1. Introduction
It is well accepted that modern industry requires a range of effective plant sensors and appropriate process control systems leading to a level of automation and third-generation process control for the highest efficiency [
1]. This is the case of steelmaking plants, the oil and gas industry, chemical processes and the food industry to mention some examples. In all of them, the 3rd industrial revolution has been adopted in their control systems. In this set of industries, the copper pyrometallurgical processes can be considered as the last step of the mining industry or the first one for manufacturing. Today, they face significant challenges for establishing sustainable operations due to higher complexity in the ores to be treated and increasingly stringent environmental standards.
On-line sensors of important operational variables play a key role in the improvements of operational standards. In copper pyrometallurgy, the degree of use of analytical instrumentation for the monitoring and control of the process is limited, so that the information available for the decision-making process during the operation is scarce. Currently, the control of copper smelters operations is mainly based on macroscopic mass and energy balances, and the dynamics of the process depends, to a large extent, on the experience of operators.
This diagnosis is clearer if the iron and steel industry is taken as a reference, a process industry with clear similarities and analogies to copper pyrometallurgy. The steel industry uses different types of sensor and well-developed control systems. This condition is a key element in the operational versatility that these plants have, producing a wide range of products with the same reactors and the same operators, and changing the characteristics of the steel produced from one charge to another. Similarly, the consumption of refractory materials in the steel industry is orders of magnitude lower than those of copper pyrometallurgy, expressed per ton of metal produced. It should also be borne in mind that the steel industry operates at a temperature higher than the temperature of the copper pyrometallurgy, at least 300 °C and with more aggressive chemical systems.
Even with the tremendous advance in the development of passive and active photonic sensors such as hyperspectral imaging (HI) and different optic sensors, as simple as digital optic pyrometers, there are still only two real-time analytical sensors specially designed for the unique condition of the pyrometallurgical copper processes.
The direct study of the encrypted information in the spectral radiation produced by combustion reactions facilitates the analysis of the process, due to the non-invasive and wireless nature of the technologies used. This has enabled, for example, the estimation of reaction temperatures and the observation of the main species of the reaction and its concentrations. This concept has been successfully applied to the combustion of liquids or gases [
2] and pyrotechnic mixtures [
3,
4,
5]. In these applications, the information provided by online spectra has allowed investigation of morphological structures of flames, types of reactions in mixtures pyrotechnics, the movement and burning of individual particles, the processes of igniting powders, propagation of gas explosions, and in situ observations of reactions in closed combustion chambers through optical fibers with optomechanics adapted for these processes.
The application of optical spectroscopy to copper pyrometallurgy was discussed during the Annual Meeting of the Minerals, Metals & Materials Society in Denver 1993 where professor Queneau defined the advantage of the information that the operator can have, where up to that time (until today) there had been no option to have the same information “without sticking the head into the vessel”, this information was then developed in [
6].
The maturity of the development of this type of sensor for the steelmaking industry is clear today. The first development at the industrial scale was done early in the 1970s [
7,
8] and gained real maturity in the 1980s [
9,
10]. This led to very robust process control of the steelmaking processes and reactors. The use of spectral characteristics has also been validated in the spatial recognition of phases of interest in the iron and steel making process, as will be discussed in detail in
Section 4.2.
Within copper smelters, the reality is that even the 3.0 industrial revolution (information technology (IT) and automation) still has room for continued development. This current state limits the ability to integrate Industry 4.0 developments for process optimization. Indeed, the availability of analytical instrumentation for the monitoring and control of the smelter processes is limited. Thus, the information available for operational decision-making is mainly based on static mass and energy balances. The operational dynamics continue to depend largely on the experience of ground operators. This condition is also reflected in the literature review (both on the eastern and western world) where the scientific and technical information is related only with the two instruments that have gained industry acceptance for operational monitoring and control in copper pyrometallurgical reactors.
The first one is the Semtech Online Production Control (OPC) system. The OPC system was developed in collaboration with the Swedish company Boliden Mineral AB to provide continuous online information on the status of the process in the Pierce Smith converter (Equations (3) and (4)). The company started as a spin-off from the Physics Department, Lund Institute of Technology at Lund University in 1987, and its first commercial system was installed in 1994 at Boliden, already working [
11]. The instrument is based on spectrometric measurements to identify the presence of PbS and PbO in the off-gas of the converter. The dynamic of these trace elements in the gas, increasing concentration of PbO and decreasing concentration of PbS, signal when the process must be stopped (by stopping the O
2(g) injection in Equation (3)) [
12,
13]. Precise determination of the endpoint of O
2(g) injection is of great value to control the operation. It increases the operating time while stabilizing the operation of the whole smelter due to the optimization of slag recirculation, which at the same time diminishes its copper content increasing copper recovery.
The second is the Noranda Pyrometer [
14], configured solely for bath furnaces using blowing tuyeres. It has been on the market since the 1980s without any modifications to the original design. By measuring radiation through an analog array, this instrument monitors the temperature of the molten bath by applying Planck’s law for two fixed wavelengths. In this case, more than the application of a radiometric measurement to determine a temperature, which is quite trivial, the value of the instrument is in the design and operation of an optical system that allows a direct and permanent field of vision of the molten bath inside the reactor.
One option for the advancement of process monitoring and control systems in copper smelters is to modernize the use of radiometric measurements since this approach has been previously validated with both the OPC system and the Noranda Pyrometer.
The analysis presented in this article is based on the physicochemical characteristics of the reactions that occur in the different reactors of the pyrometallurgical process for copper concentrates to relate them with similar sensing processes present in other industries. The concept for the development of new sensors for copper smelters is based then, in adopting and adapting principles already validated to the very particular conditions of the chemical transformations of the primary production of copper from concentrates.
4. Radiometric Proposals for New Instruments
4.1. Radiometric Measurements of Chemical Oxidation
The development of this family of “new instruments” has started by reproducing the Equations (2)–(4) at laboratory level, adding online measurement of the spectral signal through an optic fiber connected to a radiometer with further treatment using mathematic tools. As was previously pointed out, there are two families of smelting reactors (Equation (2)): bath smelting and flash smelting. For the sake of the length of this article, we will refer specifically to developments, proof of concept, and preliminary tests at the industrial level for flash smelting reactions and reactors.
4.1.1. Experimental Set-Up
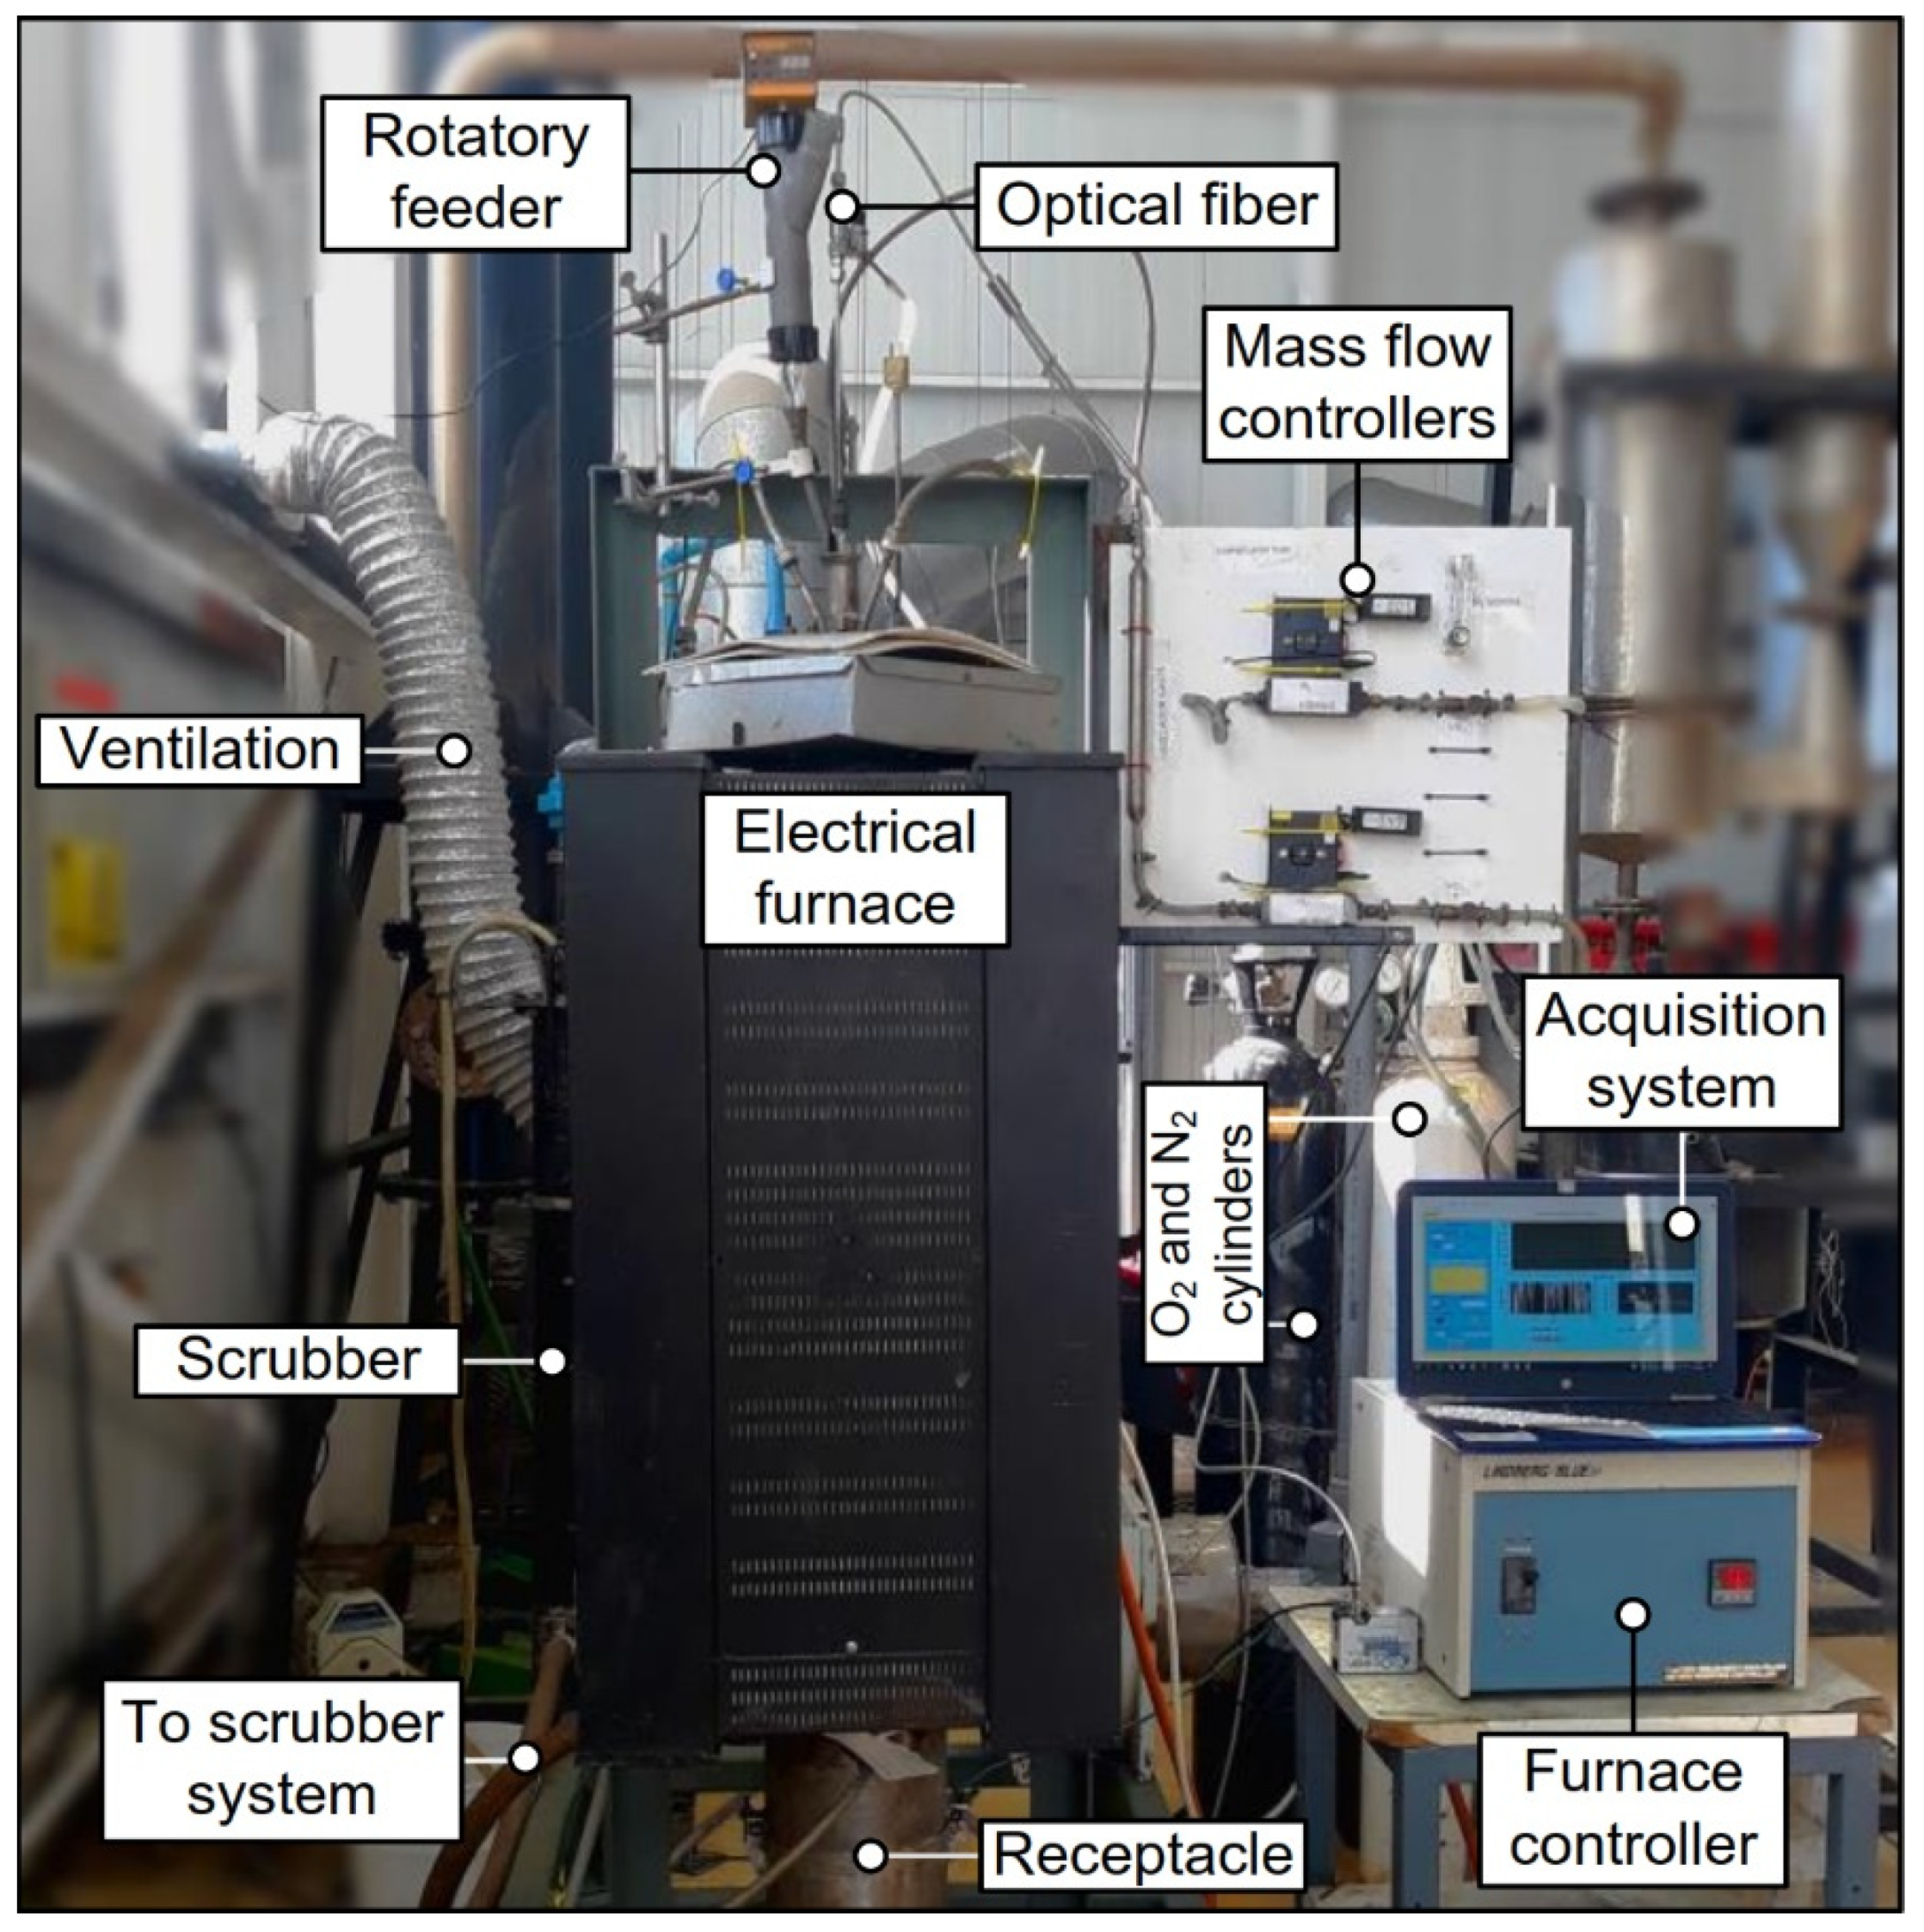
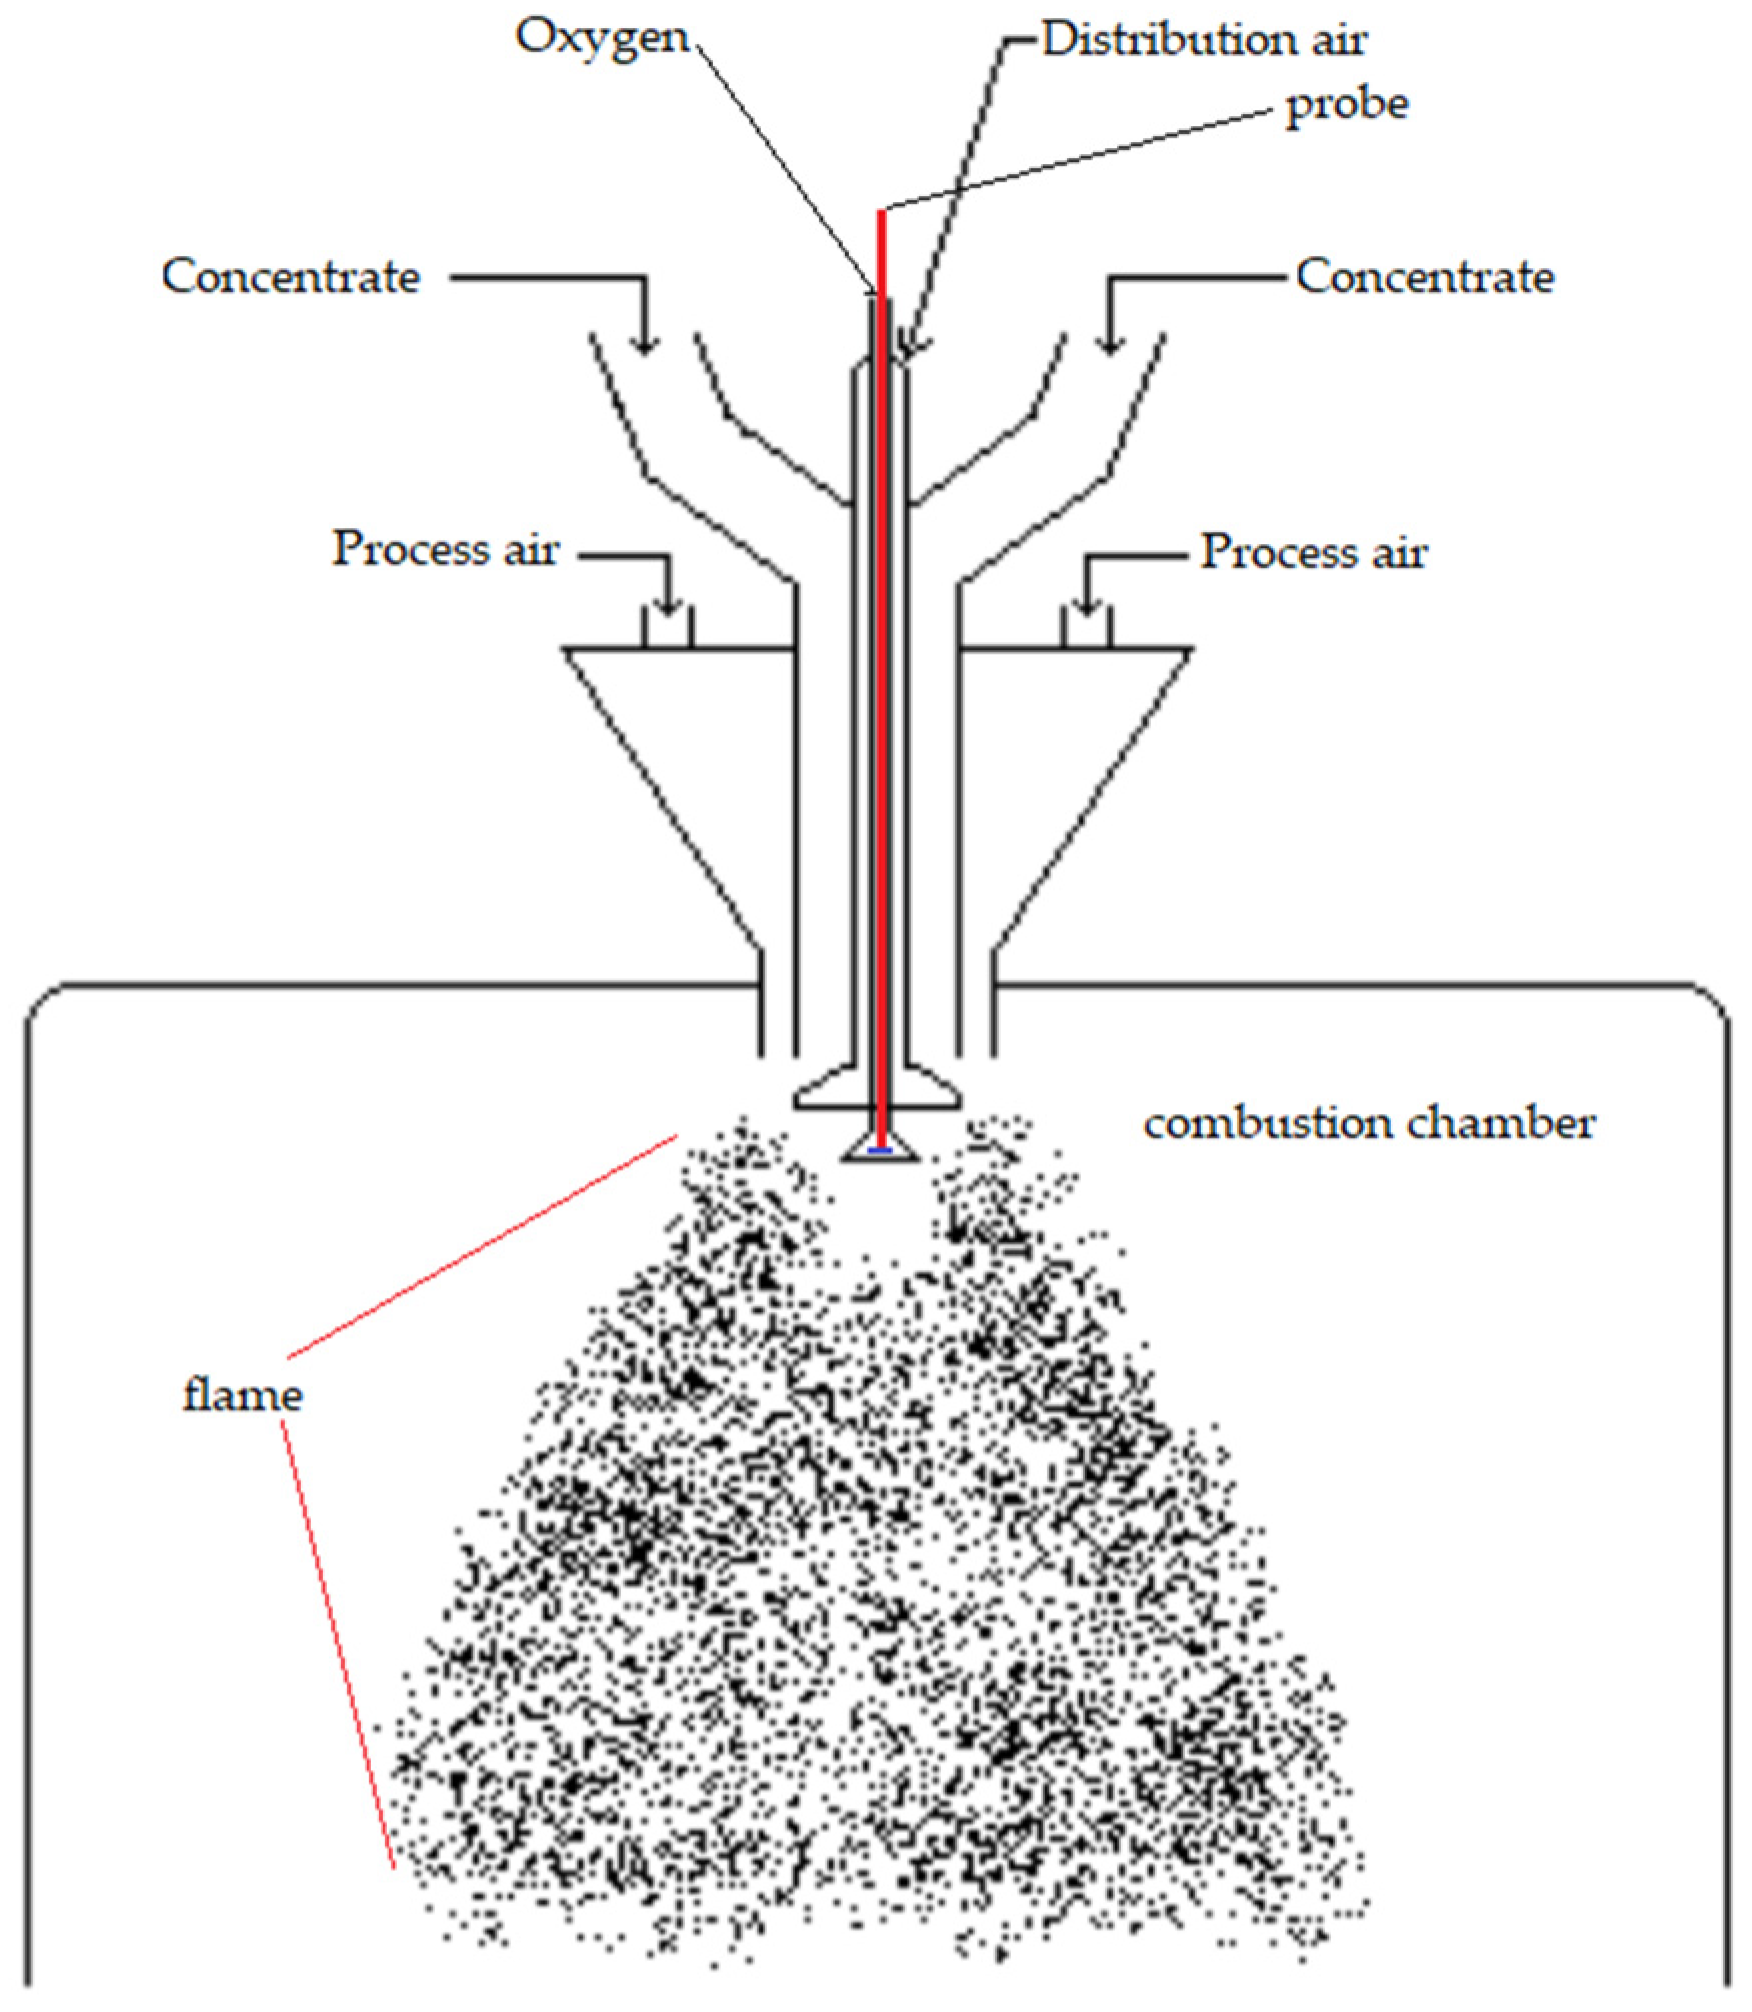
A vertical laminar flow laboratory reactor was used to simulate the oxidation conditions of the copper concentrates. The combustion of concentrates was carried out under controlled conditions of feed rate and combustion gas mixture to simulate the physical and chemical transformations that the concentrate particles have when they burn in the burner of a flash smelting furnace. In this way, the high rate of oxidation for sulfide minerals was reproduced at laboratory scale. The temperature and oxygen potential conditions in the gas inside the furnace were similar to those that typically occur in the concentrates burner at the industrial level, so the burning material was assumed to have characteristics equivalent to the material that reaches the settler of the industrial furnace. The system to feed the concentrate was equipped with a high-temperature optic fiber that was connected to a VIS-NIR spectrophotometer USB4000 (Ocean Optis Inc., Dunedin, FL, USA) was used to acquire the spectral data in the range from 400–900 nm with an average spectral resolution of ~0.22 nm; also, the spectrometer and optical circuit were calibrated to measure the emitted radiation in absolute irradiance units (μW × cm
−2 × nm
−1). With such a set-up, the reaction zone of the reactor is within the field of view of the fiber allowing to follow the spectral emission of the oxidation/combustion of the copper concentrate (
Figure 4). A detailed description of the set-up and its operation is presented elsewhere [
1,
2,
3,
4,
5,
6,
7,
8,
9,
10,
11,
12,
13,
14,
15,
16,
17,
18,
19,
20,
21,
22,
23].
The spectrum collected during the oxidation process was analyzed to obtain valuable information to correlate the spectral information with the chemical process. The measured spectra have a continuous part that follows Planck’s radiation behavior and discontinuous pattern that are related to the emission from atoms and molecules formed during the oxidation process. The temperature of the flame produced was also calculated using a classical Planck’s Law.
The results presented hereafter are the summary of different experimental campaigns and have been reported individually in other articles or documents for the public domain. It is the first time, however, that they have been integrated to give a global vision of what has been developed at the laboratory level. This comprehensive view seeks to present the concept that laboratory-level studies which reproduce the same chemical reactions of industrial processes on a small scale are representative for studying the optical signals that processes have.
4.1.2. Experimental Results: Temperature Measurements
Considering the continuous part of the spectrum, it is very clear that a calculation for the flame temperature is possible by applying Planck radiation law. The mass balance requires a model of reactions based on the mineralogical species that are oxidized in the flame of the laboratory burner. This was achieved by performing a characterization using automated mineralogy techniques (QEMSCAN
®) for the products generated. From this information, a set of
k chemical reactions were proposed and a calculation of their degree of conversion allows us to close the mass balance to fit with the characterization of the
l species produced. Knowing the degree of conversion for each reaction we can apply Equation (5) that corresponds to an energy balance and so on, estimating the temperature of the flame.
where
ni is the moles of a specie that reacts according to reaction
i from the
m reactions defined;
mj is the mole of one mineralogical specie from the
l identified;
TRef is the reference temperature for the calculation of the enthalpy of the chemical reactions:
is the enthalpy of reaction
i at the the temperature of reference;
QFurnace is the heat released by the furnace to the environment; ε is the emissivity of the flame (understood as a reactive system which considers gases and condensed particles, both Cu concentrate and liquid droplets of sulfide and oxides, and as well solid oxides produced or coming from the gangue);
A is the area of the flame;
σ is Stefan–Boltzmann constant;
Twall is the temperature of the furnace wall. Please note that
j varies from 1 to
l + 3, where 3 represents the 3 gases species: O
2(g), N
2(g) and SO
2(g). In this case, the heat losses by the convective mechanism were neglected.
Equation (5) requires an estimate of the flame area and an estimate of the emissivity. The emissivity is the emissivity of the whole reactive system, which is a mix of gases and condensed/liquid phases with a space density much lower than the case of an industrial burner. The emissivity was taken from Marin et al. [
22] with a value of 0.28 × 10
−3. This work presented a detailed model for the calculation of the emissivity with the same experimental set-up used in this work.
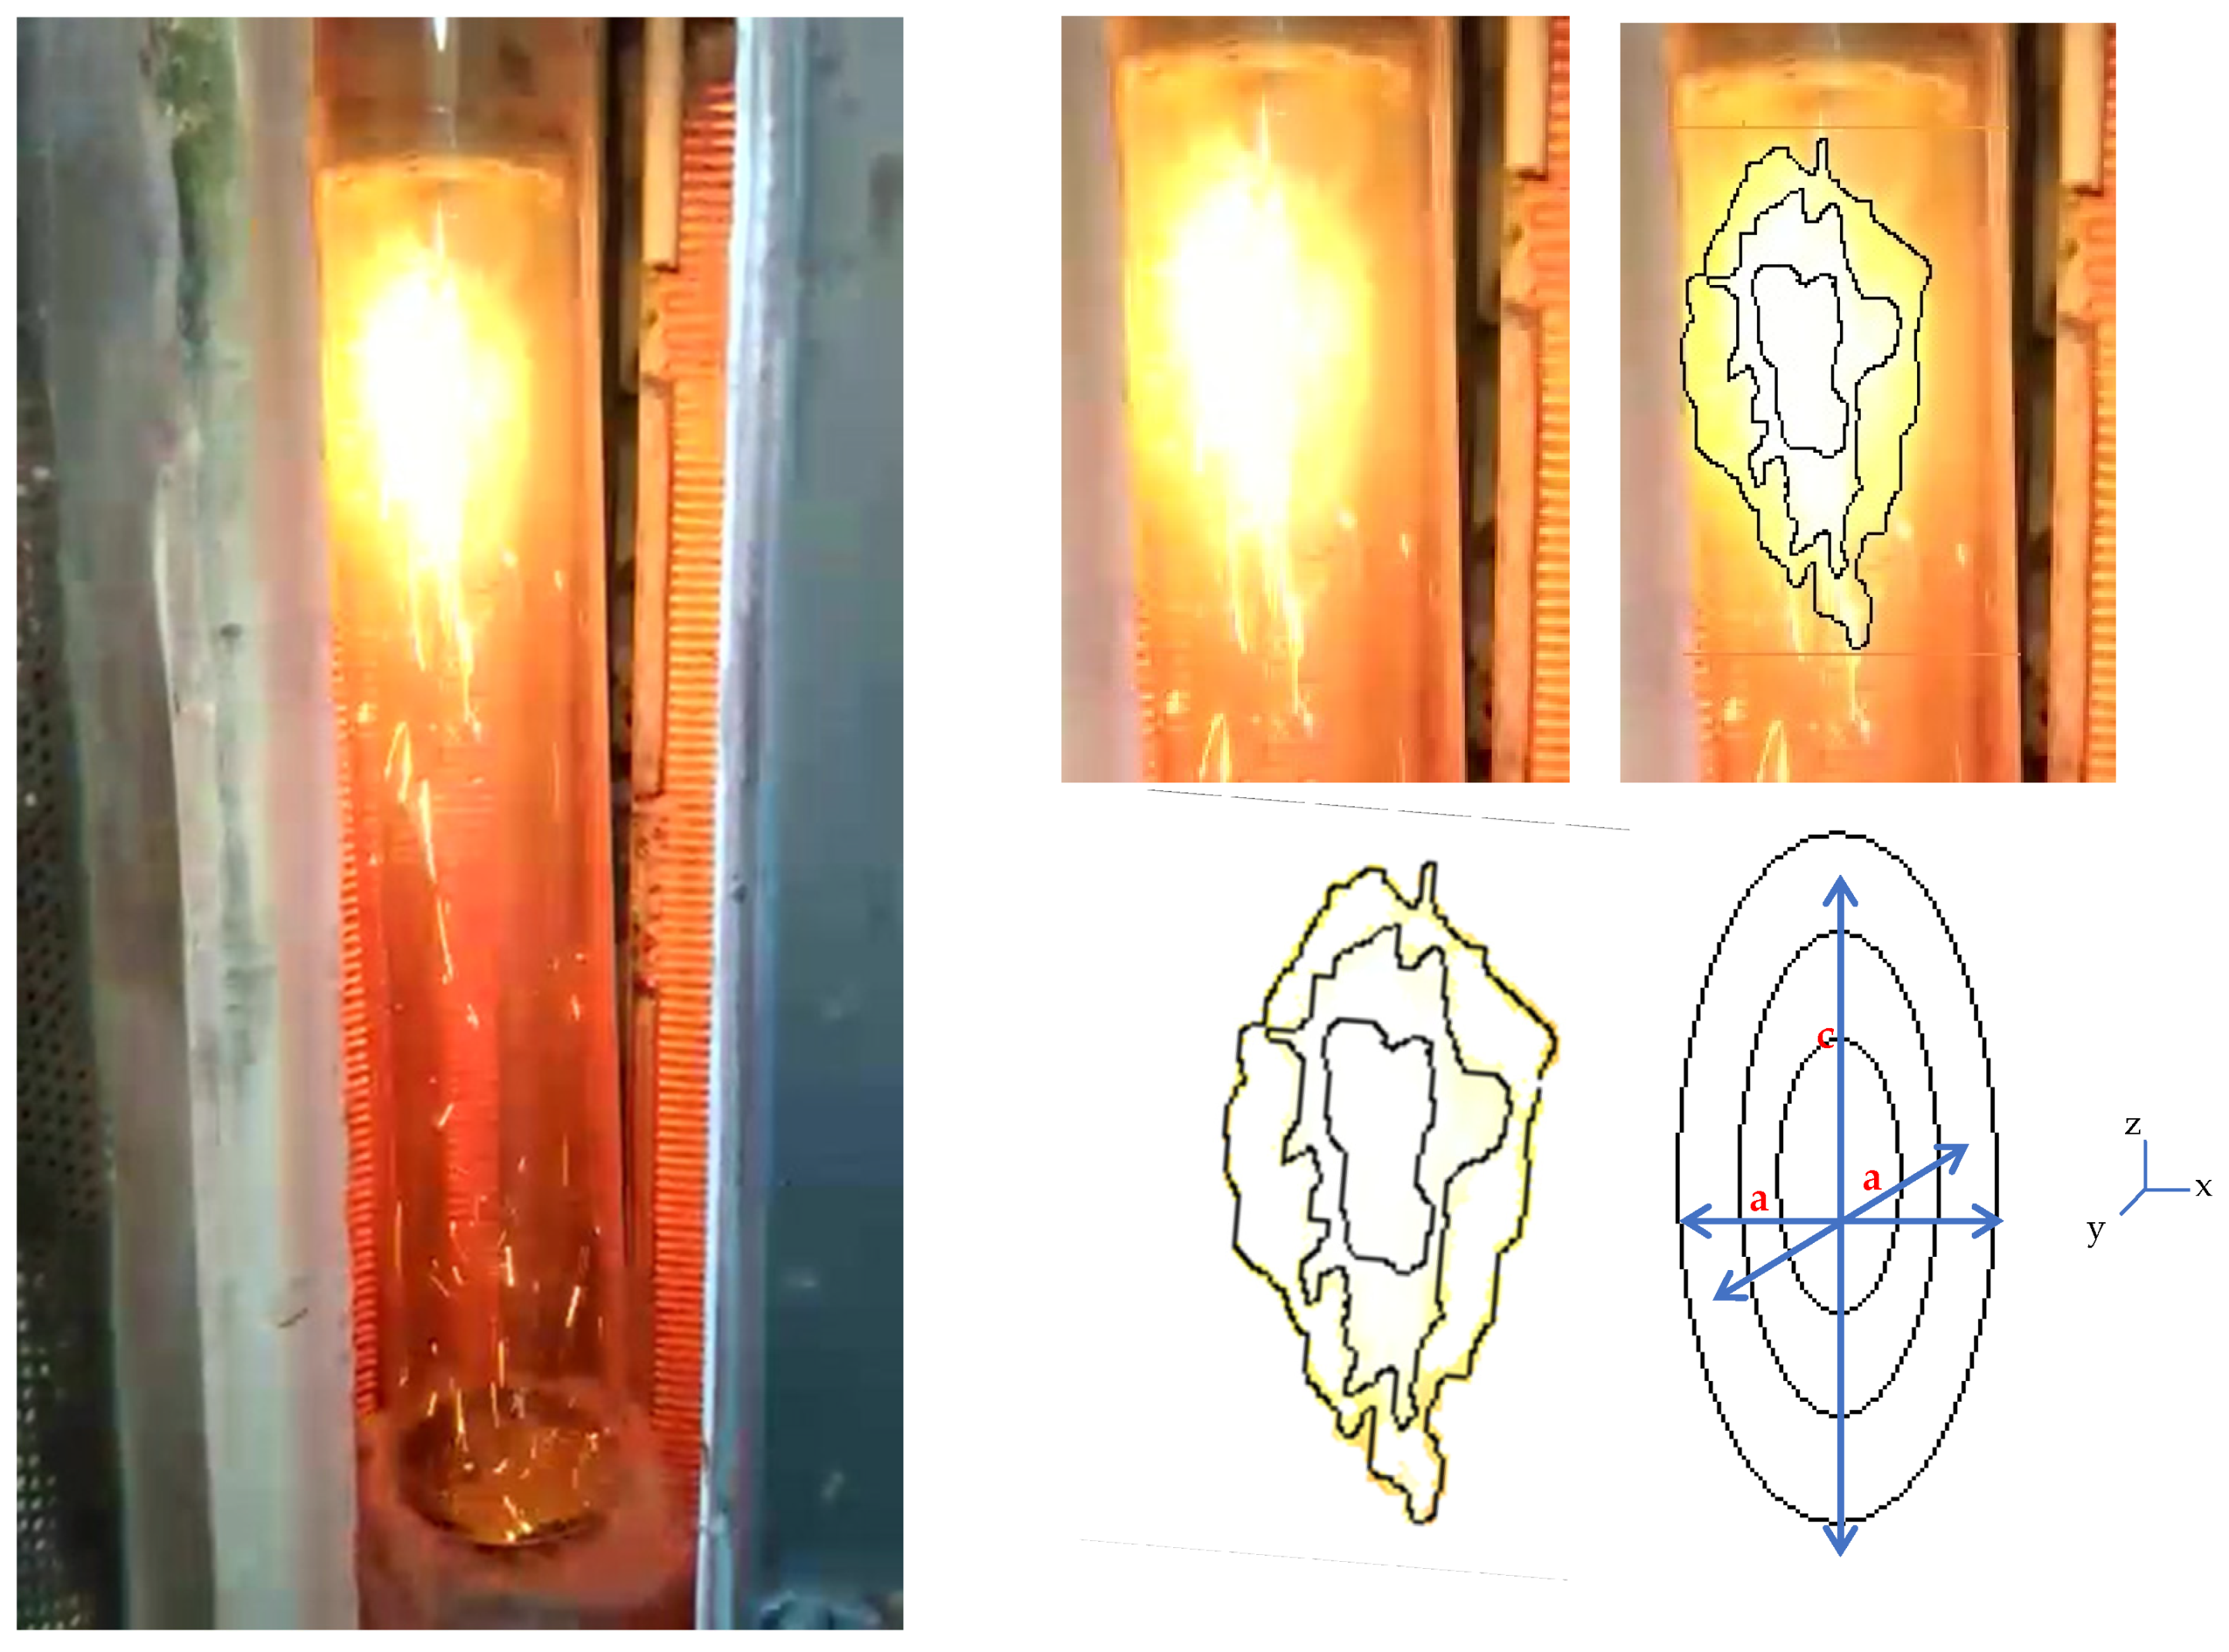
The area of the flame was estimated through a set of photographs taken in a special configuration of the set-up where the steel tube of the furnace was replaced by a quartz one, and thanks to the characteristic of the furnace that can be open longitudinally (
Figure 5). The flame was approximated to a prolate spheroid, as described in Cartesian coordinates by Equation (6). Its area, A is given by Equation (6) [
24].
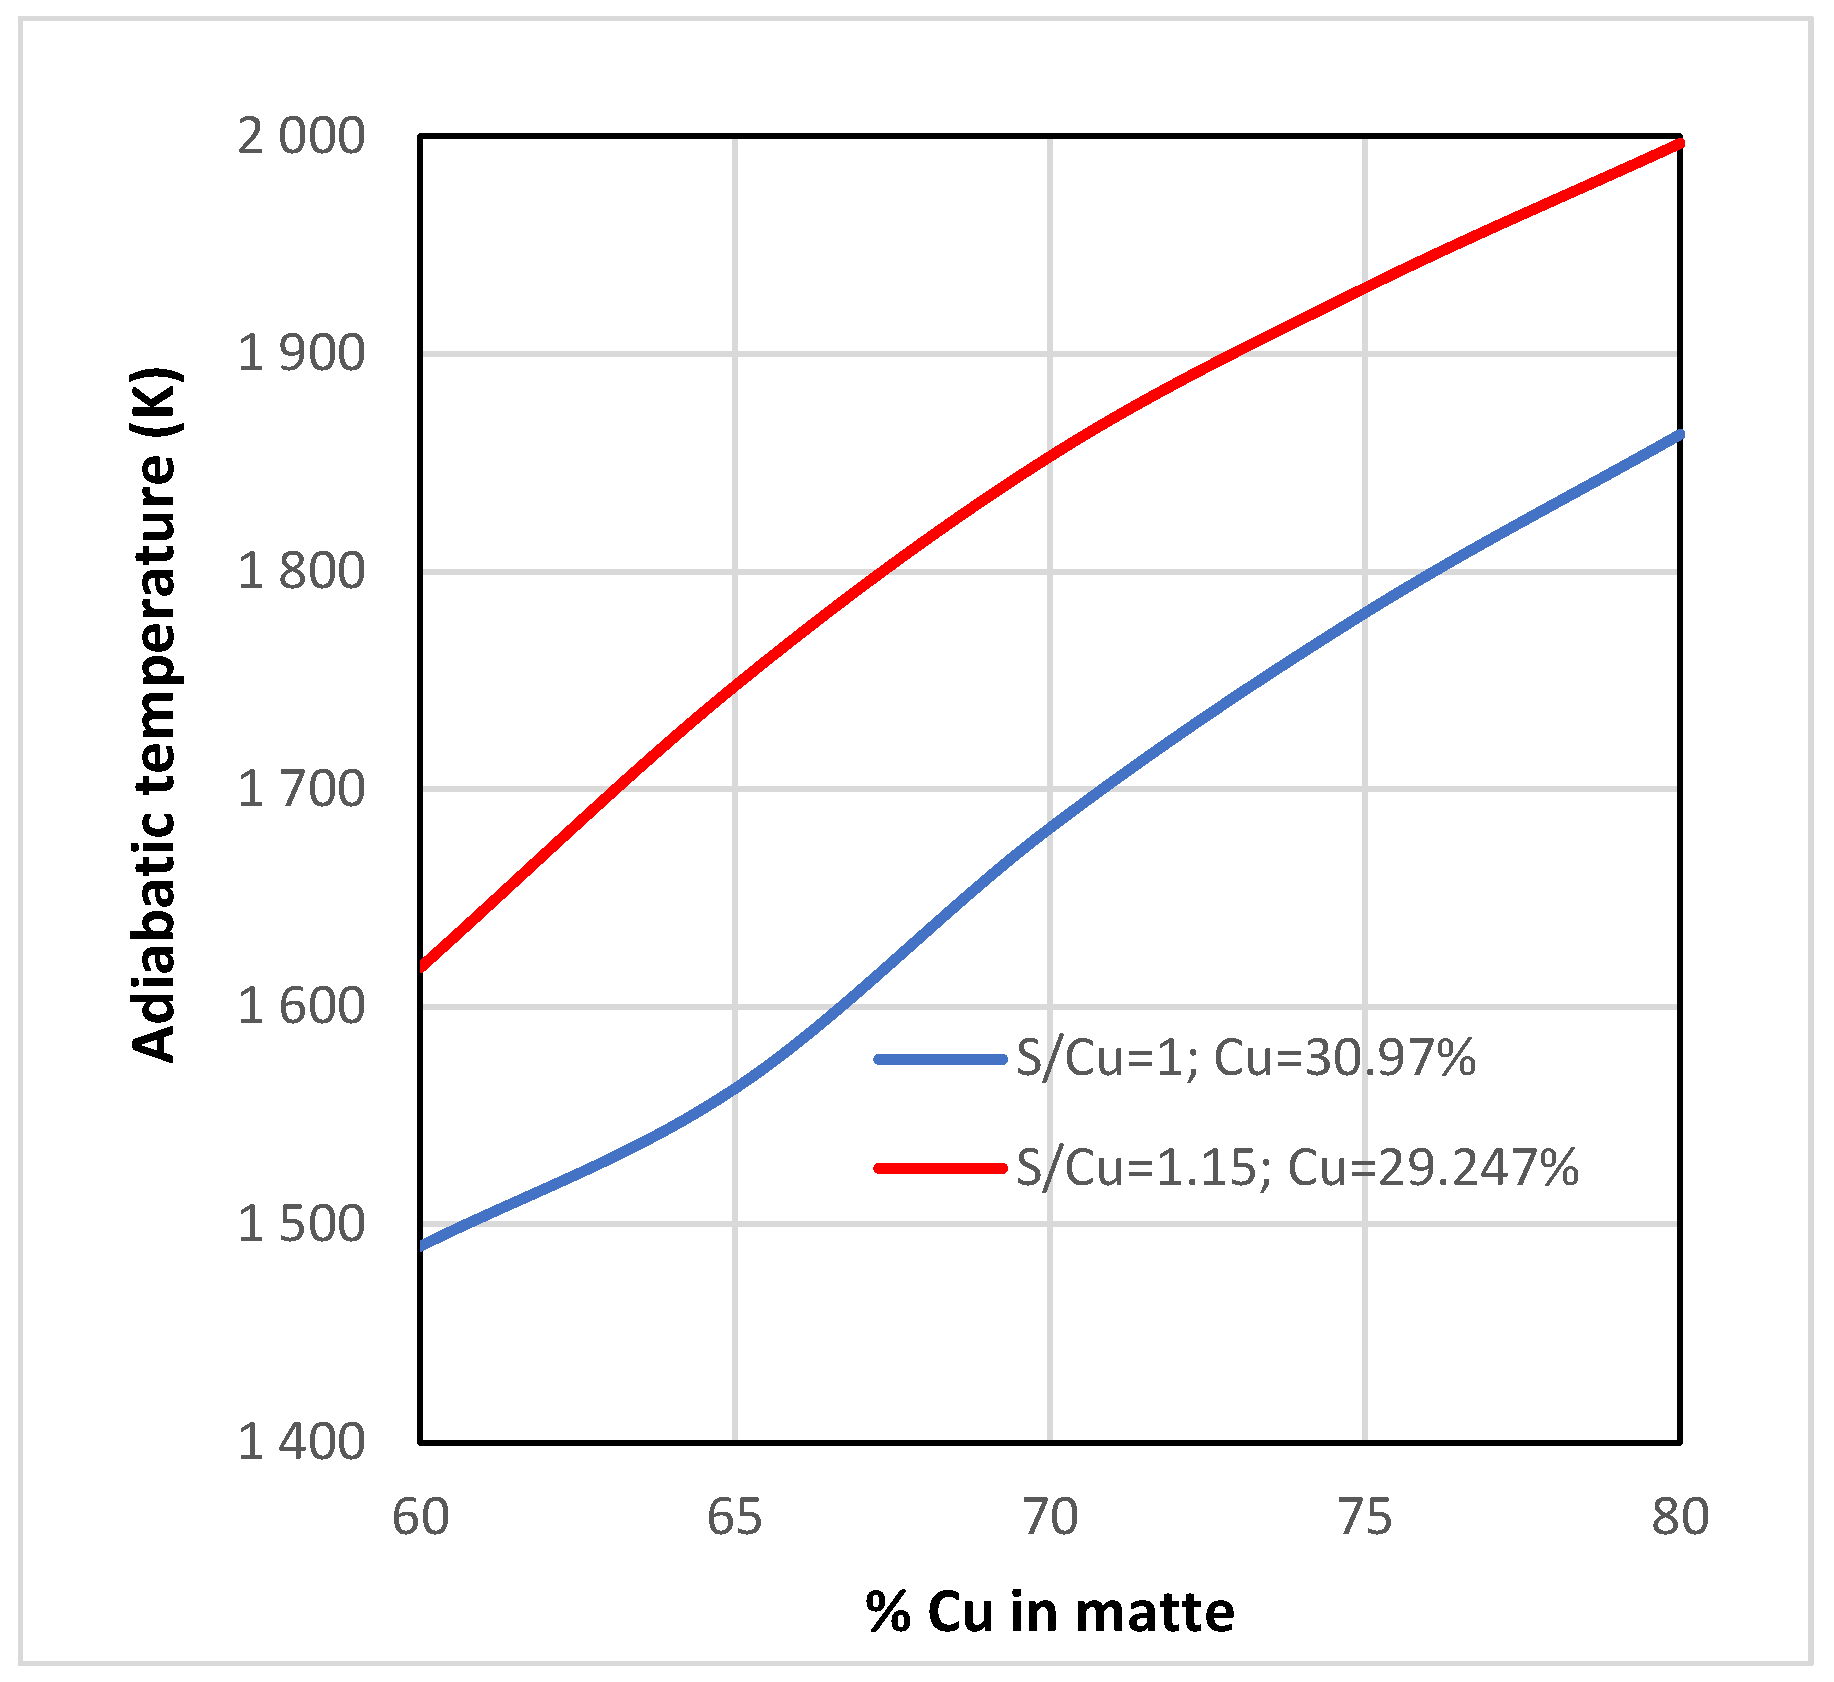
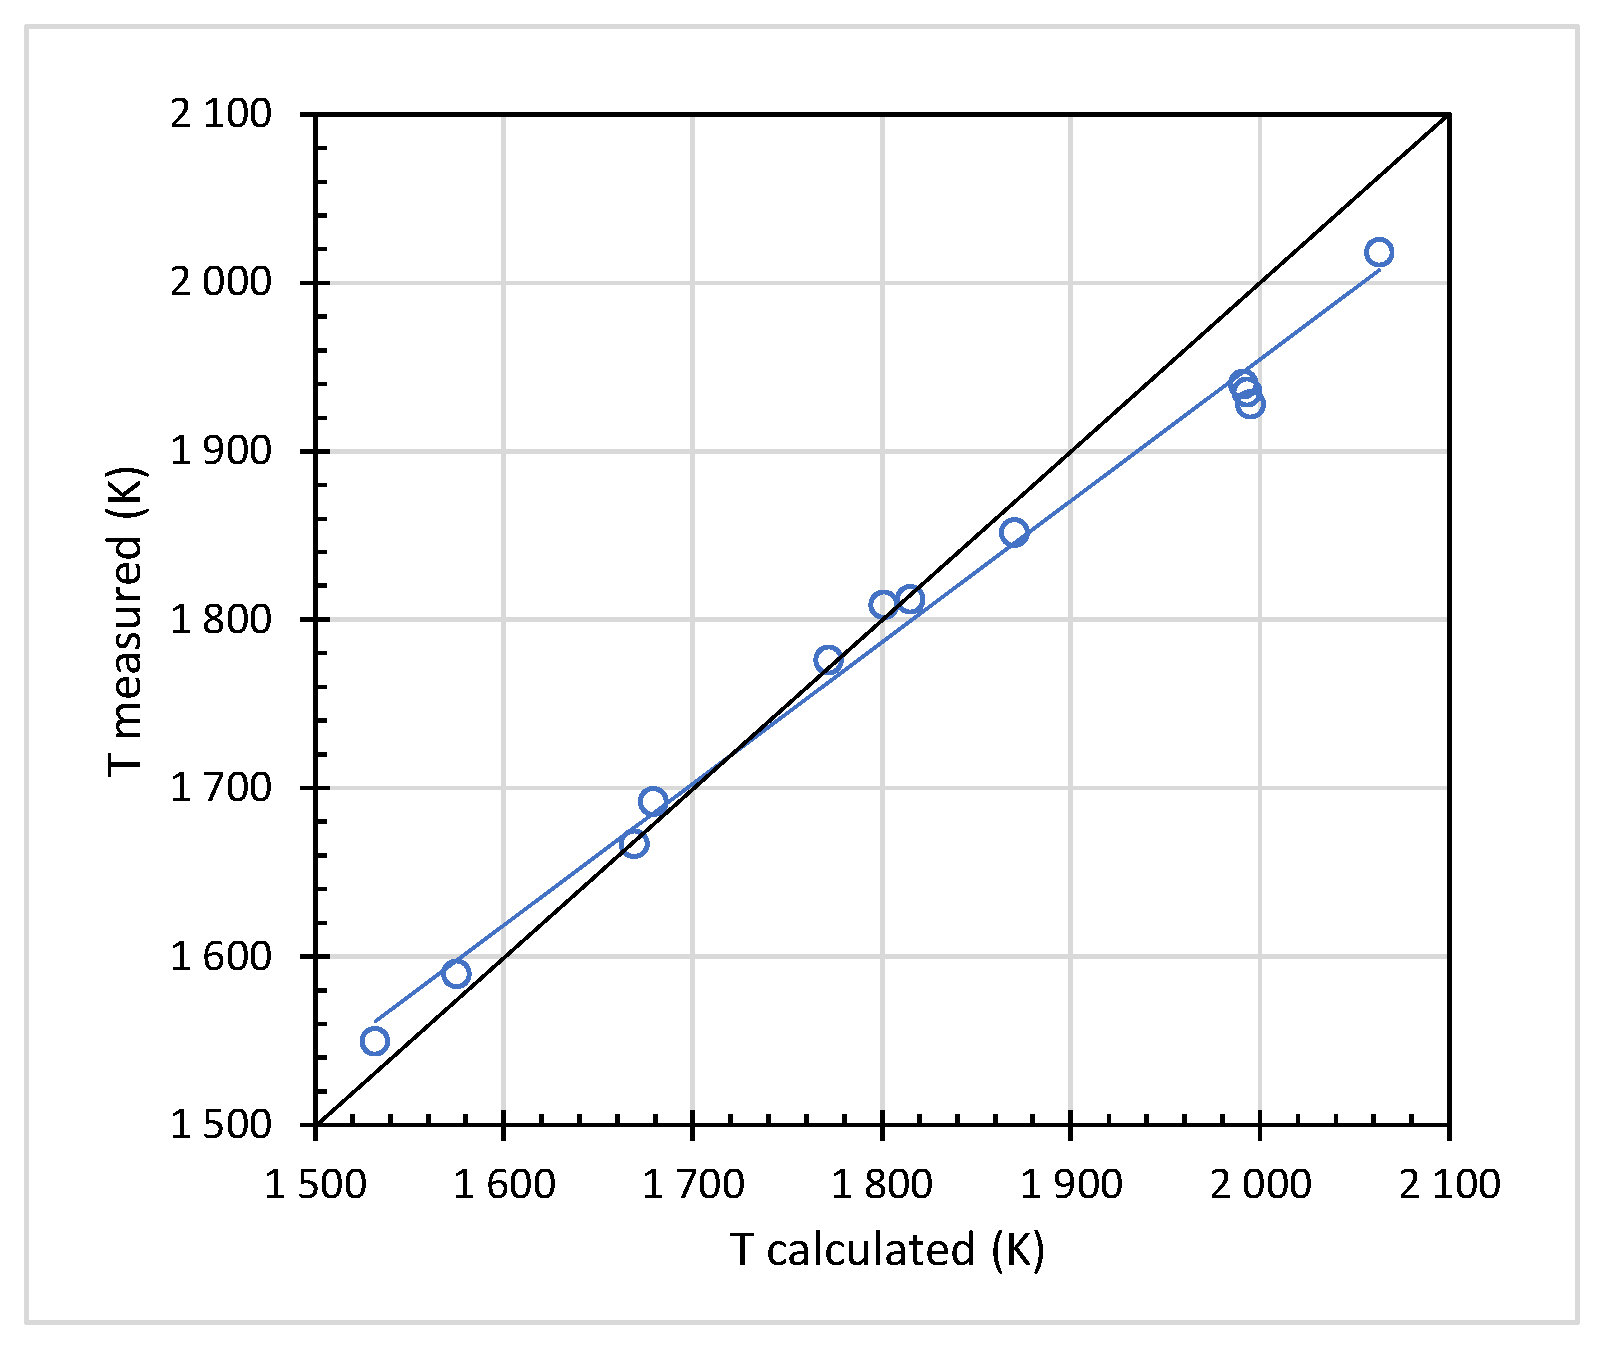
The adiabatic temperatures calculated from the mass and energy balance were compared with the temperature measured using Planck’s law with two wavelengths (
Figure 6). This calculation takes the online spectrum from the radiometric measurement and through a mathematical treatment of the signal eliminates the discontinuities of the spectrum. The continuous part was then used to apply the two wavelengths method. A second algorithm, using an optimization method, chooses the best pair of wavelengths for the calculation. The reported and calculated temperatures are on the same order of magnitudes as those obtained by modeling the flash combustion for different mineral particles (
Figure 2 and
Figure 3). The results show a very good agreement, which was expected due to the accurate characterization of the products. Nevertheless, it seems that the error is depending on the temperature itself. One source of error could be the evaluation of the size of the flame, which is kept the same for different temperatures. At higher temperatures, the flame must expand, and its transfer area increases, as well as the temperature, so radiation losses are greater. Those two points go into the explanation for the error evolution.
4.1.3. Experimental Results: Molecular Identification of Oxides in the Flame
The discontinuous part of the spectrum is related to some species, atoms or molecules, that emit at a very specific wavelength. The discontinuities observed in the laboratory and industrial measurements were analyzed to establish their relationship with species typically obtained from the concentrated oxidation process. One goal is to develop the capacity to correlate these discontinuities with the presence of species that are the ones to be formed (Equation (2)) and others that would indicate an anomalous operation. The increase of copper oxides (CuO and Cu
2O) and magnetite (Fe
3O
4) is an unquestionable indicator of the bad quality of the combustion-oxidation that occurs in the flame. Indeed, Cu oxide should not be formed according to the scheme of Equation (2), and Fe
3O
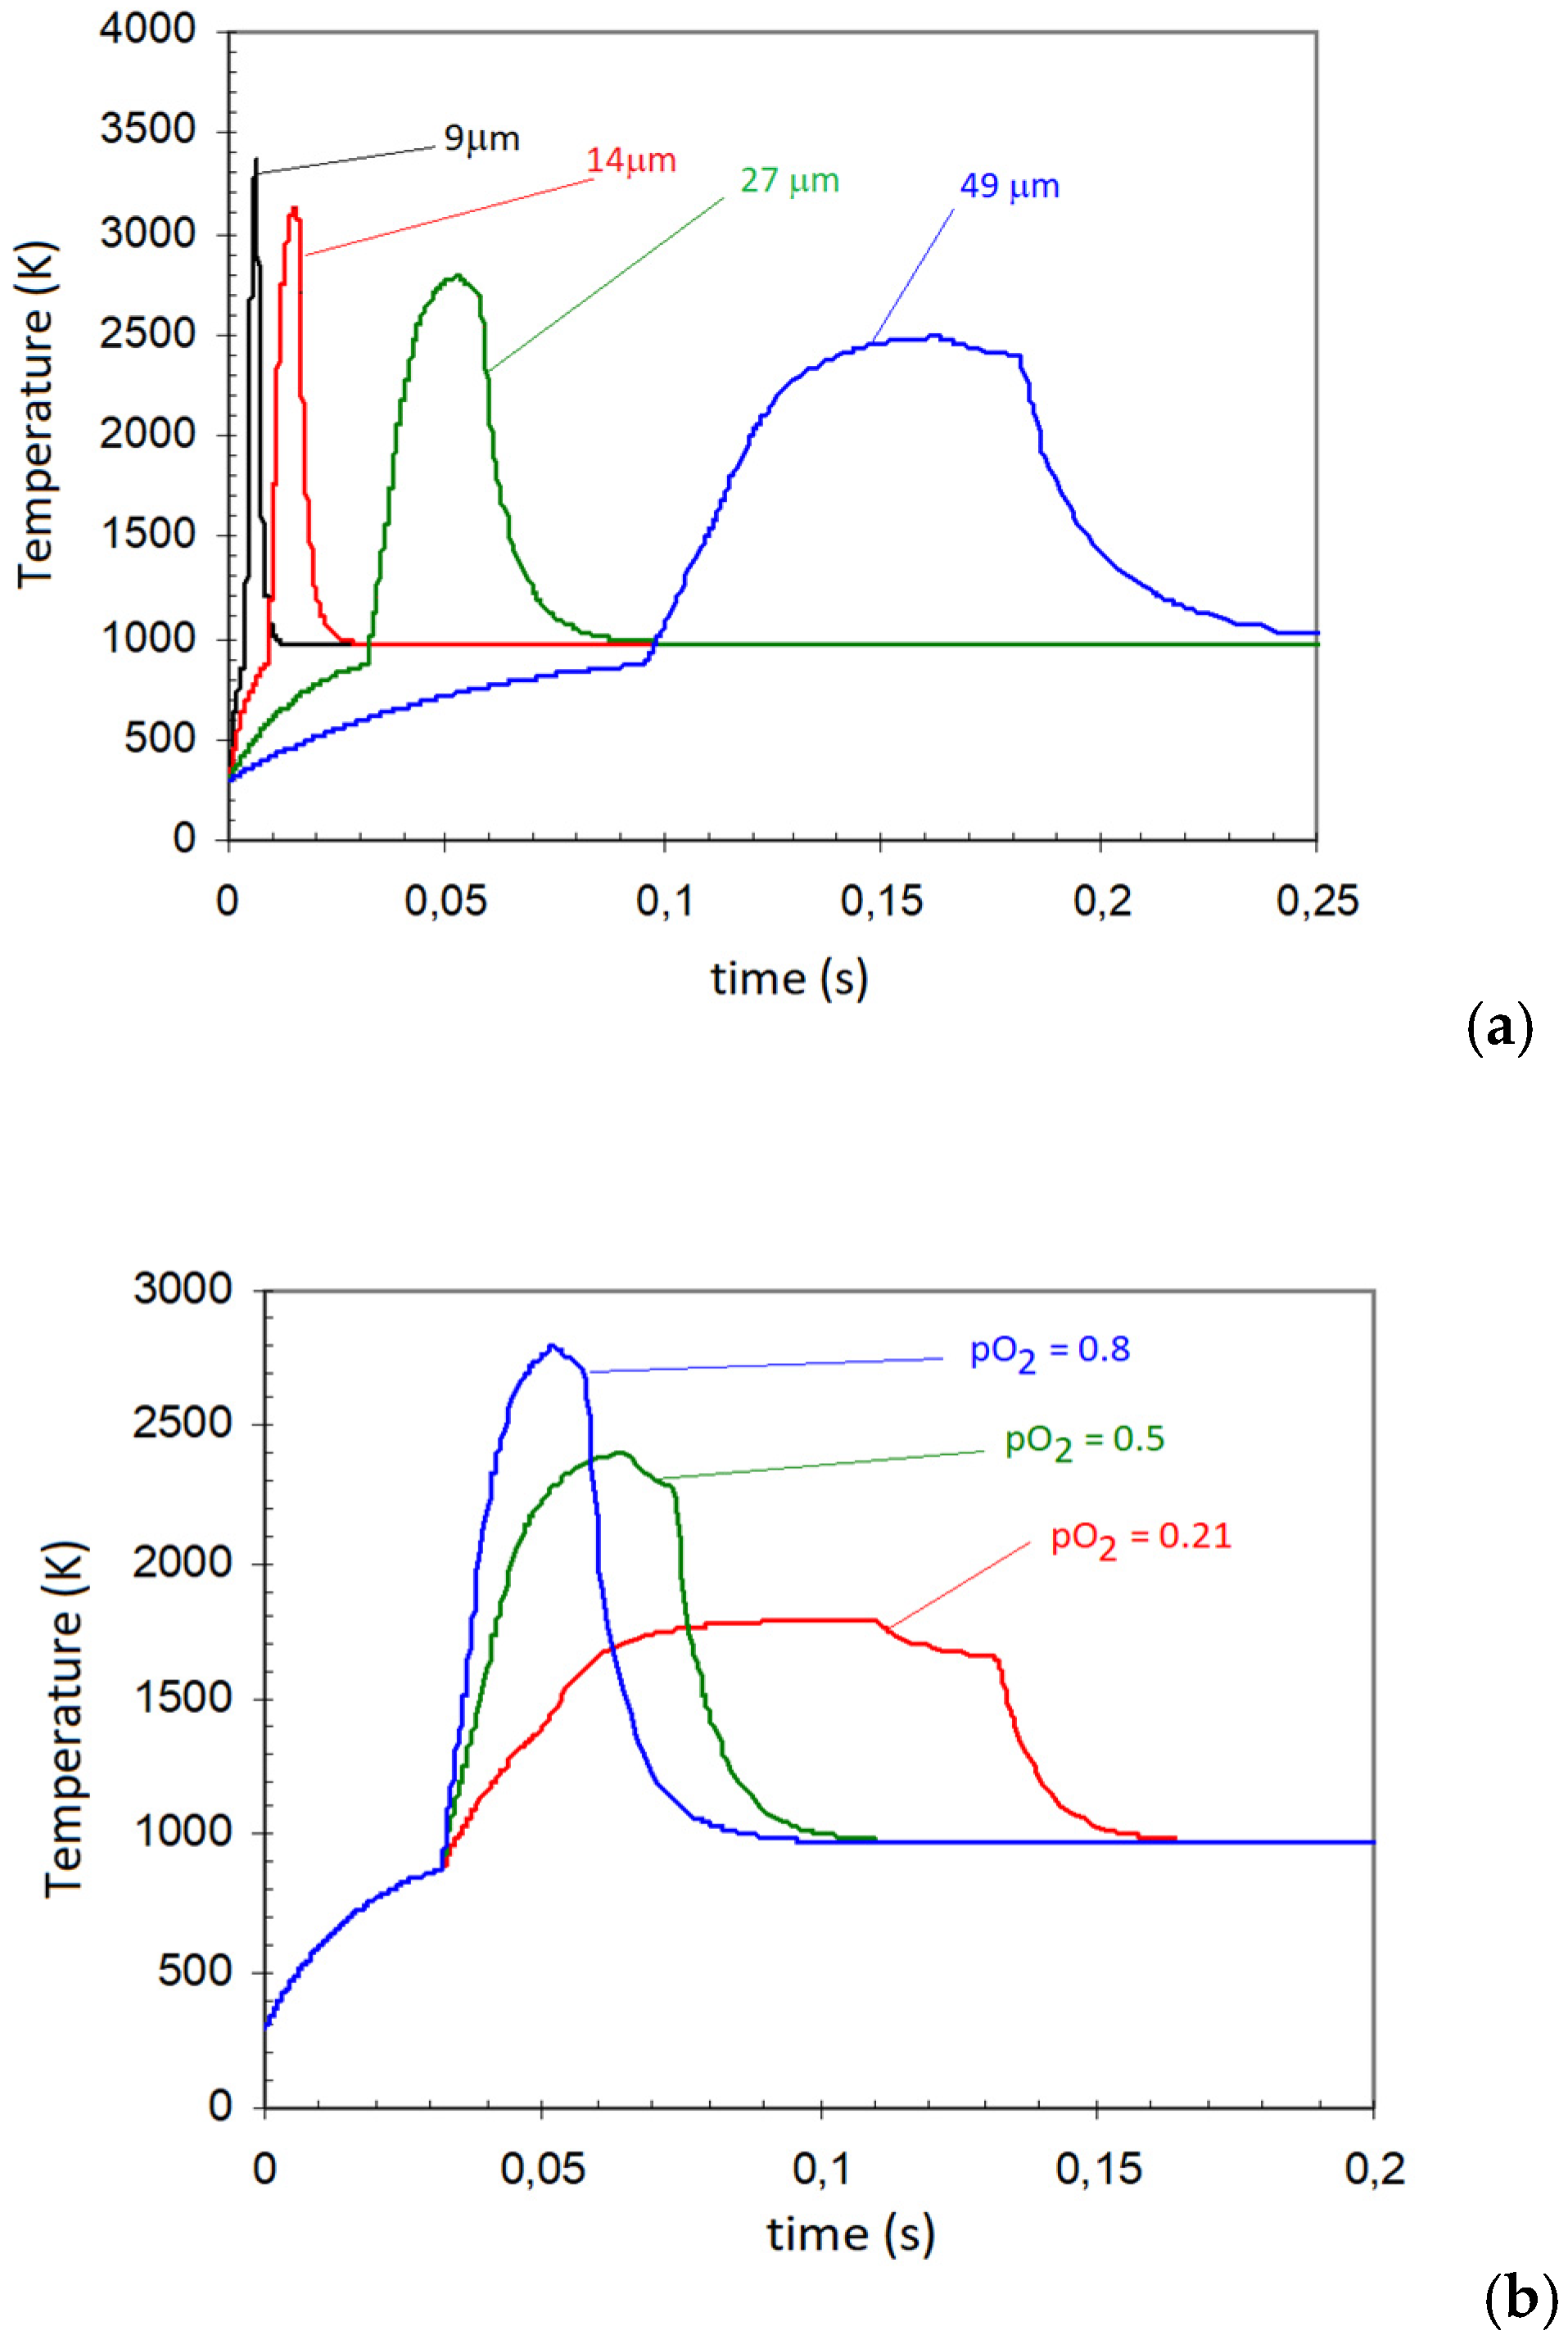
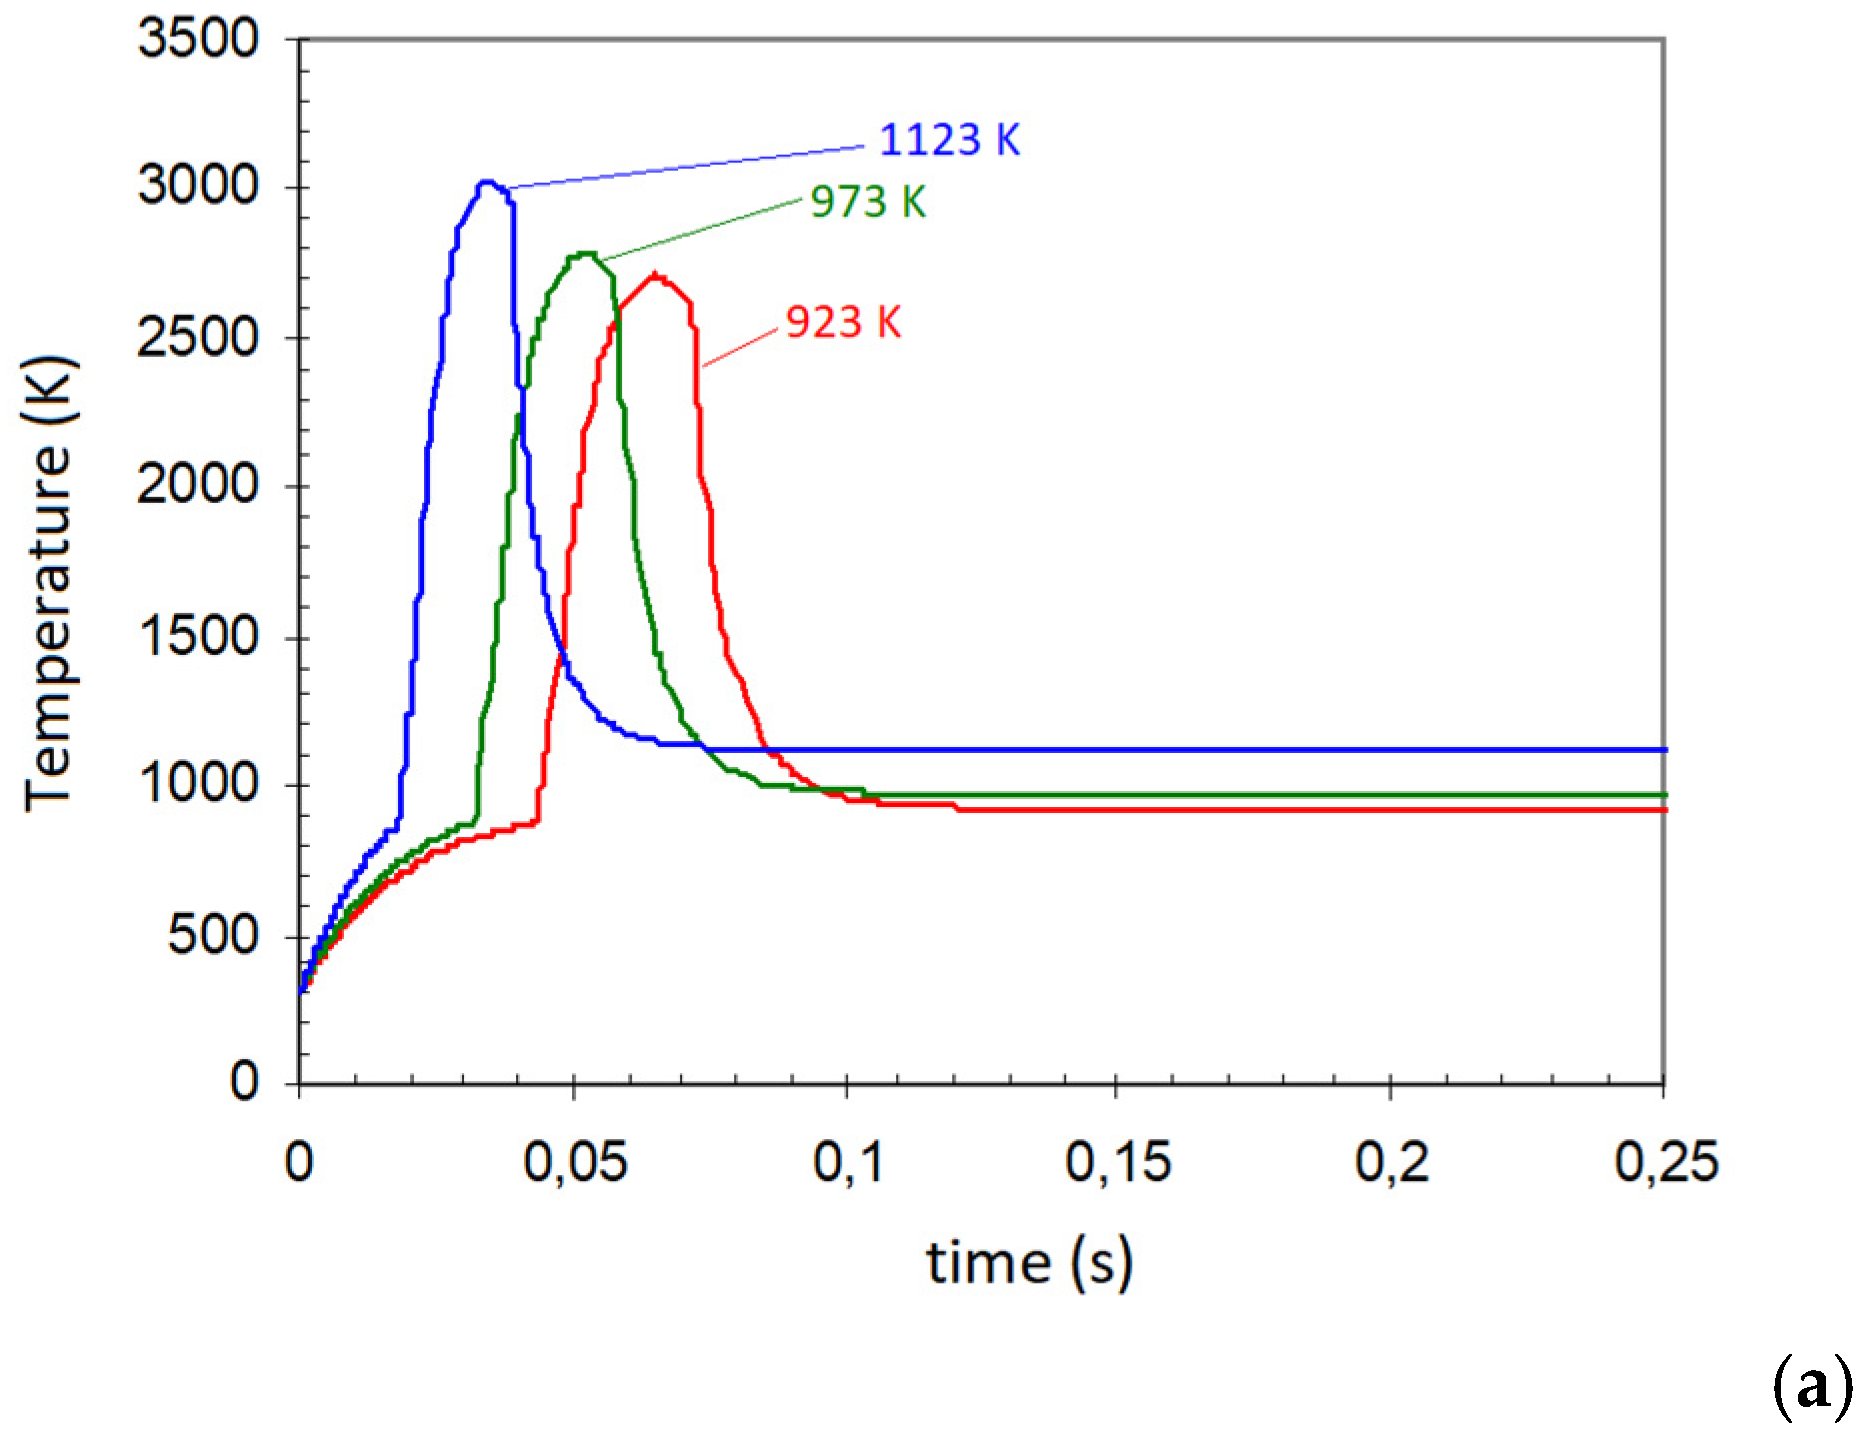
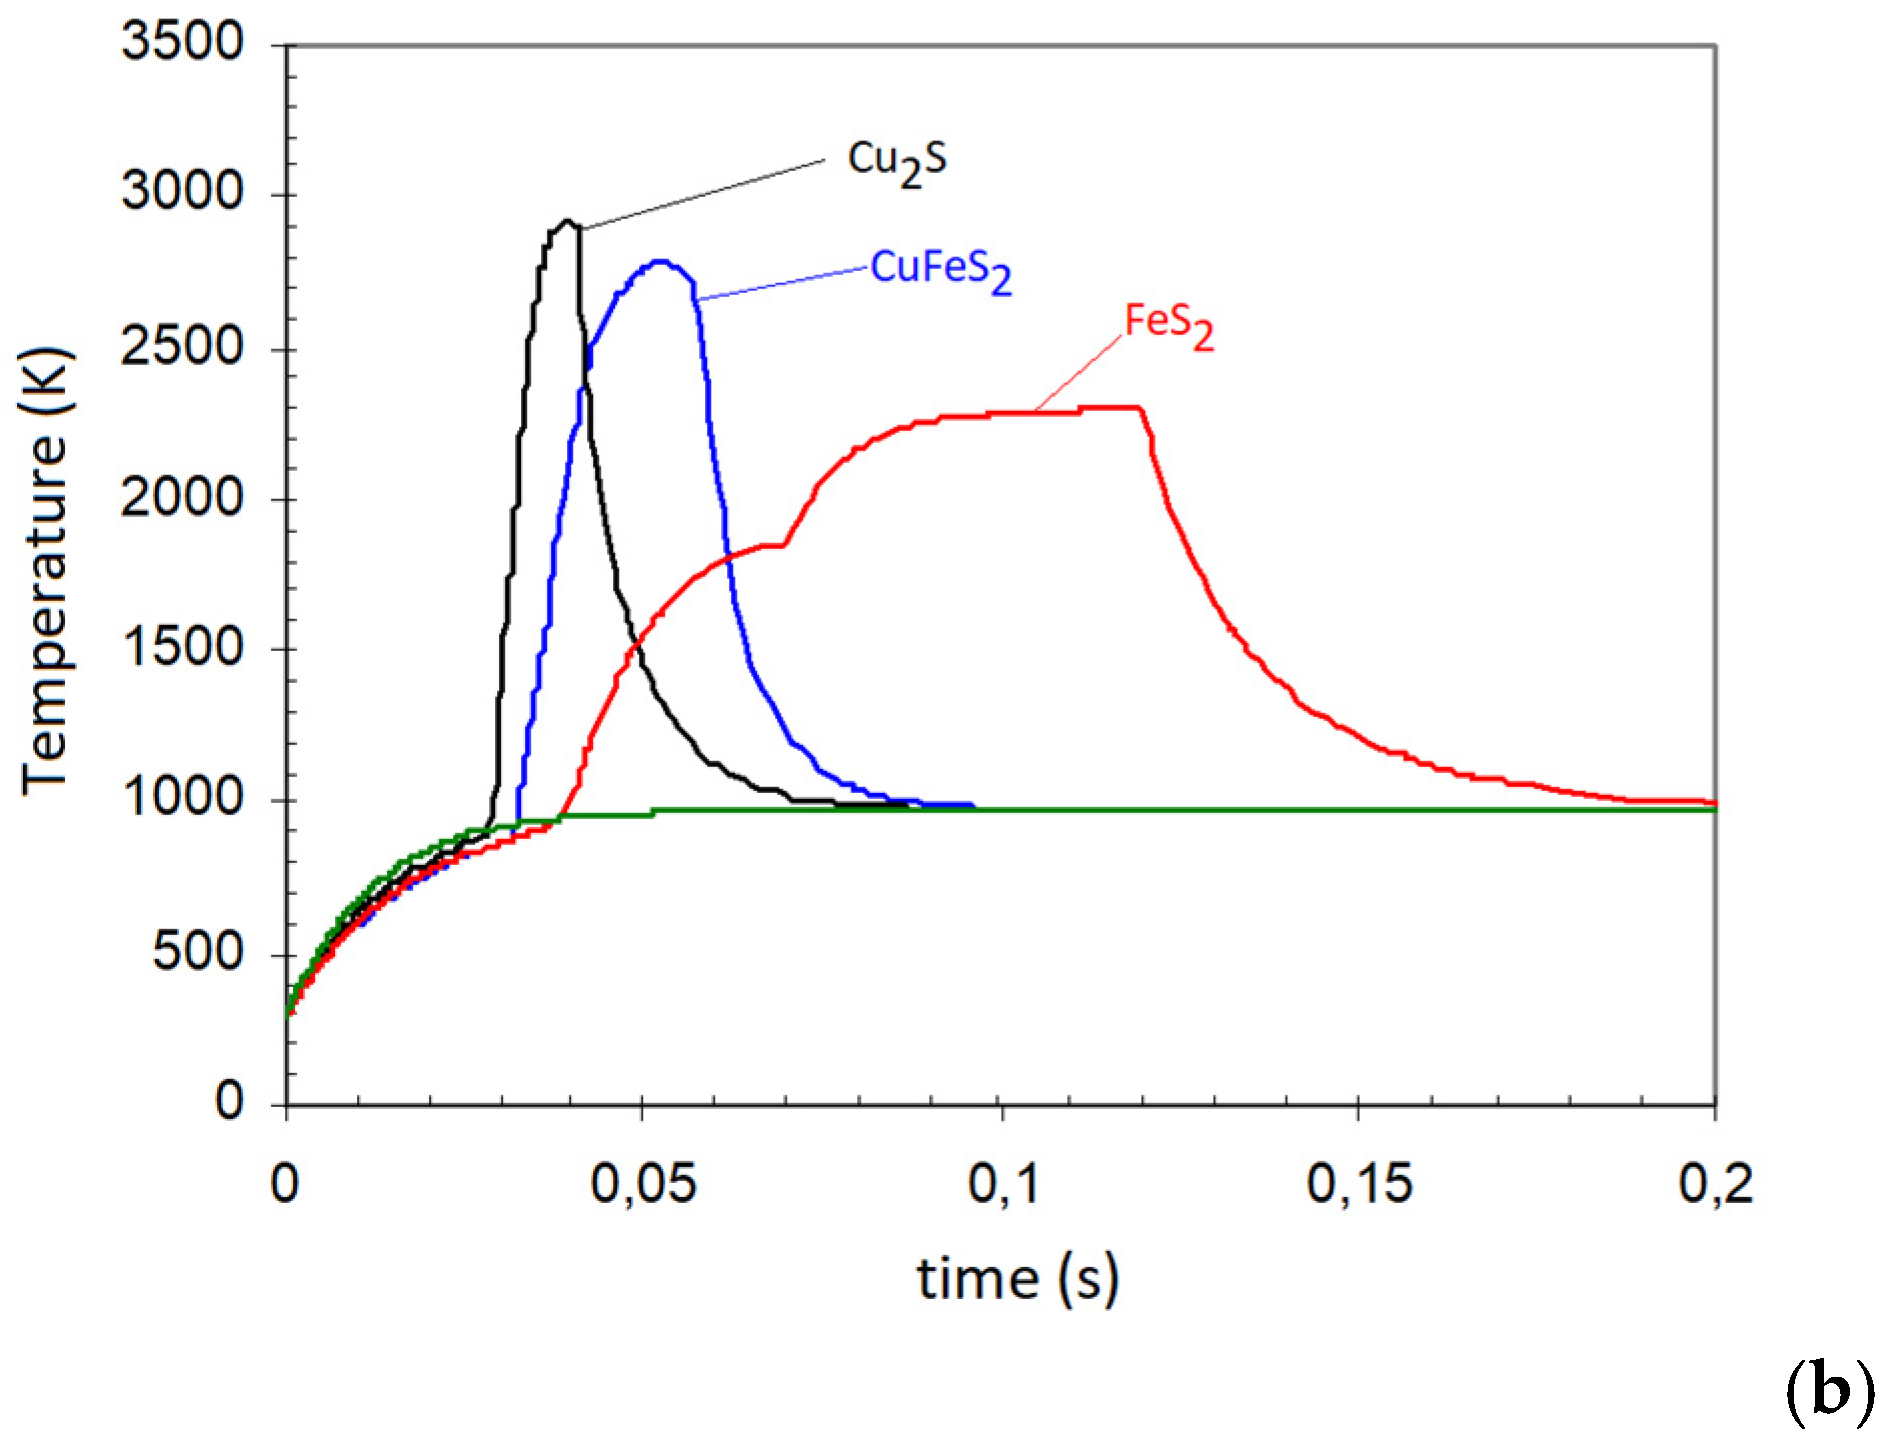
4 must stay under a certain level. In industrial practice, the results of this anomalous condition can be identified only after several hours according to the chemical analysis of the products, as it was shown the oxidation process is on the time scale of milliseconds (
Figure 2 and
Figure 3) so having the information or not after several hours is of questionable utility.
If there is an increase in oxidized Cu, it represents a higher Cu content in the slag, and consequently losses in the value for the process. Magnetite affects the viscosity of the slag and the proper separation of matte and slag in the settler. Early identification of the formation of these molecules in the flame would provide information to relate poor oxygen distribution during the oxidation process and establish actions in the process control.
Toro et al. [
26] have presented evidence of the FeO pick at laboratory scale by measurements with a built-in developed spectrometer with a high sensitivity and a high spectral resolution (
Figure 7). Then, a second experiment was conducted measuring the spectra with a low spectral resolution and a low-sensitivity commercial spectrometer, but enhanced and analyzed with post-signal processing and multivariate data analysis such as principal component analysis (PCA) and a multivariate curve resolution–alternating least squares (MCR-ALS) method. In the same article, one can find the results from an experimental plan to propose for the first time in the scientific literature the characteristic wavelength for Fe
3O
4 molecular emissions. The experiment was undertaken by the combustion of pure pyrite (FeS
2). This combustion test is very representative due to the possibility to produce Fe
3O
4 in the laboratory furnace according to the control of oxygen potential in the combustion chamber.
In the same scope and analyzing data from the same set-up for combustion of concentrates, Arias at all [
21] reported exploratory results depicted some spectral features related to the presence of Cu
xO emissions at 606 nm and 616 nm.
4.1.4. Experimental Results: Identification Characteristics of the Charge
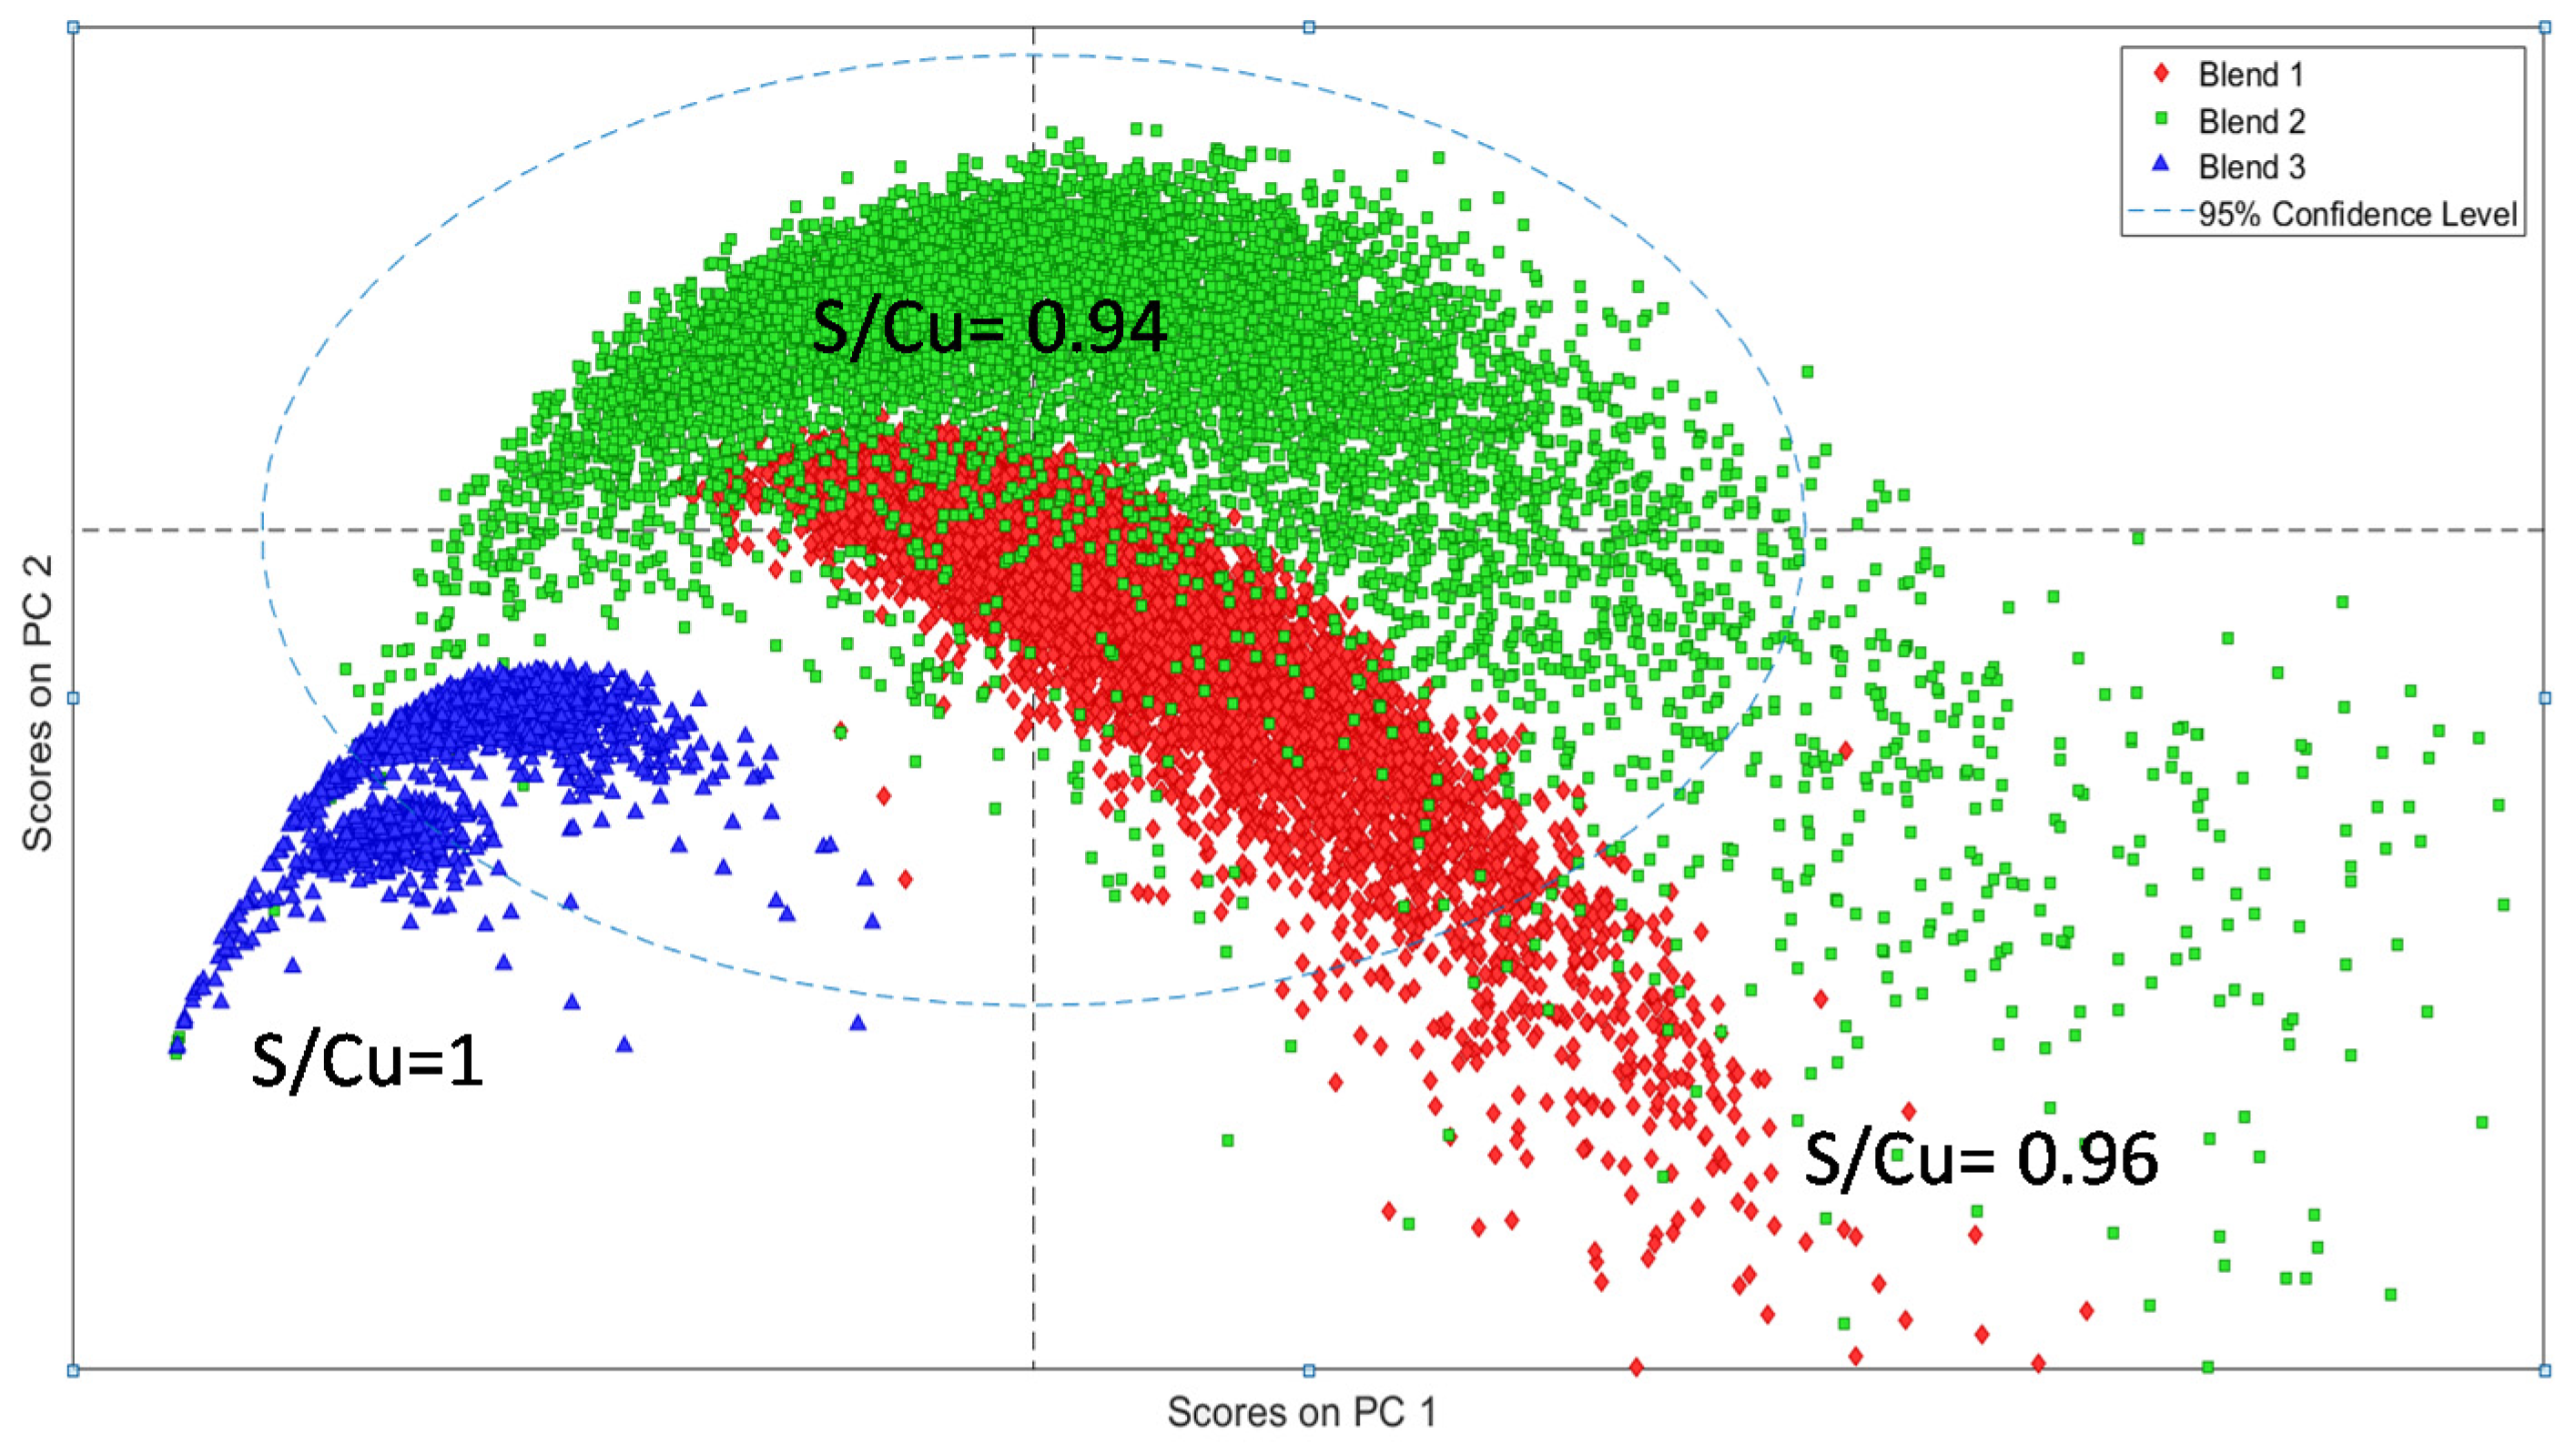
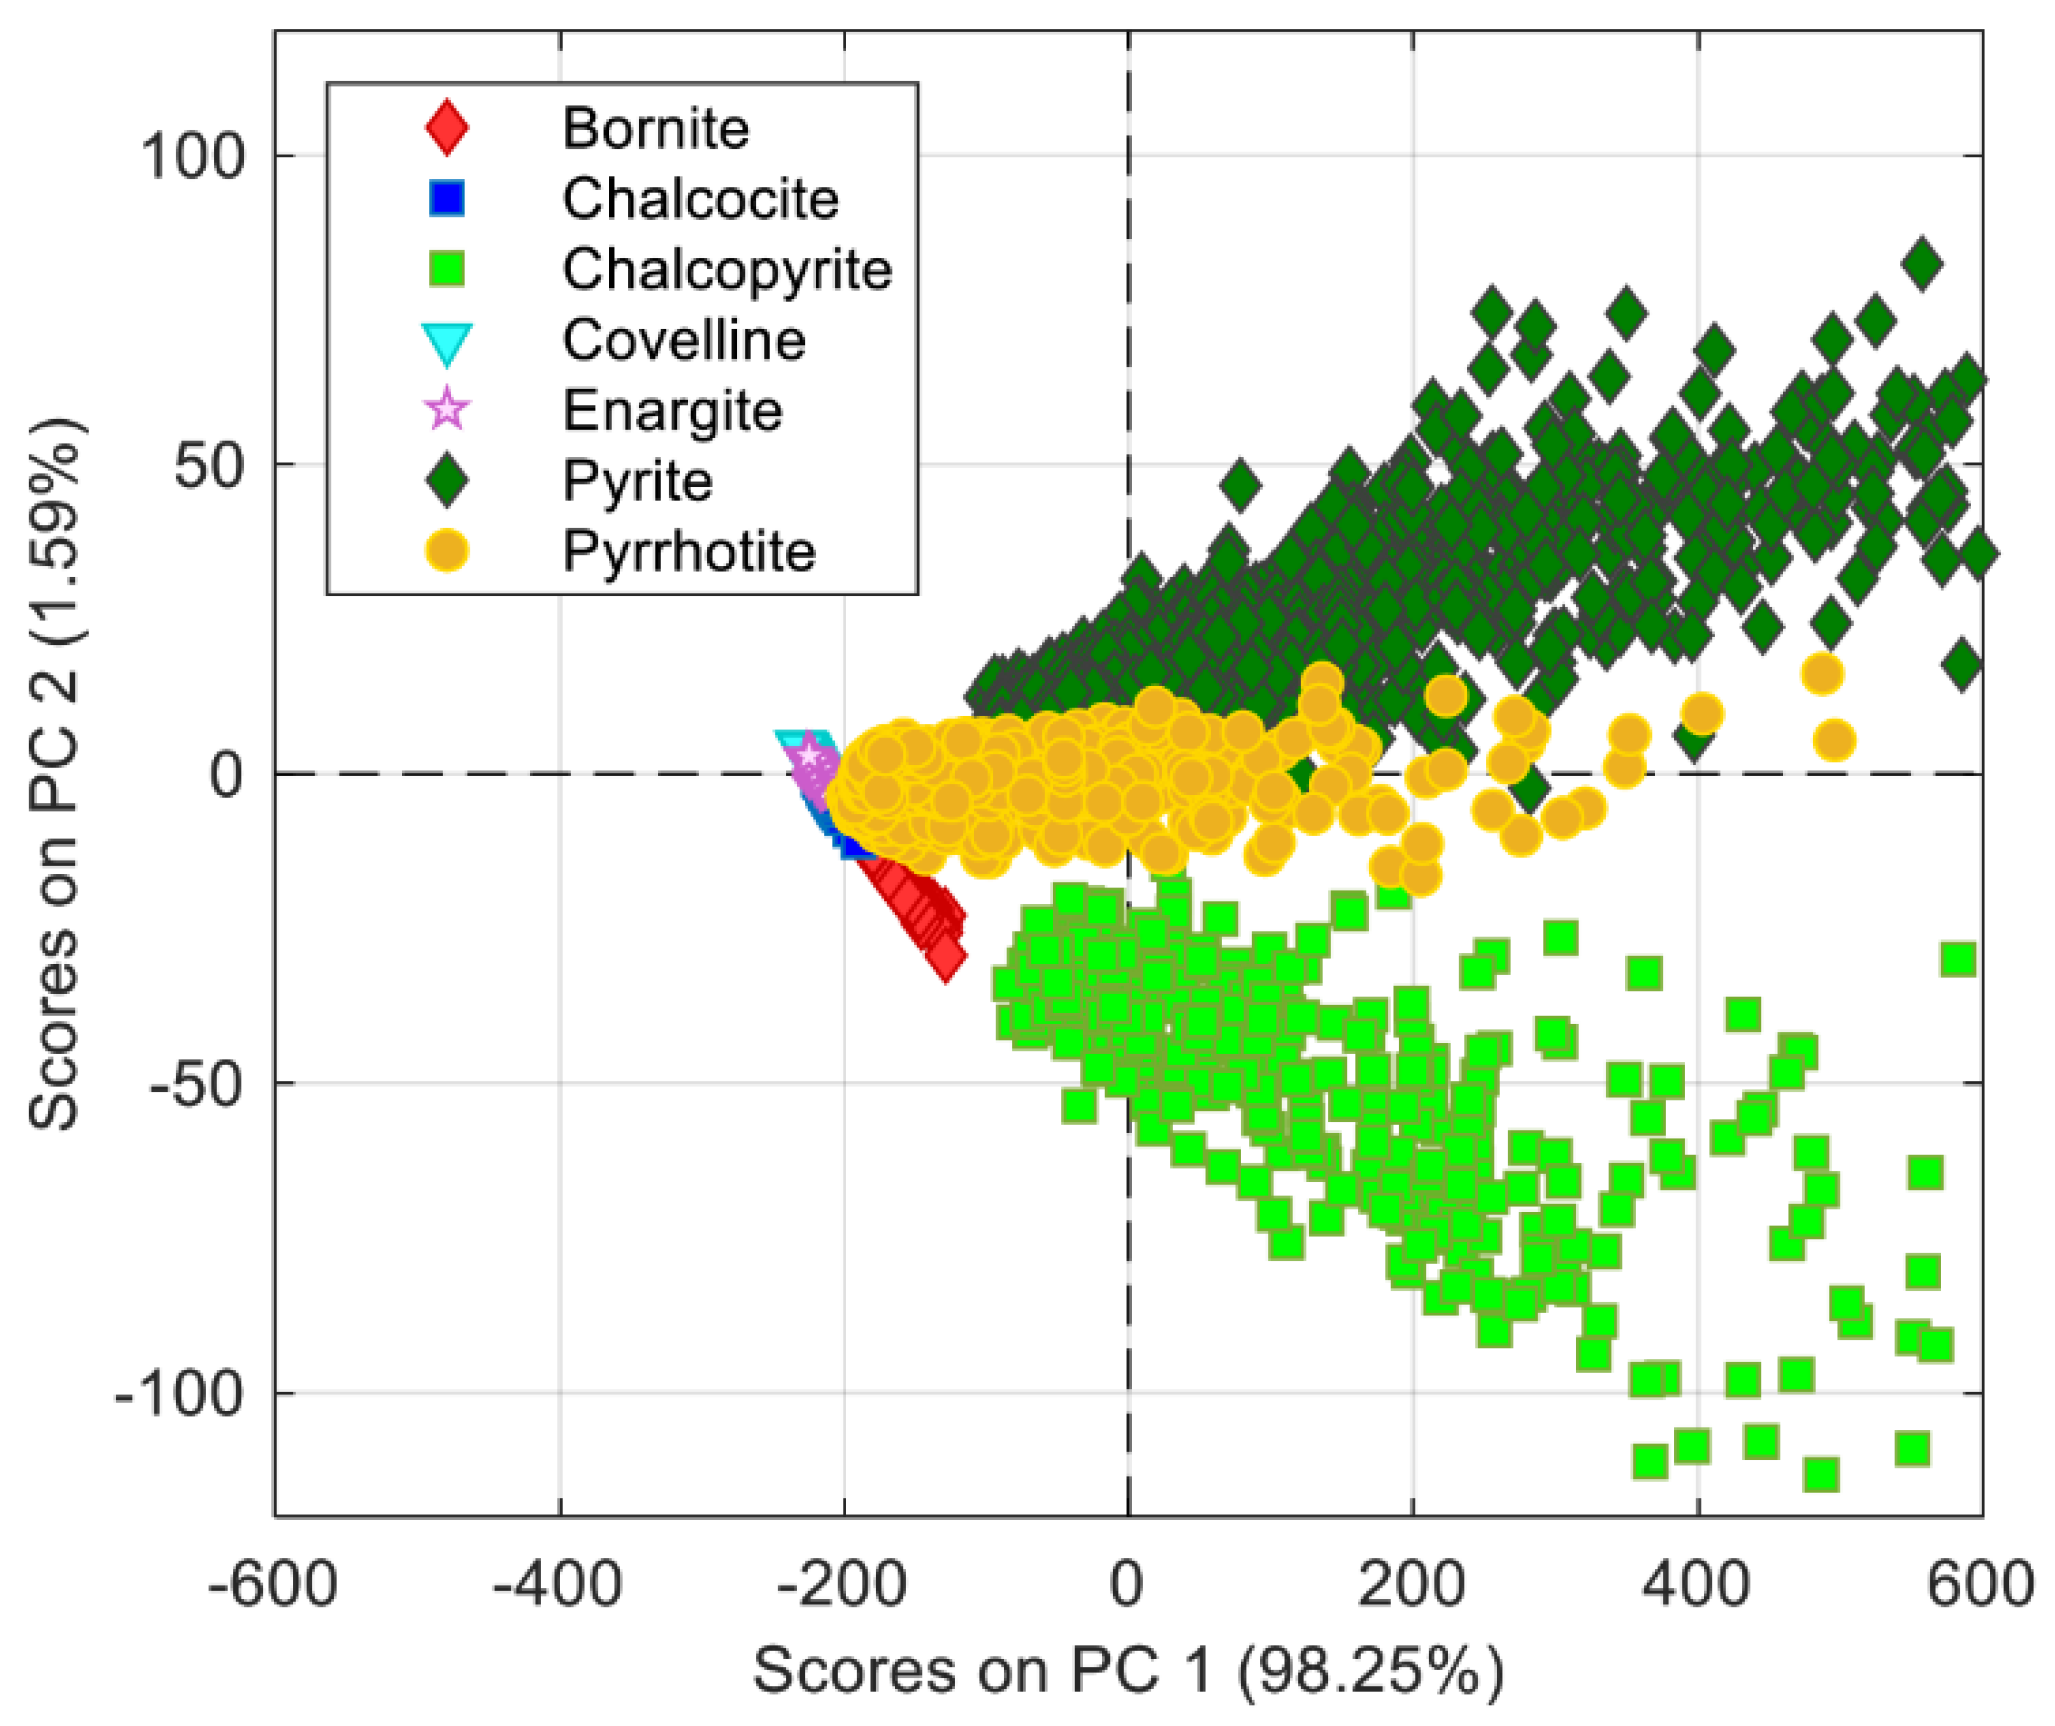
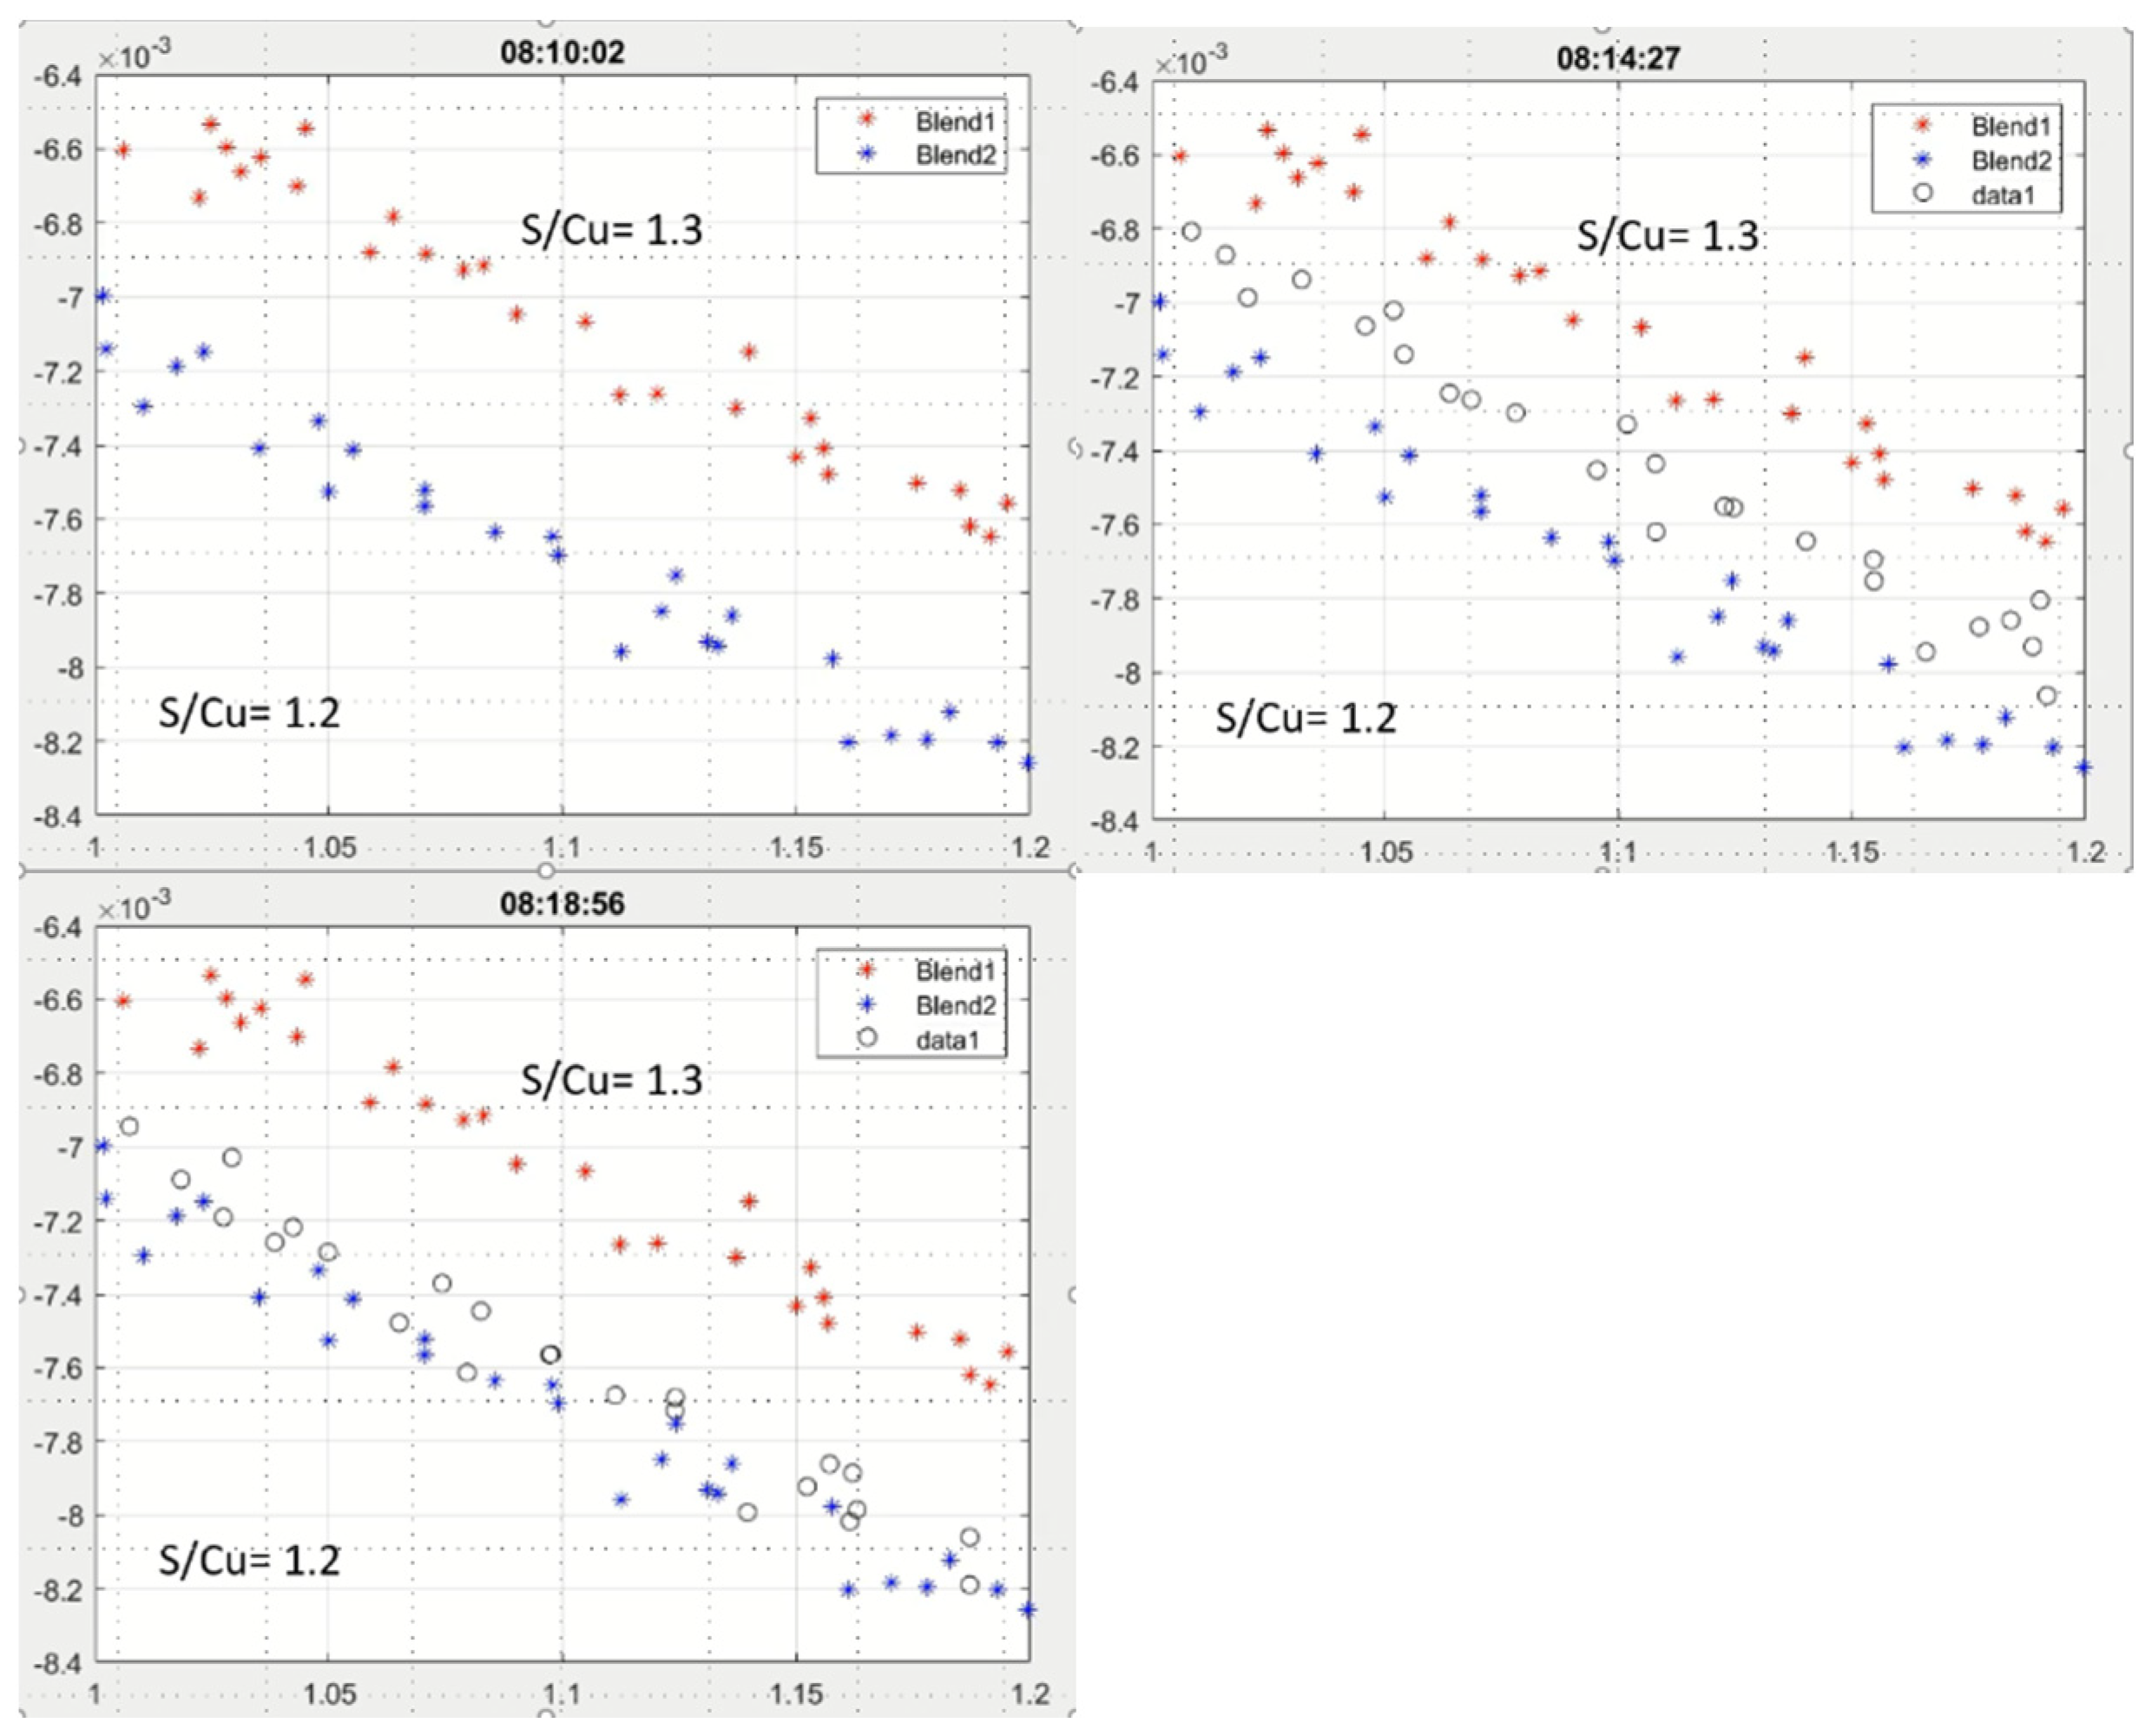
The last result is related to the possibility to identify the characteristics of the charge based on the analysis of the spectrum collected. In this topic, Marin [
27] developed the first algorithms applied to identify three types of concentrates characterized by their S/Cu ratio (
Figure 8). Then Díaz et al. [
23] used the same approach to extend the identification target to mineralogical species (
Figure 9). The algorithms are based on principal component analysis (PCA) applied on the spectral data showing high correlation features among species with similar elemental compositions or the same type of concentrate. Classification algorithms were tested on the spectral data, and a classification accuracy of over 95% was shown. Detailed mathematical treatment of the spectrum and the mathematical development of identification procedures can be followed in [
23,
27].
These results provide a very interesting opportunity to integrate spectral measurements of a smelting furnace flame into operational control. As previously stated, the control of a smelting furnace (flash smelting or bath smelting) is based on a macroscopic mass and energy balance. These balances are carried out by charges that represent several hours of furnace operation. These charges are statistically characterized and, therefore, there is always a deviation from the values that have been established to control the process. The main variables of this control are the amount of oxygen indicated in Equation (2) and its percentage in the process gas, which is the first control for a target temperature of the operation. Having an online indicator whether of the type of charge (
Figure 8) or, ideally, based on information on their species (
Figure 9) would allow establishing a mass and energy balance online and adjusting the control variables based on this information. The situation today is that the operator only knows the results of the operation several hours later, having only the measurements of the temperature of the gas line as the most relevant information for the control.
4.1.5. Preliminary Industrial Tests
To date, some measurements in an industrial environment made it possible to validate some of the results proposed from the laboratory studies summarized in the previous points. The setup considered the installation of an optical probe in the center of a burner in an industrial flash smelting furnace, which is a location analogous to that of the laboratory (
Figure 10). The probe was installed in the space for the fuel lance that flash burners usually have. The fuel lance is concentric to the concentrate burner and aims to provide a radiant heat source from the center of the volume where the flame appears. The probe was placed instead of the fuel lance. Due to the process of air and oxygen injection in this area, the temperature is low enough to fit a standard optical probe.
The objective of using this radiometric probe in the control structure of a smelting furnace is to provide on-line and real-time information on the combustion conditions of the charge fed to the burner. As a first result, it can be precise that the probe and its digital system give an on-line temperature measurement, which is within the orders of magnitude of the values obtained in the laboratory. This simple fact is relevant because it allows the validity of the experimental setup (
Figure 4) to be established in order to study the flash oxidation reactions of copper concentrates.
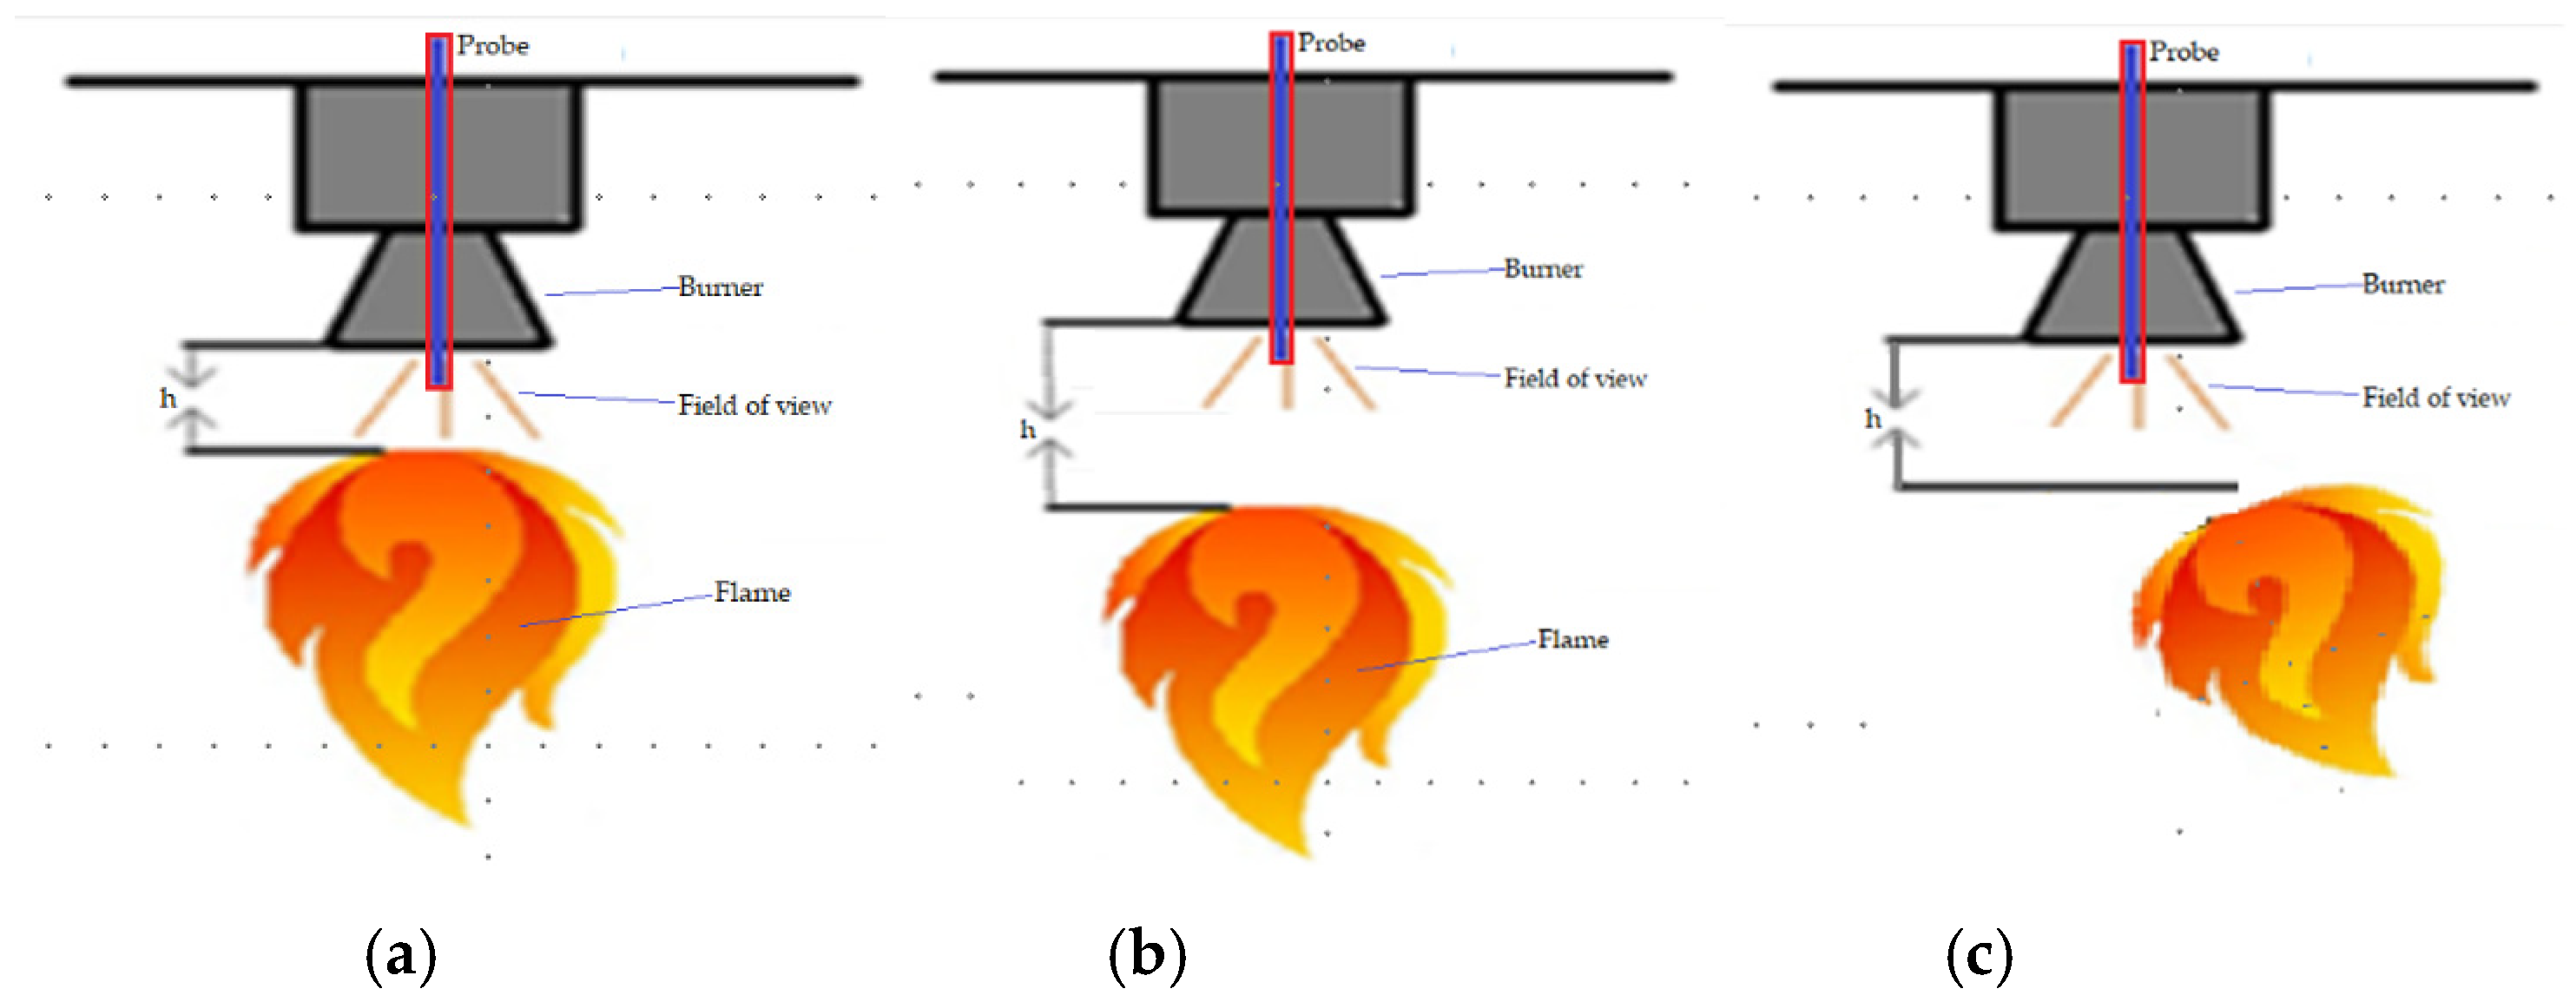
A relevant objective for the operation of a smelting furnace is to maintain a stable process for the sulfide oxidation (Equation (2)). In the case of a flash smelting furnace, one can say that the objective is to achieve stable combustion (
Figure 11 shows a drawing of some conditions out of standard). It is widely known that any instability in the flame produces a series of disturbances into the operation, perhaps the most relevant being the increase in dust generation that can generate accretions inside the furnace or in the gas line that are difficult to handling impacting the reactor operating time.
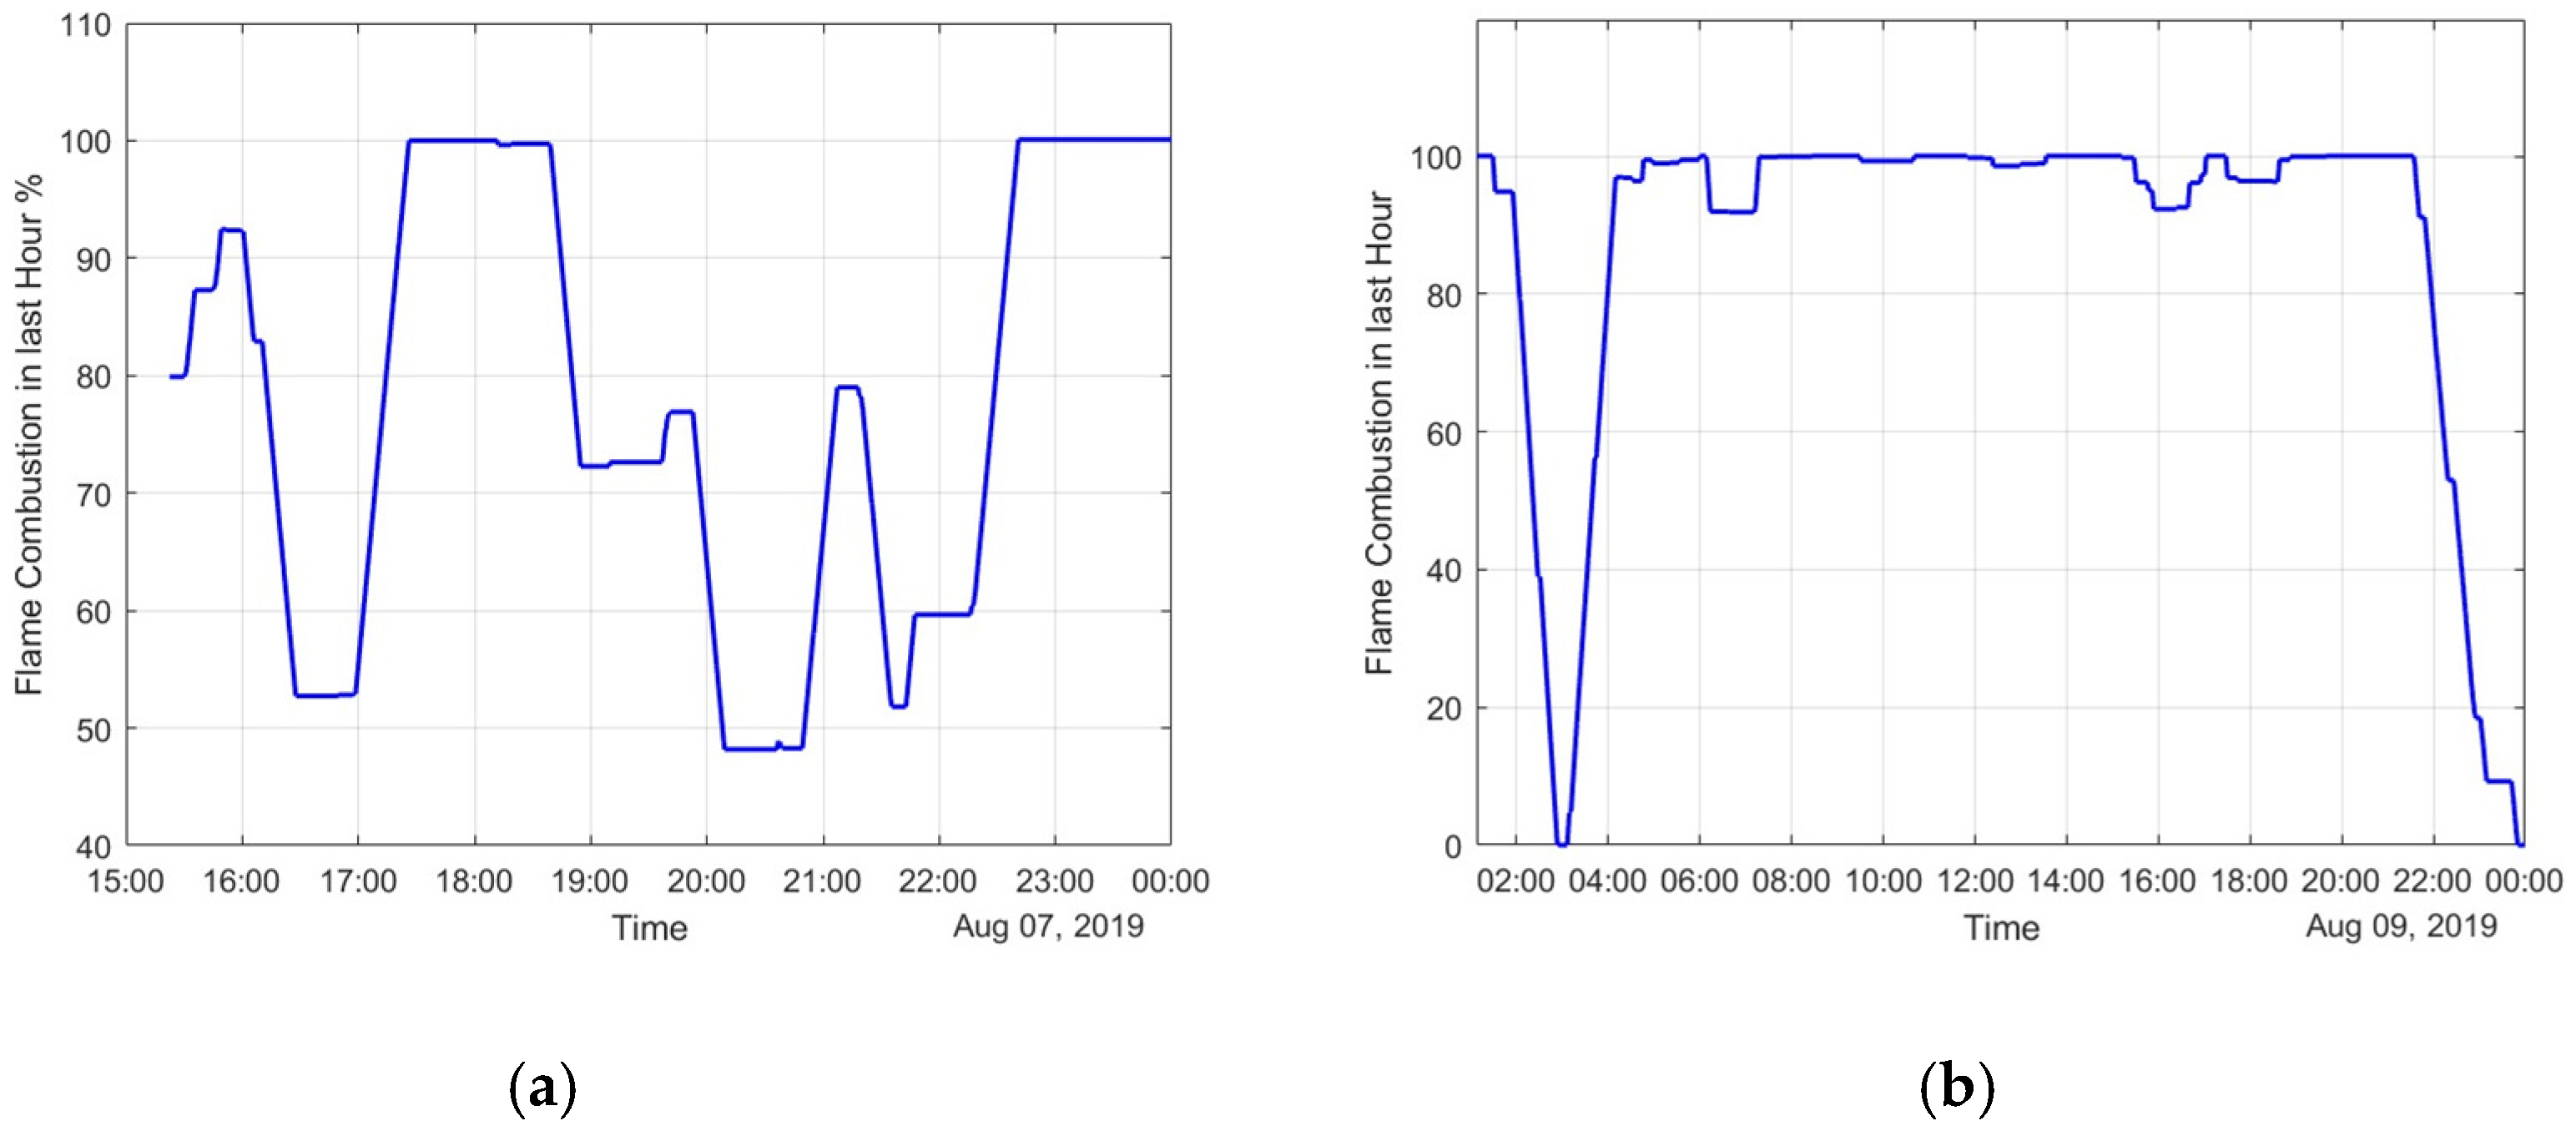
The first objective was, therefore, to propose a parameter that would inform the operator about the stability of the flame, following the intensity measured by the probe over time. If this measurement is below a certain threshold of reference for a certain period in a previous interval (for example, the last 60 or 90 min), the combustion could be out of standard, and the operator must take action to monitor the function of the burner as a priority.
Figure 12 gives an example of this indicator, being very relevant to identify moments in which the measurement dropped abruptly, even without energy measurements, which may mean that the flame did not form or it is outside the field of view of the probe. There are conditions of this type where, however, the feed of the concentrate and O
2(g) was maintained.
A second stage for the analysis of the collected information considers the design of online algorithms. Offline PCA was already applied in the previously discussed results, where it was possible to establish that the signals of FeO, CuOx, and Fe3O4 appear in the measured spectra.
As was done for laboratory tests using PCA, changes in the charge fed to the furnace were identified.
Figure 13 shows the evolution in time of the passage from one charge to another. This identification is relevant since the arrival of a new type of charge to the burner is established by a methodology considering the mass balance of the hoppers, and the change of the control parameters of the furnace is programmed accordingly, without having any field measurements of this process. The effective moment when the charge changes is not certain. It was found that, in effect, this change differs at the start from the program, having a difference of up to 25 min. The change itself takes at least 10 min, so the furnace was in inappropriate control conditions for at least 35 min, and if the charge changes several times per day, there is a risk of the furnace having inappropriate control parameters several hours a day.
4.2. Non-Reactive Systems
The previous sections have shown that radiometric measurements can follow dynamic aspects of the oxidation of sulfides and, in particular, mineral sulfides. The analysis of the characteristics of these measurements, which are non-invasive, at a distance, and with increasingly affordable components, can be extended for the application of spatial recognition of the molten phases. Based on technological surveillance and prospecting of the scientific and technical literature, there is no commercial instrument available for copper smelters, that quantifies online and without contact the percentage of copper (% Cu) in the molten metallic phases during tapping operations, nor the possibility of discriminating the phases during tapping, which is of a superior interest for these operations. Indeed, the discrimination of matte on the slag during slag tapping in smelting reactors or metallic copper during slag tapping during the converting stage can impact Cu recovery for the whole smelter. This action is, again, based solely and exclusively on the experience of ground operators.
Just as a starting point for reactive system measurements was established in developments in the steel industry, development in spatial recognition of high-temperature molten phases has also been established. In the last decade the spectral behavior of pig iron, and slag in pig iron production processes in blast furnaces have been studied to estimate tapping temperature [
28,
29]. The models presented describe the parameters contained in the iron-slag mixture in the blast furnace tapping, essentially describing parameters such as iron emissivity, tapping depth, slag layer thickness, slag absorption coefficients and radiometric parameters such as reflectance at the iron–slag interface. The method consists in determining a spectral range in which the spectral radiation of the molten phases tapped is high, facilitating the detection by a silicon CCD camera, sensitive in the visible spectral range and part of the near infrared. An optical filter centered at 650 nm was used together with the optics, so the radiation emitted by the slag was partially filtered in the indicated spectral range. The results confirm that the difference in emissivity of iron and slag at 650 nm allows a spatial distinction of the location of these phases, further identifying that the radiation intensity of the molten iron remains practically constant during the process, while the intensity of radiation from the slag is fluctuating. The fluctuation of this radiation intensity would be due to the difference in the thickness of the slag layer, absorbing and transmitting with variable percentages the radiation coming from the steel at high temperature. Moreover, the optical system has been calibrated with a high-temperature black body radiator, allowing the temperature value to be estimated at 1500–1600 °C. These results confirm that by using appropriate spectral models, sensitive optoelectronic systems in the spectral molten iron emission band and processing software, it is possible to obtain both laboratory and industrial developments of reliable and robust systems. In addition, it is now possible to find commercial instrumentation for the on-line detection of slag in the steel industry (Slag Detection Systems, LAND instruments) [
29]. This instrument measures infrared radiation in the middle band (3–5 micrometer wavelength) with a narrow band optical filter in 3.7 micrometers, generating a video in which the steel of the slag is clearly discriminated in the image. Associated with the equipment, there is an algorithm specially designed to calculate the percentage of slag.
This review shows that the possibility to apply spatial recognition of molten phases is already a feasible development based on the same principles we have used until now for reactive systems. The concept is to adopt the fundamentals the define the principle and adapt them to the physical, chemical and optic properties of the molten phases of Cu pyrometallurgy. Iron and copper have similar physical characteristics: bond microstructure and comparable transport properties, especially of the molten phase. At the same time, the steel making slag and the copper slag have similar oxide structure because they have the same constituents: SiO2, CaO, Al2O3, MgO and FeOx.
5. Final Remarks
In this first stage, the results obtained at the laboratory scale have been validated in the industrial environment. It is important to point out that the experimental set-up designed to replicate the fundamental phenomena of industrial reactors on a small scale is fully valid for taking radiometric measurements during the evolution of the reactions. The radiometric measurements are the subject of this proposal for the development of optoelectronic sensors for the Cu pyrometallurgy, or in a wider scope, for non-ferrous metallurgy. These radiometric measurements are specially adapted for the chemical processes that take place in the reactors of a copper smelter. As previously specified (
Figure 2 and
Figure 3), the scale of the fundamental phenomena is in the order of milliseconds, even though the control of the smelter is based on the monitoring of variables with a sampling rate in the order of a minute. Optoelectronic sensors have the characteristics required to follow at this level the oxidation phenomena that take place during all operational stages of a copper smelter.
Undoubtedly, the current reality of operational control in copper smelters presents a considerable gap with the situation of other process industries, and very particularly with the iron and steel industry. However, the new paradigm of Industry 4.0 could be a catalyst to address these necessary developments and thus narrow the gap.
The developments presented require work to validate the instruments, not in their functionality (which has already been demonstrated) but in their application, first, to create tools of real value for the operators. The possibility of carrying out an online treatment of the information is something very promising and so require different process calculations to support the operators and tend to develop automatic control strategies. Those predictive calculations require the generation of databases to evaluate different tools within the data analytic techniques that, and in an accelerated manner, have been consolidated as an applied alternative to solve complex problems. In particular, it is interesting to propose the prediction of the output variables of the different reactors: chemical compositions and temperatures of the molten phases that are produced in each one of them. From a fundamental perspective, this objective is reasonable considering that the combustion flame of sulfides carries information on the species participating in the oxidation, as was demonstrated at the laboratory and industrial level. Consequently, it is plausible to expect that the information from the flame radiation, perhaps combined with some other variables, could predict the chemical characteristics of the products.
The reality of copper smelters is that the information systems must be able to incorporate information from different discrete variables, such as temperature and composition of molten phases tapped out of the reactor to make batch and semi-continuous operations compatible. Although this operation seems trivial it is a source of errors and inconsistencies. The development of sensors that continuously measure the chemical composition of the molten phases from the reactors will be of great help to have a uniform and unique database to approach the analysis of modern techniques looking to optimize the processes and the business of the smelter.
The results shown are part of a broad research program and progress has also been made in the application of these concepts for bath smelting reactors. Although this part of the study lags behind the application to flash melting furnaces, that represent over 50% of smelting reactors in the world, the first results indicate that the signal from a molten bath will be more stable and with a higher intensity than in the case of the sulfide oxidation flame. Indeed, the flame is not a continuous volume, instead, the molten bath represents a continuous domain for the field of view of the probe.


