Abstract
A gravity core (220 cm depth) was collected to investigate the geochemistry, enrichment, and pollution of trace metals in anoxic sediments from San Simon Bay, an ecosystem of high biological productivity in the northwest of Spain. A five-step sequential extraction procedure was used. The Cu, Pb, and Zn contents decreased with depth, with maximum values in the top layers. Ni and Zn were bound to pyrite fractions, while Cd and Pb were associated with the most mobile fractions. The analyzed metals were associated with the fractions bound to organic matter, mainly with the strongly bound to organic matter fraction. High Cd and Cu values were observed. The fractionation showed a high mobility for Cd (28.3–100%) and Pb (54.0–70.2%). Moreover, the pollution factor and the geoaccumulation index reflected a high contamination for Pb and a moderate contamination for Cu and Zn in the superficial layers, pointing to a possible ecotoxicological risk to organisms in San Simon Bay.
1. Introduction
Trace metals occur naturally in the environment, differing in contents along the Earth’s crust [1,2], but presenting a surprisingly consistent background in sediments [3]. Human activities can drastically increase their contents, mainly from agricultural, urban, and industrial land use [4,5]. Industrial and mining activities contribute to 48% of the total release of contaminants in Europe [6]. The human delivery of some trace metals to the coastal environment, putting coastal ecosystems under stress, represents a current issue of concern. This is due to their persistence, potential toxicity, mobility, and ability to be incorporated and accumulated in food chains, with important implications for risk assessment, public health, and contamination management [7,8,9,10,11]. Trace metal pollution is related to a deterioration of water quality and/or accumulation in plants and animals [12,13,14], being incorporated into sediments as one of their reservoirs [15,16].
The distribution of trace metals in the different sediment fractions, their capacity for complexation, and the magnitude of the contamination-related risks are conditioned by the intrinsic properties of both metals and sediments, as well as their, mobilization in interstitial water and other factors (salinity, bioturbation, redox or pH). Metal accumulation in sediments and the determination of their natural and anthropogenic sources makes sedimentary records good environmental indicators and a powerful tool by which evaluate geochemical changes, reconstructing the human–nature relationship over time, particularly in coastal areas [17,18,19]. With the purpose of assessing trace metals contents in sediments and their contamination degree, this study considers the distribution of Cadmium (Cd), Copper (Cu), Nickel (Ni), Lead (Pb), and Zinc (Zn) in a gravity core (220 cm depth) retrieved from San Simon Bay (NW of the Iberian Peninsula). The bay is a Special Area of Conservation (SAC; included in the Natura 2000 Network), with high natural values affected by intense human pressure. It is a suitable site to study natural and anthropogenic dynamics from pre-industrial society to today.
Numerous studies have focused on determining the contamination of the Galician Rias (e.g., [20,21,22,23,24]), mainly in San Simon Bay (e.g., [25,26,27]). Some studies have analyzed the metal fractionation [21,25,28,29]. However, these studies cover only the inner or middle zones of the Ria of Vigo, analyzing the uppermost part of the sedimentary sequence (<100 cm deep). The objective of this work was to analyze the trace metal contents in the San Simon Bay sediments in order to conduct an environmental risk assessment to provide relevant information for environmental protection and future management.
2. Materials and Methods
2.1. Study Area
The San Simon Bay, with a length of 8 km and a maximum width of 3.6 km, has a surface area of 19.4 km2 with an average water depth < 5 m (Figure 1). The San Simon Bay can be considered as an estuary, according to its hydrology and sedimentology [30]. The orientation and morphology of this area cause low-energy hydrodynamics, which lead to the development of intertidal flats and marshes [24,26]. The sedimentary environments in the bay are controlled by tidal processes, being in the medium tidal range of 2.2 m. The upwelling process provides cold waters rich in nutrients, causing San Simon Bay (as the Ria of Vigo) to have a high productivity. According to [31], the primary production values range between 0.05 and 2.8 g C/m2 day. The high productivity increase the flow of organic matter to the seabed, having sediments with total organic carbon (TOC) average values from 7% to 10% [32]. The TOC/TN (total nitrogen) ratio is from 11 to 21 [33], indicating that the organic matter is of a continental origin [34]. The sediments are fine-grained and the pH values are close to neutral or slightly alkaline. The sedimentation rates ranged between 3 and 6 mm y−1 [27]. The high sedimentation rate, together with the high biological productivity, favor the development of anoxic conditions in the sediment and biogenic methane production [33,35]. Shallow gas accumulations have been observed in the Holocene sedimentary record [36], delimiting the sulfate-methane transition zone (SMTZ) between an 80 and 100 cm depth in the inner zone of Ria of Vigo [35].
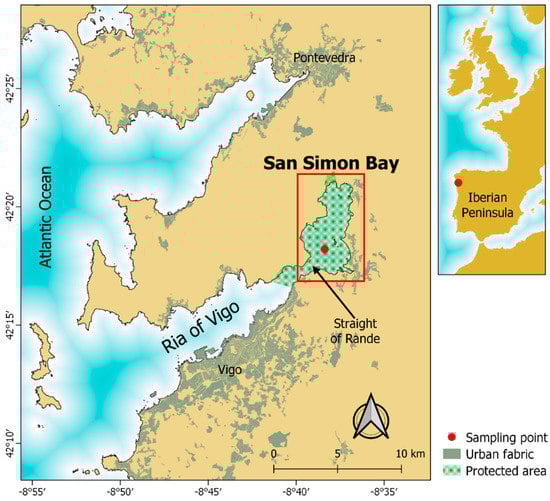
Figure 1.
Location of San Simon Bay in the Ria of Vigo (NW Iberian Peninsula) and the position of the sampling point. Map elaborated with QGIS 3.4 with layers from the Spanish National Geographic Institute (©IGN) and the Directorate General of Nature Conservation of the Ministry of the Environment, Territory and Infrastructures s (©Xunta de Galicia).
Intertidal areas are usually sinks for trace metals. Anoxic conditions, pH values near to neutrality, and high TOC contents in the San Simon Bay sediment could determine the speciation of trace metals and the behavior in these environments.
2.2. Sampling and Analysis
In order to characterize the behavior and trace metals distribution in sediments with high organic matter contents, a gravity core (220 cm depth) was retrieved in the subtidal area of San Simon Bay (Latitude 42.302972°; Longitude −8.638778°, Figure 1) in November 2012, on board the R/V Mytillus. This core showed Eh values <−174 mV, and the pH ranged between 6.8 and 7.9. The sediments are fine-grained (48% and 46% on average of silt and clay, respectively). The TOC values varied from 4% to 15% [37].
The core was promptly sampled in the ship’s laboratory in order to minimize the oxidation of the sampled material. The core was sliced into 2.5 cm segments and frozen at −18 °C until chemical analysis. For the analysis of this work, 1 out of 4 samples (0–2.5 cm; 10–12.5 cm, and so on) were used.
The samples were analyzed in duplicate after the separation of pore water by centrifugation for 45 min at 4000 rpm. The percent wetness of the samples was calculated in order to express the final results in dry weight. The partitioning of the solid-phase trace metal contents was performed using the sequential extraction procedure proposed by [38]. This procedure allows separate five phases according to the nomenclature [37,39]:
- Metals present in the ion-exchangeable form and bound to carbonate (F1), were obtained by adding 40mL of 1M ammonium acetate (NH4CH3CO2) adjusted to pH 5 with acetic acid to a 0.5 g sample under stirring for 24 h at room temperature.
- Metals present in the reductive phase bound to manganese-iron oxides (F2), obtained with 20 mL of 1M hydroxylammonium chloride (HONH2·HCl) and 20 mL of acetic acid (CH3COOH, 25%) after 24 h of shaking at room temperature.
- Metals weakly bound to organic matter (F3), obtained by adding 20 mL of 0.1 M HCl and stirring for 24 h at room temperature.
- Metals strongly bound to organic matter (F4), obtained by adding 20 mL of 0.5 M NaOH under stirring for 24 h at room temperature. For sediment samples with high organic carbon content, this treatment should be repeated until a clear solution is obtained. All the solutions obtained from the solids were dried at 55 °C and digested using 8 mL of HNO3 (65%) at 115 °C for 30 min.
- Metals bound to sulfide (F5), was obtained with 20 mL of 8 M HNO3 and digested for 3 h at 85 °C.
All the residues were washed with 5 mL of distilled water and the washings were added to the solution. The trace metals contents were measured by inductively coupled plasma optical emission spectrometry (ICP-OES) with a Perkin Elmer Optima 4300 DV instrument. The reagents for analysis were ISO grade and ACS. Calibration solutions were prepared in deionized water from stock solution. The detection limits were: Cd: 0.005 mg L−1, Cu: 0.010 mg L−1, Ni: 0.010 mg L−1, Pb: 0.020 mg L−1, and Zn: 0.005 mg L−1.
2.3. Assessment Indices
In the present study, the mobility factor (MF) and three others indices were selected for the environmental assessment—i.e., the contamination factor (CF), geo-accumulation index (Igeo), and risk assessment code (RAC).
The mobility factor (MF, [40]) describes the potential of a metal to become mobile in the environment and to be bioavailable. This factor strongly depends on the specific chemical forms of association of each metal [Me], and it is calculated following Equation (1), where Fn is the metal content (mg kg−1) obtained for each extracted fraction (from F1 to F5):
MFMe = ((F1 + F2)/(F1 +F2 + F3 + F4 + F5)) × 100.
The Contamination Factor (CF,[41] ) is calculated (Equation (2)) as the quotient between the content of a single metal in the sediments [Me]i and the background content of the same metal [Me]BG. The criteria adopted to determine the extent of the contamination were as follows: no/low contamination (CF < 2), moderate (2 ≤ CF < 3), high (3 ≤ CF < 6), and very high (CF ≥ 6).
CF = [Me]i/[Me]BG
The geoaccumulation index (Igeo; [42]) is used to quantify possible metal pollution in marine sediments by comparing the current contents with preindustrial levels. The mathematical expression of the Igeo is presented in Equation (3); a 1.5 factor is included to take into consideration the natural variations caused by factors such as the lithology.
Igeo = log2 ([Me]i/1.5 [Me]BG)
Based on [42], a sediment classification into seven grades can be established—i.e., grade 0: uncontaminated (Igeo ≤ 0); grade 1: slightly contaminated (0 < Igeo ≤ 1); grade 2: moderately contaminated (1 < Igeo ≤ 2); grade 3: moderately/severely contaminated (2 < Igeo ≤ 3); grade 4: severely contaminated (3 < Igeo ≤ 4); grade 5: severely/extremely contaminated (4 < Igeo ≤ 5); grade 6: extremely contaminated (Igeo > 5).
In this study, the background/preindustrial contents [Me]BG were established by the identification of uncontaminated sediments within the core (“low down-hole metal profile” [3]) with a common procedure found in the literature (e.g., [43,44,45]). This approach considers the local complexities, more appropriate than the use of general or regional references [46], because small variations in the geographic location may result in noticeable differences in the metal content (e.g., [47]).
The risk assessment code (RAC) is defined as the percentage of the exchangeable fraction (F1) in the total content of the selected metal. A five-level classification consists of no risk (<1%), low risk (1–10%), medium risk (11–30%), high risk (31–50%), and very high risk (>50%) [48].
3. Results and Discussion
Assuming a rough sedimentation rate between 3 and 6 mm y−1 [27], the bottom of the core (220 cm) could respond to sediments deposited 300–700 years ago. However, these sediments might be older according to [49], who dated the sediments in San Simon Bay deposited at a 200–220 cm depth to have sunk 8905 ± 305 cal. aBP. Anyway, the depth of the core supports the assumption that it has reached a pre-industrial section.
The copper, Pb, and Zn total extractable contents can serve to identify the industrial boundary (when the industrialization is clearly noticeable) in the 30 cm depth (Figure 2). Below this depth, the contents remained nearly constant (RSD < 15%, except for Cd). In consequence, sediments below a 30 cm depth can be considered as a pre-industrial record, assimilating them to the background contents [3,44]. The sum of the five fractions, or metal total extractable contents (hereinafter denoted as Tex), in the preindustrial layers of the core ranged between 18 and 30 mg Cu kg−1, 24–45 mgNi kg−1, 17–29 mgPb kg−1, and 85–135 mgZn kg−1. These preindustrial contents were coherent with previous works in the Ria of Vigo (see Table 1), pointing to a minor contribution of the residual phase (not measured in this work); therefore, Tex will be operatively considered as the total content. However, it is necessary to acknowledge that a certain portion of the elements would be missing in the residual portion of the sediments.
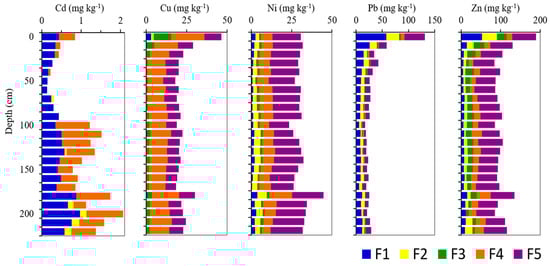
Figure 2.
Vertical distribution of the metal fractions (Cd, Cu, Ni, Pb, and Zn) in the sediments of San Simon Bay. F1, metals present in exchangeable form and bound to carbonate; F2, metals present in the reductive phase bound to Mn-Fe oxides; F3, metals weakly bound to organic matter; F4, metals strongly bound to organic matter; F5, metals bound to sulfide.

Table 1.
Local background [Me]BG levels for trace elements (mg kg−1).
The Tex content for Cd in the preindustrial section (0.1–2.1 mg kg−1) cannot be established as a reference due to the high mobility of this element in sediments, affected by intense post-depositional migrations [53]. Nevertheless, the Cd average Tex content in the preindustrial section (1.0 mg kg−1) is similar to the top limit for the Cd background values previously established in the nearby Ria of Arousa—i.e., 0.99–0.92 mg kg−1—respectively in [54,55]. This value is presented as indicative in Table 1, but it needs to be considered carefully, and this level is probably an overestimation, as will be discussed further.
The different distributions of the five trace metals under study among the five chemically defined fractions are shown in Figure 2.
3.1. Cadmium
The total extractable contents of Cd varied between 0.1 and 2.1 mg kg−1, coherent with the ranges of total contents previously determined in San Simon Bay (i.e., 0.2–5.5 mg kg−1; [56]. This trace element is present along the core in the labile fraction (particularly F1) and bound to organic matter (mainly F4), and was not detected in the sulfide fraction. Organic matter seems to be the major source of variation. After simple regression, considering the Cd Tex content (mg kg−1) as the dependent variable and the total organic carbon (%TOC) as the independent variable, the resulting function ([Cd]Tex = 4.71e0.434[TOC]) showed a moderately strong relationship between the variables (r2 = 0.56; p-value < 0.05). Cadmium increased largely below a 90 cm depth, mainly in the strongly bound to organic matter fraction (F4). This increase happened below the sulfate-methane transition zone (SMTZ; see [35]). This enrichment of Cd may be related to the bacteria-mediated processes of solid sulfide mineral production [53] or with the formation of organic-Cd complexes [57].
Cadmium was the most mobile element of those studied. The calculated MF (Figure 3a) showed an average value of 66% ± 24%. Its mobility increased from the surface (51%) to a 30 cm depth (100%). Below 90 cm, the values of Cd bound to the F4 fraction reduced its mobility drastically (28% at a 100 cm depth), increasing again towards the bottom, but never passing the 72% mark. Similar to the MF, the Risk Assessment Code (RAC, Figure 3b) indicated that Cd was at the level of very high risk, on average at RAC0–220 cm = 66%, but the RAC is again irregularly distributed. Higher values were found in the uppermost layer (average RAC0–90 cm = 88%). However, the total contents were low (average0–90 cm, 0.35 ± 0.21mg kg−1), probably without environmental meaning, and so under the threshold effects of the sediment quality guidelines that can be found in the literature (e.g., 1.2 mg kg−1, [58] freshwater ecosystems; [0.05] 0.5–1.5 mg kg−1 [59]; 0.68 mg kg−1 [60]). In the bottom core (100–200 cm depth), the average RAC100–220 cm was 49% and the total content average was 1.29 ± 0.37 mg kg−1, indicating that this core section acted as a sink of Cd and was a risk if the sediments were dredged, remobilized, or resuspended. Contents of up to 2.1 mg kg−1 are above the available threshold effects and close to the probable effect levels (e.g., 2.6 mg kg−1 [58]; 1–9.6 mg kg−1 [59]; 4.21 mg kg−1 [60]).
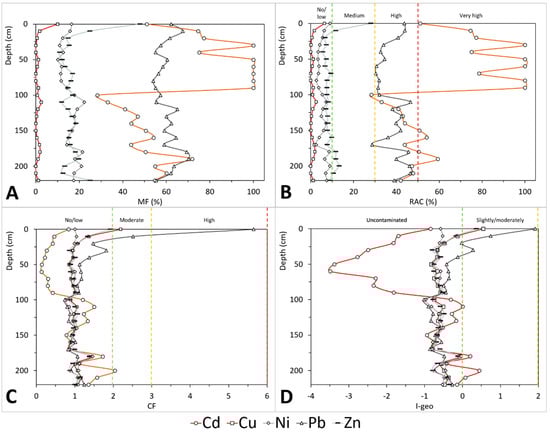
Figure 3.
Vertical distribution of the tested indices for the studied metals (Cd, Cu, Ni, Pb, and Zn) in the sediments of San Simon Bay. (A) Mobility Factor; (B) Risk Assessment Code; (C) Contamination Factor; (D) Geoaccumulation Index. Vertical broken lines in B, C, and D represent the thresholds used in the assessment of each index.
The CF (Figure 3c) was not a good measure of anthropogenic pressure for Cd due to its mobility. However, using as indicative value of 1.0 mgCd kg−1 (Table 1), the 90 cm depth boundary is revealed. Sediments above 90 cm seemed to be depleted in Cd (average CF = 0.35), and the sediments below were probably enriched by post-depositional migration (average CF = 1.28). The use of the Igeo (Figure 3d), more restrictive than CF and taking into consideration a factor for natural variability, showed equivalent results below the 90 cm boundary. Although Igeo cannot be used to measure contamination in this case, its high negative values pointed to a possible overestimation of the indicative value used as background, well above the upper continental crust reference (i.e., 0.09 mg kg−1; [61]) or the average in regional (Galicia) continental sedimentary deposits (i.e., 0.10 ± 0.06 mg kg−1; [57]).
3.2. Copper
The copper Tex contents were the highest at the surface—i.e., 46.4 mg kg−1—decreasing until being relatively constant below the 30 cm depth—i.e., 21.1 ± 2.8 (RSD = 13%). Only on the surface (0–20 cm) the Cu Tex contents were slightly higher than the previous background values established in the Ria of Vigo and in San Simon Bay (Table 1). They were regularly distributed within the five fractions along the core, with the major carrier being organic matter (F3 + F4 ~ 63%), particularly in the strongly bound to organic matter fraction (F4, 54.2 ± 3.0%). The second reservoir was bound to sulfide (F5, 36.1 ± 3.9%), being the labile forms (F1 + F2 ~ 1%) of lesser importance. In the uppermost layers (0–30 cm), we observed a general exponential increase (r2 ≥ 0.9) towards the top core in all the five fractions, mainly in the organic fractions (F3 + F4). Comparing the bottom core trend with the uppermost layer enrichment, the mass balance showed the following sequence from higher to lower: F3 (from 1.6 ± 0.6 mg kg−140–220 cm to 10.9 mg kg−10 cm), F4 (from 11.60 ± 1.6 mg kg−140–220 cm to 20.4 mg kg−10 cm), F1 (from 0.2 ± 0.2 mg kg−140–220 cm to 3.0 mg kg−10 cm), F5 (from 7.7 ± 0.8 mg kg−140–220 cm to 10.5 mg kg−10 cm), and F2 (from negligible mg kg−140–220 cm to 1.7 mg kg−10 cm). Accordingly, the organic matter (both F3 and F4) seemed to be the major carrier of the uppermost core enrichment in Cu.
Between the five studied elements, Cu is the least mobile. Its MF (Figure 3a) showed values below 3% in the whole core (range10–220 cm from negligible to 2.5%), except in the surficial layer (0 cm), where the MF increased up to 10%. Cu was not detected in the reductive phase bound to manganese-iron oxides (F2), except in the 0–10 cm section. The results calculated for the RAC (Figure 3b) were equal to the MF below 10 cm, ranging in the core from 0% to 6.4%. The qualitative assessment for the RAC placed Cu in the ranges between no risk and low risk. Unlike what was observed for Cd, although the Cu contents in labile forms (F1 and F2) were scarce, the Tex contents were within the values between the threshold effect (e.g., 16 mg kg−1 [58]; 16–70 mg kg−1 [59]; 18.7 mg kg−1 [60]) and the probable effect levels (e.g., 34 mg kg−1 [58]; 36–390 mg kg−1 [59]; 108 mg kg−1 [60]), suggesting any kind of potential risk.
The contaminant factor (CF, Figure 3c) is relatively constant in the sediment core (average CF40–220 cm = 1.0 ± 0.1), except in the superficial layer, where the CF increased from 30 cm (0.9) to the surface (2.2), reaching values in the range of moderate contamination. The Igeo (Figure 3d) showed similar results (-0.6 ± 0.2 below 30 cm), increasing towards the surface (up to 0.6) to reach a value classified as slightly contaminated in the uppermost layer. Although the inflexion in the trend is observed above a 30 cm depth, only the surficial sediments showed indexes indicative of low contamination, with Tex contents slightly above the local background values (Table 1), and also over the range for unpolluted marine sediments (i.e., 30–35 mg kg−1), provided by [62] for the regional and global scale.
3.3. Lead
The lead Tex contents ranged between 17.3 and 131.7 mg kg−1, showing the highest values at the surface, over the local background values previously reported in the area (Table 1). The Tex contents were relatively constant below a 40 cm depth, of 23.3 ± 3.4 mg kg−1 (RSD = 15%). The enrichment in the uppermost 40 cm, ranging from 32.0 to 131.7 mg kg−1, increased towards the surface adjusted to a power function (r2 ~ 0.95). Lead was mainly present in labile forms throughout the core (F1 + F2 gathers 60%, RSD < 10%), especially in the ion-exchangeable form, and was bound to carbonate (F1, 38% ± 6%). The second fraction in importance was the bound to sulfide (F5, 31% ± 4%), followed by the Pb bound to organic matter (9% ± 5%), both weakly (F3, 6% ± 2%) and strongly bound (F4, 3% ± 4%). The standard deviations provided (or the relative standard deviations), except in the more variable and less Pb-containing fractions (F3 and F4), showed a low variability. In consequence, all the fractions increased in Pb content in the uppermost 40 cm, adjusting to a power function towards the surface (r2 > 0.8, except for F3 -0.6- and F2 -0.7-).
The mobility factor (MF, Figure 3a) was high along the core, varying from 54% to 70%. Its average mobility (65% ± 5%) was close to that of Cd but much less variable, not presenting any apparent trend in its fluctuations. The RAC (Figure 3b, on average 38% ± 6%) showed three well differentiated zones: (1) an uppermost zone (0–40 cm depth), ranging from 33% to 44%, with increasing values towards the surface; (2) an intermediate zone (50–90 cm), ranging from 30% to 35%, with values more or less constant; and (3) a downcore trend, varying from 29% to 47%, with higher fluctuations. This assessment, based on the mobility of Pb (MF and RAC), could be relevant in the up-core section (0–30 cm), where the Tex contents of Pb (34.4–131.7 mg kg−1) were higher than the threshold effect levels (e.g., 31 mg kg−1 [58]; [0.1, 0.01] 28–85 mg kg−1 [59]; 30.2 mg kg−1 [60]) and even above the probable effect levels (e.g., 68 mg kg−1 [58]; [0.3] 38–530 mg kg−1 [59]; 112 mg kg−1 [60]).
The CF (Figure 3c) showed a considerable variation (1.3 ± 1.0; RSD = 76%). The fluctuations in the CF values again determined two zones: a down-core constant trend in the range of no/low contamination (CF = 1.0 ± 0.2), with progressively increasing values above the 50 cm depth, from 1.1 to 5.7 at the surface, reaching the classifications of moderate (10 cm) and high contamination (0 cm). Similar results were provided by the Igeo (Figure 3d), below the inflexion at a 50 cm depth, with the Igeo averages of −0.6 ± 0.2 being classified as uncontaminated. The increasing values above this depth (50 cm)—i.e., from −0.4 to 1.9—classify the sediments as slightly (30, 10 cm) and moderately contaminated (0 cm). In coherence, the superficial sediments (0 cm) overpass the background values at the local (Table 1), regional, and global scales (e.g., 5–78 mgPb kg−1 [62]).
3.4. Nickel
The nickel Tex contents were relatively constant along the core (RSD = 13%), averaging 30.6 ± 4.1 mg kg−1, being in accordance with the previously established background values presented in Table 1. The nickel fractionation showed that Ni bound to sulfide was the most abundant fraction (F5, 56% ± 4%), followed by the organic fractions (F3 + F4, 29% ± 3%), and particularly the strongly bound to organic matter fraction (F4, 24 ± 3). The labile fractions were the minor drivers (F1, 6% ± 2%; F2, 10% ± 2%). The variability within the fractions was low (except in F1, RSD = 46%), so the proportions were relatively constant in the sedimentary column.
The mobility factor (MF, Figure 3a) allowed distinguishing some differences along the core. This index presented an average of 16% ± 4%, the lowest between the studied metals after Cu. Two sections were differentiated in the core, occurring at the boundary with the SMTZ (90 cm depth, see [35]). Above this depth, the MF slightly increased towards the surface (an average: 13%±2%), while below 90 cm the average mobility is higher, at 18% ± 3%. The RAC values (Figure 3b) followed a similar dynamic to those for the MF. From the SMTZ (90 cm depth) towards the surface the values increased regularly, from 2.7% (80 cm) to 9.0% (0 cm), averaging 4.7% ± 2.0%. Below 90 cm, the RAC was more variable, showing slightly higher values (on average 6.1% ± 1.9%). The RAC values in the core were indicative of low risk (<10%). However, the Ni contents (23-45) were similar to or slightly higher than the threshold effect levels (e.g., 7.5 mg kg−1 [58]; 16–40 mg kg−1 [59]; 15.9 mg kg−1 [60]), but below or close to the lower values for the probable effect levels (e.g., 19 mg kg−1 [58]; 36–130 mg kg−1 [59]; 42.8 mg kg−1 [60]).
Both the CF and Igeo indices for Ni were indicative of uncontaminated sediments along the core (Figure 3c,d). The contamination factor average was 1.0 ± 0.1 and the mean Igeo was −0.6 ± 0.2. Although a slight difference can be observed over (CF average 1.0 ± 0.1, and Igeo average 0.6 ± 0.1) and below (CF 1.0 ± 0.2 and Igeo 0.6 ± 0.2) the 90 cm depth, the variations were not significantly different. This lack of evidence of contamination was coherent with the similarity of the values to those in the local (Table 1) and broader references (e.g., 7–38 mgNi kg−1; [62]).
3.5. Zinc
The variations in Zn Tex in the sedimentary column were similar to those of Cu and Pb. Contents averaged 103 ± 23 mg kg−1, being relatively constant below a 30 cm depth (98 ± 12 mg kg−1, RSD = 12%) and increasing towards the surface, from 84 mg kg−1 (30 cm) to 189 mg kg−1 (0 cm). Below 30 cm, the Zn Tex contents were slightly lower than the background values found in the literature, but the top-core contents were well above the references (Table 1). Zinc bound to sulfide (F5) was the most abundant fraction (52 ± 7%), presenting a low variation (RSD = 13%). The organic fractions (F3 + F4) showed 31%±7% of Zn, with similar contents in the weakly (F3, 14% ± 5%) and strongly (F4, 17% ± 5%) bound to organic matter fractions. The labile fractions (F1 and F2) were responsible, in average, for the 18% ± 8% of the Zn content. Both fractions—metals present in an ion-exchangeable form and bound to carbonate (F1, 9% ± 4%) and metals present in the reductive phase bound to manganese-iron oxides (F2, 9% ± 4%)—increased above 30 cm depth, reaching 48% of the Zn content at the core surface (F1, 28%; F2, 20%).
The MF (Figure 3a), average 17%±8%, clearly identified a bottom, nearly constant, low-mobility trend (16% ± 3%) below 30 cm, and a top-core with a higher mobile Zn above 30 cm (26% ± 15%). This is a consequence of the top-core Zn enrichment on the most labile fractions (F1 and F2). The RAC values (Figure 3b) were nearly constant along the core, being on average (9% ± 4%) within the limit for low risk. It reached the medium risk classification above the 20 cm depth (12%), being maximum at the surface (28%), presenting in this point a value below but close to the high risk level. It was also highlightable a bottom-core section (180–210 cm) presenting RAC values (10–13%) which are in the low range of medium risk. Only at the surface, the Tex content (189 mg kg−1) was within or slightly over the threshold effect levels reported in the literature (e.g., 163 mg kg−1 [58]; 80–200 mg kg−1 [59]; 124 mg kg−1 [60]), but the risk seems to be low or irrelevant because the content is well below the probable effect levels (e.g., 305 mg kg−1 [58]; 100-700 mg kg−1 [59]; 271 mg kg−1 [60]).
Below a 30 cm depth, both indices (CF and Igeo) did not show evidence of reliable contamination (Figure 3c,d). Their values were in this major section of the core in the range of uncontaminated (CF30–220cm = 1.0 ± 0.1 and Igeo30–220cm = −0.6 ± 0.2). The contamination indices also increased towards the surface in the uppermost 30 cm, but only on the most superficial layer was a legible contamination observed. The Igeo and CF values (0.4 and 1.9, respectively) at the surface indicated low contamination according to the assumed criteria, and showed that the low contamination at the surface was above the local references (Table 1), and also over those in a world context (e.g., 20–136 mgZn kg−1; [62]).
3.6. Environmental Assessment
The San Simon Bay sediments have a clay-silty texture and high TOC contents (4–15%), resulting from a mixture of terrestrial and marine inputs [37]. The high specific surface and surficial charge of clay minerals together with the organic-rich fine-grained sediments favor the trace metals accumulation [63]. Organic matter and oxides act as principal adsorbents of the trace metals, controlling their mobility and bioavailability [64,65]. The fractionation procedure in this study was useful to evaluate bioavailability and possible risk associated with metals, separated between labile forms (F1 and F2), organic fractions (F3 and F4), and the fraction bound to sulfides (F5).
The order of affinity of metal cations by organic matter (F3 + F4) in the sediments of San Simon Bay was Cu > Cd > Zn > Ni > Pb. These trace metals were bound to strongly bound to the organic matter (Figure 3).
The cluster analysis allowed us to differentiate three behaviors (Figure 4): (1) cadmium, a highly mobile element affected by post-depositional migration being stored below the SMTZ (90 cm depth) and keeping a potential risk in depth sediments if they are dredged or removed; (2) nickel, an stable and conservative element mainly bound to the less mobile fractions (F5 and F4), did not show evidence of important post-depositional migration or legible contamination; (3) copper, Pb. and Zn showed contamination (particularly Pb) in the uppermost core at 30-40 cm. According to the RAC, only Pb presented a high risk in the surface layer.
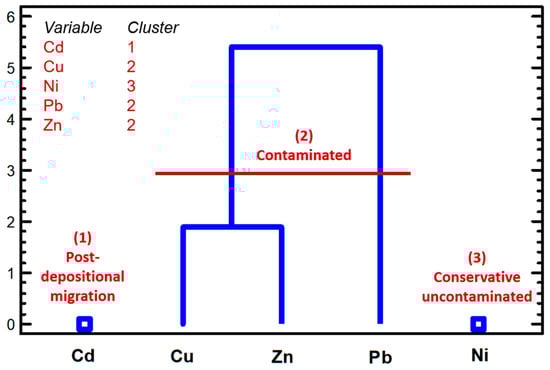
Figure 4.
Cluster analysis (median method, squared Eucliean distance) performed over the total extractable contents for each element in the studied core.
Several authors have pointed to a variety of contamination sources in the area, related to the urbanization phenomenon coupled with industrial development—i.e., local industries [25,28], wastewater outflows [66], harbor-shipyard activities [67], the use of fossil fuels [25,27], the traffic of vehicles [22,68,69], or the use of fertilizers and pesticides in agriculture [27,52]. The anthropogenic enrichment towards the surface was consistent with [27]. These authors found important metal enrichments (particularly Cu and Pb) in sediments deposited after the 1970s attributed to anthropogenic sources. The industrialization started in the area within the end the 19th century in the City of Vigo and its surrounding area (including San Simon Bay) [70], suffering an important increase in the 1960s, being coherent with the global phenomenon of the “Great Acceleration” of the mid-20th century [71,72].
4. Conclusions
The sedimentary column allowed us to estimate the background for Cu, Pb, Ni, and Zn. Cadmium was a particularly difficult element in estimating background values due to its high mobility and participation in post-depositional processes, thus only a rough estimation is provided by previous works. The fractionation procedure allowed us to identify the carriers of risk elements within the sediments—i.e., Cd and Cu were driven by their association with organic matter, Pb was mainly in the most mobile form (ion-exchangeable and bound to carbonates), and Ni and Zn were related to the less mobile fraction (bound to sulfide). The use of the Risk Assessment Code index showed some risk in surface sediments, particularly for Pb. It should be mentioned that contamination risks are actual only within those sediment layers which are easily accessible to bottom fauna—i.e., above the depth of 30 cm. In the deeper layers, as is known, most zoobenthic organisms are not found there. The contamination indices showed contamination above 30-40 cm depth, in increasing order, by Zn, Cu, and Pb. The nickel contamination was negligible, and it was not possible to determine for Cd.
This information is a valuable resource for management issues to be taken into account by decision-makers. San Simon Bay sediments might be considered contaminated in the surface mainly due to anthropogenic inputs, especially in the case of Pb, reflecting the enormous human pressure on these ecosystems. Depth sediments showed a sink for Cd due to diagenetic processes. Both Pb and Cd presented contents and mobility factors that can imply concern due to possible environmental risk.
Author Contributions
A.M.R.-P., Conceptualization, Methodology, Writing—original draft, Writing—review & editing, Investigation, Formal analysis; M.A.Á.-V., Conceptualization, Methodology, Writing—original draft, Writing—review & editing, Investigation. E.D.U.-Á., Conceptualization, Methodology, Writing—review & editing; E.D.B., Conceptualization, Methodology, Writing—review & editing, Investigation, Funding acquisition.
Funding
This work was supported by the Spanish Ministry of Economy and Competitiveness and the European Regional Development Fund under research project CGL2012-33584 and by the Xunta de Galicia under research project GRC2015/020. M.A. Álvarez-Vázquez is supported by the Xunta de Galicia through the postdoctoral grant #ED481B-2019-066.
Conflicts of Interest
The authors declare no conflict of interest.
References
- McLennan, S.M. Relationships between the trace element composition of sedimentary rocks and upper continental crust. Geochem. Geophys. Geosyst. 2001, 2, 2. [Google Scholar] [CrossRef]
- Hu, Z.; Gao, S. Upper crustal abundances of trace elements: A revision and update. Chem. Geol. 2008, 253, 205–221. [Google Scholar] [CrossRef]
- Birch, G.F. Determination of sediment metal background concentrations and enrichment in marine environments—A critical review. Sci. Total Environ. 2017, 580, 813–831. [Google Scholar] [CrossRef]
- Adriano, D.C. Trace Elements in Terrestrial Environments; Springer Science and Business Media LLC: Berlin/Heidelberg, Germany, 2001. [Google Scholar]
- Kabata-Pendias, A. Trace Elements in Soils and Plants; CRC Press: Boca Raton, FL, USA, 2011; p. 548. [Google Scholar]
- Panagos, P.; Van Liedekerke, M.; Yigini, Y.; Montanarella, L. Contaminated Sites in Europe: Review of the Current Situation Based on Data Collected through a European Network. J. Environ. Public Health 2013, 2013, 1–11. [Google Scholar] [CrossRef]
- Vareda, J.P.; Valente, A.J.; Durães, L. Assessment of heavy metal pollution from anthropogenic activities and remediation strategies: A review. J. Environ. Manag. 2019, 246, 101–118. [Google Scholar] [CrossRef] [PubMed]
- Nemati, K.; Abu Bakar, N.K.; Abas, M.R.; Sobhanzadeh, E. Speciation of heavy metals by modified BCR sequential extraction procedure in different depths of sediments from Sungai Buloh, Selangor, Malaysia. J. Hazard. Mater. 2011, 192, 402–410. [Google Scholar] [CrossRef] [PubMed]
- Hamelink, J.L.; Landrum, P.F.; Harold, B.L.; William, B.H. Bioavailability: Physical, Chemical, and Biological Interactions; CRC Press: Boca Raton, FL, USA, 1994. [Google Scholar]
- Voegelin, A.; Barmettler, K.; Kretzschmar, R. Heavy metal release from contaminated soils: Comparison of column leaching and batch extraction results. J. Environ. Qual. 2003, 32, 865–875. [Google Scholar] [CrossRef]
- Fang, T.; Li, X.-D.; Zhang, G. Acid volatile sulfide and simultaneously extracted metals in the sediment cores of the Pearl River Estuary, South China. Ecotoxicol. Environ. Saf. 2005, 61, 420–431. [Google Scholar] [CrossRef]
- Rodgers, K.; McLellan, I.; Peshkur, T.; Williams, R.; Tonner, R.; Knapp, C.W.; Henriquez, F.L.; Hursthouse, A.S. The legacy of industrial pollution in estuarine sediments: Spatial and temporal variability implications for ecosystem stress. Environ. Geochem. Health 2019, 42, 1057–1068. [Google Scholar] [CrossRef]
- Vukovic, D.; Vuković, Ž.; Stanković, S. The impact of the Danube Iron Gate Dam on heavy metal storage and sediment flux within the reservoir. Catena 2014, 113, 18–23. [Google Scholar] [CrossRef]
- Zhong, A.-P.; Guo, S.; Li, F.-M.; Li, G.; Jiang, K.-X. Impact of anions on the heavy metals release from marine sediments. J. Environ. Sci. 2006, 18, 1216–1220. [Google Scholar] [CrossRef]
- Birch, G.; Gunns, T.; Olmos, M. Sediment-bound metals as indicators of anthropogenic change in estuarine environments. Mar. Pollut. Bull. 2015, 101, 243–257. [Google Scholar] [CrossRef] [PubMed]
- De Groot, A.J.; Salomons, W.; Allersma, E. Processes affecting heavy metals in estuarine sediments. Estuar. Chem. 1976, 131–157. [Google Scholar]
- Fang, G.-C.; Yang, H.-C. Comparison of heavy metals in marine sediments from coast areas in East and Southeast Asian countries during the years 2000–2010. Toxicol. Ind. Health 2011, 27, 754–759. [Google Scholar] [CrossRef]
- Rubio, B.; Gago, L.; Vilas, F.; Nombela, M.A.; García-Gil, S.; Alejo, I.; Pazos, O. Interpretación de tendencias históricas de contaminación por metales pesados en testigos de sedimentos de la Ría de Pontevedra. Thalassas 1996, 12, 137–152. [Google Scholar]
- Valette-Silver, N.J. The Use of Sediment Cores to Reconstruct Historical Trends in Contamination of Estuarine and Coastal Sediments. Estuaries 1993, 16, 577–588. [Google Scholar] [CrossRef]
- Carballeira, A.; Carral, E.; Puente, X.; Villares, R. Regional-scale monitoring of coastal contamination. Nutrients and heavy metals in estuarine sediments and organisms on the coast of Galicia (northwest Spain). Int. J. Environ. Pollut. 2000, 13, 534. [Google Scholar] [CrossRef]
- Belzunce Segarra, M.J.; Prego, R.; Wilson, M.J.; Bacon, J.; Santos-Echeandía, J. Metal speciation in surface sediments of the Vigo Ria (NW Iberian Peninsula). Sci. Mar. 2008, 72, 119–126. [Google Scholar]
- Marcet, P. Contribucion al Estudio de la Contaminacion de la ria de Vigo. Contenido y Distribucion de Nutrientes y Metales Pesados en Sedimentos Someros; Universidad de Vigo: Vigo, Spain, 1994. [Google Scholar]
- Nombela, M.A.; Vilas, F.; Evans, G. Sedimentation in the Mesotidal Rías Bajas of Galicia (North-Western Spain): Ensenada De San Simón, Inner Ría De Vigo. Tidal Signat. Mod. Anc. Sediments 2009, 133–149. [Google Scholar] [CrossRef]
- Rubio, B.; Nombela, M.A.; Vilas, F. Geochemistry of Major and Trace Elements in Sediments of the Ria de Vigo (NW Spain): An Assessment of Metal Pollution. Mar. Pollut. Bull. 2000, 40, 968–980. [Google Scholar] [CrossRef]
- Alvarez-Iglesias, P.; Rubio, B.; Vilas, F. Pollution in intertidal sediments of San Simón Bay (Inner Ria de Vigo, NW of Spain): Total heavy metal concentrations and speciation. Mar. Pollut. Bull. 2003, 46, 491–503. [Google Scholar] [CrossRef]
- Villares, R.; Puente, X.; Carballeira, A. Heavy Metals in Sandy Sediments of the Rías Baixas (NW Spain). Environ. Monit. Assess. 2003, 83, 129–144. [Google Scholar] [CrossRef] [PubMed]
- Alvarez-Iglesias, P.; Quintana, B.; Rubio, B.; Pérez-Arlucea, M. Sedimentation rates and trace metal input history in intertidal sediments from San Simón Bay (Ría de Vigo, NW Spain) derived from 210Pb and 137Cs chronology. J. Environ. Radioact. 2007, 98, 229–250. [Google Scholar] [CrossRef] [PubMed]
- Álvarez-Iglesias, P.; Rubio, B. Trace Metals in Shallow Marine Sediments from the Ría de Vigo: Sources, Pollution, Speciation and Early Diagenesis. Geochem. Earth’s Syst. Process. 2012, 185–210. [Google Scholar] [CrossRef]
- Rubio, B.; Alvarez-Iglesias, P.; Vilas, F. Diagenesis and anthropogenesis of metals in the recent Holocene sedimentary record of the Ría de Vigo (NW Spain). Mar. Pollut. Bull. 2010, 60, 1122–1129. [Google Scholar] [CrossRef]
- Evans, G.; Prego, R. Rias, estuaries and incised valleys: Is a ria an estuary? Mar. Geol. 2003, 196, 171–175. [Google Scholar] [CrossRef]
- Fraga, F. Fotosíntesis en la Ría de Vigo. Invst. Pesq. 1976, 40, 151–167. [Google Scholar]
- Vilas, F.; Nombela, M.A.; García-Gil, E.; García-Gil, S.; Alejo, I.; Rubio, B.; Pazos, O. Cartografía de sedimentos submarinos, Ría de Pontevedra. E: 1:50000; Xunta de Galicia: Sandtiago de Compostela, Spain, 1996.
- García-Gil, S.; De Blas, E.; Martínez-Carreño, N.; Iglesias, J.; Rial-Otero, R.; Simal-Gandara, J.; Judd, A. Characterisation and preliminary quantification of the methane reservoir in a coastal sedimentary source: San Simón Bay, Ría de Vigo, NW Spain. Estuarine Coast. Shelf Sci. 2011, 91, 232–242. [Google Scholar] [CrossRef]
- Hedges, J.I.; Keil, R.G. Sedimentary organic matter preservation: An assessment and speculative synthesis. Mar. Chem. 1995, 49, 81–115. [Google Scholar] [CrossRef]
- Ramírez-Pérez, A.; De Blas, E.; García-Gil, S. Redox processes in pore water of anoxic sediments with shallow gas. Sci. Total. Environ. 2015, 538, 317–326. [Google Scholar] [CrossRef]
- Martínez-Carreño, N.; García-Gil, S. The Holocene gas system of the Ría de Vigo (NW Spain): Factors controlling the location of gas accumulations, seeps and pockmarks. Mar. Geol. 2013, 344, 82–100. [Google Scholar] [CrossRef]
- Ramírez-Pérez, A.; De Blas, E.; García-Gil, S. Sulfur, Iron, and Manganese Speciation in Anoxic Sediments with Methane (Ría de Vigo, NW Spain). CLEAN Soil Air Water 2017, 45, 1600700. [Google Scholar] [CrossRef]
- Campanella, L.; D’Orazio, D.; Petronio, B.; Pietrantonio, E. Proposal for a metal speciation study in sediments. Anal. Chim. Acta 1995, 309, 387–393. [Google Scholar] [CrossRef]
- Pagnanelli, F.; Moscardini, E.; Giuliano, V.; Toro, L. Sequential extraction of heavy metals in river sediments of an abandoned pyrite mining area: Pollution detection and affinity series. Environ. Pollut. 2004, 132, 189–201. [Google Scholar] [CrossRef]
- Kabala, C.; Singh, B.R. Fractionation and Mobility of Copper, Lead, and Zinc in Soil Profiles in the Vicinity of a Copper Smelter. J. Environ. Qual. 2001, 30, 485–492. [Google Scholar] [CrossRef]
- Håkanson, L. An ecological risk index for aquatic pollution control.a sedimentological approach. Water Res. 1980, 14, 975–1001. [Google Scholar] [CrossRef]
- Muller, G. Index of Geoaccumulation in sediments of the Rhine River. Geo J. 1969, 2, 108–118. [Google Scholar]
- Mil-Homens, M.; Vale, C.; Naughton, F.; Brito, P.; Drago, T.; Anes, B.; Raimundo, J.; Schmidt, S.; Caetano, M. Footprint of roman and modern mining activities in a sediment core from the southwestern Iberian Atlantic shelf. Sci. Total. Environ. 2016, 571, 1211–1221. [Google Scholar] [CrossRef]
- Álvarez-Vázquez, M.A.; Bendicho, C.; Prego, R. Ultrasonic slurry sampling combined with total reflection X-ray spectrometry for multi-elemental analysis of coastal sediments in a ria system. Microchem. J. 2014, 112, 172–180. [Google Scholar] [CrossRef][Green Version]
- Birch, G.; Chang, C.-H.; Lee, J.-H.; Churchill, L. The use of vintage surficial sediment data and sedimentary cores to determine past and future trends in estuarine metal contamination (Sydney estuary, Australia). Sci. Total Environ. 2013, 454, 542–561. [Google Scholar] [CrossRef]
- Rubio, B.; Nombela, M.A.; Vilas, F. La contaminación por metales pesados en las Rías Baixas gallegas: Nuevos valores de fondo para la Ría de Vigo (NO de España). J. Iber. Geol. 2000, 26, 121–149. [Google Scholar]
- Álvarez-Vázquez, M.A.; Caetano, M.; Alvarez-Iglesias, P.; Pedrosa-García, M.D.C.; Calvo, S.; De Uña-Álvarez, E.; Quintana, B.; Vale, C.; Prego, R. Natural and Anthropocene fluxes of trace elements in estuarine sediments of Galician Rias. Estuarine Coast. Shelf Sci. 2017, 198, 329–342. [Google Scholar] [CrossRef]
- Perin, G.; Craboledda, L.; Lucchese, M.; Cirillo, R.; Dotta, L.; Zanette, M.L.; Orio, A.A. Heavy metal speciation in the sediments of northern Adriatic Sea. A new approach for environmental toxicity determination. Heavy Metals Environ. 1985, 2, 454–456. [Google Scholar]
- Martínez-Carreño, N.; García-Gil, S. Reinterpretation of the Quaternary sedimentary infill of the Ría de Vigo, NW Iberian Peninsula, as a compound incised valley. Quat. Sci. Rev. 2017, 173, 124–144. [Google Scholar] [CrossRef]
- Barreiro, R. Estudio de metales pesados en medio y organismos de un ecosistema de ría (Pontedeume, A Coruña). Ph.D. Thesis, Universidade de Santiago de Compostela, Santiago de Compostela, Spain, 1991; p. 227. [Google Scholar]
- Carral, E.; Puente, X.; Villares, R.; Carballeira, A. Background heavy metal levels in estuarine sediments and organisms in Galicia (northwest Spain) as determined by modal analysis. Sci. Total Environ. 1995, 172, 175–188. [Google Scholar] [CrossRef]
- Álvarez-Iglesias, P.; Rubio, B.; Pérez-Arlucea, M. Reliability of subtidal sediments as “geochemical recorders” of pollution input: San Simón Bay (Ría de Vigo, NW Spain). Estuarine Coast. Shelf Sci. 2006, 70, 507–521. [Google Scholar] [CrossRef]
- Davies-Colley, R.J.; Nelson, P.O.; Williamson, K.J. Sulfide control of cadmium and copper concentrations in anaerobic estuarine sediments. Mar. Chem. 1985, 16, 173–186. [Google Scholar] [CrossRef]
- Barciela-Alonso, M.C.; Pazos-Capeáns, P.; Regueira-Miguens, M.E.; Bermejo-Barrera, A.; Bermejo-Barrera, P. Study of cadmium, lead and tin distribution in surface marine sediment samples from Ria de Arousa (NW of Spain). Anal. Chim. Acta 2004, 524, 115–120. [Google Scholar] [CrossRef]
- Prego, R.; Segarra, M.J.B.; Helios-Rybicka, E.; Barciela, M.C. Cadmium, manganese, nickel and lead contents in surface sediments of the lower Ulla River and its estuary (northwest Spain). Bol. Inst. Esp. Oceanogr. 1999, 15, 495–500. [Google Scholar]
- Howarth, R.J.; Evans, G.; Croudace, I.W.; Cundy, A.B. Sources and timing of anthropogenic pollution in the Ensenada de San Simón (inner Ría de Vigo), Galicia, NW Spain: An application of mixture-modelling and nonlinear optimization to recent sedimentation. Sci. Total. Environ. 2005, 340, 149–176. [Google Scholar] [CrossRef]
- Macías, F.; Calvo de Anta, R. Niveles Genéricos de Referencia de Metales Pesados y Otros Elementos Traza en Suelos de Galicia; Consellería de Medio Ambiente e Desenvolvemento Sostible: Santiago de Compostela, Spain, 2008.
- De Deckere, E.; De Cooman, W.; Leloup, V.; Meire, P.; Schmitt, C.; Von Der Ohe, P.C. Development of sediment quality guidelines for freshwater ecosystems. J. Soils Sediments 2011, 11, 504–517. [Google Scholar] [CrossRef]
- Burton, G.A. Sediment quality criteria in use around the world. J. Limnol. 2002, 3, 65–76. [Google Scholar] [CrossRef]
- Macdonald, D.D.; Carr, R.S.; Calder, F.D.; Long, E.R.; Ingersoll, C.G. Development and evaluation of sediment quality guidelines for Florida coastal waters. Ecotoxicology 1996, 5, 253–278. [Google Scholar] [CrossRef] [PubMed]
- Rudnick, R.; Gao, S. Composition of the Continental Crust. In Treatise on Geochemistry; Elsevier: Amsterdam, The Netherlands, 2003; Volume 3. [Google Scholar]
- Prego, R.; Cobelo-Garcı́a, A. Twentieth century overview of heavy metals in the Galician Rias (NW Iberian Peninsula). Environ. Pollut. 2003, 121, 425–452. [Google Scholar] [CrossRef]
- Horowitz, A.J.; Elrick, K.A. The relation of stream sediment surface area, grain size and composition to trace element chemistry. Appl. Geochem. 1987, 2, 437–451. [Google Scholar] [CrossRef]
- Ajala, L.O.; Onwukeme, V.I.; Mgbemena, M.N. Speciation of Some Trace Metals in Floodplain Soil of Eke-Mgbom, Afikpo, Nigeria. Am. Chem. Sci. J. 2014, 4, 963–974. [Google Scholar] [CrossRef]
- McBride, M.B. Toxic Metal Accumulation from Agricultural Use of Sludge: Are USEPA Regulations Protective? J. Environ. Qual. 1995, 24, 5–18. [Google Scholar] [CrossRef]
- Filgueiras, A.V.; Prego, R. Biogeochemical fluxes of iron from rainwater, rivers and sewage to a Galician Ria (NW Iberian Peninsula). Natural versus anthropogenic contributions. Biogeochemistry 2007, 86, 319–329. [Google Scholar] [CrossRef]
- Prego, R.; Filgueiras, A.V.; Santos-Echeandía, J. Temporal and spatial changes of total and labile metal concentration in the surface sediments of the Vigo Ria (NW Iberian Peninsula): Influence of anthropogenic sources. Mar. Pollut. Bull. 2008, 56, 1031–1042. [Google Scholar] [CrossRef]
- Belzunce-Segarra, M.J.; Bacon, J.R.; Prego, R.; Wilson, M.J. Chemical forms of heavy metals in surface sediments of the san Simón inlet, Ría de vigo, galicia. J. Environ. Sci. Heal. Part A 1997, 32, 1271–1292. [Google Scholar] [CrossRef]
- Evans, G.; Howarth, R.J.; Nombela, M.A. Metals in the sediments of Ensenada de San Simón (inner Ría de Vigo), Galicia, NW Spain. Appl. Geochem. 2003, 18, 973–996. [Google Scholar] [CrossRef]
- González-Pérez, J.M.; Pérez González, A. Demographic dynamics and urban planning in Vigo since 1960. The impact of industrialization. Anal. Geogr. Univ. Complut. 2003, 23, 163–185. [Google Scholar]
- Steffen, W.; Crutzen, P.J.; McNeill, J.R. The Anthropocene: Are Humans Now Overwhelming the Great Forces of Nature. Ambio 2007, 36, 614–621. [Google Scholar] [CrossRef]
- Steffen, W.; Grinevald, J.; Crutzen, P.; McNeill, J. The Anthropocene: Conceptual and historical perspectives. Philos. Trans. R. Soc. A Math. Phys. Eng. Sci. 2011, 369, 842–867. [Google Scholar] [CrossRef] [PubMed]
© 2020 by the authors. Licensee MDPI, Basel, Switzerland. This article is an open access article distributed under the terms and conditions of the Creative Commons Attribution (CC BY) license (http://creativecommons.org/licenses/by/4.0/).