Abstract
Previous studies suggested that, generally, the climate of early Mars would have been semi-arid when the surface temperatures were above freezing. On early Mars, closed-basin lakes would have been created; however, the hydrogeochemical cycles of the lake systems are poorly constrained. Here we report results of our field surveys to terrestrial analogs of closed-basin lake systems that developed in cold and semi-arid climates: The Valley of the Gobi Lakes of Mongolia. Our results show that groundwater plays a central role not only in hydrology, but also in geochemical cycles in the lake systems. We find that groundwater predominantly flows into the lakes through local seepage and regional flows in semi-arid climates. Through the interactions with calcite-containing soils, local groundwater seepage provides Ca2+ and HCO3− to the lakes. In the wetland located in between the lakes, high-salinity shallow pools would provide Cl− and Na+ to the groundwater through infiltration. If similar processes occurred on early Mars, local seepage of groundwater would have provided magnesium and alkalinity to the early Jezero lakes, possibly leading to authigenic precipitation of lacustrine carbonates. On early Mars, infiltration of surface brine may have transported salts and oxidants on the surface to lakes via regional groundwater flows. We suggest that inflows of multiple types of groundwater in semi-arid climates could have caused redox disequilibria in closed-basin lakes on early Mars.
1. Introduction
Early Mars is thought to have been warmer and wetter than today, evidenced by the widespread presence of valley networks, deltas, lake deposits, clay minerals, and evaporates on the surface across Noachian to early Hesperian crust (3.8–3.5 billion years ago (Ga)) (e.g., see a review by [1]). Formation models of valley networks, closed-basin lakes, and lake deposits on early Mars suggest (cold and) semi-arid climates at places when the surface temperatures were above the freezing point of liquid water, e.g., [2,3,4,5,6,7,8,9,10,11]. However, hydrogeochemical cycles that occurred in the semi-arid climates on early Mars remain poorly constrained. Although valley networks, deltas, and lake deposits seen on Mars from orbit would serve as records of transport and evaporation of surface water, groundwater hydrogeochemistry and interactions with surface water in general cannot be constrained only from the geomorphological features.
Chemical and mineralogical compositions of evaporite deposits found within lake deposits on Mars can provide information on the hydrogeochemistry of paleolakes, which would have been controlled not only by inlet rivers, but also by interactions with groundwater if subsurface aquifers connected to the lakes. Chloride deposits are often found near crater floors and feeder valleys on late Noachian to Hesperian deposits, suggesting evaporation of water in lacustrine environments, e.g., [8,12,13,14]. Theoretical studies suggest the possibility that chlorides in paleolakes would have been provided through inflow of groundwater that interacted with subsurface rocks [8]; however, an alternative possibility of accumulation of pre-existing salt deposits to paleolakes via near-surface water flows cannot be ruled out [8]. Chloride and sulfate salts have been also found in lacustrine sediments of Gale Crater [15,16]. Although their occurrences indicate evaporative concentrations of early Gale lakes [16], the sources of dissolved species in the lake water remain uncertain. Did groundwater inflow to lakes in semi-arid climates on early Mars? If so, what types of dissolved species were supplied to lakes? Could surface brine infiltrate the subsurface? These questions remain unsolved due to the difficulty of regional-scale, geochemical investigations on Mars.
In this regard, regional-scale investigations of terrestrial analogs of saline lakes may provide insights into hydrogeochemical cycles in lacustrine environments on early Mars. The previous studies on terrestrial analogs have investigated geochemical and geological processes that may have occurred on early Mars, including hematite concretions at desert sites, e.g., [17,18], impact crater lake, e.g., [19], hydrothermal silica deposits, e.g., [20], and hydrological systems at polar sites, e.g., [21]. Nevertheless, only a few studies have investigated saline lacustrine environments that developed in cold and (semi-)arid climates as terrestrial analogues for early Martian lakes, such as cold springs on Axel Heiberg Island in the polar zone [22], saline lakes on the Qaidam Basin in the arid climate zone [23], and salt lakes in the Atacama-Andes regions [24]. In especially, few studies have investigated subsurface hydrogeochemical cycles and roles of groundwater.
Here, we perform field surveys for three closed-basin lakes (the Böön Tsagaan, Orog, and Olgoy lakes) in the Khangai and Gobi-Altai mountains transition zone, called the Valley of the Gobi Lakes, in central Mongolia (Figure 1). This region is unique on Earth because the subarctic climate area is directly in contact with the steppe semi-arid climate area (Figure 1). The Valley of the Gobi Lakes lies on the boundary between permafrost range (i.e., the Khangai mountains) and arid deserts (i.e., Gobi Desert) in central Asia (Figure 1). The Valley of the Gobi Lakes is cold and semi-arid, where the annual averaged temperature is about 1 °C and evaporation predominates over precipitation [25,26]. The water source of the Valley of the Gobi Lakes relies largely on snow melting and permafrost degradation of the Khangai mountains [26,27]. A large part of the Valley of the Gobi Lakes may have once been covered by a larger lake in more humid climates in the past [28]. In a cold and semi-arid scenario of early Mars, melting of snow/ground ice in low-latitude highlands is suggested to have provided liquid water to low-latitude lowlands, forming valley networks and paleolakes [29,30,31]. The characteristics of the climate and hydrology of the Valley of the Gobi Lakes allow this area to be a promising terrestrial analog for lake systems that developed in semi-arid climates on early Mars. Nevertheless, there are only a few hydrogeochemical studies of the lake systems in this area, e.g., [26,27]. In particular, there are no previous studies focusing on groundwater hydrogeochemistry.
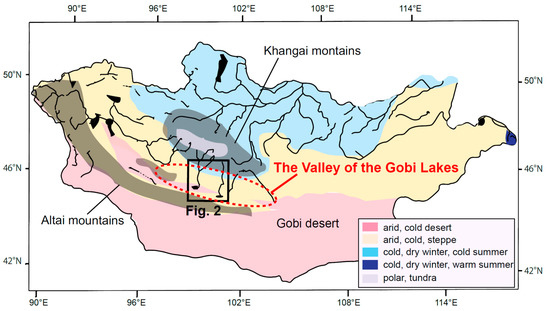
Figure 1.
A geographical map of Mongolia and the locations of the Valley of the Gobi Lakes (the red ellipse with dotted line), based on [28]. The research area in the present study is outlined by the black square. A satellite image of this targeted area is shown in Figure 2 below. Major rivers (the bold curves) and lakes (the black areas) are also shown. Mountain ranges (the Khangai and Altai mountains) are also represented as shadows. Based on [32], a simplified map of Köppen–Geiger climate classification zones is superposed on the geographical map.
In the field survey we measured water chemistry of the lakes, rivers, springs, and wells to understand the hydrogeochemical cycles that support the lacustrine systems. Based on the results, we discuss the implications for the hydrogeochemical cycles of closed-basin lake systems that developed in semi-arid climates on early Mars.
2. Geohydrological Setting
The study area is the Valley of the Gobi Lakes in central Mongolia (Figure 1). The Valley of the Gobi Lakes exists in a latitudinally oriented depression of tectonic origin, lying in between the Khangai and Altai Gobi mountains (Figure 1). Two major lakes—the Böön Tsagaan lake and the Orog lake—are located in the middle of the Valley of the Gobi Lakes (Figure 1). The elevations from sea level of the Böön Tsagaan and Orog lakes are ~1305 m and ~1220 m, respectively [25]. The Böön Tsagaan and Orog lakes are fed by the inlet rivers of the Baidrag and Tuin rivers, respectively, whereas there are currently no outlet rivers from the lakes (Figure 2). Both of the Baidrag and Tuin rivers originate in the Khangai mountains (Figure 1). The Khangai mountains reach above 3000 m in elevation and contain continuous and discontinuous permafrost [26]. These rivers continue through proluvial regions of dry steppe and end in the Böön Tsagaan and Orog lakes in the semi-arid climate zone. The present-day lake surface areas are ~250 km2 for Böön Tsagaan lake and ~140 km2 for Orog lake, with the maximum depths of 10 m and 3 m, respectively [26]. The catchment areas of the Böön Tsagaan–Baidrag and Orog-Tuin systems are ~45,000 km2 and ~14,900 km2, respectively [26]. In the catchment areas near the Khangai mountains, there are a number of small closed-basin lakes, including the Olgoy lake, at topographic lows in association with melting of sporadic ground ice and snow (Figure 2). The Olgoy lake is likely an oxbow lake of the nearby Sumber river, which is a tributary of the Baidrag river. There are currently no inlet and outlet rivers of Olgoy lake. There are also small depressions within the valley, which may have been lakebeds in the past [28]. These small depressions include the Tsagaan Nuur wetland (Figure 2), where lacustrine sediments and shallow pools are present. The Tsagaan Nuur wetland belongs to the catchment area of the Böön Tsagaan lake [26].
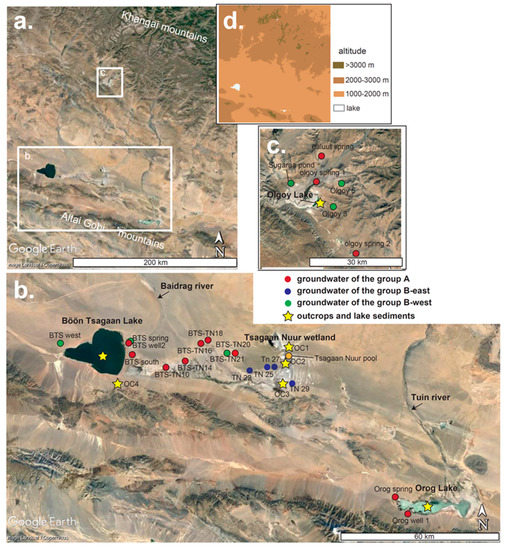
Figure 2.
Locations of the sampling points of wells, springs, and outcrops are shown on a satellite image taken from Google Earth. (a) A satellite image of our research area. (b) The locations of the sampling points around the Böön Tsagaan and Orog lakes. The altitudes of BTS-TN 10, 14, 16, and 18 are higher than those of the Böön Tsagaan lake and Tsagaan Nuur wetland (Table 1), being a topographic barrier. (c) The locations of the sampling points around the Olgoy lake. The colors of the sampling locations of groundwater represent the types of water chemistry (see the annotation in the figure and Section 4.1 below). More detailed information on the locations are summarized in Table 1. (d) A simplified topographic map of our research area, corresponding to the area shown in the panel (a). The original data were derived from GSI Maps of Geospatial Information Authority of Japan.
The Khangai mountains consist mainly of Precambrian and Paleozoic sedimentary rocks and Mesozoic granitic intrusions, whereas the Altai Gobi mountains is formed by transpressional Cainozoic movements of Paleozoic volcanic and sedimentary rocks [33]. Major faults exist along with the Khangai and Altai Gobi mountains, intersecting the Baidrag and Tuin rivers [33]. The Valley of the Gobi Lakes is an elongated inter-montane depression between the Siberian craton and the Tarim craton [33]. The basins of the Valley of the Gobi Lakes are filled with Quaterary alluvial fans, lacustrine sediments, and aeolian deposits [28,33]. The alluvial, lacustrine, and aeolian deposits are poorly cemented. The thickness of the alluvial, lacustrine, and aeolian deposits can reach 20–40 m or greater in the Valley of the Gobi Lakes, capable of storing groundwater in the subsurface.
The mean annual precipitation of the Valley of the Gobi Lakes is 50–100 mm. In the last thirty years, the mean annual air temperature in this area has increased by 1–2 °C upon global warming, enhancing melting of permafrost in the mountain areas [28]. Although the annual mean temperature of this area is around 1 °C, there are significant regional differences. For instance, the annual mean temperature around the Olgoy lake is 4–5 °C lower than that of the Orog and Böön Tsagaan lakes. Precipitation usually occurs predominantly from July to September with a mean precipitation of 10–50 mm/month, whereas the other seasons are cold and arid with precipitation less than 5 mm/month. The aridity index (the ratio of precipitation to potential evaporation) is estimated to be 0.2–0.3 in the Valley of the Gobi Lakes [25]. The precipitation in the Valley of the Gobi Lakes is insufficient to support the water volumes of both of the Böön Tsagaan and Orog lakes [26], suggesting the importance of melting snow and permafrost in the Khangai mountains supporting the lake systems with a water supply [27]. The mean precipitation around the Olgoy lake area near the mountains (~200 mm/year) is higher than that of the Orog and Böön Tsagaan lakes. The surface area of the Böön Tsagaan lake has been on monotonic decrease over the last twenty years based on remote sensing data, whereas the Orog lake has dried up a few times in the last 40 years [26]. This may have happened due to a combination of several factors, including changes in precipitation and a recent increase in evaporation [26].
3. Materials and Methods
3.1. Geological Survey and Sampling
We performed geological surveys for the Valley of the Gobi Lakes and its catchment areas in October 2017 (the beginning of a dry season) and August 2018 (the middle of a rainy season). Water samples were collected from the Böön Tsagaan, Orog, and Olgoy lakes as well as surrounding wells and springs. Sediment samples were also collected from the lake floors and the surrounding areas of the Valley of the Gobi Lakes (see below).
Water samples: Water samples were taken from the Böön Tsagaan, Orog, and Olgoy lakes and the Baidrag, Tuin, and Sumber rivers, 19 wells, and 2 springs surrounding the lakes (Figure 2 and Table 1). Water samples from wells and springs are generally believed to represent local groundwater chemistry. In the 2018 rainy season survey, we collected a water sample from a shallow pool in the Tsagaan Nuur wetland. Dissolved O2 (DO) levels, electric conductivity (EC), oxidation-reduction potential (ORP), pH, alkalinity, and temperature of water samples were measured on site (see below for the measurements). For the chemical analysis of dissolved species, the collected water samples were stored in two pre-cleaned plastic bottles with volumes of 100 mL after filtering with a 0.45-μm membrane (see below for the chemical analysis). We also measured the water levels at wells at the timing of sampling in 2017 (Table 1).

Table 1.
Types, names, locations, and altitudes of water table of the sampling sites.
Sediment samples: We collected sediment samples in the area around the Böön Tsagaan lake and Tsagaan Nuur wetland (Figure 2). Four samples (OC 1–4) were collected from outcrops around the Böön Tsagaan lake (Figure 2). Present-day lacustrine sediment samples were collected from the Böön Tsagaan lake in 2016, from the Orog lake in 2015, and from the Olgoy lake in 2019 in our previous surveys. The pictures of the outcrops are summarized in Supplementary Figure S1.
The samples of OC 1–3 were collected from the locations near proposed paleo-shorelines of larger lakes in more humid climates in the past [28]. The altitudes of OC 1–3 were close to each other (~1280 to 1290 m above sea level), suggesting that they were deposited at almost the same horizon. At the outcrops, poorly cemented laminated sandy sediments were commonly observed (Supplementary Figure S1), supporting the hypothesis that their formation was due to past water activities. Given the presence of conglomerate layers within the sandy sediments (Supplementary Figure S1), these sediments may be flood plain deposits formed by repeated floods in the past. The sample of OC 4 was collected from a higher altitude location (1325 m for OC 4 above sea level). The presence of laminated sandy sediments in the outcrop of OC 4 suggests that the water levels of larger paleolakes may have reached a minimum of this altitude (~1325 m) in the past. In the outcrop of OC 4, we sometimes find carbonate concretions 0.1–1 cm in diameter in the subsurface soils (Supplementary Figure S1). We collected ~10 to 50 g of sediment samples from these outcrops.
The lacustrine sediment samples within the Böön Tsagaan and Orog lakes were taken using a gravity core sampler. The gravity core sampler—with an inner tube 1 m in length and 60 mm in diameter—was thrown into the lakes from a boat and it then penetrated the unsolidified sediments. The lacustrine sediment samples used in the present study were located at a depth 10 cm from the lake floor. During winter, the surface of Olgoy lake is covered with thick ice. We collected the lacustrine sediment sample from the bottom of the frozen lake by drilling through the surface ice in February 2019. All of the lacustrine sediments were freeze-dried in a laboratory after collection.
3.2. Chemical and Mineralogical Analyses
Water chemistry: For the on-site DO measurements of the water samples, we employed a DO meter (DO-3IP; TOA-DKK Corp. Milton, Cambridge, UK). We used a portable electrical pH meter with electrodes (WM-32EP; TOA-DKK Corp.) for the EC, pH, ORP, and temperature measurements on site. Prior to the measurements, the pH electrode was calibrated with pH buffer solutions at pH 4.01, 6.86, and 9.18. After filtering using a 0.45-μm membrane, total alkalinity was also measured on site for the water samples through titration using sulfuric acid (H2SO4) solutions.
We collected two bottles of the water samples at each sampling site. One was used for the measurements of dissolved total Na, K, Ca, and Mg. Ultra-pure nitric acid (HNO3) was added to this bottle so that the HNO3 concentration in the water sample became 0.6%. The water sample in the other bottle was left for the measurements of dissolved Cl− and SO42−. These major dissolved species in the water samples were measured using an inductively coupled plasma optical emission spectrometer (ICP-OES) (ES-710; Varian Inc. Palo Alto, CA, USA).
To calculate the species concentrations (speciation) and the saturation index of some secondary minerals (e.g., calcite and gypsum) in the water samples, a chemical equilibrium calculation code of the REACT program in Geochemist’s Workbench [34] was employed. In the present study, we evaluated whether evaporation of the inlet river water and groundwaters can reproduce the compositions of lake waters (see Section 5.1 below). To this end, the REACT program in Geochemist’s Workbench was also run to calculate the evaporative concentrations of dissolved species and consequent precipitation of secondary minerals by progressively removing pure water abundance from the measured river water and groundwaters at temperature of 20 °C. In the calculations of evaporative concentrations, we did not take into account any removal of Na+ and K+. In reality, these cations could be removed from lake water through adsorption onto clay minerals.
Mineralogical composition and grain size distribution: To obtain the mineralogical compositions of the sediment samples, X-ray diffraction (XRD) spectra were obtained for the dried sediment samples with an X-ray diffractometer (X’PERT-PRO; PANalytical, Malvern, UK). Prior to the XRD analysis, ~0.5 g of the sediment samples was pounded in an agate mortar. The scan range is 3.011°–64.993° in 2θ. The generator voltage is 45 V. The scan step is 0.0167°.
In addition to the XRD analysis, we performed grain-size analysis for the sediment samples using a He-Ne laser-diffraction-scattering grain size analyzer (SALD2200J; SHIMADZU Corp. Kyoto, Japan). Approximately 0.05 g of the sediment samples were first dispersed with an ultrasonic wave in 50 mL of sodium hexametaphosphate solutions for 5 min. The solutions with the sediment samples were then emptied into the analyzer with ~20 mL of sodium hexametaphosphate solution. The concentrations of the mixed solutions were adjusted to obtain a sufficient laser transmission level around 40–60%. The sediments in the solutions were dispersed with an ultra-sonic wave in a transport circuit accompanying the analyzer. The grain-size distributions were obtained for a diameter range between 0.03 and 1000 μm.
4. Results
4.1. Water Chemistry of Lakes, Rivers, and Groundwater
Table 2 and Table 3 summarize pH, DO, ORP, alkalinity, EC, and the compositions of major elements of collected water from lakes, rivers, springs, and wells. The hexa-diagrams and piper diagrams of water chemistry in meq/kg are also shown in Figure 3 and Figure 4, respectively. The lake waters exhibit different water chemistry to the rivers, springs, and wells (Table 2 and Table 3). The lake waters are all alkaline (pH 9–9.5) and hyposaline (salinity 30–200 mmol/kg); meanwhile, those of the rivers, springs, and wells are circumneutral (pH 6.4–8.1) and low salinity (Table 2 and Table 3). The lake waters are categorized as a Na-Cl type for Böön Tsagaan lake, which means that the major cation and anion are Na+ and Cl−, respectively (Table 2 and Table 3, and Figure 3). The waters of the Olgoy and Orog lakes are categorized as a Na-HCO3 type (Table 2 and Table 3, and Figure 3), although the Cl− and Mg2+ concentrations are significant for the Orog and Olgoy lakes, respectively. The high Na+ (and Cl−) concentrations and alkaline pH are most likely a result of evaporation of the lake waters, leading to accumulation of conservative ions of Na+ (and Cl−) within the lakes. The high HCO3− concentrations in the three lakes are achieved by effective dissolution of atmospheric CO2 into alkaline lake water. Compared with the rivers, springs, and wells, the relative concentrations of Ca2+ are low in the lakes because it is removed as precipitates of carbonate minerals (calcium carbonates) within the lakes (see below).
Table 2.
Data for the survey in the summer of 2018. Temperature (°C), pH, oxidation-reduction potential (ORP) (mV), dissolved oxygen (DO) (mg/L), electric conductivity (EC) (mS/m), alkalinity (meq/L), concentrations of each species (ppm), electric charge imbalance (E.B.), solution types, calculated saturation indexes (SI) of calcite, monohydrocalcite (MHC), amorphous magnesium carbonate (AMC), and gypsum.
Table 3.
Data for the survey in the fall of 2017. Temperature (°C), pH, oxidation−reduction potential (ORP) (mV), dissolved oxygen (DO) (mg/L), electric conductivity (EC) (mS/m), alkalinity (meq/L), concentrations of each species (ppm), electric charge imbalance (E.B.), solution types, calculated saturation indexes (SI) of calcite, monohydrocalcite (MHC), amorphous magnesium carbonate (AMC), and gypsum.
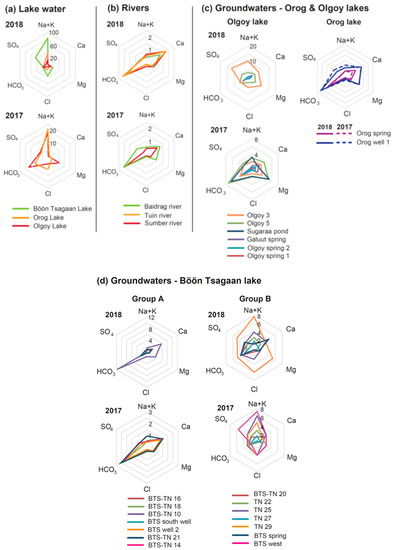
Figure 3.
Hexa−diagrams for the measured water chemistry (in meq/kg) of (a) lake water, (b) river waters, (c) groundwaters around the Orog and Olgoy lakes, and (d) groundwaters around Böön Tsagaan lake. The original data are summarized in Table 2 and Table 3. The concentrations (ppm) of each element in Table 2 and Table 3 were converted to meq/kg.
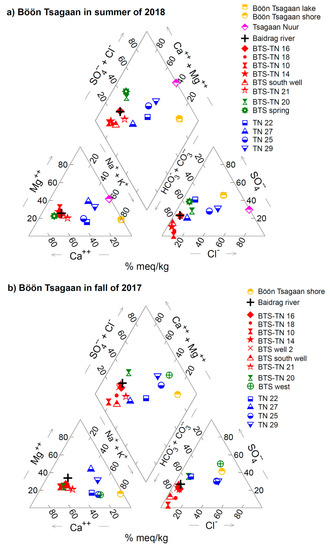
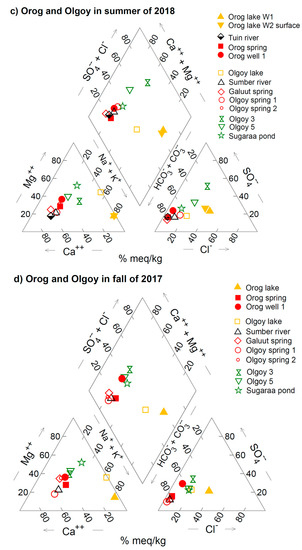
Figure 4.
Piper diagrams of the measured water chemistry for (a) the Böön Tsagaan lake system in the summer of 2018, (b) that in the fall of 2017, (c) the Orog and Olgoy lake systems in the summer of 2018, and (d) that in the fall of 2017. The original data are summarized in Table 2 and Table 3. The concentrations (ppm) of each element in Table 2 and Table 3 were converted to meq/kg.
A review of the water chemistries of 24 alkaline lakes with pH > 9 on Earth shows that the water chemistries are apparently equilibrated with respect to monohydrocalcite (MHC) (CaCO3·H2O) and amorphous Mg carbonate (AMC) (MgCO3·nH2O) [35]. The saturation indexes of MHC of the Böön Tsagaan, Orog, and Olgoy lakes are commonly slightly supersaturated with respect to MHC from 0.3 to 0.6, suggestive of precipitation of MHC in the lakes. The precipitations of MHC were confirmed through collection and analysis of suspended materials in these lakes by our companion paper [36]. The saturation indexes of AMC of the lakes during a rainy season in 2018 range from –0.1 to −0.6, although those during a dry season in 2017 are slightly low—down to −1.0—compared with those in the wet season (the seasonal difference in the saturation indexes cannot be explained by the difference in surface temperatures). Nevertheless, the saturation indexes of AMC in the lakes are significantly higher than those of the rivers, springs, and wells. The previous study on laboratory experiments and geochemical modeling indicated that the co-existence of AMC in solutions is required for precipitation of MHC [37]. Thus, the results of the near-zero saturation indexes of AMC (−0.1 to −0.6) suggest that Ca2+ and Mg2+ in the lakes may be removed by formation of AMC, in addition to MHC, during the evaporation of lake water.
In contrast to the lake waters, we find that the rivers, springs, and wells generally have low salinity (Table 2 and Table 3). Our results of the major dissolved components indicate that the water chemistry of groundwaters (wells and springs) can be classified into a few groups (Figure 3 and Figure 4). The hexa−diagrams show that the groundwater chemistry around the east shore of the Böön Tsagaan lake is, in general, characterized as a Ca−HCO3 type (Figure 3d) (hereafter, we call them group A). The groundwater of group A contains high levels of Ca2+ and HCO3− and less Na+, Cl−, and SO42− (Figure 3d and Figure 4a). The near zero values of the saturation index of calcite (Table 2 and Table 3) indicate that the concentrations of Ca2+ and HCO3− in the group−A groundwater are controlled by the dissolution equilibrium of calcite. The elevations of the water tables of group−A groundwater (e.g., 1305–1315 m in fall of 2017) are generally higher than the measured elevation of the Böön Tsagaan lake (1305 m) (Table 1).
In contrast, the hexa−diagrams show that the groundwaters close to Tsagaan Nuur wetland contain Na+, Mg2+, Cl−, and SO42− in addition to Ca2+ and HCO3− (Figure 3d) (hereafter, we call them group B). The groundwater of group B is distributed east of the group A wells, toward Tsagaan Nuur wetland (Figure 2b). The groundwater of the west shore of the Böön Tsagaan lake (the well of BTS well 1 west) can also be categorized as group B (Figure 3d). Although the number of available sampling sites is limited, the groundwater of the west shore of the lake may contain more SO42− than the other groundwaters of group B. The Baidrag river may be categorized as an intermediate between groups A and B, which means that the water chemistry of the Baidrag river is a Ca−HCO3 type, the same as group A, but contains a significant fraction of SO42− and Mg2+ (Figure 3b). The elevation of the water tables of group−B groundwater (1280–1305 m) are generally lower than those of group−A groundwater (Table 1).
In the piper diagram, the groundwater of group B can be divided into two sub−groups (Figure 4): in one, the groundwater contains relatively high SO42− and low Cl− (e.g., the wells of BTS−TN 20: Figure 4a), and in the other, the groundwater contains relatively high Na+ and/or Cl− (e.g., the wells of TN 25 and TN 29: Figure 4). We believe that the groundwaters of TN 22 and TN 27 can be categorized as the latter subgroup given the high Na in the groundwaters (Figure 4a). The groundwaters of the former subgroup seem to be distributed not only west of Tsagaan Nuur wetland (i.e., BTS−TN 20), but also near the Böön Tsagaan lake (i.e., BTS spring and BTS west) (hereafter, we call this subgroup group B−west) (Figure 2b); whereas the wells of the latter subgroup are located near Tsagaan Nuur wetland (hereafter, we call them group B−east) (Figure 2b). The elevation of the water table of group−B groundwater tends to be lower toward the east and becomes lowest near Tsagaan Nuur wetland (~1280 m at TN 27 in Figure 2b) (Table 1). The elevation of the water table of group−B−east groundwater surrounding Tsagaan Nuur is comparable to, or even a few meters lower than, that of the shallow pools of Tsagaan Nuur wetland (~1285 m). The low levels of the water table of group−B−east groundwater relative to Tsagaan Nuur wetland are in contrast to the high levels of the water table of group−A groundwater relative to the Böön Tsagaan lake.
Similar variations in groundwater chemistry can be found in the areas around both of the Olgoy and Orog lakes. The water chemistry of the Sumber river and some groundwaters around the Olgoy lake is Ca−HCO3 type (see Figure 3b,c and Figure 4c,d), similar to group A of the Böön Tsagaan lake (Figure 3). In contrast, the groundwaters east and south of the Olgoy lake contain Na+, Cl−, Mg2+, and SO42− in addition to Ca2+ and HCO3− (see Figure 3c and 4), similar to group B−west (Figure 3). The groundwater and Tuin river of the Orog lake are Ca−HCO3 type (group A) (Figure 3). As far as we know from our investigation, there is no groundwater similar to group B−east around the Orog and Olgoy lakes. The measured variety of groundwater chemistry suggests that the groundwater compositions are largely determined by local hydrogeochemical processes, rather than the composition of adjacent lakes. The causative mechanisms of this various water chemistry are discussed below in Section 5.2.
Interestingly, the groundwater close to the Böön Tsagaan, Olgoy, and Orog lakes has water chemistry that is distinct from the lake waters (Figure 2 and Figure 3). The distances from the wells to each adjacent lake are a few km or less (Figure 2). The water tables at these wells are a few meters below the surface, which are comparable to or higher than the respective lake levels (Table 1). If the lake water outflows toward the surrounding subsurface, the groundwater adjacent to the lakes should be similar to that of the lakes; namely, a Na−Cl type with high salinity. Thus, the low salinity and Ca−HCO3 type of the groundwaters near the lakes strongly suggest that there is no effective outflowing of the lake water, despite saline water having high density. There are two possible explanations for these results: In one, the interactions between the lake and surrounding groundwater are highly inhibited due to fine−grain impermeable lake sediments (Section 4.2), isolating the lake water from the surrounding groundwater. In the other, the surrounding groundwater is predominantly flowing into the lakes without any significant outflowing of the lake water. These are also discussed below in Section 5.1.
In addition to spatial variations in water chemistry, we find a small temporal variation in the water chemistry of some of the rivers, wells, and springs, comparing the results from the survey during a dry season of 2017 and a rainy season of 2018 (Figure 3). For instance, the Baidrag river water and the groundwater of group A around the Böön Tsagaan lake tend to contain less Ca2+ and HCO3− during a dry season (fall in 2018) than during a rainy season (summer in 2017). The groundwater chemistry of some of group A becomes close to group B−west in a dry season (Figure 4). A similar trend can be seen for some of the springs and groundwaters of the Olgoy and Orog lakes (Figure 3). This is probably because dissolution of carbonate minerals (e.g., calcite) in the soils was enhanced during the rainy season, which results in the relatively high concentrations of Ca2+ and HCO3− in the groundwaters and rivers. However, the seasonal changes do not affect the water chemistry remarkably compared with the observed spatial variations of the groundwater chemistry (Figure 4).
4.2. Minerals and Grain Size of Lake Sediments
Figure 5 shows the results of our XRD analysis for the sediment samples. The samples from the outcrops (OC 1–4) are predominantly composed of anhydrous silicates of albite and quartz (Figure 5). Low levels of a broad peak at ~20 to 30° indicate that there are low abundances of amorphous phases and organic matter in the samples (Figure 5). These results indicate that the outcrop samples, in general, experience only low degrees of aqueous alterations, although sample OC 4 may contain a small amount of hydrated phyllosilicate of dioctahedral smectite (e.g., montmorillonite) (Figure 5). Although we found calcite concretion in the soils (Supplementary Figure S1), no peaks of carbonate minerals are found in the XRD spectra of the outcrop samples, suggesting the calcite contents would be too low to be detected.
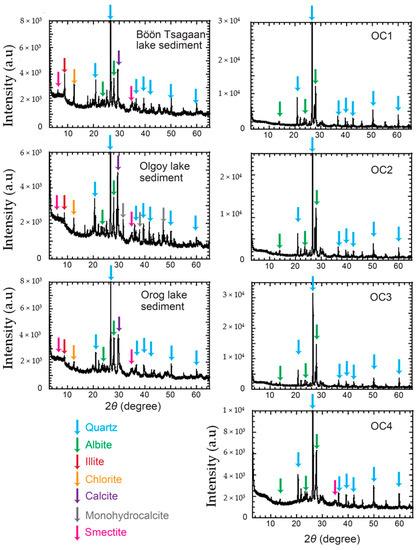
Figure 5.
X−ray diffraction (XRD) spectra of the collected soils and sediments. The peak positions and their corresponding minerals are shown as colored arrows. Supplementary Table S1 summarized the major minerals and their XRD intensities.
In contrast to the outcrop samples, the lake sediment samples of the Böön Tsagaan, Olgoy, and Orog lakes contain abundances of secondary minerals, such as calcite and MHC, in addition to primary albite and quartz (Figure 5). Relatively high levels of a broad peak at ~20° to 30° show high abundances of amorphous phases and/or organic matter in the lake sediment samples (Figure 5). Illite and chlorite found in the lake sediments likely have detrital origins given their narrow XRD peaks, and thus high crystallinity. Illite and chlorite may be detrital components of hydrothermally altered metamorphic basement rocks in the catchment area.
Figure 6 shows the results of our grain−size analysis for the outcrop and lake sediment samples. The obtained grain−size distributions of the outcrop samples (OC 1–4) are unimodal at a mean diameter of 100–300 μm, except for a faint peak at 0.3 μm for OC 2. In contrast, the lake sediment samples exhibit a multi−modal distribution of grain size at one peak diameter of 5 μm and the other of 30–50 μm. Given the unimodal grain size distributions of the outcrop samples at 100–300 μm, the peak with a mean diameter of 30–50 μm of the lake sediments may be the detrital component of non−hydrous albite and quartz. On the other hand, the grains with mean diameter of 5 μm would be due to the secondary minerals, such as carbonate minerals, found in the XRD results.
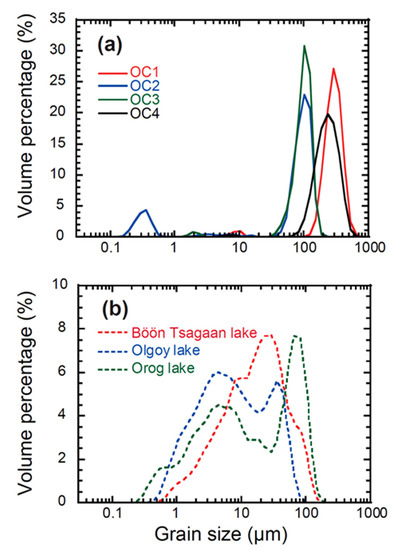
Figure 6.
Results of the grain−size distributions for (a) the collected soils from the outcrops (OC 1–4) and (b) the lake sediment samples of the Böön Tsagaan, Orog, and Olgoy lakes.
5. Discussion
5.1. Hydrogeochemical Cycles of the Hyposaline Lakes in the Valley of the Gobi Lakes
Although we performed regional−scale field surveys for the Valley of the Gobi Lakes, the sampling sites are still sparce compared to the whole of the catchment areas of the Böön Tsagaan and Orog lakes. In particular, there is only one sampling site in the west of the Böön Tsagaan lake (BTS west) and a few sampling sites around the Orog lake (Figure 2). The water chemistry of BTS west exhibits a distinct chemical composition, which is characterized as the highest fraction of SO42− in the anions among the sampling sites (Figure 4). Thus, the groundwater seepage from the west of Böön Tsagaan lake, if occurred, could provide additional SO42− to the lake, although SO42−−rich groundwater cannot be the major source of water to the lake to explain the chemistry of Böön Tsagaan lake (see Section 5.1.1 below). In addition, we performed field surveys in a rainy and dry season in different years (i.e., dry season in 2017 and rainy season in 2018). Thus, the seasonal variations in the water chemistry considered in the present study might partly include the annual variations of the water chemistry due to a change in precipitation.
To reduce the uncertainties caused by the limitation of the number of sampling sites and timing of survey, further investigations over the Valley of the Gobi Lakes in a single year would be required. Despite the uncertainties, we suggest that the following two conclusions of our field survey are robust. First is that the water chemistry of the lakes is distinct from those of the rivers and groundwaters. Second is that we find three types of water chemistry (i.e., groups A, B−east, and B−west) for the groundwaters and rivers despite the surveys in the different years. In this section, we discuss the interactions between the lake and groundwater (Section 5.1.1) and possible mechanisms to generate different types of groundwaters (Section 5.1.2).
5.1.1. Interactions between the Lake and Groundwater
In this subsection, we examine the interactions between the lake and groundwater using the measured variety of water chemistry as tracers of the water source. We consider, as an example, the Böön Tsagaan lake system because of the abundance of the measured data points around the lake. The water chemistry of Böön Tsagaan lake should be determined by the concentration of dissolved species of the water sources (river, springs, and wells) driven by evaporation of the lake water. There are two possibilities to explain the lake water chemistry by evaporative concentrations.
(1) If interactions between the lake and groundwaters are inhibited due to low permeability of the lake sediments, the lake’s composition is determined solely by evaporative concentration of the river water.
(2) If groundwater is predominantly supplied into the lake without outflowing of the lake water, the lake’s composition can be explained by evaporative concentrations of combined inlet river water and groundwater.
Using the REACT program of Geochemist’s Workbench (see Section 3.2 for calculation methods), we simulated the evolutions in chemical composition of the evaporating river water and groundwater. The principal criterion for evaluation of the evaporative concentration is whether or not a simulation reproduces the measured composition of the Böön Tsagaan lake. Upon evaporation, we consider the precipitations of both MHC and AMC at the fixed ambient CO2 pressure of 4 × 10⁻⁴ atm. This is the case because the water chemistry (Mg2+ and Ca2+ concentrations) of the lakes is thought to be governed by the formation of and dissolution equilibria with MHC and AMC [35,36], and because calcite is found in the sediments of the Böön Tsagaan lake (Figure 4 and Section 3.2). Precipitation of MHC is the precursor of authigenic deposition of calcite in alkaline lacustrine environments [35]. Furthermore, our companion paper found MHC present in the suspended materials in the lake waters of the Böön Tsagaan lake [36]. Since MHC and AMC are considered to be the initial phases of precipitation of Mg− and Ca−bearing carbonate minerals [35,36], formations of magnesite and calcite are suppressed in our calculations. On the other hand, we considered Na+, K+, Cl−, and SO42− were conservative (i.e., no removals from lake water via precipitation of minerals) upon evaporative concentration, which meant that no precipitations of chloride and sulfate minerals were taken into account. This is due to the concentrations of these elements being far below the saturation of chloride and sulfate minerals, including gypsum, epsomite, and mirabilite, in the lake (Table 2 and Table 3).
Figure 7 shows the evolutional tracks of water chemistry in evaporative concentration of the river water and groundwaters, superposed on the measured data in the piper diagrams. Our results of the calculations show that evaporation of the Baidrag river water cannot be the sole explanation for the compositions of the Böön Tsagaan lake (Figure 7). The water chemistry of the Baidrag river is plotted in the top−left quadrant of the piper diagram (Figure 7), where mNa < (mCl + 2mSO42) (mX represents the activity of the components X in solution). In this quadrant, the difference of (mCl + 2mSO42) to mNa (i.e., (mCl + 2mSO42) − mNa) increases upon evaporation of the river water, which in turn maintains high Mg2+ concentrations in the evaporating water according to the charge balance. While Mg2+ concentrations remain relatively high, the concentrations of HCO3− and CO32− become very low through the precipitations of MHC and AMC based on the dissolution equilibria. As a result, the concentrations of Mg2+ become high in the evaporating river water compared with the lake water, despite the Na+ and Cl− concentrations becoming comparable (Figure 7). The results show that evaporative concentration of the river water cannot explain the lake water, suggesting that the contribution of groundwater is crucial for the Böön Tsagaan lake system.
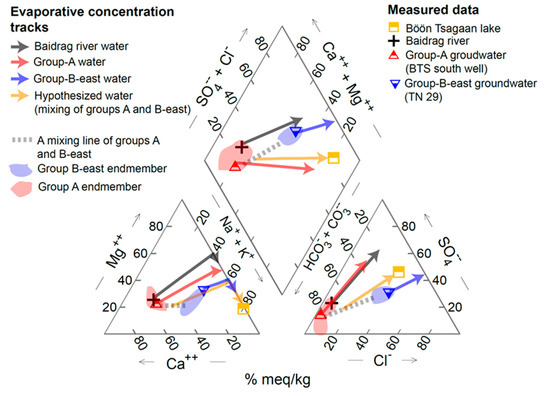
Figure 7.
Results of geochemical model calculations for evaporative concentrations of the measured water chemistry (the gray, red, and blue arrows) and hypothesized water (the yellow arrow) (see the main text for the details). As examples, the measured compositions of BTS south well and TN 29 were used for the representative values for group−A and group B−east groundwaters, respectively. The starting solutions of the measured water chemistry are also shown (see the symbols). The thick dotted lines show mixing lines of the endmember water chemistry of group−A and group−B−east groundwaters. The blue and red areas are the measured endmember compositions for groups B−east and A, respectively. As for the endmember of group−B−east groundwater, we used the measured data of TN 27 and TN 29. The results of calculations are summarized in Supplementary Table S2.
To achieve the water chemistry of the Böön Tsagaan Lake, we find that the input of group−A groundwater is important. A typical result of the water chemistry evolution track of evaporating group−A groundwater is also shown in Figure 7. Unlike the river water, the initial group−A groundwater is, in general, plotted in the lower−left quadrant in the piper diagram, where mNa > (mCl + 2mSO42) (Figure 7). In this quadrant, the difference of mNa to (mCl + 2mSO42) (i.e., mNa − (mCl + 2mSO42)) increases upon evaporation. According to the charge balance, this leads to low concentrations of Mg2+ and Ca2+ in the evaporating water (Figure 7). The concentration of Ca2+ first decreases due to precipitation of MHC (Figure 7). Subsequently, the concentration of Mg2+ dramatically decreases after precipitation of AMC (Figure 7). In contrast, the concentrations of HCO3− and CO32− remain relatively high owing to both equilibrium with 400 ppm of atmospheric CO2 in alkaline solution and following the dissolution equilibria of MHC and AMC. As a result, the evaporating group−A groundwater tends to possess low Mg2+ and moderate HCO3−, which is, in general, consistent with the characteristics of the lake water (Figure 7).
One notable discrepancy of evaporating group−A groundwater is the low levels of Cl−, or low Cl−/SO42−, compared with the Böön Tsagaan lake water chemistry (Figure 7). Additions of the Baidrag river cannot increase Cl−/SO42− because they are also characterized as low Cl−/SO42− (Figure 7). Given the limited data of the groundwater from the west shore of the lake, we cannot conclude whether the groundwater in the west shore of the Böön Tsagaan lake can be a source of Cl−containing water or not. However, to our best knowledge, our results suggest that the groundwater in the west shore of the lake (i.e., BTS west) cannot be a source of Cl−containing water because they are also characterized as low Cl−/SO42− (Figure 3). In addition, to form Cl−containing water, we suggest that infiltration of Na−Cl−rich surface water in shallow pools would be important (see Section 5.1.2), yet there are no widespread wetlands in the west shore of the Böön Tsagaan lake. Among all of the measured groundwaters and springs around the Böön Tsagaan lake, water chemistry with Cl−/SO42− > 1 is achieved for the groundwater of group B−east (e.g., TN 25 and TN 29) (Figure 7). The relative abundances of Cl− and Na+ of group−B−east groundwater are higher than those of the other regions (Figure 7). Evaporation of the groundwater of TN 29, in fact, results in high Cl−/SO42− in the evaporating water (Figure 7).
Based on the above−mentioned behaviors of the evaporating river and groundwaters, together with our trial−and−error calculations, we can reproduce chemical compositions similar to that of the Böön Tsagaan lake through evaporative concentration of a hypothesized source water (Figure 7). A typical result of the water chemistry evolutional track of a hypothesized source water is shown in Figure 7. The hypothesized water chemistry falls within the range that can be explained by mixing of the river water and groundwaters. In particular, to achieve a chemical composition similar to the lake, the hypothesized source water needs to be close to the mixing line of group−A and group−B−east groundwaters in the piper diagram (Figure 7). The needs of the groundwater of group B−east suggest that the Böön Tsagaan lake is sustained not only by local seepage of the groundwater of group A, but also by regional flows of the groundwater of group B−east from the areas near Tsagaan Nuur wetland.
Although we do not calculate the evaporative concentrations in detail due to the small number of the measured data, similar trends of evaporative concentration of water chemistry are expected for the Orog and Olgoy lake systems. In order to achieve the lake water chemistry of mNa > (mCl + 2mSO42) for the Orog and Olgoy lakes (Figure 4), the initial source water also needs to be in the lower−left quadrant in the piper diagram, where mNa > (mCl + 2mSO42). Namely, the groundwater of group A could explain the lake compositions due to evaporative concentration. The Tuin river and spring of the Orog lake are candidates for the major water source because their water chemistry is mNa > (mCl + 2mSO42) (group A) (Figure 4). As for the Olgoy lake, the groundwaters in north of the lake (e.g., the well of Olgoy spring 1 and Gault spring) exhibit the water chemistry of group A with mNa > (mCl + 2mSO42). These results suggest that evaporations of both the river water and/or groundwater would be important to explain the compositions of the Orog and Olgoy lakes. Unlike the Böön Tsagaan lake, the contributions of the rivers may be significant for the Orog and Olgoy lakes. This could be because the Böön Tsagaan lake is larger than the other lakes. For instance, the depth of the Böön Tsagaan lake is ~10 m, whereas the depths of the Orog and Olgoy lakes are only 1–3 m. Thus, groundwater could upwell more easily into the deep topographic depression of the Böön Tsagaan lake cavity than the Orog and Olgoy lakes.
5.1.2. Possible Source of Groundwater and Hydrogeochemical Cycles
In Section 5.1.1., we suggest the need for inflows of multiple sources of groundwaters (e.g., groups A and B−east) to explain the water chemistry of the Böön Tsagaan lake; however, how can the different types of water chemistry be generated in the subsurface?
Figure 7 shows that a hypothetical water located close to group A on the mixing line between groups A and B−east could explain the lake water composition. This implies that a major water source of the Böön Tsagaan lake would be local seepage of group−A groundwater. In general, groundwater with a water table higher than a lake tends to supply it through local groundwater seepage, e.g., [38] (Table 1).
Our conclusion that group−A groundwater is a major water source may be inconsistent with previous results suggesting that the Khangai mountains are the ultimate water source due to the aqueous organic compositions of the Böön Tsagaan lake largely being influenced by the occurrence of permafrost in the mountains [27]. The previous study showed that organic compounds bound in water of the Böön Tsagaan lake are derived from melting water of permafrost in the Khangai mountains [27]. To explain the two conflicting results that the lake composition derives largely from group−A groundwater and yet the lake’s organic composition is influenced by permafrost thaw in the Khangai mountains, we suggest that the source of the groundwater of group A would be river water that infiltrated the subsurface. This can happen because the groundwater of group A is distributed downstream of the Baidrag river near the Böön Tsagaan lake (Figure 2b). During the river water’s infiltration into the subsurface, the water would interact with soil materials. We found carbonate concretions in subsurface soils south and east of the Böön Tsagaan lake (Section 4.2) (Supplementary Figure S1). Dissolution of calcite in the soils would increase the concentrations of Ca2+, HCO3−, and CO32−, possibly forming a Ca−HCO3 type (i.e., group A) groundwater. The calcite concretions may have been generated through early diagenesis of carbonate−containing sediments of a larger lake in the past [18]. As described above in Section 1, the Valley of the Gobi Lakes would have been once covered with a larger lake in more humid past [28]. We found bedding of the lacustrine sediments in the outcrops (Supplementary Figure S1). We suggest that early diagenesis of the carbonate−containing sediments might be a source of calcite concretion in the soils.
In Section 5.1.1, we suggest the necessity of group−B−east groundwater flowing into the Böön Tsagaan lake. The groundwater of group B−east is distributed around Tsagaan Nuur wetland (Figure 2b). In Figure 4 and Figure 7, we find that the groundwater of group B−east can be generated through a mixing of Ca−HCO3−type groundwater with the highly saline shallow pool of Tsagaan Nuur wetland. This shallow pool exhibits extremely high levels of Na+, Cl−, Mg2+, and SO42− (Table 3). The near zero saturation indexes of gypsum and calcite suggest that the Ca2+, Mg2+, HCO3−, and SO42− are controlled by dissolution of these secondary minerals in Tsagaan Nuur wetland, whereas the water chemistry of Tsagaan Nuur wetland is unsaturated with epsomite or mirabilite (e.g., the saturation indexes of epsomite and mirabilite are −1.62 and −1.48, respectively, at 25 °C). In semi−arid climates, the water of shallow pools tends to infiltrate the subsurface when its water level is higher than the surrounding groundwater table, e.g., [38]. In fact, the elevation of Tsagaan Nuur wetland (~1285 m) is comparable to or higher than the water table elevations of the group B−east wells of groundwater (1280–1285 m) (Table 1), which suggests that Tsagaan Nuur wetland’s surface saline water may have infiltrated the subsurface and formed group−B−east groundwater through mixing.
The groundwater of group B−west is located in between the groundwaters of groups A and B−east (Figure 2b). The group−B−west groundwater contains more SO42− and Mg2+ than group B−east (Figure 4). Figure 7 shows that the evolution track of the evaporating river water is consistent with the measured compositions of the group−B−west groundwater, suggesting the occurrence of groundwater evaporation of river water that infiltrated soils in this area. In fact, groundwater evaporation occurs at a depth of 1–5 m from the surface depending on vegetation and climate, e.g., [39]. We suggest that the groundwater of group B−west is generated through groundwater evaporation.
Figure 8 summarizes a conceptual image of hydrogeochemical cycles and interactions between the surface and groundwater around the Böön Tsagaan lake suggested by the present study. The Baidrag river water not only provides water to the lake, but also infiltrates calcite−containing soils downstream, generating the Ca−HCO3−type groundwater of group A near the lake (Figure 8). Local seepage of group−A groundwater would play a central role in supplying water to the lake. In addition to group−A groundwater, a supply of group−B−east groundwater would be important to explain the lake water composition. The groundwater of group B−east would be generated through recharge of highly saline surface water into the subsurface near Tsagaan Nuur wetland (Figure 8), whose water source includes small transient rivers from the mountain area and flooding of the Baidrag river in rainy seasons. The groundwater of group B−east is then supplied into the lake through regional groundwater flows (Figure 8). The driving force of regional groundwater flows into the lake may be owing to the fact that the Böön Tsagaan lake is a deep lake in this area. In addition, regional groundwater flows may be enhanced by effective evaporation of the lake water in semi−arid climates [11], similar to other groundwater−fed lakes that developed in (semi−)arid climates, e.g., [38]. We suggest that the multiple hydrogeochemical processes (i.e., infiltration of surface water, seepage of local groundwater, and regional groundwater flows) would sustain the Böön Tsagaan lake system.
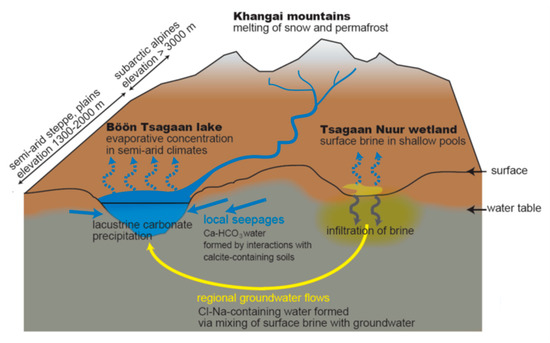
Figure 8.
A conceptual illustration of hydrogeochemical cycles around the Böön Tsagaan lake system in the Valley of the Gobi Lakes. See the main text for the detailed explanation.
5.2. Implications for Hydrogeochemical Cycles around Lakes on Early Mars
Comparing to other terrestrial analogues for early Martian lakes (e.g., saline lakes in the Qaidam Basin and Atacama−Andes regions, and cold springs on Axel Heiberg Island) [22,23,24], the sources of water and salts differ each other depending on the geohydrological settings. Owing to the tectonically−active setting and hyperarid climate of Atacama−Andes regions, there are multiple sources of salts, including aeolian inputs (sea salts and desert dust), recycling of crustal salts, and volcanic inputs [24]. In the polar zone of Axel Heiberg Island springs [22], the major source of highly saline water is subglacial meltwater. Although these supply processes of salts could have also occurred in lake systems on early Mars, the characteristics of the Valley of the Gobi Lakes allow us to understand the roles of evaporative concentration of salinity and groundwater hydrology in semi−arid climates. Despite of the variety of the water sources among the analogue sites, all of them suggest the importance of groundwater hydrology to transport the water and dissolved elements to the lakes.
In Section 1, we raise some questions regarding hydrogeochemical cycles that developed in semi−arid climates on early Mars—(1) Did groundwater flow into lakes? (2) If so, what types of dissolved species were supplied to lakes? (3) Could surface water and salts infiltrate the subsurface? Our field survey for a terrestrial analog of hyposaline lakes in semi−arid climates provides insights into these questions.
Concerning questions (1) and (2), our results suggest that groundwater inflows play central roles in the hydrogeochemistry of the closed−basin lake systems of the Valley of the Gobi Lakes. River water originating from the melting of permafrost and snow in the mountain areas (i.e., the Khangai mountains) would be a major source of water sustaining the lakes. Thus, the melting of permafrost and snow is the ultimate crucial source of water in this area. However, interactions with soils significantly affect the chemical compositions of water that is supplied to the lakes. In the Valley of the Gobi Lakes, calcite in soils would dissolve into the groundwater near the inlet river, providing Ca and HCO3 to the lakes via local groundwater seepages (Figure 3 and Figure 4). On current Mars, surface soils contain high abundances of sulfate minerals (e.g., anhydrite) at the landing sites of Mars rovers and landers, e.g., [40,41]. If sulfate minerals were also contained in soils on early Mars, interactions of infiltrated river water with soils would have provided dissolved Ca2+ and SO42− to the groundwater downstream of valley networks and channels, which could have eventually supplied Ca2+ and SO42− to lacustrine environments on early Mars. In the lacustrine mudstone−sandstone of the Sutton Island member of the Murray formation of Gale Crater, sulfate minerals are thought to exist in the matrix of the sediments, suggesting precipitation of lacustrine sulfate [16]. We suggest that local groundwater seepage could have been one of the sources of dissolved sulfate in the early Gale lakes if sulfate minerals existed in the soils at the time of deposition, although the direct inputs of sulfate from the atmosphere and surface cannot be excluded.
In early lakes in Jezero Crater, carbonate minerals (e.g., magnesite) may have been present in the soils downstream of inlet rivers and alluvial fans, given the presence of carbonate minerals (Mg carbonates) in the catchment area of valley networks of Jezero Crater (i.e., Nili Fossae) [42]. Our results suggest that if the soils around Jezero Crater contain detrital Mg carbonates, groundwater beneath inlet rivers and alluvial fans would have contained an abundance of dissolved Mg2+ and HCO3−. Local seepages of the groundwater would have then supplied these dissolved species to the lake. The supplied Mg2+ and HCO3− would have been consumed within the early Jezero lakes through evaporation and consequent precipitation of authigenic carbonate minerals, such as AMC, in a similar manner to the terrestrial saline lakes found in the Valley of the Gobi Lakes [35,36]. In fact, recent remote−sensing observations found possible evidence for lacustrine carbonates (hydrated magnesite and/or hydromagnesite) near a large inlet river and delta deposits of Jezero Crater [43]. Fukushi et al. (2017) show that AMC is the precursor of deposition of hydromagnesite [37]. Given the low degree of diagenesis and preservations of metastable phases (e.g., ferrihydrite) in lacustrine sediments of Gale Crater, e.g., [38], we predict that metastable AMC and/or diagenetic hydromagnesite could be preserved in the lacustrine sediments of Jezero Crater. The findings of AMC/hydromagnesite can serve as evidence for authigenic precipitation of carbonate minerals in alkaline lakes [35,43], which may be testable by the Mars 2020 Perseverance rover and in future Mars Sample Return missions.
Regarding question (3) of the fate of surface salts, our results suggest that saline shallow pools in the wetlands (i.e., Tsagaan Nuur wetland) infiltrate the subsurface, providing Cl− and Na+ to the groundwater (Section 5.1). On early Mars, shallow pools in wetlands might not only have contained Cl− and Na+, but also photochemically produced oxychlorides, such as ClO3− and ClO4− [44]. Irradiation from solar UV light would have also oxidized and acidified surface water through photo−oxidation of ferrous ions [45]. If oxidizing surface water infiltrated the wetlands of semi−arid climates on early Mars, highly reactive oxychlorides (e.g., ClO3−) would have oxidized the subsurface materials, as suggested previously [44,46]. Less reactive Cl−, Na+, and ClO4− in infiltrating surface water could have been transported into deep lakes through regional groundwater flows, as proposed by [8]. The previous study estimated a duration of hydrological cycles based on observed thickness of salt deposits, assuming Na+ and Cl− were supplied by water–rock reactions using a reactive transport model [8]. The accumulation of pre−existing surface salts into lakes through regional flows, however, could affect the estimation of the duration [8]. Finally, transport of surface ClO4− through regional groundwater flows to lakes could have contributed to generate redox disequilibria in the lacustrine environments. On Earth, similar transports of oxidants (e.g., NO3−) via regional groundwater flows and reductants (e.g., Fe2+ and Mn2+) via upwelling of deep groundwater controls microbial ecosystems in a floodplain in semi−arid climates [47]. Together with upwelling of reducing deep groundwater in semi−arid climates on early Mars [11], such transports of multiple sources of groundwater could provide a perspective on the past habitable environments on Mars.
6. Conclusions
The present study focused on the reconstruction of the geohydrological cycles of the closed−basin lake systems in the Valley of the Gobi Lakes, central Mongolia, based on field surveys. The water of the Valley of the Gobi Lakes largely relies on the melting of snow and permafrost in the mountain ranges. The melted water is transported to closed−basin lakes in semi−arid steppe plains where evaporation predominates precipitation. This hydrological nature would allow this area to be a promising terrestrial analog of lacustrine environments that developed in cold and semi−arid climates on early Mars. Since the sampling locations are still sparse compared with the catchment area, especially in the west shore area of the Böön Tsagaan lake, the whole picture of hydrology and geochemical cycles of the lake systems remains unclear. Additionally, the measured water chemistry data may be snapshots of seasonal or long−term variations. Despite these uncertainties, we can summarize the following results of our field study.
(1) The water chemistry of the closed−basin lakes is characterized as alkaline−hyposaline, Na−Cl−type water. This is in contrast to the circumneutral, low−salinity waters of the rivers and groundwaters. Even for the groundwater adjacent to the lakes, salinity remains at low levels, suggesting ineffective outflowing of the lake water to the surrounding subsurface. We suggest that groundwater predominantly inflows into the lakes in semi−arid climates, which would be driven by effective evaporation of surface water.
(2) The groundwater chemistry around the lakes can be classified into a few groups. In group A, water chemistry is characterized as Ca−HCO3 type, which would be generated by interactions of infiltrating river water with calcite−containing soils near the inlet rivers. In group B−east, groundwater contains Cl− and Na+ together with Ca2+, Mg2+, HCO3−, and SO42−, which would be formed by the mixing of infiltrating surface brine with groundwater. The high−salinity brine occurs in shallow pools of the wetland (Tsagaan Nuur wetland) upon evaporation. In group B−west, the groundwater contains Ca2+, Mg2+, and SO42−, which would be generated through groundwater evaporation.
(3) The lake water composition cannot be explained solely by evaporation of the river water. To achieve the composition of the Böön Tsagaan lake, inflows of the different types of groundwaters are necessary. In particular, the groundwater of groups A and B−east would be important to account for the lake composition. These results suggest that the occurrence of local seepage (group−A groundwater) and regional flows (group−B−east groundwater) are required to sustain the Böön Tsagaan lake.
These results would provide insights into hydrogeochemical cycles around closed−basin paleolakes on Mars. In semi−arid climates of early Mars, groundwater may have played central roles not only in sustaining surface water in lakes, but also in collecting soluble species in the subsurface of the catchment area. For instance, local groundwater seepage could have been a source of Ca2+, Mg2+, and SO42− to lakes through dissolution of sulfates in soils. If the soils near early Jezero lakes contained detrital Mg carbonates provided from the Nili Fossae region, local groundwater seepage would have also provided an abundance of dissolved Mg and alkalinity to the lakes, which in turn could have caused authigenic precipitation of lacustrine carbonates [43]. Our results also support the idea that shallow pools in wetlands in semi−arid climates of early Mars would have transported salinity and oxidizing materials to the subsurface groundwater through infiltration [8,44]. We suggest that closed−basin lakes in semi−arid climates on early Mars would have been sustained by multiple types of groundwater inflows (e.g., local seepage, regional flows, and upwelling of deep groundwater [11]), which would have generated redox disequilibria in the lacustrine environments and could have affected the past habitability.
Supplementary Materials
The following are available online at https://www.mdpi.com/2075-163X/10/9/792/s1, Figure S1: Pictures of the outcrops. (a) The outcrop of OC1. (b) A close-up photo of the outcrop OC1. Laminated sands and conglomerates were found (the scale in cm). (c) The outcrop of OC2. (d) Muddy samples were collected from ~10 cm below the surface. (e) The outcrop of OC3. (f) A close-up photo of the outcrop OC3. Laminated sands/silts were collected. Table S1: The list of the major minerals (XRD intensity > 2000) and their XRD intensities found in the outcrops and lake sediments. Table S2: Calculation results of evaporative concentrations of typical groundwater, river water, and a hypothesized water.
Author Contributions
Conceptualization, Y.S. and K.F.; methodology, T.K. and K.F.; field investigation, Y.S., T.K., K.F., B.G., D.D., S.T., H.M., T.C., M.N., and N.H.; analyses, T.K., B.G., H.M., T.C., and M.N.; writing—original draft preparation, Y.S.; writing—review and editing, K.F.; and funding acquisition, Y.S and K.F. All authors have read and agreed to the published version of the manuscript.
Funding
This study was supported by Grants−in−aid for Scientific Research, KAKENHI JSPS (Grant Nos. JP17H06456, JP17H06458, and JP20H00195), and cooperative research programs of the Institute of Nature and Environmental Technology, Kanazawa University, grant numbers 19035, 20010, and 20061.
Acknowledgments
Y.S. thank Uyangaa of Kanazawa Univ.; Shuukhkaaz and Tuvshin of Nat. Univ. of Mongolia; Y. Tanaka of Kyung Hee Univ.; and car drivers, and local people for help in the field surveys. Y.S. also appreciates great nature of Mongolia.
Conflicts of Interest
The authors declare no conflict of interest.
References
- Ehlmann, B.L.; Edwards, C.S. Mineralogy of the Martian surface. Annu. Rev. Earth Planet. Sci. 2014, 42, 291–315. [Google Scholar] [CrossRef]
- Irwin, R.P.; Howard, A.D.; Craddock, R.A.; Moore, J.M. An intense terminal epoch of widespread fluvial activity on early Mars: 2. Increased runoff and paleolake development. J. Geophys. Res. 2005, 110, E12S15. [Google Scholar] [CrossRef]
- Irwin, R.P.; Craddock, R.A.; Howard, A.D.; Flemming, H.L. Topographic influences on development of Martian valley networks. J. Geophys. Res. 2011, 116, E02005. [Google Scholar] [CrossRef]
- Barnhart, C.J.; Howard, A.D.; Moore, J.M. Long−term precipitation and late−stage valley network formation: Landform simulations of Parana Basin, Mars. J. Geophys. Res. 2009, 114, E01003. [Google Scholar] [CrossRef]
- Hoke, M.R.; Hynek, B.M.; Tucker, G.E. Formation timescales of large Martian valley networks. Earth Planet. Sci. Lett. 2011, 312, 1–12. [Google Scholar] [CrossRef]
- Wordsworth, R. The Climate of Early Mars. Annu. Rev. Earth Planet. Sci. 2016, 44, 381–408. [Google Scholar] [CrossRef]
- Horvath, D.G.; Andrews−Hanna, J.C. Reconstructing the past climate at Gale crater, Mars, from hydrological modeling of late−stage lakes. Geophys. Res. Lett. 2017, 44, 8196–8204. [Google Scholar] [CrossRef]
- Melwani Daswani, M.; Kite, E.S. Paleohydrology on Mars constrained by mass balance and mineralogy of pre−Amazonian sodium chloride lakes. J. Geophys. Res. Planets 2017, 122, 1802–1823. [Google Scholar] [CrossRef]
- Ramirez, R.M.; Craddock, R.A. The geological and climatological case for a warmer and wetter early Mars. Nat. Geosci. 2018, 11, 230–237. [Google Scholar] [CrossRef]
- Fukushi, K.; Sekine, Y.; Sakuma, H.; Morida, K.; Wordsworth, R. Semiarid climate and hyposaline lake on early Mars inferred from reconstructed water chemistry at Gale. Nat. Comms. 2019, 10, 4896. [Google Scholar] [CrossRef]
- Noda, N.; Sekine, Y.; Tan, S.; Kikuchi, S.; Shibuya, T.; Kurisu, M.; Genda, H.; Takahashi, Y.; Wordsworth, R. Upwelling Groundwater in Semi−Arid Climates on Early Mars as A Possible Source of Silica in Gale’s Lake Sediments; American Geophysical Union (AGU): Washington DC, USA, 2020; under review. [Google Scholar]
- Osterloo, M.M.; Hamilton, V.E.; Banfield, J.L.; Glotch, T.D.; Baldridge, A.M.; Christensen, P.R.; Tornabene, L.L.; Anderson, F.S. Chloride−bearing materials in the southern highlands of Mars. Science 2018, 319, 1651–1654. [Google Scholar] [CrossRef] [PubMed]
- Hynek, B.M.; Osterloo, M.M.; Kierein−Young, K.S. Late−stage formation of Martian chloride salts through ponding and evaporation. Geology 2015, 43, 787–790. [Google Scholar] [CrossRef]
- Glotch, T.D.; Bandfield, J.L.; Wolff, M.J.; Arnold, J.A.; Che, C. Constraints on the composition and particle size of chloride salt−bearing deposits on Mars. J. Geophys. Res. Planets 2016, 121, 454–471. [Google Scholar] [CrossRef]
- Thomas, N.H.; Ehlmann, B.L.; Meslin, P.Y.; Rapin, W.; Anderson, D.E.; Rivera-Hernández, F.; Forni, O.; Schroeder, S.; Cousin, A.; Mangold, N.; et al. Mars Science Laboratory observations of chloride salts in Gale Crater, Mars. Geophys. Res. Lett. 2019, 46, 10754–10763. [Google Scholar] [CrossRef] [PubMed]
- Rapin, W.; Ehlmann, B.L.; Dromart, G.; Schieber, J.; Thomas, N.H.; Fischer, W.W.; Fox, V.K.; Stein, N.T.; Nachon, M.; Clark, B.C.; et al. An interval of high salinity in ancient Gale crater lake on Mars. Nat. Geosci. 2019, 12, 889–895. [Google Scholar] [CrossRef]
- Chan, M.A.; Beitler, B.; Parry, W.T.; Ormö, J.; Komatsu, G. A possible terrestrial analogue for haematite concretions on Mars. Nature 2014, 429, 731–734. [Google Scholar] [CrossRef]
- Yoshida, H.; Hasegawa, H.; Katsuta, N.; Maruyama, I.; Sirono, S.; Minami, M.; Asahara, Y.; Nishimoto, S.; Yamaguchi, Y.; Ichinnorov, N.; et al. Fe−oxide concretions formed by interacting carbonate and acidic waters on Earth and Mars. Sci. Adv. 2018, 4, eaau0872. [Google Scholar] [CrossRef]
- Komatsu, G.; Kumar, P.S.; Goto, K.; Sekine, Y.; Giri, C.; Matsui, T. Drainage systems of Lonar Crater, India: Contributions to Lonar Lake hydrology and crater degradation. Planet. Space Sci. 2014, 95, 45–55. [Google Scholar] [CrossRef]
- Ruff, S.W.; Farmer, J.D. Silica deposits on Mars with features resembling hot spring biosignatures at El Tatio in Chile. Nat. Comms. 2016, 7, 13554. [Google Scholar] [CrossRef]
- Head, J.W.; Marchant, D.R. The climate history of early Mars: Insights from the Antarctic McMurdo Dry Valleys hydrologic system. Antarctic Sci. 2014, 26, 774–800. [Google Scholar] [CrossRef]
- Battler, M.; Osinski, G.R.; Banerjee, N.R. Mineralogy of saline perennial cold springs on Axel Heiberg Island, Nunavut, Canada and implications for spring deposits on Mars. Icarus 2013, 224, 364–381. [Google Scholar] [CrossRef]
- Xiao, L.; Wang, J.; Dang, Y.; Cheng, Z.; Huang, T.; Zhao, J.; Xu, Y.; Huang, J.; Xiao, Z.; Komatsu, G. A new terrestrial analogue site for Mars research: The Qaidam Basin, Tibetan Plateau (NW China). Earth−Sci. Rev. 2017, 164, 84–101. [Google Scholar] [CrossRef]
- Risacher, F.; Alonso, H.; Salazar, C. The origin of brines and salts in Chilean salars: A hydrochemical review. Earth−Sci. Rev. 2003, 63, 249–293. [Google Scholar] [CrossRef]
- Davaa, G.; Oyunbaatar, D.; Sugita, M. Surface Water of Mongolia. In A Handbook of Mongolian Environments; Konagaya, Y., Ed.; National Museum Ethnology: Osaka, Japan, 2006; pp. 55–68. [Google Scholar]
- Szumińska, D. Changes in surface area of the Böön Tsagaan and Orog lakes (Mongolia, Valley of the Lakes, 1974–2013) compared to climate and permafrost changes. Sediment. Geol. 2016, 340, 62–73. [Google Scholar] [CrossRef]
- Szopińska, M.; Dymerski, T.; Polkowska, Ż.; Szumińska, D.; Wolska, L. The chemis−try of river–lake systems in the context of permafrost occurrence (Mongolia, Valley of the Lakes) Part II. Spatial trends and possible sources of organic composition. Sediment. Geol. 2016, 340, 84–95. [Google Scholar] [CrossRef]
- Komatsu, G.; Brantingham, P.J.; Olsen, J.W.; Baker, V.R. Paleoshoreline geomorphology of Böön Tsagaan Nuur, Tsagaan Nuur and Orog Nuur: The Valley of Lakes, Mongolia. Geomorphology 2001, 39, 83–98. [Google Scholar] [CrossRef]
- Wordsworth, R.D.; Kerber, L.; Pierrehumbert, R.T.; Forget, F.; Head, J.W. Comparison of “warm and wet” and “cold and icy” scenarios for early Mars in a 3−D climate model. J. Geophys. Res. Planets 2015, 120, 1201–1219. [Google Scholar] [CrossRef]
- Wordsworth, R.; Kalugina, Y.; Lokshtanov, S.; Vigasin, A.; Ehlmann, B.; Head, J.; Sanders, C.; Wang, H. Transient reducing greenhouse warming on early Mars. Geophys. Res. Lett. 2017, 44, 665–671. [Google Scholar] [CrossRef]
- Palumbo, A.M.; Head, J.W. Groundwater release on early Mars: Utilizing models and proposed evidence for groundwater release to estimate the required climate and sub−surface water budget. Geophys. Res. Lett. 2020, 47, e2020GL087230. [Google Scholar] [CrossRef]
- Beck, H.E.; Zimmermann, N.E.; McVicar, T.R.; Vergopolan, N.; Berg, A.; Wood, E.F. Present and future Köppen−Geiger climate classification maps at 1−km resolution. Sci. Data 2018, 5, 180214. [Google Scholar] [CrossRef]
- Lehmkuhl, F.; Nottebaum, V.; Hülle, D. Aspects of late Quaternary geomorphological development in the Khangai Mountains and the Gobi Altai Mountains (Mongolia). Geomorphology 2018, 312, 24–39. [Google Scholar] [CrossRef]
- Bethke, C.M. The Geochemist’s Workbench Users Guide; University of Illinois: Illinois, IL, USA, 2007; p. 190. [Google Scholar]
- Fukushi, K.; Matsumiya, H. Control of water chemistry in alkaline lakes: Solubility of monohydrocalcite and amorphous magnesium carbonate in CaCl2−MgCl2−Na2CO3 solutions. ACS Earth Space Chem. 2018, 2, 735–744. [Google Scholar] [CrossRef]
- Fukushi, K.; Imai, E.; Sekine, Y.; Kitajima, T.; Gankhrel, B.; Davaasuren, D.; Hasebe, N. In−situ formation of monohydrocalcite in alkaline saline lakes from the Valley of Gobi lakes: Prediction for Mg, Ca, and total dissolved carbonate concentrations in Enceladus’ ocean and alkaline−carbonate ocean worlds. Minerals 2020, 10, 669. [Google Scholar] [CrossRef]
- Fukushi, K.; Suzuki, Y.; Kawano, J.; Ohno, T.; Ogawa, M.; Yaji, T.; Takahashi, Y. Speciation of magnesium in monohydrocalcite: XANES, Ab Initio and Geochemical Modeling. Geochim. Cosmochim. Acta 2017, 213, 457–474. [Google Scholar] [CrossRef]
- Jolly, I.D.; McEwan, L.; Holland, K.L. A review of groundwater−surface water interactions in arid/semi−arid wetlands and the consequences of salinity for wetland ecology. Ecohydrology 2008, 1, 43–58. [Google Scholar] [CrossRef]
- Shah, N.; Nachabe, M.; Ross, M. Extinction depth and evapotranspiration from ground water under selected land covers. Groundwater 2007, 45, 329–338. [Google Scholar] [CrossRef]
- Boynton, W.V.; Ming, D.W.; Kounaves, S.P.; Young, S.M.; Arvidson, R.E.; Hecht, M.H.; Hoffman, J.; Niles, P.B.; Hamara, D.K.; Quinn, R.C.; et al. Evidence for calcium carbonate at the Mars Phoenix landing site. Science 2009, 325, 61–64. [Google Scholar] [CrossRef]
- Vaniman, D.T.; Bish, D.L.; Ming, D.W.; Bristow, T.F.; Morris, R.V.; Blake, D.F.; Chipera, S.J.; Morrison, S.M.; Treiman, A.H.; Rampe, E.B.; et al. Mineralogy of a mudstone at Yellowknife Bay, Gale crater, Mars. Science 2014, 343, 1243480. [Google Scholar] [CrossRef]
- Ehlmann, B.L.; Mustard, J.F.; Murchie, S.L.; Poulet, F.; Bishop, J.L.; Brown, A.J.; Calvin, W.M.; Clark, R.N.; Des Marais, D.J.; Milliken, R.E. Orbital identification of carbonate−bearing rocks on Mars. Science 2008, 322, 1828. [Google Scholar] [CrossRef]
- Horgan, B.H.N.; Anderson, R.B.; Dromart, G.; Amador, E.S.; Rice, M.S. The mineral diversity of Jezero crater: Evidence for possible lacustrine carbonates on Mars. Icarus 2020, 339, 113526. [Google Scholar] [CrossRef]
- Mitra, K.; Catalano, J.G. Chlorate as a potential oxidant on Mars: Rates and products of dissolved Fe(II) oxidation. J. Geophys. Res. Planets 2019, 124, 2893–2916. [Google Scholar] [CrossRef]
- Hurowitz, J.A.; Fischer, W.W.; Tosca, N.J.; Milliken, R.E. Origin of acidic surface waters and the evolution of atmospheric chemistry on early Mars. Nat. Geosci. 2010, 3, 323–326. [Google Scholar] [CrossRef]
- Mitra, K.; Moreland, E.L.; Catalano, J.G. Capacity of chlorate to oxidize ferrous iron: Implications for iron oxide formation on Mars. Minerals 2020, 10, 729. [Google Scholar] [CrossRef]
- Kirk, M.F.; Crossey, L.J.; Takacs−Vesbach, C.; Newell, D.L.; Bowman, R.S. Influence of upwelling saline groundwater on iron and manganese cycling in the Rio Grande floodplain aquifer. Appl. Geochem. 2009, 24, 426–437. [Google Scholar] [CrossRef]
© 2020 by the authors. Licensee MDPI, Basel, Switzerland. This article is an open access article distributed under the terms and conditions of the Creative Commons Attribution (CC BY) license (http://creativecommons.org/licenses/by/4.0/).