Article

Crystal Chemical and Structural Characterization of Natural and Cation-Exchanged Mexican Erionite

by
Karla Quiroz-Estrada
1,*,
Alessandro Pacella
2,*,
Paolo Ballirano
2,
Miguel Ángel Hernández-Espinosa
3,
Carlos Felipe
4 and
Marcos Esparza-Schulz
5
1
Doctorado en Nanociencias y Micro-Nanotecnologías, UPIBI, Instituto Politécnico Nacional, Ciudad de Mexico 07340, Mexico
2
Dipartimento di Scienze della Terra, Sapienza Università di Roma, Piazzale Aldo Moro 5, 00185 Roma, Italy
3
Departamento de Investigación en Zeolitas, Benemérita Universidad Autónoma de Puebla, Puebla 72570, Mexico
4
Departamento de Biociencias e Ingeniería, CIIEMAD, Instituto Politécnico Nacional, Ciudad de Mexico 07340, Mexico
5
Departamento de Química, Fisicoquímica de Superficies, Universidad Autónoma Metropolitana-Iztapalapa, Ciudad de Mexico 09340, Mexico
*
Authors to whom correspondence should be addressed.
Minerals 2020, 10(9), 772; https://doi.org/10.3390/min10090772
Submission received: 18 July 2020 / Revised: 20 August 2020 / Accepted: 27 August 2020 / Published: 31 August 2020
(This article belongs to the Special Issue Hazardous Minerals)

Abstract

:
In this work, the chemical structural characterization of the erionite-type zeolite from Agua Prieta, Sonora, México, was performed on both pristine and Na, Ca, and Mg exchanged samples in order to identify the various modifications due to cation exchange. The samples investigated were those that showed the best behaviour of CO2 and CH4 adsorption at zero coverage levels and the higher values of surface area reported in our previous studies. According to the crystal-chemical formula (Na3.44K1.96Mg0.63Ca0.62)[Al8.21Si27.79O71.85]·29.63H2O, the pristine sample has been classified as erionite-Na. Morphological FE-SEM investigation performed on both pristine (ERIN) and Na-exchanged samples (ERINa3) showed a similar range of fiber diameters (27–37 nm). The chemical analyses of the ion-exchanged samples evidenced the upload of Ca and Mg following ion exchange with Na. Rietveld analysis results allowed the identification of the chemical structural modification caused by the ion exchange process, occurring mainly at the Ca1 site.

Graphical Abstract

1. Introduction

Currently, there are more than 240 zeolite frameworks reported, which are subdivided into 232 synthetic zeolites and 67 mineral species of natural zeolites [1,2]. Natural zeolites have a mainly volcanic origin. They can occur both in crystallized forms found in igneous and metamorphic rocks, as well as in grains of smaller diameters agglomerated in sedimentary rocks [3,4]. Various zeolite species may form by hydrothermal activity associated with different types of igneous rocks. This type of deposit mainly includes alteration in active geothermal fields and alteration associated with ore deposition. Regardless of the formation mechanism, the zeolite deposits are characterized as “sedimentary deposits” and today it is generally accepted that zeolites are widespread minerals, which form in a variety of geological environments [5]. Depending on the geological setting and physical-chemical conditions during mineral formation, natural zeolite deposits generally consist of heterogeneous mixtures of zeolite minerals along with varying amounts of other species such as quartz, feldspars and phyllosilicates [2], where the fraction corresponding to the zeolitic phase is the majority (>50 wt.%) [6]. Mexico has a wide range of zeolite deposits throughout its territory, mainly containing clinoptilolite, mordenite, epistilbite, erionite and chabazite [7]. Specifically, the municipalities of Tierra Blanca de Abajo, in the state of Guanajuato [8,9], and Agua Prieta, in the state of Sonora (Figure 1) [10,11] have abundant deposits of fibrous erionite. Erionite is a relatively widespread zeolite that occurs [12,13] with fibrous morphology in cavities of altered basalts, as a product of the diagenetic alteration of sediments, and as a hydrothermal alteration product [14]. It is hexagonal, space group P63/mmc [15], and according to the most abundant extra-framework cation, three different species are recognized: erionite-K, erionite-Ca, and erionite-Na [16,17,18], the latter being the most abundant [19]. In particular, erionite-Na has been reported from the United States [20,21], Tanzania Campbell, Antarctica [22], Northern Ireland [23], Cairns Bay (Australia) and Tuzkoy, Cappadocia (Turkey) [19]. Besides, fibrous erionite environmental exposure has been unambiguously related to the high rates of malignant mesothelioma cases observed in several villages of Cappadocia [24,25]. Erionite is classified as a low silica zeolite (Si/Al~3) and belongs to the small pore family, with 8-member rings (8MR) (0.36 × 0.51 nm) in its structure [26]. Furthermore, it is a member of the ABC-6 family [4,27], stacked along the c-axis of layers made of hexagonal rings of TO4 (T=Si, Al) tetrahedra, following an ABC scheme. Erionite is characterized by the AABAAC sequence. The resulting framework consists of columns of cancrinite (ε) cages connected along the z direction by double 6-rings (D6R) [28]. In addition, erionite cages (23-hedra) are formed by linking adjacent columns via single 6-rings (S6R) at the level of ε-cages. The cancrinite cage contains a K+ ion at the center of the cavity (site K1), whereas Ca1, Ca2 and Ca3 extra-framework (EF) cation sites, mainly coordinated by water molecules, are located along the axis of the large erionite cavity. Moreover, a further site, labelled K2 and placed at the center of the boat-shaped 8-member rings (8MR) forming the walls of the erionite cage, has been found in erionite-K and attributed to the presence of extra-K+ ions or Ca2+ and Na+ ions [15,16,29].
One of the most relevant characteristics of zeolites is their ability to exchange the cations present in their structure; each zeolite has a distribution of unique cationic sites [30]. The importance of a correct chemical and structural characterization of the zeolites that are applied in the adsorption processes is based on the fact that the distribution, size and number of cations present are strongly associated with the local electric field and the polarization of the adsorbed molecules in the cavities of zeolitic structures [31]. In some small pore zeolites with 8-member rings (8MR) such as erionite and chabazite, the location of certain cations like Na+ plays a role in the blocking or allowing of gaseous molecules that are adsorbed in their cavities [32,33]. In recent years, several studies have been published aimed at describing the crystal chemical characteristics of fibrous erionite samples from the typical localities [34,35,36,37] as well as on cation-exchanged samples. Mexican erionite from Agua Prieta, Sonora has already been characterized from a morphological, thermal and textural point of view [11,38]. In fact, this zeolite has been studied for industrial applications in gas and liquid adsorption processes [39,40,41]. Specifically, the selected erionite samples, both pristine and ionic exchanged, occupied in the present investigation were studied by Hernandez and Quiroz in CO2 [42] and CH4 [38] adsorption processes at zero degrees of coverage where the interactions between cations in the zeolitic cavities and gas molecules are more representative. According to the data reported, the main variations in CO2 adsorption occurred in the ERINa3 (0.155 mmol/g) and EriCa2 (0.11 mmol/g) and ERIMg2 (0.05 mmol/g) samples compared to the pristine ERIN sample (0.08mmol/g) at a temperature of 473 K and 10 mm Hg of pressure.
However, detailed chemical and crystallographic information on this sample is currently unavailable and it would be desirable to fill this gap for comparison purposes with well-characterized samples from other localities. This information is relevant since erionite must be handled safely due to its known carcinogenicity [43].
On this basis, this work aims to investigate, from the structural and crystal chemical point of view, samples from Agua Prieta (Sonora, Mexico), in the form of pristine material and loaded with Ca, Mg and Na by suspension in the corresponding salt solution at different concentrations.

2. Materials and Methods

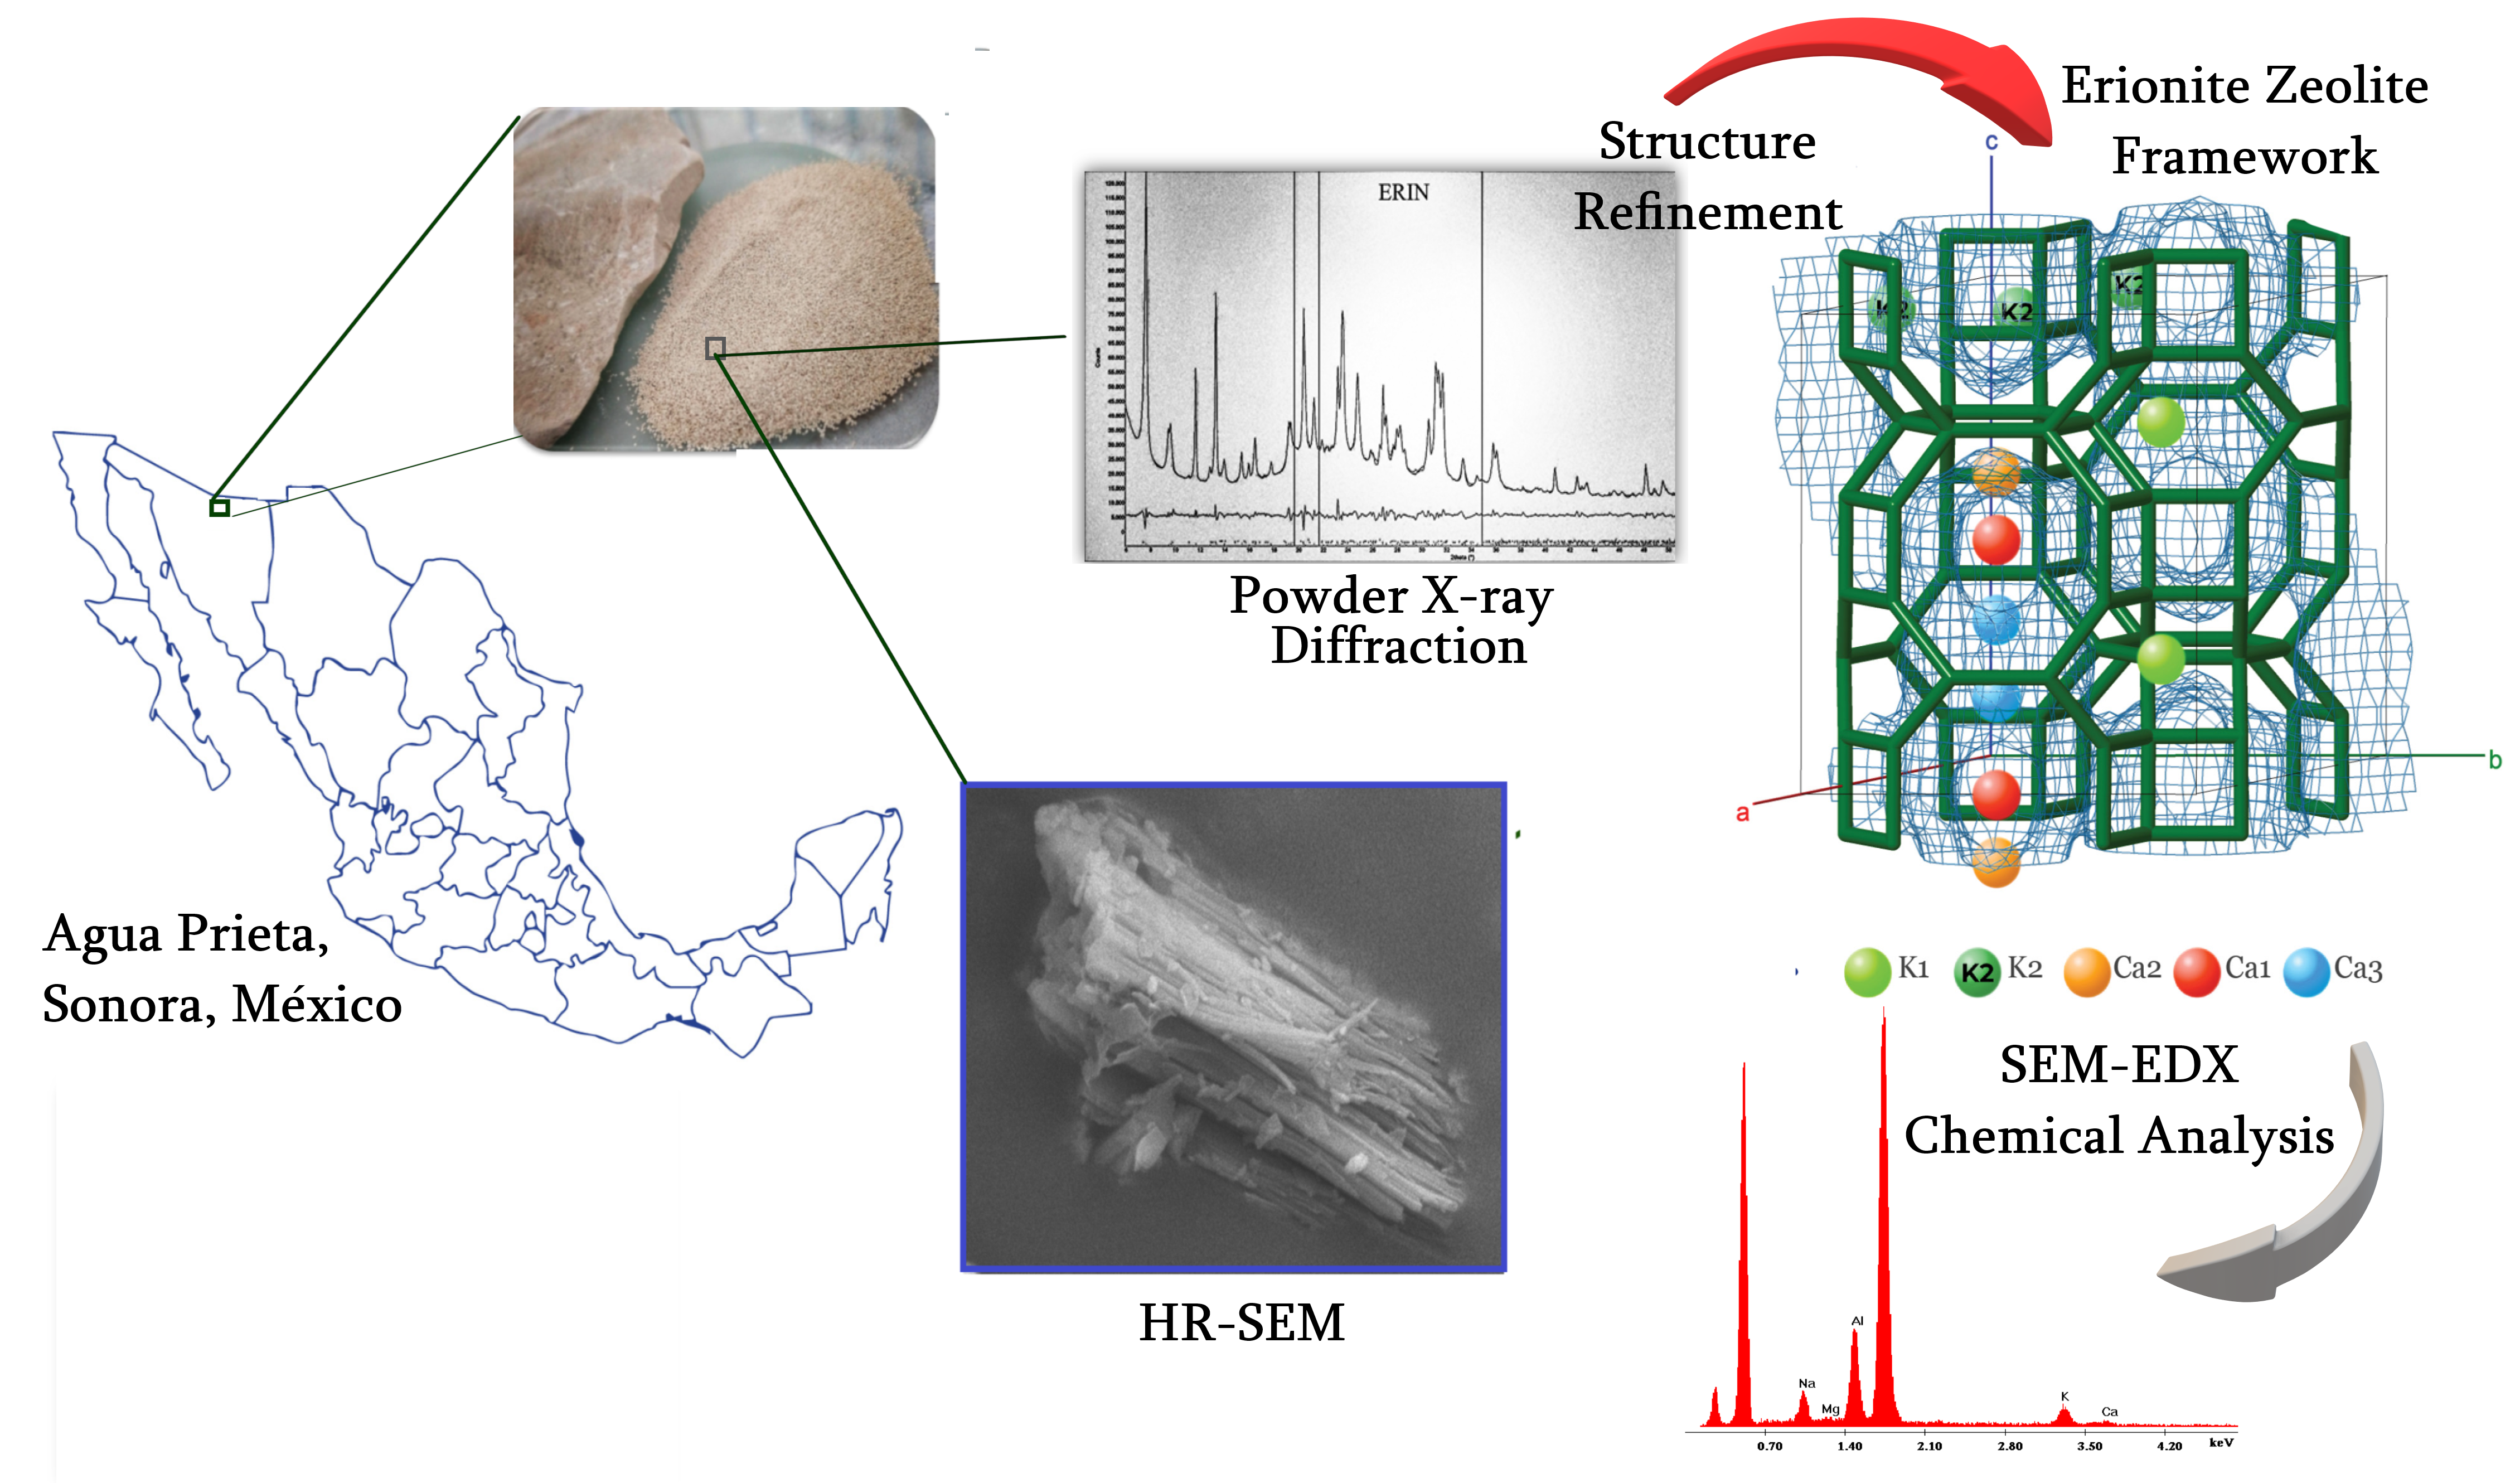
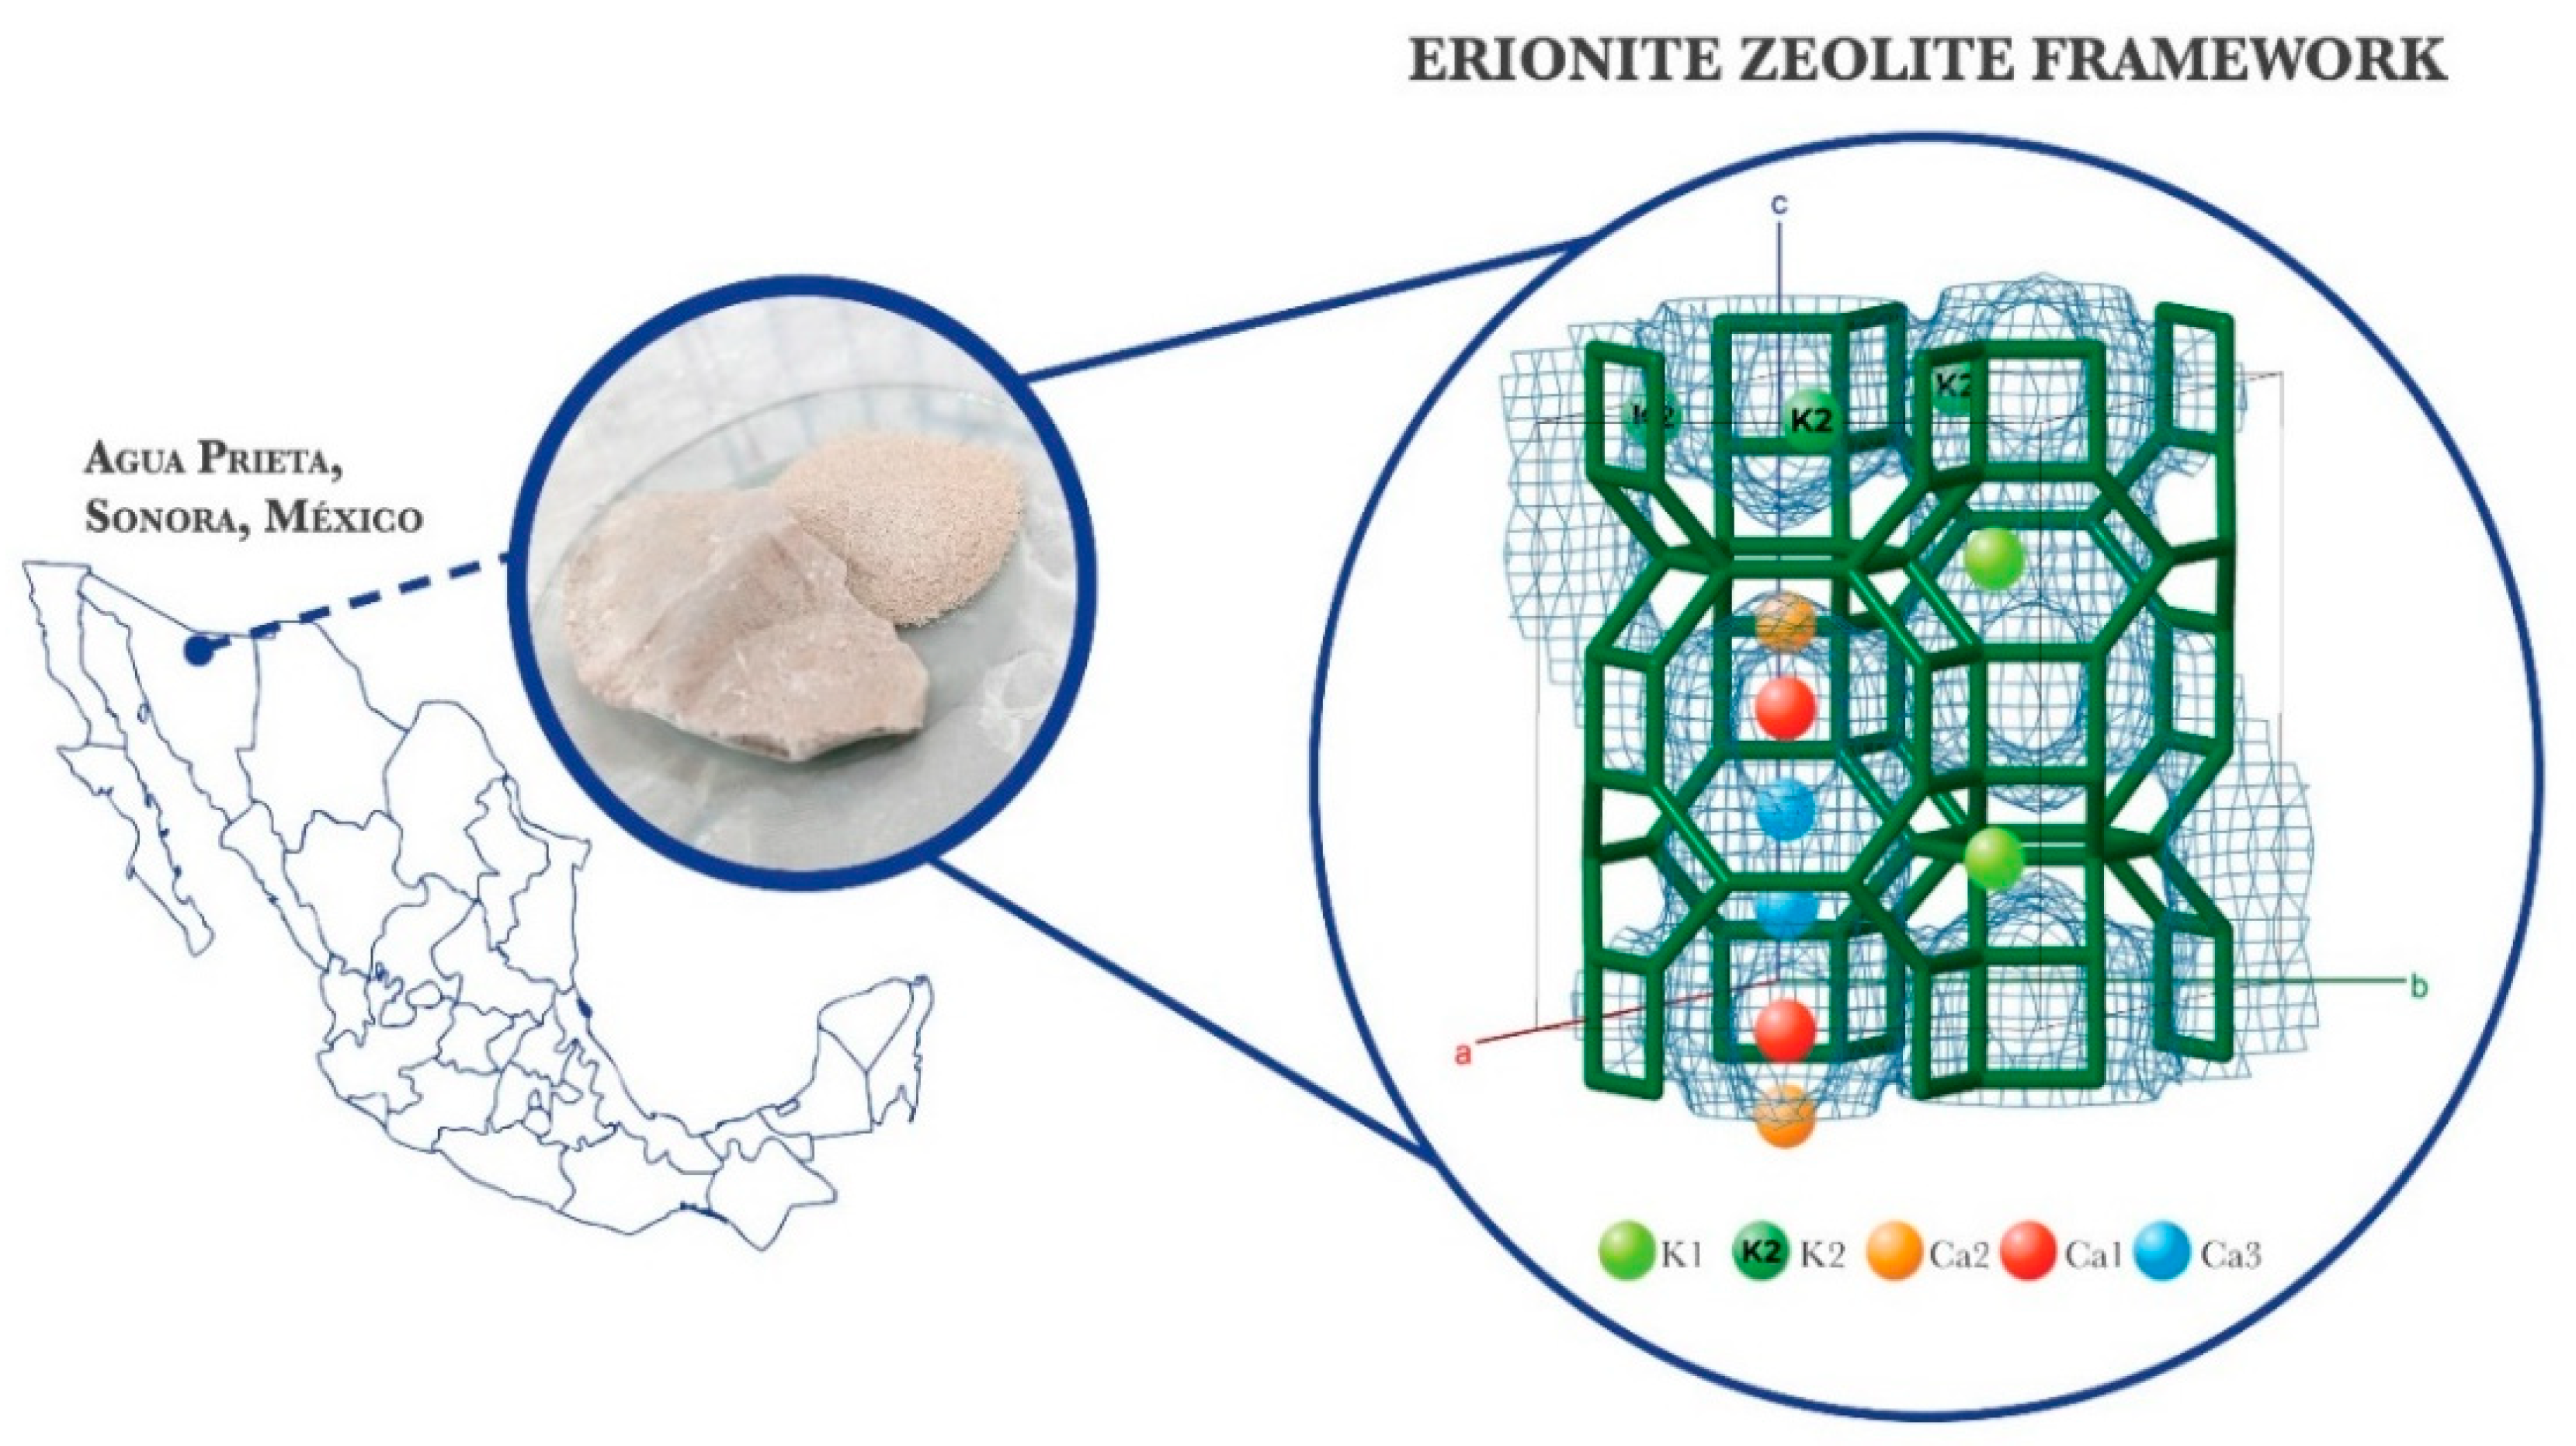
2.1. Samples Description

The natural erionite studied in this work was collected in Agua Prieta, Sonora (Mexico). The sample was ground and sieved with a 60–80 mesh until about 100 g was obtained. For each treatment, 10 g of zeolite were used, which were packed in an elution column where the exchange treatment was carried out. The cation exchange treatments consisted of the addition of one of the three different salts (NaCl, CaCl2 and MgCl2) and consecutive washes with distilled water. Three samples were obtained for each salt used at one, two and three contact cycles of 250 mL 0.01 N. The total remotion of the Cl ion was confirmed using AgNO3 as an indicator. Finally, samples were dried at room temperature. It should be noted that the efficacy and use of inorganic salts such as chlorides is well known and has been reported in numerous research works [44,45,46]. The concentration and contact volumes used in this project were selected according to the results obtained in the application of different experimental treatments to different types of natural zeolites in the “Zeolite Research Department” ICUAP, BUAP.
The samples are identified by the following nomenclature: the ERI prefix is used to denote erionite followed by the exchanged cation (Na, Ca, Mg) and the treatment number (1, 2, 3), i.e., ERINa3. Pristine erionite has been labelled ERIN (N = natural). The porosity and the adsorption capacity of CO2, CH4 and H2 from both pristine and ion-exchanged samples were evaluated in previous works [38,42]. Results showed that ERINa3, EriCa2 and EriMg2 samples (see Supplementary Materials) have the best textural properties and adsorption capacity compared to the ion-exchanged analogue ones. Consequently, in this work, these samples were investigated from the chemical and structural point of view. In addition, the pristine sample was studied for comparison purposes.

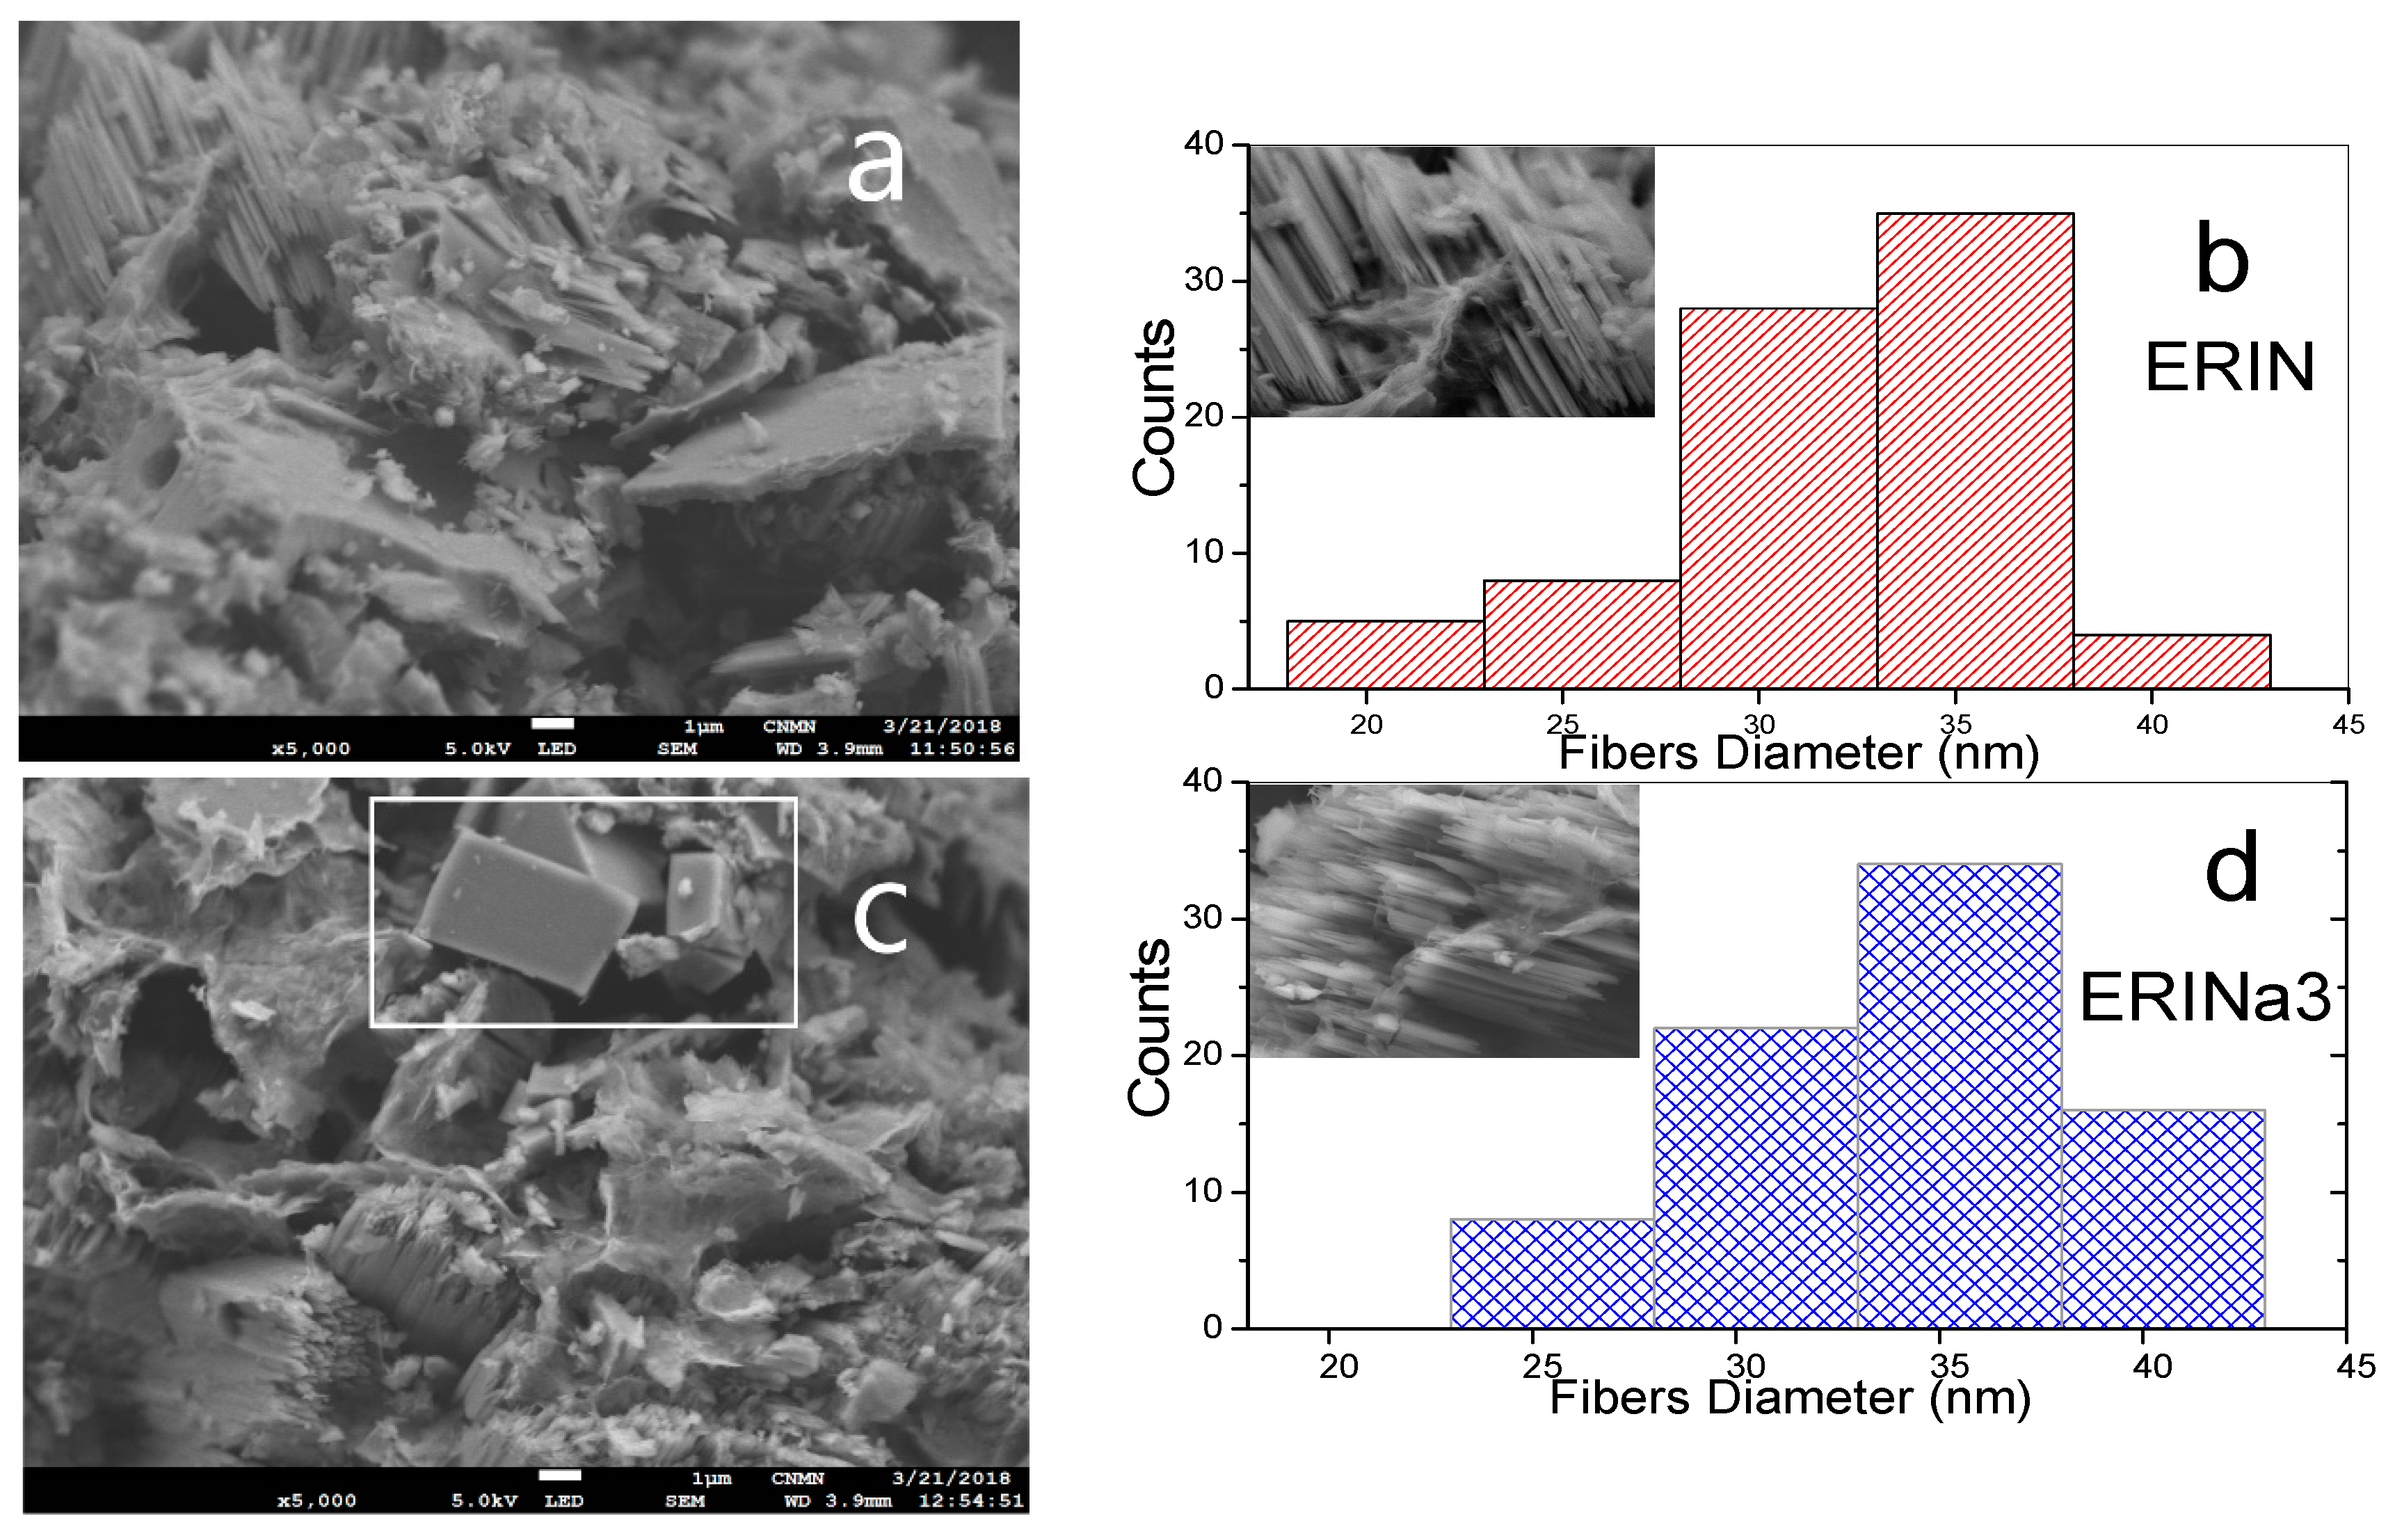
2.2. High Resolution Scanning Electron Microscopy (HR-SEM)

The fibers morphology was analyzed with a JEOL HR-SEM instrument, model JSM-7800F (JEOL USA, Inc., Peabody, MA, USA) at 5 kV. Erionite samples were mounted on a stub holder and coated with Au. Additionally, fiber diameters were measured using the Image J-1.54u software on micrographs at magnifications of 35,000× and a scale of 100 nm.

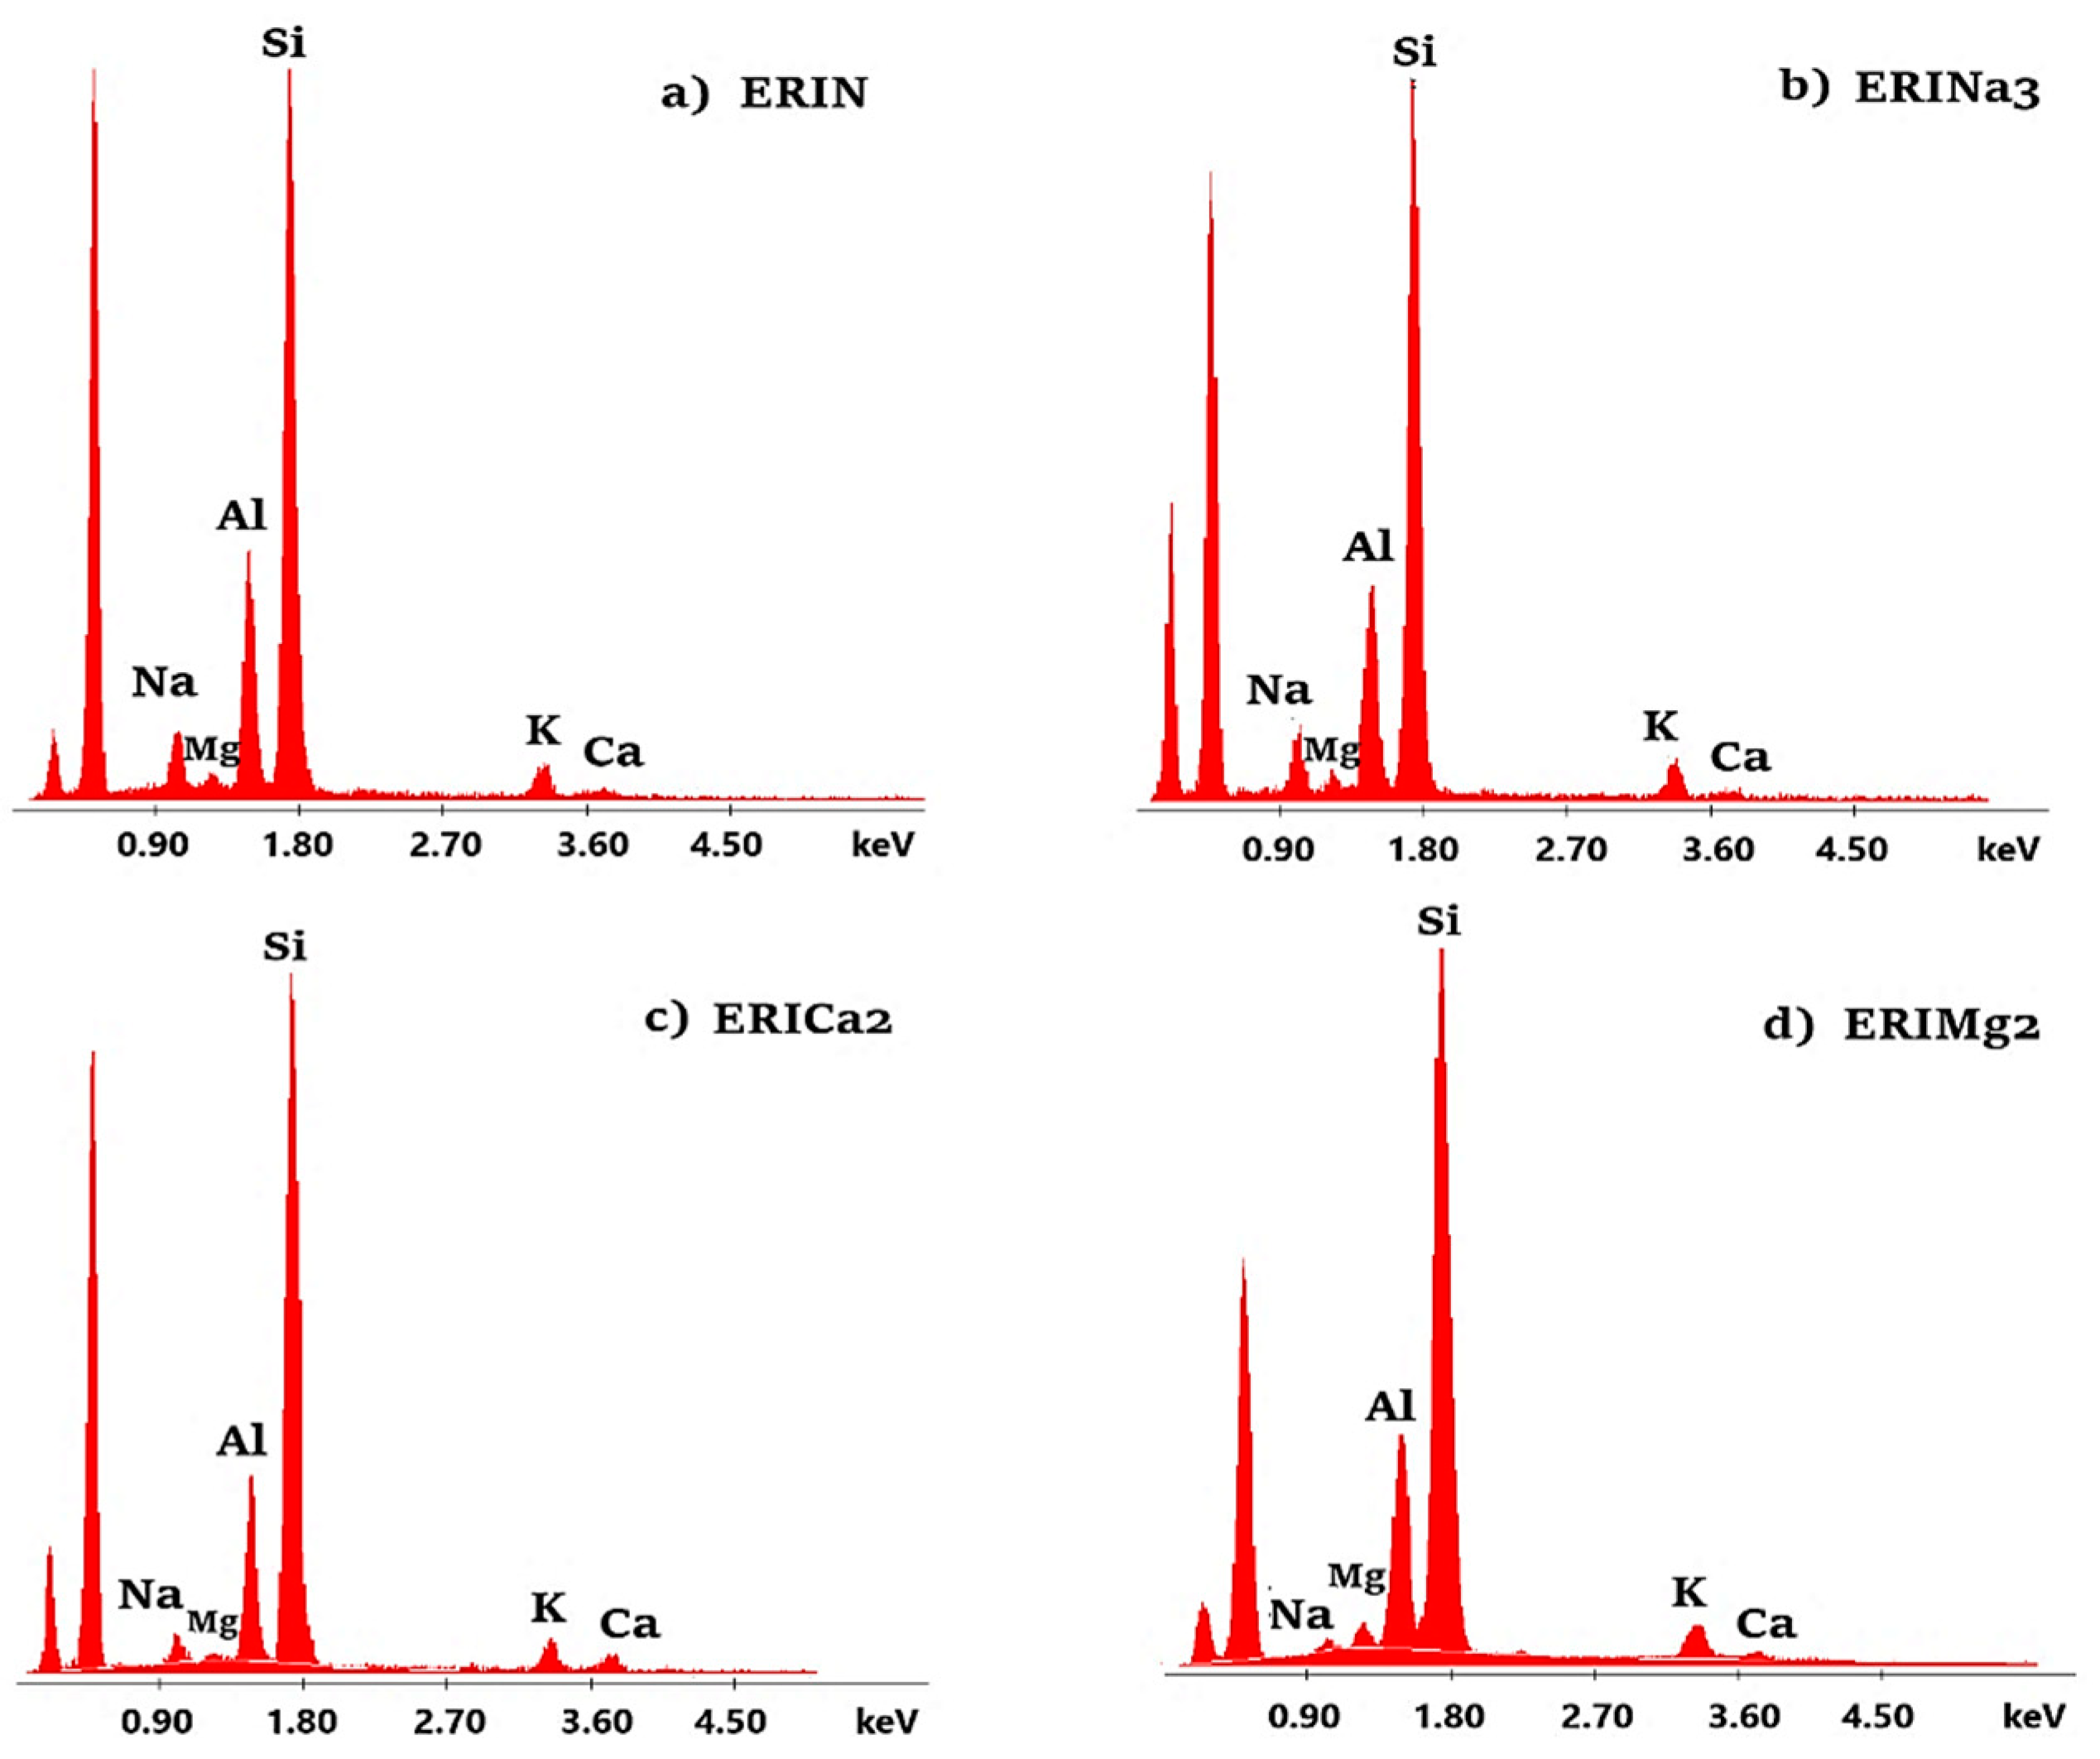
2.3. Scanning Electron Microscopy with Energy Dispersive X-ray Analysis (SEM-EDX)

The micro-chemical characterization was performed using a Quanta 400 SEM (FEI, Hillsboro, OR, USA) equipped with an EDX Genesis EDS system following the procedures described in [47]. Operating conditions were: 15 kV accelerating voltage, 11 mm working distance, 0° tilt angle. Chemical data were collected at least at 6 analytical points. The final crystal chemical formula was calculated, after renormalization of the chemical analyses hypothesizing a water content of 18.5 wt.% (corresponding to ca. 30 atoms per formula unit, apfu), on the basis of 36 (Si + Al + Fe(III)) apfu. Both the balance error formula E% [48] and the K content filter [37] were used for the selection of the positive analyses.

2.4. X-ray Powder Diffraction (XRPD)

X-ray powder diffraction data were collected in transmission mode, θ/θ geometry, using a Bruker AXS D8 Advance (Bruker AXS, Karlsruhe, Germany). Samples were charged in 0.7 mm diameter borosilicate glass capillaries and mounted on a goniometer head. The instrument was fitted with incident beam focusing Göbel mirrors and a position sensitive detector (PSD) VÅntec-1. Diffraction patterns were measured in the 6°–145° 2θ/angular range, 0.022° 2θ step-size and 10 s counting time. Preliminary analysis of the data indicated that the samples consisted of mixtures of erionite, chabazite, clinoptilolite, albite and quartz plus minor clay minerals (possibly montmorillonite). Before performing X-ray powder diffraction (XRPD) analysis, pristine erionite was subjected to a gravimetric enrichment treatment following the procedure indicated in reference [36]. Analysis of pristine erionite sample was performed not only for the as-is material but also for the fraction sedimented after 60 s and 1 h in order to find the best experimental conditions. The maximum, albeit minor, enrichment was found in the case of the fraction sedimented after 1h and therefore only those data will be presented in this work. Quantitative phase analysis (QPA) and erionite structure refinements were performed by the Rietveld method using Topas V6 [49] and the Fundamental Parameters Approach [50] to describe the peak shape. Starting structural data of the various minerals were: erionite-Na [37], chabazite [51], clinoptilolite [52], albite [53], quartz [54]. Owing to the absence of a proper structural model for montmorillonite, its minor contribution to the pattern was modelled using single peaks located at the relevant 2θ values (ca. 19.7°, 21.7°, 35.0°, 51.5°, 61.5°, 67.7°, 76.5° 2θ) consistent with a hexagonal a = 5.16 Å c = 14.43 Å lattice. Therefore, quantification of clay minerals was not performed but a rough estimate, based on relative peak intensities, points to a content <5 wt.%. In the case of erionite, fractional coordinates and site occupancies of both EF cation and H2O molecule sites were refined. Cell parameters were refined for erionite and chabazite, the most abundant phases in the mixture. Coherently with the morphology of the samples, as disclosed by HR-SEM, an anisotropic broadening model was used to describe the peak shape of erionite. Absorption correction was modelled using the formalism of Sabine et al. [55] and the preferred orientation was modelled using spherical harmonics (8th-order, six refinable parameters) by selecting the number of appropriate terms as suggested in reference [56]. CIF files of the pristine and cation-exchanged samples are available for download at the journal site.

3. Results

3.1. Morphology Characterization

HR-SEM images of the pristine and Na-exchanged erionite zeolites are shown in Figure 2, in which a morphology of compacted elongated prisms is observed. The histograms presented in Figure 2b,d show no differences in the single fibril diameter, which mainly range between 27 and 37 nm. In addition, the presence of chabazite can be observed as a secondary phase (inset of Figure 2c). The morphology and chemical composition are different from that reported for the zeolitic material from Tierra Blanca de Abajo, Mexico [8], which is characterized by isolated fibers with diameters ranging from 200 to 500 nm and clinoptilolite as an accessory phase.

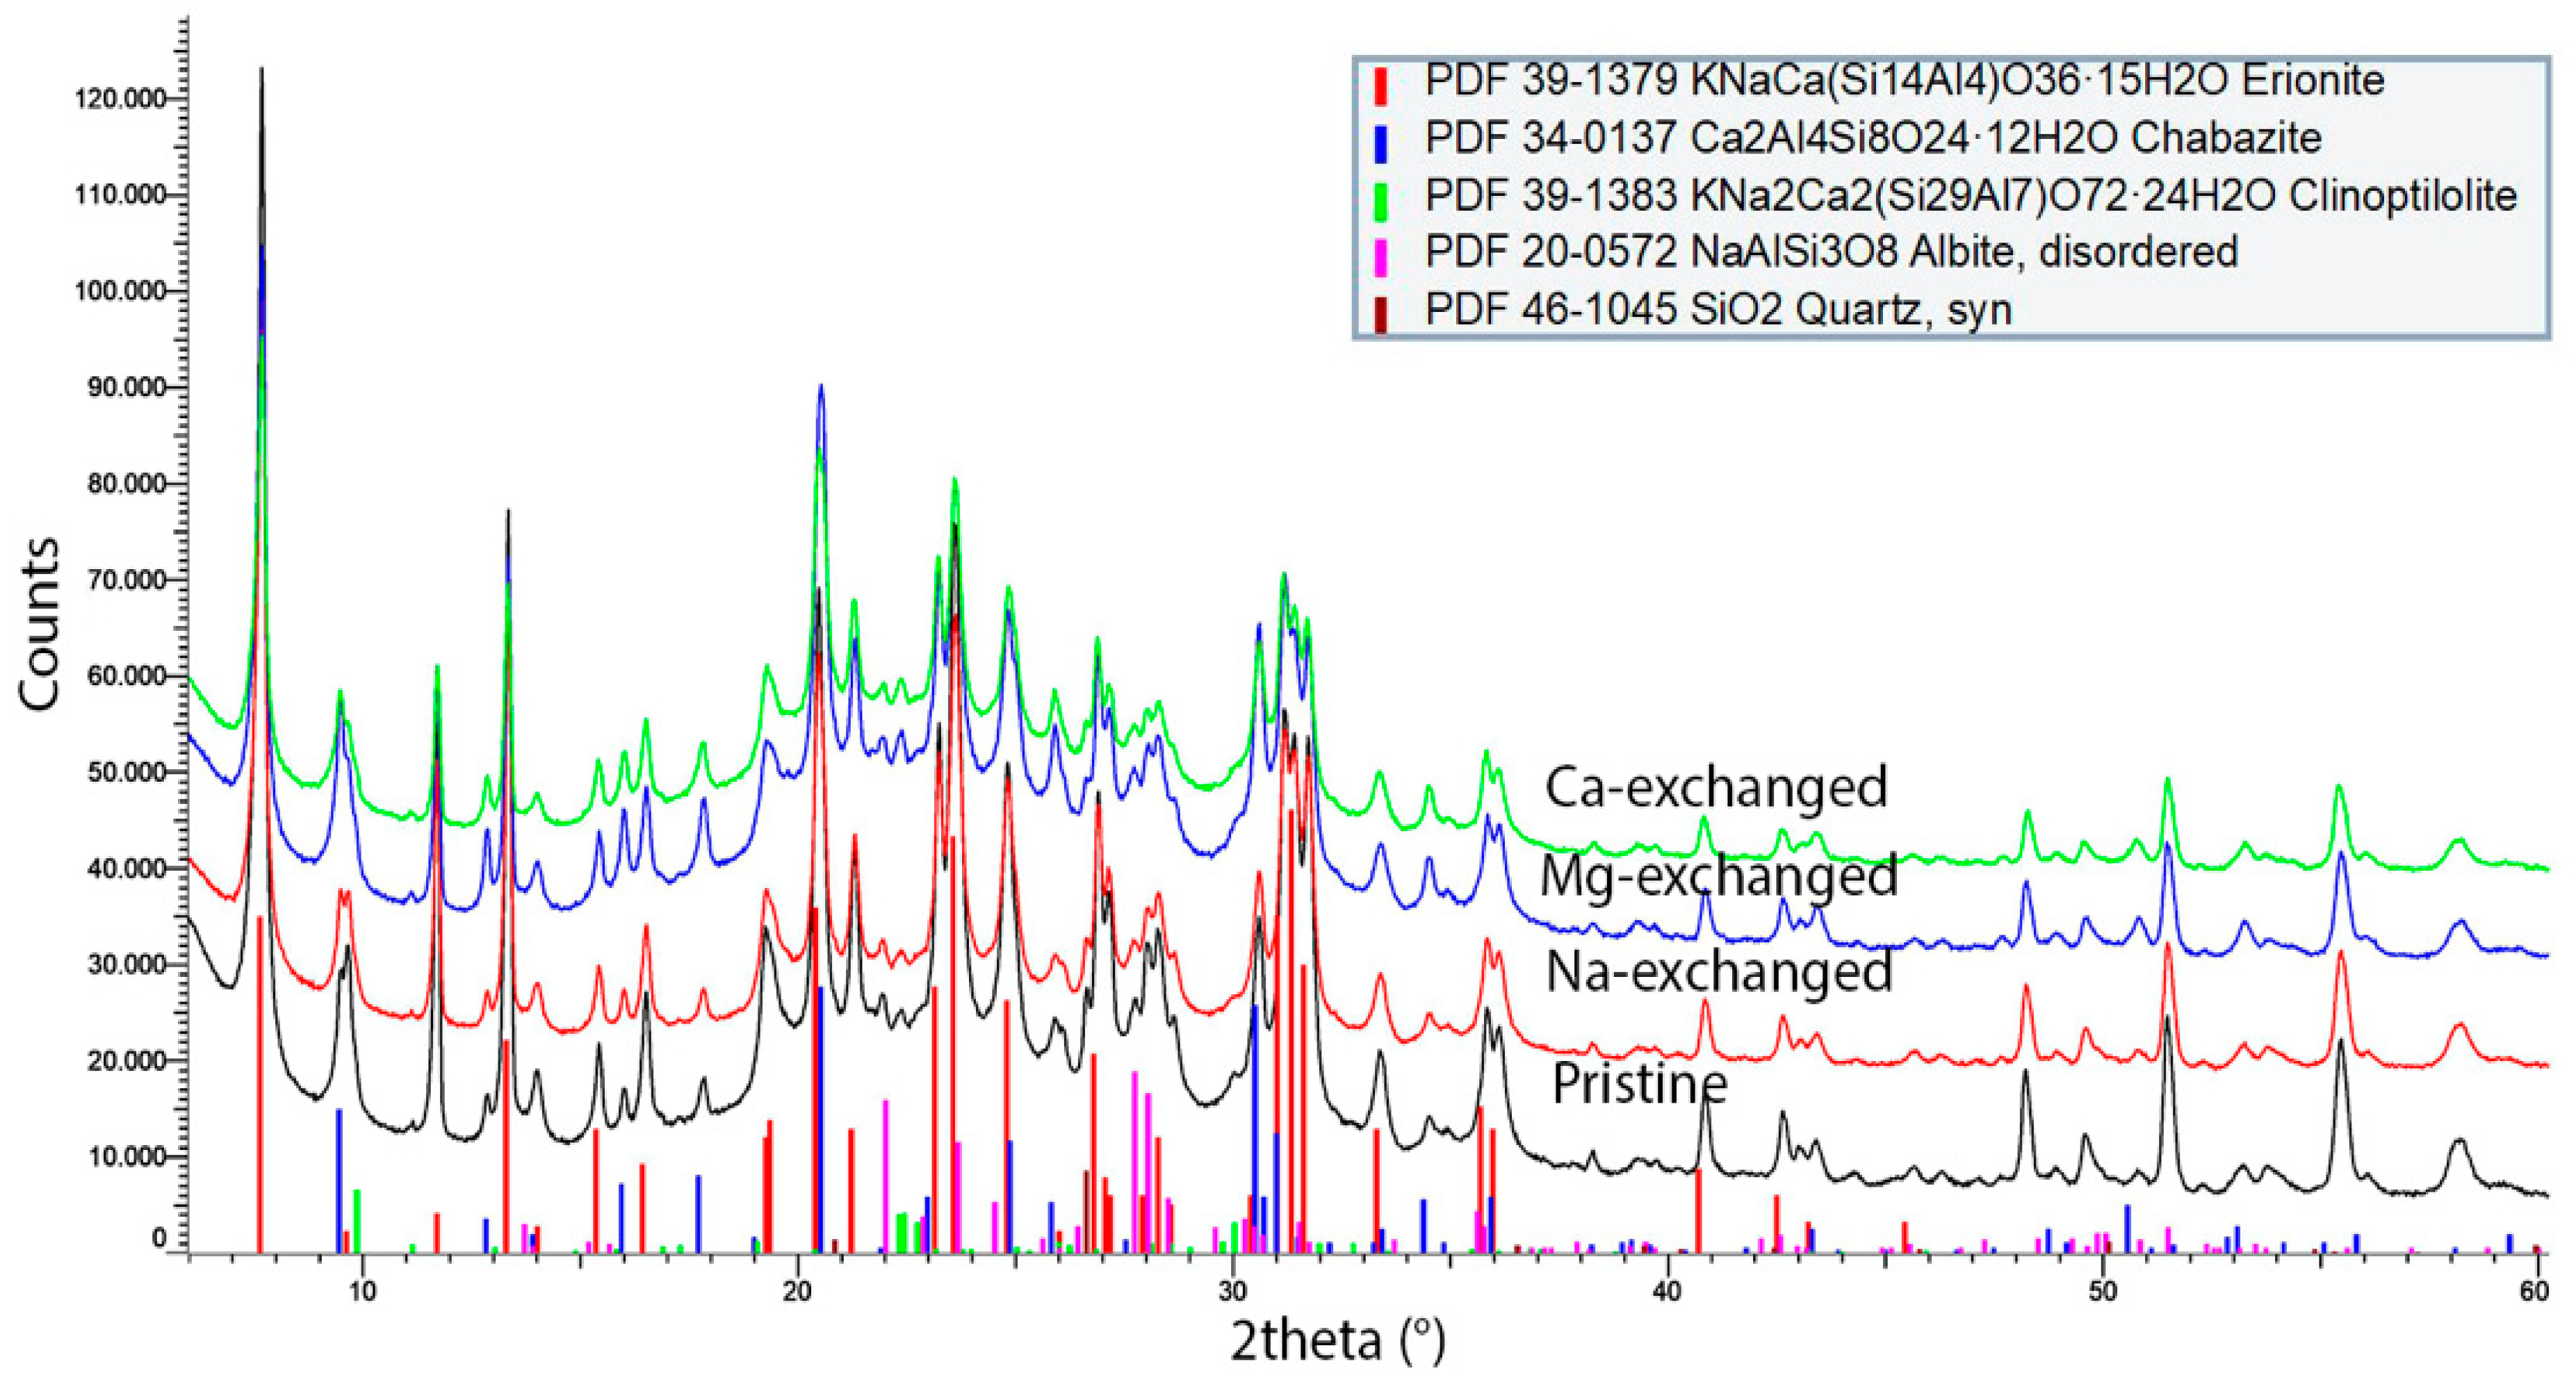
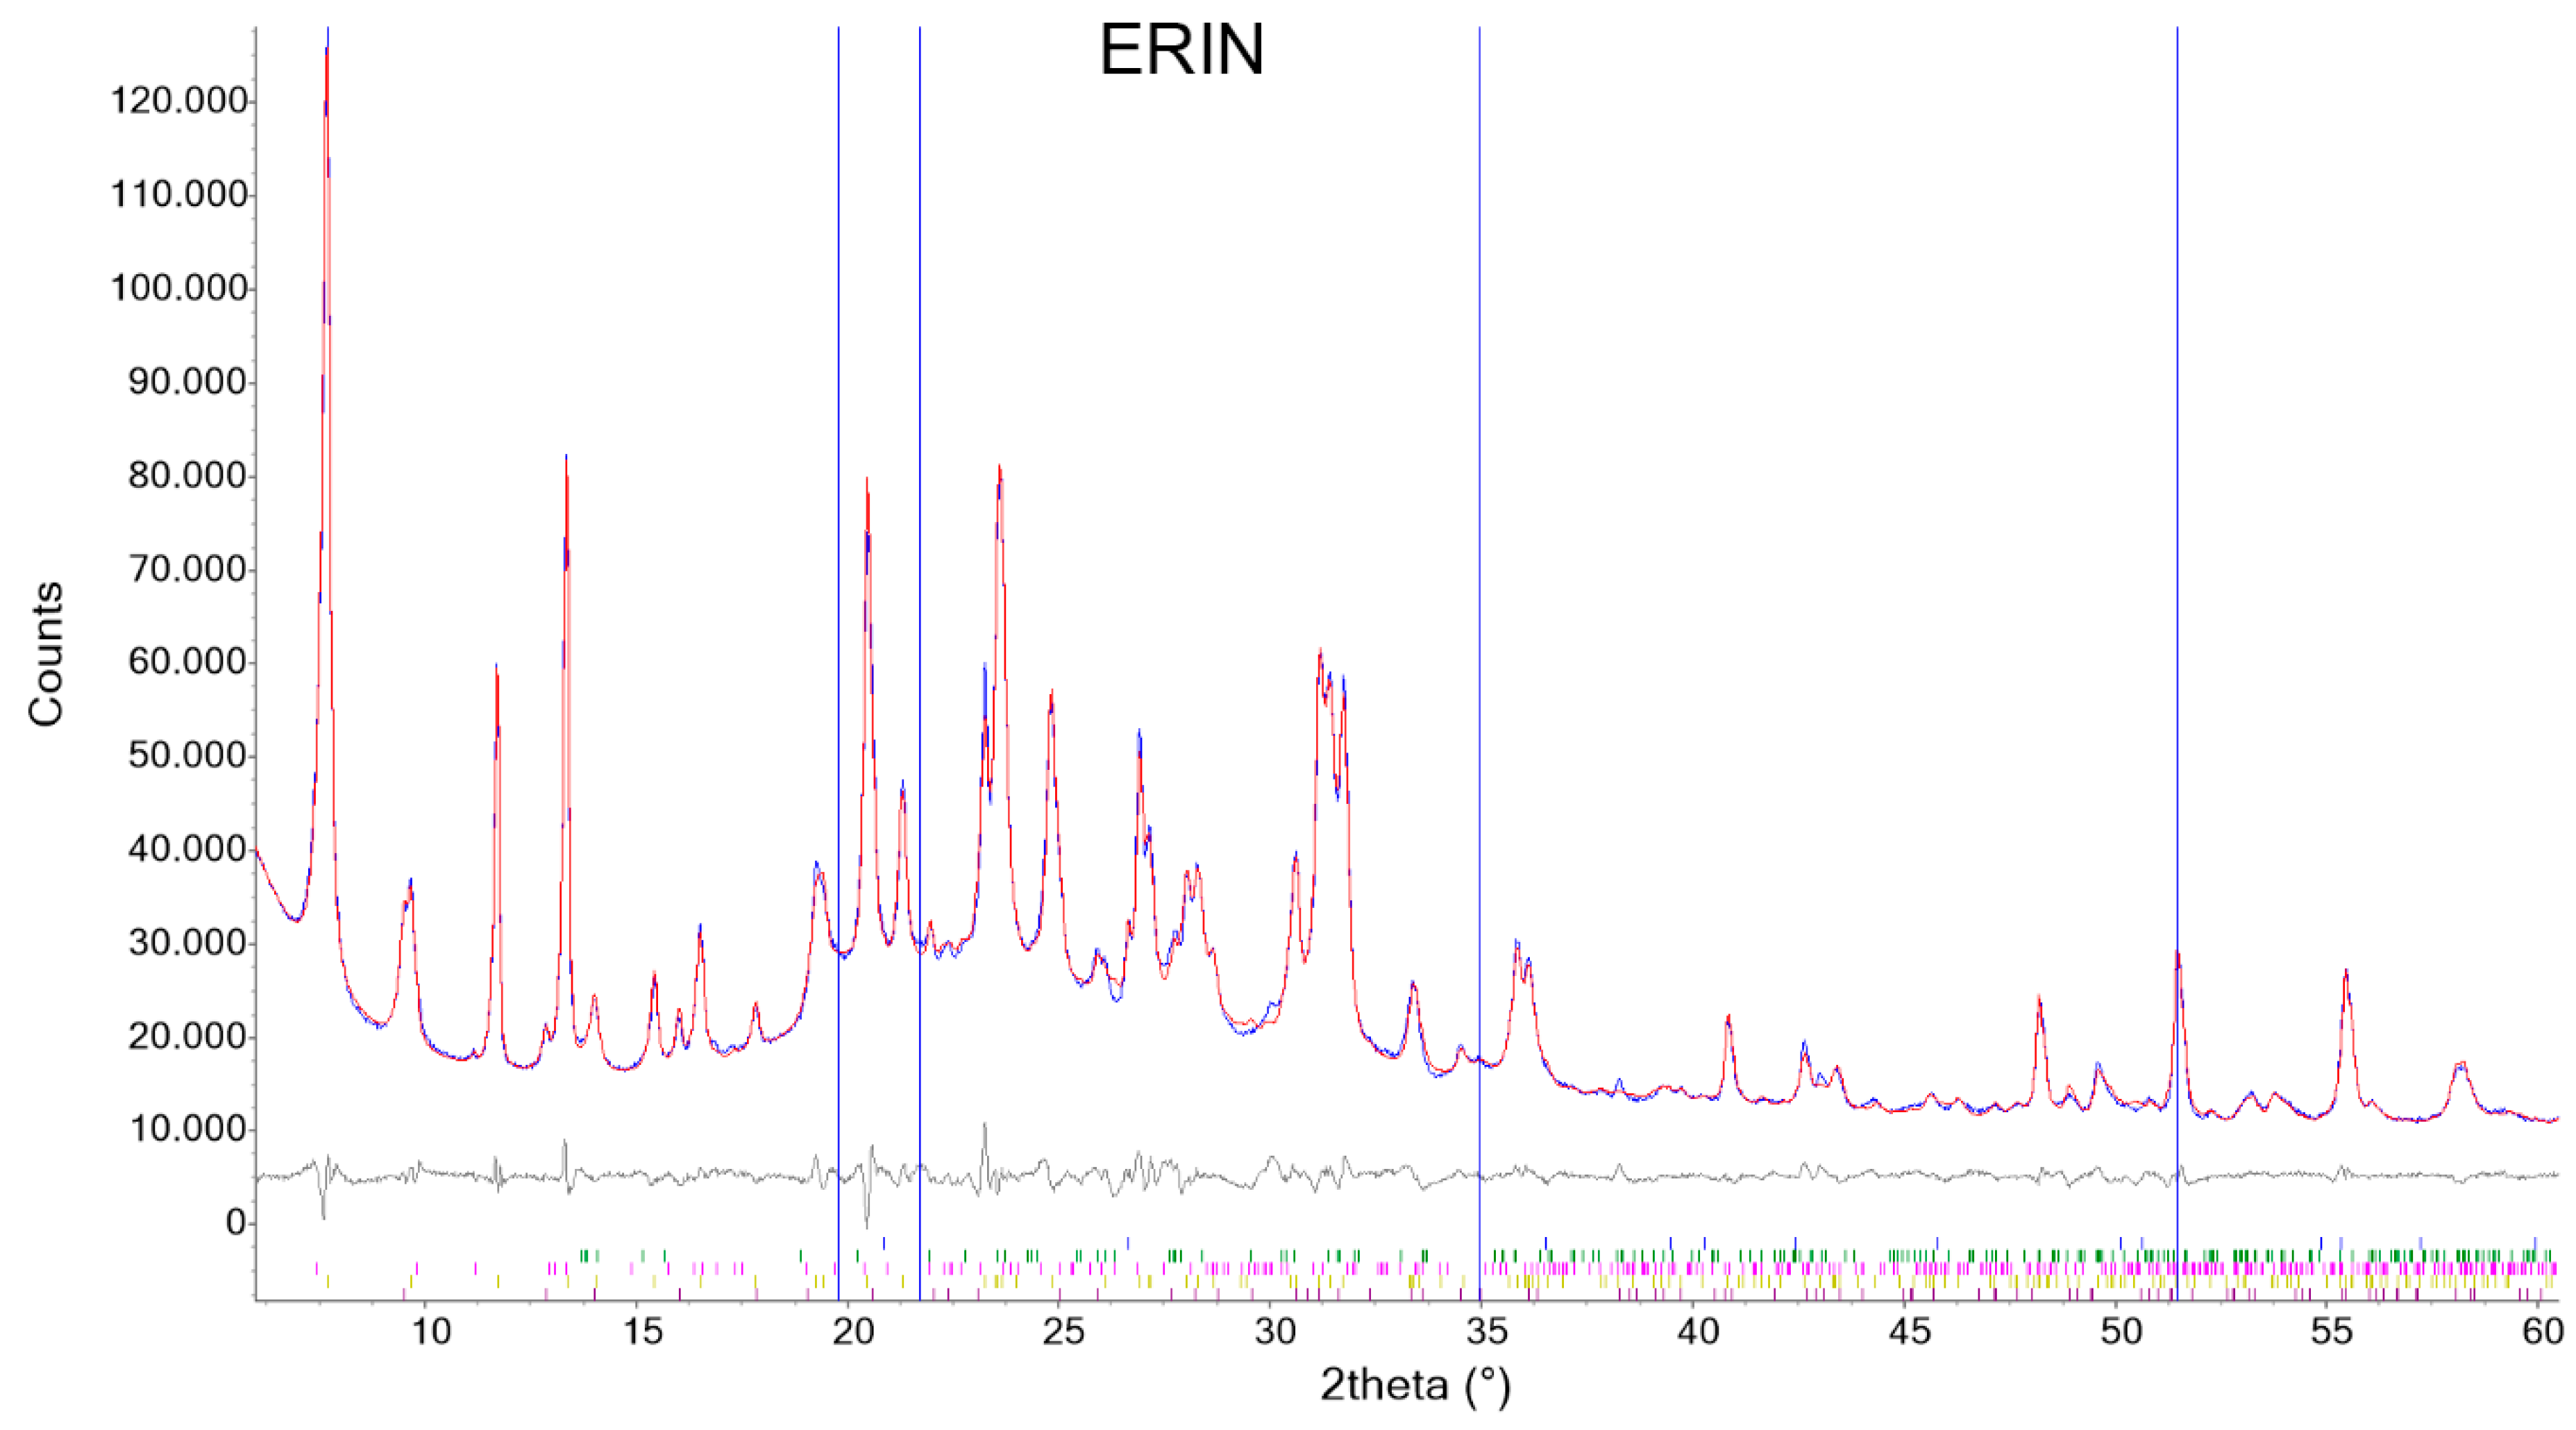
3.2. Chemical Structural Characterization of both Pristine and Ion-Exchanged Samples

The chemical compositions of both pristine and ion-exchanged fibers are shown in Figure 3, where the presence of Na, Ca, K, and Mg as extraframework cations is notable. Notably, no Fe was detected in the fibers, in agreement with previous results obtained on erionite fibers from Oregon, USA [36,37]. On this basis, the presence of Fe previously detected in the sample by X-ray fluorescence spectroscopy may be attributed to impurity phases [38], possibly clays.
The pristine sample can be classified as erionite-Na from the crystal-chemical formula (Na3.44K1.96Mg0.63Ca0.62)[Al8.21Si27.79O71.85]·29.63H2O. It must be pointed out that this sample has a different chemical composition with respect to the well-characterized erionite-Na samples from Oregon (Durkee and Rome localities), the main difference being the presence of some Ca as EF cation in the Mexican sample, resulting in a smaller M/(M + D) (where M = Na + K; D = Ca + Mg) ratio (Table 1). Moreover, erionite from Agua Prieta has a chemical composition different from that of erionite from the other reported occurrence in Mexico, Tierra Blanca (state of Guanajuato), where erionite-K occurs as a diagenetic product in altered Oligocene-Miocene rhyolitic tuffs [8].
The chemical analysis of the fibers suspended in the NaCl, CaCl2 and MgCl2 solutions highlighted that the ion-exchange process was successfully performed only for Ca and Mg cations. Notably, the unchanged chemistry of the NaCl-treated fibers was expected, since the lowest selectivity of Na among all the more common alkali or alkali–earth metal elements found in erionite [44]. Moreover, the two K+ ions per unit cell allocated within the cancrinite cages of erionite (Table 1) cannot be replaced by ion exchange due to steric hindrance [35,44].
The CaO and MgO content of the CaCl2- and MgCl2-treated samples increased, with respect to the pristine sample, from 1.21 to 2.58 wt.% (corresponding to 0.62 and 1.32 apfu) and from 0.88 to 1.48 wt.% (corresponding to 0.63 and 1.05 apfu), respectively. For both samples, a marked reduction in Na2O content was observed (from 3.44 apfu to 1.89 and 2.30 apfu, respectively), confirming that Na was the cation exchanged during fiber incubation in salt solutions. As a matter of curiosity, the Ca-exchanged sample should be more precisely classified as erionite-K. However, it must be pointed out that the difference between the most abundant K and Na EF cations are only within one standard deviation (Table 1). Notably, the small amount of loaded Mg is in agreement, within one standard deviation, with the maximum observed value of 0.8 apfu Mg ions hosted within the erionite cage in natural ERI samples [16]. Differently, the Ca content was more than double after sample incubation in the CaCl2 solution.
The experimental diffraction patterns of natural and exchanged erionites are shown in Figure 4, where the presence of erionite, accompanied with secondary phases as chabazite, clinoptilolite, quartz and albite, is visible. The obtained patterns of the exchanged erionites do not show significant variations in their characteristic signals with respect to the pristine sample.
Quantitative phase analysis (QPA) by the Rietveld method of the various samples is reported in Table 2 and an example of the conventional Rietveld plots is shown in Figure 5. This figure shows that relevant CHA reflections are independent, and they are not superimposed to those of ERI at low angles. Reflections at ca. 9° and 21° 2θ are part of doublets whose contribution to both phases are clearly assigned. As can be seen in Table 2, samples are characterized by compositional variability, as common in natural samples, in particular the erionite/chabazite ratio ranges from ca. 10 (ERIN) to ca. 2.5 (ERIMg2). This fact may be able to modulate the adsorption properties shown by the various samples.
Structural data are fully consistent with the chemical data arising from SEM-EDX analysis. In particular, the sample immersed in NaCl solution shows minimal differences in cell parameters, EF cations and H2O sites’ population with respect to the pristine material. No electron density was observed at K2, coherently with a K content close to 2 apfu, and at Ca3 (Table 3). The latter feature is not unusual as it has also been observed in erionite-K from Rome (USA) [15]. The average R = Si/(Si + Al) of 0.779(5) (Table 1) is consistent with a cell volume of 2292.5 Å3 according to the regression equation R = 0.0021 × Volume + 5.593 reported in [51]. The reported cell volumes of all analyzed samples are reasonably close to that value, indicating its minor dependence from the cation content. As far as the framework is referred to, average <T–O> bond distances were used to calculate the Al population at the two T1 and T2 tetrahedral sites using the Jones’ determinative curves [58] (Table 4). Although some variability is observed, caused by the extreme sensitivity of this parameter to very minor variations of <T–O>, the average values, which are more significant as obviously no modification of the Si/Al ratio has occurred as a result of the ionic-exchange process, return a R = Si/(Si + Al) of 0.774, which is in very good agreement with 0.779 from SEM-EDX chemical data. Similarly to the sample of acicular to fibrous erionite-Ca MB170 from Berici Hills, Northern Italy [59], aluminum is preferentially allocated at T1.
The cation exchange procedure does not significantly modify the position of the EF cation sites that experience only minor displacement along the c-axis, as testified by nearly constant z coordinates (Table 4). On the contrary, according to the miscellaneous data of the refinements presented in Table 3, the EF cation sites’ population is affected by the Mg and Ca exchange process and, in both cases, an increase in site scattering (s.s.) at Ca1 has been observed. It is not possible to easily define which is the site where Mg and Ca enter because no relevant modification of bond distances between cations and neighboring oxygen atoms or H2O has been observed. Mg has been consistently allocated at Ca1 [15,29,34,35,36], whereas Ca has been allocated at Ca1, Ca2 and Ca3. It is worth noting that the total EF cation site s.s. derived from the Rietveld refinements show different behaviors in comparison to that obtained from SEM-EDX. In fact, both ERIN and ERINa3 show a lower s.s. from Rietveld refinement, whereas the opposite is true for ERIMg2 and ERICa2. It is worth noting that the Mg2+ → 2 Na+ substitution scheme should ideally result in a reduction in s.s. (12 e vs 22 e), whereas the Ca2+ → 2 Na+ substitution scheme does not significantly modify the s.s. (20 e vs 22 e). There is no simple and univocal answer to this apparently strange behavior. Various concurring processes may be invoked to explain it. Alkali migration/volatilization has been reported to occur during SEM-EDX (and EMPA) analysis [50]; cations may be partly allocated at sites normally attributed to H2O [61] and correlation between displacement parameters and site population may modulate the observed EF s.s. In the present case, the total s.s. observed at H2O sites is in the 275–280 e range corresponding to ca. 34.5–35 H2O apfu that it is a little higher than the grand average calculated from reliable chemical data of 30 H2O apfu [18], albeit similar values have been reported [23]. Therefore, it could be hypothesized that a minor amount of cations could be hosted at OW sites. In the case of the Mg- and Ca-exchanged samples, it is worth noting that the content of erionite in mixture is significantly lower than that in ERIN and ERINa3. This fact, in turn, could be (partly) responsible for the higher s.s. at EF cationic sites, owing to correlations among parameters.
As a final remark, the cell parameters of the admixed chabazite (Table 3) show minor variation in the various samples and the cell volume increases from 812.33(15) Å3 in the case of ERIN to 812.83(11) Å3 for ERINa3, to 813.08(8) Å3 for ERIMg2, and to 814.05(10) Å3 for ERICa2. This behavior suggests the onset of some ion exchange in admixed chabazite too.

4. Conclusions

The detailed structure characterization, by the Rietveld method, of the pristine erionite-Na ERIN sample from Agua Prieta, Sonora, México indicated differences in terms of extra framework site population with respect to samples from classic localities. QPA testified an inhomogeneity of the material as the content of accessory phases (mainly chabazite) ranged from ca. 20 to 40 wt.%, albeit the content of zeolite was consistently close to 90 wt.%. The morphology observed is different from that found in known localities, while, regarding its chemical composition and structural modifications, the effectiveness of the exchange treatments was confirmed in the treatments carried out with calcium and magnesium, with sodium being consistently the cation exchanged. This fact is in agreement with the variation of the EF cation sites’ population, where an increase in the s.s. at Ca1 and of the a cell parameter was observed for ERIMg2 and ERICa2. Furthermore, the absence of iron inside the erionite structures is an important point since its role in the toxicity of these fibrous zeolites is well known. In addition, the data obtained will serve to correlate the structural modifications induced by ion exchange processes in future investigations of selective volumetric adsorption of CO2/CH4.

Supplementary Materials

CIF files of ERIN, ERIMg2, ERICa2 and EriNa3 are available online at https://www.mdpi.com/2075-163X/10/9/772/s1.

Author Contributions

Conceptualization, K.Q.-E., A.P.; Data curation, K.Q.-E., A.P., and P.B.; Formal analysis, K.Q.-E., A.P., and P.B.; Funding acquisition, P.B., and C.F.; Investigation, K.Q.-E., A.P., P.B., C.F., and M.E.-S.; Methodology, K.Q.-E., A.P., P.B., and M.Á.H.-E.; Resources, P.B., M.Á.H.-E., M.E.-S., and C.F. Supervision, M.Á.H.-E., M.E.-S., and C.F.; Visualization, K.Q.-E., A.P., P.B., and M.Á.H.-E.; Writing—original draft, K.Q.-E., A.P., and P.B.; Writing—review and editing, K.Q.-E., A.P., P.B., and M.Á.H.-E. All authors have read and agreed to the published version of the manuscript.

Funding

This research was funded by an international mobility scholarship—CONACYT, Technological development or innovation projects for IPN 2019 students and the academic body “Investigación en Zeolitas” CA-95 (PROMEP-SEP). Additional funding from MIUR PRIN 20173X8WA4 and Progetto Ateneo 2016_ is also acknowledged.

Conflicts of Interest

The authors declare no conflict of interest.

References

  1. McCusker, L.B.; Olson, D.H.; Baerlocher, C. Atlas of Zeolite Framework Types, 6th ed.; Elsevier: Amsterdam, The Netherlands, 2007. [Google Scholar] [CrossRef]
  2. Stocker, K.; Ellersdorfer, M.; Lehner, M.; Raith, J. Characterization and Utilization of Natural Zeolites in Technical Applications. BHM Berg- Und Hüttenmännische Monatshefte 2017, 162, 142–147. [Google Scholar] [CrossRef]
  3. Kròl, M. Natural vs synthetic zeolites. Crystals 2020, 10, 662. [Google Scholar] [CrossRef]
  4. Gottardi, G.; Galli, E. Natural Zeolites, Mineral and Rocks; Springer: Berlin/Heidelberg, Germany, 1985. [Google Scholar] [CrossRef]
  5. Marantos, I.; Christidis, G.E.; Ulmanu, M. Zeolite Formation and Deposits. In Handbook of Natural Zeolites; Inglezakis, V.J., Zorpas, A.A., Eds.; Bentham Science Publishers: Sharjah, United Arab Emirates, 2012; pp. 28–51. [Google Scholar]
  6. Gatta, G.D.; Lotti, P. Chapter 1-Systematics, crystal structures, and occurrences of zeolites. In Micro and Nano Technologies; Mercurio, M., Sarkar, B., Langella, A., Eds.; Elsevier: Amsterdam, The Netherlands, 2019; pp. 1–25. ISBN 978-0-12-814617-0. [Google Scholar]
  7. Quiroz, K.; Hernandez, M.A.; Portillo, R.; Rubio, E.; Petranovskii, V. Comparación de la capacidad de secuestro de CO2 en Clinoptilolita, Epistilbita, Erionita, Mordenita y Caolinita como constituyentes del suelo. Superf. Y Vacío 2016, 29, 55–61. [Google Scholar]
  8. Ortega-Guerrero, M.A.; Carrasco-Núñez, G. Environmental occurrence, origin, physical and geochemical properties, and carcinogenic potential of erionite near San Miguel de Allende, Mexico. Environ. Geochem. Health 2014, 36, 517–529. [Google Scholar] [CrossRef]
  9. Ortega-Guerrero, M.A.; Carrasco-Núñez, G.; Barragán-Campos, H.; Ortega, M.R. High incidence of lung cancer and malignant mesothelioma linked to erionite fibre exposure in a rural community in Central Mexico. Occup. Environ. Med. 2015, 72, 216–218. [Google Scholar] [CrossRef]
  10. Hernández, M.A.; Corona, L.; Rojas, F. Adsorption characteristics of natural erionite, clinoptilolite and mordenite zeolites from Mexico. Adsorption 2000, 6, 33–45. [Google Scholar] [CrossRef]
  11. Hernandez, M.A.; Rojas, F.; Portillo, R.; Salgado, M.A.; Rubio, E.; Ruiz, S. Creating nanoporosity in Na, Ca and Mg exchanged erionite zeolite. Int. J. Nanotechnol. 2016, 13, 28–43. [Google Scholar] [CrossRef]
  12. Sheppard, B.R.A.; Gude, A.J. Zeolites and Associated Authigenic Silicate Minerals in Tuffaceous Rocks of the Big Sandy Formation, Mohave County, Arizona. USGS Professional Paper 830; 1973. Available online: https://pubs.usgs.gov/pp/0830/report.pdf (accessed on 28 April 2020).
  13. Tschernich, R.W. Zeolites of the World; Geoscience Press: Phoenix, AZ, USA, 1992. [Google Scholar]
  14. Bargar, K.E.; Beeson, M.H.; Keith, T.E.C. Zeolites in Yellowstone National Park. Mineral. Rec. 1981, 12, 29–38. [Google Scholar]
  15. Ballirano, P.; Andreozzi, G.B.; Dogan, M.; Dogan, A.U. Crystal structure and iron topochemistry of erionite-K from Rome, Oregon, U.S.A. Am. Mineral. 2009, 94, 1262–1270. [Google Scholar] [CrossRef]
  16. Gualtieri, A.; Artioli, G.; Passaglia, E.; Bigi, S.; Viani, A.; Hanson, J.C. Crystal structure-crystal chemistry relationships in the zeolites erionite and offretite. Am. Mineral. 1998, 83, 590–606. [Google Scholar] [CrossRef]
  17. IZA. Commission of Natural Zeolites. Erionite. Available online: http://www.iza-online.org/natural/Datasheets/Erionite/erionite.htm (accessed on 11 February 2020).
  18. Coombs, D.S.; Alberti, A.; Armbruster, T.; Artioli, G.; Colella, C.; Galli, E.; Grice, J.D.; Liebau, F.; Mandarino, J.A.; Minato, H.; et al. Recommended nomenclature for zeolite minerals: Report of the subcommittee on zeolites of the International Mineralogical Association, Commission on new Minerals and Mineral names. Can. Mineral. 1997, 35, 1571–1606. [Google Scholar] [CrossRef]
  19. Dogan, A.U.; Dogan, M. Re-evaluation and re-classification of erionite series minerals. Environ. Geochem. Health 2008, 30, 355–366. [Google Scholar] [CrossRef] [PubMed]
  20. Sheppard, A.R.; Gude, A.J. Zeolitic authigenesis of tuffs inthe Ricardo Fromation, Kern Cpuntr, Sounthern California. USGS Prof. Pap. 1965, 525-D, D44–D47. [Google Scholar]
  21. Sheppard, R.A.; Gude, A. Chemical composition and physical properties of the related zeolites offretite and erionite. Am. Mineral. 1969, 54, 875–886. [Google Scholar]
  22. Vezzalini, G.; Quartieri, S.; Rossi, A. Occurrence of zeolites from Northern Victoria Land (Antarctica). Terra Antart. 1994, 1, 96–99. [Google Scholar]
  23. Passaglia, E.; Artioli, G.; Gualtieri, A. Crystal chemistry of the zeolites erionite and offretite. Am. Mineral. 1998, 83, 577–589. [Google Scholar] [CrossRef]
  24. Carbone, M.; Baris, Y.I.; Bertino, P.; Brass, B.; Comertpay, S.; Dogan, A.U.; Gaudino, G.; Jube, S.; Kanodia, S.; Partridge, C.R.; et al. Erionite exposure in North Dakota and Turkish villages with mesothelioma. Proc. Natl. Acad. Sci. USA 2011, 108, 13618–13623. [Google Scholar] [CrossRef] [Green Version]
  25. Baris, Y.I.; Sahin, A.A.; Ozesmi, M.; Kerse, I.; Ozen, E.; Kolacan, B.; Altinors, M.; Goktepeli, A. An outbreak of pleural mesothelioma and chronic fibrosing pleurisy in the village of Karain/Urgup in Anatolia. Thorax 1978, 33, 181–192. [Google Scholar] [CrossRef] [Green Version]
  26. Tekla, J.; Lakiss, L.; Valchev, V.; Tarach, K.A.; Jabłońska, M.; Girman, V.; Szymocha, A.; Kowalczyk, A.; Góra-Marek, K.; Gilson, J.P. Increasing the catalytic performance of erionite by hierarchization. Microporous Mesoporous Mater. 2020, 299, 110088. [Google Scholar] [CrossRef]
  27. Ballirano, P.; Bloise, A.; Gualtieri, A.F.; Lezzerini, M.; Pacella, A.; Perchiazzi, N.; Dogan, M.; Dogan, A.U. The crystal structure of mineral fibres. In Mineral Fibres: Crystal Chemistry, Chemical-Physical Properties, Biological Interaction and Toxicity; Gualtieri, A.F., Ed.; European Mineralogical Union and Mineralogical Society of Great Britain & Ireland: London, UK, 2017; ISBN 978-09003056-65-6. [Google Scholar] [CrossRef]
  28. Staples, L.W.; Gard, J.A. The fibrous zeolite erionite; its occurrence, unit cell, and structure. Mineral. Mag. J. Mineral. Soc. 1959, 32, 261–281. [Google Scholar] [CrossRef]
  29. Alberti, A.; Martucci, A.; Galli, E.; Vezzalini, G. A reexamination of the crystal structure of erionite. Zeolites 1997, 19, 349–352. [Google Scholar] [CrossRef]
  30. Bonenfant, D.; Kharoune, M.; Niquette, P.; Mimeault, M.; Hausler, R. Advances in principal factors influencing carbon dioxide adsorption on zeolites. Sci. Technol. Adv. Mater. 2008, 9, 013007–013014. [Google Scholar] [CrossRef] [PubMed]
  31. Lozinska, M.M.; Mowat, J.P.S.; Wright, P.A.; Thompson, S.P.; Jorda, J.L.; Palomino, M.; Valencia, S.; Rey, F. Cation gating and relocation during the highly selective “trapdoor” adsorption of CO2 on univalent cation forms of zeolite Rho. Chem. Mater. 2014, 26, 2052–2061. [Google Scholar] [CrossRef]
  32. Shang, J.; Li, G.; Singh, R.; Xiao, P.; Liu, J.Z.; Webley, P.A. Determination of composition range for “molecular trapdoor” effect in chabazite zeolite. J. Phys. Chem. C 2013, 117, 12841–12847. [Google Scholar] [CrossRef]
  33. De Baerdemaeker, T.; De Vos, D. Trapdoors in zeolites. Nat. Chem. 2013, 5, 89–90. [Google Scholar] [CrossRef] [PubMed]
  34. Pacella, A.; Fantauzzi, M.; Atzei, D.; Cremisini, C.; Nardi, E.; Montereali, M.R.; Rossi, A.; Ballirano, P. Iron within the erionite cavity and its potential role in inducing its toxicity: Evidence of Fe (III) segregation as extra-framework cation. Microporous Mesoporous Mater. 2017, 237, 168–179. [Google Scholar] [CrossRef]
  35. Pacella, A.; Cremisini, C.; Nardi, E.; Montereali, M.R.; Pettiti, I.; Ballirano, P. The mechanism of iron binding processes in erionite fibres. Sci. Rep. 2017, 7, 1319. [Google Scholar] [CrossRef] [Green Version]
  36. Ballirano, P.; Cametti, G. Minerals in the human body. Crystal chemical and structural modifications of erionite fibers leached with simulated lung fluids. Am. Mineral. 2015, 100, 103–112. [Google Scholar] [CrossRef]
  37. Cametti, G.; Pacella, A.; Mura, F.; Rossi, M.; Ballirano, P. New morphological, chemical, and structural data of woolly erionite-Na from Durkee, Oregon, U.S.A. Am. Mineral. 2013, 98, 2155–2163. [Google Scholar] [CrossRef]
  38. Quiroz-Estrada, K.; Hernández, M.Á.; Felipe-Mendoza, C.; Santamaría-Juárez, J.D.; Petranovskii, V.; Rubio, E. Critical admission temperature of H2 and CH4 in nanopores of exchanged ERI zeolites. Nanomaterials 2019, 9, 160. [Google Scholar] [CrossRef] [Green Version]
  39. Salinas-Pedroza, M.G.; Olguín, M.T. Thorium removal from aqueous solutions of Mexican erionite and X zeolite. J. Radioanal. Nucl. Chem. 2004, 260, 115–118. [Google Scholar] [CrossRef]
  40. Moreno-Gutiérrez, B.Y.; Olguín, M.T. Mercury removal from aqueous and organo-aqueous solutions by natural Mexican erionite. J. Radioanal. Nucl. Chem. 2003, 256, 245–348. [Google Scholar] [CrossRef]
  41. Bosch, P.; Caputo, D.; Liguori, B.; Colella, C. Safe trapping of Cs in heat-treated zeolite matrices. J. Nucl. Mater. 2004, 324, 183–188. [Google Scholar] [CrossRef]
  42. Hernandez, M.A.; Pestryakov, A.; Portillo, R.; Salgado, M.A.; Rojas, F.; Rubio, E.; Ruiz, S.; Petranovskii, V. CO2 Sequestration by Natural Zeolite for Greenhouse Effect Control. Procedia Chem. 2015, 15, 33–41. [Google Scholar] [CrossRef] [Green Version]
  43. IARC Working Group on the Evaluation of Carcinogenic Risk to Humans. Arsenic, Metals, Fibres and Dusts; Chemical Agents and Related Occupations; IARC Monographs on the Evaluation of Carcinogenic Risks to Humans; International Agency for Research on Cancer: Lyon, France, 2011; Volume 100 C, Available online: https://www.ncbi.nlm.nih.gov/books/NBK304375 (accessed on 30 April 2020).
  44. Sherry, H.S. Ion-Exchange Properties of the Natural Zeolite Erionite. Clays Clay Miner. 1979, 27, 231–237. [Google Scholar] [CrossRef]
  45. Lewis, M.A.; Fischer, D.F.; Smith, L.J. Salt-Occluded Zeolites as an Immobilization Matrix for Chloride Waste Salt. J. Am. Ceram. Soc. 1993, 76, 2826–2832. [Google Scholar] [CrossRef]
  46. Santiago, O.; Walsh, K.; Kele, B.; Gardner, E.; Chapman, J. Novel pre-treatment of zeolite materials for the removal of sodium ions: Potential materials for coal seam gas co-produced wastewater. Springerplus 2016, 5, 571. [Google Scholar] [CrossRef] [Green Version]
  47. Pacella, A.; Ballirano, P.; Cametti, G. Quantitative chemical analysis of erionite fibres using a micro-analytical SEM-EDX method. Eur. J. Mineral. 2016, 28, 257–264. [Google Scholar] [CrossRef]
  48. Passaglia, E. The Crystal Chemistry of Chabazites. Am. Mineral. 1970, 55, 1278–1301. [Google Scholar]
  49. General Profile and Structure Analysis Software for Powder Diffraction Data; Bruker AXS: Karlsruhe, Germany, 2016.
  50. Cheary, R.W.; Coelho, A. Fundamental parameters approach to x-ray line-profile fitting. J. Appl. Crystallogr. 1992, 25, 109–121. [Google Scholar] [CrossRef]
  51. Passaglia, E.; Ferro, O. Occurrence and crystal structure of magnesian chabazite. Stud. Surf. Sci. Catal. 2002, 142, 1729–1735. [Google Scholar] [CrossRef]
  52. Alberti, A. The crystal structure of two clinoptilolites. Tschermaks Mineral. Und Petrogr. Mitt. 1975, 22, 25–37. [Google Scholar] [CrossRef]
  53. Meneghinello, E.; Alberti, A.; Cruciani, G. Order-disorder process in the tetrahedral sites of albite. Am. Mineral. 1999, 84, 1144–1151. [Google Scholar] [CrossRef]
  54. Le Page, Y.; Donnay, G. Refinement of the crystal structure of low-quartz. Acta Crystallogr. Sect. B 1976, 32, 2456–2459. [Google Scholar] [CrossRef]
  55. Sabine, T.M.; Hunter, B.A.; Sabine, W.R.; Ball, C.J. Analytical Expressions for the Transmission Factor and Peak Shift in Absorbing Cylindrical Specimens. J. Appl. Crystallogr. 1998, 31, 47–51. [Google Scholar] [CrossRef]
  56. Ballirano, P. Effects of the choice of different ionization level for scattering curves and correction for small preferred orientation in Rietveld refinement: The MgAl2O4 test case. J. Appl. Crystallogr. 2003, 36, 1056–1061. [Google Scholar] [CrossRef] [Green Version]
  57. Ballirano, P.; Pacella, A.; Cremisini, C.; Nardi, E.; Fantauzzi, M.; Atzei, D.; Rossi, A.; Cametti, G. Fe (II) segregation at a specific crystallographic site of fibrous erionite: A first step toward the understanding of the mechanisms inducing its carcinogenicity. Microporous Mesoporous Mater. 2015, 211, 49–63. [Google Scholar] [CrossRef]
  58. Jones, J.B. Al–O and Si–O tetrahedral distances in aluminosilicate framework structures. Acta Crystallogr. Sect. B Struct. Crystallogr. Cryst. Chem. 1968, 24, 355. [Google Scholar] [CrossRef]
  59. Giordani, M.; Mattioli, M.; Ballirano, P.; Pacella, A.; Cenni, M.; Boscardin, M.; Valentini, L. Geological occurrence, mineralogical characterization, and risk assessment of potentially carcinogenic erionite in Italy. J. Toxicol. Environ. Health Part B Crit. Rev. 2017, 20, 81–103. [Google Scholar] [CrossRef]
  60. Young, R.A. Introduction to the Rietveld method. In The Rietveld Method; Young, R.A., Ed.; Oxford University Press: New York, NY, USA, 1993; pp. 1–38. [Google Scholar]
  61. Ballirano, P.; Pacella, A. Erionite-Na upon heating: Dehydration dynamics and exchangeable cations mobility. Sci. Rep. 2016, 6, 11786. [Google Scholar] [CrossRef] [Green Version]
Figure 1. Mexican erionite zeolite framework.
Minerals 10 00772 g001
Figure 2. HR-SEM images of erionite fibers: (a) ERIN—5000×, (b) Histogram of ERIN diameter, (c) ERINa3—5000×, (d) Histogram of ERINa3 diameter.
Minerals 10 00772 g002
Figure 3. SEM-EDX spectrums of erionite fiber samples: (a) ERIN (b) ERINa3, (c) ERICa2 and (d) ERIMg2.
Minerals 10 00772 g003
Figure 4. Experimental diffraction pattern of the various samples. Coloured vertical bars mark the position of the Bragg reflection of the various minerals.
Minerals 10 00772 g004
Figure 5. Magnified view (6°–60° 2θ) of the conventional Rietveld plots of the ERIN sample. Blue dots: Experimental pattern; red continuous: Calculated pattern; gray continuous: difference plot; vertical lines: position of the relevant reflections of clays.
Minerals 10 00772 g005
Table 1. SEM-EDX chemical analyses of the both pristine and ion-exchanged erionite fibers. Reference data: (C2013) [37] and (B2015) [57] for erionite-Na are reported for comparison purposes.
Oxides (wt.%)ERINERINa3ERICa2ERIMg2AverageC2013B2015
SiO258.00 (74)58.28 (102)59.04 (86)59.11 (98) 58.74 (84)60.06 (47)
Al2O314.51 (36)14.15 (51)13.83 (55)13.88 (86) 13.46 (45)12.81 (19)
Na2O3.70 (67)3.87 (64)2.04 (39)2.49 (35) 5.75 (1.15)4.03 (27)
K2O3.20 (37)3.24 (35)3.23 (25)3.41 (28) 3.22 (69)4.01 (42)
MgO0.88 (22)1.00 (18)0.78 (24)1.48 (32) 0.33 (28)0.59 (24)
CaO1.21 (34)1.04 (11)2.58 (39)1.13 (36) --
FeOn.d.n.d.n.d.n.d. --
H2O *18.5018.5018.5018.50 18.5018.50
Total100.00100.00100.00100.00 100.00100.00
Si27.79 (23)27.98 (32)28.20 (33)28.19 (47)28.04 (17)28.34 (14)28.76 (11)
Al8.21 (23)8.02 (32)7.80 (33)7.81 (47)7.96 (17)7.66 (14)7.24 (11)
Na3.44 (64)3.61 (62)1.89 (36)2.30 (33) 5.38 (1.17)3.75 (27)
K1.96 (24)1.99 (22)1.97 (15)2.08 (17) 1.99 (45)2.45 (27)
Mg0.63 (16)0.71 (14)0.55 (17)1.05 (23) 0.24 (20)0.42 (17)
Ca0.62 (18)0.54 (05)1.32 (20)0.58 (19) --
Fe---- --
O71.85 (15)72.04 (25)71.91 (06)71.92 (32) 72.09 (49)72.10 (14)
H2O29.63 (17)29.69 (26)29.54 (04)29.49 (19) 29.7729.60 (17)
E%3.8−0.92.32.2 −2.33.1
R0.772 (6)0.777 (9)0.783 (9)0.783 (13)0.779 (5)0.7870.799 (3)
M/(M + D)0.809 (46)0.817 (12)0.673 (41)0.728 (37) 0.9690.936 (27)
* Ideal content based on ca. 30H2O apfu. E% = (Al − [Na + K) + 2(Mg + Ca + Sr + Ba + Fe2+)]/[(Na + K) + 2(Mg + Ca + Sr + Ba + Fe2+)] [23]; R = Si/(Si + Al); M = Na + K; D = ƩCa + Mg + Mn. n.d. = not determined.
Table 2. QPA of the various samples. Clays were observed in all samples but were not quantified owing to the absence of an adequate structural model (see text). The content has been estimated to be similar in all samples and <5 wt.% from visual evaluation of the intensity of the relevant reflections.
PhasesERINσERINa3σERIMg2σERICa2σ
Erionite85.70.383.00.366.40.468.10.4
Chabazite8.80.311.80.327.90.426.80.4
Albite3.310.092.890.092.600.092.300.10
Clinoptilolite1.400.091.620.092.630.102.370.11
Quartz0.740.030.620.020.350.030.440.03
Clays> > > >
Table 3. Miscellaneous data of the Rietveld refinements including agreement indices, cell parameters of erionite and coexisting chabazite, site scattering (s.s.) at both extra framework (EF) and H2O sites. Statistical indicators as defined in Young (1993) [60].
Statistical IndicatorsERINσERINa3σERIMg2σERICa2σ
Rwp2.38 2.10 2.13 1.94
Rp1.67 1.53 1.56 1.42
χ23.08 2.43 2.54 2.23
DWd0.30 0.41 0.43 0.48
RBragg erionite0.95 0.70 0.56 0.62
Cell parameters erionite
a (Å)13.24690.000213.24700.000213.24460.000313.25530.0003
C (Å)15.08950.000415.08810.000415.09050.000515.08030.0005
V (Å3)2293.170.102292.970.102292.530.132294.660.13
Cell parameters chabazite
a (Å)9.36040.00069.36240.00049.36360.00039.36650.0004
α(°)94.4410.00694.4460.00594.4640.00394.4140.004
V (Å3)812.330.15812.830.11813.080.08814.040.10
EF site scattering s.s. (e)
Ca119.70.721.30.727.31.035.10.9
Ca232.20.731.80.732.01.027.11.0
Ca30.00.00.00.00.00.00.00.0
K138.00.038.00.038.00.038.00.0
K20.00.00.00.00.00.00,00.0
Total cat. s.s. refinement89.91.491.01.497.31.9100.21.9
Total cat. s.s. from SEM-EDX95.1 96.8 89.0 91.4
H2O sites s.s. (e)
OW76.31.38.52.27.61.55.92.1
OW838.61.138.31.236.11.655.81.7
OW961.91.859.32.179.14.960.42.9
OW1071.92.072.82.149.75.478.32.5
OW1175.21.874.02.578.22.162.42.8
OW1222.32.024.22.327.32.717.73.2
Total s.s. H2O sites276.110.0277.112.4277.918.3280.515.2
H2O apfu34.51.334.61.634.72.335.11.9
Table 4. z coordinates of Ca1 and Ca2 cation sites; individual and average T–O bond distances; Al population at T1 [Al(1)] and T2 [Al(2)] tetrahedral sites as calculated from the Jones’ determinative curves [58] Alpop = 6.4116 x <T–O>-10.282. Tabulated values were multiplied by the site multiplicity (T1 = 24; T2 = 12).
Fractional CoordinatesERINσERINa3σERIMg2σERICa2σAverage
z Ca10.8140.0040.8230.0040.8250.0040.8240.003
z Ca20.10590.00190.1060.0020.1100.0030.1110.003
Bond distances
T1–O21.6430.0041.6420.0041.6360.0061.6490.006
T1–O41.6260.0041.6240.0041.6330.0051.6320.005
T1–O11.6290.0081.6570.0081.6500.0101.6130.012
T1–O31.6750.0071.6970.0071.6930.0091.6600.010
<T1–O>1.643 1.655 1.653 1.639 1.647
T2–O61.6110.0081.6110.0071.6220.0101.6310.011
T2–O11.6280.0071.6230.0081.6250.0101.6200.010
T2–O51.6240.0071.6150.0071.6110.0101.6320.011
<T2–O>1.623 1.618 1.621 1.626 1.622
Si/Al partition
Al(1) apfu6.09 7.90 7.59 5.36 6.74
Al(2) apfu1.47 1.10 1.32 1.70 1.40
Altot apfu7.56 9.00 8.91 7.06 8.13
Sitot apfu28.44 27.00 27.09 28.94 27.87
R = Si/(Si + Al)0.790 0.750 0.753 0.804 0.774
R from SEM-EDX0.772(6) 0.777(9) 0.783(9) 0.783(13) 0.779(5)

