Article

A Novel Pneumatic Planar Magnetic Separator for Magnetite Beneficiation: A Focus on Flowsheet Configuration

by
Emmanuel Baawuah
1,*,
Christopher Kelsey
2,
Jonas Addai-Mensah
1,3 and
William Skinner
1
1
University of South Australia, Future Industries Institute, Mawson Lakes, SA 5000, Australia
2
Kelsey Engineering Pty. Limited, 83A Proctor Road, Hope Forest, SA 5172, Australia
3
Department of Mining and Process Engineering, Namibia University of Science and Technology, Windhoek 13388, Namibia
*
Author to whom correspondence should be addressed.
Minerals 2020, 10(9), 759; https://doi.org/10.3390/min10090759
Submission received: 27 July 2020 / Revised: 25 August 2020 / Accepted: 26 August 2020 / Published: 27 August 2020

Abstract

:
In our previous studies, we investigated the performance of a novel pneumatic planar magnetic separator (PMS) for the dry beneficiation of a selected magnetite ore. In the present study, we have extended the studies on the PMS with the focus on investigating how various PMS processing flowsheet configurations influence its performance. The outcomes were subsequently compared with those of a Davis tube recovery (DTR) tester. The study demonstrated that the use of PMS in the dry beneficiation of magnetite ores is feasible, and operating the PMS in different flowsheet configurations positively influences the magnetite concentrate grade and purity. Finally, the study showed that the PMS performance compares well with that of DTR and can potentially replace DTR in operations that are carried out in arid regions.

1. Introduction

The global steel industry has heavily depended on iron (Fe) products sourced from high-grade hematite deposits [1]. The continuous increase in the demand for steel products has led to a progressive depletion of these hematite deposits, and therefore, the development of alternative sources of iron becomes necessary to sustain the current iron production capacity and meet future demands [2]. Magnetite ores have gained significant attention in the iron industry.
Magnetite is an iron oxide mineral found in metasedimentary and magmatic iron deposits [3]. It is generally black and has high magnetic properties. The latter property is exploited in the beneficiation of magnetite ores using low-intensity magnetic separation. Although magnetite stoichiometrically contains the highest iron (72.4 wt %) compared with all the other sources of iron, its low-grade ore state usually contains low iron—magnetite ores located in Australia usually contain iron grades between 14 and 45 wt % [4,5,6]. These ores are of low economic value in that state, and they invariably require significant upgrading to a higher-grade iron concentrate with accepted levels of impurities [7].
Whilst high-grade hematite ores can be readily upgraded into saleable concentrates through crushing, milling, concentration by screening, and/or through hydraulic or magnetic classification [4], magnetite ores require much complex and costly beneficiation for the following reasons. Current industrial magnetite beneficiation is carried out as a wet process, and therefore, they require large quantities of water. This becomes a major bottleneck for developing magnetite deposits that are located in arid regions such as Australia [2] and the Taklimakan desert in China [8]. The development of magnetite projects in such arid regions requires extensive water pumping infrastructure and desalination operations to provide potable water for their operations [9], and this can significantly affect the economic viability of the project. Furthermore, magnetite minerals are generally fine-grained, and therefore, they require fine to ultrafine comminution (usually below 45 μm) to achieve enough liberation prior to upgrading. The wet processing of such finely ground particles has a major negative impact on magnetic separation, concentrate, tailing dewatering, and wet tailings storage. Finally, the potential disastrous failure of tailing impoundment dams and the legacy costs associated with such tragedies have motivated research into the dry processing of iron ores.
In the mineral processing industry, dry magnetic separation is commonly used for removing tramp metals [10] and the coarse cobbing of magnetite ores [11,12]. However, it is inefficient for processing finely ground magnetite ores [7,10]. This is because conventional dry magnetic separators are effective for processing ore feed with particles coarser than 75 μm, which are spread in a monolayer over the separator [13]. However, since low-grade fine-grained magnetite ores generally require milling the run-of-mine (ROM) ore to particles finer than 45 μm, it renders the conventional dry magnetic separators ineffective [7]. Additionally, spreading such fine-milled feed particles in a monolayer over a magnetic separator has a major dust pollution issue. This motivated the development of the innovative pneumatic planar magnetic separator (PMS) pictured in Figure 1, which provides efficient dry magnetic separation of finely ground magnetite ore feed.
The PMS consists of a nonmagnetic housing with a circular internal separation chamber, a feed inlet, and concentrate and tailings outlet ports with an internal partition separating the inlet and outlet ports. The PMS’ separation chamber is sandwiched between rotating discs with embedded permanent magnets alternating with blank disengagement sectors. During its operation, the dry feed is conveyed by pressurised air through the separation chamber, where the magnetic particles are recovered and separated from the nonmagnetic particles. The magnetic particles are discharged as concentrates, whilst the nonmagnetic particles are carried by the air stream through the outlet port to either waste or scavenging. The design and operation of the PMS eliminate dust pollution. Some optimisation and comparative studies conducted using the PMS on different magnetite ores have been presented by Baawuah et al. [14], Baawuah et al. [6], Baawuah et al. [15], Kelsey et al. [16], and Kelsey et al. [17].
In our previous study [6] on the PMS, we investigated its performance and compared the outcomes with those of a Davis tube recovery (DTR) tester and wet drum magnetic separator (DMS). The study showed that for the selected magnetite ore, the PMS performance compared well with that of the DTR and outperformed that of the DMS. In this study, we investigate the performance of the PMS in processing a selected magnetite ore and how different PMS flowsheet configurations affect its performance. The outcomes are compared with those obtained from using DTR to treat the same ore. The key research questions to be addressed in this study are:
  • What is the effect of different flowsheet configurations on the performance of the PMS?
  • How does the performance of the various PMS flowsheet configurations compare with that of DTR?
  • What are the implications of the outcomes of the study on magnetite beneficiation?

2. Materials and Methods

2.1. Materials

A low-grade magnetite ore sourced from South Australia was used in this study. The top size of the received sample was 10 mm. The sample was divided into four using the cone and quartering. The first sample was used for chemical and mineralogical analysis. Two of the remaining samples were crushed using a novel dry superfine crusher (SFC) in line with air classification [18] to produce two feeds with grind sizes of P80s of 45 µm and 75 µm. The last part was kept as a reference sample.

2.2. Ore Characterisation Techniques

X-ray fluorescence (XRF) spectroscopy, Scanning Electron Microscopy (SEM), energy-dispersive X-ray spectroscopy (EDS), and Quantitative Evaluation of Minerals by Scanning electron microscopy (QEMSCAN™) were used to characterise the ore, the concentrate, and the tailing obtained from the various magnetic separation tests.
The XRF analysis was conducted using an Olympus Vanta M-Series XRF analyser equipped with a rhodium (Rh) anode and a 50 kV X-ray tube. SEM-EDS analyses were carried out using a Zeiss Merlin (Crossbeam 540) FEG SEM equipped with a Silicon drift detector (SDD) whilst QEMSCAN analysis was conducted using Zeiss QEMSCAN. All characterisation studies were conducted at the Future Industries Institute of the University of South Australia, Mawson Lakes, South Australia.
For the QEMSCAN analysis, a representative sample of the material was obtained using a micro-rotary splitter. The sub-samples of required masses were mounted in 30 mm diameter sample blocks using epoxy resin, polished to a mirror-smooth finish of 1 µm, and carbon-coated to about 20 nm thickness. The Particle Mineral Analysis (PMA) and field image mode of QEMSCAN measurements were used to provide quantitative mineralogy (mineral abundance, percentage), mineral liberation, and locking statistics. For the SEM-EDS analysis, a representative sample of the material was mounted onto the stubs using double-sided adhesive tape and coated with a thin carbon film using a vacuum evaporator. These characterisation techniques followed those described in Baawuah et al. [5] and Baawuah et al. [6].
A manual investigation (with 1,000,000 counts) allowed for developing of Species Identification Protocol (SIP) to specify the elemental composition of unclassified minerals that were present in the sample. Specific attention was paid to the discrimination of magnetite and hematite, as well as other similar minerals that show minor differences in EDS chemistry and backscattered intensity.

2.3. Magnetite Liberation Analysis Using QEMSCAN

The magnetite liberation characteristics of six (6) size fractions (−106 + 75 µm, −75 + 63 µm, −63 + 53 µm, −53 + 45 µm, −45 + 38 µm and −38 µm) obtained from the ore were determined using QEMSCAN. The mineral liberation was categorised into four, and these are;
  • Liberated particles were fragments in which more than 80% of the particles were made up of the magnetite.
  • High-grade middling particles were the particles in which the magnetite made up between 50% and 80% of the particle.
  • Low-grade middling particles were the particles in which between 20% and 50% of the particles were made up of the magnetite.
  • Locked particles were those fragments in which the magnetite made up less than 20%.

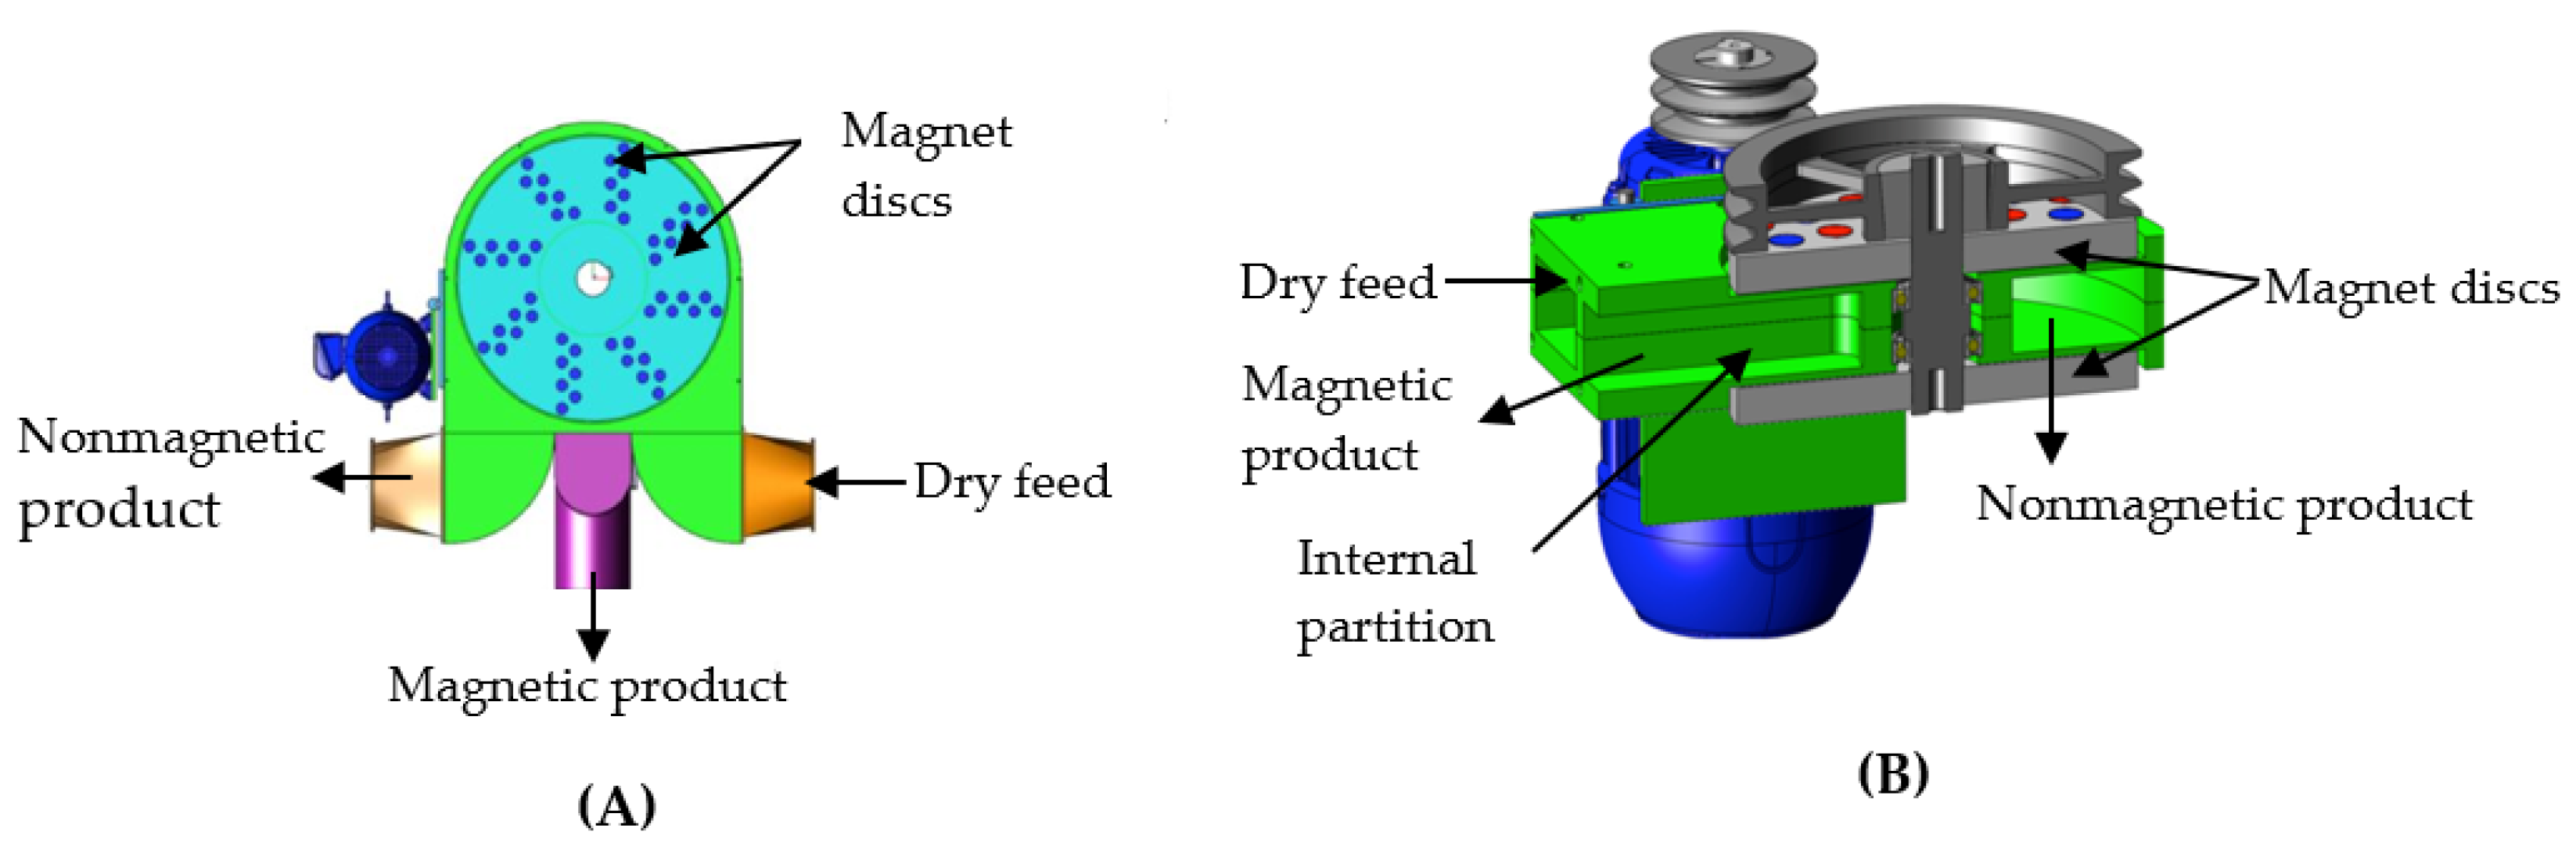
2.4. PMS Experimental Setup

The PMS experimental setup (Figure 2) consisted of the PMS equipped with a variable speed motor that drives the magnet embedded disc assembly, inlet, and outlet pumps. Feeding to the separation chamber was via a Eriez variable speed vibratory feeder. The magnetic field intensity within the separation chamber is approximately 0.1 tesla (T).
All PMS tests were conducted dry at an inlet air velocity of 15 m/s. The magnet disc speeds for the rougher magnetic separation (RMS), scavenger magnetic separation (SMS), and cleaner magnetic separation (CMS) stages were 30 rpm, 10 rpm, and 50 rpm, respectively. These parameters were selected based on our previous study [14]. After each test, the concentrate and tailing were weighed, and representative samples were assayed. Each test was replicated three times, and the reported mass yield, iron recovery, and assays are the arithmetic means.

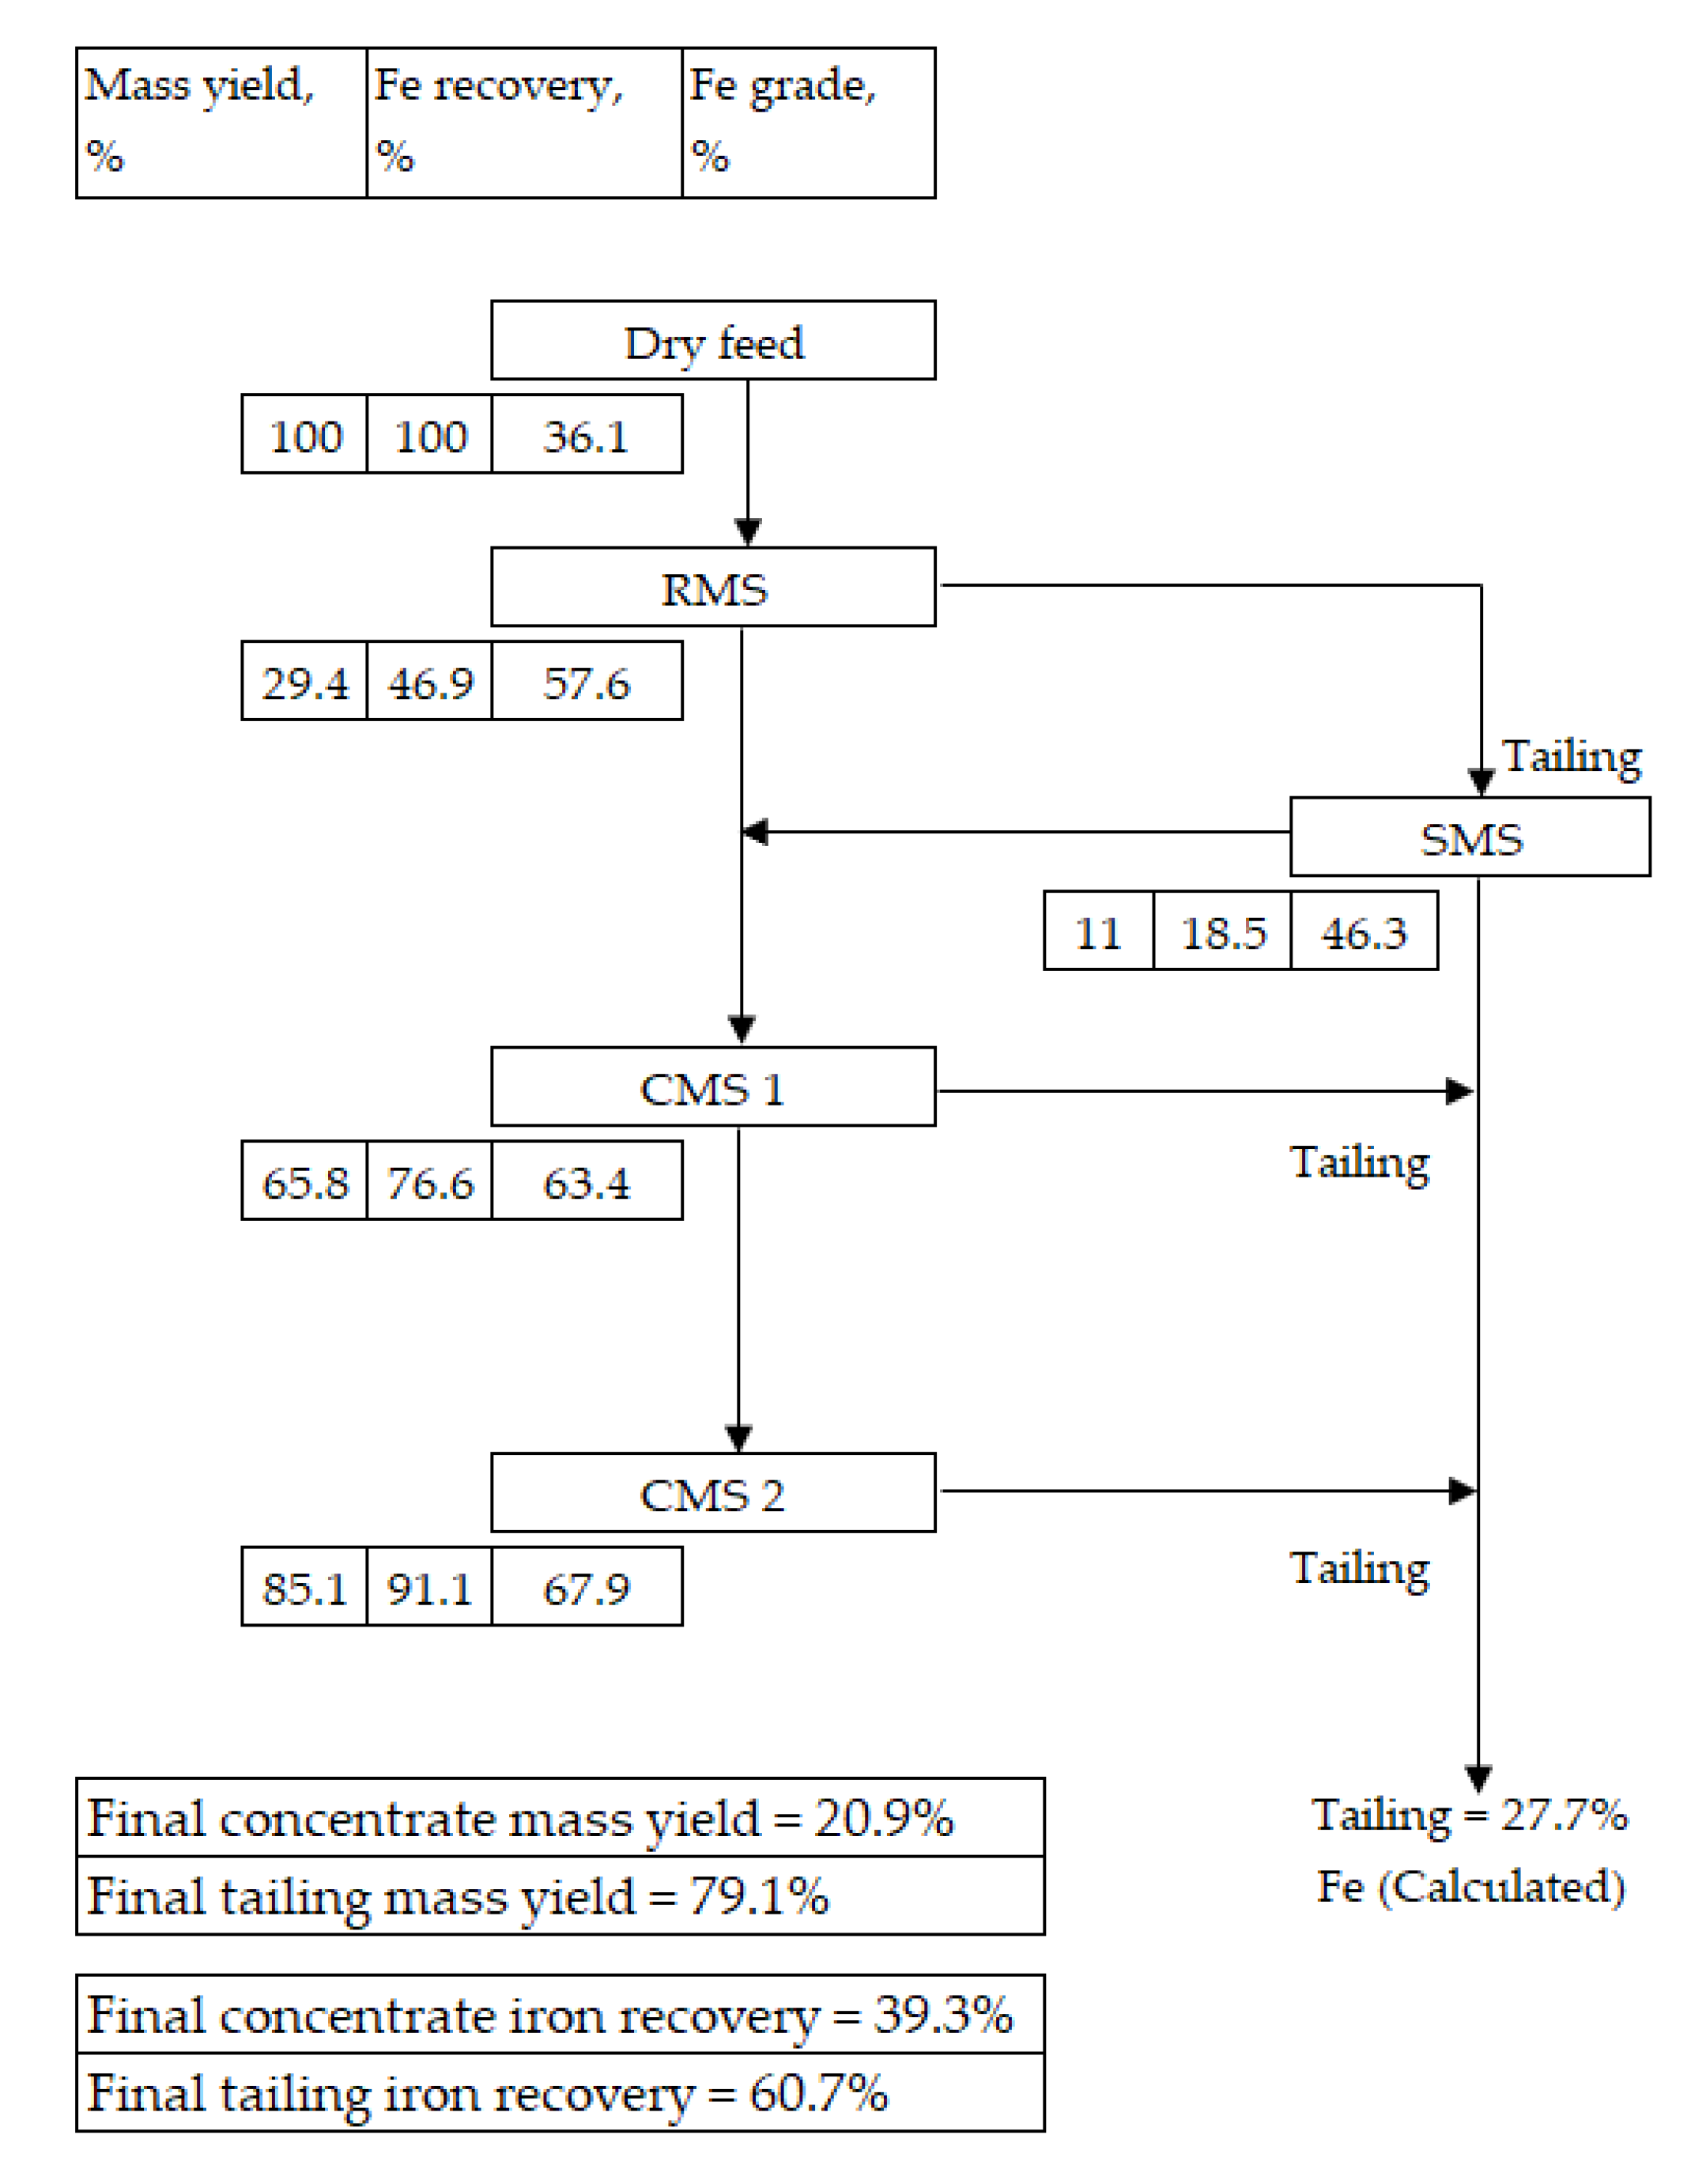
2.4.1. PMS Flowsheet 1

The Flowsheet 1 circuit consisted of a RMS, followed by an SMS and 2 stages of CMS, as shown in Figure 7. SMS was conducted on the tailings from the RMS. A composite of the RMS and SMS concentrates were taken through two stages of CMS. The concentrate from the CMS was reported as the final concentrate. The composite of the tailings from the 2 stages of CMS, together with the tailings from the SMS, was reported as final tailings. The particle size of the ore feed used for Flowsheet 1 was P80 of 45 µm.

2.4.2. PMS Flowsheet 2

The Flowsheet 2 circuit comprised an RMS, followed by an SMS and 2 streams each consisting of 2 stages of CMS, as shown in Figure 8. The concentrate from the RMS was screened using a 45 µm sieve. The undersize product (Stream 1 feed) was subjected to 2 stages of CMS to produce Stream 1 concentrate. The oversize from the screening (>45 µm feed particles) were reground to P100 = 45 µm to improve the liberation. The tailing from the RMS was subjected to an SMS stage. A composite (Stream 2 feed) of the SMS concentrate, the oversize fraction from the screening and the tailings from the 2 CMS stages from Stream 1, was subjected to 2 stages of CMS to produce Stream 2 concentrate. A composite of the tailings from the RMS, SMS, and the 2 stages of CMS from Stream 2 was reported as the final tailing. The particle size of the feed used for Flowsheet 2 was a P80 of 75 µm. The particle size distribution curves of the two ore feeds are shown in Figure 3.

2.5. DTR Experimental Setup

DTR tests were conducted on both the feeds for Flowsheets 1 and 2 for comparison. DTR tests were conducted at a 0.1 T magnetic field intensity, 540 millilitre per minute of wash water, and an agitation rate of 60 strokes per minute. The tests were replicated three times and the reported mass yield, iron recovery, and assays are the arithmetic means.

2.6. Evaluation Criteria

The mass yield and iron recovery were estimated using Equations (1) and (2), respectively.
Mass yield (%) = Mconcentrate/Mfeed × 100%,
where Mconcentrate is the concentrate mass in grams and Mfeed is the feed mass in grams.
Fe recovery (%) = [cFe × (fFetFe)]/[fFe × (cFetFe)] × 100%,
where fFe, cFe, and tFe are feed, concentrate, and tailing iron grades, respectively.

3. Results and Discussion

3.1. Ore Characterisation

3.1.1. Elemental and Mineralogical Compositions of the Ore

The major elements present in the ore are summarised in Table 1, whilst the major minerals identified, their abundance, and average grain size are presented in Table 2. The characterisation studies showed that the ore contains low iron (36.1 wt %) and is rich in silica.
The major impurity elements in the ore are silicon (Si), magnesium (Mg), calcium (Ca), and aluminium (Al), and traces of manganese (Mn) and phosphorus (P) were also identified. QEMSCAN identified magnetite as the dominant iron-bearing mineral in the ore, and this was followed by goethite and hematite. The major gangues identified in the ore were quartz and other silicates, phosphates, and carbonate minerals. The phosphates comprise mainly of apatite, whilst the carbonate minerals consist of dolomite and ankerite. The ‘others’ comprised a mixture of very fine and other unclassified phases.
Additionally, the results showed that the minerals identified were fine-grained, as can be seen in Table 2. The average grain size of magnetite was about 14 µm, and that of hematite and goethite was approximately 7.5 µm. The average grain size of the carbonates was approximately 20 µm and that of the quartz was about 14.4 µm.

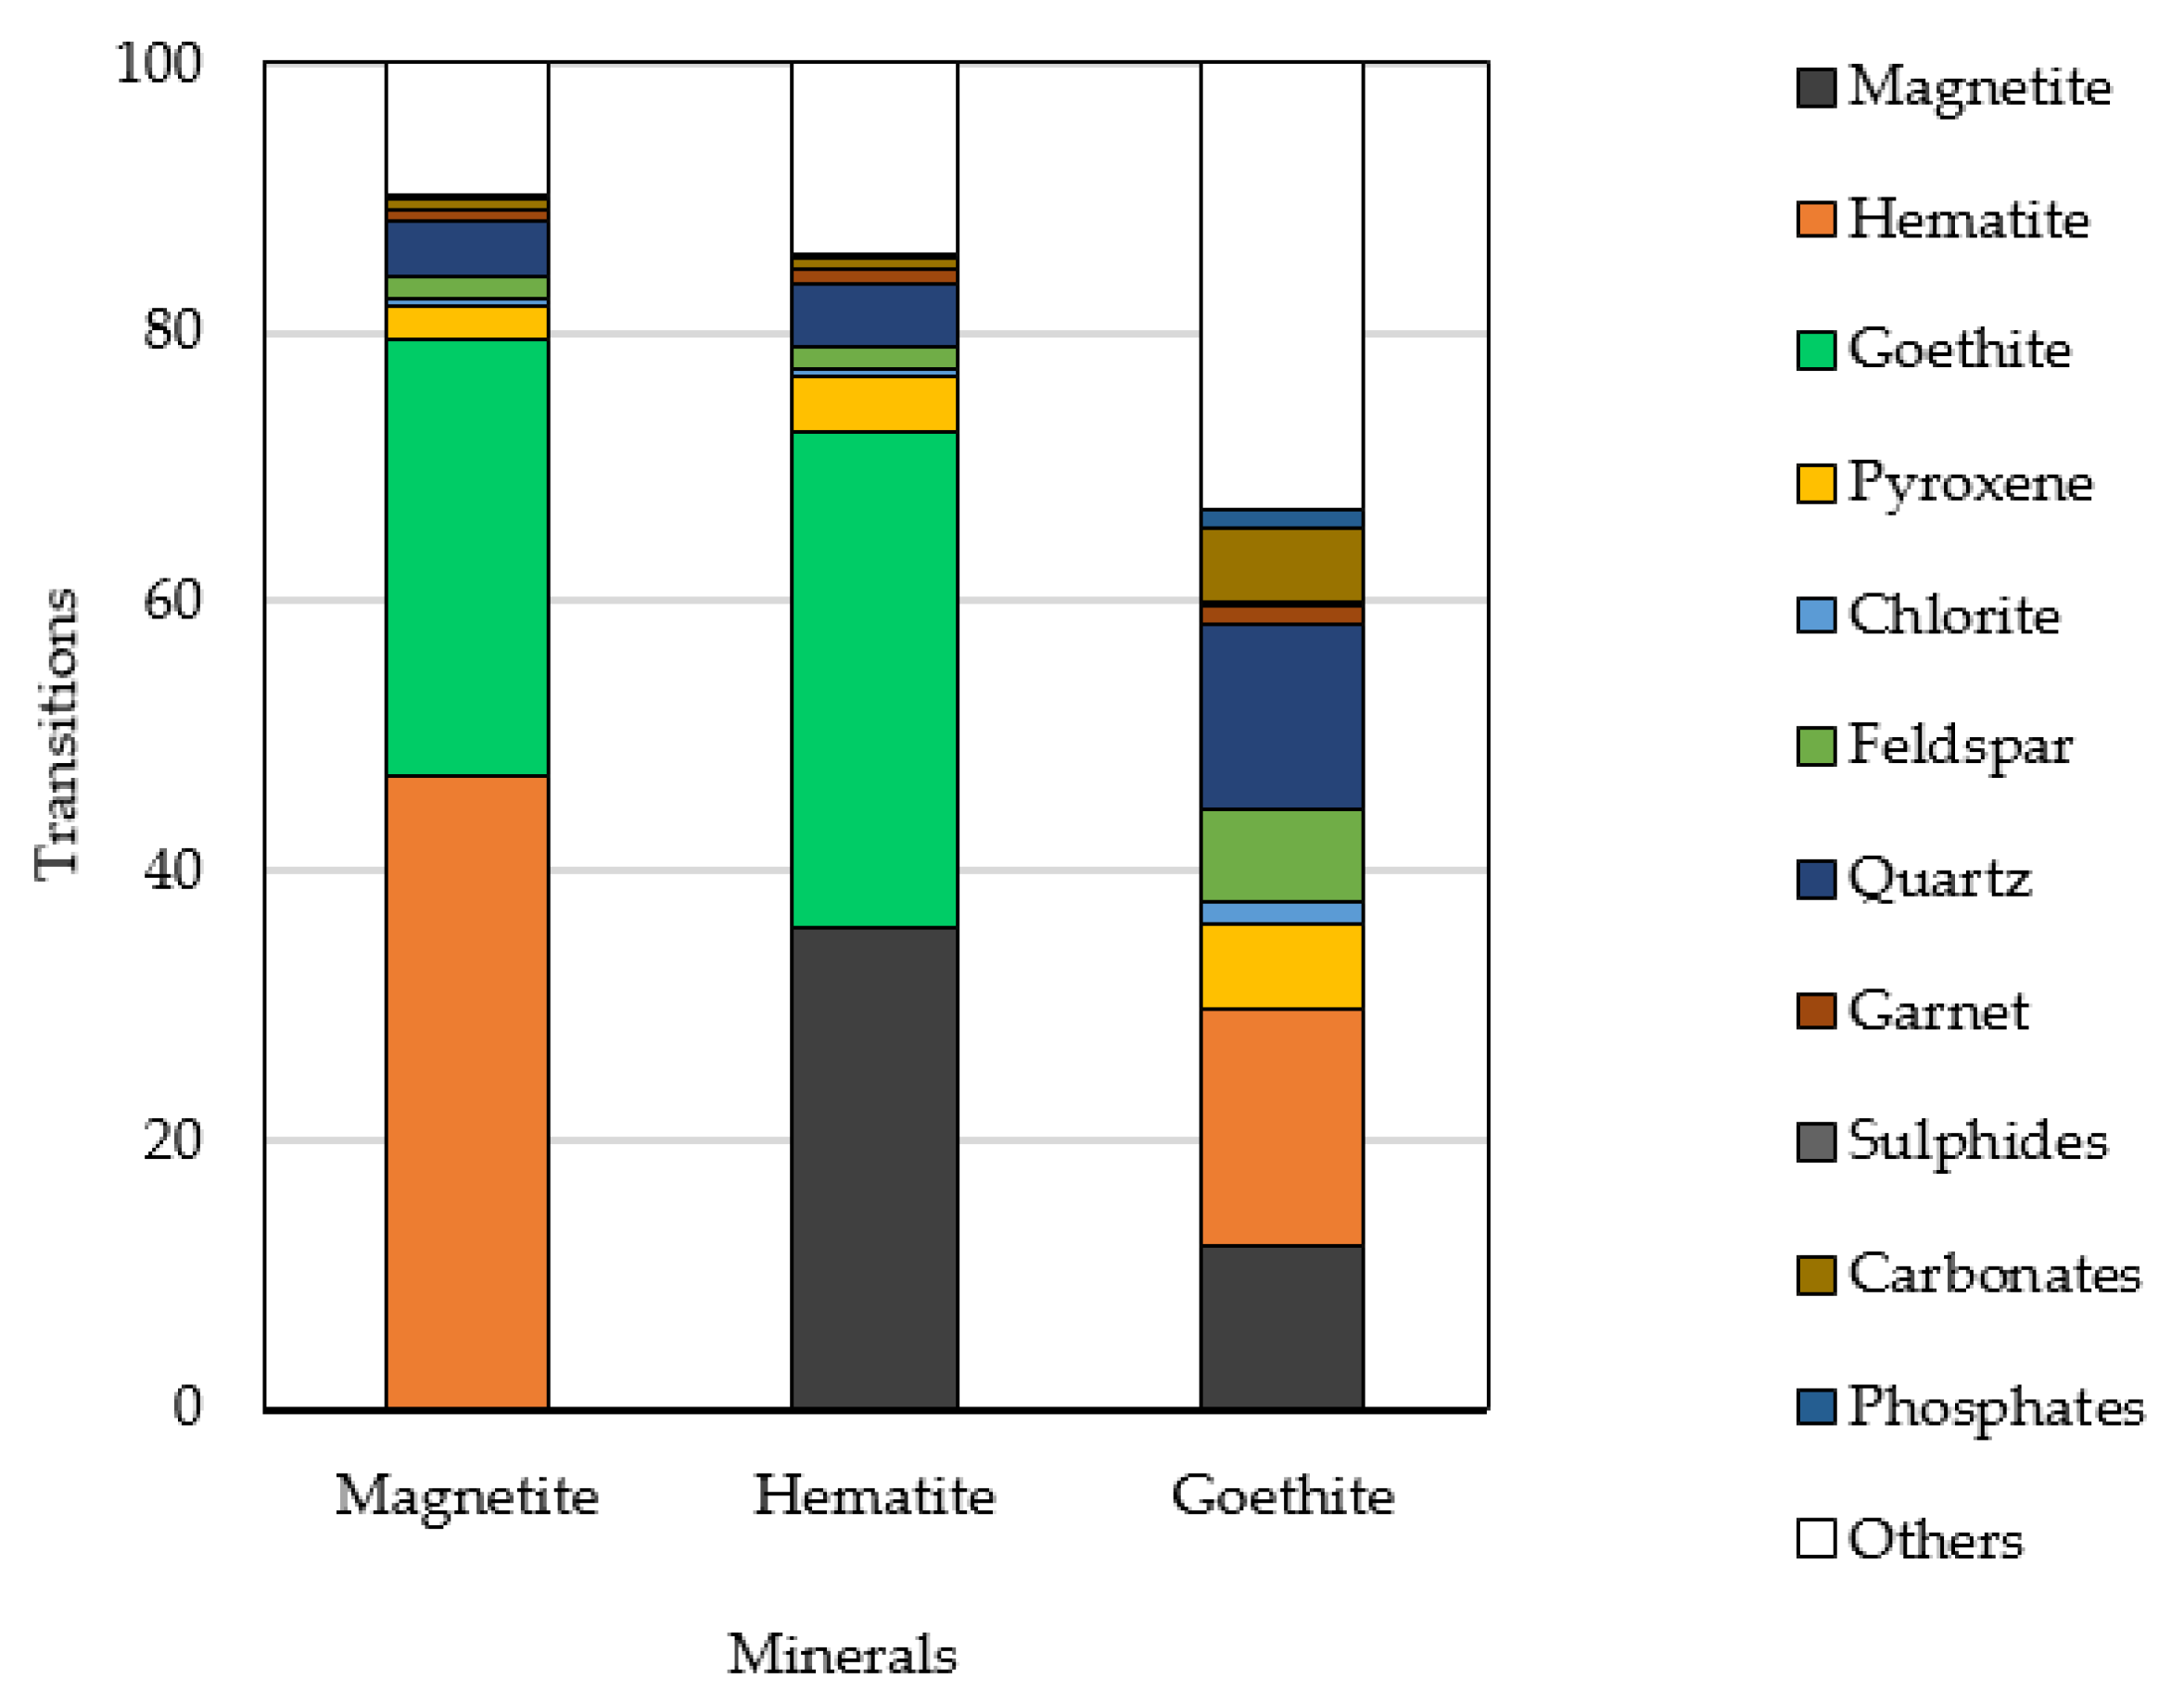
3.1.2. Mineral Association within the Ore

Knowledge of the mineral associations within any ore is particularly important because they provide information on the composition and association of the minerals of interest as well as the mineral locking, liberation, and the texture of each particle [19]. Mineral association measures and quantifies the degree to which a mineral grain is adjacent or touches another [20]. Figure 4 shows the nature of the mineral association in the major iron-bearing minerals in the ore as identified by QEMSCAN, whilst Figure 5 shows an SEM backscattered electron (BSE) image and an SEM-EDS mineral map image of the ore.
The outcomes of the ore characterisation showed that some magnetite particles were fully liberated whilst some particles were in close and complex associations with gangue minerals such as dolomite, quartz, and feldspar, among others. The fine-grained nature of the magnetite and its mineral associations suggest that magnetite will be sparsely liberated after comminution.

3.1.3. Magnetite Liberation and Interlocking Analysis

An understanding of the mineral liberation and interlocking characteristics of any ore is important in comminution circuit design and beneficiation processes optimisation. As was discussed in the previous section, mineral associations provide information about the spatial relationship between the various minerals present in a particle, which subsequently result in determining the liberation characteristics of the mineral of interest. The determination of mineral associations and liberation characteristics within a particle intrinsically depends on the mineral grain sizes within the ore. The degrees of magnetite liberation within the selected size fractions studied are depicted in Figure 6.
The results show that the percentage of magnetite that was fully liberated consistently improved with the finer size fractions; however, it declined for the minus 38 µm size fraction particles. The highest magnetite liberation was observed in the −45 + 38 µm size fraction particles. As was expected, the coarsest particle size fraction (−106 + 75 µm) recorded the least magnetite liberation, i.e., the highest locked magnetite. Most of the magnetite in this size fraction was in the low-grade middlings category with a small percentage within the high-grade middlings category. On the contrary, the −38 µm size fraction, which was expected to achieve the highest percentage of fully liberated magnetite, recorded a minor fully liberated magnetite. This could potentially be due to factors that are outside the scope of the current research scope. Generally, significant portions of the magnetite were within the low- and high-grade middlings categories.

3.2. PMS Flowsheets

From the magnetite liberation studies presented in Section 3.1.3, it was clear that the ore feed achieved the highest magnetite liberation at a size of 45 µm; therefore, for Flowsheet 1, the ore feed was crushed to a P80 of 45 µm. The outcome and metallurgical balance for Flowsheet 1 are presented in Figure 7.
The study revealed that at the RMS stage, 29% of the ore feed was recovered as the concentrate with an iron grade of 57.9 wt %. The major impurity elements in the concentrate were silicon (10.2 wt %), aluminium (0.74 wt %), calcium (0.52 wt %), and phosphorus (0.08 wt %). After the two stages of CMS, the PMS recovered a magnetite concentrate with iron and silicon grades of 67.9 wt % and 6.01 wt %, respectively with no detection of aluminium, phosphorus, and calcium.
From a mineral economic point of view, the energy requirement and cost in breaking an ore feed size to a finer particle size is significantly higher than breaking the same ore feed size to a relatively coarse product size fraction. In this regard, when developing processing flowsheets, mineral processors target the rejection of gangue particles at a relatively coarser size fraction, thereby reducing the amount of energy and cost expended on these gangue products. This motivated the development of the PMS Flowsheet 2 where the ore feed was crushed to a product with P80 of 75 µm to reject the gangue particles at that coarse particle size fraction before the CMS operations. The metallurgical balance for Flowsheet 2 is presented in Figure 8.
The outcome of Flowsheet 2 showed that at the RMS stage, the PMS recovered 31.2% of the feed as the concentrate with iron, silicon, aluminium, and calcium grades of 56.2 wt %, 10.9 wt %, 0.98 wt %, and 0.56 wt %, respectively. Compared with the RMS stage of Flowsheet 1, Flowsheet 2 recovered higher concentrate mass, lower iron grade, and higher impurities due to the poor magnetite liberation.
The higher magnetite liberation achieved at the 45 µm size fractions of the ore motivated the introduction of a classification unit into the Flowsheet 2 circuit to classify the RMS stage concentrate. The classification of the concentrate from the RMS showed that about 50% of the concentrate was finer than 45 µm, and that fraction of the concentrate was rich in iron and contains fewer impurities. The major elements in the oversize and undersize products obtained from the classification unit are summarised in Table 3.
Subsequently, the −45 µm size fraction of the RMS concentrate was taken through a dedicated two-stage CMS (labelled as Stream 1) to produce highly rich magnetite concentrate. The CMS stages produced a concentrate with iron and silicon grades of 70.4 wt % and 3.82 wt %, respectively, with no detectable calcium, aluminium, and phosphorus. This concentrate is a premium product that shows that the introduction of the classification unit into the circuit of Flowsheet 2 was beneficial.
Subsequently, the oversize fraction from the classification unit was reground to improve the magnetite liberation, and together, the concentrates obtained from the SMS and the tailing from Stream 1 form a composite feed, which was also processed through a different two-stage CMS circuit (labelled Stream 2). The study revealed that the Stream 2 produced concentrate with iron and silicon grades of 69 wt % and 5.13 wt %, respectively. Again, the concentrate from Stream 2 had no detectable calcium, aluminium, and phosphorus.
The results of the PMS studies have demonstrated that the dry processing of finely ground magnetite ore feed using the PMS is feasible. Both Flowsheets 1 and 2 produced premium iron concentrates at varying mass yields, recoveries, and gangue concentrations. Additionally, the studies have shown that it is possible to process magnetite ores located in arid regions where the scarcity of potable water for mineral processing has rendered them uneconomic. Finally, comparing the outcomes from Flowsheets 1 and 2, it is clear that operating the PMS in different flowsheet configurations can improve the performance of its beneficiation circuit and lower the amount of ore feed that requires comminution to liberation size. This will subsequently reduce comminution energy requirement and the cost associated with magnetite processing.

3.3. PMS and DTR Comparative Studies

The study was extended to investigate how the performance of the PMS compares with other wet magnetite beneficiation technologies. A DTR tester was selected for the PMS comparative studies because it is universally accepted and applied in the magnetite industry to establish the maximum theoretical recoveries and grades of magnetite ores. Therefore, comparing the performance of the PMS against that of the DTR will provide an understanding of the potential benefits of the PMS in magnetite beneficiation plants. The results of the PMS and DTR comparative studies for Flowsheets 1 and 2 have been summarised in Table 4 and Table 5, respectively.
The outcome of the PMS and DTR comparative studies also confirmed the benefits of operating the PMS in different configurations depending on the ore characteristics. For example, for Flowsheet 1, the PMS recovered approximately 29% of the feed mass as the concentrate for the RMS stage, whilst the DTR recovered about 28%. Additionally, the PMS’ concentrate contained lesser iron grade and more impurity elements than that of the DTR. However, after the two stages of PMS CMS, the recovered concentrate contained more iron grade with lesser impurity element than that of the DTR.
Similarly, for the RMS stage of Flowsheet 2, the PMS recovered about 31% of the ore feed as the concentrate with an iron content of about 56% whilst the DTR recovered approximately 37% as the mass yield with an iron content of about 57%. However, whilst the DTR concentrate contained no detectable calcium, aluminium, and phosphorus, the PMS concentrate obtained from the RMS stage contained significant impurity elements. Subsequently, after the two stages of PMS CMS for both Streams 1 and 2, Streams 1 and 2 generated concentrates with iron grades of approximately 70 wt % and 69 wt %, respectively. These iron grades were significantly higher than those obtained for the DTR concentrate and the PMS RMS stage concentrate.
It is also obvious that the final PMS concentrate masses from both flowsheets were lower than those of the DTR. For Flowsheet 1, this can be ascribed to the rejection of gangue particles that were associated with the PMS concentrate. On the other hand, for Flowsheet 2, the fraction of the RMS concentrate (50%), which was coarser than 45 µm, was reground to improve mineral liberation, which led to the rejection of more gangue particles and subsequently resulted in low mass yield. These results clearly confirm that the performance of the PMS in concentrating a magnetite ore can be significantly improved by understanding the mineralogical characteristics of the ore applying different PMS flowsheet configurations.
All the assay results of the concentrates obtained from both the PMS and DTR tests showed the presence of impurity elements. To investigate the sources of these impurity elements, a representative sample was taken from the concentrate of the DTR test (P80 = 75 µm feed) and analysed using SEM-EDS to identify the mineral species in the concentrate. Figure 9 shows the SEM BSE image and EDS mineral map of a portion of the magnetite concentrate. The SEM-EDS results show that the gangue minerals that are associated with the magnetite mineral in the concentrate are mostly quartz and felspar.
Furthermore, the SEM BSE image (Figure 9A) showed that significant portions of the magnetite in the concentrate are comingled and unliberated. This was expected, looking at the average magnetite mineral grain size (approximately 14 µm; see Table 2) and the ore feed particle size (P80 = 75 µm). This means that grinding the ore finer can improve the magnetite liberation and subsequently lower the gangue in the concentrates. A detailed mineralogical characterisation of the concentrates using QEMSCAN is recommended to quantify the various minerals in the concentrate.

3.4. The Implications of Studies for Magnetite Beneficiation

To date, there are no dry processing technologies that have been successfully applied in an industrial large-scale beneficiation of finely ground magnetite ore feed. This is because studies have shown that the use of conventional dry magnetic separators to process fine and ultrafine ore feed particles is ineffective and is associated with major dust pollution issues. The outcomes of the current study have shown that the PMS can successfully and efficiently process fine (finer than 75 µm) magnetite ore feed without the usual challenges of dust pollution. Additionally, the study has revealed that the PMS can be operated in different flowsheet configurations to achieve the target concentrate mass and grades based on the ore mineralogy. This was demonstrated by the outcomes of the PMS Flowsheets 1 and 2.
In our previous study [6], it was demonstrated that the PMS performance compared favorably with that of DTR. The outcomes of this study also confirm that the PMS performance agrees well with that of the DTR. This means that the PMS can provide a dry alternative for the DTR in drought-ridden areas such as the Taklimakan desert in China, where studies by Torii et al. [8] show the presence of magnetite deposits where the scarcity of water can become an economic obstacle for the operations of the DTR. More importantly, DTR tests are usually conducted on small sample masses (usually less than 50 g) in batch processes, which means that any error or bias in the sampling operation can negatively influence the outcomes and predictions of the DTR results. On the other hand, the PMS tests are conducted on larger samples (usually more than 2 kg), which ensures adequate sample representativeness compared with the DTR and thereby provides more operationally relevant results.
Finally, the wet processing of magnetite ores especially in arid regions is characterised by huge cost for extensive water pumping infrastructure, concentrate and tailing dewatering, tailing disposal, and tailing impoundments for storing process effluents. The successful application of the PMS in magnetite beneficiation will drastically reduce the cost associated with water acquisition, which is gradually becoming a major cost component in determining the economic viability of low-grade magnetite deposits that are located within arid and remote regions [16]. Subsequently, this will eliminate the need for the construction of tailing impoundment, which is a requirement for wet processing operations. Dry tailing from the PMS can be agglomerated and return to disused mining pits as backfill, or where conducive, it can be used for other construction works. This will lower the environmental footprint for magnetite projects and subsequently eliminate the legacy cost associated with the potential deleterious collapse of a tailings dam.

4. Conclusions

In this study, the application of a novel pneumatic magnetic separator for the dry beneficiation of a selected low-grade magnetite ore using 2 different flowsheets was investigated and the outcomes were compared with results from DTR tests. The PMS showed a positive outcome making its application in magnetite beneficiation an attractive area for further research and development. Based on the results from the study, the following conclusions are made;
  • The dry beneficiation of magnetite ores using the PMS is highly feasible. The PMS generated concentrates with iron grades of more than 68 wt % from the CMS stages of all the studies conducted. For Flowsheet 1, the PMS achieve iron upgrades of 60% and 88% for the RMS stage and CMS stage, respectively. For Flowsheet 2, the PMS achieved an iron upgrade of 56% for the RMS stage, whilst it achieved iron upgrades of 95% and 91% for the final CMS concentrates for Streams 1 and 2, respectively.
  • The use of different flowsheet configurations has the potential to improve the performance of the PMS in terms of the early rejection of gangue particles and concentrate purity. For example, in Flowsheet 2, using a relatively coarse feed and introducing a classification unit into the beneficiation circuit resulted in the reduction of the amount of feed that required fine grinding, as in the case of Flowsheet 1. This also resulted in Flowsheet 2 generating concentrate with higher iron grades compared with Flowsheet 1.
  • The study also showed that the PMS performance compares well with that of the DTR. For example, for Flowsheet 1, the DTR and PMS achieved mass yields of 27.6% and 29.4%, respectively. After the PMS’ CMS stage, both the DTR and PMS produced concentrate iron grades of 66.2% and 67.9%, respectively. Whilst DTR tests are usually conducted on small sample masses (usually less than 50 g) in batches, PMS tests are conducted on larger samples (usually more than 2 kg) in a continuous process, which ensures sample representativeness compared with the DTR.
  • The application of the PMS in the dry beneficiation of magnetite will potentially lower the environmental footprint of magnetite projects, since dry tailing from the magnetite concentrator can be agglomerated and return directly to mining pits, thereby obviating the need for tailing dams.

Author Contributions

E.B.: Conceptualisation, Methodology, Investigation, Validation, Formal analysis, Visualisation, Writing—Original Draft; Writing—Review and Editing; C.K.: Resources; J.A.-M.: Formal analysis, Writing—Review and Editing, Supervision; W.S.: Formal analysis, Writing—Review and Editing, Supervision, Funding acquisition. All authors have read and agreed to the published version of the manuscript.

Funding

This research received no external funding.

Acknowledgments

The Australian Government Research Training Program Scholarship and the Future Industries Institute of the University of South Australia are thankfully acknowledged. The authors also acknowledge the Technical Service Team of the Future Industries Institute of the University of South Australia for the QEMSCAN and SEM-EDS analyses.

Conflicts of Interest

I (First author: Emmanuel Baawuah) declare that I have no financial and personal relationship with other people or organisation that could inappropriately influence (bias) this work. This research work is part of a PhD research which is aimed at the application of novel dry processing technologies for magnetite beneficiation. The second author (Christopher Kelsey) provided access to the technology. The third (Jonas Addai-Mensah) and fourth authors (William Skinner) are my research supervisors and advisors.

References

  1. McNab, B.; Jankovic, A.; David, D.; Payne, P. Processing of magnetite iron ores–comparing grinding options. In Proceedings of the Iron Ore Conference, Perth, Australia, 27–29 July 2009; pp. 277–287. [Google Scholar]
  2. Holmes, R.J.; Lu, L. Introduction: Overview of the global iron ore industry. In Iron Ore: Mineralogy, Processing and Environmental Sustainability; Lu, L., Ed.; Woodhead Publishing: Cambridge, UK, 2015; pp. 1–42. [Google Scholar]
  3. Clout, J.M.F.; Manuel, J.R. Mineralogical, chemical, and physical characterisation of iron ore. In Iron Ore: Mineralogy, Processing and Environmental Sustainability; Lu, L., Ed.; Woodhead Publishing: Cambridge, UK, 2015; pp. 45–84. [Google Scholar]
  4. Yellishetty, M.; Mudd, G.; Mason, L.; Mohr, S.; Prior, T.; Giurco, D. Iron Resources and Production: Technology, Sustainability and Future Prospects; Prepared for CSIRO Minerals Down Under Flagship; Monash University: Melbourne, Australia; University of Technology: Sydney, Australia, 2012; ISBN 978-1-922173-46-1. [Google Scholar]
  5. Baawuah, E.; Kelsey, C.; Addai-Mensah, J.; Skinner, W. Comparison of the performance of different comminution technologies in terms of energy efficiency and mineral liberation. Miner. Eng. 2020, 156, 106454. [Google Scholar] [CrossRef]
  6. Baawuah, E.; Kelsey, C.; Addai-Mensah, J.; Skinner, W. Assessing the performance of a novel pneumatic magnetic separator for the beneficiation of magnetite ore. Miner. Eng. 2020, 156, 106483. [Google Scholar] [CrossRef]
  7. Xiong, D.; Lu, L.; Holmes, R. Developments in the physical separation of iron ore: Magnetic separation. In Iron Ore: Mineralogy, Processing and Environmental Sustainability; Lu, L., Ed.; Woodhead Publishing: Cambridge, UK, 2015; pp. 283–307. [Google Scholar]
  8. Torii, M.; Lee, T.-Q.; Fukuma, K.; Mishima, T.; Yamazaki, T.; Oda, H.; Ishikawa, N. Mineral magnetic study of the Taklimakan desert sands and its relevance to the Chinese loess. Geophys. J. Int. 2001, 146, 416–424. [Google Scholar] [CrossRef] [Green Version]
  9. Ghaffour, N.; Missimer, T.M.; Amy, G.L. Technical review and evaluation of the economics of water desalination: Current and future challenges for better water supply sustainability. Desalination 2013, 309, 197–207. [Google Scholar] [CrossRef] [Green Version]
  10. Elder, J.; Sherrell, I. Dry versus wet magnetic separation—Horses for courses. In Proceedings of the 8th International Heavy Minerals Conference, Perth, Australia, 5–6 October 2011; pp. 99–106. [Google Scholar]
  11. Aubrey, W.M. Dry Magnetic Cobbing Separation—Dry Magnetic Cobbing Separation. In Proceedings of the SME Annual Meeting, New York, NY, USA, 16–20 February 1958; pp. 1–13. [Google Scholar]
  12. Connelly, D.; Yan, D. Trends in Magnetite Ore Processing and Test Work. In Proceedings of the Iron Ore Conference, Perth, Australia, 27–29 July 2009; pp. 231–241. [Google Scholar]
  13. Svoboda, J. Review of Magnetic Separator. In Magnetic Techniques for the Treatment of Materials; Springer: Dordrecht, The Netherlands, 2004; p. 96. [Google Scholar] [CrossRef]
  14. Baawuah, E.; Kelsey, C.; Kelly, J.R.; Addai-Mensah, J.; Skinner, W. Dry magnetic separation of magnetite from magnetite-quartz blends using Cyclomag Planar magnetic separator. In Proceedings of the XXIX International Mineral Processing Congress, Moscow, Russia, 17–21 September 2018; pp. 1–10. [Google Scholar]
  15. Baawuah, E.; Kelsey, C.; Addai-Mensah, J.; Skinner, W. Evaluation of the performance of Cyclomag PMS-300 S2. In Proceedings of the Iron Ore Conference, Perth, Australia, 22–24 July 2019; pp. 645–656. [Google Scholar]
  16. Kelsey, C.G.; Kelly, J.; Skinner, W. Dry Processing of Magnetic Iron Ores—Addressing Cost and Environmental Issues. In Proceedings of the Iron Ore Conference, Perth, Australia, 24–26 July 2017; pp. 215–220. [Google Scholar]
  17. Kelsey, C.; Kelly, J.R.; Skinner, W. Recasting mineral processing flow-sheets. In Proceedings of the 29th International Mineral Processing Congress, Moscow, Russia, 15–21 September 2018; pp. 1–11. [Google Scholar]
  18. Baawuah, E.; Kelsey, C.; Addai-Mensah, J.; Skinner, W. Advances in superfine crushing—A study on IMPTEC superfine crusher (SFC 160) operating parameters. In Proceedings of the Iron Ore Conference, Perth, Australia, 22–24 July 2019; pp. 633–644. [Google Scholar]
  19. Aylmore, M.G. Automated mineralogy. In SME Mineral Processing & Extractive Metallurgy Handbook; Dunne, R.C., Kawatra, S.K., Young, C.A., Eds.; Society for Mining, Metallurgy & Exploration: Englewood, CO, USA, 2019; Volume 1, pp. 43–68. [Google Scholar]
  20. Anderson, K.F.E.; Wall, F.; Rollinson, G.K.; Moon, C.J. Quantitative mineralogical and chemical assessment of the Nkout iron ore deposit, Southern Cameroon. Ore Geol. Rev. 2014, 62, 25–39. [Google Scholar] [CrossRef]
Figure 1. (A) PMS cross-section view and (B) internal design.
Minerals 10 00759 g001
Figure 2. PMS experimental setup.
Minerals 10 00759 g002
Figure 3. Particle size distributions of the various feed used in the study.
Minerals 10 00759 g003
Figure 4. Mineral associations as determined by Quantitative Evaluation of Minerals by Scanning electron microscopy (QEMSCAN).
Minerals 10 00759 g004
Figure 5. SEM BSE image (A) and chemical map image (B) of the ore feed. Mag = magnetite; Qua = quartz; Fel = feldspar; Cal = calcite; A = A composite of magnetite, quartz, and feldspar.
Minerals 10 00759 g005
Figure 6. Magnetite liberation in various size fractions of the ore.
Minerals 10 00759 g006
Figure 7. Metallurgical balance for Flowsheet 1 with a feed particle size of P80 = 45 µm.
Minerals 10 00759 g007
Figure 8. Metallurgical balance for Flowsheet 2 with a feed particle size of P80 = 75 µm.
Minerals 10 00759 g008
Figure 9. SEM BSE (A) and chemical map (B) images of a portion of the concentrate. Fel = felspar; Qua = quartz; A = magnetite in close association with quartz; B = liberated magnetite.
Minerals 10 00759 g009
Table 1. The major elemental composition of the ore.
ElementFeSiAlMgCaPMn
wt %36.119.12.595.064.170.300.04
Table 2. Mineral phases, their abundance, and average grain size in the ore.
MineralChemical
Formula
Abundance,
wt %
Average Grain Size, µm
MagnetiteFe3O421.814.1
GoethiteFeO.OH15.57.56
HematiteFe2O313.17.36
Pyroxene (Actinolite and enstatite)Ca2(Mg,Fe)5Si8O22(OH), Mg2Si2O63.225.67
Chlorite (Clinochlore and chamosite)(Mg,Fe)6(Si,Al)4O10(O)81.509.82
Feldspar (Anorthite)CaAl2Si2O89.9413.9
QuartzSiO212.714.4
Garnet (Almandine and andradite)Fe3Al2(SiO4)3, Ca3Fe2(SiO4)30.865.29
Other Silicates (Pyrophyllite and olivine)Al2Si4O10(OH)2, (Mg,Fe)2SiO48.476.92
Sulphides (Pyrite and pyrrhotite)FeS2, Fe2S80.065.25
Carbonates (Calcite and dolomite)CaCO3, CaMg(CO3)210.720.1
Phosphates (apatite)Ca5(PO4)3OH1.868.51
Others (a mixture of unclassified phases)-0.29<6.67
Table 3. The major element in the products from the classification unit.
Size Fraction.FeSiAlCaP
−45 µm63.18.320.640.45-
+45 µm46.316.51.691.040.19
Table 4. PMS and DTR comparative studies Flowsheet 1 (Ore feed of P80 = 45 µm). CMS: cleaner magnetic separation, PMS: planar magnetic separator, RMS: rougher magnetic separation.
Separation MethodsConcentrate, wt %
Mass YieldFeSiAlCaP
DTR 27.666.29.33---
PMSRMS29.457.610.20.740.520.08
Final CMS20.967.96.01---
Table 5. PMS and DTR comparative studies of Flowsheet 2 (Ore feed of P80 = 75 µm).
Separation MethodsConcentrate, wt %
Mass YieldFeSiAlCaP
DTR 36.957.213.5---
PMSRMS31.256.210.90.980.560.11
Final CMS: Stream 110.270.43.82---
Final CMS: Stream 211.969.05.13---

