Impact of Diagenesis on the Reservoir Properties of the Cretaceous Sandstones in the Southern Bredasdorp Basin, Offshore South Africa


Abstract
:1. Introduction
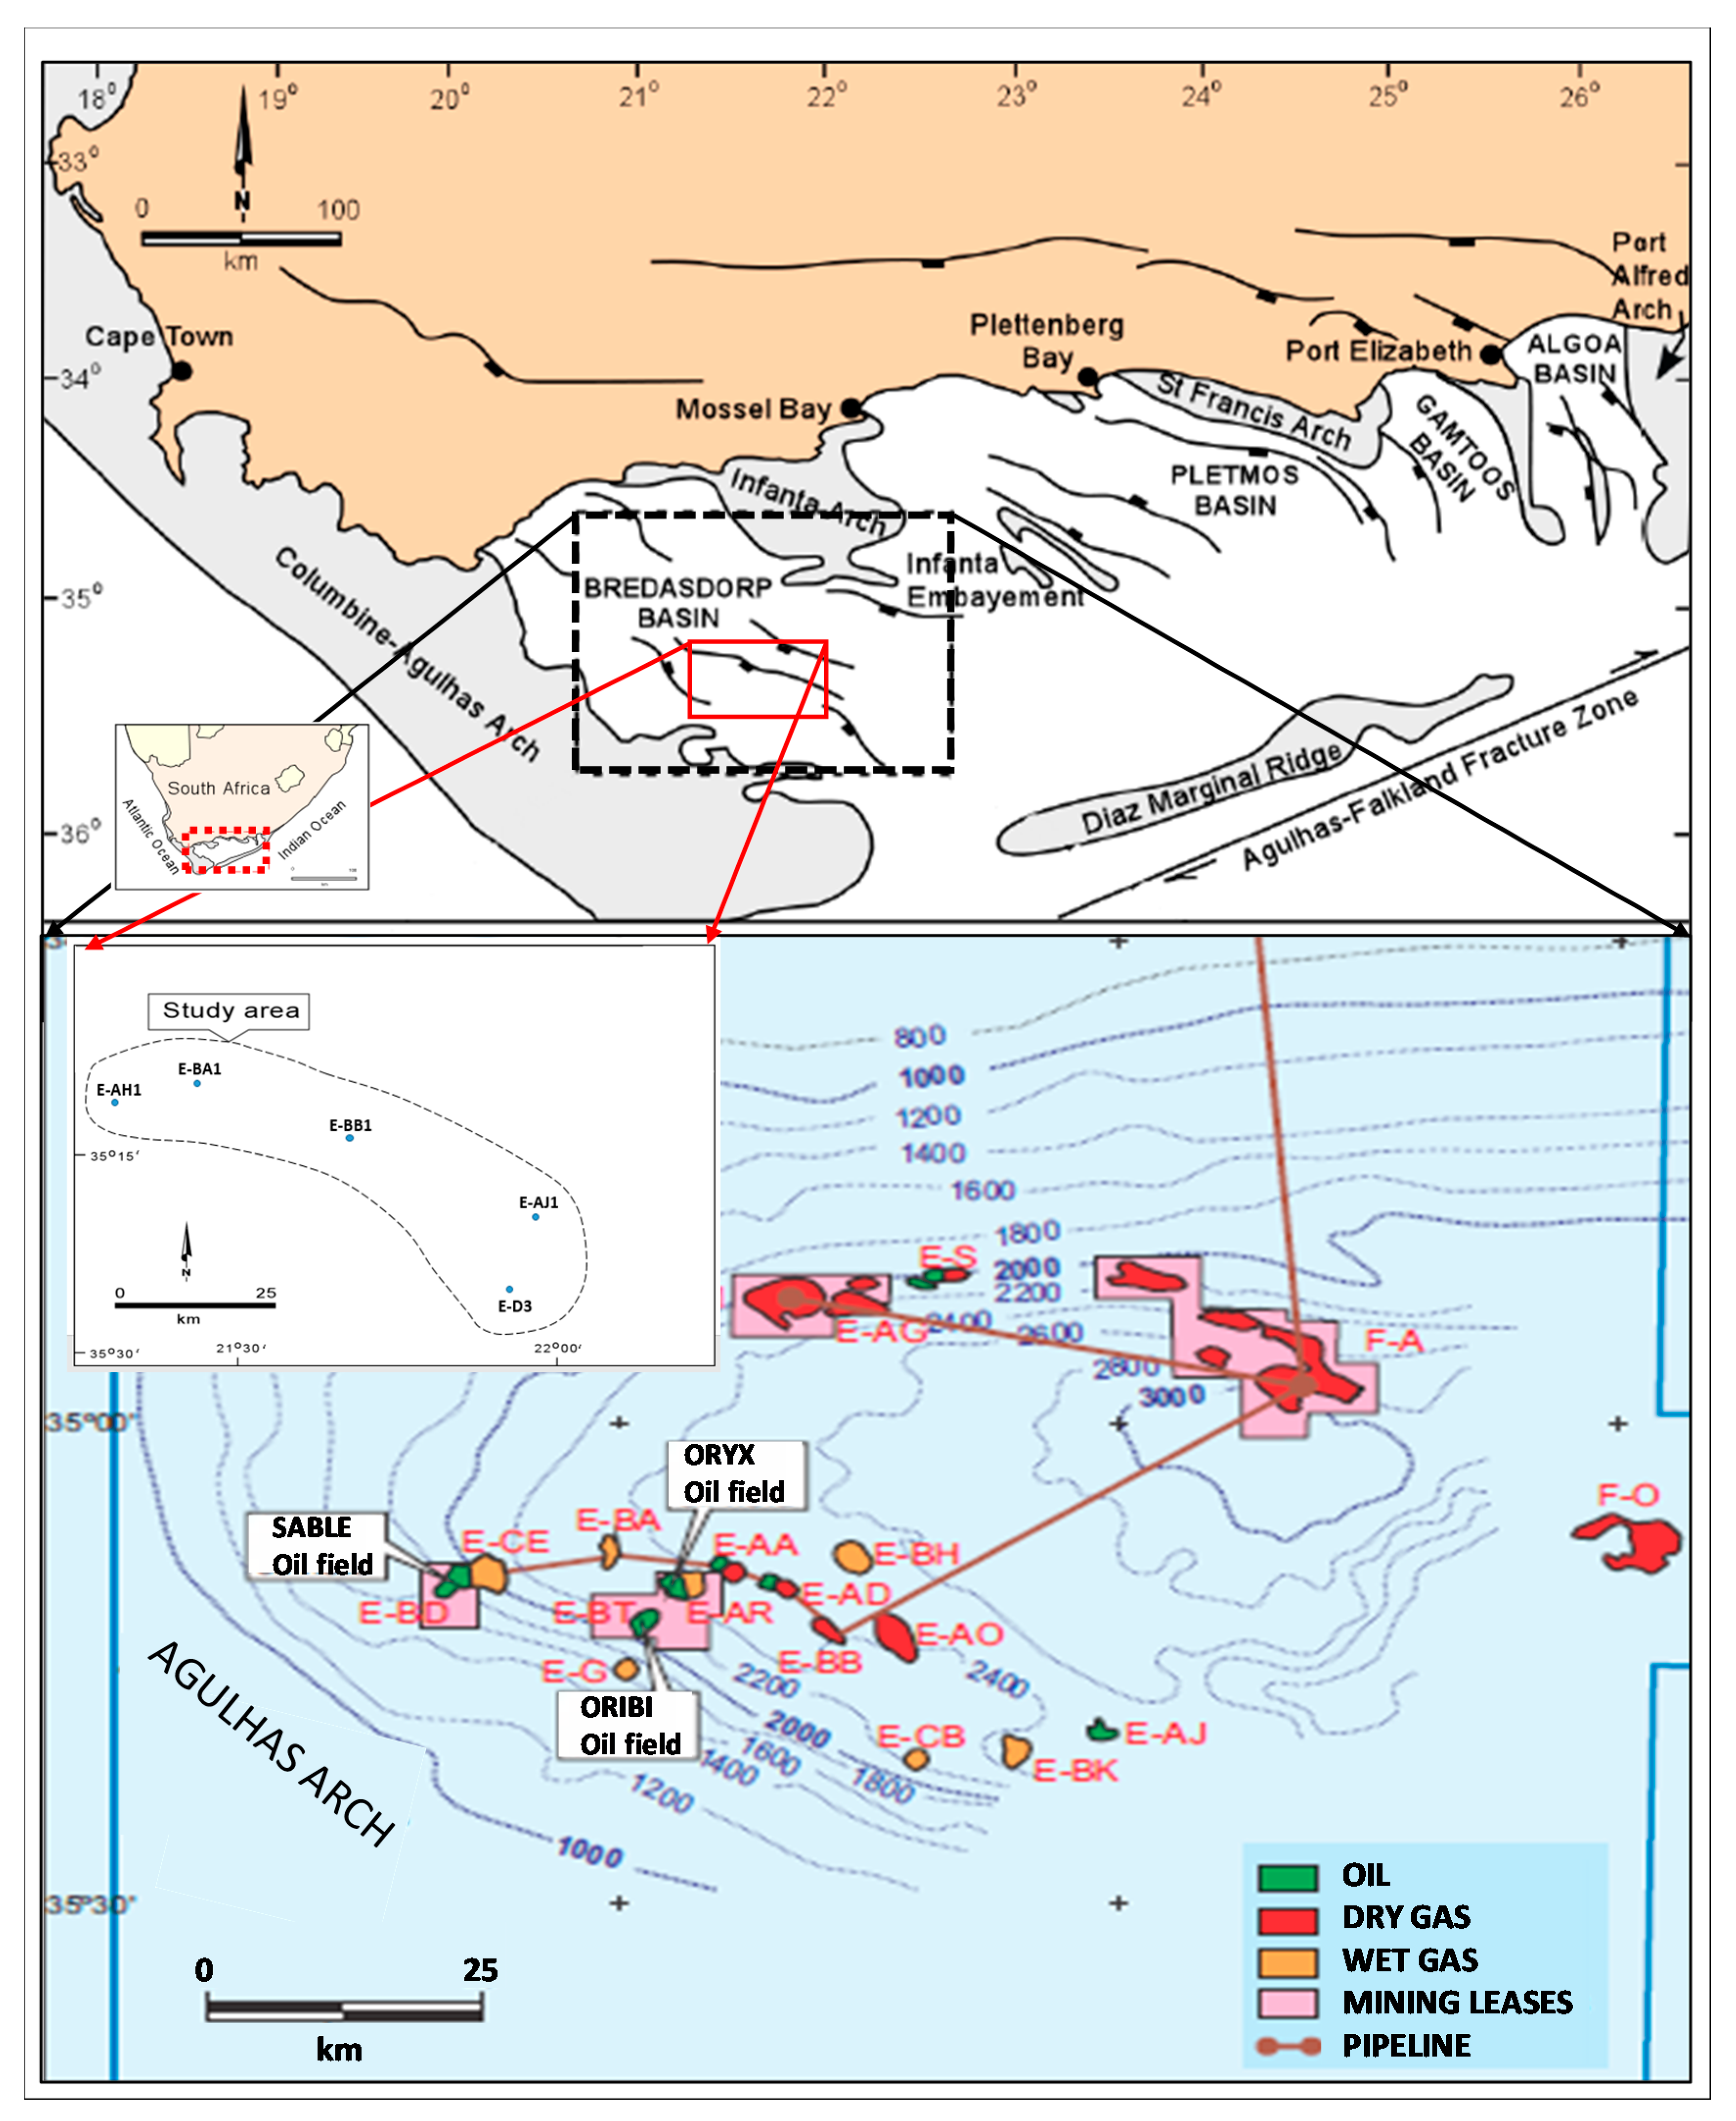
2. Geological Setting
3. Materials and Methods
4. Results
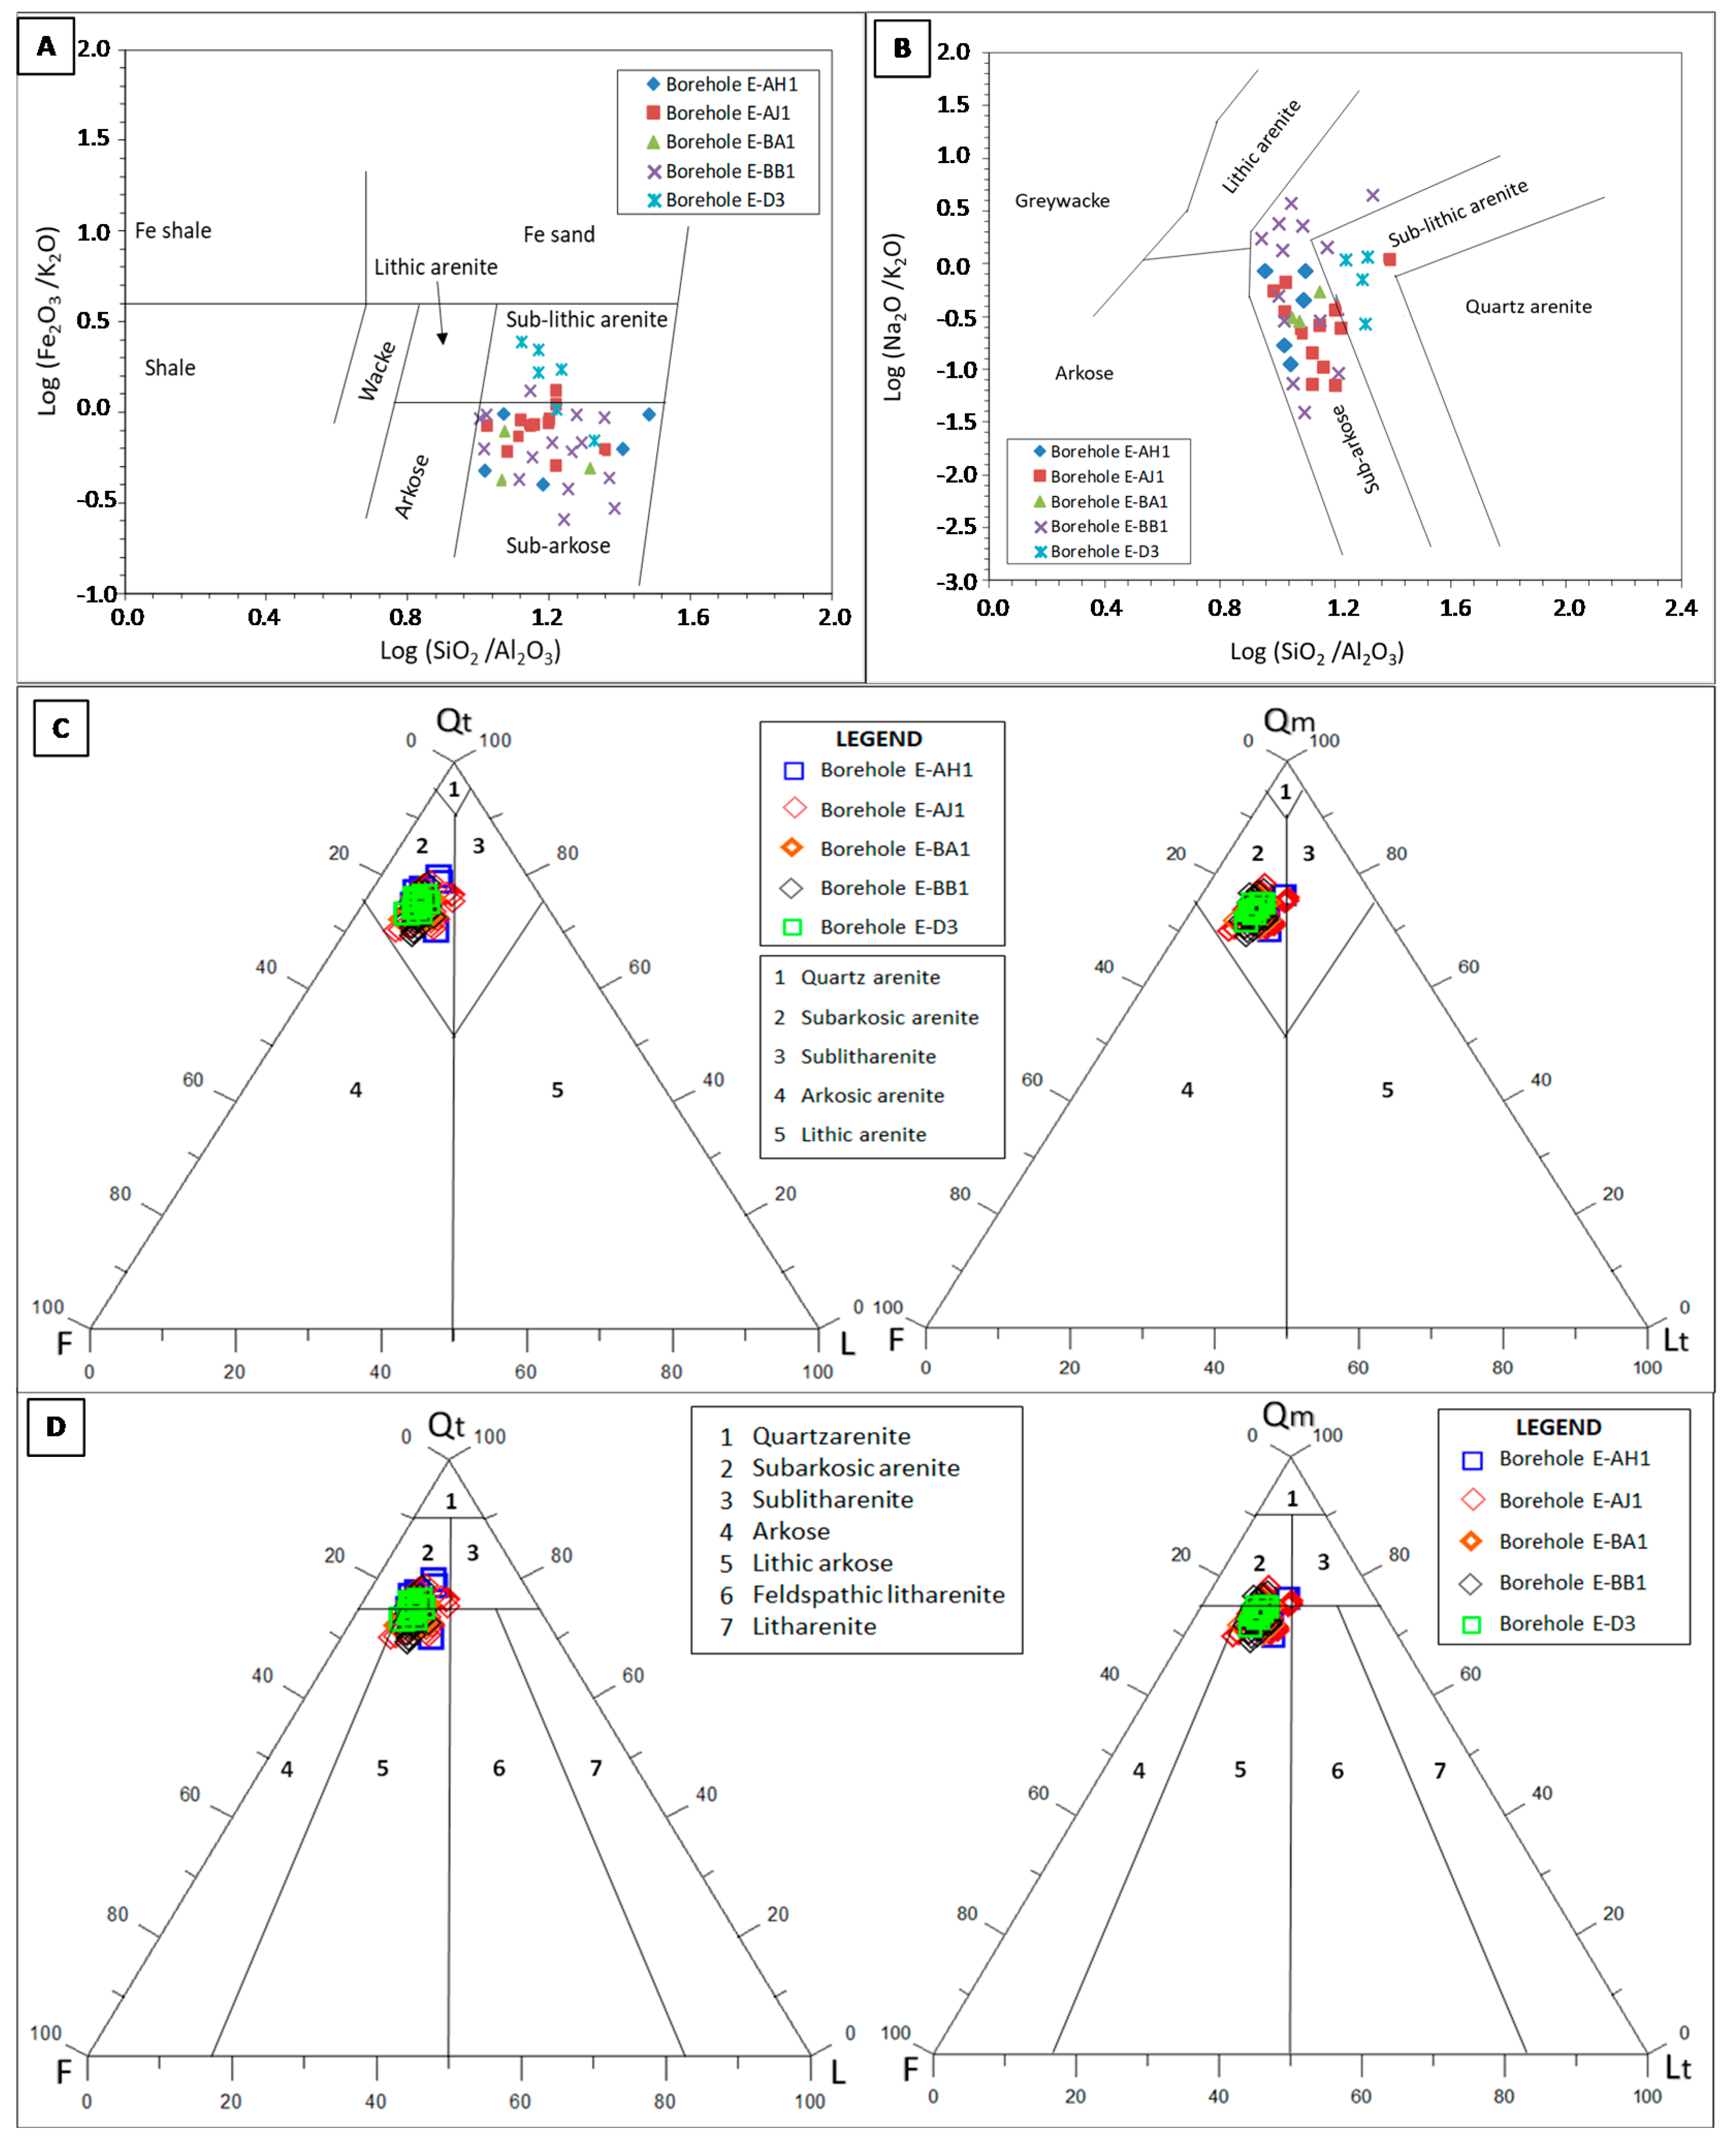
4.1. Major Oxides
4.2. Modal Composition
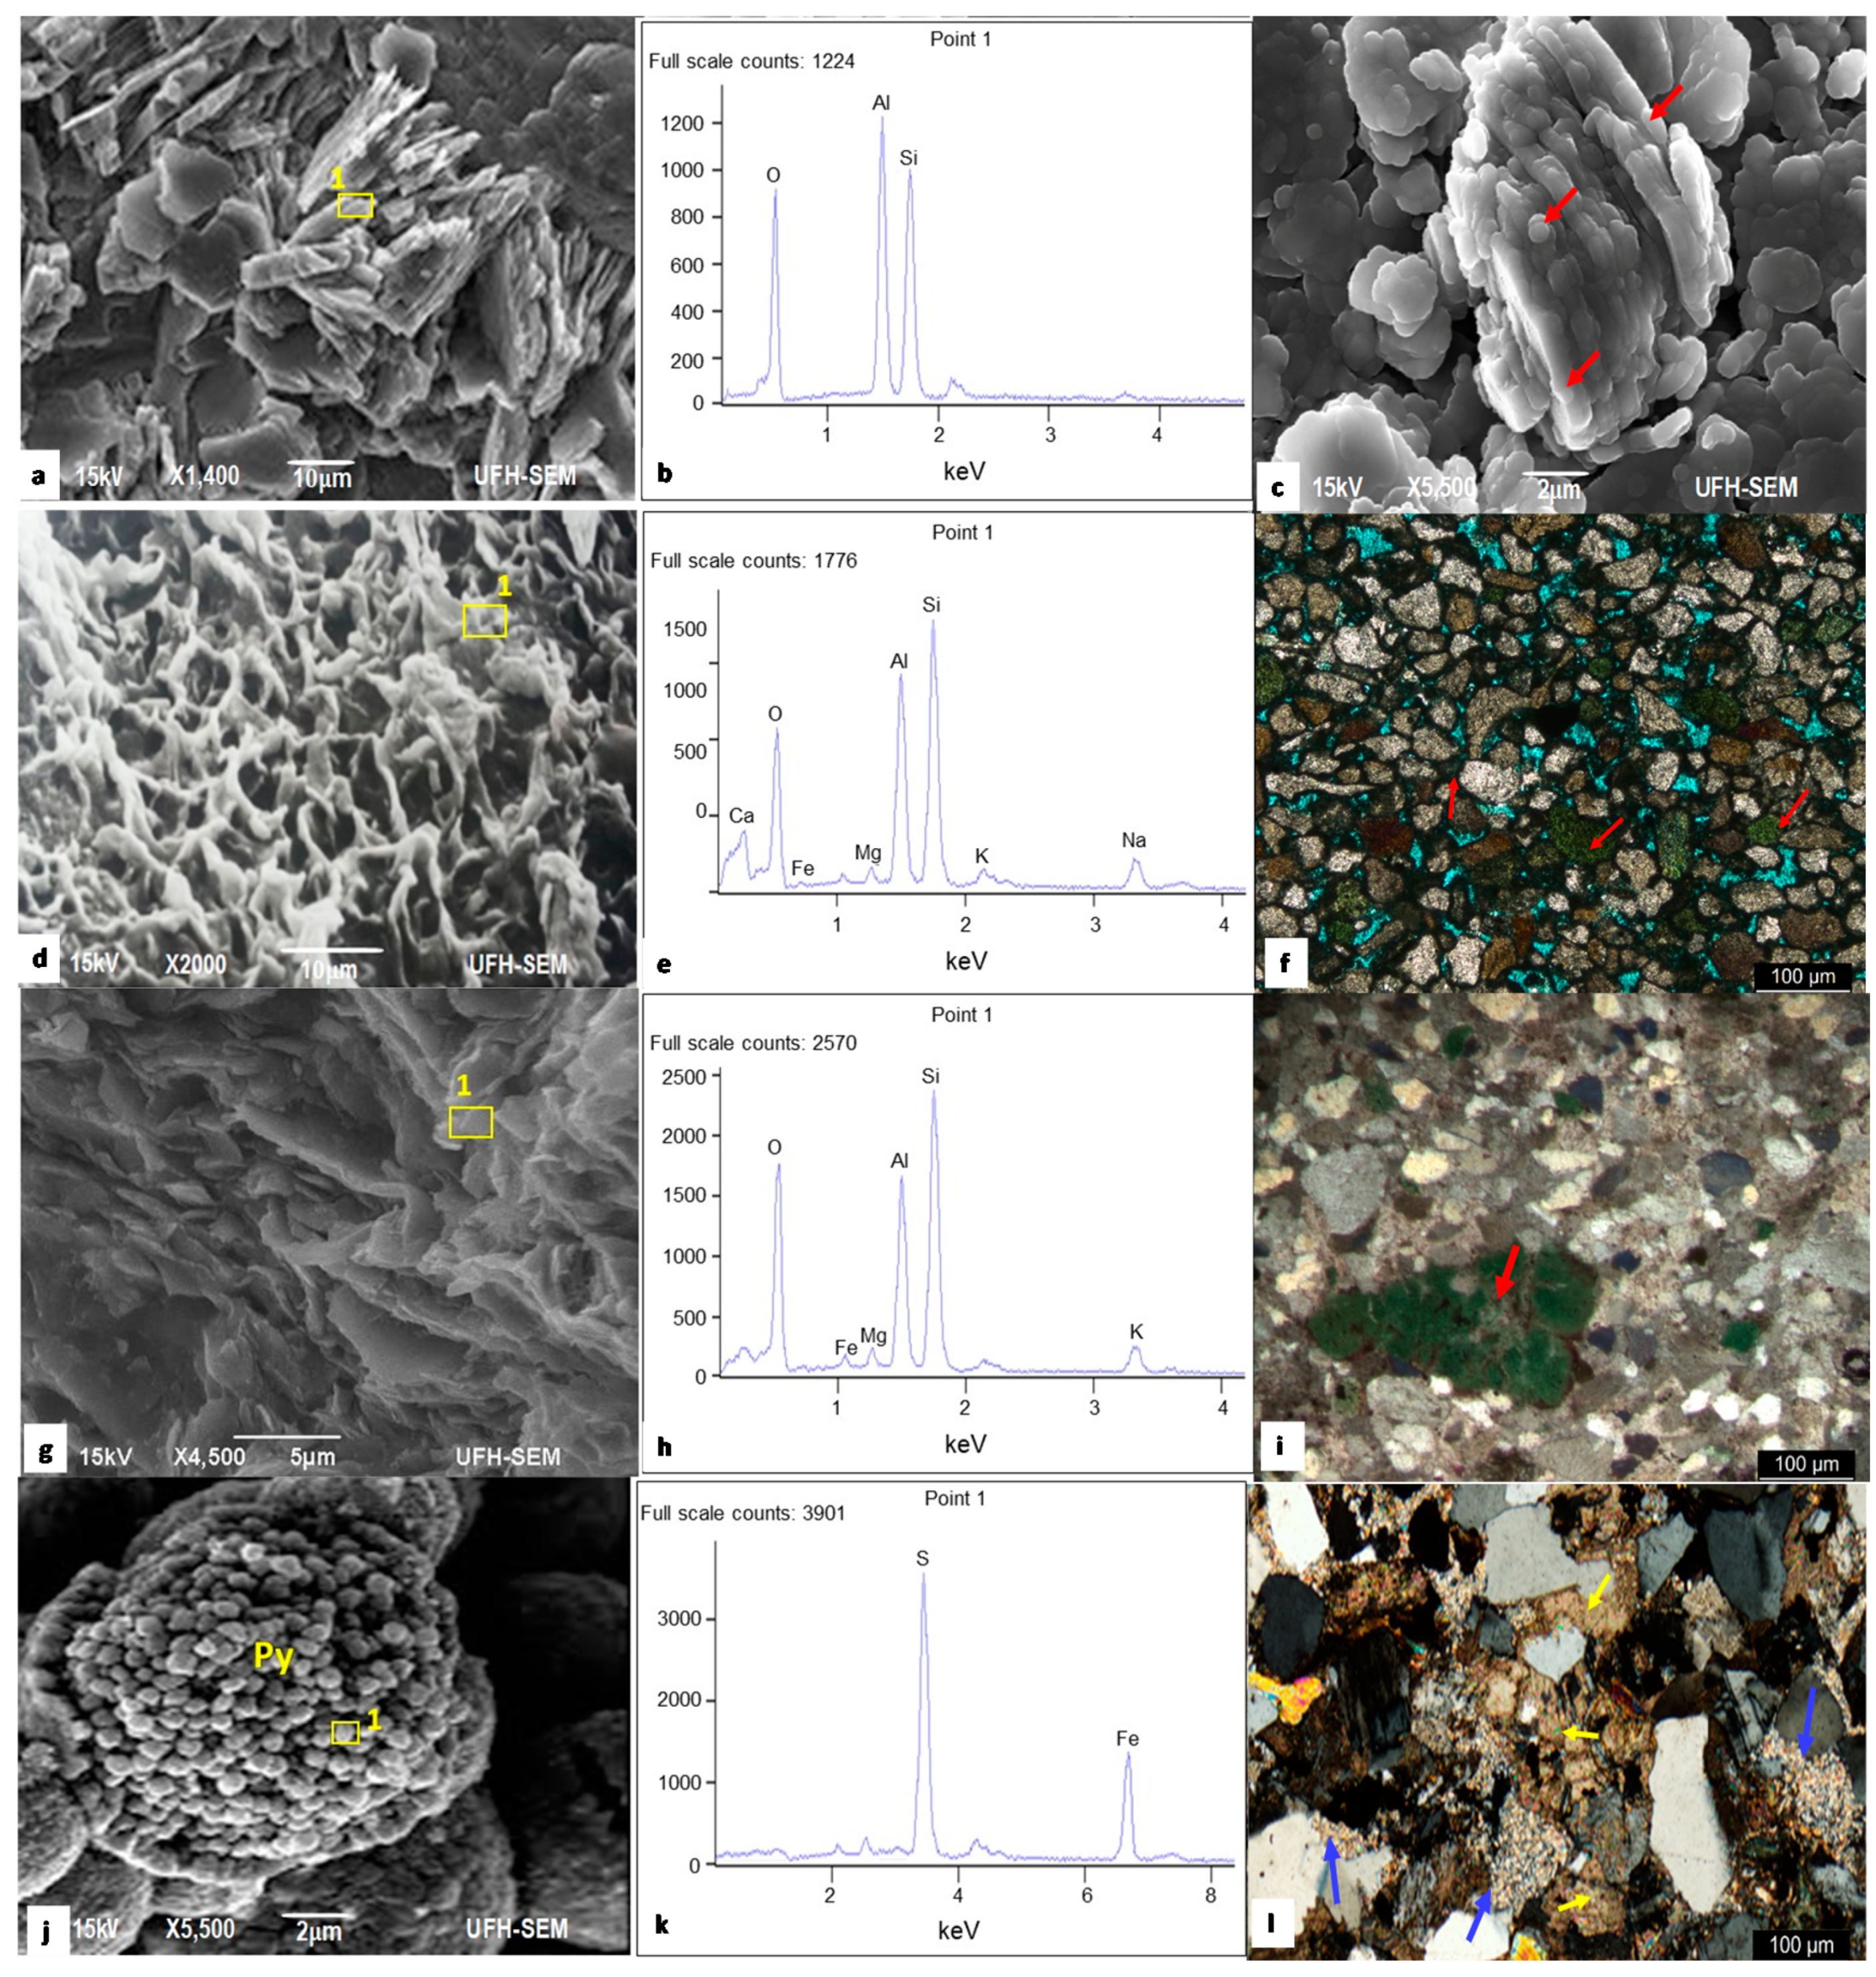
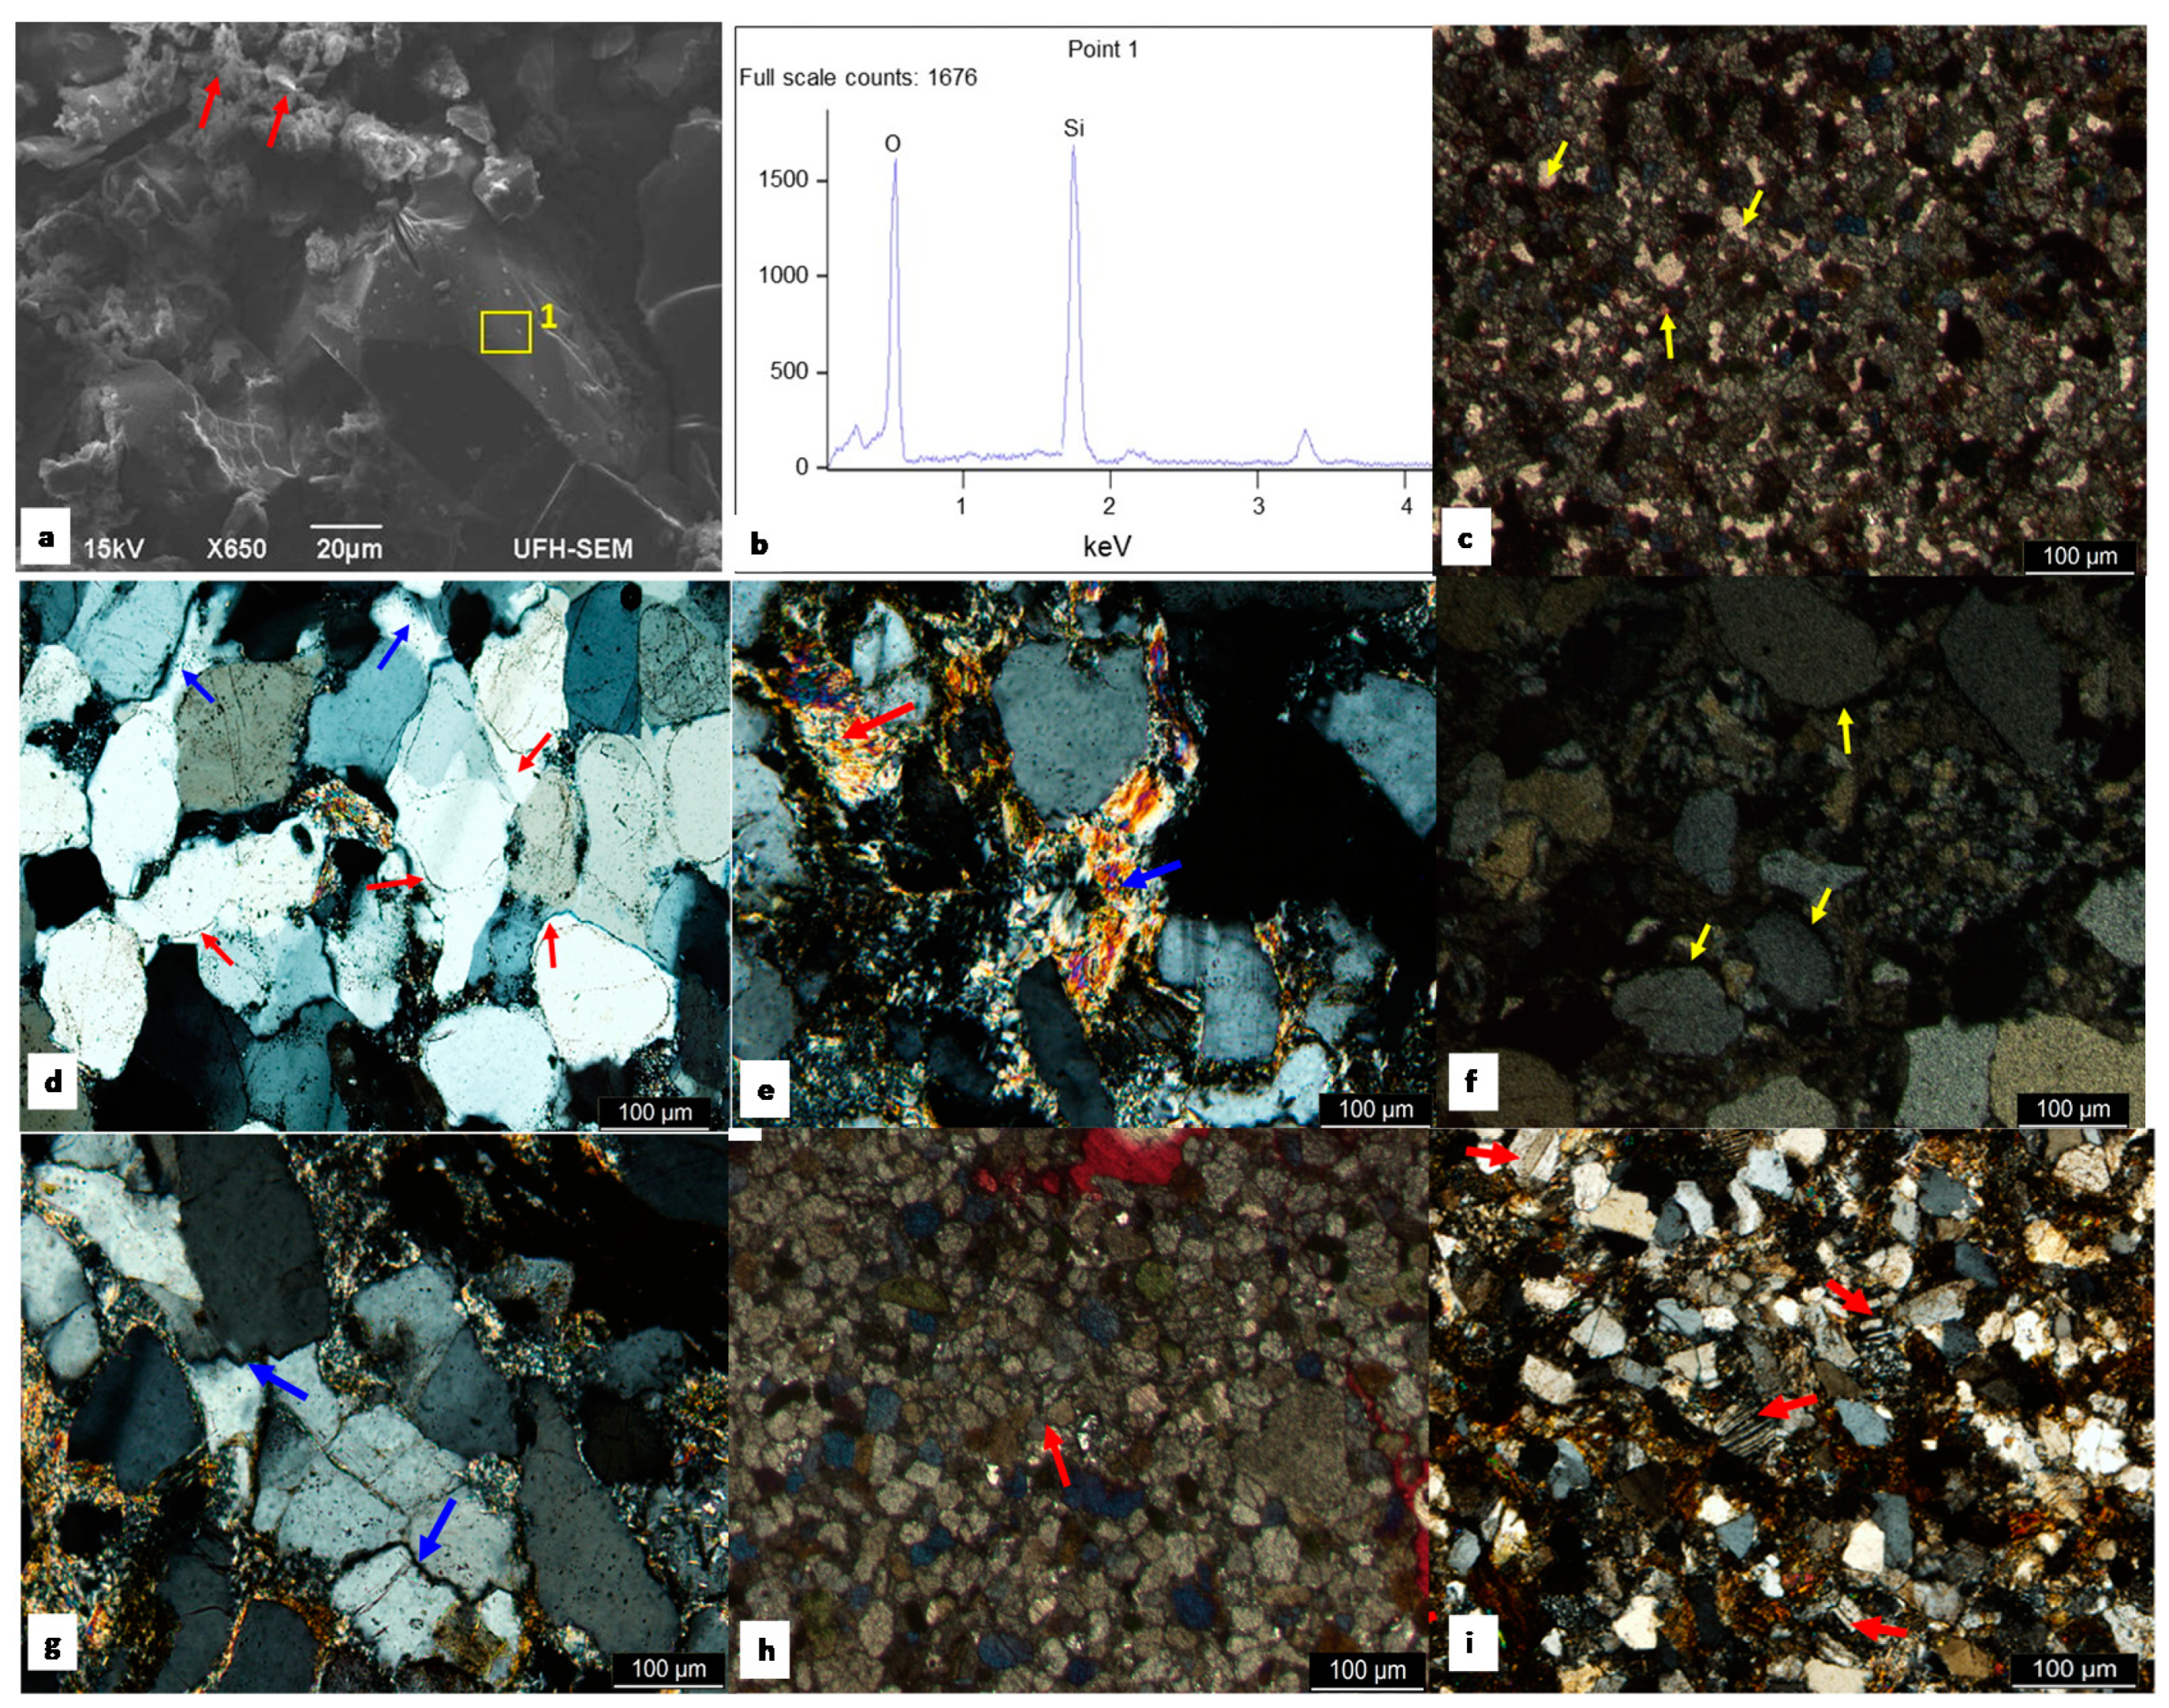
4.3. Mineralogy of the Bredasdorp Sandstones
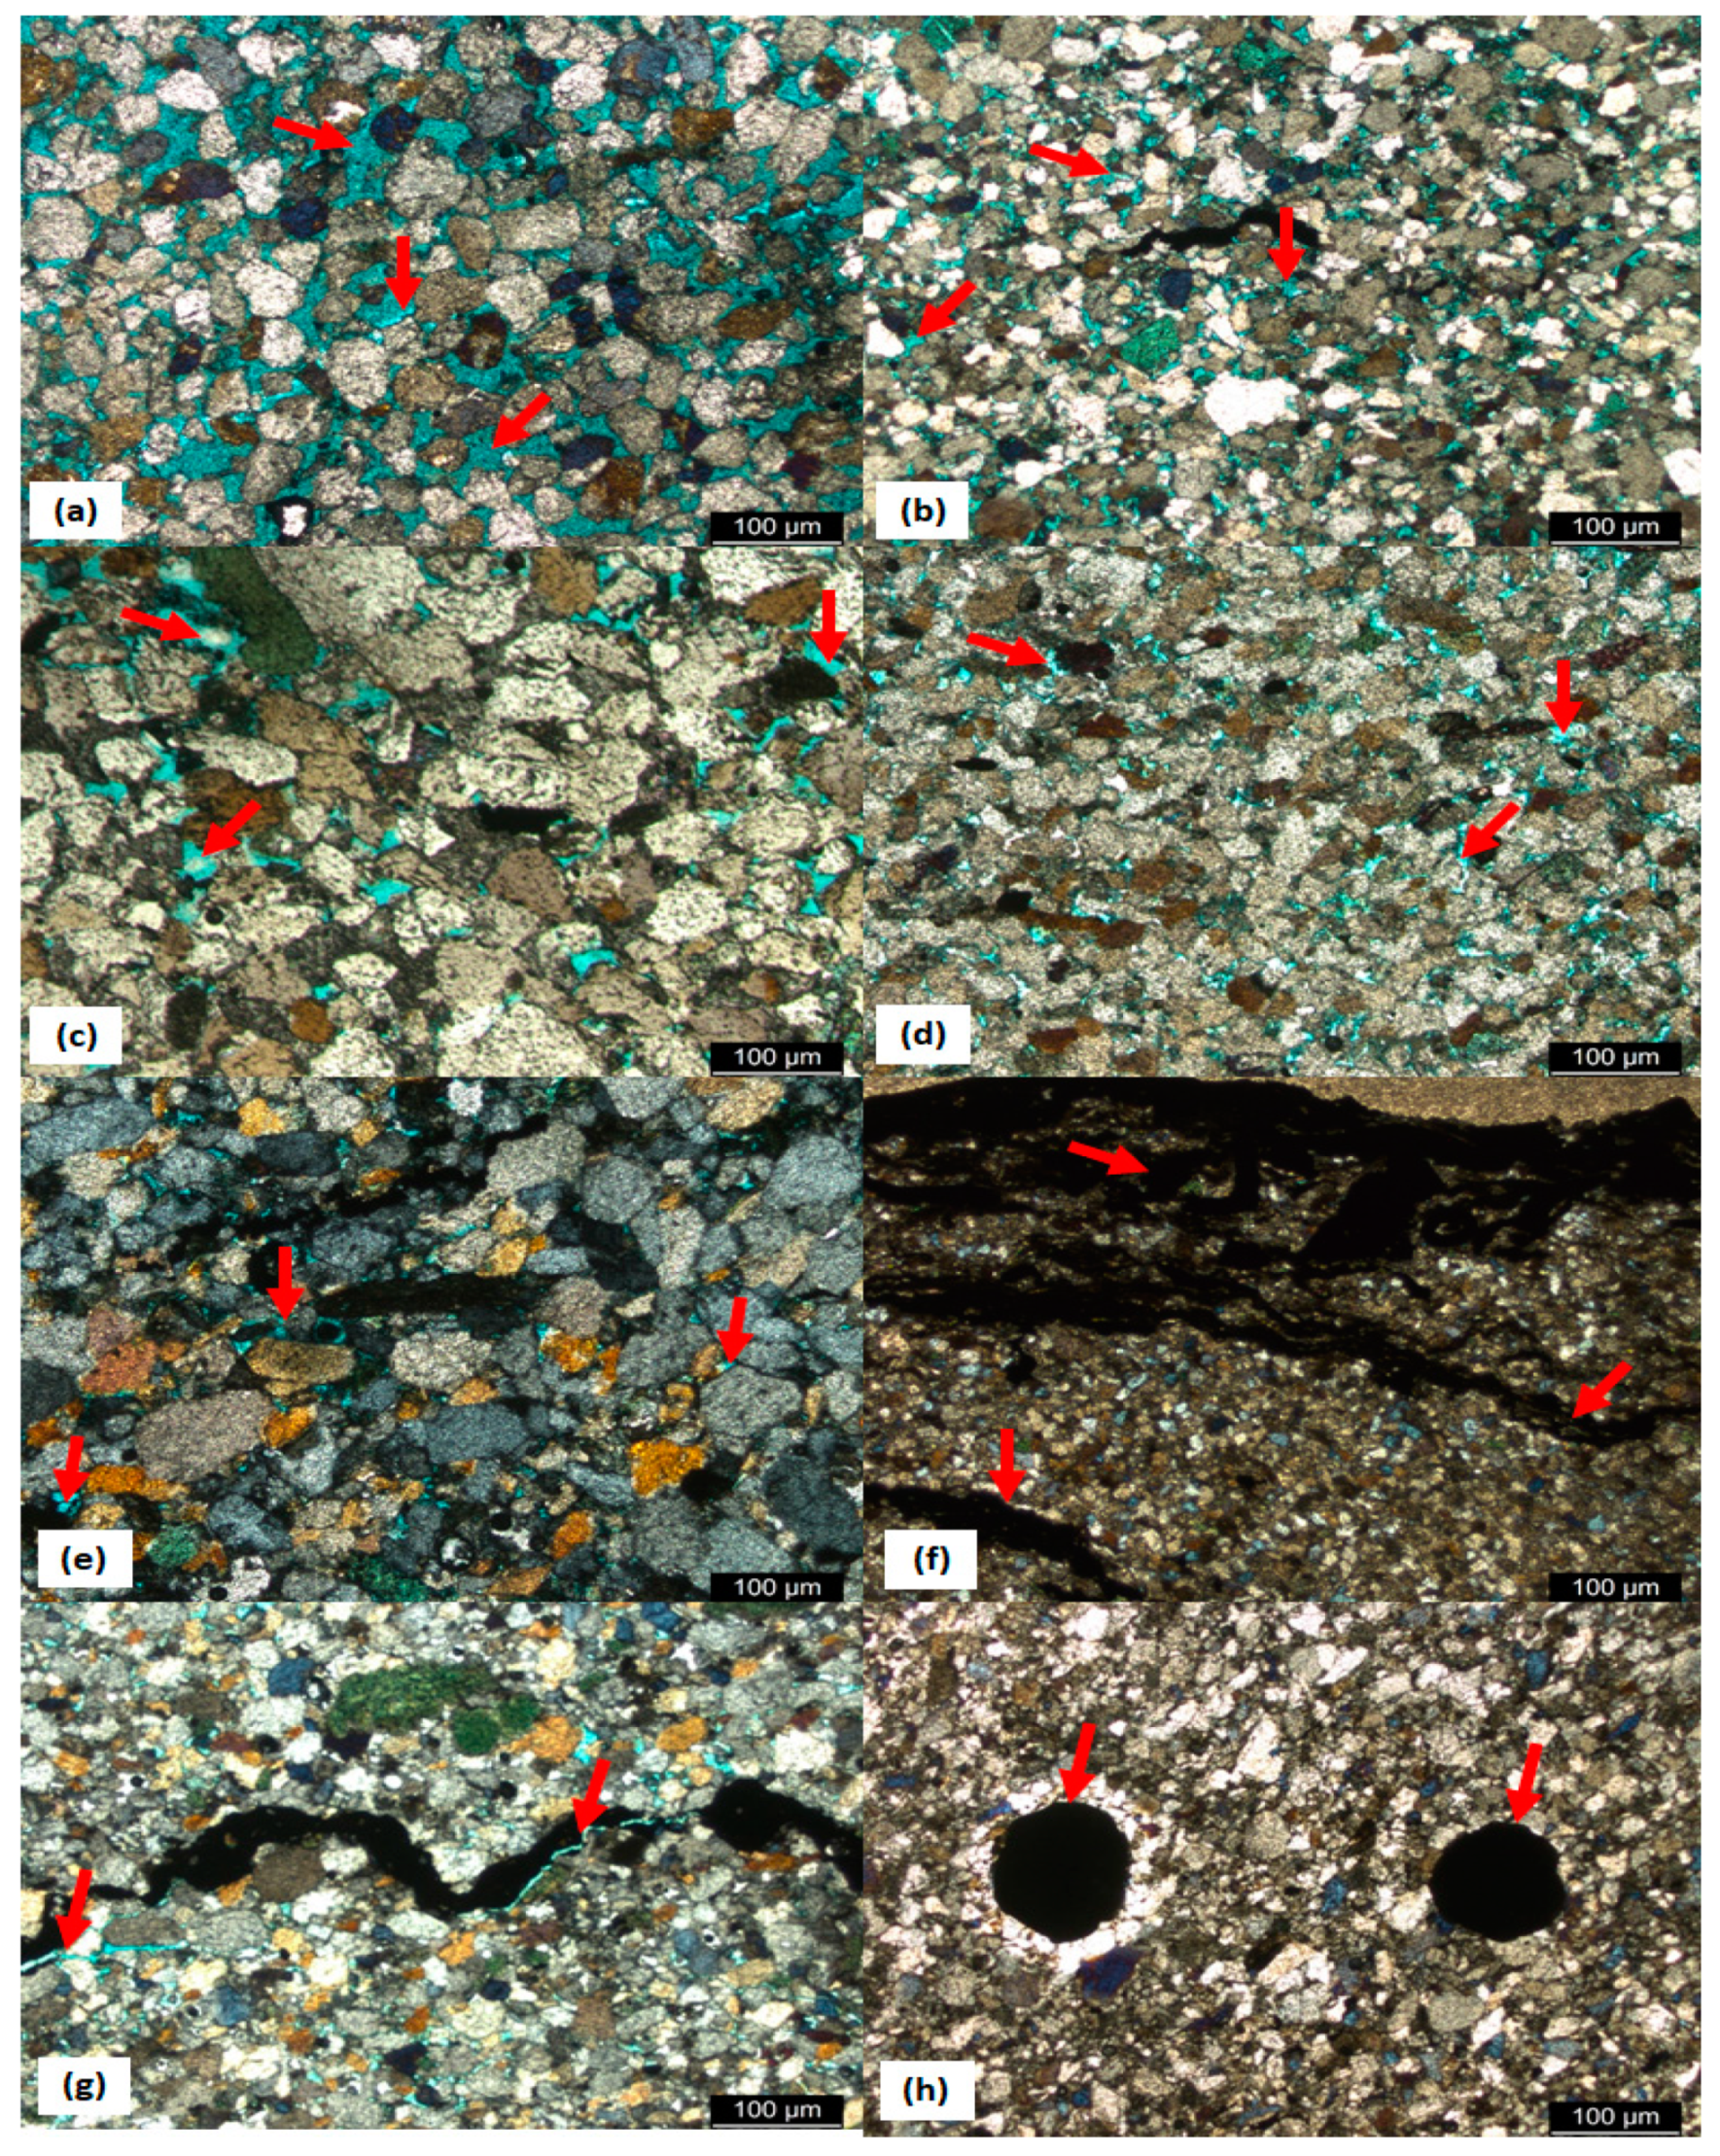
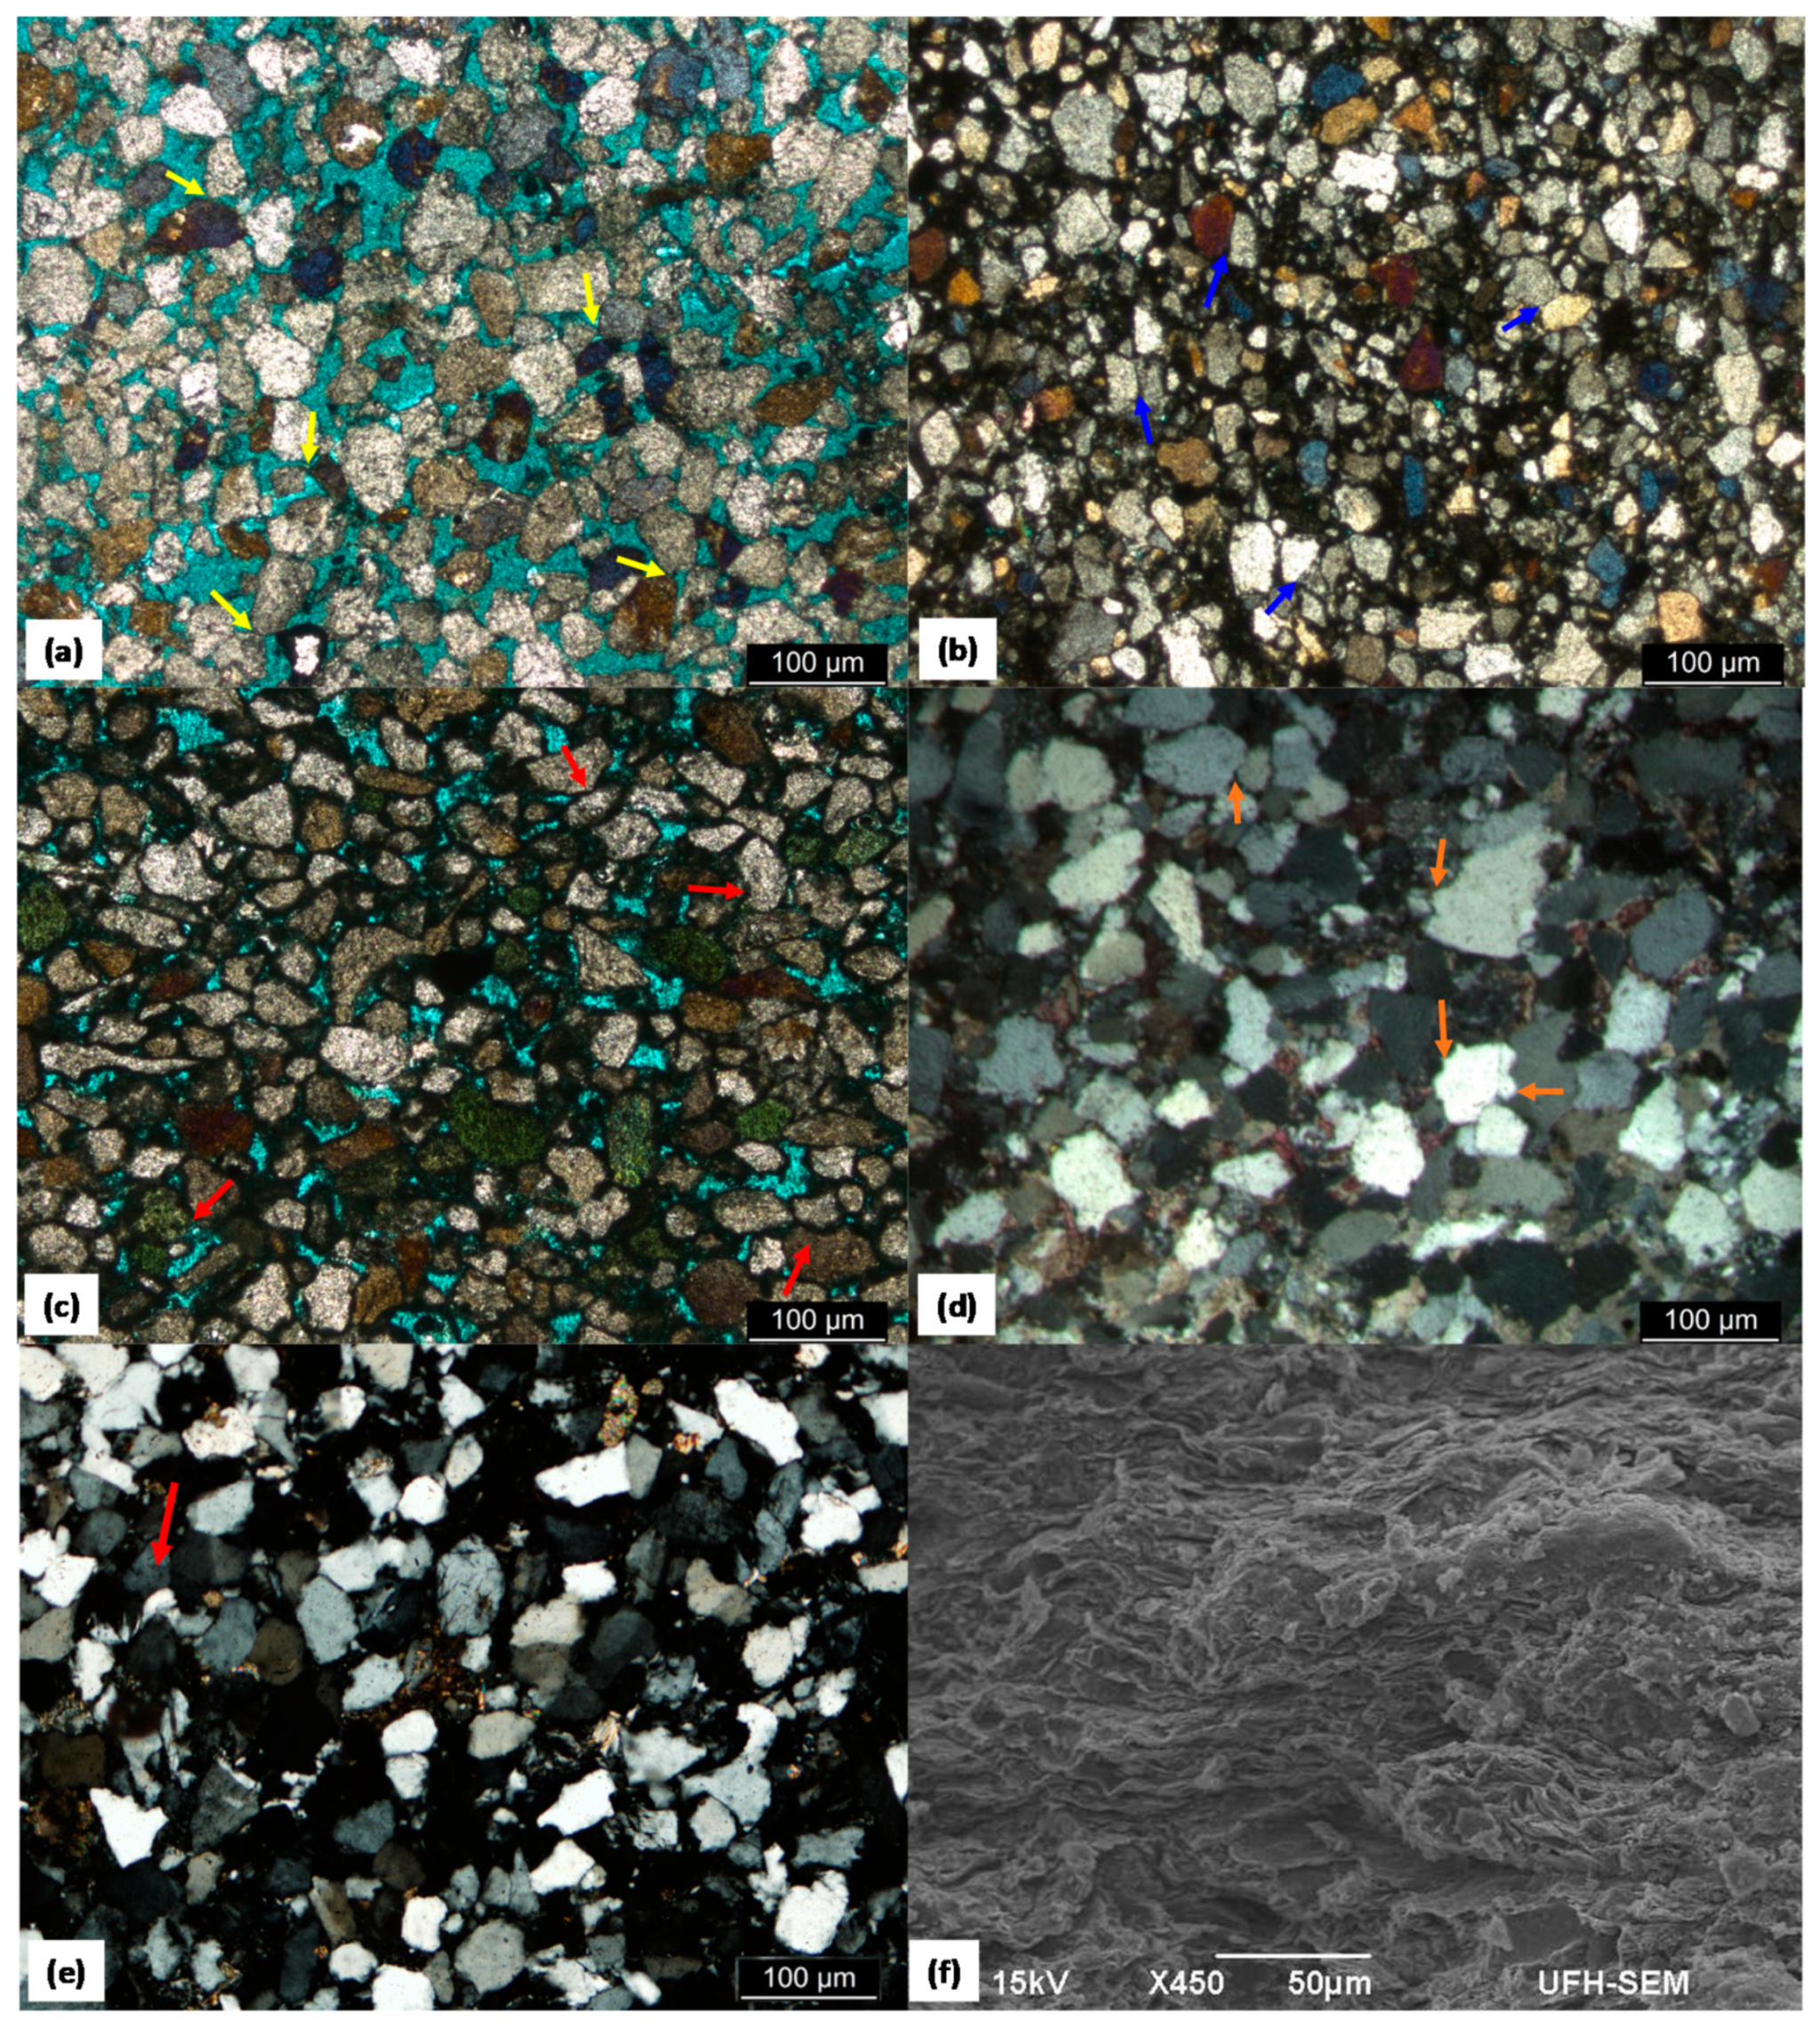
4.4. Diagenesis of the Bredasdorp Sandstones
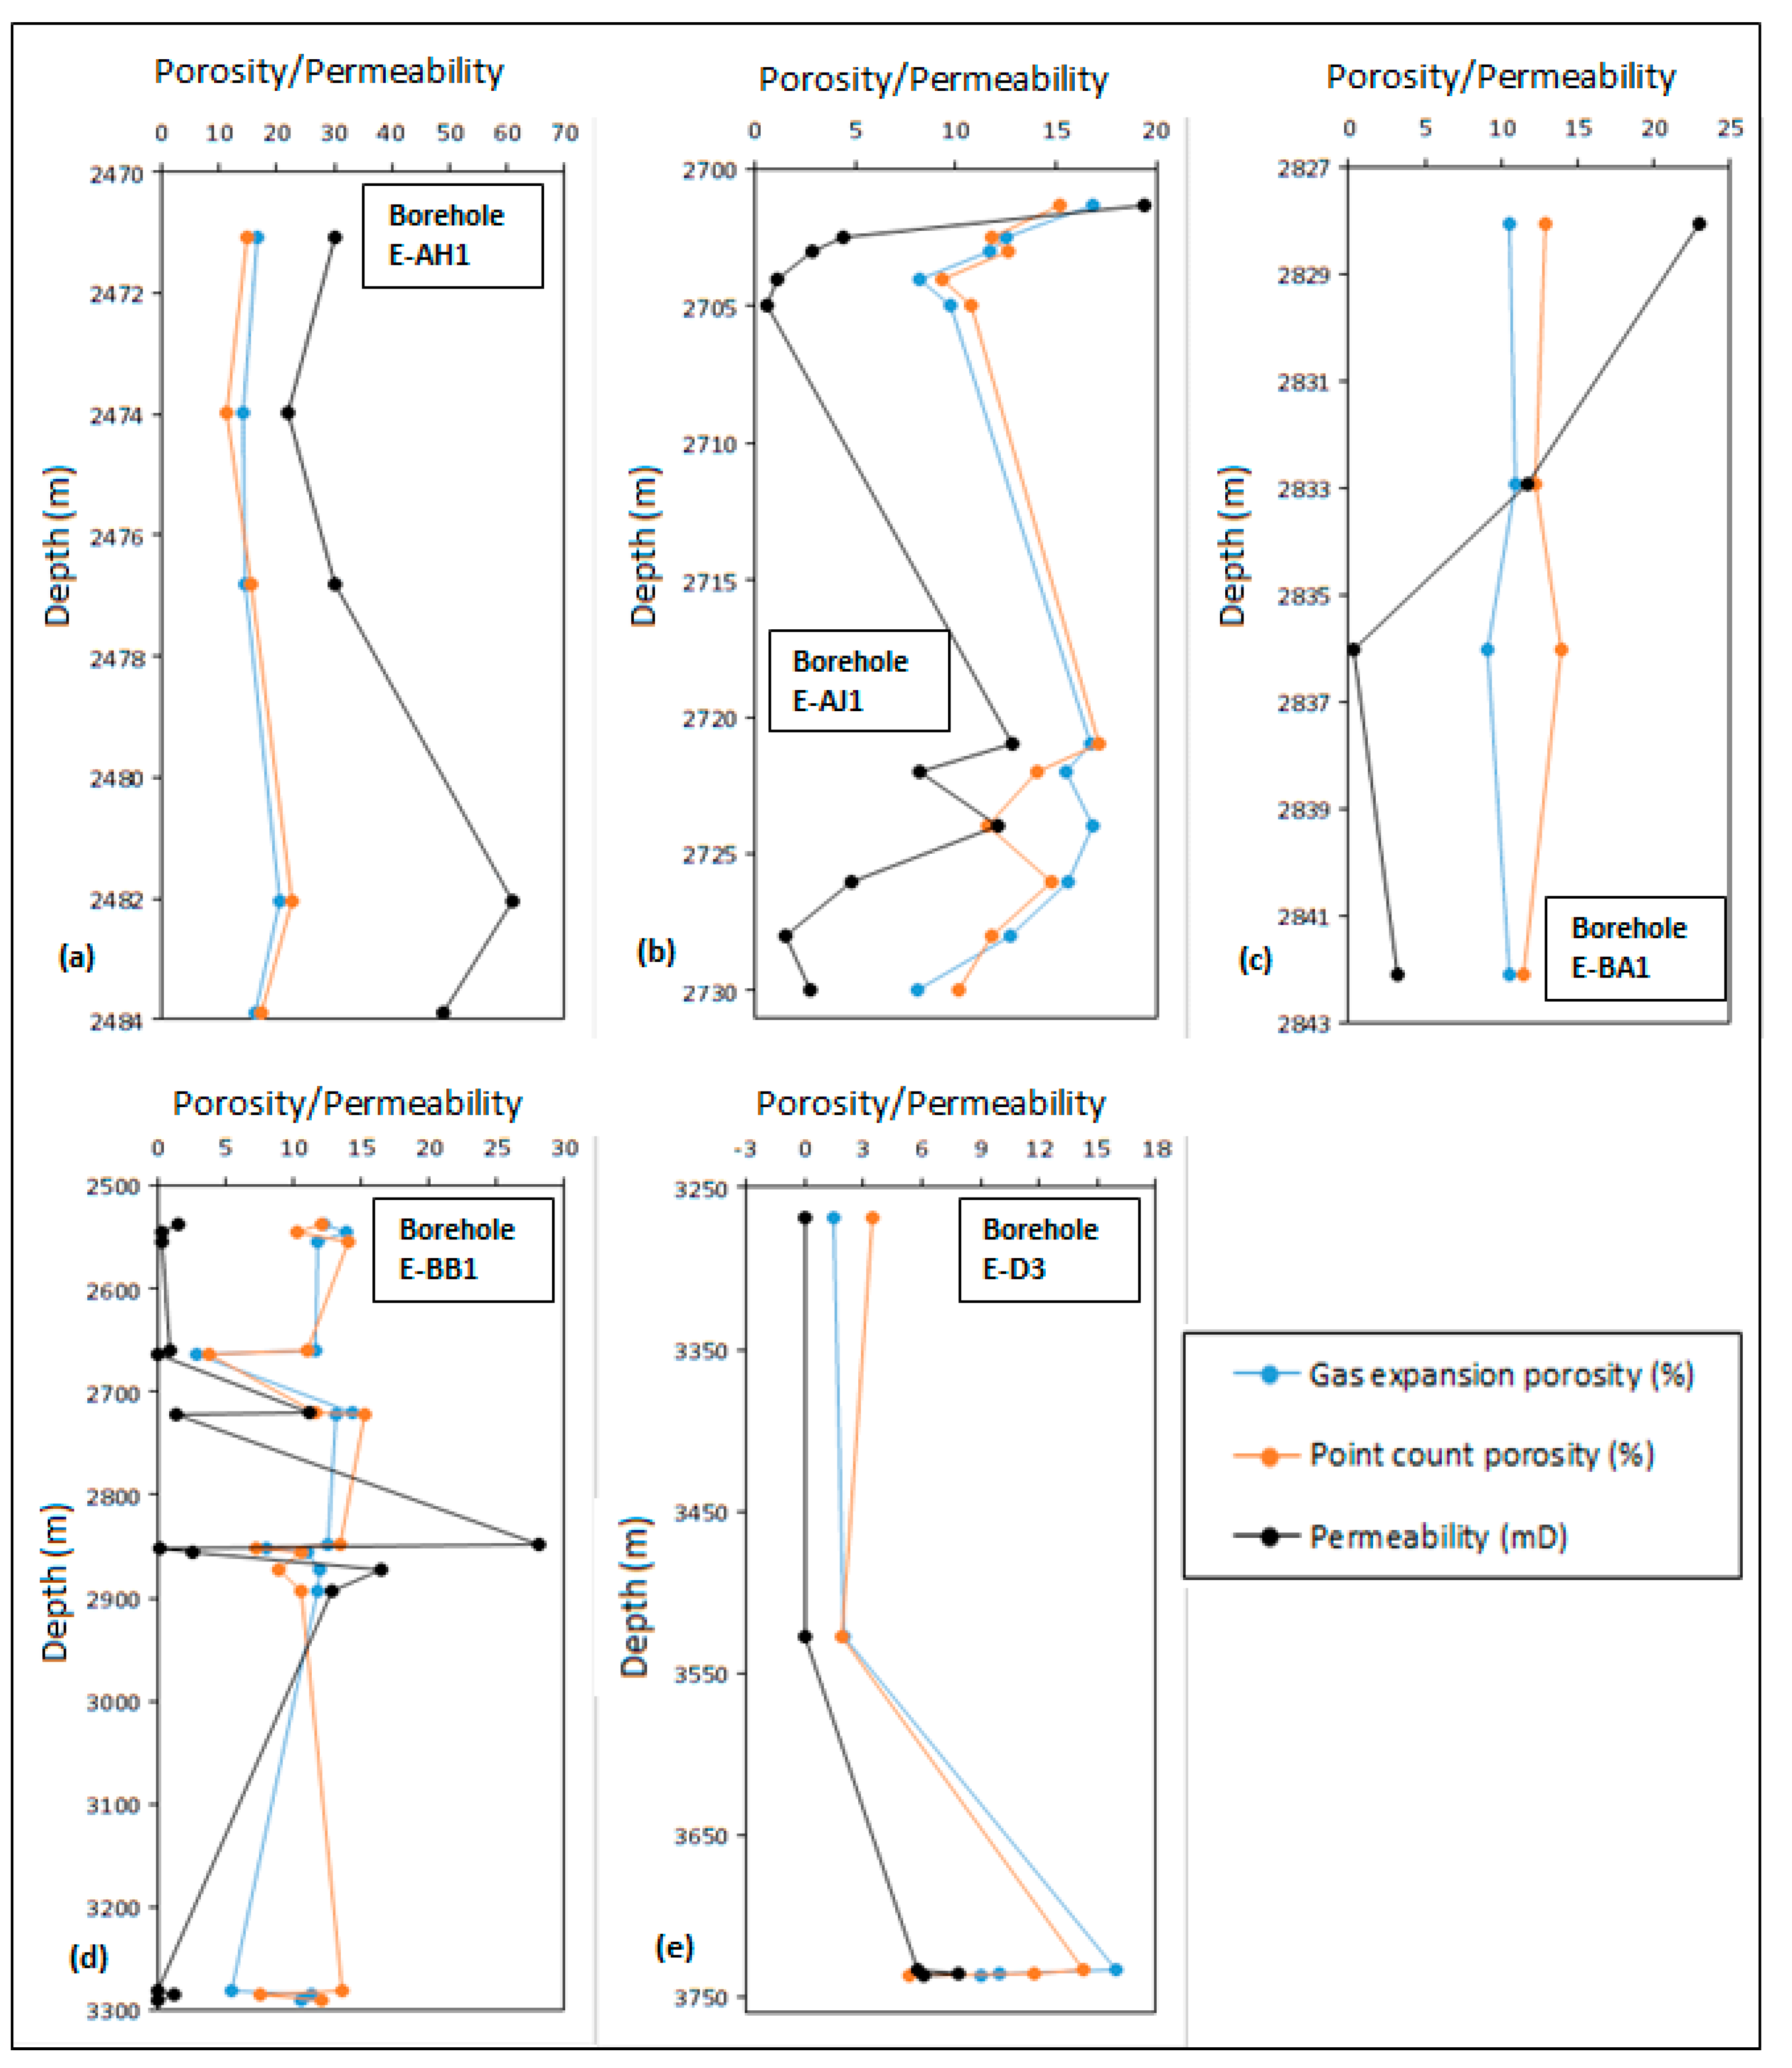
4.5. Porosity and Permeability
5. Discussion
5.1. Sandstone Classification
5.2. Diagenetic Processes and Stages
5.3. Reservoir Properties
5.4. Implications of Diagenesis for Reservoir Quality
6. Conclusions
Supplementary Materials
Author Contributions
Funding
Acknowledgments
Conflicts of Interest
References
- Bjorlykke, K.; Diagenesis, I. Development in Sedimentology; Chilingarian, G.V., Wolf, K.H., Eds.; Elsevier: Amsterdam, The Netherlands, 1988; Volume 41, pp. 555–588. [Google Scholar]
- Zou, C.; Zhu, R.; Liu, K.; Su, L.; Bai, B.; Zhang, X.; Yuan, X.; Wang, J. Tight gas sandstone reservoirs in China: Characteristics and recognition criteria. J. Pet. Sci. Eng. 2012, 88, 82–91. [Google Scholar] [CrossRef]
- Baiyegunhi, C.; Liu, K.; Gwavava, O. Diagenesis and reservoir properties of the Permian Ecca Group sandstones and mudrocks in the Eastern Cape Province, South Africa. Minerals 2017, 88, 1–26. [Google Scholar]
- Bloch, S.; Lander, R.H.; Bonell, L. Anomalously high porosity and permeability in deeply buried sandstones reservoirs. Origin and predictability. AAPG Bull. 2002, 86, 301–328. [Google Scholar]
- Burley, S.D.; Worden, R.H. (Eds.) Sandstone diagenesis: The evolution of sand to stone. In Sandstone Diagenesis Recent and Ancient; International Association of Sedimentologists Reprint Series; Blackwell Publishing: Malden, MA, USA, 2003; Volume 4, pp. 34–44. [Google Scholar]
- Mackenzie, F.T. Diagenesis, and sedimentary rocks. In Treatise on Geochemistry, 2nd ed.; Elsevier: Oxford, UK, 2005; Volume 7, 446p. [Google Scholar]
- Milliken, K.L. Understanding diagenetic controls on sandstone reservoir quality: A compendium of influential papers. In Getting Started, #4; AAPG/Datapages: Tulsa, OK, USA, 2006. [Google Scholar]
- Ajdukiewicz, J.M.; Lander, R.H. Sandstone reservoir quality prediction: The state of the art. AAPG Bull. 2010, 94, 1083–1091. [Google Scholar] [CrossRef]
- Boggs, S., Jr. Petrology of Sedimentary Rocks, 2nd ed.; Cambridge University Press: Cambridge, UK, 2009; 600p. [Google Scholar]
- Roswell, D.M.; De Swart, A.M.J. Diagenesis in Cape and Karroo sediments, South Africa, and its bearing on their hydrocarbon potential. S. Afr. J. Geol. 1976, 79, 81–145. [Google Scholar]
- Reed, J.S.; Eriksson, K.A.; Kowalewski, M. Climatic, depositional and burial controls on diagenesis of Appalachian Carboniferous sandstones: Qualitative and quantitative methods. Sediment. Geol. 2005, 176, 225–246. [Google Scholar] [CrossRef]
- Macquaker, J.H.S.; Taylor, K.G.; Keller, M.; Polya, D. Compositional controls on early diagenetic pathways in fine-grained sedimentary rocks: Implications for predicting unconventional reservoir attributes of mudstones. AAPG Bull. 2014, 93, 587–603. [Google Scholar] [CrossRef]
- Chima, P.; Baiyegunhi, C.; Liu, K.; Gwavava, O. Diagenesis and rock properties of sandstones from the Stormberg Group, Karoo Supergroup in the Eastern Cape Province of South Africa. Open Geosci. 2018, 10, 740–771. [Google Scholar] [CrossRef]
- Burden, P.L.A. Soekor, partners explore possibilities in Bredasdorp Basin off South Africa. Oil Gas J. 1992, 90, 109–112. [Google Scholar]
- Brown, L.F.; Brink, G.J.; Doherty, S.; Jollands, A.; Jungslager, E.H.A.; Keenan, J.H.G.; Muntigh, A.; van Wyk, N.J.S. Sequence stratigraphy in offshore South African divergent basins: An atlas on exploration for cretaceous lowstand traps, by Soeker (Pty) Ltd. In AAPG Studies in Geology, #41; AAPG/Datapages: Tulsa, OK, USA, 1995; pp. 83–131. [Google Scholar]
- Jungslager, E.H.A. Geological Evaluation of the Remaining Prospectivity for Oil and Gas of the Pre-1At1 “Synrift” Succession in Block 9, Republic of South Africa. Unpublished SOEKOR Technical Report SOE-EXP-RPT-0380. 1996; 63p. [Google Scholar]
- McMillan, I.K.; Brink, G.J.; Broad, D.S.; Maier, J.J. Late Mesozoic sedimentary basins off the south coast of South Africa. In Sedimentary Basins of the World—African Basins; Selley, R.C., Ed.; Elsevier Science Publisher B.V.: Amsterdam, The Netherlands, 1997; pp. 319–376. [Google Scholar]
- Petroleum Geo-Services, PGS. Re-Evaluation of the F-A Field and Satellite; Petroleum Geo-Services, PGS: Cape Town, South Africa, 1999; 57p, Unpublished. [Google Scholar]
- Petroleum Agency South Africa, PASA. Petroleum Exploration in South Africa, Information and Opportunities; Online Report; Petroleum Agency South Africa PASA: Cape Town, South Africa, 2003; pp. 12–15. Available online: http://www.petroleumagencysa.com/images/pdfs/pet_expl_opp_2003fw.pdf (accessed on 17 November 2019).
- Petroleum Agency South Africa, PASA. Petroleum Exploration in South Africa, Information and Opportunities; Online Report; Petroleum Agency South Africa PASA: Cape Town, South Africa, 2005; pp. 16–18. Available online: http://www.petroleumagencysa.com/images/pdfs/pet_expl_opp_2005fw.pdf (accessed on 17 November 2005).
- Petroleum Agency South Africa, PASA. Petroleum Exploration in South Africa, Information and Opportunities; Online Report; Petroleum Agency South Africa PASA: Cape Town, South Africa, 2015; pp. 13–16. Available online: http://www.petroleumagencysa.com/images/pdfs/pet_expl_opp_2009fw.pdf (accessed on 17 November 2009).
- Petroleum Agency South Africa, PASA. Petroleum Exploration in South Africa, Information and Opportunities; Online Report; PASA: Cape Town, South Africa, 2012; pp. 25–29. Available online: http://www.petroleumagencysa.com/images/pdfs/pet_expl_opp_2012fw.pdf (accessed on 17 November 2019).
- Petroleum Agency South Africa, PASA. Petroleum Exploration in South Africa, Information and Opportunities; Online Report; Petroleum Agency South Africa PASA: Cape Town, South Africa, 2015; pp. 1–15. Available online: http://www.petroleumagencysa.com/images/pdfs/pet_expl_opp_2015fw.pdf (accessed on 17 November 2019).
- Broad, D.S.; Jungslager, E.H.A.; McLachlan, I.R.; Roux, J. Offshore Mesozoic Basins. In The Geology of South Africa; Johnson, M.R., Anhaeusser, C.R., Thomas, R.J., Eds.; Geological Society of South Africa, Johannesburg/Council for Geoscience: Pretoria, South Africa, 2006; pp. 553–571. [Google Scholar]
- Tinker, J.; de Wit, M.; Brown, R. Linking source and sink: Evaluating the balance between onshore erosion and offshore sediment accumulation since Gondwana break-up, South Africa. Tectonophysics 2008, 455, 94–103. [Google Scholar] [CrossRef]
- Akinlua, A.; Sigedle, A.; Buthelezi, T.; Fadipe, O.A. Trace element geochemistry of crude oils and condensates from South African Basins. Mar. Pet. Geol. 2015, 59, 286–293. [Google Scholar] [CrossRef]
- Liro, L.M.; Dawson, W.C. Reservoir systems of selected basins of the South Atlantic. In Petroleum System of South Atlantic Margins; Mello, M.R., Katz, B.J., Eds.; American Association of Petroleum Geologists: Tulsa, OK, USA, 2000; Volume 73, pp. 77–92. [Google Scholar]
- Menger-Allogo, A. Sedimentology and Stratigraphy of Deep-Water Reservoirs in the 9A to 14A Sequences of the Central Bredasdorp Basin, Offshore South Africa. Master’s Dissertation, Stellenbosch University, Stellenbosch, South Africa, 2006; 203p. Unpublished. [Google Scholar]
- Dingle, R.V.; Siesser, W.G.; Newton, A.R. Mesozoic and Tertiary Geology of Southern African; American Association for the Advancement of Science: Washington, DC, USA, 1983; pp. 99–106. [Google Scholar]
- De Wit, M.J.; Ransome, I.G. Regional inversion tectonics along the southern margin of Gondwana. In Proceedings of theInversion Tectonics of the Cape Fold Belt, Karoo and Cretaceous Basins of Southern Africa, Cape Town, South Africa, 2–6 December 1991; De Wit, M.J., Ransome, I.G., Eds.; CRC Press: Rotterdam, The Netherlands, 1992; pp. 15–22. [Google Scholar]
- Davies, C.P.N. Unusual biomarker maturation ratio changes through the oil window, a consequence of varied thermal history. Org. Geochem. 1997, 27, 537–560. [Google Scholar] [CrossRef]
- Duncan, R.A. Hotspots in the Southern Ocean, an absolute frame of reference for motion of the Gondwana continent. Tectonophysics 1981, 74, 29–42. [Google Scholar] [CrossRef]
- Hartnady, C.J.H.; Le Roex, A.P. Southern Ocean hotspot tracks and the Cenozoic absolute motion of the African, Antarctic and South American plates. Earth Planet. Sci. Lett. 1985, 75, 245–257. [Google Scholar] [CrossRef]
- Emery, K.O.; Uchapi, E.; Bowin, C.O.; Phillips, J.; Simpson, E.S.W. Continental margin of western Africa: Cape St Francis (South Africa) to Walvis Ridge (South West Africa). AAPG Bull. 1974, 59, 34–59. [Google Scholar]
- Hartnady, C.J.H.; Partridge, T.C. Neotectonic uplift in Southern Africa: A brief review and geodynamic conjecture. In Proceedings of the Centernnial Geocongress Geological Society of South Africa, Johannesburg, South Africa, 3–7 April 1995; Volume 11, pp. 456–459. [Google Scholar]
- Ben-Avraham, Z.; Hartnady, C.J.H.; Malan, J.A. Early tectonic extension between the Agulhas Bank and the Falkland Plateau due to the rotation of the Lafonia microplate. Earth Planet. Sci. Lett. 1993, 117, 43–58. [Google Scholar] [CrossRef]
- Broad, D.S.; Mills, S.R. South Africa offshore exploratory potential in variety of basins. Oil Gas J. 1993, 91, 38–44. [Google Scholar]
- Sonibare, W.A. Structure and Evolution of Basin and Petroleum Systems within a Transform-Related Passive Margin Setting: Data-Based Insights from Crust-Scale 3D Modelling of the Western Bredasdorp Basin, Offshore South Africa. Ph.D. Thesis, Stellenbosch University, Stellenbosch, South Africa, 2015; pp. 16–44. [Google Scholar]
- Peters, K.E.; Cassa, M.R. Applied source rock geochemistry. In The Petroleum System—From Source to Trap; Magoon, L.B., Dow, W.G., Eds.; American Association of Petroleum Geologists: Tulsa, OK, USA, 1994; Volume 60, pp. 93–120. [Google Scholar]
- McCarthy, K.; Rojas, K.; Niemann, M.; Palmowski, D.; Peters, K.; Stankiewicz, A. Basic petroleum geochemistry for source rock evaluation. Oil Field Rev. 2011, 23, 32–43. [Google Scholar]
- Acho, B.C. Assessing Hydrocarbon Potential in Cretaceous Sediments in the Western Bredasdorp Sub-Basin in the Outeniqua Basin South Africa. Master’s Dissertation, University of Western Cape, Cape Town, South Africa, 2015; 197p. Unpublished. [Google Scholar]
- Burden, P.L.A.; Davies, C.P.N. Exploration to first production on block 9 off South Africa. Oil Gas J. 1997, 1, 92–98. [Google Scholar]
- Davies, C.P.N. Geochemical Correlation of Oils in 14A Reservoirs in Wells E-BT1, EBTO1P, E-AR1, E-AA1 and E-AD1. SOEKOR Unpublished Report, SOE-GCH-RPT-131. 1994; 41p. [Google Scholar]
- Dickinson, W.R.; Suczek, C. Plate tectonics and sandstone composition. AAPG Bull. 1979, 63, 2164–2194. [Google Scholar]
- Dickinson, W.R.; Beard, S.; Brakenbridge, F.; Erjavec, J.; Fergusion, R.; Inman, K.; Knepp, R.; Linberg, P.; Ryberg, P. Provenance of the North American Phanerozoic sandstones in relation to tectonic setting. Geol. Soc. Am. Bull. 1983, 64, 222–235. [Google Scholar] [CrossRef]
- Rietveld, H.M. The Rietveld method. Phys. Scr. 2014, 89, 1–9. [Google Scholar] [CrossRef]
- Dott, R.H. Wackes, greywacke and matrix: What approach to immature sandstone classification. J. Sediment. Petrol. 1964, 34, 625–632. [Google Scholar]
- Pettijohn, F.J.; Potter, P.E.; Siever, R. Sand and Sandstones; Springer: New York, NY, USA, 1972; 513p. [Google Scholar]
- Pettijohn, F.G.; Potter, P.E.; Siever, R. Sand and Sandstone; Springer: New York, NY, USA, 1973; 618p. [Google Scholar]
- Folk, R.L. Petrology of Sedimentary Rock, 2nd ed.; Hemphill Press: Austin, TX, USA, 1974; 182p. [Google Scholar]
- Pettijohn, F.J.; Potter, P.E.; Siever, R. Sand and Sandstone; Springer: New York, NY, USA, 1987; 553p. [Google Scholar]
- Herron, M.M. Geochemical classification of terrigenous sands and shales from core or log data. J. Sediment. Petrol. 1988, 58, 820–829. [Google Scholar]


| Stage | Period | Phase | Major Event | Hydrocarbon Potential | Maturity (Ro%) |
|---|---|---|---|---|---|
| 1 | middle Jurassic to Valanginian (Basement to 1At1) | Synrift I | Extension-instigated or driven subsidence and syndrift basin fill. Isostatic uplift on both side of the half-graben led to significant reduction in the erosion of Synrift I sediments. Great or intensive marginal uplift and erosion of the northern part of the basin removed the whole Synrift I succession in some places | Dry Gas Or Oil and non- hydrocarbons | 1.0–1.5% |
| 2 | late Valanginian to Hauterivian (1At1 to 6At1) | Synrift II | Fast subsidence and extensive flooding. Continued or non-stop uplift caused additional truncation or reduction of structural highs. The deposition of deepwater sediments happened within rift depocentres (Southern Sub-Basin and Arniston Half-graben) led to the deposition of source rocks | Gas | 0.9–1.5% |
| 3 | Hauterivian to Aptian (6At1 to 13At1) | Transitional (Early Drift) | Progradation enlargement of the shelf in the northern part over the Arniston Half-graben, plus a sustained deepening of the Southern Sub-Basin | Wet Gas-Oil | 0.8–1.3% |
| 4 | Aptian to Maastrichtian (13At1 to 15At1) | Middle Drift | Regional subsidence instigated by thermal cooling and sediment loading. Continued movement on the Arniston Fault | Oil | 0.7–1.2% |
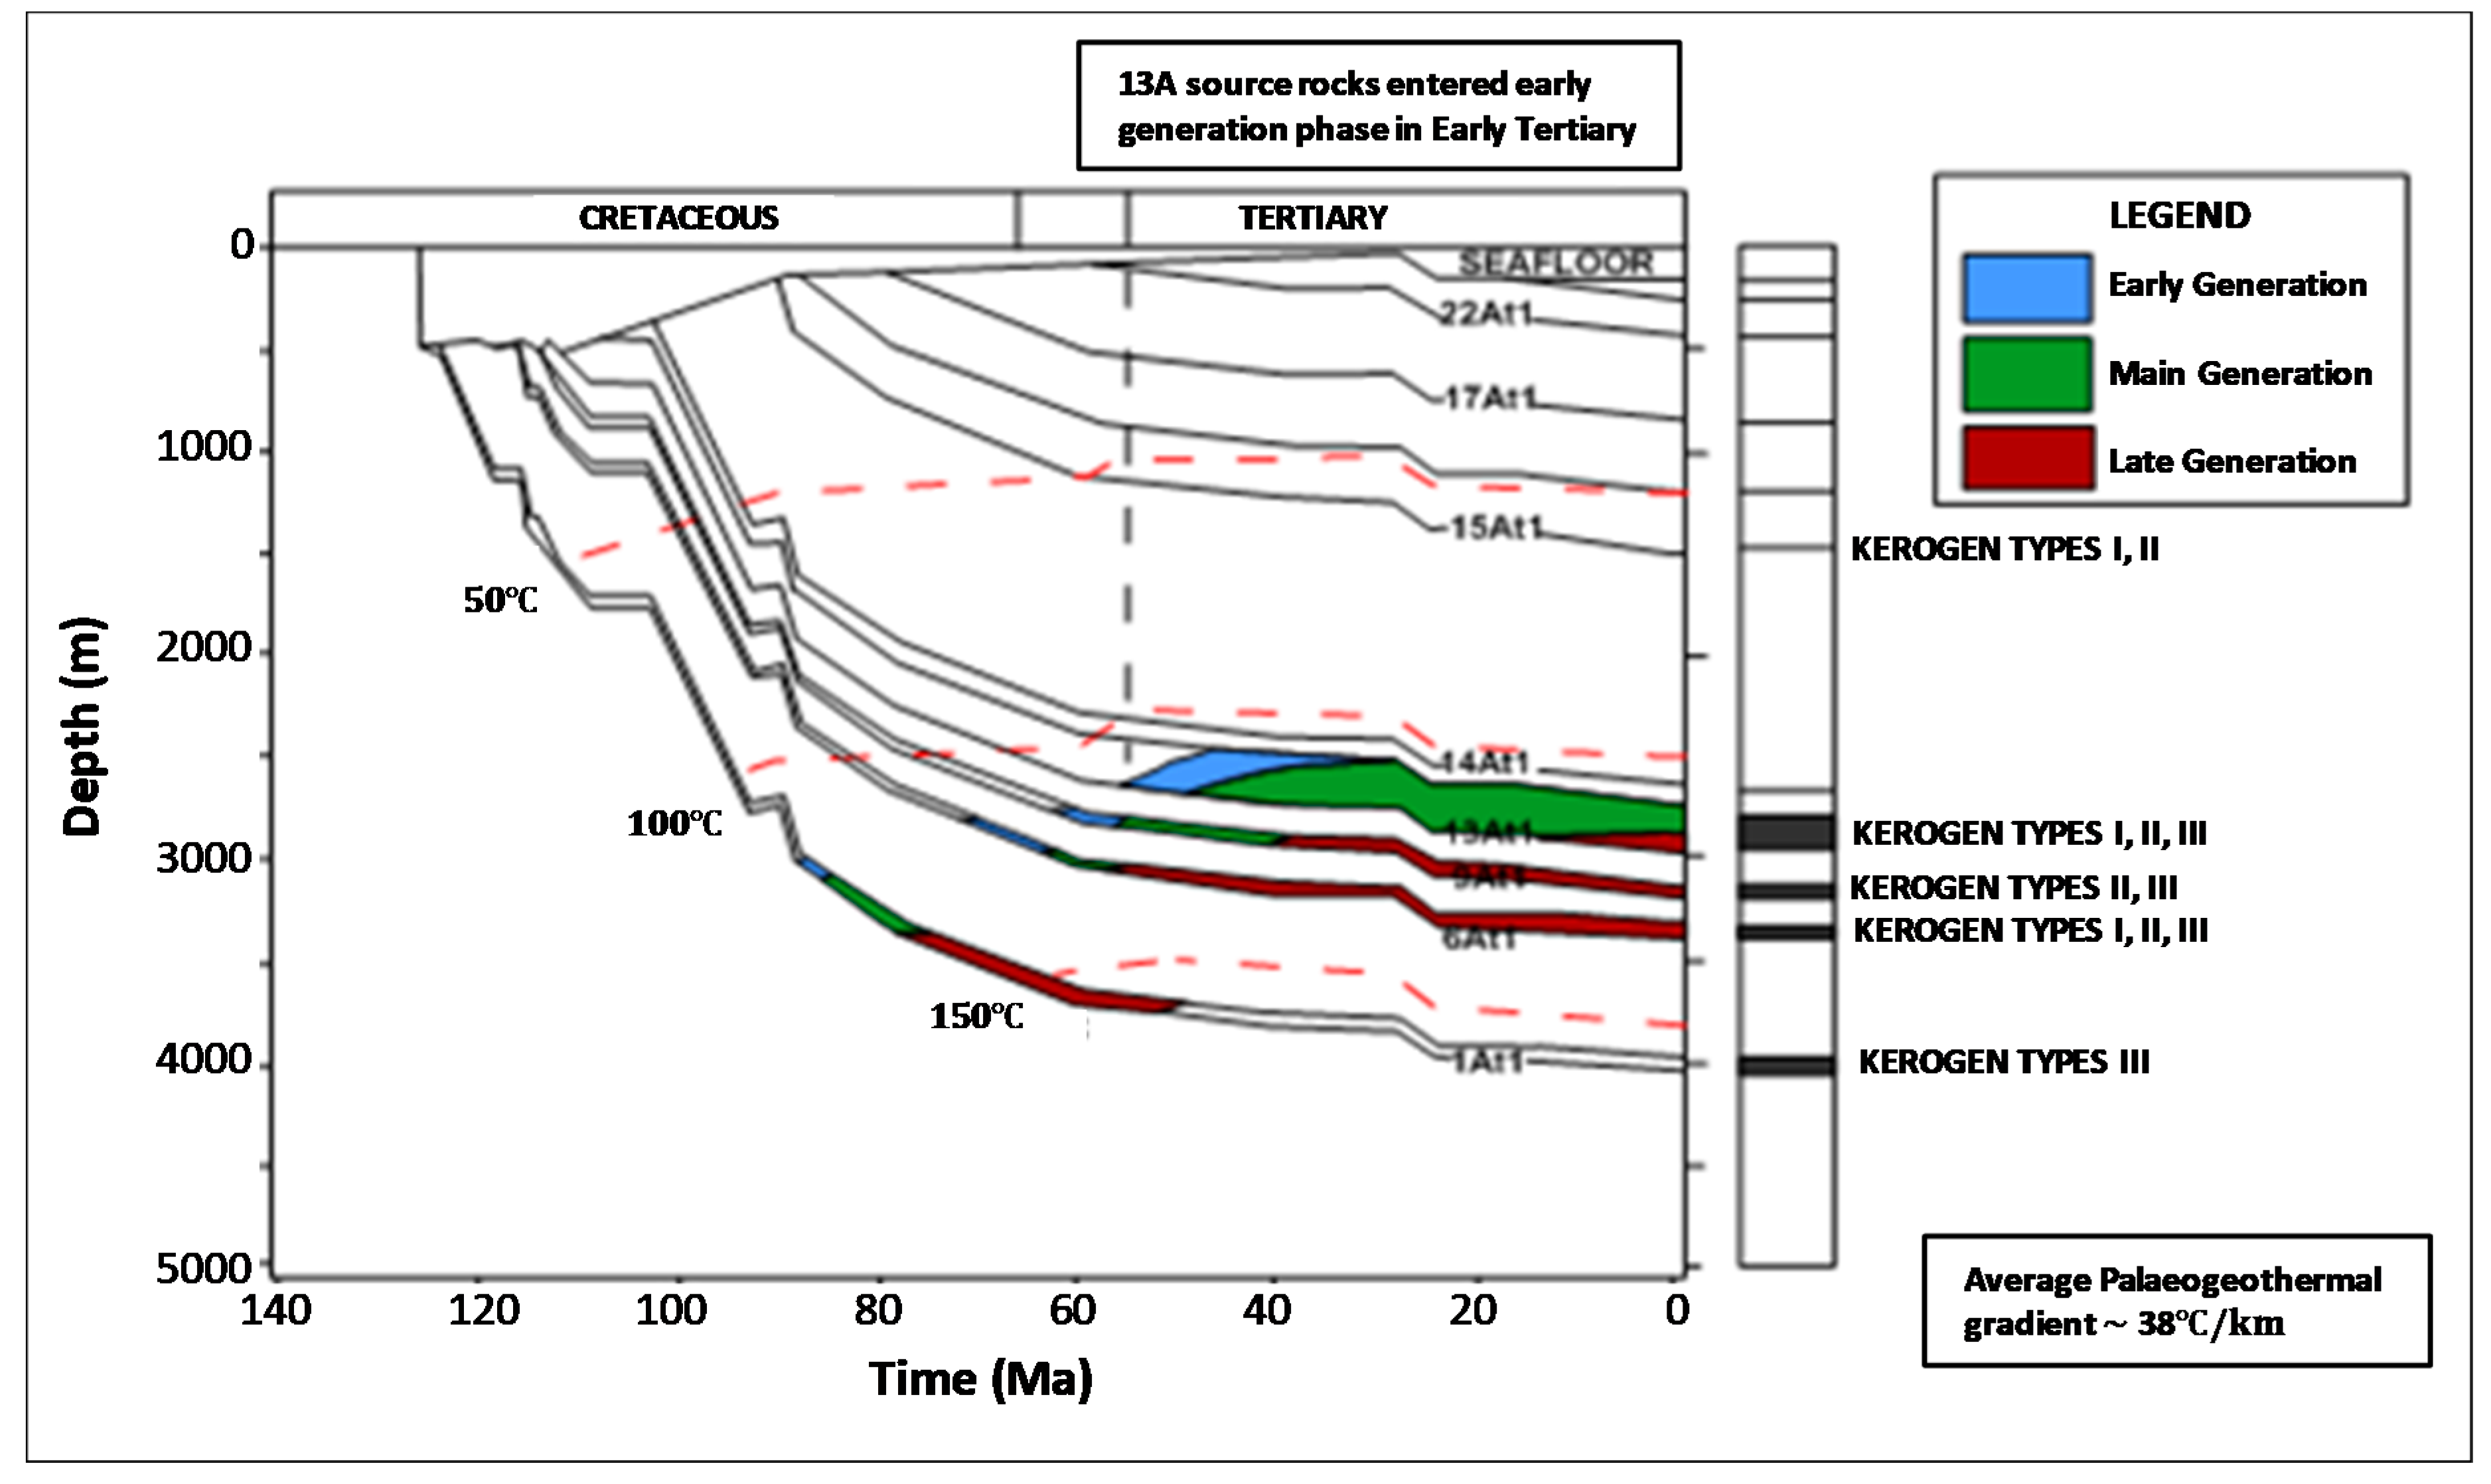
| 5 | Paleocene to Present Day (15At1 to Seafloor) | Late Drift | Oil-prone source in synrift depocentres and northern and central part of the Bredasdorp Basin proceed into the main phase of oil generation. Continued slight subsidence interrupted by the early Tertiary alkaline intrusion activity over the Central part of the basin. Late slanting of the basin together with uplift of the northern side led to the late removal or erosion of about 600 m succession in some places | Oil | 0.5–0.7% |
| Kerogen Type | Hydrogen Index (mgHC/g TOC) | Main Expelled at Peak Maturity |
|---|---|---|
| I | >600 | Oil |
| II | 300–600 | Oil |
| II/III | 200–300 | Mixed oil and gas |
| III | 50–200 | Gas |
| IV | <50 | Dry Gas |
| Wells/Borehole | E-AH1 | E-AJ1 | E-BA1 | E-BB1 | E-D3 |
|---|---|---|---|---|---|
| Co-ordinates | Latitude 35°11′13.40′′ S Longitude 21°08′37.07′′ E | Latitude 35°20′09.15′′ S Longitude 21°58′37.45′′ E | Latitude 35°09′29.67′′ S Longitude 21°28′31.19′′ E | Latitude 35°14′51.32′′ S Longitude 21°41′41.088′′ E | Latitude 35°28′45.91′′ S Longitude 21°56′16.16′′ E |
| Kelly Bushing (KB) to sea level (m) | 26 | 26 | 22 | 22 | 186 |
| Water depth (m) | 91 | 142 | 115 | 122 | 156 |
| Total drilling depth (m) | 3729 | 3490 | 3130 | 3320 | 3996 |
| Depth of sampling | 2471–2483 | 2696–3043 | 2828–2850 | 2537–3294 | 3261–3530 |
| No of samples | 8 | 27 | 11 | 38 | 8 |
| Borehole | Depth (m) | Lithology | SiO2 (%) | TiO2 (%) | Al2O3 (%) | Fe2O3 (%) | MnO (%) | MgO (%) | CaO (%) | Na2O (%) | K2O (%) | P2O5 (%) | Cr2O3 (%) | LOI (%) | H2O- (%) | Total (%) |
|---|---|---|---|---|---|---|---|---|---|---|---|---|---|---|---|---|
| E-AH1 | 2471.08 | Sandstone | 51.70 | 0.82 | 28.92 | 4.69 | 0.06 | 1.02 | 1.05 | 0.53 | 2.96 | 0.11 | 0.07 | 7.33 | 0.70 | 99.96 |
| E-AH1 | 2473.98 | Sandstone | 51.26 | 0.85 | 25.83 | 4.37 | 0.06 | 0.90 | 1.07 | 0.67 | 3.17 | 0.19 | 0.04 | 11.04 | 0.53 | 99.98 |
| E-AH1 | 2476.80 | Sandstone | 53.20 | 0.74 | 27.13 | 5.85 | 0.03 | 0.98 | 1.03 | 0.66 | 3.96 | 0.13 | 0.03 | 5.58 | 0.63 | 99.95 |
| E-AH1 | 2482.04 | Sandstone | 70.98 | 0.36 | 3.62 | 3.31 | 0.07 | 0.39 | 1.27 | 0.64 | 1.58 | 0.11 | 0.03 | 16.94 | 0.72 | 100.01 |
| E-AH1 | 2483.90 | Sandstone | 60.24 | 0.34 | 3.80 | 1.34 | 0.06 | 0.39 | 1.13 | 0.11 | 1.53 | 0.09 | 0.04 | 30.35 | 0.63 | 100.05 |
| E-AJ1 | 2701.30 | Sandstone | 62.55 | 0.28 | 4.75 | 1.36 | 0.09 | 0.47 | 1.33 | 0.11 | 1.50 | 0.05 | 0.02 | 26.78 | 0.71 | 100.00 |
| E-AJ1 | 2702.50 | Sandstone | 81.58 | 0.26 | 5.83 | 1.32 | 0.08 | 0.45 | 1.33 | 0.42 | 1.57 | 0.07 | 0.02 | 6.62 | 0.52 | 100.07 |
| E-AJ1 | 2703.00 | Sandstone | 61.48 | 0.27 | 3.88 | 1.68 | 0.01 | 0.50 | 1.64 | 0.68 | 1.84 | 0.13 | 0.02 | 27.10 | 0.79 | 100.02 |
| E-AJ1 | 2704.00 | Sandstone | 76.68 | 0.49 | 5.33 | 3.34 | 0.02 | 1.30 | 3.68 | 0.41 | 3.90 | 0.14 | 0.06 | 3.87 | 0.86 | 100.07 |
| E-AJ1 | 2705.00 | Sandstone | 80.49 | 0.40 | 8.28 | 3.42 | 0.07 | 0.92 | 1.17 | 0.81 | 1,46 | 0.17 | 0.02 | 2.28 | 0.55 | 100.03 |
| E-AJ1 | 2721.00 | Sandstone | 71.26 | 0.74 | 6.74 | 2.28 | 0.08 | 0.97 | 1.12 | 0.96 | 2.72 | 0.13 | 0.02 | 12.32 | 0.67 | 100.00 |
| E-AJ1 | 2722.00 | Sandstone | 69.84 | 0.70 | 4.20 | 2.30 | 0.09 | 0.97 | 1.14 | 0.94 | 2.09 | 0.13 | 0.01 | 16.76 | 0.82 | 100.00 |
| E-AJ1 | 2724.00 | Sandstone | 66.66 | 0.67 | 4.01 | 4.74 | 0.05 | 0.90 | 1.09 | 0.89 | 3.61 | 0,13 | 0.03 | 16.50 | 0.73 | 100.00 |
| E-AJ1 | 2726.00 | Sandstone | 74.92 | 0.20 | 7.04 | 3.08 | 0.07 | 0.99 | 0.81 | 0.68 | 1.03 | 0.11 | 0.01 | 10.30 | 0.74 | 99.98 |
| E-AJ1 | 2728.00 | Sandstone | 69.03 | 0.72 | 3.03 | 3.19 | 0.01 | 1.34 | 1.14 | 0.59 | 5.11 | 0.15 | 0.09 | 14.72 | 0.87 | 99.98 |
| E-AJ1 | 2730.00 | Sandstone | 66.01 | 0.57 | 5.00 | 3.99 | 0.02 | 1.37 | 1.42 | 0.23 | 1.59 | 0.19 | 0.05 | 18.71 | 0.98 | 100.13 |
| E-BA1 | 2828.05 | Sandstone | 66.10 | 0.25 | 2.15 | 1.07 | 0.02 | 1.22 | 1.94 | 0,27 | 0.54 | 0.04 | 0.03 | 25.74 | 0.63 | 100.01 |
| E-BA1 | 2832.92 | Sandstone | 74.45 | 0.29 | 6.61 | 1.83 | 0.09 | 1.60 | 2.27 | 0.26 | 0.83 | 0.06 | 0.02 | 10.97 | 0.73 | 100.01 |
| E-BA1 | 2836.01 | Sandstone | 85.10 | 0.16 | 6.09 | 1.23 | 0.04 | 0.74 | 1.98 | 0.30 | 0.54 | 0.11 | 0.02 | 3.52 | 0.62 | 100.44 |
| E-BA1 | 2842.10 | Sandstone | 68.17 | 0.24 | 5.73 | 0.61 | 0.08 | 6.18 | 1.53 | 0.22 | 0.78 | 0.11 | 0.04 | 15.74 | 0.60 | 100.02 |
| E-BB1 | 2538.05 | Sandstone | 67.97 | 0.74 | 3.57 | 3.01 | 0.08 | 1.85 | 1.63 | 0.79 | 3.13 | 0.13 | 0.02 | 16.51 | 0.64 | 100.07 |
| E-BB1 | 2546.00 | Sandstone | 68.00 | 0.29 | 3.79 | 0.27 | 0.01 | 0.42 | 6.31 | 0.34 | 0.72 | 0.11 | 0.03 | 18.84 | 0.86 | 99.98 |
| E-BB1 | 2554.40 | Sandstone | 61.09 | 0.33 | 3.33 | 2.68 | 0.01 | 2.30 | 1.50 | 1.40 | 4.45 | 0.10 | 0.02 | 22.21 | 0.59 | 100.01 |
| E-BB1 | 2659.05 | Sandstone | 62.21 | 0.85 | 4.42 | 4.36 | 0.09 | 2.31 | 1.52 | 0.96 | 3.34 | 0.07 | 0.03 | 18.86 | 0.93 | 99.95 |
| E-BB1 | 2663.18 | Sandstone | 64.15 | 0.79 | 2.82 | 2.73 | 0.09 | 2.14 | 0.93 | 1.06 | 2.91 | 0.09 | 0.01 | 21.39 | 0.87 | 99.98 |
| E-BB1 | 2720.55 | Sandstone | 62.09 | 0.67 | 5.87 | 2.35 | 0.09 | 1.77 | 1.58 | 0.71 | 2.43 | 0.08 | 0.04 | 21.60 | 0.71 | 99.99 |
| E-BB1 | 2722.55 | Sandstone | 63.65 | 0.10 | 2.62 | 1.01 | 0.01 | 1.28 | 1.09 | 0.77 | 3.44 | 0.15 | 0.05 | 25.01 | 0.78 | 99.96 |
| E-BB1 | 2849.05 | Sandstone | 68.54 | 0.24 | 4.23 | 3.32 | 0.05 | 1.07 | 1.08 | 0.45 | 4.89 | 0.14 | 0.01 | 15.36 | 0.68 | 100.05 |
| E-BB1 | 2852.03 | Sandstone | 63.29 | 0.52 | 3.61 | 0.44 | 0.03 | 1.02 | 1.17 | 0.65 | 1.74 | 0.07 | 0.01 | 26.73 | 0.75 | 100.03 |
| E-BB1 | 2856.05 | Sandstone | 65.72 | 0.45 | 6.50 | 0.96 | 0.05 | 5.68 | 1.10 | 0.52 | 1.04 | 0.09 | 0.01 | 17.26 | 0.62 | 99.99 |
| E-BB1 | 2872.05 | Sandstone | 75.24 | 0.52 | 3.83 | 1.07 | 0.05 | 1.08 | 1.34 | 1.19 | 1.59 | 0.14 | 0.01 | 13.48 | 0.51 | 100.04 |
| E-BB1 | 2894.05 | Sandstone | 52.21 | 0.67 | 24.08 | 4.49 | 0.03 | 1.84 | 2.39 | 0.89 | 3.32 | 0.08 | 0.04 | 9.54 | 0.54 | 100.10 |
| E-BB1 | 3280.06 | Sandstone | 52.28 | 0.74 | 22.53 | 4.86 | 0.02 | 1.80 | 1.96 | 0.96 | 3.96 | 0.18 | 0.01 | 9.90 | 0.84 | 100.02 |
| E-BB1 | 3284.87 | Sandstone | 58.02 | 0.57 | 23.87 | 3.89 | 0.04 | 2.16 | 4.82 | 0.97 | 2.82 | 0.13 | 0.03 | 1.81 | 0.90 | 100.02 |
| E-BB1 | 3290.31 | Sandstone | 52.68 | 0.66 | 23.01 | 3.49 | 0.01 | 1.71 | 1.46 | 1.03 | 3.04 | 0.09 | 0.01 | 12.11 | 0.68 | 99.96 |
| E-D3 | 3268.58 | Sandstone | 54.13 | 0.61 | 23.99 | 3.04 | 0.01 | 1.56 | 3.39 | 0.87 | 2.56 | 0.06 | 0.02 | 9.17 | 0.61 | 100.01 |
| E-D3 | 3527.50 | Sandstone | 69.25 | 0.53 | 4.17 | 1.09 | 0.02 | 0.79 | 7.68 | 0.56 | 1.05 | 0.15 | 0.01 | 14.00 | 0.78 | 100.05 |
| E-D3 | 3733.25 | Sandstone | 76.58 | 0.53 | 3.60 | 1.14 | 0.01 | 1.28 | 1.23 | 1.03 | 1.64 | 0.05 | 0.01 | 12.24 | 0.73 | 100.05 |
| E-D3 | 3736.03 | Sandstone | 56.20 | 0.50 | 24.02 | 3.34 | 0.09 | 1.35 | 1.44 | 0.89 | 2.03 | 0.14 | 0.02 | 9.28 | 0.77 | 100.04 |
| E-D3 | 3737.00 | Sandstone | 79.27 | 0.20 | 4.61 | 1.48 | 0.01 | 1.09 | 3.11 | 0.94 | 0.86 | 0.12 | 0.06 | 7.53 | 0.61 | 99.90 |
| Borehole | Depth (m) | Qt (%) | Qm (%) | Qp (%) | F (%) | L (%) | GL (%) | Acc (%) | Cmt (%) | Mx (%) | QmFLt (%) | QtFL (%) | ||||
|---|---|---|---|---|---|---|---|---|---|---|---|---|---|---|---|---|
| Qm | F | Lt | Qt | F | L | |||||||||||
| E-AH1 | 2471.0 | 59.0 | 57.6 | 1.4 | 13.4 | 7.4 | 4.2 | 0.2 | 3.8 | 12.0 | 72.2 | 16.8 | 11.0 | 73.9 | 16.8 | 9.3 |
| 2473.0 | 52.2 | 52.0 | 0.2 | 13.0 | 9.2 | 4.4 | 1.0 | 6.4 | 13.8 | 69.9 | 17.5 | 12.6 | 70.2 | 17.5 | 12.4 | |
| 2475.0 | 58.8 | 56.0 | 2.8 | 14.2 | 5.8 | 5.0 | 0.3 | 6.4 | 9.5 | 71.1 | 18.0 | 10.9 | 74.6 | 18.0 | 7.4 | |
| 2482.0 | 65.2 | 62.2 | 3.0 | 10.0 | 6.4 | 3.0 | 0.1 | 5.0 | 10.3 | 76.2 | 12.3 | 11.5 | 79.9 | 12.3 | 7.8 | |
| 2483.0 | 65.8 | 63.8 | 2.0 | 14.2 | 5.2 | 5.0 | 1.0 | 5.6 | 3.2 | 74.9 | 16.7 | 8.5 | 77.2 | 16.7 | 6.1 | |
| E-AJ1 | 2701.3 | 66.2 | 64.2 | 2.0 | 13.8 | 6.6 | 4.2 | 0.3 | 4.2 | 4.7 | 74.1 | 15.9 | 9.9 | 76.4 | 15.9 | 7.6 |
| 2702.5 | 68.4 | 66.6 | 1.8 | 14.2 | 5.6 | 1.0 | 0.1 | 6.4 | 4.3 | 75.5 | 16.1 | 8.4 | 77.6 | 16.1 | 6.3 | |
| 2703.0 | 61.0 | 59.0 | 2.0 | 14.0 | 5.0 | 4.0 | 0.8 | 6.4 | 8.8 | 73.8 | 17.5 | 8.8 | 76.3 | 17.5 | 6.3 | |
| 2704.0 | 52.2 | 51.8 | 0.4 | 15.2 | 6.2 | 4.0 | 0.4 | 8.6 | 13.4 | 70.4 | 20.7 | 9.0 | 70.9 | 20.7 | 8.4 | |
| 2705.0 | 59.8 | 59.6 | 0.2 | 18.8 | 6.2 | 3.0 | 0.4 | 4.2 | 7.6 | 70.3 | 22.2 | 7.5 | 70.5 | 22.2 | 7.3 | |
| 2721.0 | 60.4 | 60.2 | 0.2 | 19.8 | 5.8 | 3.0 | 0.2 | 3.0 | 7.8 | 70.0 | 23.0 | 7.0 | 70.2 | 23.0 | 6.7 | |
| 2722.0 | 66.0 | 65.4 | 0.6 | 15.2 | 7.8 | 2.2 | 0.2 | 1.8 | 6.8 | 73.5 | 17.1 | 9.4 | 74.2 | 17.1 | 8.8 | |
| 2724.0 | 60.2 | 59.8 | 0.4 | 10.6 | 5.6 | 3.6 | 0.8 | 9.4 | 9.8 | 78.3 | 13.9 | 7.9 | 78.8 | 13.9 | 7.3 | |
| 2726.0 | 60.6 | 59.2 | 1.4 | 13.6 | 7.2 | 2.4 | 0.5 | 5.8 | 9.9 | 72.7 | 16.7 | 10.6 | 74.4 | 16.7 | 8.8 | |
| 2728.0 | 62.0 | 61.0 | 1.0 | 17.6 | 5.8 | 3.2 | 0.6 | 3.8 | 7.0 | 71.4 | 20.6 | 8.0 | 72.6 | 20.6 | 6.8 | |
| 2730.0 | 61.0 | 60.4 | 0.6 | 15.2 | 9.6 | 1.4 | 0.1 | 5.8 | 6.9 | 70.4 | 17.7 | 11.9 | 71.1 | 17.7 | 11.2 | |
| E-BA1 | 2828.0 | 60.0 | 59.4 | 0.6 | 13.8 | 8.6 | 3.6 | 0.0 | 3.6 | 10.4 | 72.1 | 16.7 | 11.2 | 72.8 | 16.7 | 10.4 |
| 2832.0 | 68.4 | 67.6 | 0.8 | 13.8 | 8.0 | 2.0 | 0.2 | 2.4 | 5.2 | 74.9 | 15.3 | 9.8 | 75.8 | 15.3 | 8.9 | |
| 2836.0 | 63.2 | 62.8 | 0.4 | 14.6 | 7.2 | 3.6 | 0.6 | 3.6 | 7.2 | 73.9 | 17.2 | 8.9 | 74.4 | 17.2 | 8.5 | |
| 2842.0 | 59.6 | 59.4 | 0.2 | 13.8 | 7.0 | 3.4 | 0.2 | 6.0 | 10.0 | 73.9 | 17.2 | 9.0 | 74.1 | 17.2 | 8.7 | |
| E-BB1 | 2537.7 | 62.0 | 61.8 | 0.2 | 14.0 | 6.0 | 2.0 | 0.2 | 6.2 | 9.6 | 75.4 | 17.1 | 7.6 | 75.6 | 17.1 | 7.3 |
| 2546.0 | 65.0 | 64.4 | 0.6 | 15.8 | 6.8 | 2.0 | 0.0 | 2.4 | 8.0 | 73.5 | 18.0 | 8.4 | 74.2 | 18.0 | 7.8 | |
| 2553.0 | 57.8 | 57.4 | 0.4 | 13.6 | 6.0 | 3.6 | 0.3 | 7.0 | 11.7 | 74.2 | 17.6 | 8.3 | 74.7 | 17.6 | 7.8 | |
| 2659.0 | 62.0 | 60.6 | 1.4 | 15.6 | 6.0 | 2.4 | 0.8 | 3.6 | 9.6 | 72.5 | 18.7 | 8.9 | 74.2 | 18.7 | 7.2 | |
| 2663.0 | 61.6 | 60.8 | 0.8 | 16.4 | 7.8 | 2.4 | 0.6 | 3.2 | 8.0 | 70.9 | 19.1 | 10.0 | 71.8 | 19.1 | 9.1 | |
| 2721.0 | 60.2 | 60.0 | 0.2 | 15.0 | 6.6 | 3.0 | 0.6 | 4.6 | 10.0 | 73.3 | 18.3 | 8.3 | 73.6 | 18.3 | 8.1 | |
| 2723.0 | 57.6 | 56.6 | 1.0 | 14.8 | 6.8 | 4.2 | 0.0 | 5.6 | 11.0 | 71.5 | 18.7 | 9.8 | 72.7 | 18.7 | 8.6 | |
| 2849.0 | 61.4 | 60.4 | 1.0 | 13.8 | 7.6 | 2.4 | 0.2 | 5.0 | 9.6 | 72.9 | 16.7 | 10.4 | 74.2 | 16.7 | 9.2 | |
| 2853.0 | 60.0 | 59.0 | 1.0 | 11.0 | 5.2 | 3.0 | 0.8 | 8.0 | 12.0 | 77.4 | 14.4 | 8.1 | 78.7 | 14.4 | 6.8 | |
| 2855.0 | 61.0 | 60.6 | 0.4 | 14.0 | 5.8 | 1.4 | 0.2 | 5.8 | 11.8 | 75.0 | 17.3 | 7.7 | 75.5 | 17.3 | 7.2 | |
| 2872.0 | 57.2 | 57.0 | 0.2 | 15.2 | 7.0 | 2.2 | 0.1 | 6.0 | 12.3 | 71.8 | 19.1 | 9.1 | 72.0 | 19.1 | 8.8 | |
| 2873.8 | 56.0 | 55.6 | 0.4 | 15.6 | 7.8 | 4.0 | 0.4 | 6.6 | 9.6 | 70.0 | 19.6 | 10.3 | 70.5 | 19.6 | 9.8 | |
| 3280.4 | 59.8 | 59.6 | 0.2 | 17.6 | 8.0 | 1.8 | 0.6 | 4.2 | 8.0 | 69.8 | 20.6 | 9.6 | 70.0 | 20.6 | 9.4 | |
| 3284..0 | 57.6 | 57.4 | 0.2 | 12.4 | 7.2 | 2.0 | 0.2 | 9.0 | 11.6 | 74.4 | 16.1 | 9.6 | 74.6 | 16.1 | 9.3 | |
| 3292.7 | 59.8 | 59.4 | 0.4 | 16.2 | 7.2 | 2.6 | 0.0 | 5.6 | 8.6 | 71.4 | 19.5 | 9.1 | 71.9 | 19.5 | 8.7 | |
| E-D3 | 3268.0 | 63.0 | 62.2 | 0.8 | 15.0 | 6.4 | 2.4 | 0.8 | 4.4 | 8.0 | 73.7 | 17.8 | 8.5 | 74.6 | 17.8 | 7.6 |
| 3269.0 | 58.4 | 58.0 | 0.4 | 14.4 | 6.8 | 3.6 | 0.0 | 5.0 | 11.8 | 72.9 | 18.1 | 9.0 | 73.4 | 18.1 | 8.5 | |
| 3526.0 | 62.0 | 60.8 | 1.2 | 14.0 | 6.2 | 3.2 | 0.2 | 5.4 | 9.0 | 74.0 | 17.0 | 9.0 | 75.4 | 17.0 | 7.5 | |
| 3528.5 | 59.2 | 58.2 | 1.0 | 13.4 | 5.2 | 2.2 | 0.0 | 6.2 | 13.8 | 74.8 | 17.2 | 8.0 | 76.1 | 17.2 | 6.7 | |
| 3529.5 | 62.8 | 62.2 | 0.6 | 15.6 | 6.2 | 2.6 | 0.1 | 4.2 | 8.5 | 73.5 | 18.4 | 8.0 | 74.2 | 18.4 | 7.3 | |
| Borehole | Depth (m) | Quartz (%) | Pyrite (%) | Muscovite (%) | Kaolinite (%) | Plagioclase (%) | Glauconite (%) | Rutile (%) | Dolomite (%) | Calcite/ (%) | Chlorite (%) | Microcline (%) | Smectite (%) | Illite (%) |
|---|---|---|---|---|---|---|---|---|---|---|---|---|---|---|
| E-AH1 | 2471 | 56.1 | 2.1 | 5.8 | 13.6 | 6.1 | 4.1 | 0.0 | 0.4 | 9.4 | 0.1 | 1.3 | 0.6 | 0.5 |
| 2475 | 67.6 | 0.9 | 1.2 | 4.1 | 7.3 | 1.7 | 0.0 | 0.3 | 12.8 | 0.6 | 1.6 | 0.0 | 1.6 | |
| 2478 | 69.4 | 1.0 | 0.9 | 7.4 | 8.9 | 0.6 | 0.1 | 0.1 | 6.4 | 0.3 | 4.5 | 0.1 | 0.0 | |
| 2481 | 68.2 | 0.4 | 3.5 | 3.9 | 9.2 | 1.8 | 0.2 | 0.3 | 7.9 | 0.6 | 3.7 | 0.1 | 0.0 | |
| 2483 | 67.4 | 0.3 | 2.2 | 5.3 | 9.7 | 2.0 | 0.0 | 0.2 | 9.4 | 0.4 | 2.1 | 0.3 | 0.5 | |
| E-AJ1 | 2703 | 73.7 | 0.2 | 1.1 | 4.0 | 8.3 | 0.1 | 0.1 | 0.6 | 9.0 | 0.3 | 2.1 | 0.1 | 0.3 |
| 2721 | 68.5 | 0.2 | 1.2 | 5.0 | 9.2 | 1.9 | 0.1 | 0.7 | 10.4 | 0.8 | 1.7 | 0.0 | 0.2 | |
| 2726 | 69.4 | 0.3 | 1.0 | 1.6 | 10.2 | 0.6 | 0.5 | 2.4 | 10.9 | 1.3 | 1.3 | 0.0 | 0.4 | |
| 2730 | 63.5 | 0.1 | 5.6 | 10.4 | 11.1 | 0.2 | 0.4 | 0.2 | 7.1 | 0.2 | 1.1 | 0.1 | 0.0 | |
| 2970 | 71.5 | 0.2 | 5.9 | 3.7 | 12.8 | 1.3 | 0.1 | 0.0 | 3.0 | 0.3 | 0.8 | 0.2 | 0.3 | |
| 2982 | 69.7 | 0.6 | 4.7 | 6.6 | 14.5 | 0.6 | 0.3 | 0.2 | 1.8 | 0.1 | 0.4 | 0.2 | 0.2 | |
| 3039 | 68.4 | 0.4 | 3.2 | 5.1 | 12.1 | 0.9 | 0.6 | 0.3 | 5.4 | 1.0 | 2.1 | 0.1 | 0.3 | |
| E-BA1 | 2828 | 63.7 | 5.9 | 1.5 | 4.2 | 10.1 | 0.3 | 0.2 | 1.8 | 7.1 | 2.7 | 1.6 | 0.1 | 0.8 |
| 2832 | 68.7 | 0.3 | 2.2 | 3.7 | 14.5 | 0.2 | 0.1 | 0.1 | 8.1 | 0.5 | 1.4 | 0.0 | 0.0 | |
| 2838 | 69.4 | 0.2 | 1.7 | 7.1 | 8.5 | 0.4 | 0.2 | 0.1 | 10.2 | 0.1 | 1.6 | 0.2 | 0.0 | |
| 2843 | 61.9 | 0.7 | 2.0 | 6.8 | 9.3 | 0.3 | 0.3 | 0.0 | 16.8 | 0.3 | 1.3 | 0.2 | 0.1 | |
| 2850 | 61.7 | 0.7 | 1.8 | 5.3 | 13.4 | 1.7 | 0.1 | 0.2 | 12.9 | 0.3 | 1.0 | 0.1 | 0.5 | |
| E-BB1 | 2539 | 60.7 | 4.4 | 13.3 | 6.2 | 10.6 | 0.6 | 0.3 | 0.0 | 0.4 | 2.8 | 0.7 | 0.0 | 0.0 |
| 2548 | 60.1 | 2.5 | 2.6 | 6.9 | 9.8 | 0.1 | 0.1 | 0.0 | 13.5 | 1.2 | 2.8 | 0.1 | 0.1 | |
| 2556 | 71.4 | 1.7 | 4.1 | 4.6 | 10.3 | 0.7 | 0.1 | 0.1 | 5.0 | 0.9 | 0.8 | 0.0 | 0.0 | |
| 2662 | 70.4 | 1.9 | 4.2 | 4.7 | 9.6 | 0.3 | 0.19 | 0.2 | 4.2 | 1.0 | 3.2 | 0.0 | 0.0 | |
| 2721 | 63.9 | 0.9 | 2.8 | 6.2 | 14.7 | 0.2 | 0.2 | 0.0 | 7.7 | 1.4 | 1.2 | 0.1 | 0.5 | |
| 2849 | 67.6 | 0.2 | 2.1 | 4.9 | 15.2 | 0.1 | 0.0 | 0.1 | 6.9 | 0.8 | 1.4 | 0.0 | 0.7 | |
| 2863 | 65.2 | 0.8 | 2.0 | 7.8 | 13.0 | 0.7 | 0.0 | 0.1 | 8.0 | 0.7 | 1.0 | 0.1 | 0.4 | |
| 3284 | 70.0 | 0.3 | 1.4 | 5.2 | 8.9 | 0.4 | 0.0 | 0.2 | 11.7 | 0.4 | 1.0 | 0.0 | 0.2 | |
| 3294 | 67.4 | 0.5 | 3.0 | 6.0 | 11.8 | 0.5 | 0.6 | 0.5 | 8.2 | 0.8 | 0.5 | 0.0 | 0.0 | |
| E-D3 | 3261 | 68.4 | 1.0 | 2.5 | 5.1 | 10.6 | 0.4 | 0.5 | 0.6 | 7.1 | 0.7 | 2.6 | 0.1 | 0.2 |
| 3269 | 65.3 | 0.20 | 6.6 | 7.1 | 9.5 | 0.5 | 0.5 | 0.3 | 5.3 | 2.1 | 1.0 | 0.0 | 0.2 | |
| 3526 | 67.5 | 0.3 | 3.4 | 6.0 | 12.3 | 1.1 | 0.3 | 0.2 | 4.3 | 1.6 | 2.4 | 0.0 | 0.4 | |
| 3529 | 70.8 | 0.2 | 2.8 | 5.4 | 11.0 | 1.3 | 0.2 | 0.1 | 6.2 | 0.4 | 0.9 | 0.3 | 0.4 |
| Type of Pore | Method of Formation | Characteristics | |
|---|---|---|---|
| Primary pores | Primary intergranular pores | Compaction and contraction between grains | Point to line contact of grains |
| Matrix micro pores (Micro porosity) | Pores formed by the sustained function between matrix grains | Pores between authigenic clay minerals | |
| Secondary pores | Solution pores | Formed by dissolution of cements and framework grains | Corrosion of the edge of grains and cements |
| Secondary intragranular pores | Pores produced by the dissolution of detrital feldspars, lithic fragments and cement material (i.e., calcite cement). | Corrosion inside of feldspar grains | |
| Fracture pores | Fracturing of rocks by differential compaction and tectonic forces | Presence of cracks or the grains are folded |
| Borehole | Depth (m) | Gas Expansion Porosity (%) | Point Count Porosity (%) | Klinkenberg Corrected Permeability (mD) | Dominant Cement under SEM and Petrography | Effect of Diagenesis on the Reservoir Properties |
|---|---|---|---|---|---|---|
| E-AH1 | 2471.08 | 16.80 | 14.80 | 30.00 | Quartz, kaolinite, non-ferroan calcite | Porosity and permeability are generally good. Secondary porosities are well developed. The abundance of elongate and oversized pores, and the uncompacted nature of the sandstones suggest that much of the porosity is secondary, after dissolution of an early intergranular cement and detrital grains. |
| 2473.98 | 14.20 | 11.40 | 22.00 | |||
| 2476.80 | 14.50 | 15.60 | 30.00 | |||
| 2482.04 | 20.60 | 22.70 | 61.00 | |||
| 2483.90 | 16.30 | 17.40 | 49.00 | |||
| E-AJ1 | 2701.30 | 16.80 | 15.20 | 19.40 | Quartz and ferroan calcite | Porosity is good and permeability is moderate to good. Quartz commonly fills the secondary pores and the pseudomatrix in some places results in the reduced permeability |
| 2702.50 | 12.50 | 11.80 | 4.40 | |||
| 2703.00 | 11.70 | 12.60 | 2.90 | Quartz, ferroan calcite, kaolinite and illite | Porosity is good and permeability is poor to moderate. Secondary porosity is patchy developed, after dissolution of calcite cement. The increase in abundance of fibrous illite, and resultant microporosity development is primarily responsible for poor permeability. | |
| 2704.00 | 8.20 | 9.40 | 1.10 | |||
| 2705.00 | 9.80 | 10.80 | 0.60 | |||
| 2721.00 | 16.70 | 17.20 | 12.80 | Non-ferroan calcite, illite and kaolinite | Porosity and permeability are good. Secondary porosity are well developed, but permeabilities are restricted by fibrous authigenic illite, quartz overgrowths and, to a lesser extent, calcite. | |
| 2722.00 | 15.50 | 14.10 | 8.20 | |||
| 2724.00 | 16.80 | 11.60 | 12.10 | |||
| 2726.00 | 15.60 | 14.80 | 4.80 | Non-ferroan calcite, illite and kaolinite | Porosity is good and permeability is poor to moderate. Fibrous illite, from grain alteration, has reduced the secondary porosity to microporosity in places, resulting in reduced permeability. | |
| 2728.00 | 12.70 | 11.80 | 1.60 | |||
| 2730.00 | 8.10 | 10.20 | 2.80 | |||
| E-BA1 | 2828.05 | 10.50 | 12.90 | 43.00 | Quartz, kaolinite and calcite | Porosity is good and permeability is moderate to good. Quartz commonly fills the secondary porosity and the pseudomatrix results in it having poorer permeability |
| 2832.92 | 11.00 | 12.30 | 11.70 | |||
| 2836.01 | 9.10 | 13.90 | 0.33 | Quartz and kaolinite | Porosity is moderate with poor permeability. Quartz overgrowths and pseudomatrix are the most abundant pore filling phases with lesser kaolinite. Microporosity through pseudomatrix and authigenic clays restricts permeability. | |
| 2842.10 | 10.50 | 11.40 | 3.21 | |||
| E-BB1 | 2538.05 | 12.30 | 12.10 | 1.50 | Quartz overgrowth and non-ferroan calcite | Good porosity and poor permeability. Secondary porosity is good and developed by leaching of calcite cement. Porosity is substantially reduced by quartz overgrowths and compaction of claystone clasts to form pseudomatrix. Permeability is restricted by quartz overgrowths and the development of fibrous authigenic illite, creating microporosity. |
| 2546.00 | 13.90 | 10.30 | 0.30 | |||
| 2554.40 | 11.70 | 14.10 | 0.28 | |||
| 2659.05 | 11.60 | 11.00 | 0.93 | |||
| 2663.18 | 2.80 | 3.70 | 0.01 | Quartz and non-ferroan calcite | Poor porosity and permeability. Porosity is reduced by pore filling quartz, quartz overgrowths, calcite and illite are the factors resulting in the poor permeability. | |
| 2720.55 | 14.30 | 11.60 | 11.20 | Quartz, illite and kaolinite | Porosity is good and permeability is poor to good. Quartz overgrowths reduce intergranular porosity. Illite also restricts permeability by creating microporosity. | |
| 2722.55 | 13.20 | 15.30 | 1.30 | |||
| 2849.05 | 12.60 | 13.50 | 28.10 | Quartz overgrowth, illite and kaolinite | Porosity and permeability are generally good. | |
| 2852.03 | 8.00 | 7.20 | 0.09 | Porosity is good and permeability is poor. The increase in the amounts of illite and kaolinite and the presence of pseudomatrix accounts for the poor permeabilities. | ||
| 2856.05 | 11.00 | 10.60 | 2.60 | |||
| 2872.05 | 11.90 | 8.90 | 16.50 | Quartz, ferroan calcite and pyrite | Porosity and permeability are generally good. Quartz and calcite commonly fills the secondary porosity and the pseudomatrix in some places results in it having these porosity and permeability | |
| 2894.05 | 11.70 | 10.60 | 12.80 | |||
| 3280.06 | 5.40 | 13.60 | 0.01 | Ferroan calcite, quartz and illite | Porosity is moderate to good and permeability is generally poor. The very poor porosity due to cementation by calcite, quartz and illite. The permeability is restricted by microporous illite and by quartz overgrowth cementation. | |
| 3284.87 | 11.30 | 7.50 | 1.20 | |||
| 3290.31 | 10.60 | 12.10 | 0.02 | |||
| E-D3 | 3268.58 | 1.50 | 3.50 | 0.00 | Kaolinite, illite, non-ferroan calcite and quartz overgrowth | Porosity and permeability are very poor. Intergranular porosity is reduced by quartz overgrowths and non-ferroan calcite. Kaolinite, calcite and illite are abundant, producing microporosity, and hence reducing porosity permeability. |
| 3527.50 | 2.00 | 1.90 | 0.00 | |||
| 3733.25 | 16.00 | 14.30 | 5.80 | Quartz overgrowth, non-ferroan calcite and pyrite | Porosity and permeability are good. Quartz overgrowths and calcite have reduced intergranular porosity. Secondary porosity is developed by leaching of calcite cement, but is commonly reduced to microporosity by authigenic illite. | |
| 3736.03 | 10.00 | 11.80 | 7.90 | |||
| 3737.00 | 9.00 | 5.40 | 6.10 |
© 2020 by the authors. Licensee MDPI, Basel, Switzerland. This article is an open access article distributed under the terms and conditions of the Creative Commons Attribution (CC BY) license (http://creativecommons.org/licenses/by/4.0/).
Share and Cite
Baiyegunhi, T.L.; Liu, K.; Gwavava, O.; Baiyegunhi, C. Impact of Diagenesis on the Reservoir Properties of the Cretaceous Sandstones in the Southern Bredasdorp Basin, Offshore South Africa. Minerals 2020, 10, 757. https://doi.org/10.3390/min10090757
Baiyegunhi TL, Liu K, Gwavava O, Baiyegunhi C. Impact of Diagenesis on the Reservoir Properties of the Cretaceous Sandstones in the Southern Bredasdorp Basin, Offshore South Africa. Minerals. 2020; 10(9):757. https://doi.org/10.3390/min10090757
Chicago/Turabian StyleBaiyegunhi, Temitope Love, Kuiwu Liu, Oswald Gwavava, and Christopher Baiyegunhi. 2020. "Impact of Diagenesis on the Reservoir Properties of the Cretaceous Sandstones in the Southern Bredasdorp Basin, Offshore South Africa" Minerals 10, no. 9: 757. https://doi.org/10.3390/min10090757
APA StyleBaiyegunhi, T. L., Liu, K., Gwavava, O., & Baiyegunhi, C. (2020). Impact of Diagenesis on the Reservoir Properties of the Cretaceous Sandstones in the Southern Bredasdorp Basin, Offshore South Africa. Minerals, 10(9), 757. https://doi.org/10.3390/min10090757