Abstract
At present, many mines adopt the filling method. It is particularly important to solve the problem of the long-distance transportation of slurry during the filling process. Based on the high-density filling material of Sanning mine, the experiments were designed to add sodium abietate (SA), triterpene saponin (SJ) and sodium dodecyl sulfonate (K12) with concentrations of 0.0%, 0.2%, 0.4% and 0.6%, respectively, which were used as air entraining agents (AEA). The filling body with the curing age of 7 and 28 days was prepared for various tests, including nuclear magnetic resonance (NMR), and alternating current (AC) impedance tests. The effects of the air entraining agent and curing time on the physical properties, pore structure and AC impedance properties of the filling were obtained. The results show that: (1) within the frequency range of 10−1–105 Hz, the variation trend of AC impedance of the filling body cannot be changed by adding the air entraining agent, and the filling body with the same ratio had a similar topological structure. (2) The filling body with different AEA and curing times can be represented by the same equivalent circuit model, while the maximum chi-square coefficient was 0.46%. (3) Under the condition of a high frequency of 105 Hz, the porosity and uniaxial compressive strength of the filling body with 7 day curing age were linearly correlated with the AC impedance. However, the porosity and uniaxial compressive strengths of the filling body with 28 days curing time were affected by the type of AEA at a high frequency of 105 Hz.
1. Introduction
Similar to other rock masses, backfill has a complex internal structure. Cement tailings or macadam cement tailings consolidation fill not only has solid particles, but also has water and air. The strength of the filling body is related to the nature of solid particles, the liquid phase of the filling body, and the distribution of the liquid phase in the filling body. Since the first application of electrochemical AC impedance to study the microstructure characterization of filling [1], some scholars have paid more attention to researching this field of engineering [2,3]. Due to the limitations of early testing techniques, AC impedance testing is performed only within the kilohertz (kHz) range [4,5]. With the development of AC impedance testing equipment and electrochemical measurement technology, the AC impedance can be measured in the high frequency range [6,7]. Previous studies had shown that the AC impedance spectrum can characterize the changes in pore structure during the hydration process of the filling body. Shi et al. (1998) [8] studied the influence of various admixtures on the ionic concentration of concrete’s pore solution and pore structure, and showed that the conductivity of concrete can be reduced by adding auxiliary cementing materials instead of Portland cement. The AC impedance spectrum can well reflect the microstructure of cement-based materials. Furthermore, the intersection point between the high-frequency area and the real axis can obtain the resistance of pore solution in the hardened cement slurry. Additionally, the radius of the semicircle in the high-frequency zone can indirectly reflect the concentration of OH- ions in the pore solution of the cement slurry [9,10] conducted electrochemical impedance analysis on the hydration process of cement with different particle sizes, and showed that the pore diameter was smaller when the particles’ gradation was small. Furthermore, the pore diameter was further reduced by the hydration reaction, which is related to the size ratio of slag and cement particles. Andrade et al. (1999) [11] proposed the equivalent circuit model of the experimental results through the non-contact method. This method was used due to the non-contact between the sample and electrode. The equivalent model successfully distinguished between the effect of the solid phase and the electrolyte filled hole on the impedance spectrum, which greatly promoted the analysis of impedance data. Cruz et al. (2013) [6] studied the degree of hydration reaction of cement mortar through AC impedance parameters based on a three-branch circuit equivalent model, and quantified the electrochemical properties of hydration products located at the solid–liquid interface. Wansom et al. (2013) [12] studied and proposed that electrochemical AC impedance spectroscopy could be used as an effective method that could evaluate the fiber orientation in fiber cement and provide information about the interfacial properties between different phases. Wu et al. (2016) [13] summarized and analyzed the test procedure for determining the diffusion coefficient of chloride ions based on AC impedance spectrum, and proposed the correction factors of diffusion coefficients of different gel materials to eliminate the influence of other ions on the results. McCarter et al. (2013) [14] used AC impedance technology to monitor the characteristics of long-term hydration reaction of concrete with or without adding mineral-assisted cementing materials, introducing the normalized electrical conductivity to analyze the hydration kinetics of concrete at different hydration stages. The results show that this parameter can distinguish the degree of hydration reaction and the chemical properties of pore solution of different cementitious materials.
However, the effect of air entraining agents (AEAs) on the uniaxial compressive strength (UCS) of the material has not been studied yet. Moreover, AEAs render different influences on different materials. Zhu et al. (2018) [15] demonstrated that the UCS of concrete is reduced with increasing the concentration of AEAs. Şahin et al. (2011) [16] studied the effect of saponin on concrete performance and showed that the moderate concentration of AEA results in the optimal UCS of concrete. Furthermore, nuclear magnetic resonance (NMR) can measure the porosity and pore structure by analyzing the T2 relaxation time. Zhang et al. (2018) [17] analyzed the hydration degree of the cemented paste backfill by NMR and demonstrated that polynaphtalene sulfonate has a strong influence on short-duration hydration. Shang et al. (2015) [18] studied the NMR T2 curve, showing that it can be analyzed using the pore size distribution of the filling body.
In short, electrochemical AC impedance technology has been used in some studies to analyze the internal structure and equivalent circuit model of cement materials. However, only a handful of studies have been conducted on the electrochemical AC impedance characteristics of the filling body with different pore structures. The addition of different AEAs to change the porosity and internal pore structure of the filling body, and the analysis of the electrochemical AC impedance, porosity, and the strength of the filling body. In this work, the influence of AEA on the performance of cemented backfill was studied, which provided a reasonable method for AEA to improve the strength and fluidity of cemented backfill.
2. Experimental
2.1. Materials
The main filling aggregate used in the current work was obtained from Sanning mine, Hubei Province, China. According to the actual situation of the mine, coal gangue and tailings were selected as the filling aggregate, while fly ash was used as the cementing materials. The particle size distribution is shown in Figure 1 and Figure 2. According to the GB/T 14685-2011 [19], the apparent density, the packing density, and the contents of surface water of aggregates were analyzed. The corresponding results are presented in Table 1.
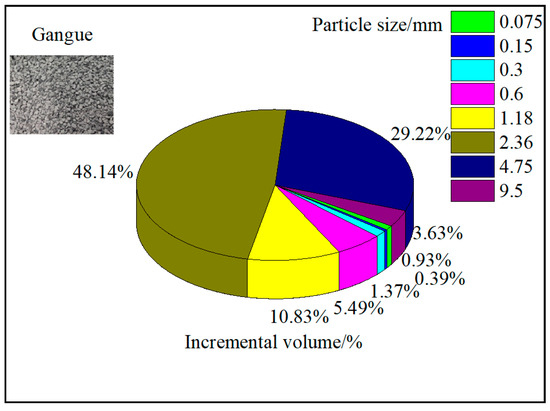
Figure 1.
Particle size distribution of gangue.
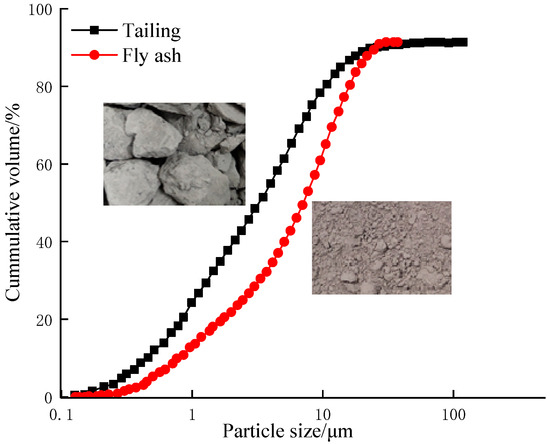
Figure 2.
Particle size distribution of tailing and fly ash.

Table 1.
Physical properties of the materials.
The mineral compositions of materials were obtained using XRD, and the results are provided in Table 2. The dolomite content is up to 69.65% in gangue. Therefore, it has little effect on the cementation activity of the filling body. The hydroxyllapatite in tailings is as high as 60.94%. This will have an effect on the cement hydration reaction and reduce the amount of tri-calcium silicate (C3S) [10,15,16,17]. It will affect the strength of the cemented paste backfill. The Al element is mainly present in muscovite and albite, which will affect the activity of fly ash.
Table 2.
Mineral compositions of the aggregate (%).
In this experiment, three AEAs, namely sodium abietate (SA), sodium dodecyl sulfonate (K12) and triterpene saponins (SJ) were selected. The three AEAs are SA, the main chemical component of which was sodium abietate, SJ, the main chemical component of which was triterpenoid saponin, and K12, whose main chemical component was sodium dodecyl sulfate, which are widely used in China. Table 3 shows the physical properties of three AEAs.
Table 3.
The main characteristic of the used air entraining agents (AEAs).
The main instruments used were UCS (WDW-2000, Shanghai new sansi Measuring Instrument Manufacturing Co., Ltd., Shanghai, China), NMR (MiniMR-60, Shanghai Newmai Co. Ltd., Shanghai, China), an electrochemical workstation and an electron microscope scanner (SEM, MIRA3 (LMH/LMU), TESCAN(China) Co. Ltd., Shanghai, China). The main experimental equipment and processes are shown in Figure 3.
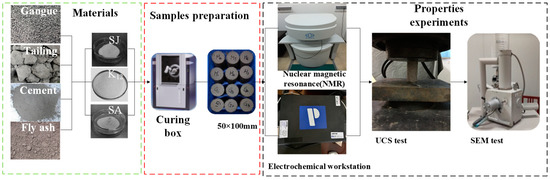
Figure 3.
Main experimental equipment and process.
2.2. Methods
The experiment mainly studied the cementing fill body with the same proportion for different curing ages (7 and 28 days). The changes in porosity, strength, and internal microstructure of the filling body were studied by changing the contents of different AEAs. The grouping and proportioning of this experiment are presented in Table 4. Each group had three filling samples. The main experimental steps are as follows.
Table 4.
Details of mixture proportions for the cemented paste backfill.
(1) According to the proportioning scheme presented in Table 4, the filling material was poured into the mixer for full and even mixing. According to the Sanning mine, the slump height of the filling body needs to reach 22 cm; when the mixing amount of AEA was 0.2%, 0.4% and 0.6%, the slump of the filling body increased approximately by 3%, 6% and 8.5%, respectively. It was then poured into the cylindrical standard test mold (50 mm × 100 mm) after stirring. The samples were cured at ambient temperature (20 °C) and a relative humidity of 99% for 7 and 28 days, respectively.
(2) After 7 and 28 days of curing, the filling body was vacuumed and saturated. The dry pumping mode was selected for 4 h, whereas the wet pumping mode was selected for 2 h to ensure that the sample was fully saturated with water.
(3) The porosity and T2 spectrum of the filling body under the condition of saturated water were measured using the NMR instrument. The NMR tests used the MiniMR-60 magnetic resonance imaging (MRI) analysis system, which was manufactured by Shanghai Newmai Co. Ltd., Shanghai, China. The experimental parameters were as follows: receiver bandwidth SW = 100 KHz; sampling points TD = 4502; waiting time Tw = 4800 ms; analog gain RG1 = 20 db; cumulative sampling NS = 64; 90° pulse application time P1 = 11.52 µs; 180° pulse application time P2 = 22.48 µs; number of echo cycles NECH = 3000; digital gain DRG1 = 3; coil waiting time RFD = 0.25 ms; number of times NS = 64.
(4) The electrochemical workstation (Integrated electrochemical test system of AMETEK, the experimental parameters were as follows: AC properties = value; start frequency = 105 Hz; end frequency = 10−1 Hz; amplitude = 10 mV; current range = 2 mA; Voltage range = ±6 V; points per decade = 10; data quality = 3), the UCS (the tests were conducted by a computer-controlled fully automatic pressure testing machine (WDW-2000) with a maximum capacity of 200 kN. The specimens were loaded at a constant displacement rate of 1mm/min), and SEM (a specimen of 1 mm2 was cut from the center part of each cemented paste backfill specimen, then take the prepared samples to the TESCAN MIRA3 field-emission scanning electron microscope to obtain the results) was used to measure the water-filled filling body with different AEAs and curing ages of 7 and 28 days.
3. Results and Discussion
3.1. AC Impedance of the Filling Body after 7 Days of Curing
Figure 4 shows the electrochemical impedance results of the filling body with different mass concentrations of SA (a), K12 (b), SJ (c) and without AEA (d) for a curing period of 7 days. As can be seen from Figure 4, with the increase in frequency, the AC impedance of the filling body with different mass concentrations of SA, K12 and SJ showed a similar trend to that of without AEA, both of which decreased gradually with the increase in frequency. This indicates that whether AEA is added or not within the frequency range of 10−1–105 Hz, the variation trend of AC impedance of backfill remains unchanged, and the filling body with the same proportion of AEA has a similar topological structure. In the low-frequency range of 10−1–104 Hz, the impedance value of the filling body without AEA is the maximum for the same frequency. Furthermore, the higher the mass concentration of SA and K12, the lower the impedance value. However, with the increase in mass concentration, the AC impedance value of SJ first increased, and then decreased. Within the range of 104–105 Hz at high frequency, the impedance value of the filling body without AEA was the highest. The variation trends of impedance of the filling body for the three AEAs were basically consistent with each other, indicating that the AC impedance of the filling body decreased with the increase in the mass concentration of AEA.
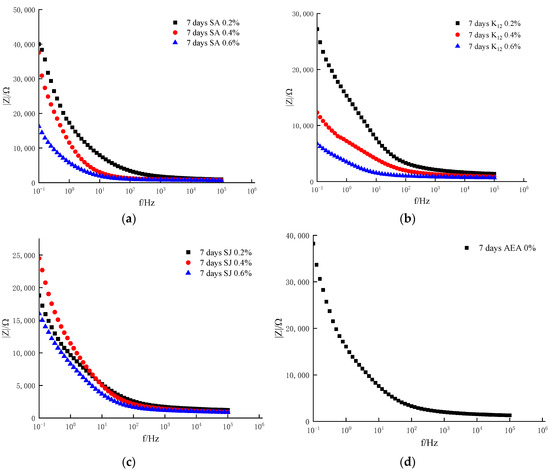
Figure 4.
Relationship between AC impedance value and frequency of filling test block with different AEA added for 7 days of curing age. (a) Add SA; (b) Add K12; (c) Add SJ; (d) 0% AEA.
3.2. AC Impedance of the Filling Body for 28 Days of Curing
Figure 5 shows the electrochemical impedance results of the filling body with different mass concentrations of SA (a), K12 (b), SJ (c) and without AEA (d) for the curing age of 28 days. As can be seen from Figure 5, with the increase in frequency, the AC impedance of the filling body with different mass concentrations of SA, K12 and SJ showed the same variation trend as that of without AEA, both of which decreased gradually with the increase in frequency. This indicates that whether AEA is added or not within the frequency range of 10−1–105 Hz, the variation trend of AC impedance of backfill remains unchanged, and the filling body with the same proportion of AEA shows a similar topological structure. In the low-frequency range of 10−1–104 Hz, the impedance value of the filling body without AEA is the maximum for the same frequency. Adding SA and K12 did not show regularity in the whole low-frequency region; however, regularity was observed only in a certain frequency range. In the high frequency range of 104–105 Hz, the AC impedance variation patterns of the filling body for the curing periods of 28 and 7 days were consistent with each other.
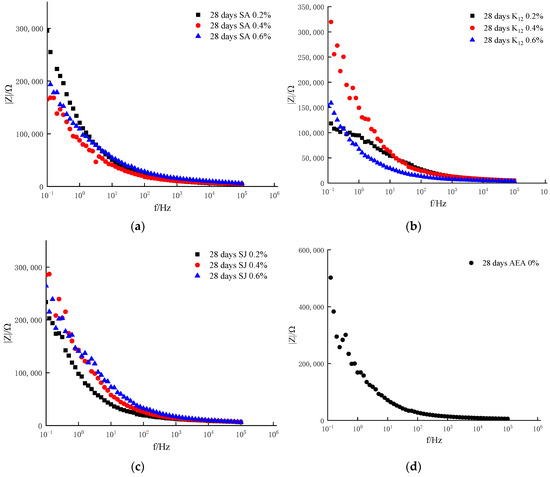
Figure 5.
Relationship between AC impedance value and frequency of filling test block with different AEA added for 28 days of curing age. (a) Add SA; (b) Add K12; (c) Add SJ; (d) 0% AEA.
3.3. Effect of Equivalent Amount of Air-Entraining Agent on AC Impedance
Figure 6 shows the Nyquist plots of AC impedance of the filling body with AEAs present in the same mass concentration for a curing period of 7 days. The impedance spectrum of the filling body with the curing age of 7 days is the same. The AC impedance of the filling body with AEA is lower than that of the test blocks without AEA for the same curing time. When the mass concentration of AEA was 0.2%, the degree of influence on AC impedance was found in the following descending order: SA > K12 > SJ. When the mass concentration of AEA was 0.4%, the degree of influence on AC impedance was found in the following descending order: SA > SJ > K12. When the mass concentration of AEA was 0.6%, the degree of influence on AC impedance was found in the following descending order: SA > SJ > K12. This phenomenon indicates that the addition of AEA reduces the degree of adhesion of the backfill, increases the connectivity of internal pores, and makes the migration of ions in pore water smoother.
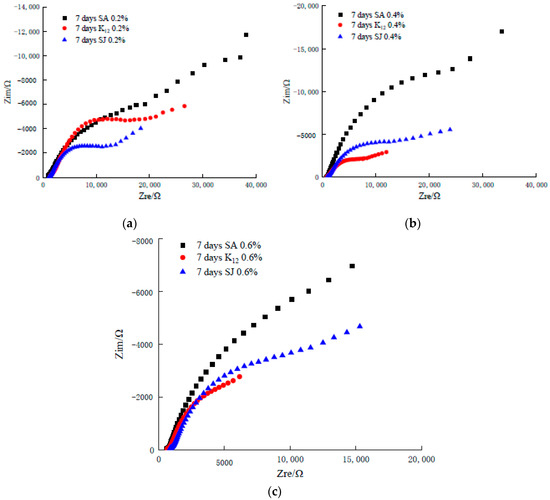
Figure 6.
Nyquist diagram of the filling body with the same amount of AEA for 7 days of curing age. (a) Add 0.2% SA, K12 and SJ, respectively; (b) Add 0.4% SA, K12 and SJ, respectively; (c) Add 0.6% SA, K12 and SJ, respectively.
As shown in Figure 7, the Nyquist plots of AC impedance of the filling body with AEA with the same mass concentration for the same curing age. For the curing age of 28 days, the variation of AC impedance of the filling body is not regular at a low frequency, and it has the similar trend for high frequency. The AC impedance for the test blocks cured for 28 days with the same AEA concentration and the same frequency were all greater than those of the test blocks cured for 7 days. The results show that the longer the curing time, the weaker the connectivity of the pores inside the backfill. This is caused by the hydration expansion reaction, which is the property of the backfill itself. However, the AC impedance value of the sample preserved for 28 days was lower than that of the sample without AEA. When the curing time was less than 28 days, the effect of AEA still existed, making the porosity inside the backfill larger than that of the sample without AEA. The properties of this kind of AEA can help pump the filling slurry and increase the fluidity of filling slurry in actual filling engineering.
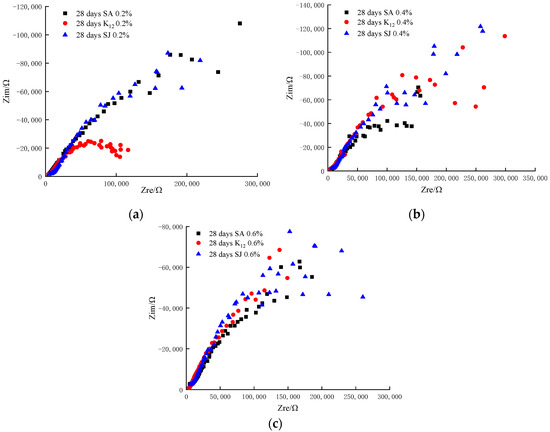
Figure 7.
Nyquist diagram of the filling body with the same amount of AEA for 28 days of curing age. (a) Add 0.2% SA, K12 and SJ, respectively; (b) Add 0.4% SA, K12 and SJ, respectively; (c) Add 0.6% SA, K12 and SJ, respectively.
3.4. Equivalent Circuit Analysis of the AC Impedance
As shown in Figure 8, the conductive schematic of the microstructure of the filling body is mainly composed of three conductive modes, namely the continuous conductive channel (CCP), the discontinuous conductive channel (DCP), and the insulator channel (ICP), in which water in isolated pores forms a solid–liquid contact interface with the backfill.
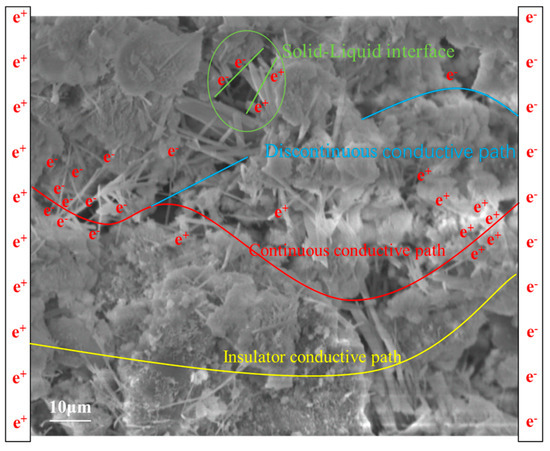
Figure 8.
Schematic diagram of the microstructure of the filling body.
According to the measured impedance value of the filling body based on the electrochemical AC impedance data, Zview software was used to simulate the equivalent circuit, and the corresponding results are shown in Figure 9. The equivalent circuit diagram of the filling body shows samples with SA, K12 and SJ with the mass concentration of 0.6% and for different curing ages. In the equivalent circuit model shown in Figure 9, Ws is the warbug impedance of the diffusion process occurring in the filling body, CPE1 is the original normal-phase angle reflecting the properties of the solid–liquid interface in the backfill, and Rs is the pore water resistance. Furthermore, the resistance of charge transfer in the backfill is represented by Rp.
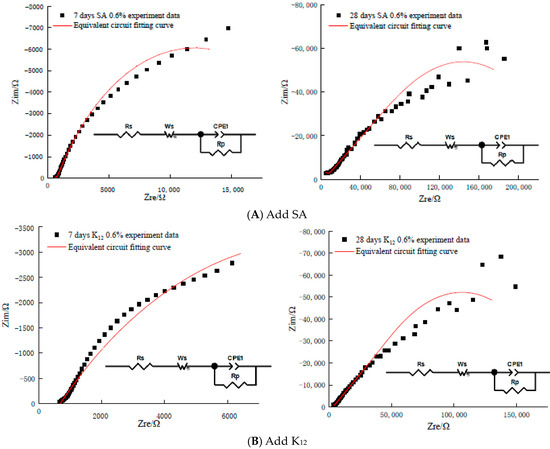
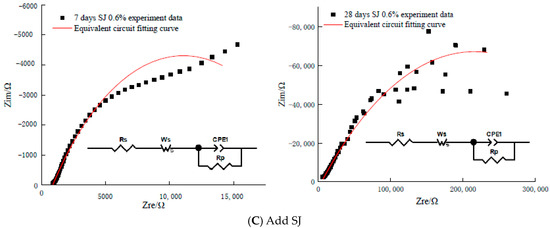
Figure 9.
Equivalent circuit diagram of air entraining agent added to the filling body of different curing ages. (A) Add SA; (B) Add K12; (C) Add SJ.
By simulating the equivalent circuit model of the filling body, it can be seen that when the concentration of SA, K12 and SJ was 0.6% for the same curing age, the equivalent circuit diagram remained unchanged. When the curing ages for the filling body with the same AEA were 7 days and 28 days, the equivalent circuit diagrams remained the same, and the chi-square coefficient had the maximum value of 0.46%. The results show that the main structure of backfill did not change due to different AEAs and curing ages. This means that the components in the equivalent circuit were consistent. However, the internal microstructure of the filling body changed due to changes in AEA and curing ages. Table 5 presents the values of each property parameter of the circuit components. For example, for 0.6% mass concentration of SA for the curing age of 28 days, Rs was 2365 Ω, whereas that for the curing age of 7 days was 560.2 Ω, which is almost 4.2 times less than that for 28 days. These results indicate that longer the curing age, the more adequate the hydration reaction of the backfill, the smaller the internal porosity and the weaker the connectivity.
Table 5.
Equivalent circuit model parameters.
3.5. Analysis of the Porosity of the Filling Body
In this paper, the porosities of water-filled backfill with different concentrations of SA, K12 and SJ cured for 7 and 28 days were measured using the NMR instrument, and the corresponding results are shown in Figure 10. For the same curing age, the porosity inside the backfill gradually increased with the increase in AEA. For the curing age of 7 days, the minimum porosities of SA and SJ were greater than that of 8.686% without AEA, whereas the porosity inside the backfill was greater than that without AEA when the concentration of K12 was only 0.6%. This shows that SA and SJ can increase the porosity of the filling body more significantly than K12. When the curing age was 28 days, the porosities inside the backfill with SA, SJ and K12 were all greater than that without AEA. This shows that all three AEAs can increase the porosity of backfill, and their effect is found in the following descending order: SA > SJ > K12. Obviously, the porosity of backfill with the curing age of 7 days is greater than that of the filling body with the curing age of 28 days. This indicates that the longer the curing age, the more sufficient the hydration reaction and the smaller the porosity.
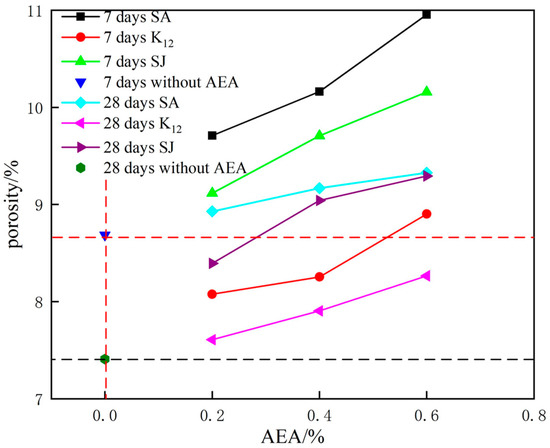
Figure 10.
Porosity of air entraining agent fillings at different curing ages.
SEM was used to analyze the pores in the filling body with the curing ages of 7 and 28 days. The changes of pore structure in the filling body with the addition of AEA and curing age were obtained. It can be seen from Figure 11 that the filling body without AEA for the curing period of 7 days had a smaller porosity with a large number of pores and an uneven distribution. However, the filling body with AEA was more porous with a higher number of pores and even distribution. Due to a certain volume of backfill, the connectivity between the pores inside the filling body will be enhanced. From the microscopic point of view, it is reasonable that the AC impedance value of the filling body with AEA at the same curing age was less than that without AEA. It can be clearly seen from the comparison between the curing period of 7 days and 28 days for 0.6% SA that the longer the curing period, the more sufficient the hydration reaction inside the backfill, which will lead to a smaller porosity. Meanwhile, the larger pore size will gradually decrease, and the smaller pore size will gradually increase. Additionally, the connectivity between the pores will gradually weaken. This indicates that the longer the curing age under the same conditions, the smaller the porosity of backfill and the larger the AC impedance. Liu et al. (1998) [10] showed that the hydration reaction can reduce the pore diameter of the filling body. The experiment in this paper proves this point from the microscopic view, and shows that the filling body with AEA has stronger fluidity, which is conducive to improving the current situation of the long-distance transportation of the filling body.
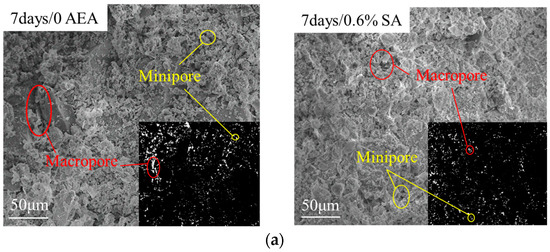
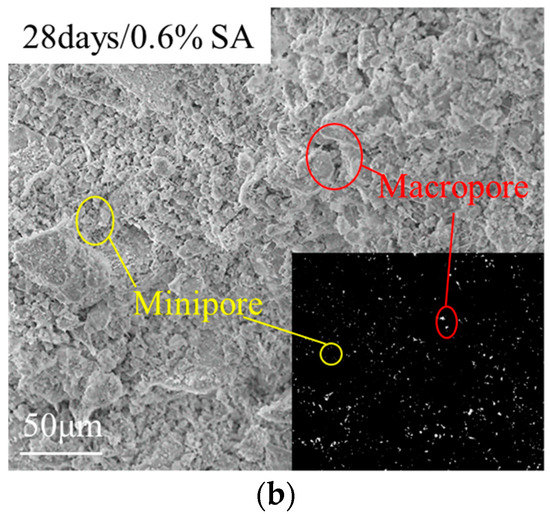
Figure 11.
SEM structure diagram of the filling body. (a) represents the filling body with different AEAs at the 7 day curing age; (b) represents the filling body with different AEAs at the 28 day curing age, the same below.
For the frequency of 105 Hz, Figure 12a,b show that the relationship between the porosity of the filling body with different AEA concentrations and the AC impedance for the curing age of 7 days, and the relationship between the porosity of the filling body with different AEA concentrations and the AC impedance for the curing age of 28 days, respectively. The AC impedance and porosity of the filling body adding SA are given after the curing ages of 7 days, as shown in Table 6. Because some of the pores in the filling body are small or closed, the porosity measured by NMR is smaller than the true value. Therefore, the change in filling porosity studied in this paper is relative, mainly based on the nuclear magnetic resonance technology to study the change law of filling porosity. According to Figure 12a, when the curing age was 7 days, the experimental data were fitted linearly, and the values of correlation coefficient (R2) were 0.7116, 0.9129 and 0.9487, respectively. This indicates that porosity is linearly correlated with AC impedance, and the AC impedance decreases with the increase in porosity. As can be seen from Figure 12b, when the curing age was 28 days, the experimental data were fitted linearly. However, such a feat could not be achieved for SJ. The values of correlation coefficient for SA and K12 were 0.9571 and 0.9655, respectively. The larger the porosity of the backfill with SA, the higher the impedance, while the larger porosity of the backfill with K12, the smaller the impedance.
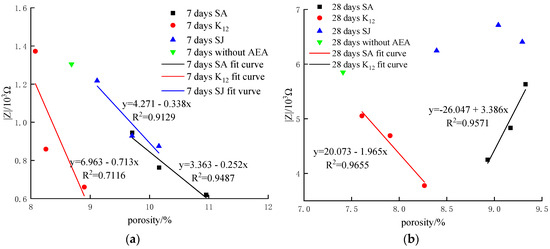
Figure 12.
Relationship between porosity and AC impedance at 105 Hz; (a) represents the filling body with different AEAs at the 7 days curing age; (b) represents the filling body with different AEAs at the 28 days curing age.
Table 6.
Adding sodium abietate (SA), the AC impedance of the filling body for the curing ages of 7 days.
The experimental results show that the porosity and AC impedance at the curing age of 7 days show a negative linear correlation, while at the curing age of 28 days, the porosity and AC impedance do not show a good regularity, but are related to the type of AEA added. The porosity and AC impedance of backfill with the curing age of 7 days with different concentrations of AEA show a linear negative correlation. However, the relationship between the porosity and AC impedance of the filling body with different concentrations of AEA for a curing age of 28 days at high frequency is affected by the type of AEA added to the system.
3.6. Analysis of the Strength of the Filling Body
In this paper, the electro-hydraulic servo material testing machine of 200 kN was used to measure the uniaxial compressive strength of water saturated backfill with different concentrations of SA, K12 and SJ and the curing ages of 7 and 28 days, respectively. The results are shown in Figure 13. For the same curing age, the uniaxial compressive strength of the filling body decreases gradually with the increase in AEA concentration. When the curing age was 7 days, the uniaxial compressive strengths of the backfill with SA, SJ and K12 with the concentration of 0.4% were close to that of the backfill without AEA at 1.23 MPa. This shows that the three AEAs in this paper have similar effects on the uniaxial compressive strength of the filling body. When the curing age was 28 days, the relationship between the uniaxial compressive strength of the filling body and the AEA was similar to that of the curing age of 7 days. When the concentration of AEA was 0.4%, the strength of the filling body was close to that of the sample without AEA. Obviously, with the same type of AEA, the uniaxial compressive strength of the backfill with the curing age of 28 days was greater than that for the curing age of 7 days. The results show that the longer the curing time, the more sufficient the hydration reaction inside the backfill, the smaller and more uniform the porosity inside the filling body, and the stronger the backfill strength. While Şahin et al., (2011) [16] showed that the moderate concentration of AEA results in the optimal UCS of concrete, in accordance with the experimental results, this shows that the filling body with 0.4% concentration of AEA can improve the production of the mine due to the insufficient strength of the filling body compared with the filling body without AEA, thus relieving the pressure of mining on the ecological environment.
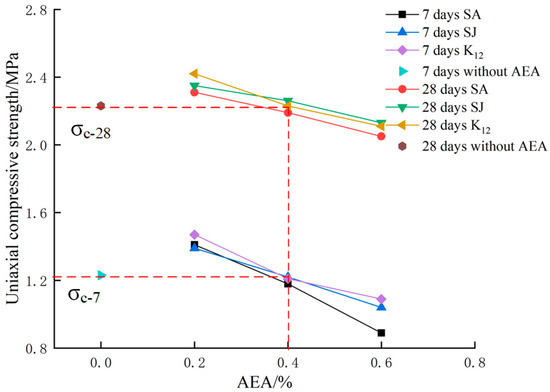
Figure 13.
Uniaxial compressive strength of AEA for different curing ages.
For the frequency of 105 Hz, Figure 14a,b show the relationship between the UCS and the AC impedance of the filling body with different concentrations of AEA for the curing age of 7 days, and the relationship between the UCS and the AC impedance of the filling body with different concentrations of AEA for the curing age of 28 days, respectively. As can be seen from Figure 14a, when the curing age was 7 days, the experimental data were fitted linearly, and the values of correlation coefficient (R2) were 0.8542, 0.9984 and 0.981, respectively. These results show that the UCS was linearly correlated with the AC impedance, and the AC impedance increased with the increase in strength. As can be seen from Figure 14b, the experimental data for the curing age of 28 days were linearly fitted (except for the data for SJ). The values of correlation coefficient of SA and K12 were 0.9979 and 0.8668, respectively. The higher the strength of the backfill with SA, the lower the impedance value was, while the higher the strength of the filling body with K12, the higher the impedance value.
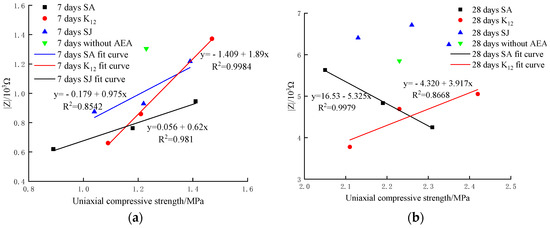
Figure 14.
Relationship between the uniaxial compressive strength (UCS) and the AC impedance at 105 Hz. (a) represents the filling body with different AEAs at the 7 days curing age; (b) represents the filling body with different AEAs at the 28 days curing age.
The experimental results show that the UCS was positively linearly correlated with the AC impedance value for the curing age of 7 days, while the UCS and impedance value at the curing age of 28 days do not show a good regularity, but are related to the type of AEA added to the system. The porosity and impedance of backfill with the curing age of 7 days with different concentrations of AEA were positively linearly correlated. The relationship between the UCS and AC impedance of the filling body with different concentrations of AEA for a curing age of 28 days at high frequency was affected by the type of AEA added to the system.
4. Conclusions
(1) Within the frequency range of 10−1–105 Hz, the addition of SA, SJ and K12 AEAs cannot change the variation pattern of the AC impedance of the filling body, which showed a gradual decrease. The AC impedance of the backfill for the curing age of 7 days was stronger than that of the filling body with the curing age of 28 days.
(2) Equivalent circuit fitting shows that the backfill with different kinds of AEAs and curing ages can be represented by the same equivalent circuit model, indicating that the main structure of the backfill samples had not changed, and that only the internal microstructure of the backfill changed due to the AEAs and curing ages.
(3) For the same curing age, the porosity inside the backfill increased with the increase in AEA. With the same type of AEA, the porosity of backfill with the curing age of 7 days was greater than that of the backfill with the curing age of 28 days.
(4) Under the condition of high frequency of 105 Hz, the porosity of the backfill with 7 days of curing age was negatively correlated with the AC impedance, whereas the UCS was positively correlated with the AC impedance. For the backfill with the curing age of 28 days, the relationship between the porosity, the UCS and the AC impedance was affected by the type of AEA at the high frequency of 105 Hz.
Author Contributions
Y.Q. performed the data analyses and wrote the manuscript; J.H. helped perform the analysis with constructive discussions; D.Y. contributed to the conception of the study and editing; Y.K. performed the experiment; F.Z. and T.Z. performed the data analyses.All authors have read and agreed to the published version of the manuscript.
Funding
The authors gratefully acknowledge the support of the National Key Research and Development Program of China through the Grant No. 2017YFC0602901 and the support of the National Natural Science Foundation of China (Grant No. 41672298).
Acknowledgments
The authors thank instructional support specialist Modern Analysis and Testing Central of Central South University.
Conflicts of Interest
The authors declare no conflict of interest.
References
- McCarter, W.; Garvin, S.; Bouzid, N. Impedance measurements on cement paste. Mater. Sci. Lett. 1988, 7, 1056–1057. [Google Scholar] [CrossRef]
- Bruce, J.C.; Tate, C.; Rudolf, A.O.; Steven, J.F.; Edward, J.G.; Hamlin, M.J.; Thomas, O.M. Impedance spectroscopy of hydrating cement-based materials: Measurement, interpretation, and application. J. Am. Ceram. Soc. 2005, 77, 2789–2804. [Google Scholar]
- Keddam, M.; Takenouti, H.; Novoa, X.; Andrade, C.; Alonso, C. Impedance measurements on cement paste. Cem. Concr. Res. 1997, 27, 1191–1201. [Google Scholar] [CrossRef]
- Song, G. Equivalent circuit model for AC electrochemical impedance spectroscopy of concrete. Cem. Concr. Res. 2000, 30, 1723–1730. [Google Scholar] [CrossRef]
- Woo, L.; Wansom, S.; Hixson, A.; Campo, M.; Mason, T. A universal equivalent circuit model for the impedance response of composites. J. Mater. Sci. 2003, 38, 2265–2270. [Google Scholar] [CrossRef]
- Cruz, J.; Fita, I.; Soriano, L.; Payá, J.; Borrachero, M. The use of electrical impedance spectroscopy for monitoring the hydration products of Portland cement mortars with high percentage of pozzolans. Cem. Concr. Res. 2013, 50, 51–61. [Google Scholar] [CrossRef]
- Sánchez, I.; XNóvoa Vera, G.D.; Climent, M. Microstructural modifications in Portland cement concrete due to forced ionic migration tests. Study by impedance spectroscopy. Cem. Concr. Res. 2008, 38, 1015–1025. [Google Scholar] [CrossRef]
- Shi, C.; Stegeman, J.A.; Cadwell, R.J. Effect of supplementary cementing materials on the specific conductivity of pore solution and its implications on the rapid chloride permeability test (AASHTO T277and ASTM C1202) results. ACI Mater. J. 1998, 95, 389–394. [Google Scholar]
- Zhang, Y.; Shi, M.L. Study of the hydration process of cement-based materials by ac impedance technique. Chin. J. Build. Mater. 2000, 3, 109–112. [Google Scholar]
- Liu, C.S.; Shen, W.; Zheng, H.Y. AC impedance spectroscopy in the hydration process of calcium phosphate cement. J. Chin. Ceram. Soc. 1998, 26, 437–442. [Google Scholar] [CrossRef]
- Andrade, C.; Blanco, V.M.; Collazo, A.; Keddam, M.; Novoa, X.R.; Takenouti, H. Cement paste hardening process studied by impedance spectroscopy. Electrochim. Acta 1999, 44, 4313–4318. [Google Scholar] [CrossRef]
- Wansom, S.; Janjaturaphan, S. Evaluation of fiber orientation in plant fiber-cement composites using AC-impedance spectroscopy. Cem. Concr. Res. 2013, 45, 37–44. [Google Scholar] [CrossRef]
- Wu, L.; Dai, P.; Li, Y. Determination of the transport properties of structural concrete using AC impedance spectroscopy techniques. J. Eng. 2016, 10, 1–8. [Google Scholar] [CrossRef]
- McCarter, W.J.; Chrisp, T.M.; Starrs, G.; Adamson, A.; Basheer, P.A.M.; Nanukuttan, S.V.; Srinivasan, S.; Green, C. Characterization of physio-chemical processes and hydration kinetics in concretes containing supplementary cementitious materials using electrical property measurements. Cem. Concr. Res. 2013, 50, 26–33. [Google Scholar] [CrossRef]
- Zhu, J.; Wang, Z.; Li, Y.; Li, Z. Effect of air entraining agent on uniaxial tensile properties of PVA-ECC. In Proceedings of the 3rd International Conference on Manufacturing, Material and Metallurgical Engineering, Kuala Lumpur, Malaysia, 17–19 March 2018; Volume 409, pp. 12–29. [Google Scholar]
- Şahin, R.; Polat, R.; İçelli, O.; Çelik, C. Determination of transmission factors of concretes with different water/cement ratio, curing condition, and dosage of cement and air entraining agent. Ann. Nucl. Energy 2011, 38, 1505–1511. [Google Scholar] [CrossRef]
- Zhang, J.; Deng, H.; Taheri, A.; Deng, J.; Ke, B. Effects of superplasticizer on the hydration, consistency, and strength development of cemented paste backfill. Minerals 2018, 8, 381. [Google Scholar] [CrossRef]
- Shang, J.; Hu, J.; Zhou, K.; Luo, X.; Aliyu, M.M. Porosity increment and strength degradation of low-porosity sedimentary rocks under different loading conditions. Int. J. Rock Mech. Min. Sci. 2015, 75, 216–223. [Google Scholar] [CrossRef]
- GB/T 14685-2011. Pebble and Crushed Stone for Construction; National Standardization Administration of China: Beijing, China, 2011. [Google Scholar]


© 2020 by the authors. Licensee MDPI, Basel, Switzerland. This article is an open access article distributed under the terms and conditions of the Creative Commons Attribution (CC BY) license (http://creativecommons.org/licenses/by/4.0/).