Article

Simultaneous Partitioning of Divalent Metal Ions between Alabandite and 1 mol/L (Ni, Mg, Co, Zn, Fe)Cl2 Aqueous Solutions under Supercritical Conditions

Department of Resources and Environmental Engineering, School of Creative Science and Engineering, Waseda University, Shinjuku, Tokyo 169-8555, Japan
*
Author to whom correspondence should be addressed.
Minerals 2020, 10(8), 696; https://doi.org/10.3390/min10080696
Submission received: 21 July 2020 / Revised: 2 August 2020 / Accepted: 4 August 2020 / Published: 5 August 2020
(This article belongs to the Special Issue Distribution of Major- and Trace-Elements in Igneous Minerals)

Abstract

:
To clarify the element partitioning behavior between minerals and aqueous chloride solutions, we conducted experiments to investigate simultaneous partitioning of Ni2+, Mg2+, Co2+, Zn2+, Fe2+, and Mn2+ ions between alabandite (MnS) and 1 mol/L (Ni, Mg, Co, Zn, Fe)Cl2 aqueous solutions at 500–800 °C and 100 MPa. The bulk partition coefficients calculated using the following equation were in the order of Fe2+ > Co2+ > Ni2+ ≈ Zn2+ > Mn2+ >> Mg2+; KPN = (xMeS/mMeaq)/(xMnS/mMnaq). A partition coefficient-ionic radius (PC-IR) curve was plotted with the logarithmic value of the partition coefficient on the y-axis and the ionic radius at the six-fold coordinated site on the x-axis. The peak of this curve was located near the ionic radius of Fe2+ and not near the ionic radius of Mn2+. Zn2+ showed a slight negative partitioning anomaly, which increased in the order of sulfide minerals < arsenic sulfide minerals < arsenide minerals as the covalent bond became stronger. Ni2+ showed a positive partitioning anomaly, which indicated that it preferred an octahedral structure. The width of the PC-IR curve decreased in the order of sulfide minerals > arsenic sulfide minerals > arsenide minerals as the covalent bond became stronger, that is, the ion selectivity became stronger.

1. Introduction

Basic data about the partitioning behavior of elements between hydrothermal fluids and ore minerals are needed to clarify the formation conditions of hydrothermal ore deposits. Studies on fluid inclusions (e.g., [1]) indicate that hydrothermal water involved in the formation of hydrothermal ore deposits can be regarded as an aqueous chloride solution. We have previously conducted experiments on the simultaneous partitioning of elements between minerals and aqueous chloride solutions under supercritical conditions for various minerals, including sulfide minerals, arsenic sulfide minerals, and arsenide minerals such as pyrite (FeS2), pyrrhotite (FeS) [2], arsenopyrite (FeAsS), cobaltite (CoAsS) [3], löllingite (FeAs2), and safflorite (CoAs2) [4]. These are important minerals among the ore minerals and have been used to investigate simultaneous partitioning of Ni, Mg, Co, Zn, Fe, and Mn between ore minerals and aqueous chloride solutions under supercritical conditions at 500–800 °C and 100 MPa. To date, alabandite (MnS), which is a manganese sulfide mineral, has not been used in these types of experiments.
In pyrite, pyrrhotite, arsenopyrite, cobaltite, löllingite, and safflorite, the main divalent metal ion is Fe or Co, but in alabandite, Mn is the main divalent metal ion. A change in the main element could affect the partitioning. Partition coefficient–ionic radius (PC-IR) curves can be constructed to investigate this. In these curves, the partition coefficient is plotted on the y-axis and the ionic radius for six-fold coordination is plotted on the x-axis. For cobaltite and safflorite, which have Co as the main element, the peak of this curve is located near the ionic radius of Co2+ [3,4]. In pyrite, pyrrhotite, arsenopyrite, and löllingite, the main element is Fe but the peak of the PC-IR curve is located slightly on the Fe2+ side of the ionic radius of Co2+, and Co, not Fe, has the largest partition coefficient [2,3,4].
Generally, the main elements (divalent metal ions) that make up a mineral are thought to enter the mineral easily and have larger partition coefficients than other divalent metal ions. In reality, this is not always the case and the partition coefficients of major elements are not always the largest.
In the present study, we selected alabandite, whose main element is Mn, to investigate partitioning behavior. One aim of this research was to understand the effect of the main element on partitioning.

2. Materials and Methods

2.1. Experimental System

In this study, experiments were conducted to investigate the simultaneous partitioning of divalent metal ions (Ni2+, Mg2+, Co2+, Zn2+, Fe2+, and Mn2+) between alabandite and 1 mol/L (Ni, Mg, Co, Zn, Fe)Cl2 aqueous solutions. The experiments were conducted at 500–800 °C and 100 MPa.
The ideal chemical composition of alabandite is MnS. In naturally occurring alabandite, up to 22% of the amount of Mn is replaced with Fe and up to 7% with Mg [5]. Alabandite is in the cubic system and is classified in the galena group. Its structure is the same as that of rock salt (NaCl). The Mn and S are surrounded by six S and Mn, respectively, and are located in a site with six-fold coordination. Alabandite is often in the form of hexahedral or octahedral crystals, and is often found in epithermal ore deposits.
Differential thermal analysis measurements by Staffansson [6] and Mann and Van Vlack [7] showed that alabandite was stable up to 1665 and 1610 °C, respectively, under oxygen-free conditions at atmospheric pressure.

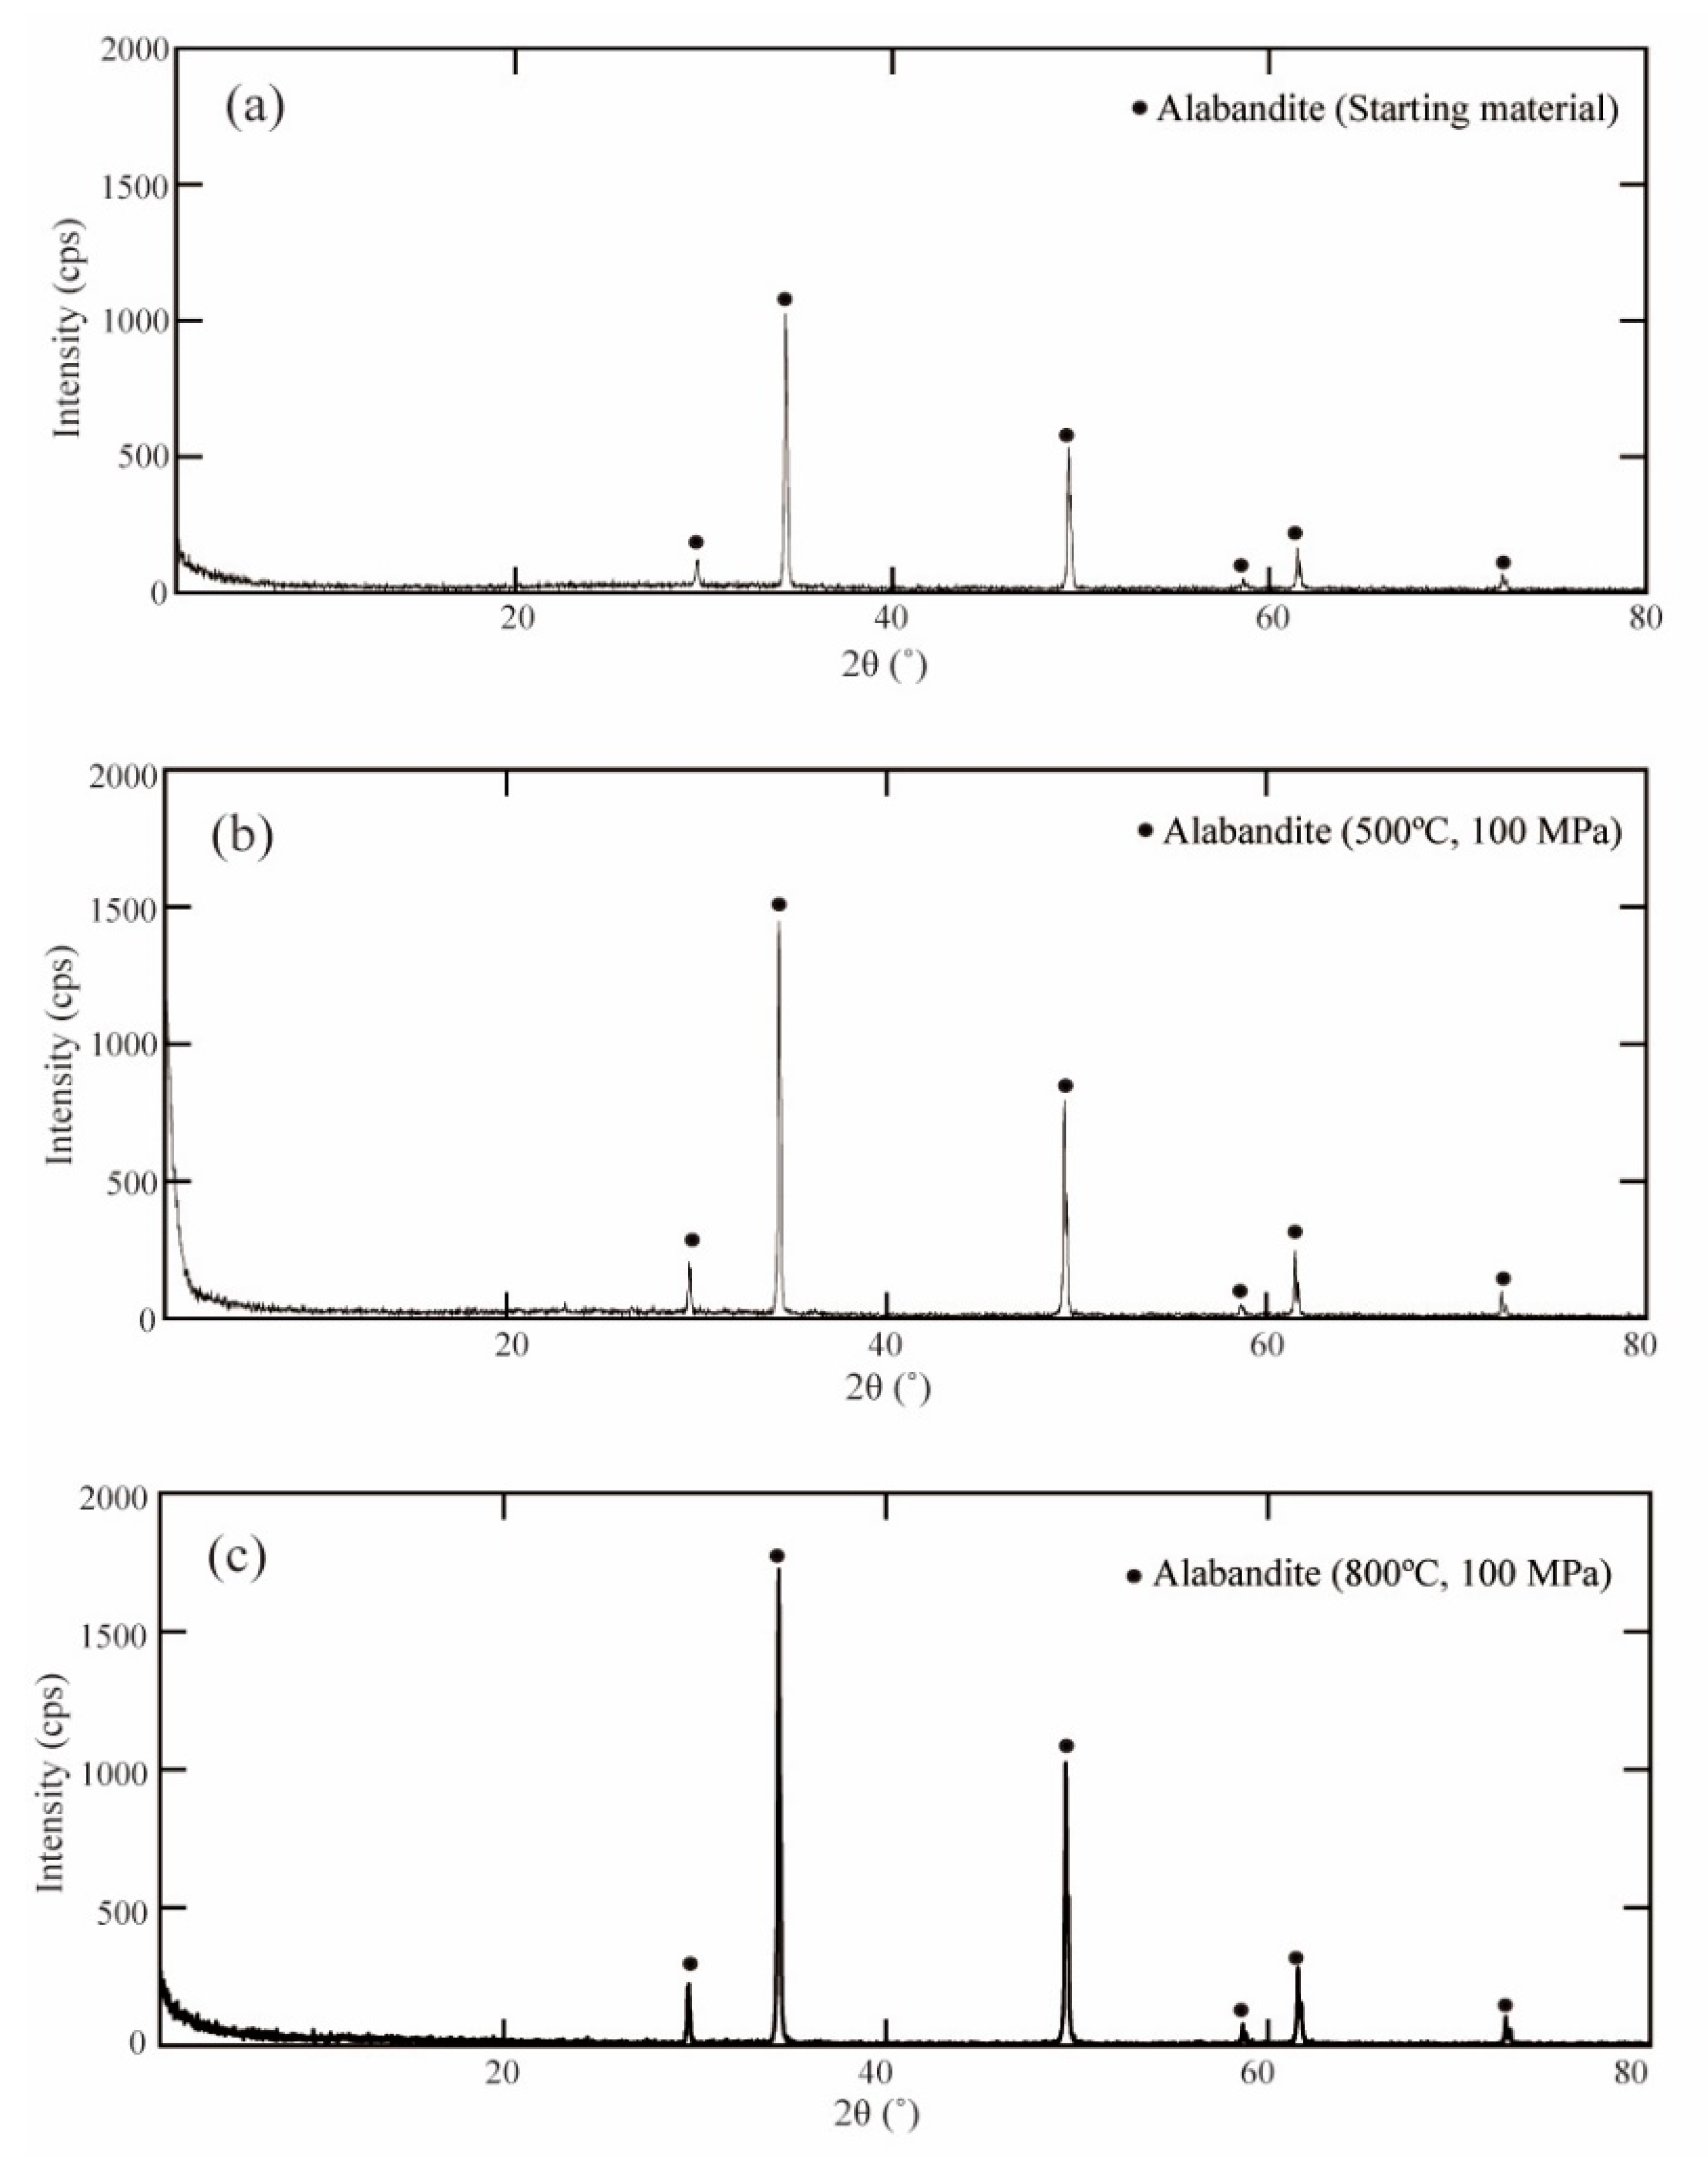
2.2. Solid Starting Material

Alabandite (99.9 % purity; Rare Metallic Co., Ltd., Tokyo, Japan) was used as a starting material. Powder X-ray diffraction analysis showed only peaks for alabandite. Scanning electron microscopy (SEM) showed that the alabandite was granular with a particle diameter of about 1–2 μm. The crystal form was not clear.

2.3. Reaction Solution

The reaction solution was a mixture of 1 mol/L NiCl2, MgCl2, CoCl2, ZnCl2, and FeCl2 aqueous solutions. The aqueous chloride solutions were prepared from reagent grade NiCl2·6H2O and MgCl2·6H2O manufactured by Kanto Chemical Co., Inc. (Tokyo, Japan), CoCl2·6H2O and ZnCl2 manufactured by Kokusan Chemical Co., Ltd. (Tokyo, Japan), and FeCl2·4H2O manufactured by FUJIFILM Wako Pure Chemical Corporation (Osaka, Japan). The 1 mol/L MgCl2, FeCl2, CoCl2, NiCl2, and ZnCl2 aqueous solutions were mixed at a volume ratio of 10:1:1:1:1 or 5:1:1:1:1. Because it is difficult for Mg to enter alabandite, the Mg concentration in the reaction solution was set higher than that for the other divalent metal ions to improve the analysis accuracy.

2.4. Experimental Procedure

Approximately 30 mg of the solid starting material was ground in an agate mortar. It was then added to a gold tube (inner diameter of 2.7 mm, outer diameter of 3.0 mm, and length of approximately 35 mm) with 20–25 μL of the reaction solution and a small amount (1 mg or less) of anthracene, which was used as a reducing agent for keeping Fe and Mn in a divalent state. One end of the gold tube was welded using a carbon electrode and the other end of the tube was sealed by welding to encapsulate the starting materials (Table 1). After putting the tube in an oven at 105 °C overnight, it was weighed to confirm that there was no leakage of materials.
The gold tube containing the starting materials and a stainless steel spacer (length of 150 mm, diameter of 5 mm; SUS316), which was used to reduce the temperature gradient, were placed in a standard stellite (stellite 25) cold-sealed reaction vessel with a volume of 5.5 cm3 (HP-MRA-114S, HP Technos, Ibaraki, Japan). The reaction vessel was placed horizontally and heated using an electric furnace. The temperature was measured by a chromel–alumel thermocouple attached to the outer surface of the reaction vessel. Temperature control was performed using a temperature controller (DSS83, Shimaden Co. Ltd., Tokyo, Japan). Water was used as the pressure medium. The pressure in the reaction vessel was measured using a 200 MPa pressure gauge (Yamazaki Keiki Co. Ltd., Tokyo, Japan) connected using a capillary tube. A hand pump connected using a capillary tube was used for adjusting the pressure. The reaction temperatures investigated were 500, 600, 700, and 800 °C, and the pressure was 100 MPa. The reaction period was 14 days at 500 °C, 7 days at 600 °C, 5 days at 700 °C, and 3 days at 800 °C. Table 1 shows the experimental conditions.
After the set reaction period, the reaction vessel was immersed in a water-filled stainless-steel bucket and rapidly cooled to stop the reaction. After cooling, the gold tube was removed from the reaction vessel and weighed to confirm that there was no leakage of reactants. Then, the gold tube was opened, and the contents were washed out into a beaker with distilled water using a syringe. A Millipore filter (0.45 μm HA) was used to separate the solid and liquid products.
The solid product was analyzed using a powder X-ray diffractometer (RINT-Ultima III, Rigaku, Tokyo, Japan). Quantitative analysis was performed by energy dispersive X-ray spectroscopy (EDX) with SEM (JSM-6360, JEOL, Tokyo, Japan) equipped with an energy dispersive detector (INCA ENERGY, Oxford Instruments, Abingdon, England). The solid product was dispersed on carbon double-sided tape, which was attached to a glass slide before carbon coating. The surface of the solid product was analyzed. The measurement time at each point was set to 600 s. Between three and five grains were analyzed for each solid product, and the average value was taken as the composition. Analyses were performed for Ni, Mg, Co, Zn, Fe, Mn, and S.
The liquid product was subjected to quantitative analysis of metal ions (Ni, Mg, Co, Zn, Fe, and Mn) using an inductively coupled, plasma atomic emission spectrometer (iCAP6300, Thermo Fisher Scientific Inc., Waltham, MA, USA).

3. Results and Discussion

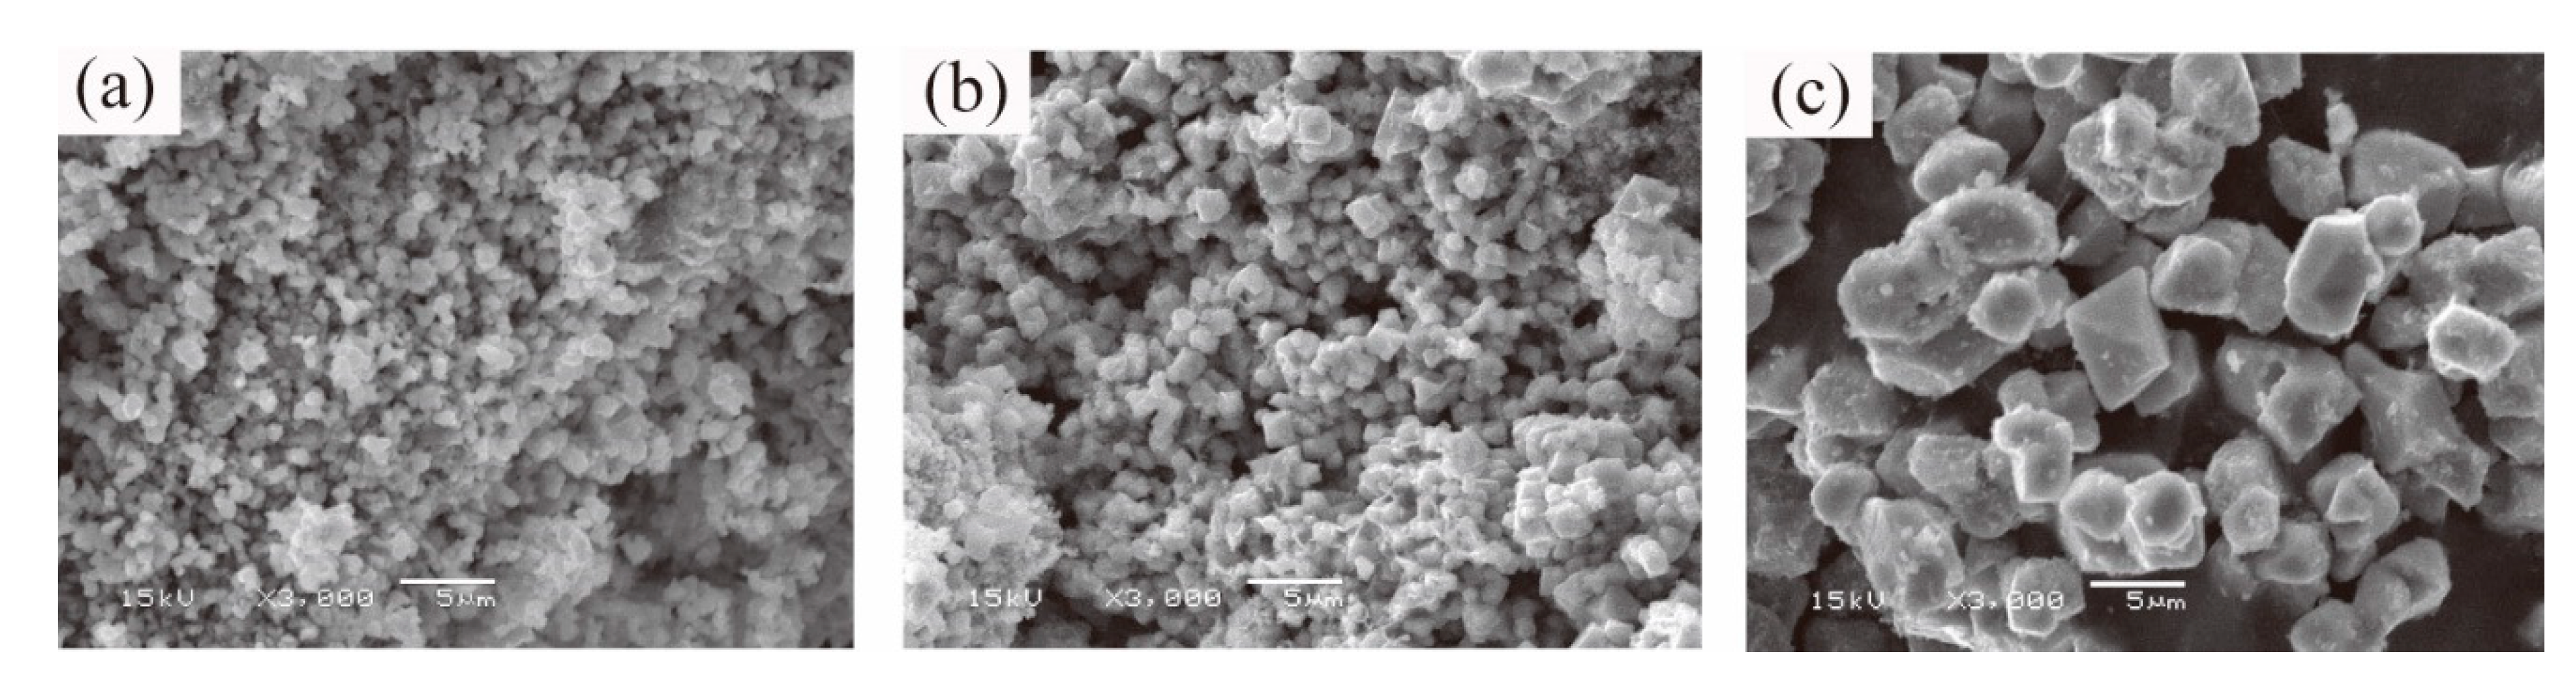
3.1. Solid and Liquid Products

About 10 mg of the solid product was ground in an agate mortar, dissolved in a few drops of water, applied to a glass slide, dried and then subjected to powder X-ray diffraction analysis (Figure 1). Only diffraction peaks for alabandite were detected at all temperatures. SEM showed that the alabandite was octahedral with a particle size of about 2 μm at 500 °C and about 5 μm at 800 °C. The particle size tended to increase with increases in the temperature (Figure 2).
Analysis of alabandite by SEM-EDX showed that the molar ratio of total divalent metal ions to S was approximately 1:1. Among the divalent metal ions, Mn was predominant and accounted for 88%–98% of the total amount. This was followed by Fe (1%–8%), Co (0.3%–2.3%), Zn (0.1%–2.3%), Ni (0.1%–1.3%), and Mg (0.1%–0.4%) (Table 2). The accuracy (1σ) of analysis by SEM-EDX was about 0.27, 0.17, 0.11, 0.09, 0.14, 0.09, and 0.06% for S, Mn, Fe, Co, Zn, Ni, and Mg, respectively.
Analysis of the liquid product by inductively coupled plasma atomic emission spectroscopy showed that the most of the divalent metal ions were Mg (38%–70% of the total amount) and Mn (30%–62%). By comparison, Ni (0.1%–0.01%), Co (<0.04%), Zn (<0.04%), and Fe (<0.03%) were present in smaller amounts (Table 2). The accuracy (1σ) of analysis by inductively coupled plasma atomic emission spectroscopy was about 1% for Mg and Mn and about 5% for all other metals, which was higher than the analytical accuracy for the solid phase.

3.2. Element Partitioning

Partitioning of divalent metal ions between alabandite and the aqueous chloride solution could be expressed using the following equation
MnS + Me aq = MeS + Mn aq ,
where Me represents a metal, and the subscript aq indicates that it is hydrated. The bulk partition coefficient, KPB(MnS), for Equation (1) can be expressed as follows
K P N ( MnS ) = x MeS m Me aq / x MnS m Mn aq ,
where x is the mole fraction of MnS or MeS in alabandite, and m is the molar concentration of the divalent metal ion in the aqueous chloride solution. Table 2 shows the partition coefficient, KPB(MnS), calculated from xMnS or xMeS and the molar concentration of each divalent metal ion in the aqueous chloride solution. The partition coefficients at the different temperatures did not differ significantly and were in the following order: Fe2+ > Co2+ > Ni2+ ≈ Zn2+ > Mn2+ >> Mg2+.
Under the experimental conditions, we assumed that most of the divalent metal ions in the aqueous chloride solution were neutral dissolved species. In that case, Equation (1) can be expressed as follows:
MnS + MeCl 2 aq = MeS + MnCl 2 aq
The partition coefficient, KPN(MnS), for the above equation can then be expressed as follows:
K P N ( MnS ) = x MeS m MeCl 2 aq / x MnS m MnCl 2 aq
The molar concentrations of the neutral dissolved species for each metal obtained by solving the mass conservation equation for each element and the mass action equation for the dissolved species (e.g., [8]) are summarized in Table 2. For the formation constant of the trichloro complex of Ni, values estimated using the value obtained by Uchida et al. [9] at 600 °C and 100 MPa was used. The partition coefficients, KPN(MnS), obtained from these values are shown in Table 2. The difference between the logarithmic values of KPB(MnS) and KPN(MnS) was small, and was, at most, only about 0.1 (Table 2).
Figure 3 shows the PC-IR diagrams (Onuma diagrams) [10] with the logarithmic value of the partition coefficient KPB(MnS) on the y-axis and the ionic radius for six-fold c.oordination [11] on the x-axis. The PC-IR curves have parabola shapes [12,13]. The results of previous partitioning experiments on divalent metal ions using pyrite, pyrrhotite, arsenopyrite, cobaltite, löllingite, and safflorite showed that Ni2+ had a positive partitioning anomaly and Zn2+ had a negative partitioning anomaly [2,3,4]. Therefore, we constructed a PC-IR curve using the partition coefficients of Fe2+, Co2+, Mn2+, and Mg2+ (Figure 3). This curve showed that Ni2+ had a clear positive partitioning anomaly. By contrast, Zn2+ seemed to exhibit a slightly negative partitioning anomaly, although this was not always clear. These results indicate that the partition tendencies of the divalent metal ions for alabandite are basically the same as those mentioned above for sulfide minerals, arsenic sulfide minerals, and arsenide minerals. However, the peak of the PC-IR curve was almost at the ionic radius of Fe2+ (0.78 Å), and clearly differed from the position of the most abundant divalent metal ion (Mn2+, 0.83 Å). Therefore, although alabandite is an Mn mineral, the most easily distributed divalent metal ion is Fe2+. Furthermore, Co2+, Zn2+, and Ni2+ tended to partition more easily than Mn2+. However, Mg2+ (0.72 Å) partitioned much less than Mn2+ in alabandite.
Figure 4 shows the temperature dependence of the logarithmic value of the partition coefficient (Arrhenius plot). There was no obvious temperature dependence of the partition coefficient in the experimental temperature range.

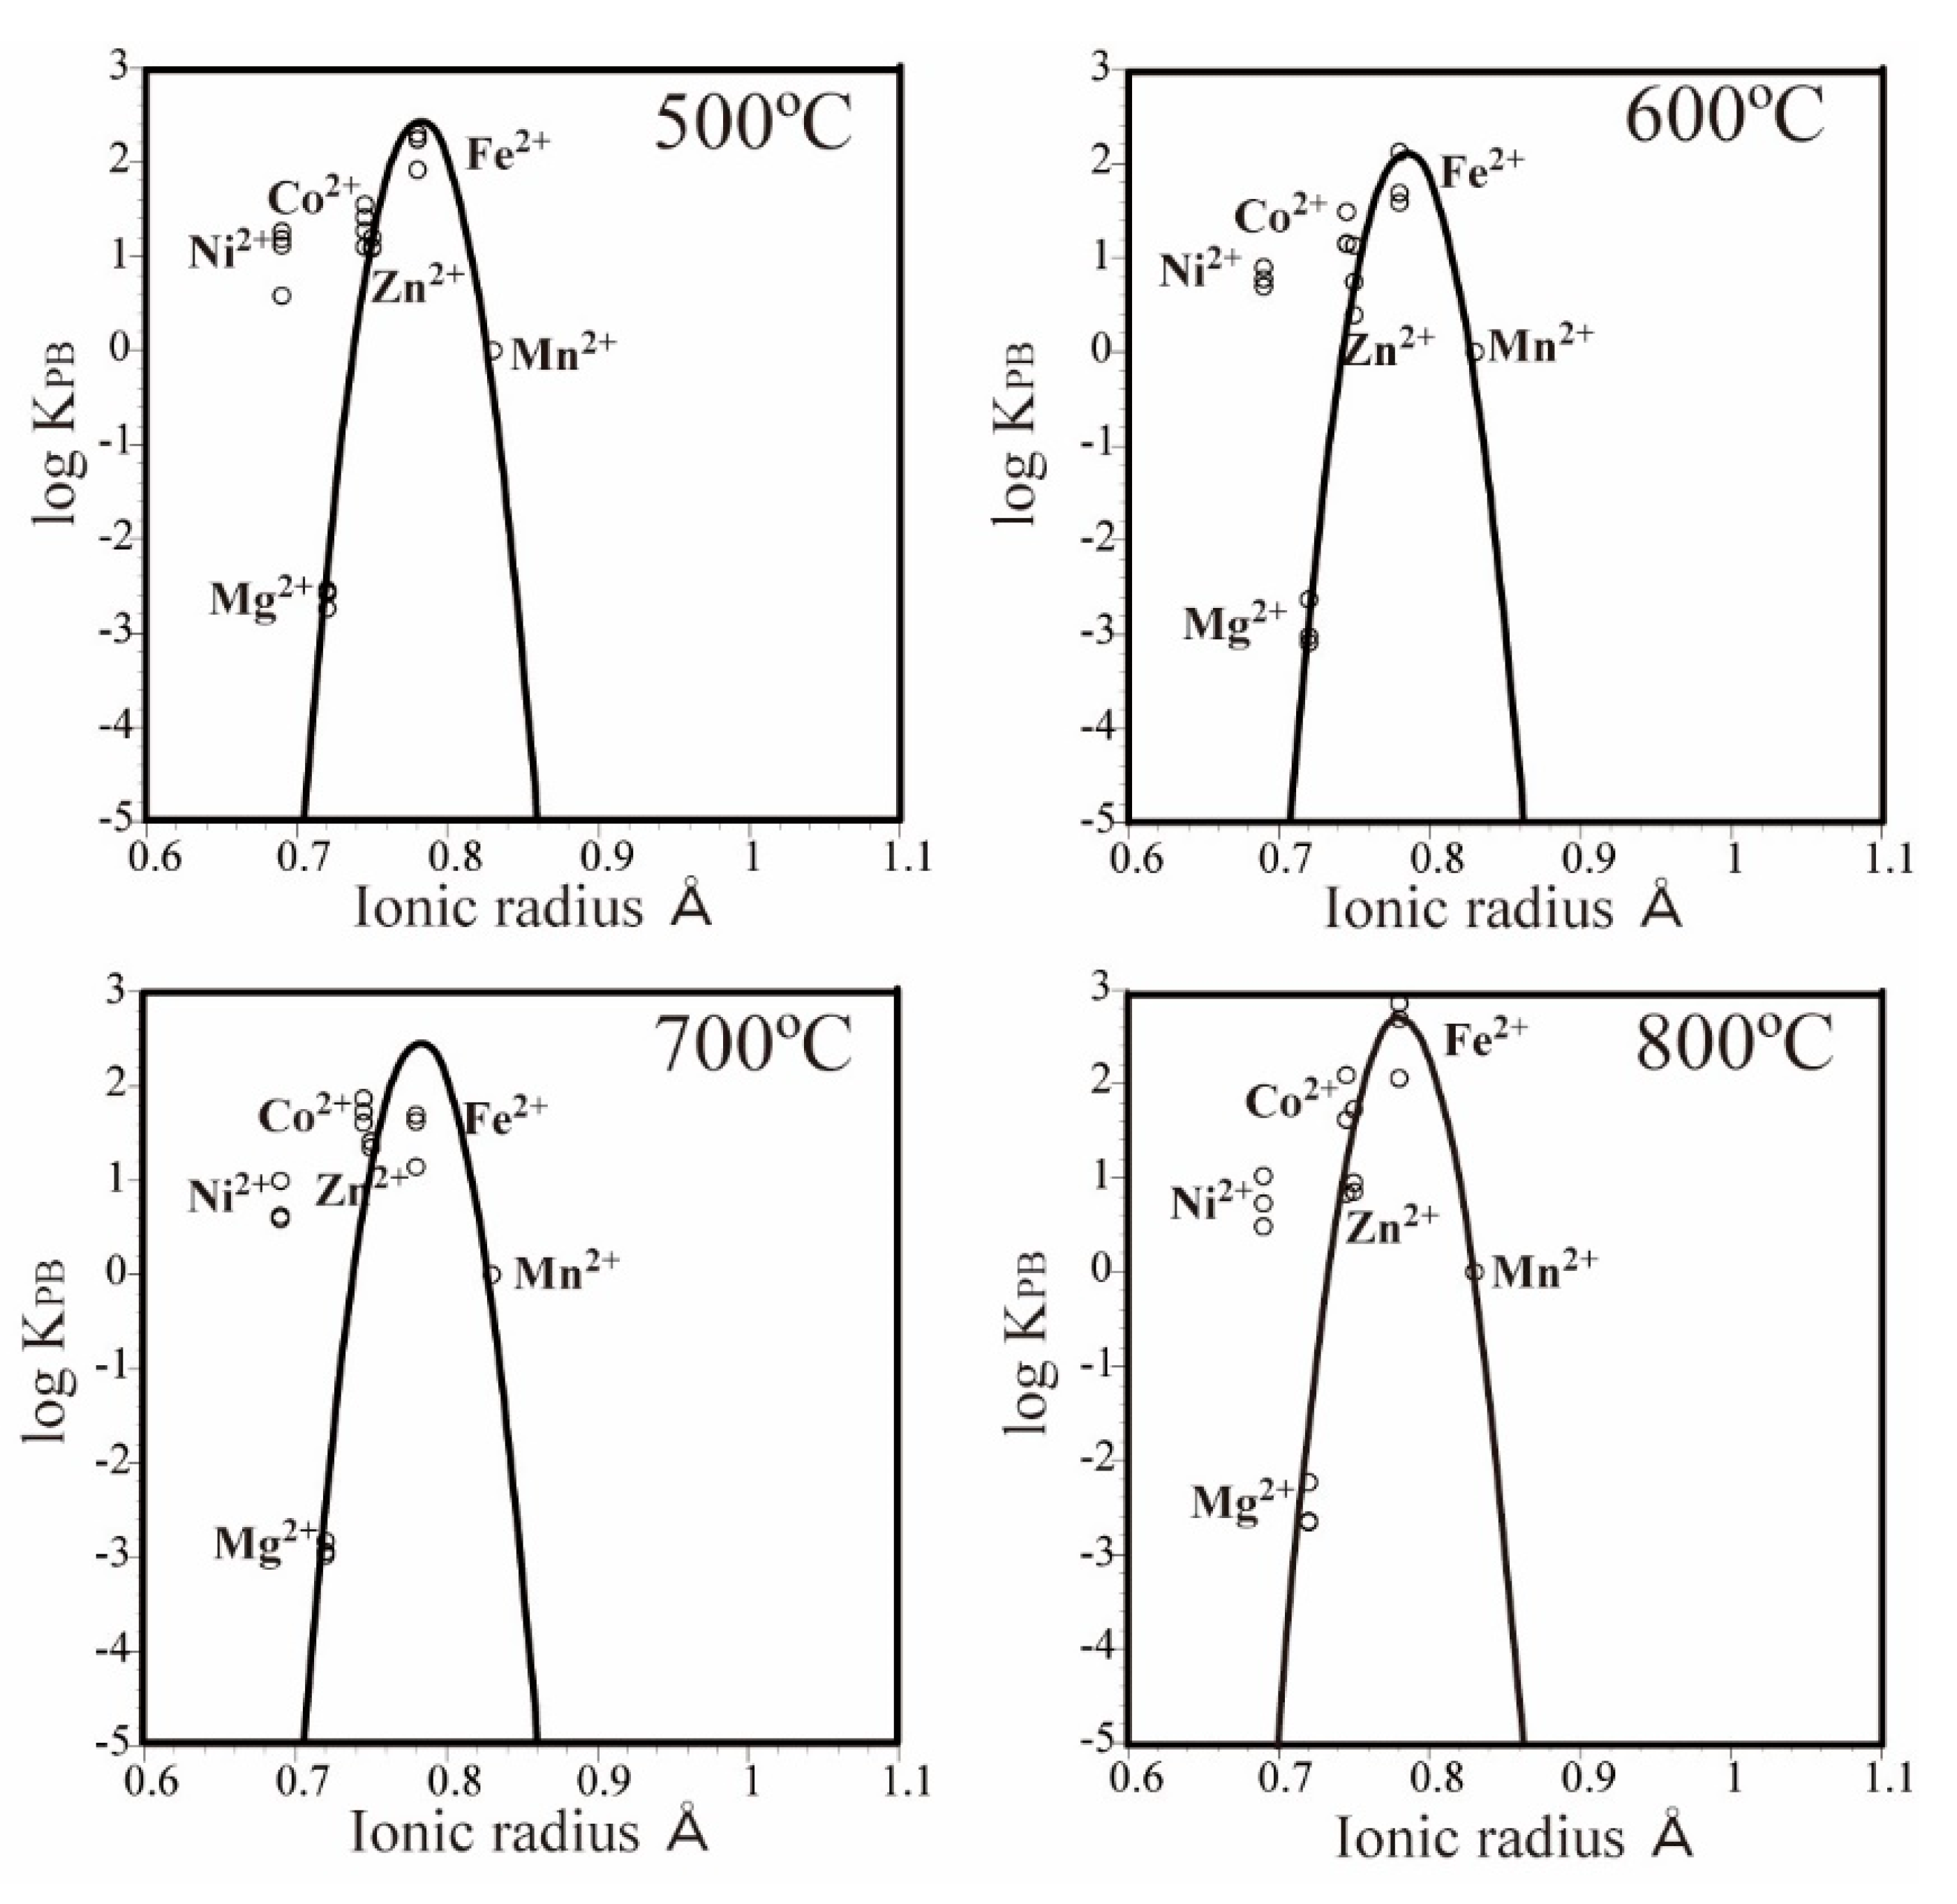
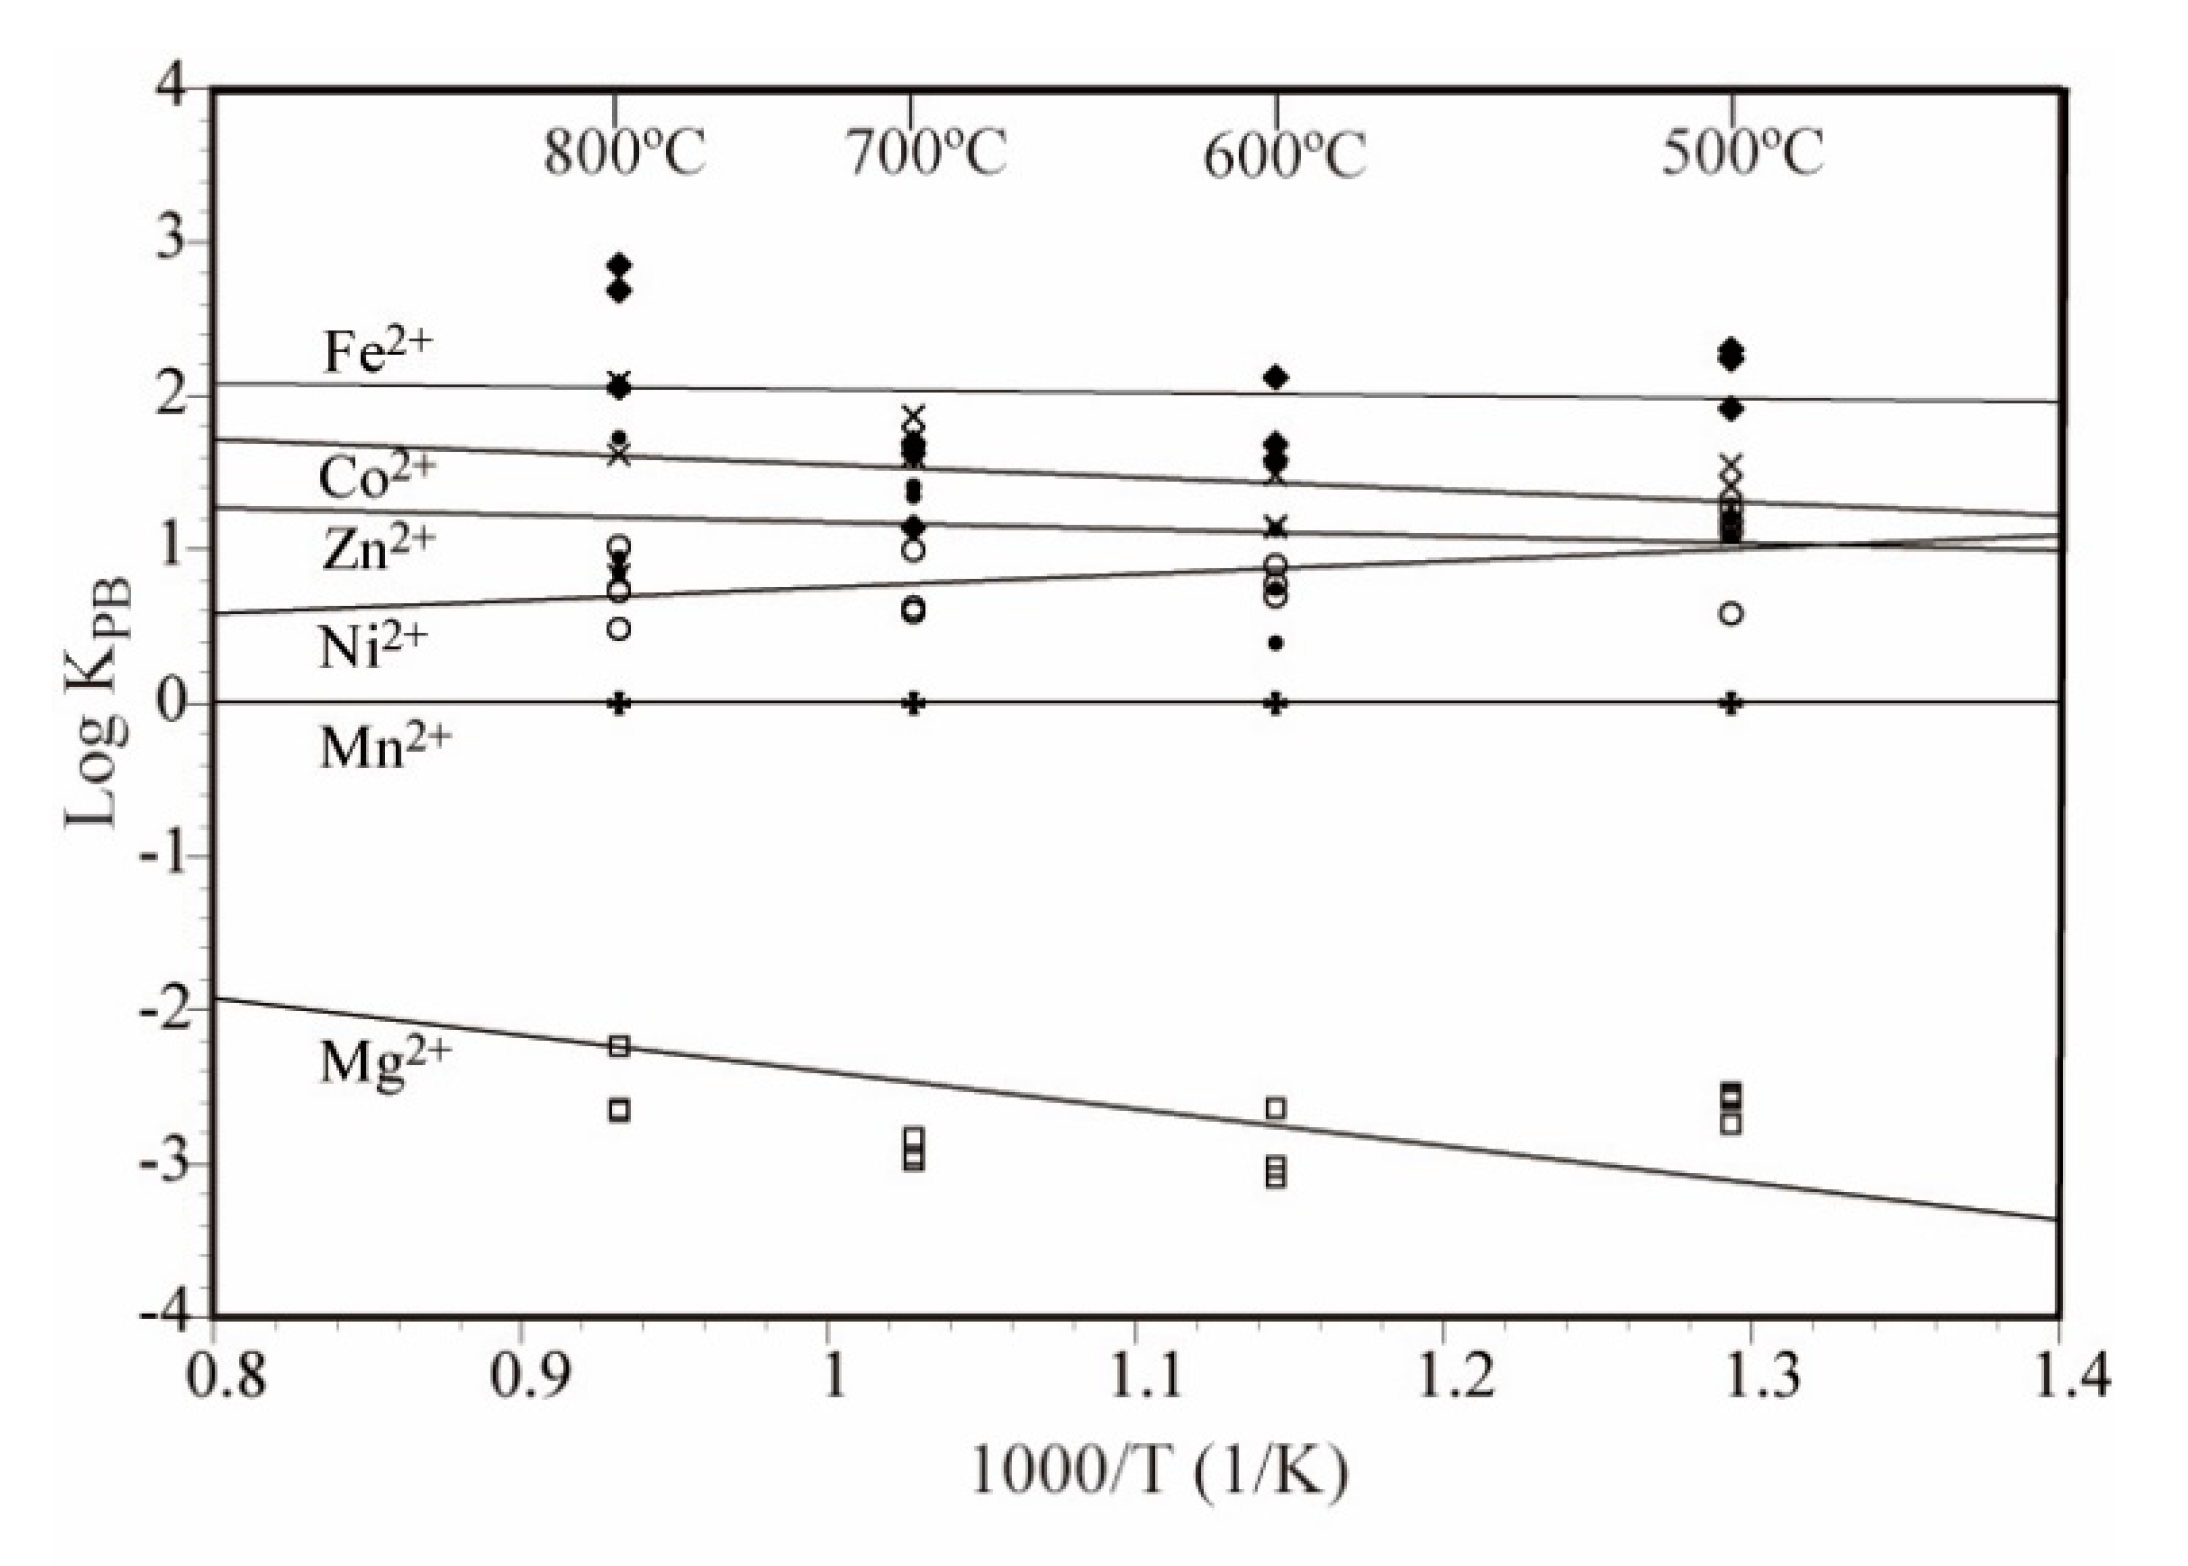
3.3. Partitioning Behavior of the Elements

Although the main divalent metal ion in the mineral alabandite is Mn, the peak of the PC-IR curve was not located at the position of Mn2+ (0.83 Å). Instead, it was located near Fe2+ (0.78 Å), which has a much smaller ionic radius than Mn2+. The same results have been observed for minerals containing Fe as the main divalent metal ion, such as pyrite (FeS2), pyrrhotite (FeS), arsenopyrite (FeAsS) and löllingite (FeAs2), with the peaks of the PC-IR curves located at 0.77 Å between the positions for Co2+ (0.745 Å) and Fe2+ (0.78 Å) (Figure 5). In cobaltite (CoAsS) and safflorite (CoAs2), which mainly contain Co, the peaks of the PC-IR curves are located at 0.76 Å [2,3,4], which is slightly larger than the ionic radius of Co2+ (Figure 5). These results indicate that the major metal ion in a mineral does not always have the optimum ionic radius for that mineral.
Zn shows a negative partitioning anomaly in all the above minerals. This is related to the preference of Zn for tetrahedral coordination, that is, a four-fold coordinated site [14]. Because the divalent metal ions are located at the six-fold coordinated site in the above-mentioned minerals, we considered that Zn2+ exhibited a negative partitioning anomaly, that is, a smaller partition coefficient estimated from the ionic radius. The magnitude of this negative partitioning showed a clear order of sulfide minerals < arsenic sulfide minerals < arsenide minerals (Figure 5). This may be explained by the difference in electronegativity of S and As. The electronegativity of S is 2.58 and that of As is 2.18 [15]. The electronegativities of the divalent metal ions in this experiment ranged from 1.31 to 1.91, and were all lower than the electronegativities of S and As. The covalent bond becomes more dominant than the ionic bond with decreases in the difference in electronegativity. Therefore, we can infer that the negative partitioning anomaly of Zn increases as the covalent bond becomes more dominant. In sulfide minerals such as pyrite, pyrrhotite, and alabandite, the distance from the PC-IR curve to the logarithmic value of the Zn partition coefficient is almost 0–2; in arsenic sulfide minerals such as arsenopyrite and cobaltite, the value is 2–4; and in arsenide minerals such as löllingite and safflorite, the value is 4–5 (Figure 5). Among the sulfide minerals, Zn in alabandite has a relatively small negative partitioning anomaly. This could occur because the electronegativity of Mn (1.55) is lower than that of Co (1.88) and Fe (1.83), which means that the contribution of covalent bonds will be small.
The PC-IR curve width varies between sulfide minerals, arsenic sulfide minerals, and arsenide minerals. The width of the PC-IR curve at the point where the partition coefficient decreases by five digits from the peak is approximately 0.12–0.14 Å for sulfide minerals, 0.10–0.12 Å for arsenic sulfide minerals, and 0.10 Å for arsenide minerals (Figure 5). This indicates that the width of the PC-IR curve increases as the ionic bond strength increases. Under the same conditions, the widths of PC-IR curves at 600 °C and 100 MPa are 0.22 Å for magnetite [16] and 0.29 Å for ilmenite [17] (Figure 5), which are thought to have predominantly ionic bonds.
In sulfide minerals, arsenic sulfide minerals, arsenide minerals, and multiple oxide minerals, Ni exhibits a positive partitioning anomaly (Figure 5). According to Matsui [18], Ni tends to form octahedral coordination bonds. Therefore, a preference for six-fold coordinated sites is thought to cause the positive partitioning anomaly of Ni2+. This is explained by crystal field theory [19]. Because the positive partitioning anomaly of Ni is smaller in sulfide minerals, arsenic sulfide minerals, and arsenide minerals than in multiple oxide minerals, it appears that the ionic and covalent properties are related to the magnitude of the positive partitioning anomaly of Ni. In other words, the more dominant the ionic bond is, the larger the positive partitioning anomaly of Ni.

4. Conclusions

Simultaneous partitioning experiments of divalent metal ions between alabandite and an aqueous chloride solution were carried out under supercritical hydrothermal conditions at 500–800 °C and 100 MPa. The divalent metal ions tended to be concentrated in alabandite in the following order: Fe2+ > Co2+ > Ni2+ ≈ Zn2+ > Mn2+ >> Mg2+. The peak of the PC-IR curve was located near the ionic radius of Fe2+ (0.78 Å) and not at the position of the main divalent metal ion (Mn2+, 0.83 Å). Zn2+ showed a small negative partitioning anomaly in alabandite, which increased in the order of sulfide minerals < arsenic sulfide minerals < arsenide minerals. This order suggests that the negative partitioning anomaly of Zn2+ increases as the covalent bond becomes stronger. In alabandite, Ni2+ showed a positive partitioning anomaly, but the magnitude of this was smaller in sulfide minerals, arsenic arsenide minerals and arsenic minerals than in multiple oxide minerals. This suggests that the positive partitioning anomaly of Ni2+ increases as the ionic bond becomes stronger. The width of the PC-IR curve decreased in the order of sulfide minerals > arsenic sulfide minerals > arsenide minerals, which means that the PC-IR curve becomes narrower as the covalent bond becomes stronger.

Author Contributions

Conceptualization, E.U.; Data curation, M.M. and S.O.; Funding acquisition, E.U.; Investigation, E.U., M.M. and S.O.; Methodology, E.U.; Project administration, E.U.; Supervision, E.U.; Visualization, E.U., M.M. and S.O.; Writing—original draft, E.U.; Writing—review and editing, E.U. All authors have read and agreed to the published version of the manuscript.

Funding

This research was supported in part by the Japan Society for the Promotion of Science (JSPS) KAKENHI (Grant Nos. JP16K06931 and JP19K05356) to E.U.

Acknowledgments

The authors are grateful to two anonymous reviewers for their valuable comments to improve the quality of the manuscript. We thank Edanz Group for editing the English text of a draft of this manuscript.

Conflicts of Interest

The authors declare no conflict of interest.

References

  1. Roedder, E. Fluid inclusions. Reviews in Mineralogy. Mineral. Soc. Amer. 1984, 12, 644. [Google Scholar]
  2. Uchida, E.; Hata, Y.; Uemura, H. Experiments on the simultaneous partitioning of divalent cations between pyrite or pyrrhotite and 2M aqueous chloride solution under supercritical conditions. Jpn. Mag. Miner. Petrol. Sci. 2017, 46, 124–134. (In Japanese) [Google Scholar]
  3. Uchida, E.; Izumi, Y.; Watanabe, H. Experiments on the simultaneous partitioning of divalent cations between arsenopyrite or cobaltite and hydrothermal chloride solution under supercritical conditions. Jpn. Mag. Miner. Petrol. Sci. 2019, 48, 103–112. (In Japanese) [Google Scholar] [CrossRef]
  4. Uchida, E.; Sugino, Y.; Yokoyama, H. Experimental investigation of the simultaneous partitioning of divalent cations between löllingite or safflorite and 2 mol/L aqueous chloride solutions under supercritical conditions. J. Miner. Petrol. Sci. 2020, 115. [Google Scholar] [CrossRef]
  5. Gaines, R.V.; Skinner, H.C.W.; Foord, E.E.; Mason, B.; Rosenzweig, A.R. Dana’s New Mineralogy, 8th ed.; John Willey & Sons, Inc.: New York, NY, USA, 1997; 1819p. [Google Scholar]
  6. Staffansson, L.I. On the Mn-MnS phase diagram. Met. Trans. B 1976, 7, 131–134. [Google Scholar] [CrossRef]
  7. Mann, G.S.; Vlack, L.H. FeS-MnS phase relationships in the presence of excess iron. Met. Trans. B 1976, 7, 469–475. [Google Scholar] [CrossRef]
  8. Uchida, E.; Tsutsui, K. Cation Leaching from the basalt JB-1a by 2M NaCl hydrothermal solutions. Resour. Geol. 2000, 50, 93–102. [Google Scholar] [CrossRef]
  9. Uchida, E.; Goryozono, Y.; Naito, M. Aqueous speciation of magnesium, strontium, nickel and cobalt chlorides in hydrothermal solutions at 600 °C and 1 kbar. Geochem. J. 1996, 30, 99–109. [Google Scholar] [CrossRef] [Green Version]
  10. Onuma, N.; Higuchi, H.; Wakita, H.; Nagasawa, H. Trace element partition between pyroxenes and the host lava. Earth Planet. Sci. Lett. 1968, 5, 47–51. [Google Scholar] [CrossRef]
  11. Shannon, R.D.; Prewitt, C.T. Revised values of effective ionic radii. Acta Crystal. 1970, 26, 1046–1048. [Google Scholar] [CrossRef]
  12. Blundy, J.; Wood, B. Prediction of crystal-melt partition coefficients from elastic moduli. Nature 1994, 372, 452–454. [Google Scholar] [CrossRef]
  13. Blundy, J.; Wood, B. Partitioning of trace elements between crystals and melts. Earth Planet. Sci. Lett. 2003, 210, 383–397. [Google Scholar] [CrossRef]
  14. Matsui, Y.; Onuma, N.; Nagasawa, H.; Higuchi, H.; Banno, S. Crystal structure control in trace element partitioning between crystal and magma. Bull. Soc. Franç. Minéral. Cristal. 1977, 100, 315–324. [Google Scholar]
  15. Pauling, L. The Nature of the Chemical Bond; Cornell University Press: New York, NY, USA, 1960; 644p. [Google Scholar]
  16. Uchida, E.; Takahashi, C.; Ohta, N. Experiments on the simultaneous partitioning of divalent metal ions between spinel group minerals (spinel and magnetite) and 2M aqueous chloride solutions under supercritical conditions. Jpn. Mag. Mineral. Petrol. Sci. 2004, 33, 1–11. (In Japanese) [Google Scholar]
  17. Uchida, E.; Tokuda, Y.; Sakamori, T. Experiments on the element distribution between ilmenite and aqueous chloride solution under supercritical conditions. J. Miner. Petrol. Econ. Geol. 2000, 95, 12–22. (In Japanese) [Google Scholar] [CrossRef] [Green Version]
  18. Matsui, Y. Behavior of Elements in Igneous Activity. In Earth Sciences 4, Material Science of the Earth III; Matsui, Y., Banno, S., Eds.; Iwanami Shoten: Tokyo, Japan, 1979; pp. 165–189. (In Japanese) [Google Scholar]
  19. Burns, R.G. Mineralogical Applications of Crystal Theory; Cambridge University Press: London, UK, 1970; 224p. [Google Scholar]
Figure 1. Powder X-ray diffraction patterns of the starting material (MnS) and synthesized minerals. (a) MnS, (b) alabandite synthesized at 500 °C and 100 MPa (run no. 510), and (c) alabandite synthesized at 800 °C and 100 MPa (run no. 813).
Minerals 10 00696 g001
Figure 2. SEM images of the starting material (MnS) and synthesized minerals. (a) MnS, (b) alabandite synthesized at 500 °C and 100 MPa (run no. 510), and (c) alabandite synthesized at 800 °C and 100 MPa (run no. 813).
Minerals 10 00696 g002
Figure 3. Partition coefficient-ionic radius (PC-IR) diagrams for the MnS–(Ni, Mg, Co, Zn, Fe)Cl2–H2O system. The PC-IR curves were drawn using a least squares method and assuming that Mg2+, Co2+, Fe2+, and Mn2+ will show partitioning behavior according to their ionic radii.
Minerals 10 00696 g003
Figure 4. Temperature dependence of the partition coefficient KPB in the MnS–(Ni, Mg, Co, Zn, Fe)Cl2–H2O system. The temperature dependence lines in the figure were obtained using a least squares method.
Minerals 10 00696 g004
Figure 5. PC-IR diagrams at 600 °C and 100 MPa for pyrite [2], pyrrhotite [2], alabandite [this study], arsenopyrite [3], cobaltite [3], löllingite [4], safflorite [4], magnetite [16], and ilmenite [17].
Minerals 10 00696 g005
Table 1. Experimental conditions in the MnS–(Ni, Mg, Co, Zn, Fe)Cl2–H2O system.
Run No.DurationTemperaturePressureSolidFluid
Days(°C)(kb)(mg)(μL)
5101450013025 2
51114500131.325 2
51214500131.625 2
51314500129.925 2
6107600129.820 1
6027600130.320 1
6047600129.720 1
7095600129.820 1
7105700130.320 1
7135700129.920 1
8063800130.320 1
8083800130.320 1
8123800131.120 2
1 MgCl2:FeCl2:CoCl2:NiCl2:ZnCl2 = 10:1:1:1:1, 2 MgCl2:FeCl2:CoCl2:NiCl2:ZnCl2 = 5:1:1:1:1.
Table 2. Experimental results for the MnS–(Ni, Mg, Co, Zn, Fe)Cl2–H2O system at 500–800 °C and 100 MPa.
T (°C), P (kb)Run No.*MgMnFeCoNiZn
500 °C, 1 kb510Alanbandite0.00140.97750.01550.00390.00250.0013
Fluid (Metotal)0.444090.555270.000040.000170.000370.00005
Fluid (MeCl2aq)0.272430.404230.000030.000140.003500.00004
log KPB−2.74700.00002.34271.11500.58411.1694
log KPN−2.67260.00002.32971.0614−0.52961.1284
511Alanbandite0.00190.97120.01480.00700.00650.0019
Fluid (Metotal)0.405610.593760.000050.000230.000260.00009
Fluid (MeCl2aq)0.239550.445780.000040.000190.000250.00007
log KPB−2.54310.00002.25761.26971.18421.1108
log KPN−2.43880.00002.23001.22821.07681.0955
512Alanbandite0.00190.96620.01550.00830.00730.0021
Fluid (Metotal)0.418850.580590.000050.000190.000240.00008
Fluid (MeCl2aq)0.250670.431350.000040.000160.000230.00007
log KPB−2.56450.00002.27021.41911.26191.1979
log KPN−2.47060.00002.23801.36471.15141.1269
513Alanbandite0.00160.96650.01580.00820.00830.0005
Fluid (Metotal)0.382570.616720.000120.000150.000400.00003
Fluid (MeCl2aq)0.220670.471440.000110.000130.000380.00003
log KPB−2.57370.00001.92441.54261.12191.0267
log KPN−2.45140.00001.84551.48811.02750.9101
600 °C, 1 kb601Alanbandite0.00130.97310.01080.00660.00660.0016
Fluid (Metotal)0.611770.387230.000110.000190.000440.00025
Fluid (MeCl2aq)0.503210.281060.000100.000150.000420.00020
log KPB−3.07280.00001.59181.14060.77590.4060
log KPN−3.12720.00001.49411.10410.65690.3637
602Alanbandite0.00140.97350.01170.00610.00610.0011
Fluid (Metotal)0.603300.395850.000100.000170.000500.00008
Fluid (MeCl2aq)0.493840.288710.000090.000140.000470.00006
log KPB−3.02520.00001.67741.16410.69560.7475
log KPN−3.07530.00001.58611.11130.58540.7354
604Alanbandite0.00330.97130.01200.00640.00510.0019
Fluid (Metotal)0.589700.409850.000040.000090.000280.00006
Fluid (MeCl2aq)0.478900.301260.000040.000070.000260.00005
log KPB−2.62680.00002.10241.47720.88571.1259
log KPN−2.67010.00001.96871.45270.78421.0714
700 °C, 1 kb709Alanbandite0.00170.97980.00870.00390.00260.0033
Fluid (Metotal)0.599270.400450.000070.000060.000110.00004
Fluid (MeCl2aq)0.560460.361150.000070.000060.000110.00004
log KPB−2.93580.00001.70581.42430.98501.5279
log KPN−2.95150.00001.66101.37950.94011.4830
710Alanbandite0.00200.97500.01040.00600.00380.0029
Fluid (Metotal)0.582300.416850.000320.000110.000380.00004
Fluid (MeCl2aq)0.542260.377000.000310.000100.000370.00004
log KPB−2.83310.00001.14291.36770.63101.4913
log KPN−2.84580.00001.11301.36550.59891.4477
713Alanbandite0.00150.97750.01100.00610.00230.0017
Fluid (Metotal)0.598070.401460.000110.000100.000240.00002
Fluid (MeCl2)0.558630.362190.000110.000090.000240.00002
log KPB−2.98710.00001.61351.39890.59501.5429
log KPN−3.00220.00001.56881.39990.55031.4982
800 °C, 1 kb806Alanbandite0.01200.88130.04740.02300.01340.0228
Fluid (Metotal)0.698460.300740.000020.000190.000440.00015
Fluid (MeCl2aq)0.685070.287340.000020.000180.000440.00015
log KPB−2.23190.00002.90781.61601.01671.7149
log KPN−2.24330.00002.88801.61970.99691.6951
808Alanbandite0.00460.90590.04930.02030.00890.0109
Fluid (Metotal)0.691910.306600.000030.000060.000980.00042
Fluid (MeCl2aq)0.678360.293080.000030.000060.000970.00041
log KPB−2.64780.00002.74522.05880.48770.9437
log KPN−2.65880.00002.72562.03930.47250.9345
812Alanbandite0.00380.88660.08480.01090.00370.0101
Fluid (Metotal)0.615760.383010.000320.000360.000300.00026
Fluid (MeCl2aq)0.600450.367740.000320.000350.000300.00025
log KPB−2.57410.00002.05871.11660.72661.2248
log KPN−2.58090.00002.04111.11120.70891.2242
* Mole fractions of cations in alabandite and the aqueous chloride solution (fluid), and partition coefficients for log KPB and log KPN.

