1. Introduction
Mica is a plate-like structured and complex hydroaluminum silicate mineral with unique physical and chemical properties. It has widespread industrial applications due to its physical properties such as color, density, particle shape, size, layered structure and reflection index [
1,
2]. Muscovite mica (ideally (KAl
2(AlSi
3O
10)·(OH)
2)) has also a plate-like mineral crystalline structure formed in layers. These layers can be split or delaminated into large thin sheets. These sheets are chemically inert, flexible, elastic, reflective and are transparent to opaque [
3].
Although mica has a naturally layered structure, it does not allow water molecules to penetrate into its structure in aqueous environments as a result of factors includes high charge density between the layers, insufficient hydration energy of the interlayer potassium ions to overcome the cooperative structural forces at the coherent edges of a cleavage surface and strong bonding force between layers [
4]. In order to make the muscovite mineral swellable in an aqueous environment, (K
+) ions between the layers of natural mica should be reduced and natural mica should be converted to Na
+ mica in turn reducing the bonding force between the layers in a controlled process [
5,
6,
7]. This requires the intercalation and/or delamination of functional molecules into the mica mineral interlayers for the purpose of using mica mineral-based nanocomposite products in many industrial applications.
Despite the nonswellable layered structural property of natural mica, the reasons why it is increasingly preferred over swellable layered structures in industrial product development are due to its uniform wide horizontal length, high thermal and mechanical stability, and higher acidity (acid site) as a result of displacements in the crystal structure.
Naturally occurring micas do not exhibit wetting ability in water, however some synthetic fluorine micas can swell with water [
8]. However, synthetic mica is quite expensive. For this reason, it is very important to turn natural mica into suitable raw material for various industrial applications [
5,
9,
10,
11,
12,
13].
Recently, metal-oxide coatings on the substrate material, also called the substrate-based inorganic pigment, have attracted great attention and due to a wide range of applications in the optical filters, cosmetics, plastics and paint industries. Metal-oxide must be perfectly and uniformly coated on the mica surface to obtain a highly pearlescent pigment for use in substrate-based inorganic pigment [
14,
15,
16,
17,
18,
19]. Mica-TiO
2 coating is most widely used to obtain the pearlescent pigment applications. However, the thickness of the mica used for this purpose must be much thinner, its surfaces must be quite horizontal and very smooth in form (it must be sufficiently thin without sacrificing the surface properties) [
20].
In the use of mica for the mineral-based nanocomposite materials and for the substrate-based inorganic pigments, it is necessary to obtain fine particle sizes desired by applying a high energy-intensive grinding process. In the case of layered minerals such as muscovite, two processes are possible when the mineral is ground: delamination by cleavage of the crystal leading to new basal surfaces, and comminution perpendicular to the cleavage planes giving rise to new lateral surfaces. However, it is well known that grinding of layered silicates such as mica produces not only particle size reduction but also various effects on structure and properties of laminar silicates such as amorphization, aggregation or modification of the surface properties that are generally undesirable for most applications of mica [
1]. Because mica minerals are extremely fragile and sensitive to mechanical processing, even weak shear forces affect crystallinity and produce irregular-shaped particles. Additionally, depending on the grain size of mica mineral, the ratio between diameter and thickness is of great importance in preserving the plate-like structure.
In reducing the grain size of layered silicates, micron and submicron-sized particles are desired thereby retaining the plate-like shape and the crystalline structure of the material. However, due to the structural configuration in materials such as mica, while the friction forces and impact reduce the grain size during fine grinding, it can destroy mica plates or change aspect ratios. Due to these specific conditions, novel grinders should be used for grinding mica. This results in the production of high-cost end products in the grinding process of muscovite minerals. For this reason, it requires cheaper and easier methods to bring the mica mineral to nanoscale [
21]. Especially for pigment applications, the need for reducing the mica to nanoscale in the lateral direction increases the importance of the grinding process. It has been suggested in many studies that sonication is a useful method for mica delamination in the grinding of laminar silicates [
21,
22]. Sonication is a very successful method for obtaining nanosized particles with the effect of delamination in swellable type layered silica structures [
22]. By applying this method to mica minerals, it is possible to obtain nanomica in the form of nanosized flakes without deforming the surface by delamination with sonication [
1,
23,
24,
25,
26,
27,
28,
29].
For industrial applications, it is often necessary to reduce the size of mica to nanoscale laterally. The sonication process is very successful for obtaining nanoparticles in the swellable type layered silica structures with the delamination effect. Since the natural mica mineral, which is a nonswellable layered structure, is difficult to delaminate, it must be obtained as nanodimensional flakes by delamination with sonication which reduces the lateral thickness without deformation of the surface.
The aspect ratio characterization of mica morphology is the key factor for nanocomposite and coating applications of this mineral. Aspect ratio being as high as possible is also a feature that indicates fine grain structure and surface smoothness in layered structures. In grinding such structures, it is necessary to use methods that will keep the aspect ratio at high values. For this purpose, it is mandatory to use energy-efficient grinding methods in the grinding process of muscovite.
For this reason, in this study, ion exchange + intercalation/sonication has been proposed as a new energy-efficient method that enables a high aspect ratio. The present method yields high aspect ratios that have not been achieved before. This is an important step for pearlescent pigment applications where fine grain structure is required for efficient coating. To achieve this goal, for the first time in this present study, before the sonication process, the layer charge density of the natural mica mineral was reduced and enhancement in the interlayered spacing with reduced charge density was enabled by surfactant intercalation. Thus, delamination and exfoliation achieved in an easier and more energy-efficient way by the sonication process and mica was reduced to smooth surface nanosized.
In this study, the suitability of the sonication method for reducing natural mica particles to nanosizes without damaging the surface shape properties for pearlescent pigment application with the highest aspect ratio was investigated. To achieve this goal, for the first time in this present study; before the sonication process, the layer charge density of the natural mica mineral was reduced and enhancement in the interlayered spacing of mica interlayers with reduced charge density was enabled by surfactant intercalation. Thus, exfoliation was achieved in an easier and more energy-efficient way by the sonication process and mica was reduced to smooth-surfaced nanosize. It should be noted that this present method also yields smooth surfaces from natural mica. The nanosized mica flake surfaces then were coated with TiO2 particles and pearlescent pigment optical properties were correlated with the aspect ratio (lateral length/thickness) of the nanosized mica flakes.
2. Materials and Methods
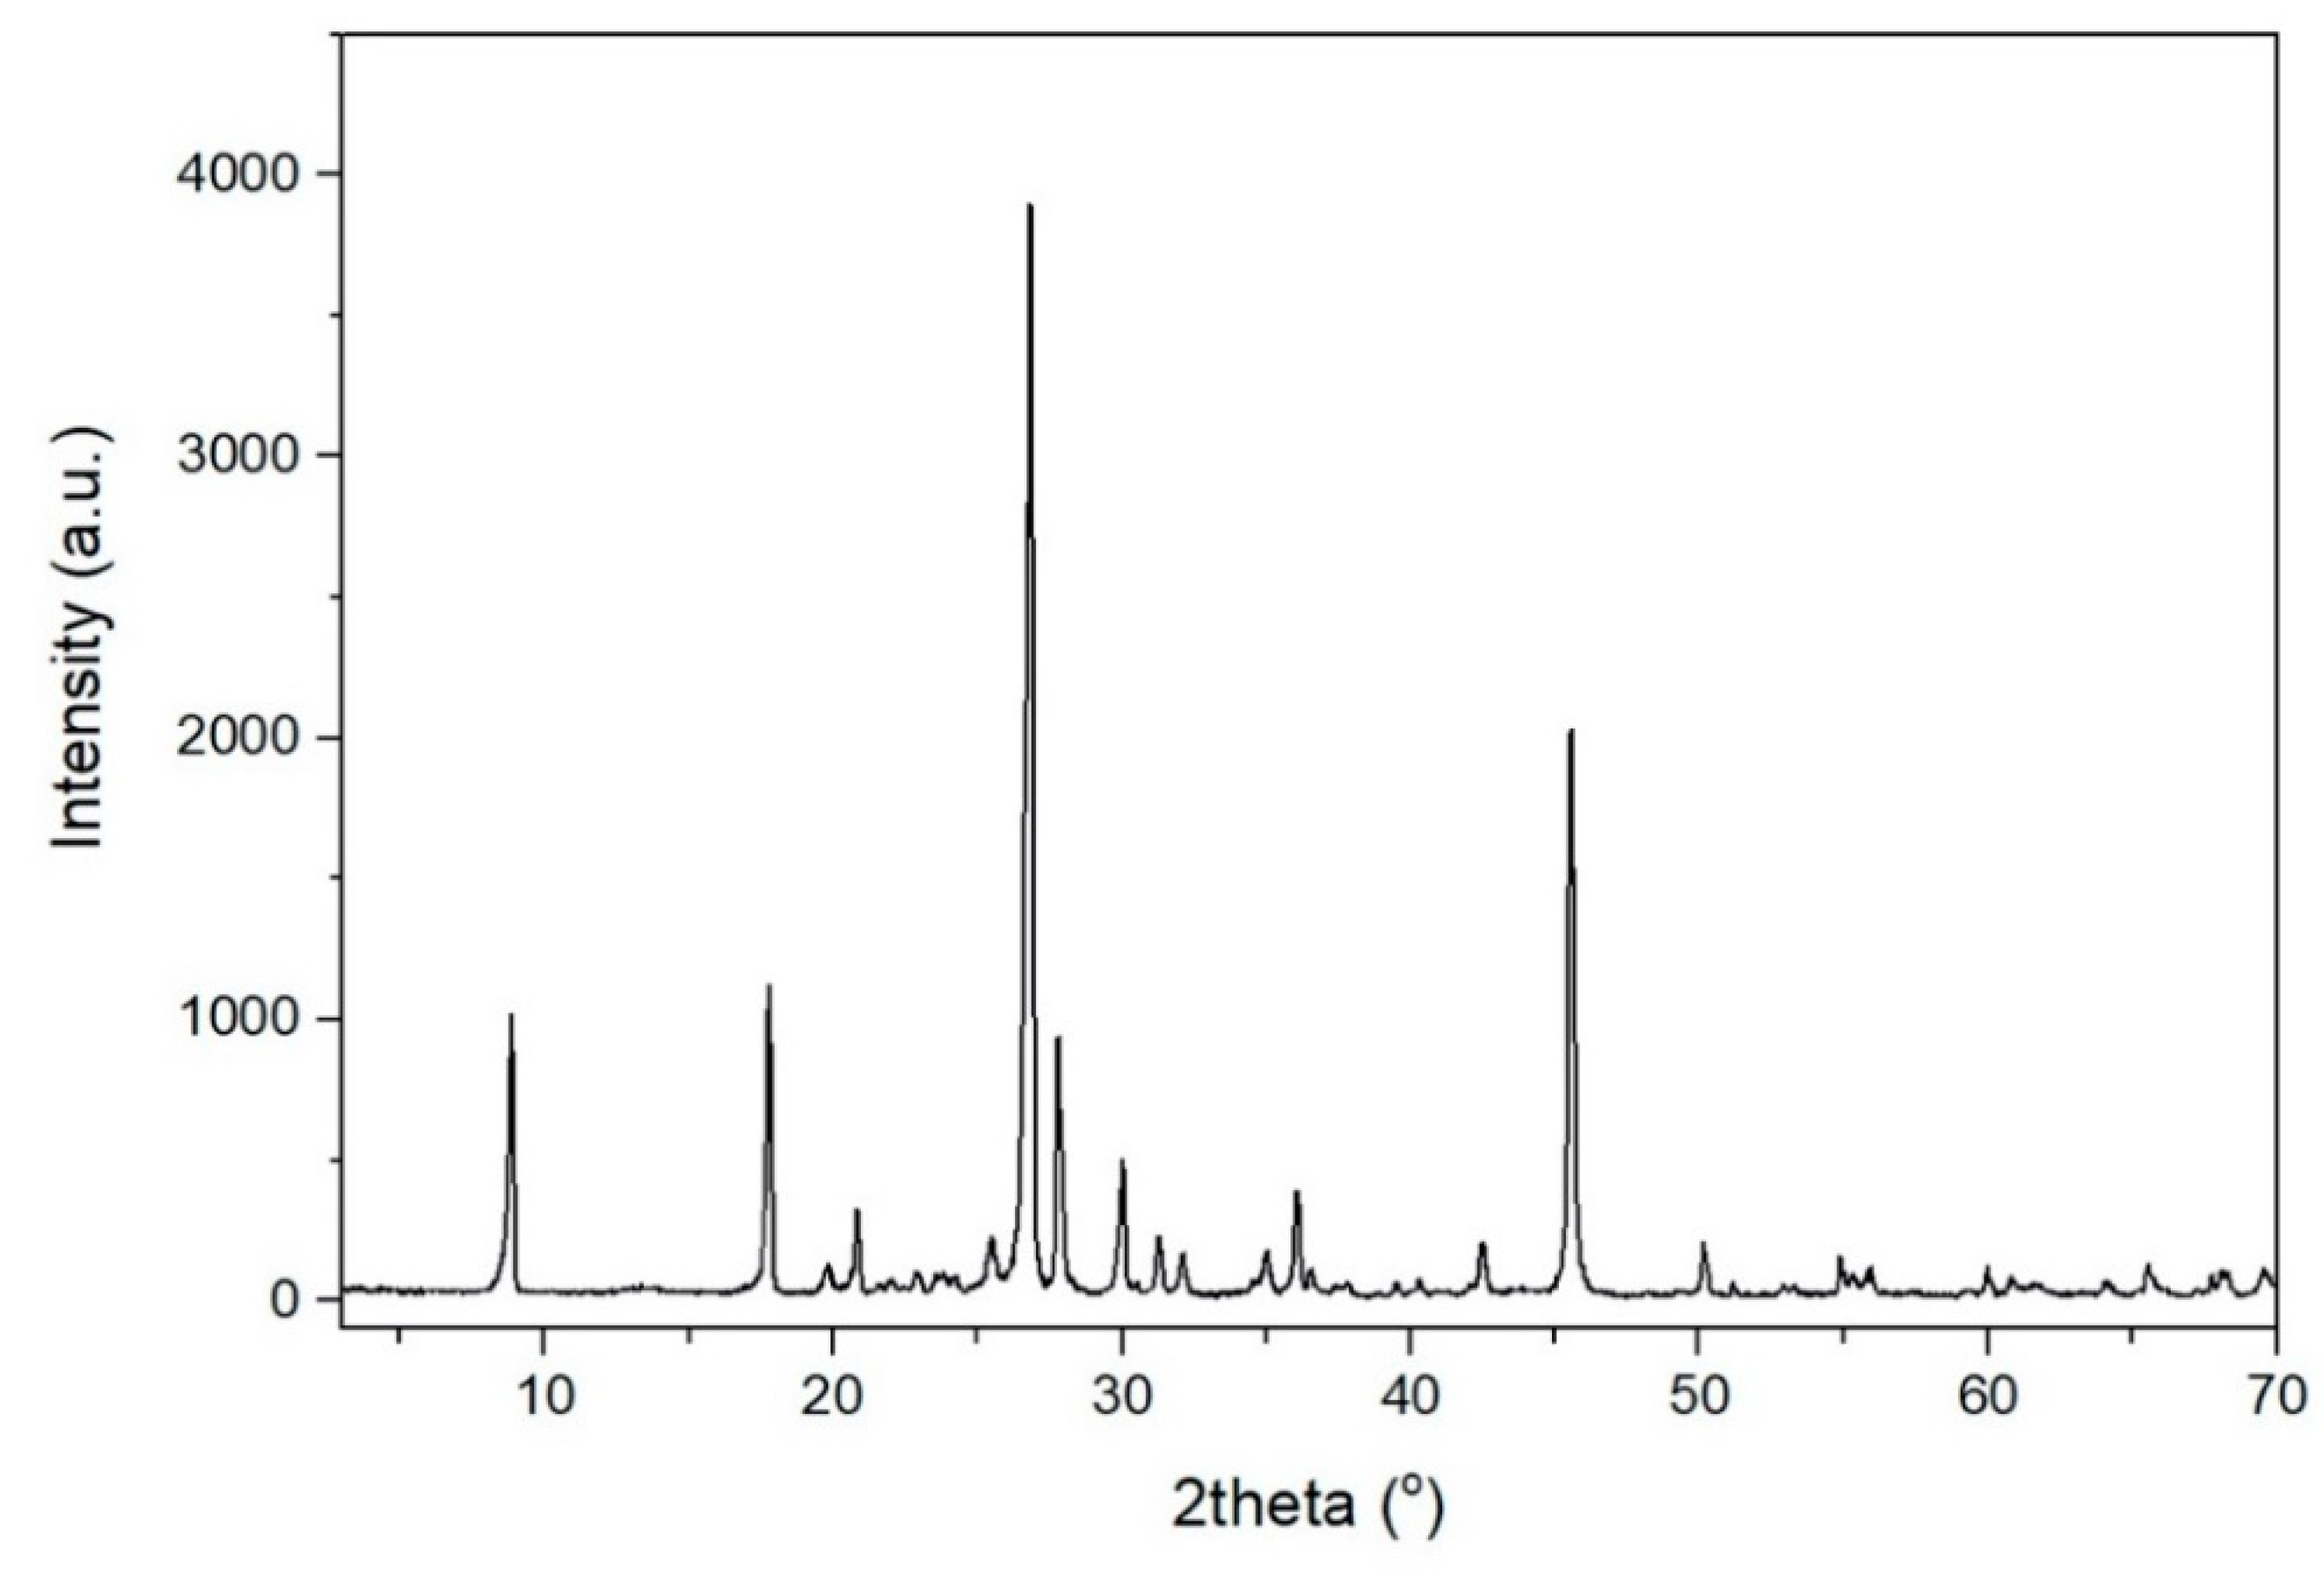
The raw muscovite ore, obtained from the Aydın Cine Turkey region, was used as received from. The chemical composition of muscovite ores used in experiments was determined by the XRF technique and an average of three analyses is summarized in
Table 1. The XRD pattern of the raw muscovite ore is given
Figure 1.
Hexadecylamine (HAD, 97%, Aldrich), dodecyltrimethylammonium (DTA, 97%, Aldrich) and n-hexadecyltrimethylammonium bromide (CTAB, 98%, Alfa-Aesar) were used as the surfactants with various C-lengths in the experiments.
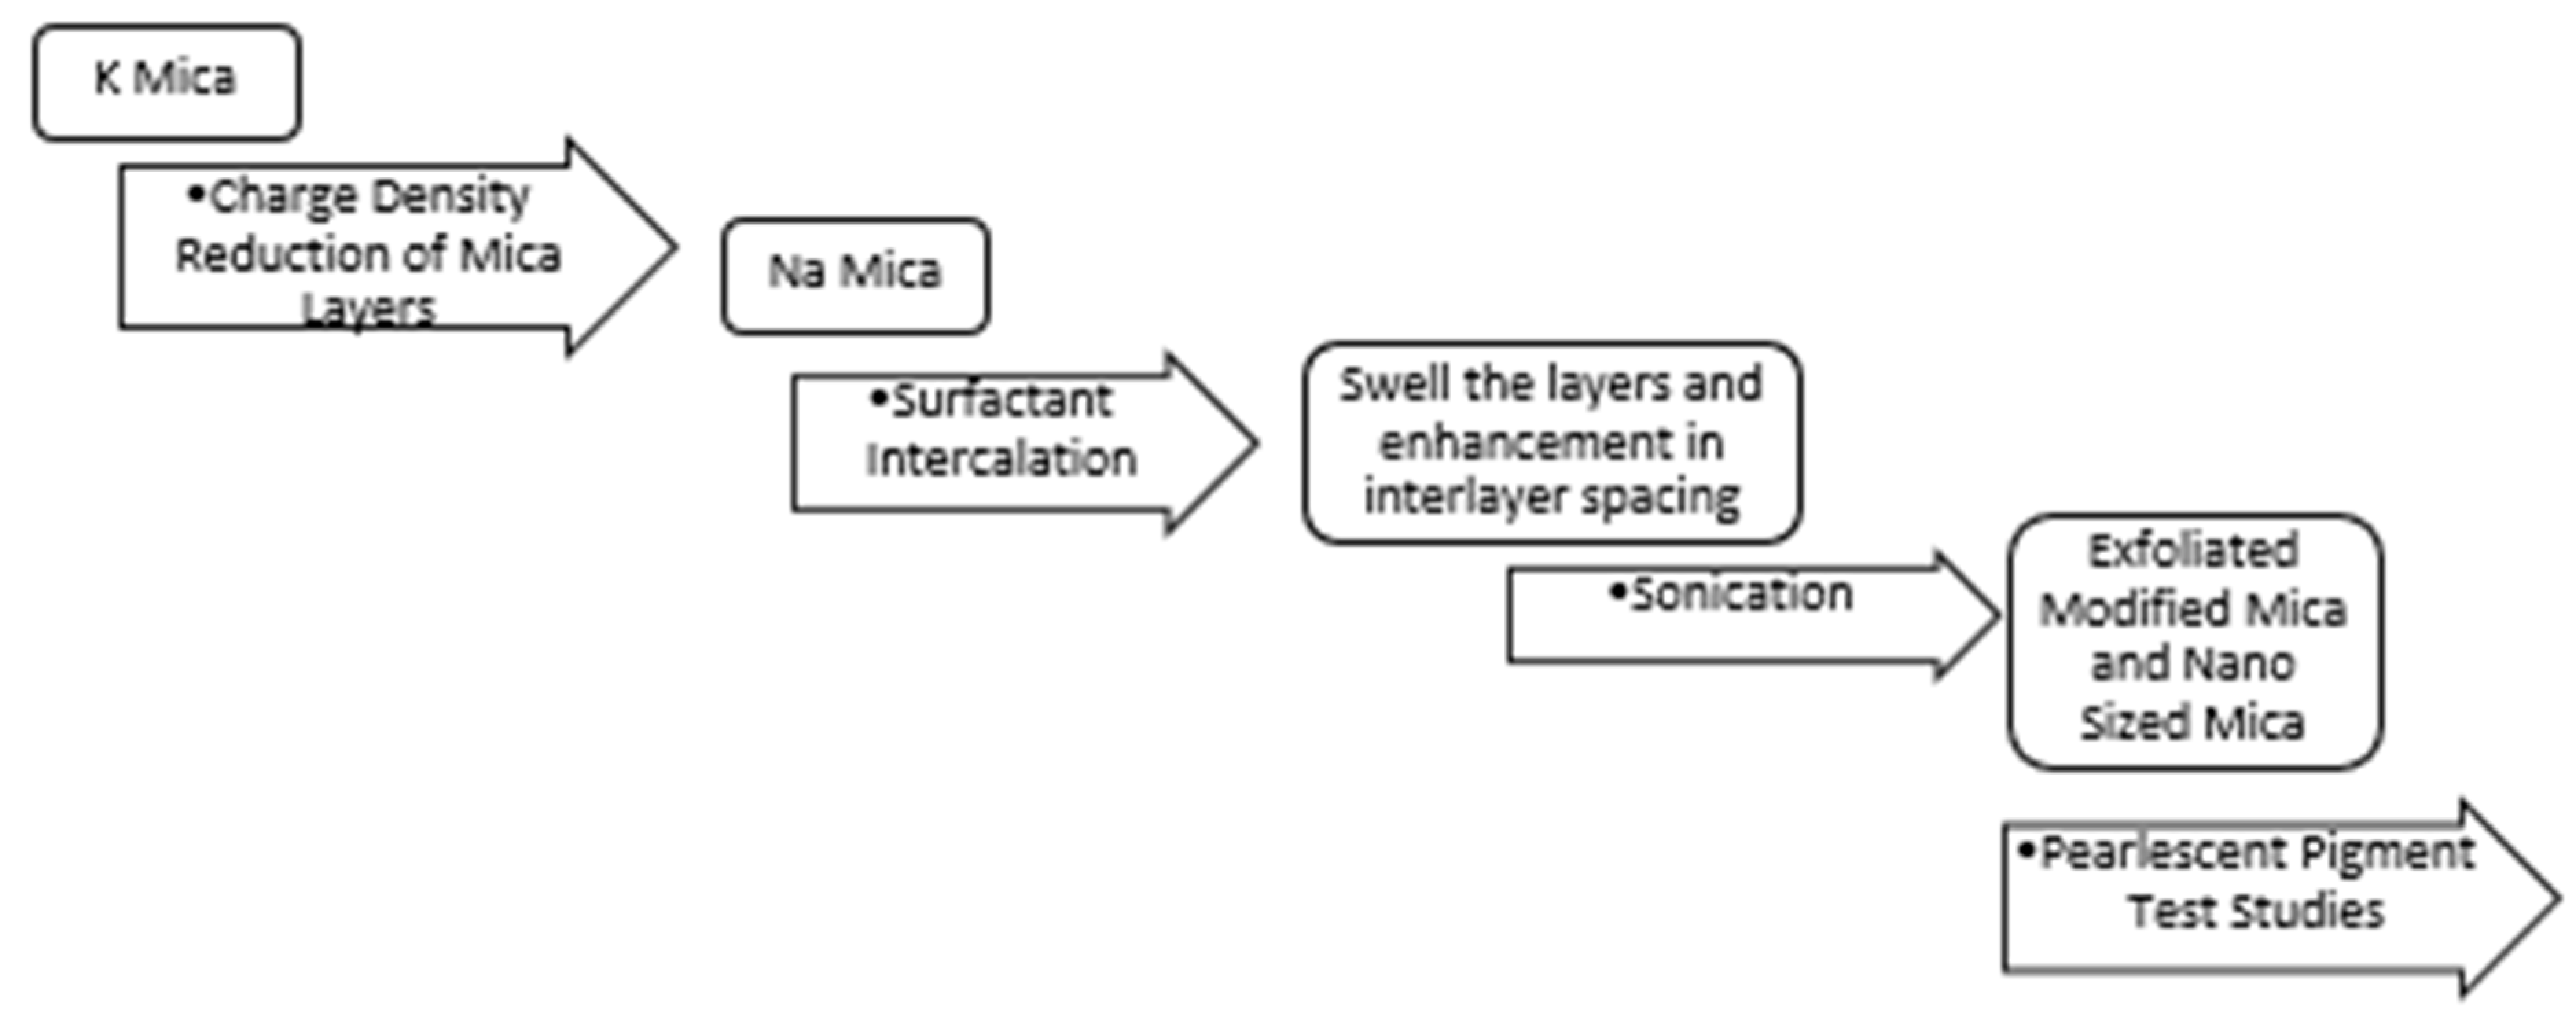
2.1. Preparation of Nanomica
The process steps are summarized in
Figure 2.
2.1.1. Charge Density Reduction of Mica Layers
In order to obtain swellable muscovite by reducing the charge density of mica layers; muscovite ore samples were processed by acids followed by ion exchange of mica interlayers to transform into sodium form from an initial potassium form. The following steps were carried out for this process.
Muscovite mineral samples were first subjected to mixing and leaching with nitric acid (HNO
3) solution at predetermined mole H
+/g mica ratios for 4 h and at 95 °C. Here, acid/solid (mica) ratio (H
+/mica ratio) and acid concentration are examined as input parameters.
Table 2 gives the parameter changes.
The solid obtained by leaching was washed and dried to remove the excess acids. The samples were then calcined at 600 °C for 4 h. With this process, the acidic-treated mica samples were both cleaned from the organics and the charge of interlayers was reduced by leaching of Al+3 ions from the octahedral layer.
The ion exchange was then achieved by mixing calcined samples 4 or 5 times with varying the 1–3 M NaCl solution to replace the potassium ions, which provide strong bonding of the layers, with less charged sodium ions, during the mica charge density reduction phase. In this process, solid concentration was varied as 2.5% and 5% by weight, and the temperature was kept constant at 95 °C. The samples were then washed until free from chlorine and dried.
2.1.2. Surfactant Intercalation
Muscovite mineral samples with reduced charge density, therefore, are expected to facilitate delamination in the following sonication step. Furthermore, at this stage, it was aimed to swell the layers and exfoliate the muscovite interlayers as much as possible by applying surfactant intercalation. For this purpose, surfactants with three different carbon chain numbers were used in order to determine the type of surfactant that gives the best results for intercalation in the mica layers. The surfactants with three different carbon chain lengths were dissolved in 80 mL deionized water, then 0.2 g Na-mica was added, and the mixture was heated to 120 °C. The mixing process was continued for 24 h to facilitate surfactant intercalation.
2.1.3. Sonication Studies
Sonication was carried out for the purpose of enabling mechanical delamination of muscovite samples. The purpose of delamination was to achieve a smooth nanosize mica surface at a low sonic frequency (20 kHz) within the shortest time possible. Prior to sonication, a suspension with 0.5 g·L−1 concentration of muscovite which reduced charge density was used. This suspension was subjected to sonication, operating at 20 kHz frequency and 500 W power. For the sonication process, the suspension was fed to the device in a volume of 140 mL and with a temperature of below 40 °C, and the sonication process varied each time for 1, 3, 5, 7, 9, 12 h. Following the sonication, solid samples were washed with 0.12 M acid to remove the surfactants within the layers and samples were washed with distilled water and dried. After sonication, the changes in particle thickness (c) and lateral dimensions (a) were determined for each condition. It should be noted that especially the aspect ratio (AR), which is the ratio of a and c values, is the most important parameter to explain the effectiveness of the present method. Nanosized mica samples with good size properties were then subjected to the pearlescent pigment test study.
2.1.4. Pearlescent Pigment Test Studies
The film coating of TiO2 was applied to the obtained smooth-surfaced nanosized mica layers and pearlescent pigment optical characterization was determined. For the preparation of mica–TiO2 pigment 10 g of nanosized mica obtained in the previous step was dispersed in distilled water and mixed with dilute hydrochloric acid at a maintained pH value of 1.0 at 70 °C. While mixing the nanosized mica suspension, to enable the TiO2 coating of mica surface, TiCl4 (1.5 mol·L−1) and NaOH (2 mol·L−1) were added at a constant speed of 0.5 mL·min−1 to the suspension with an adjusted TiO2/mica ratio by weight equals to 10. The pH of the suspension mixture was kept constant with the NaOH solution during these additions. After the addition was completed, the suspension was aged for 1 h and then allowed to cool to room temperature.
Since pearlescent pigment extraction is only for testing for the production of nanosized mica, it is not parametrically examined, and test values were taken as in the literature ones. This step has been carried out only to compare the pearlescent pigment compatibility of the developed nanosized mica materials with the values in the literature.
2.2. Characterization Studies
In this study, d-direction expansions (swellings) of developed nanosized mica samples interlayers were determined by X-Ray diffraction analysis. X-ray studies were carried out by using Philips Analytical X-Pert model diffractometer with Cu Kα radiation using Ni filter at 1.54 Å wavelength between 2θ = 2° and 80° with a speed of 0.034°·s−1. The basal plane is calculated at d −001 values.
The changes in the chemical composition of muscovite content were determined by XRF analysis. Analyzes were carried out with 40 mm disks prepared by dilution with lithium borohydride with Spectro IQ II XRF (X-ray fluorescence) device. For all the samples, dilution was done by using 7 g lithium borate hydrate for 1 g of sample (1/7).
Determination of the thickness, dimensions and ratio of the horizontal dimensions to the thickness of the nanosize mica particles obtained by the sonication process were performed by SEM (Scanning Electron Microscopy) analysis. This analysis was carried out with the images obtained via the JEOL HR-TEM 2100 F model device at 200 kV with at least 10 measurements from different parts of the images.
In order to determine the optical properties (pearlescence) of the developed pigment nanocomposites, to detect spectral reflections of all pigment samples CIE (Commission Internationale De L’E ‘clairagexy) optical properties were analyzed. The brightness and CIE L *, a *, b * values of these samples were measured at different angles (15°, 45°, 75°, 110°) by the spectrometer (D65 illuminant). In this analysis, L*, a* and b* parameters were examined. However, as TiO2 gives a white color, within these parameters, as a* determines red-green index and b* determines yellow-blue index values, it was found unnecessary to measure these values.
3. Results and Discussion
In mica charge density reduction followed by ion exchange studies in mica content acid/mica ratio and acid concentration values were analyzed parametrically. Al
2O
3 changes in mica content compared to acid/mica and acid concentration changes are given below in
Table 3.
It is clear from
Table 3 that Al
2O
3% in muscovite (can be either octahedral or tetrahedral Al) was decreased with acid treatment. Furthermore, the Na ion exchange is detected along with XRD d-spacing are also shown in
Table 3.
It is clear from
Table 3 that the displacement of Na
+ ion in interlayers causes a significant increase in Na
+ ion. This is the desired result. As no change was observed in the other ion percentages in the interlayers, those results were not given here. The Na
+ ion was probably increased in percentage by exchanging with the H
+ ion entering the interlayers during the acid treatment.
As a result of expected swelling, d-direction expansions calculated at basal plane d-001 values are also given in
Table 3 using XRD.
It should be noted that for Na
+ = 2M and 3M cases, Na
+ exchange was comparably higher. A similar trend was also valid for d-expansion values. In all Na
+ exchange processes, highest values occur at X
2 (acid/mica) = 0.008. Therefore, this was accepted as the optimum value. Again, for all Na
+ concentration exchanges, C
2 = 0.80 was the optimum value. When the Na
+ exchange and d-expansion values are evaluated together, it is useful to investigate M
X1C2, M
X1C3 and M
X3C2 values. For this reason, within the surfactant intercalation process, M
X2C1, M
X2C2, MX
2C3, M
X1C2, M
X1C3 and M
X3C2 samples in Na
+ 2M exchange were taken into consideration and investigated. d-expansion values of selected samples as a result of intercalation with hexadecylamine (HDA), dodecyltrimethylammonium (DTA), and n-hexadecyltrimethylammonium bromide (CTAB) carbon length surfactants are given in
Table 4.
It is clear from
Table 4 that the d-spacing value of C
16 (length of surfactant (hexadecylamine HDA)) was found to make the best layer expansion. This can be also seen in the change of intensities in XRD data as shown in
Figure 3. However, since the results are close to each other, it can be concluded that all three lengths of surfactant intercalations are successful. For this reason, the surfactant with C
16 length was considered to be appropriate for sonification. All the samples except the M
X1C2 sample were selected for evaluation as the M
X1C2 sample has the lowest d-expansion than others.
Sonication results of mica samples with reduced charge density and swelling property, evaluated according to particle thickness by time (
c), particle lateral length (
a) and particle dimension change, and results are given in
Table 5,
Table 6,
Table 7,
Table 8 and
Table 9 along with the change of aspect ratio AR (a/c) which is the ratio of a and c values.
In
Table 8, the calculated values of the samples with sonication times 12, 9 and 7 h showed very good results. Figure 9 shows the samples with 9 h sonication time in
Table 8. Figure 10a,b shows the different sizes of the samples 9 h. Figures 11 and 12 given in the same table show the sample with 12 and 7 h sonication times. The examples in this group gave images similar to the examples given in
Table 7. For this reason, views of these examples are not provided separately.
It is clear from the tables that as the d-expansion increases particle thickness decreases. Due to the effective delamination process performed before sonication, particle thickness (
c), horizontal length (
a) dimension and AR values are much higher than the best result AR values that were reported in a previous study and were determined by using only by the sonication (AR value = 227) [
26]. Additionally, the results show that increasing sonication time decreases particle thickness while the increasing aspect ratio of AR. The highest AR value of 520 was obtained where d-expansion = 51 Å in
Table 9 for sonication time of 9 h. Additionally, for sonication times 7 and 12 h, AR values are 500 and 498, respectively, are also quite high. In these sonification times, thin particles with a thickness of 0.030 µm were succeeded. It was reported in the literature that after 1 h of sonication, mica particle thickness was only 0.5 µm. In this present study on the other hand, with effective delamination process and only applying 1 h sonication, much thinner particles were achieved than that previously reported [
26]. The highest particle thickness obtained after a 1 h sonication time is 0.214 µm in
Table 5, while the lowest particle thicknesses obtained were 0.061 µm and 0.063 µm, respectively, in
Table 8 and
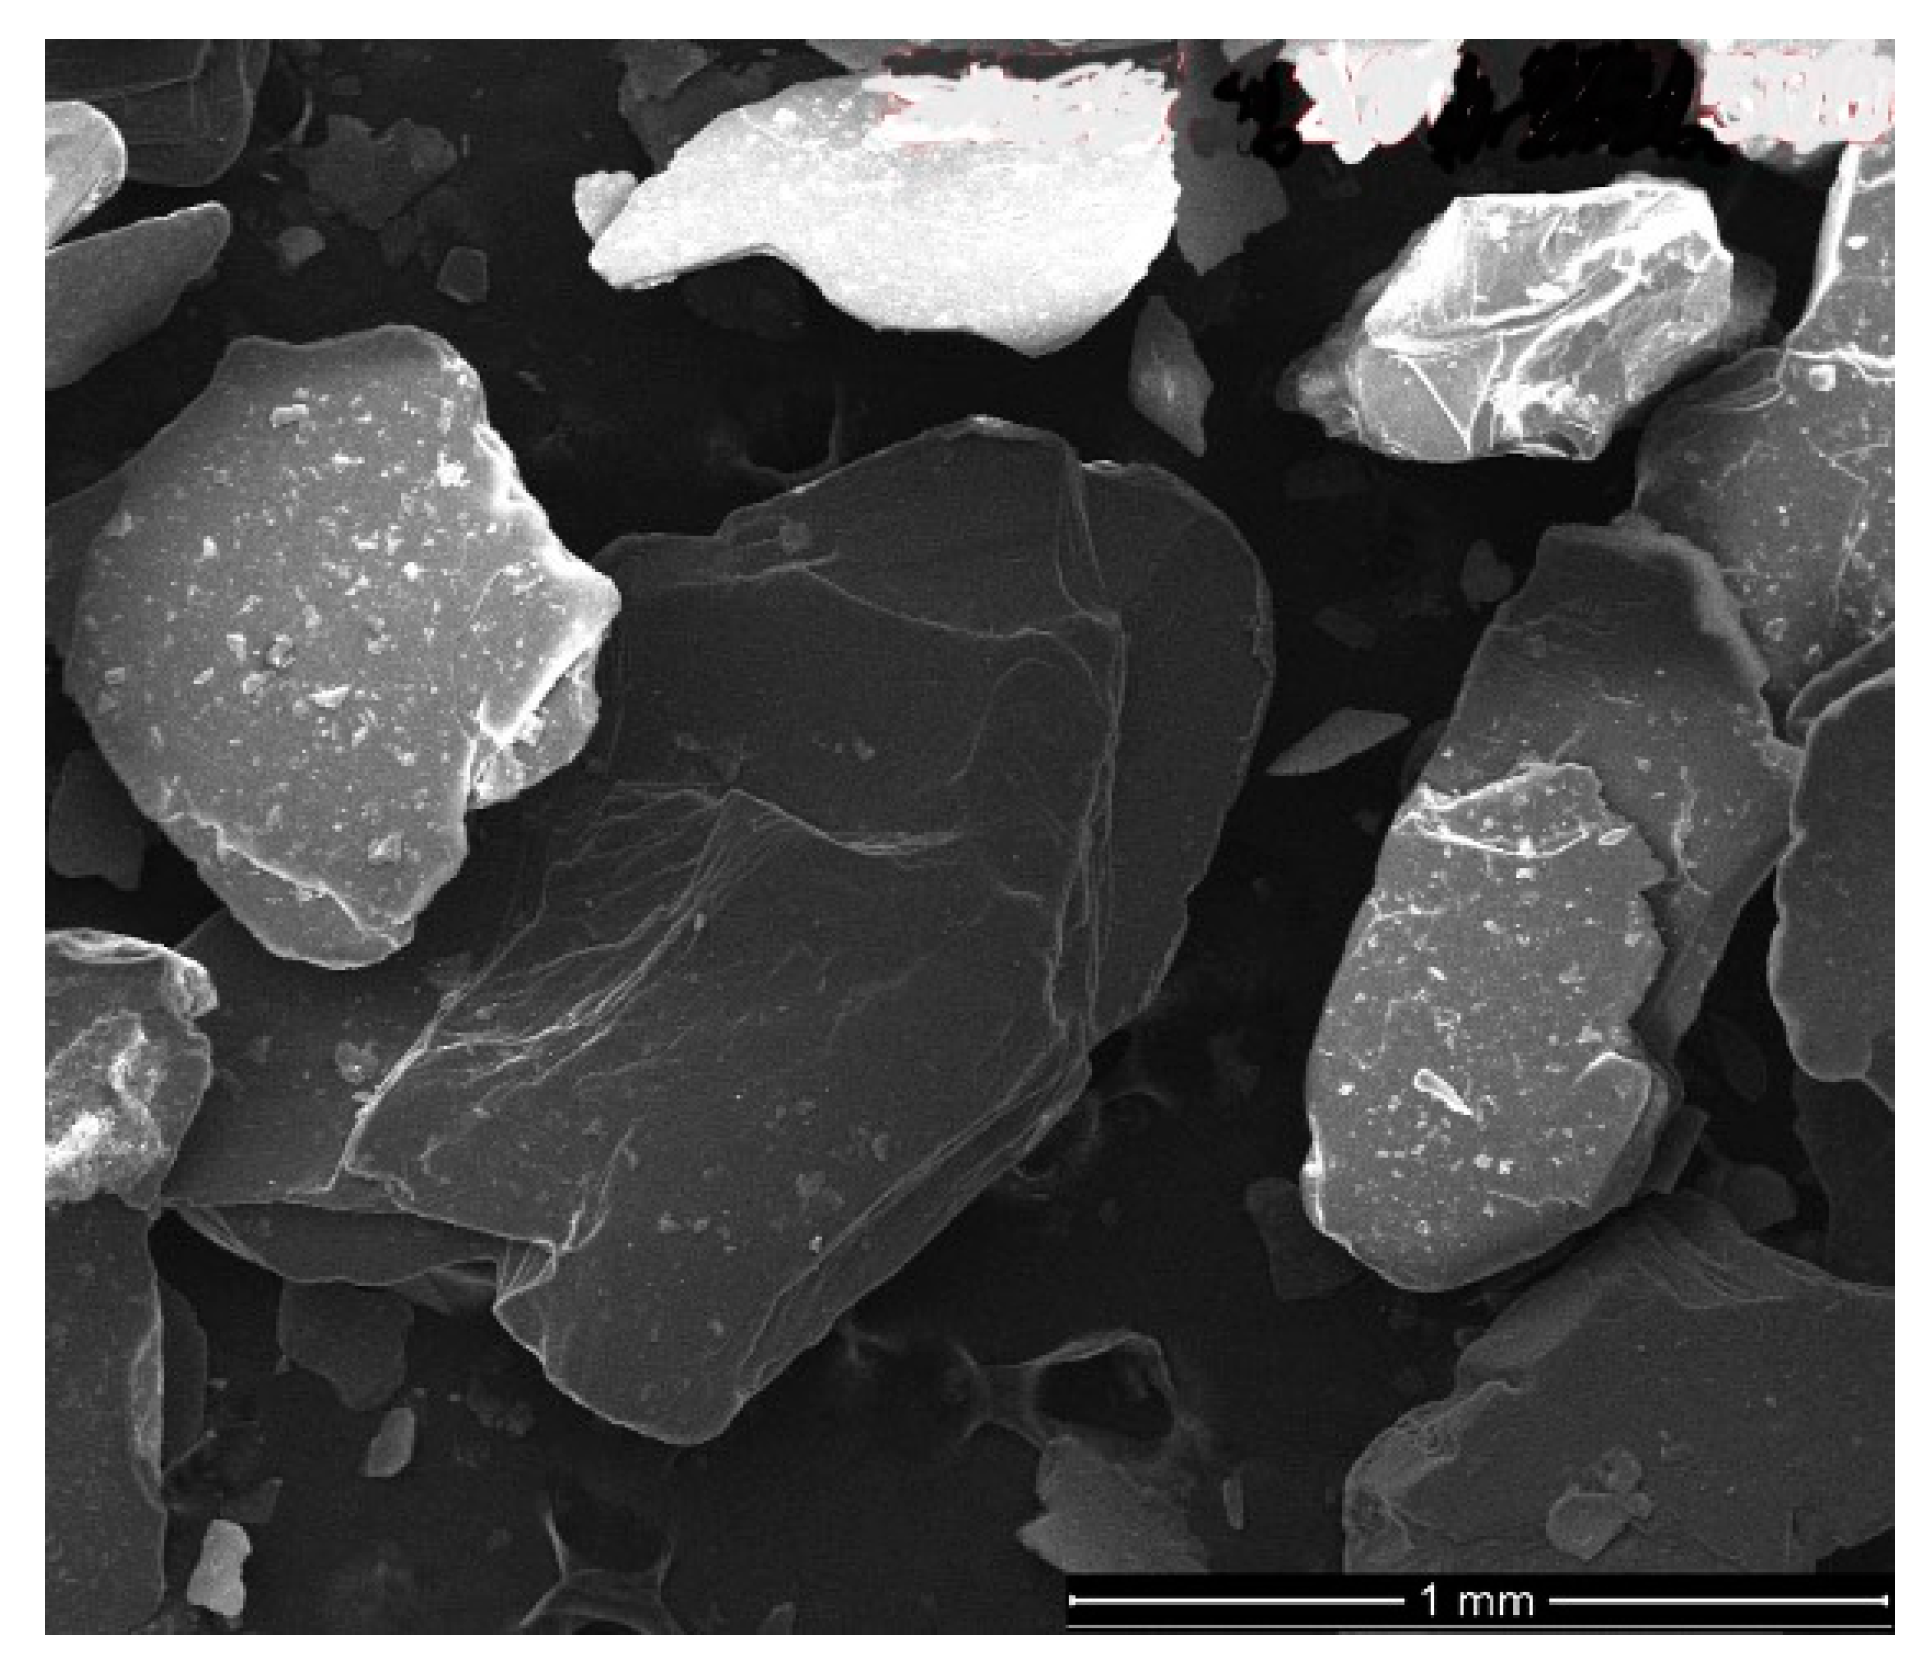
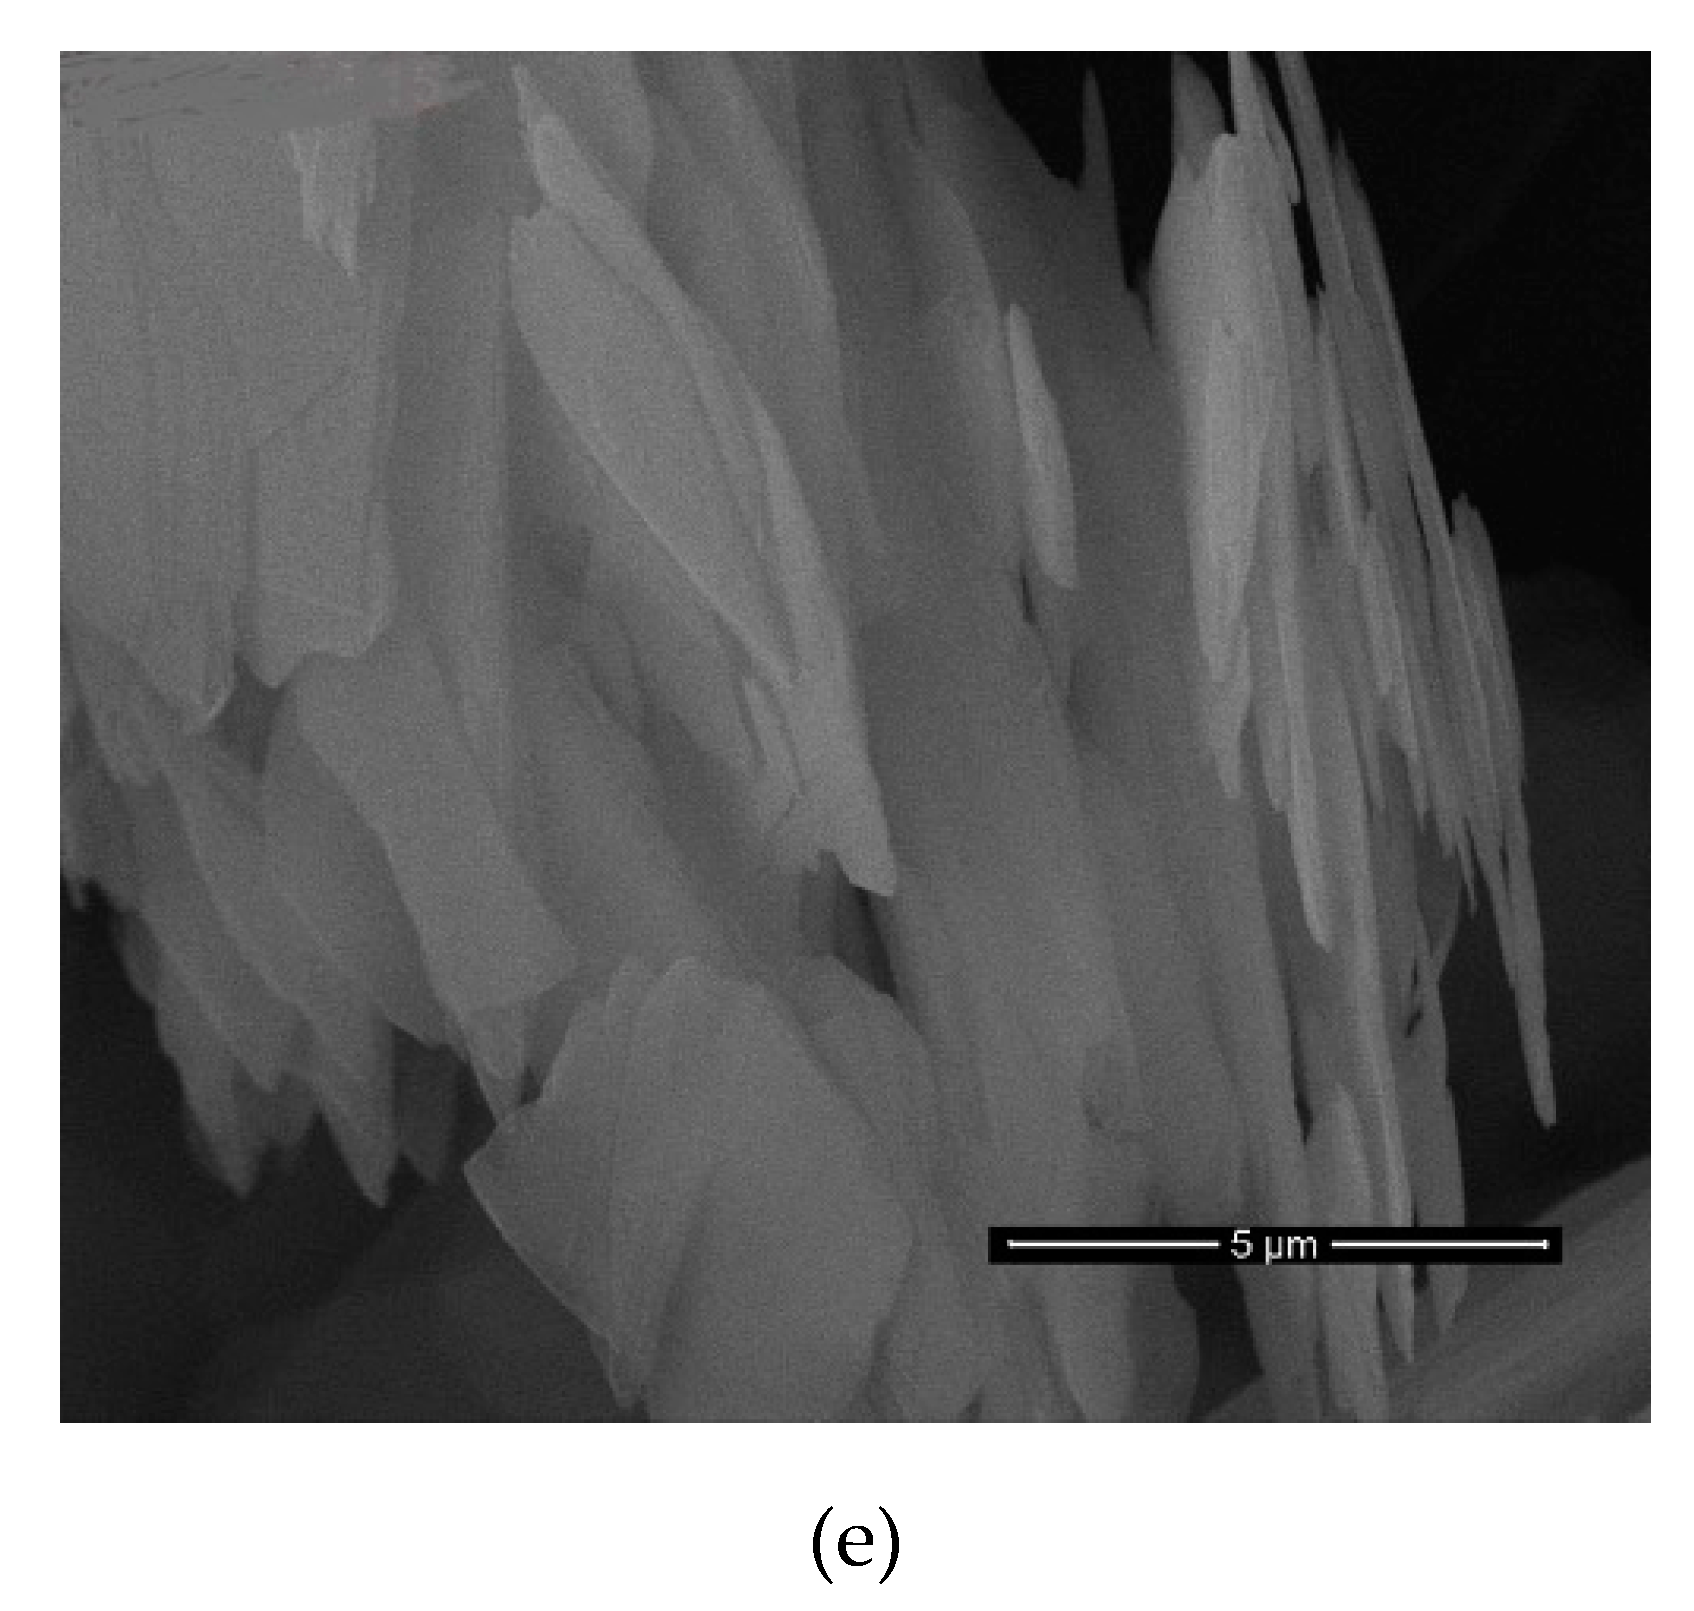
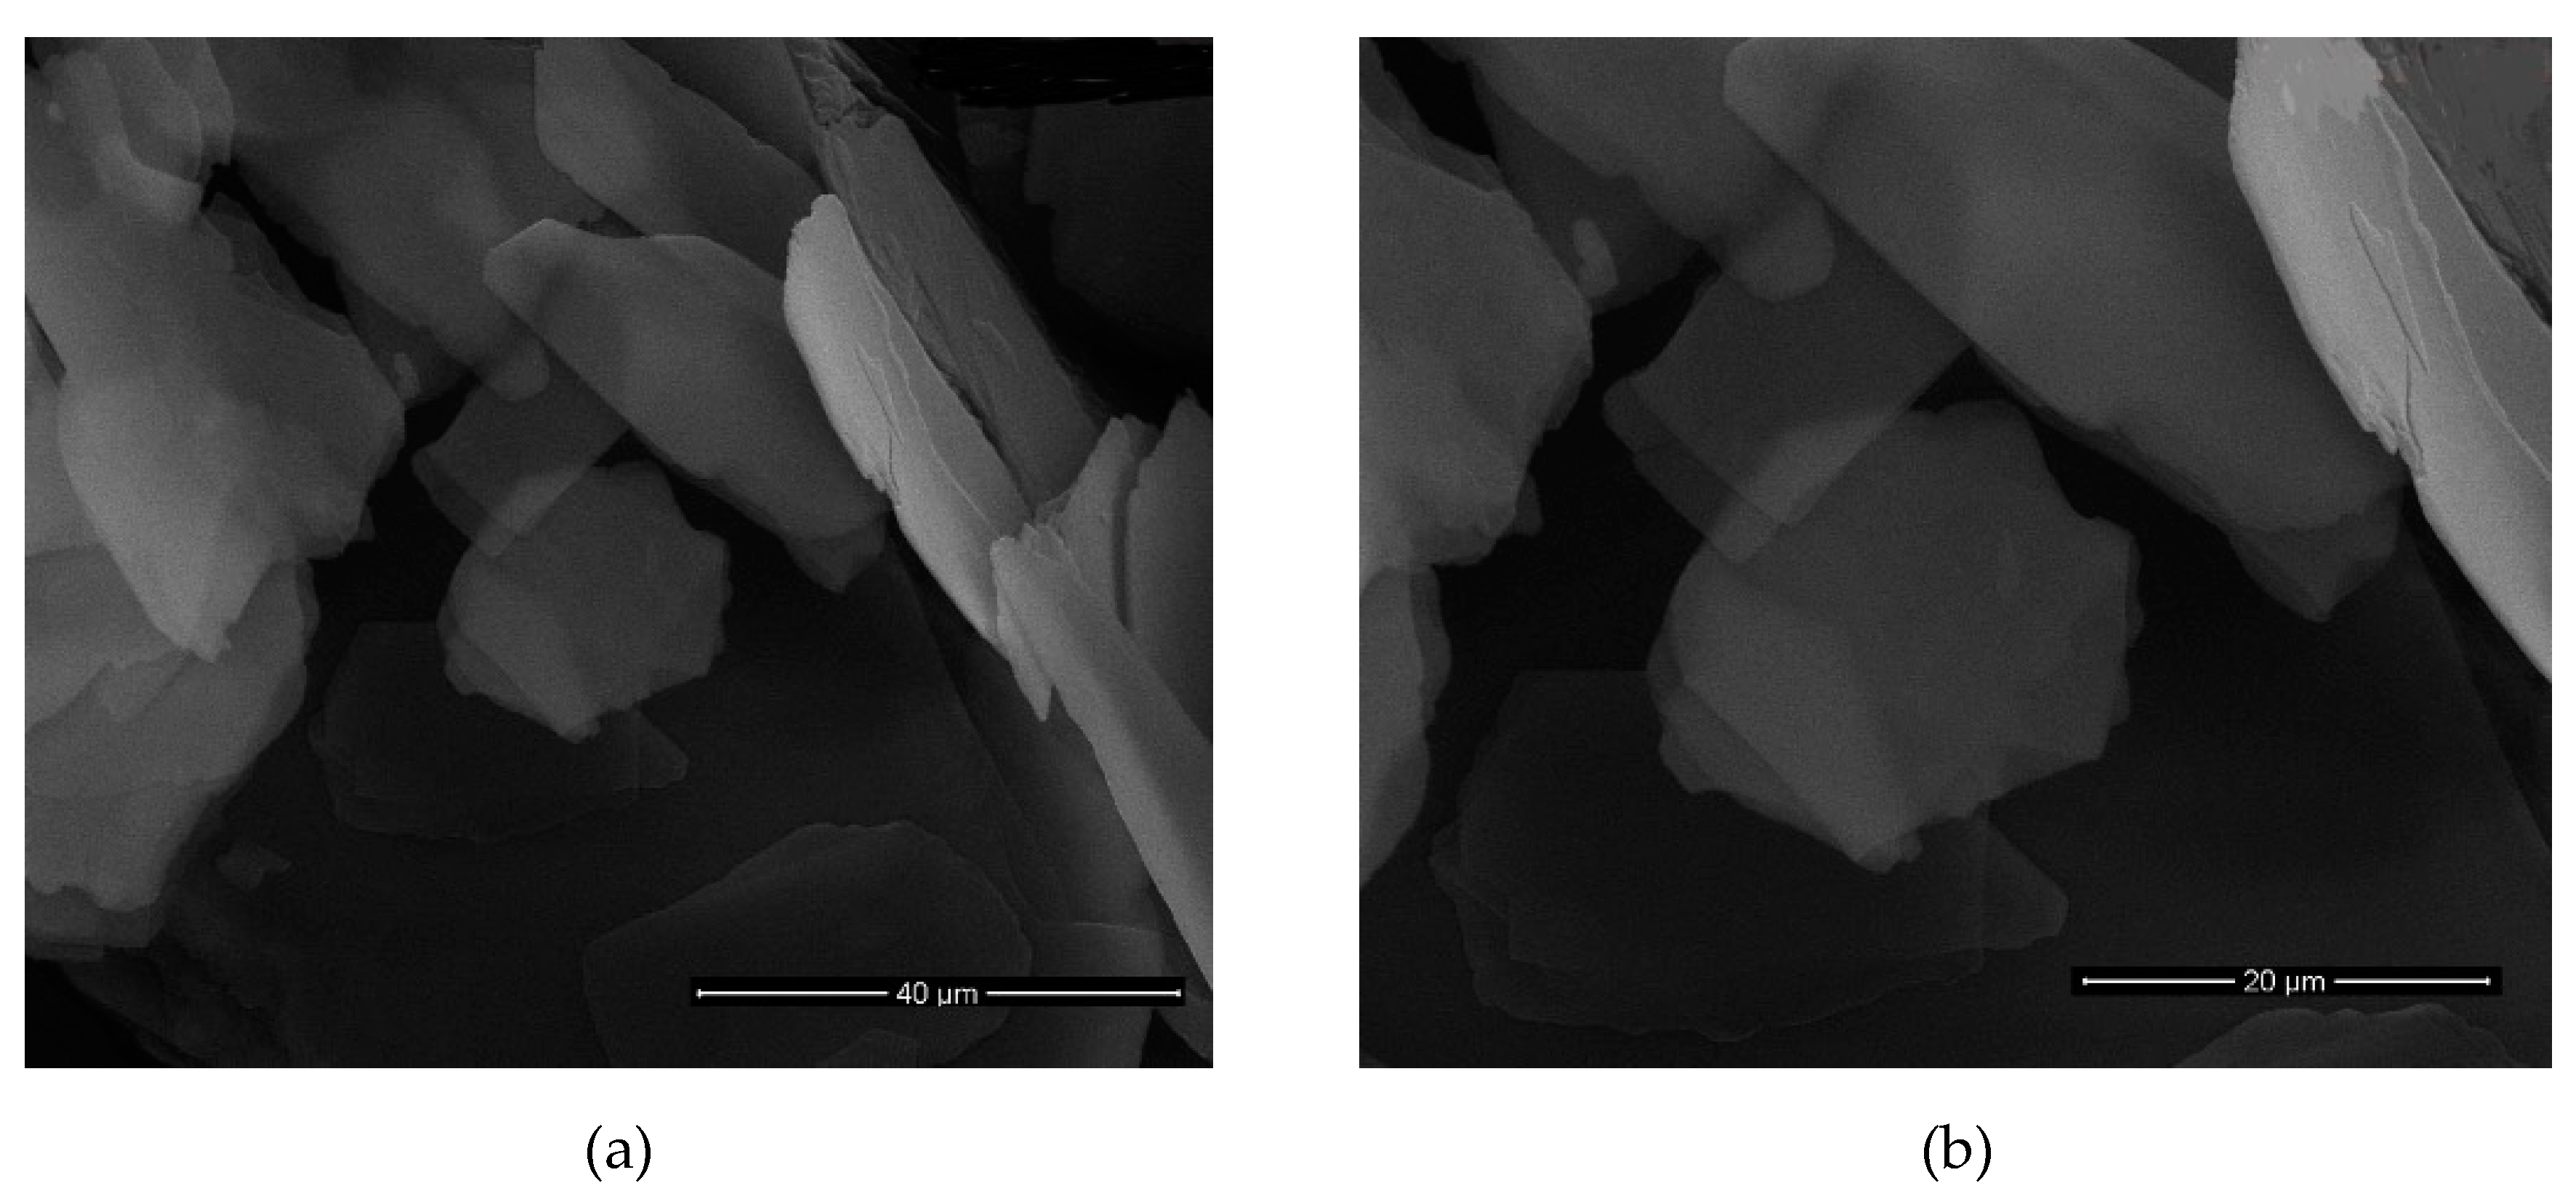
Table 9. SEM images of the pristine material is given in
Figure 4.
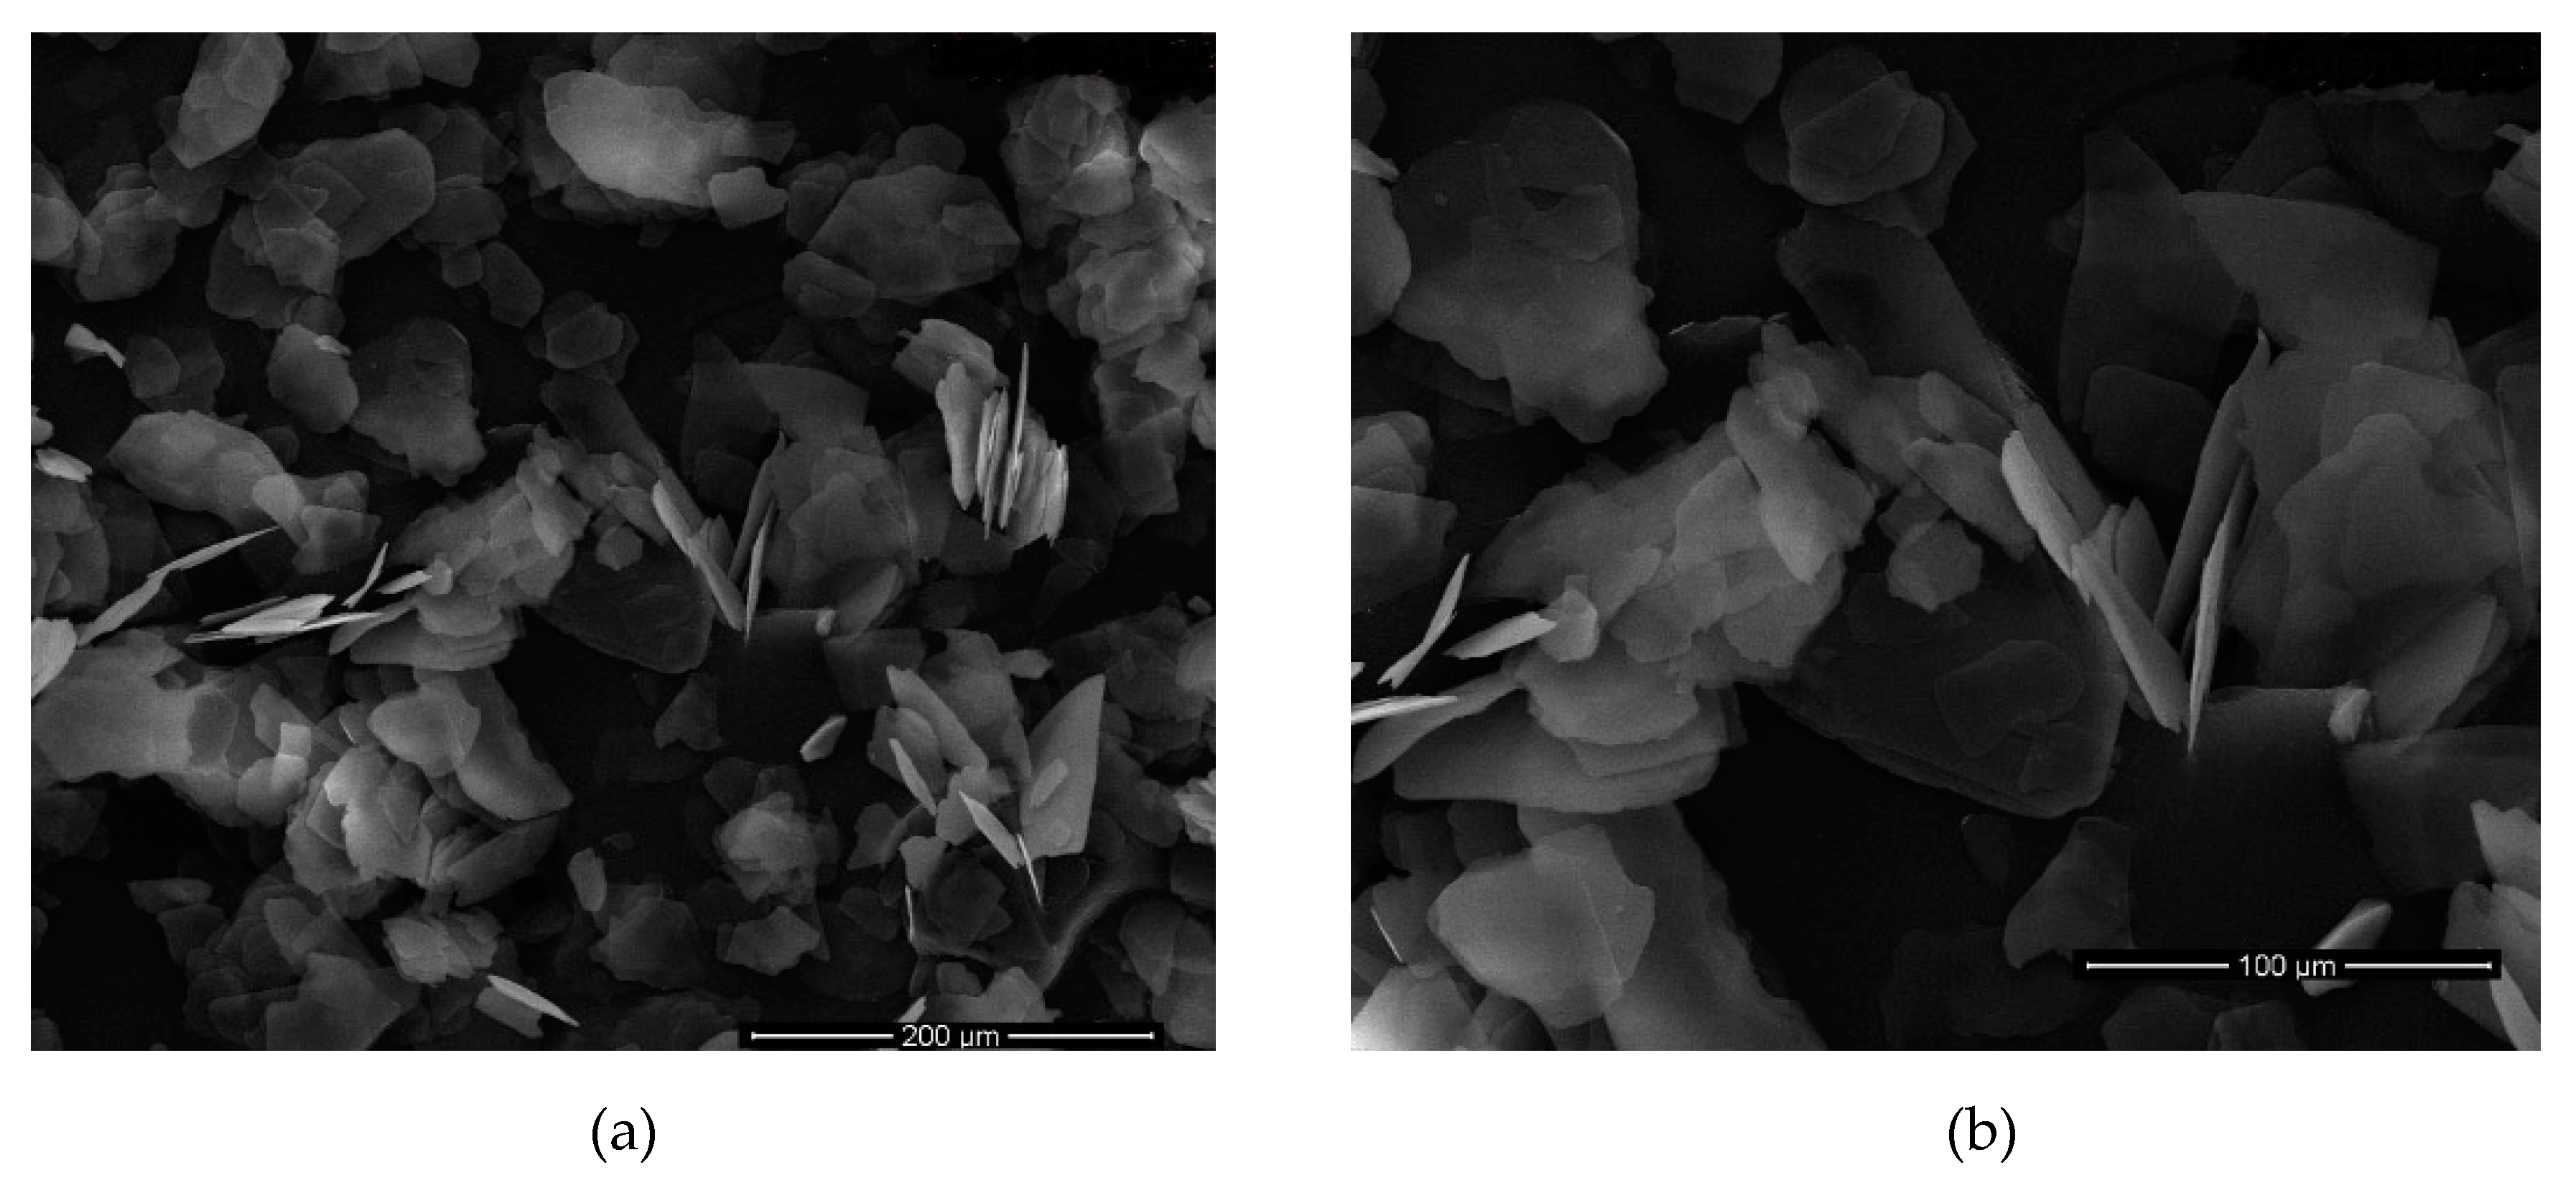
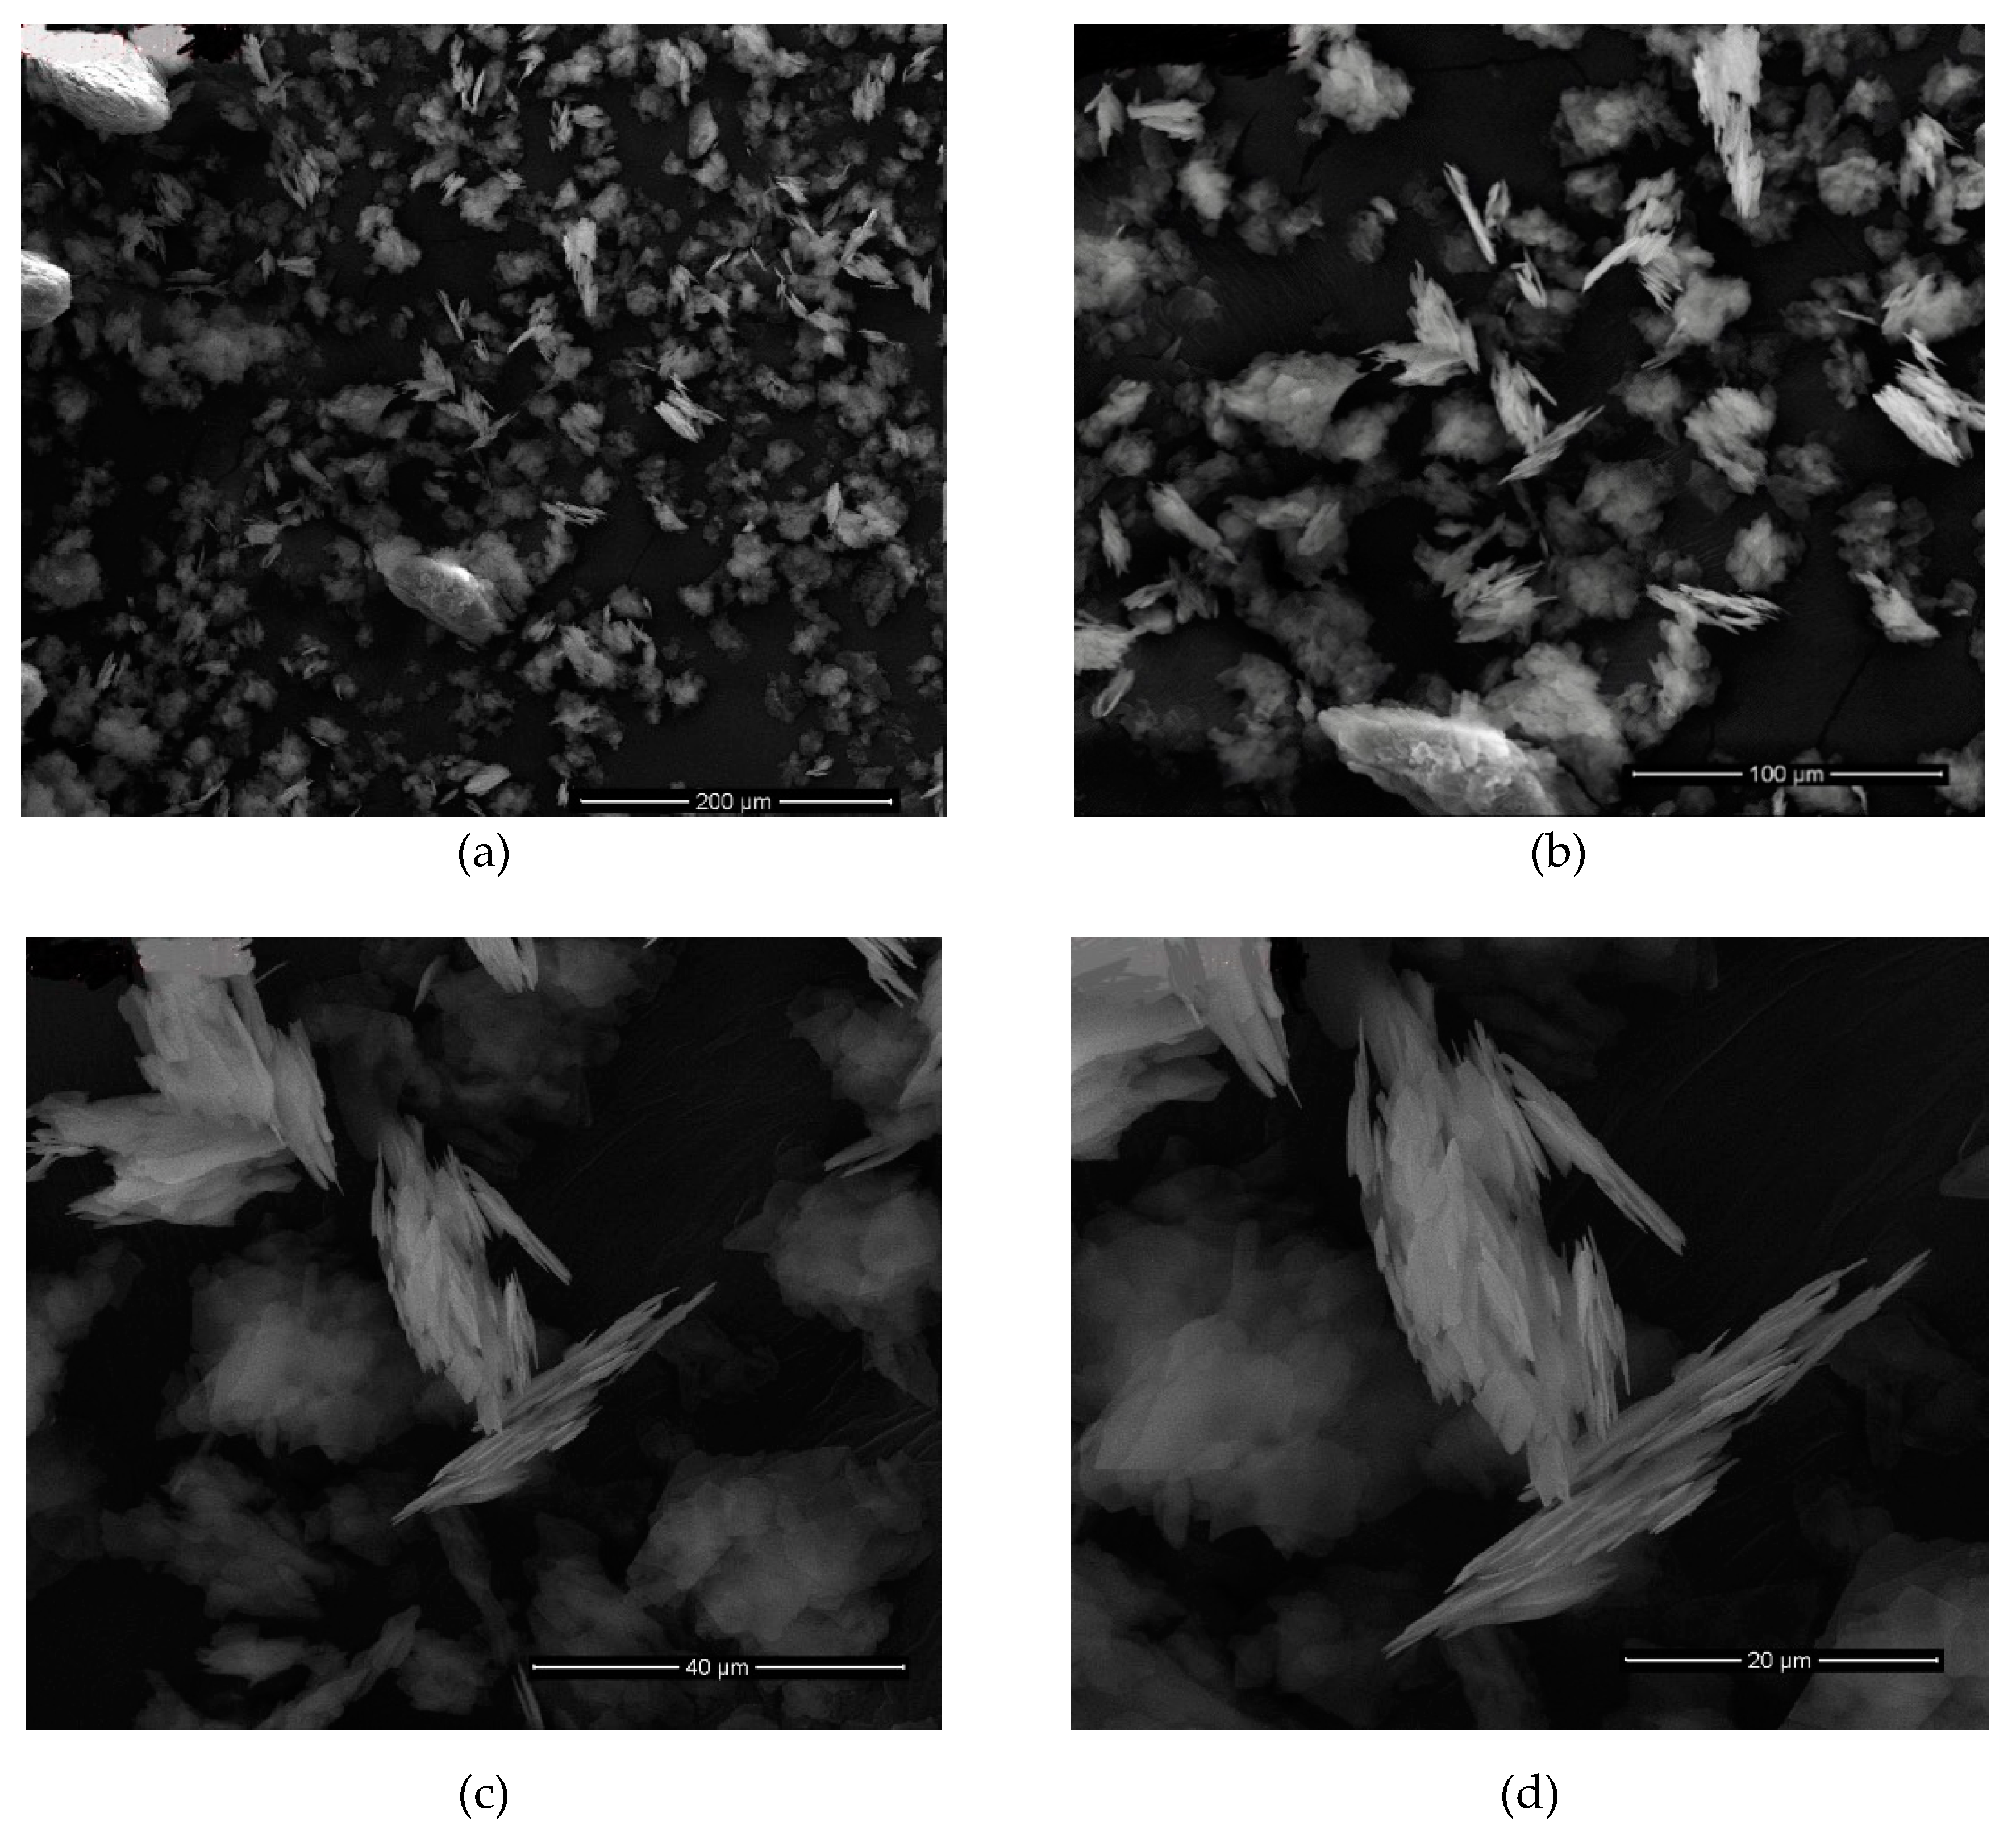
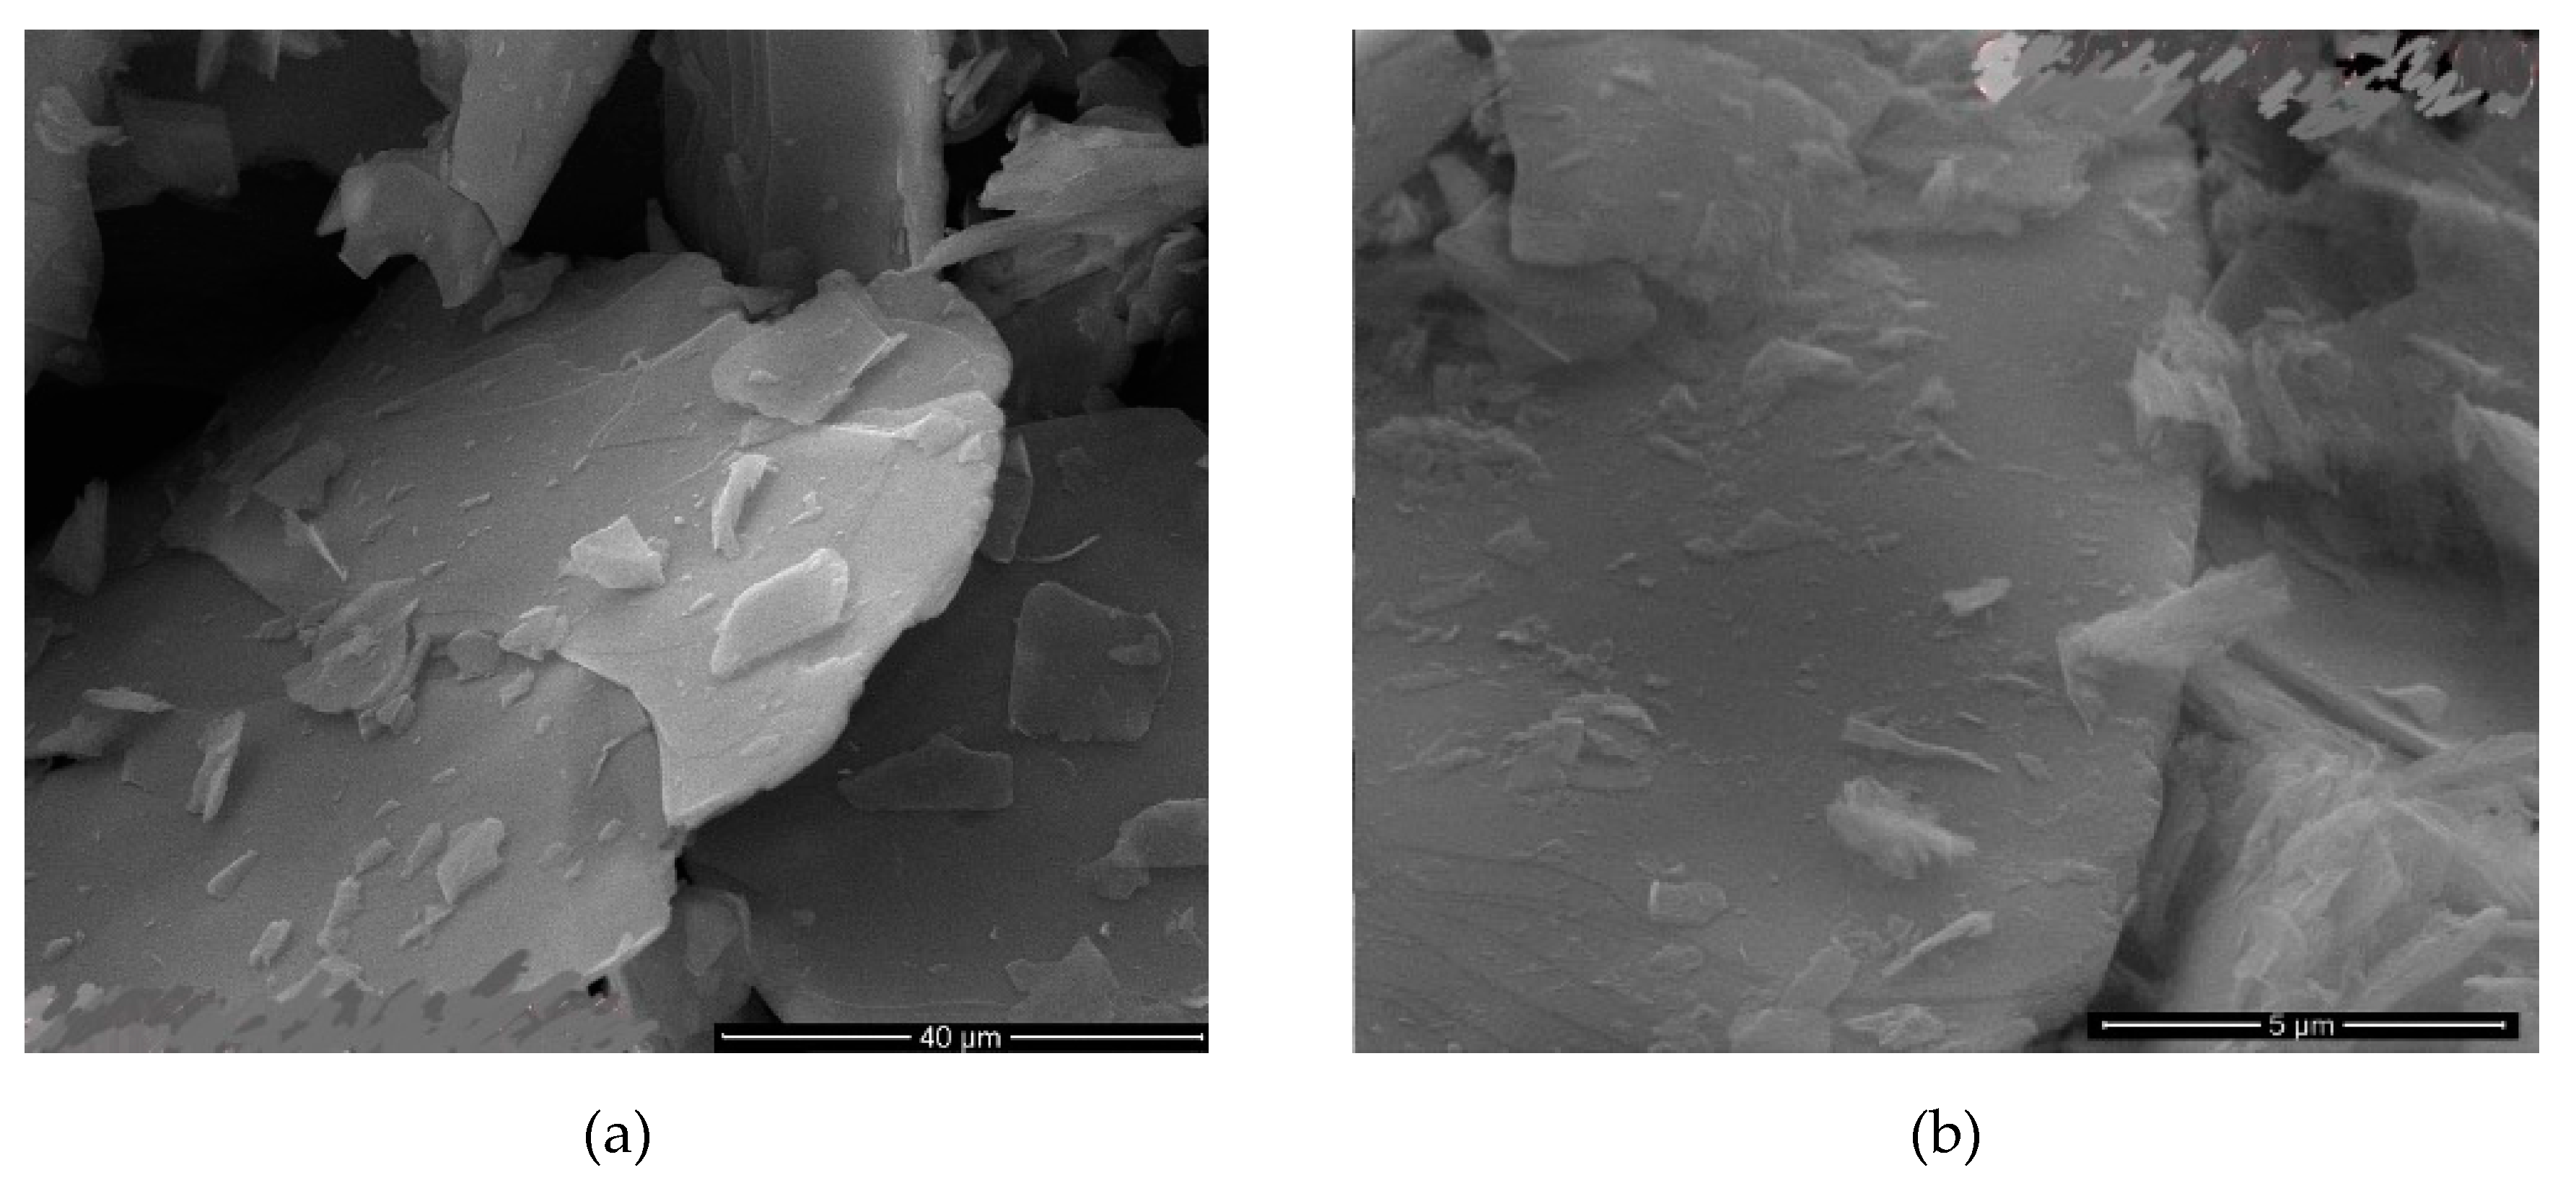
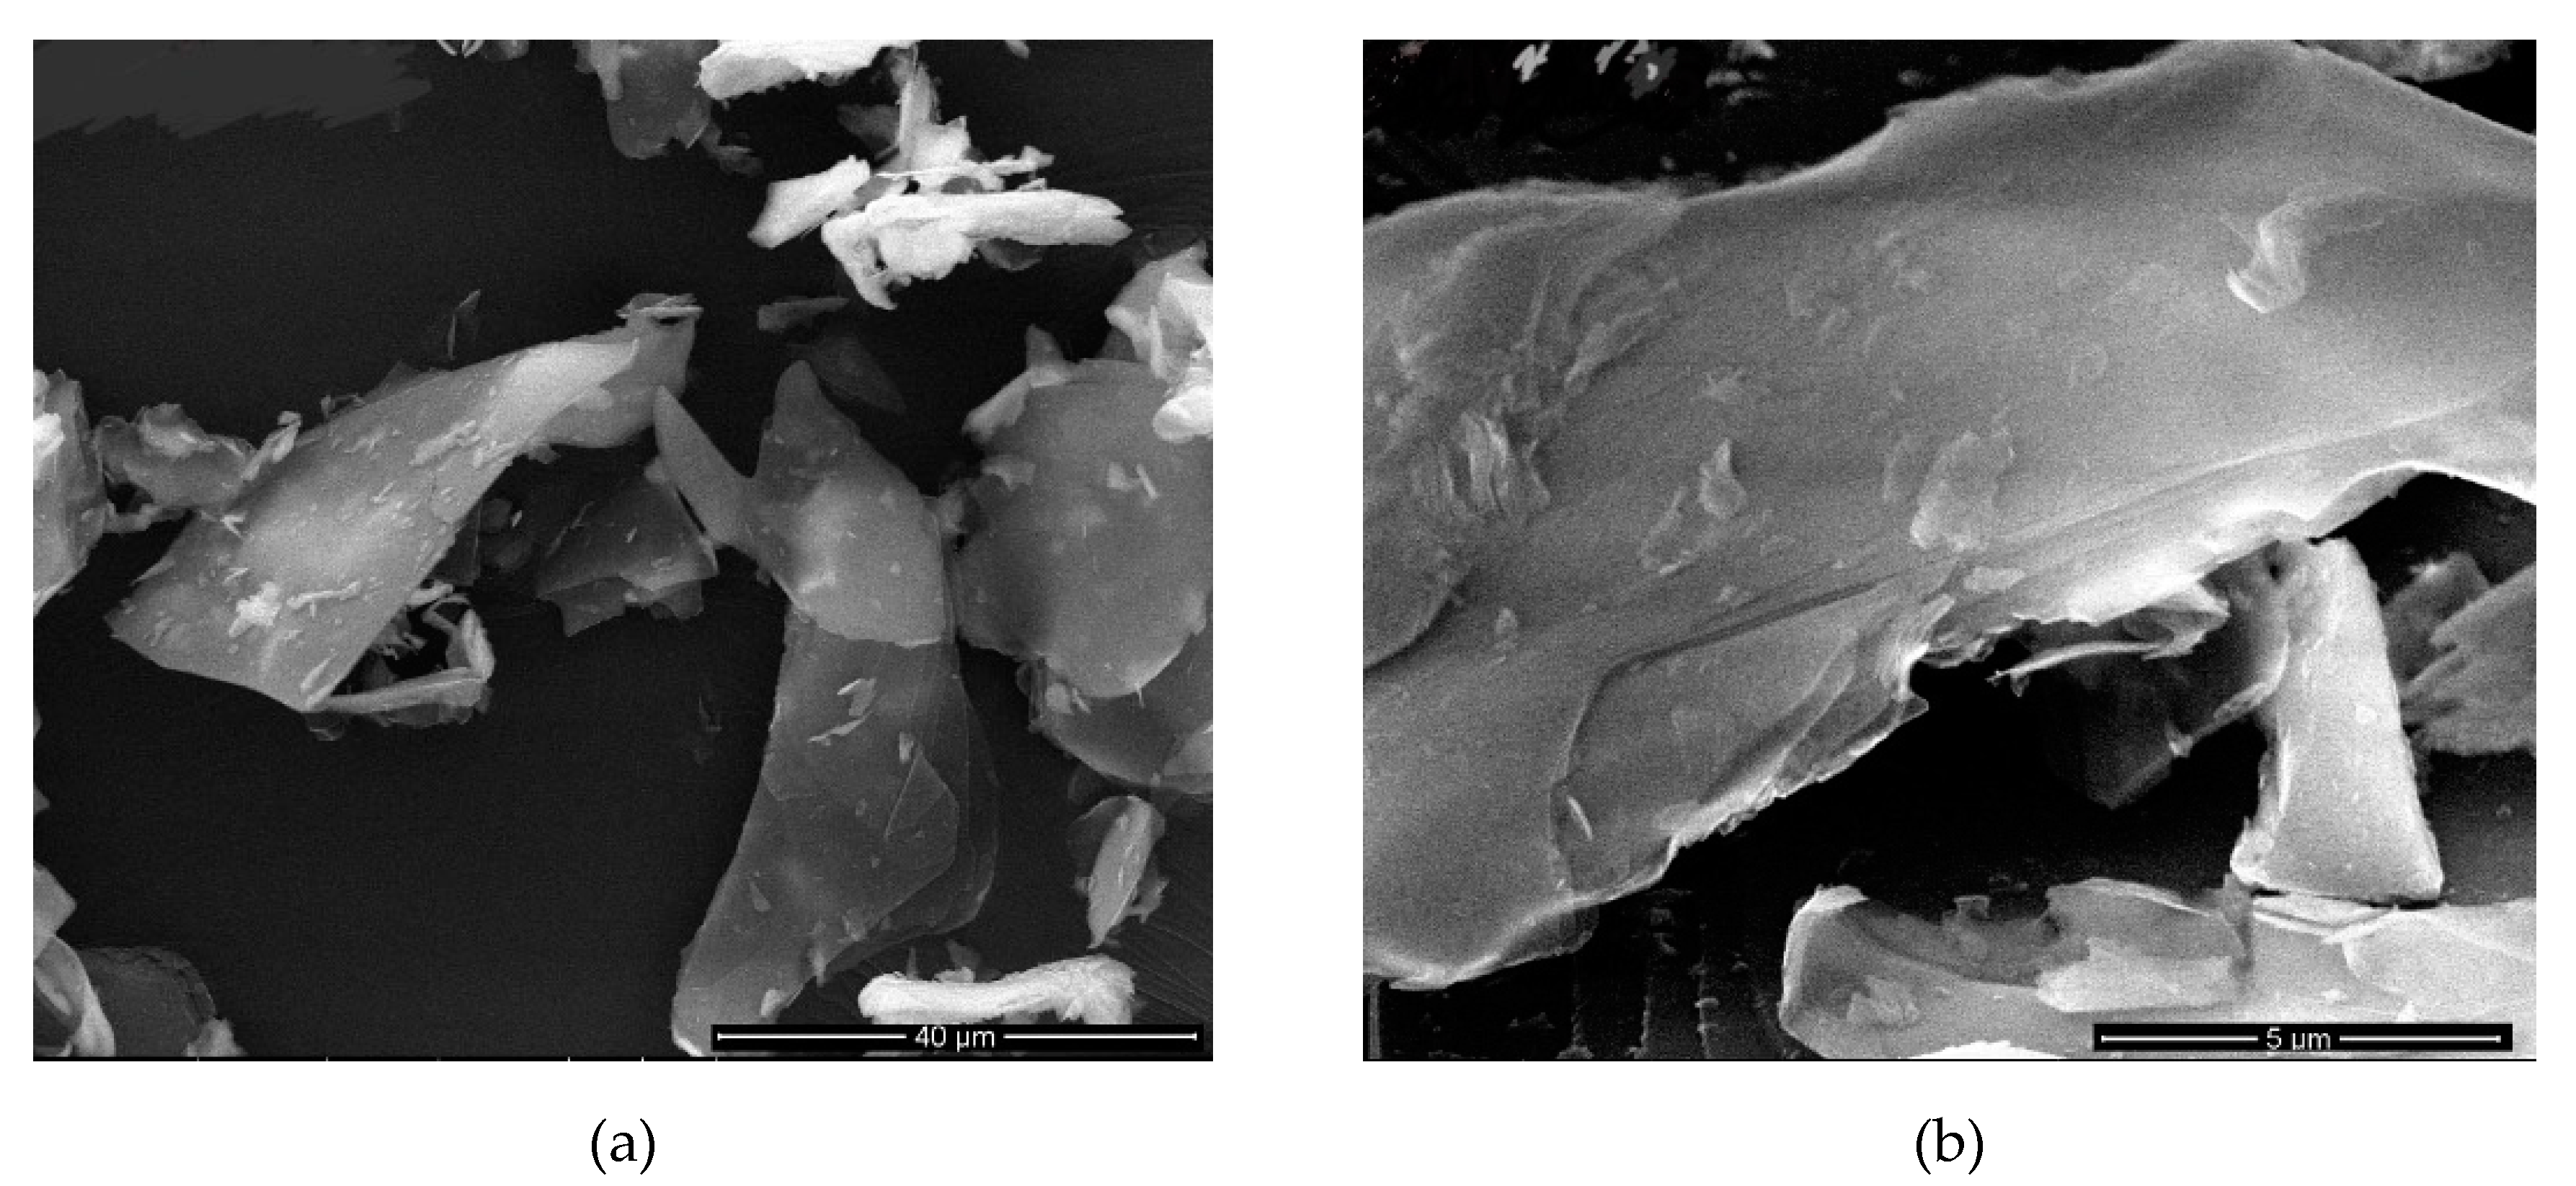
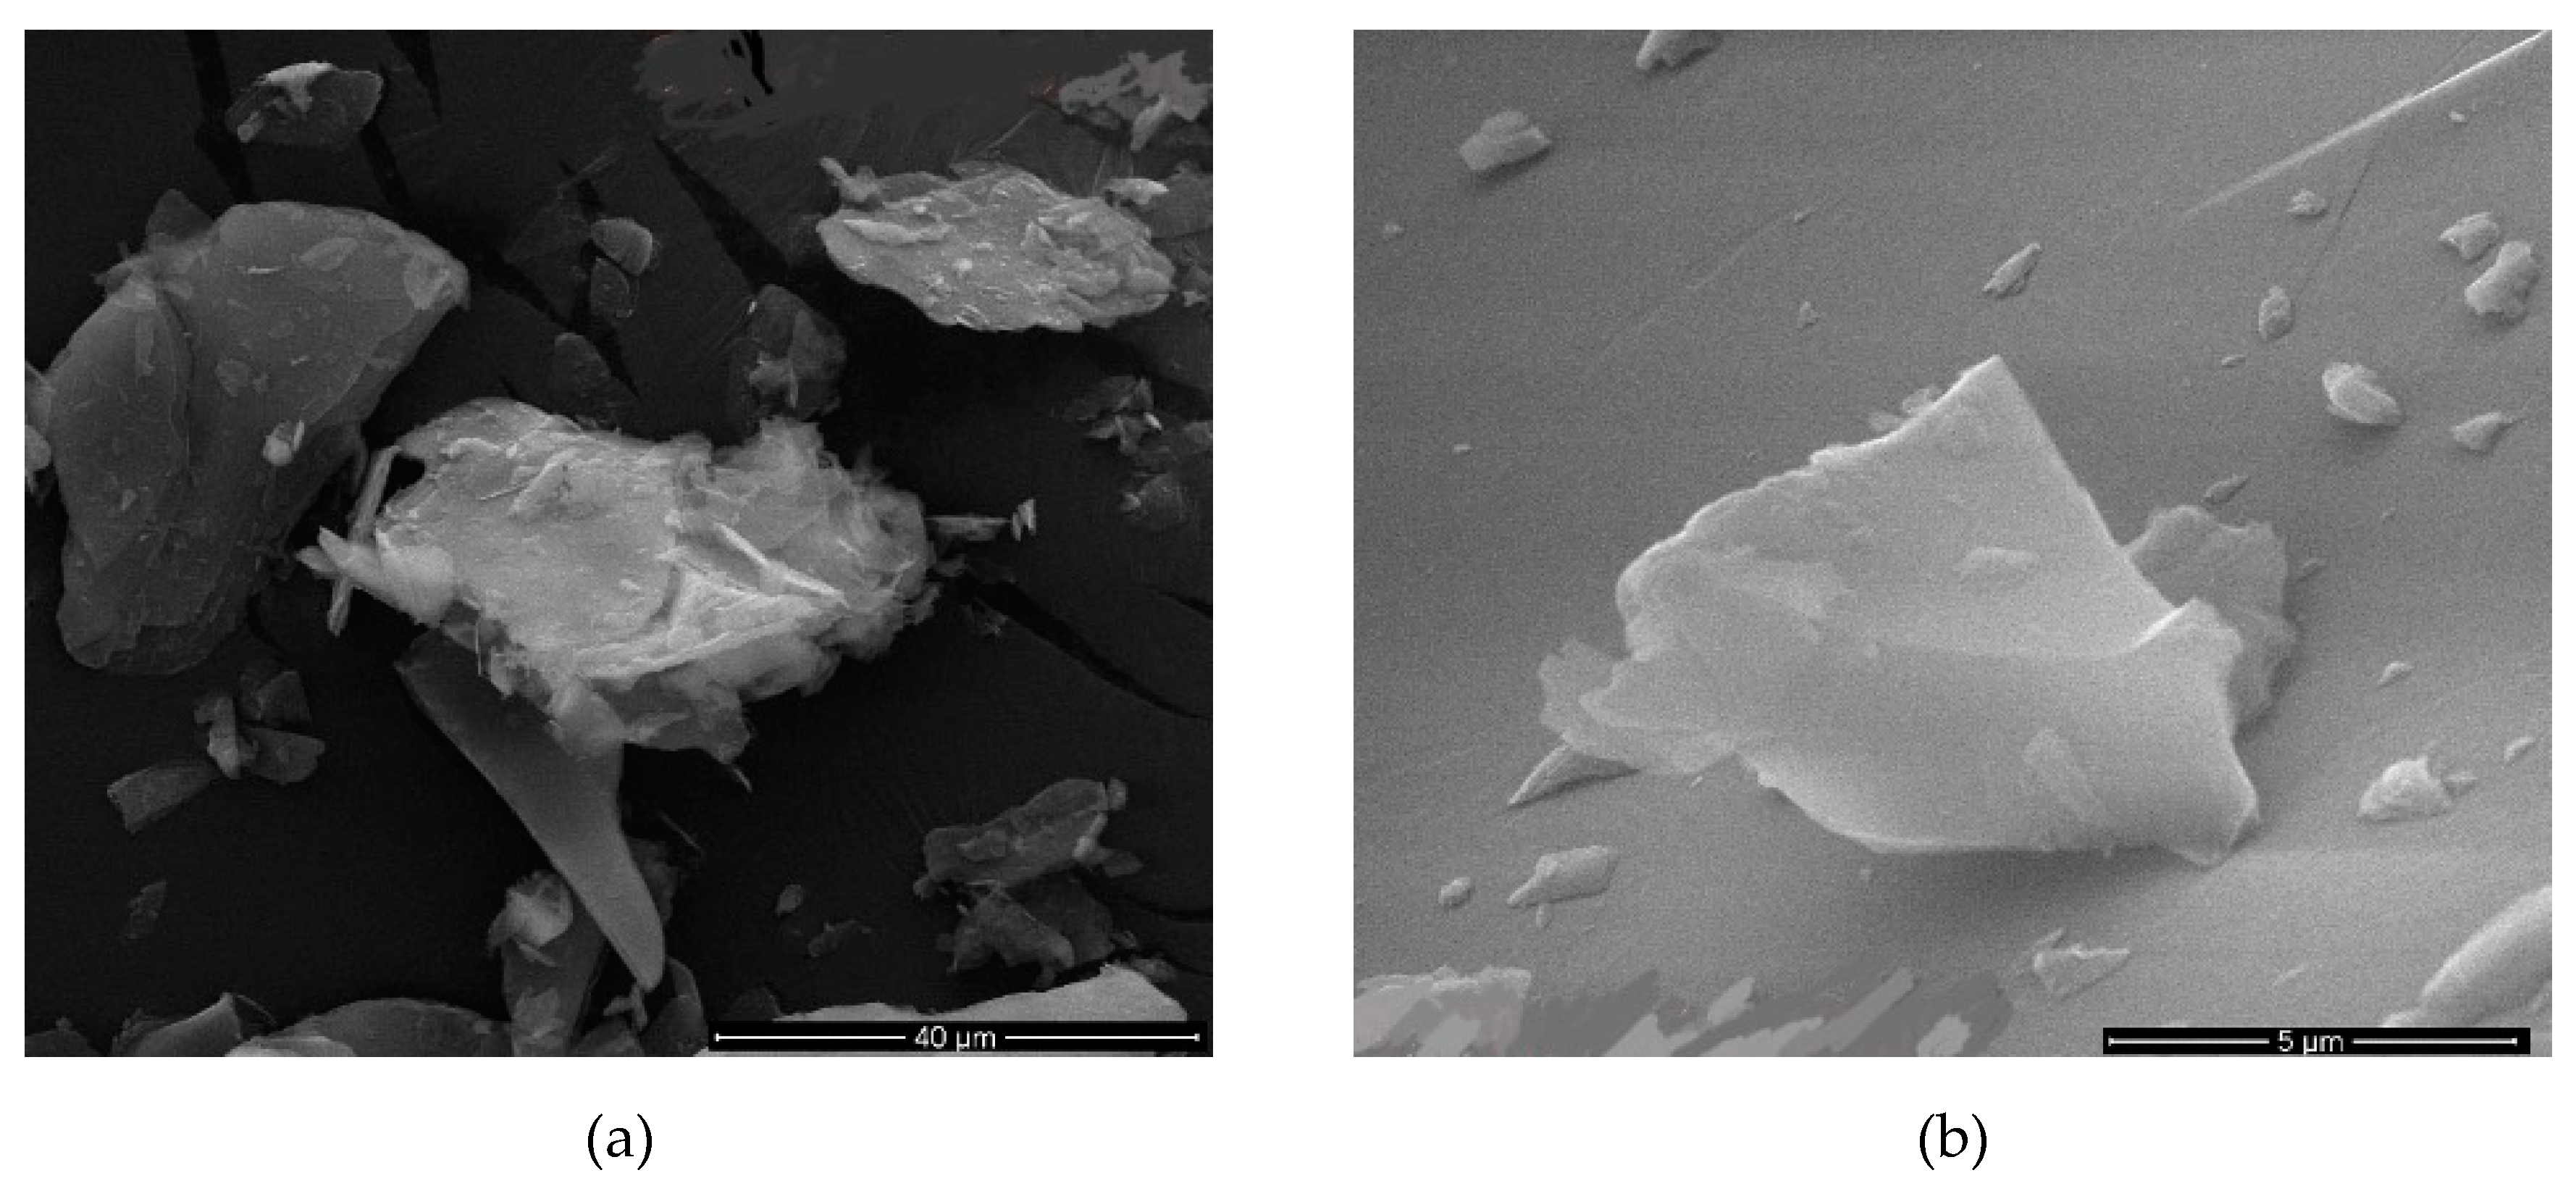
SEM images of the sample with best dimensions meaning best AR values were shown in
Figure 5 and
Table 9 where sonication time was 9 h. The image clearly shows that the mica was dispersed into very fine particles.
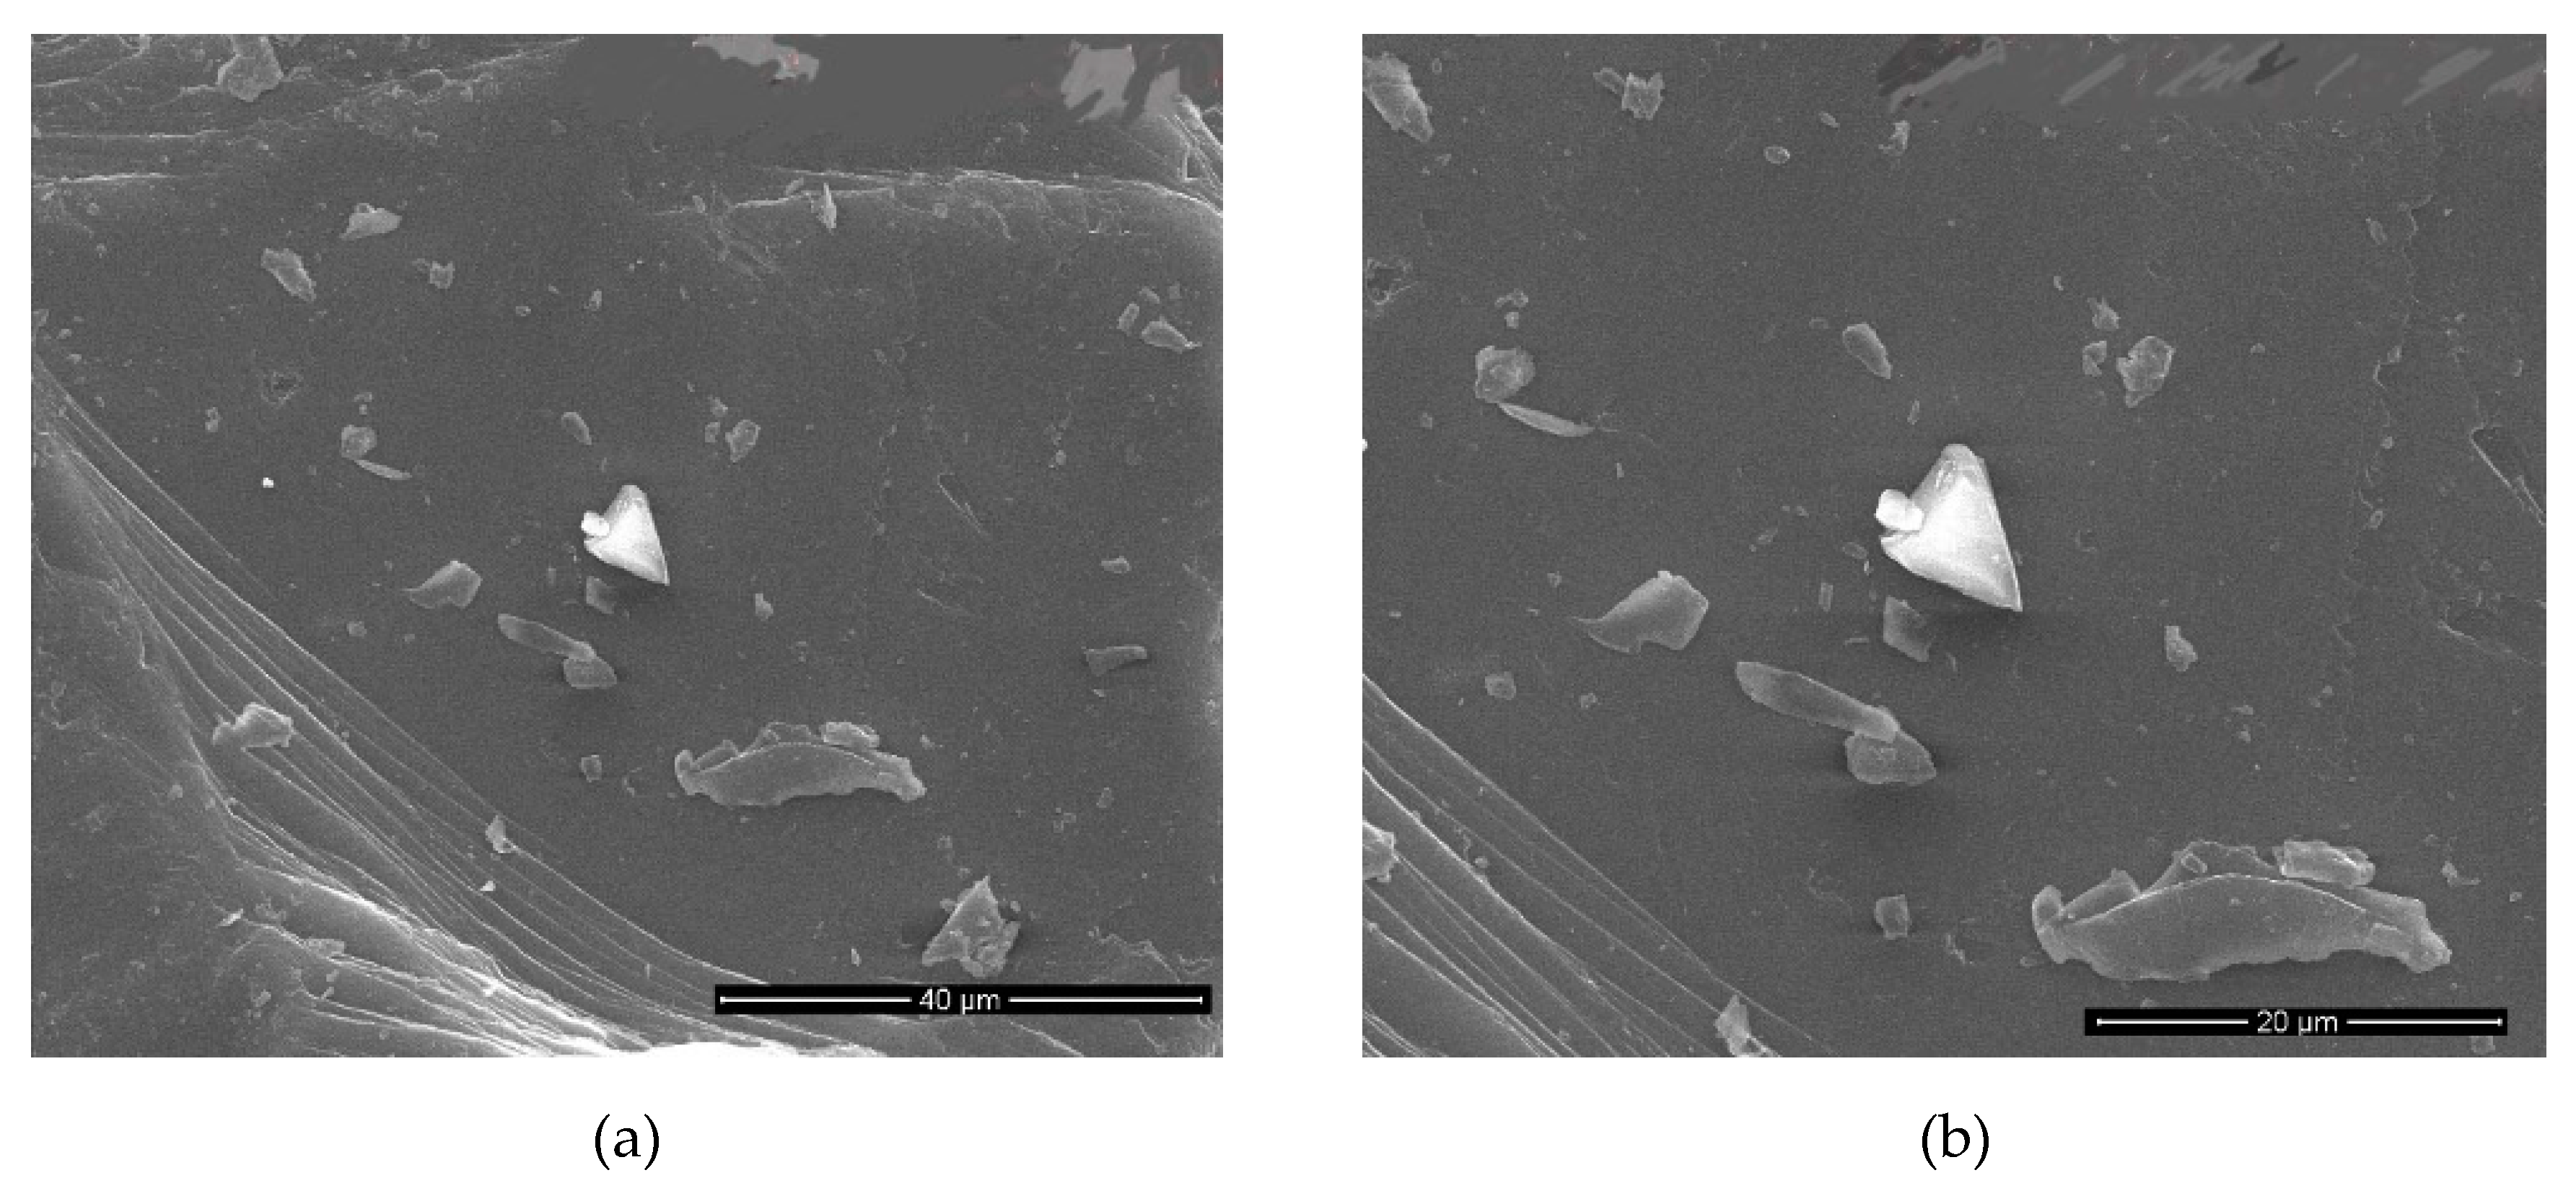
Figure 5 shows SEM images of the second-best sample which was given in
Table 9 where sonication time is 7 h.
Figure 5 and
Figure 6 show samples also given in
Table 9 where sonication time is 12 and 5 h. In these images, where the sonication time is 12 h, it is seen that the mica particles were dispersed in a very thin thickness. In samples with a sonication time of 5 h, it seems that mica particles were thicker than others.
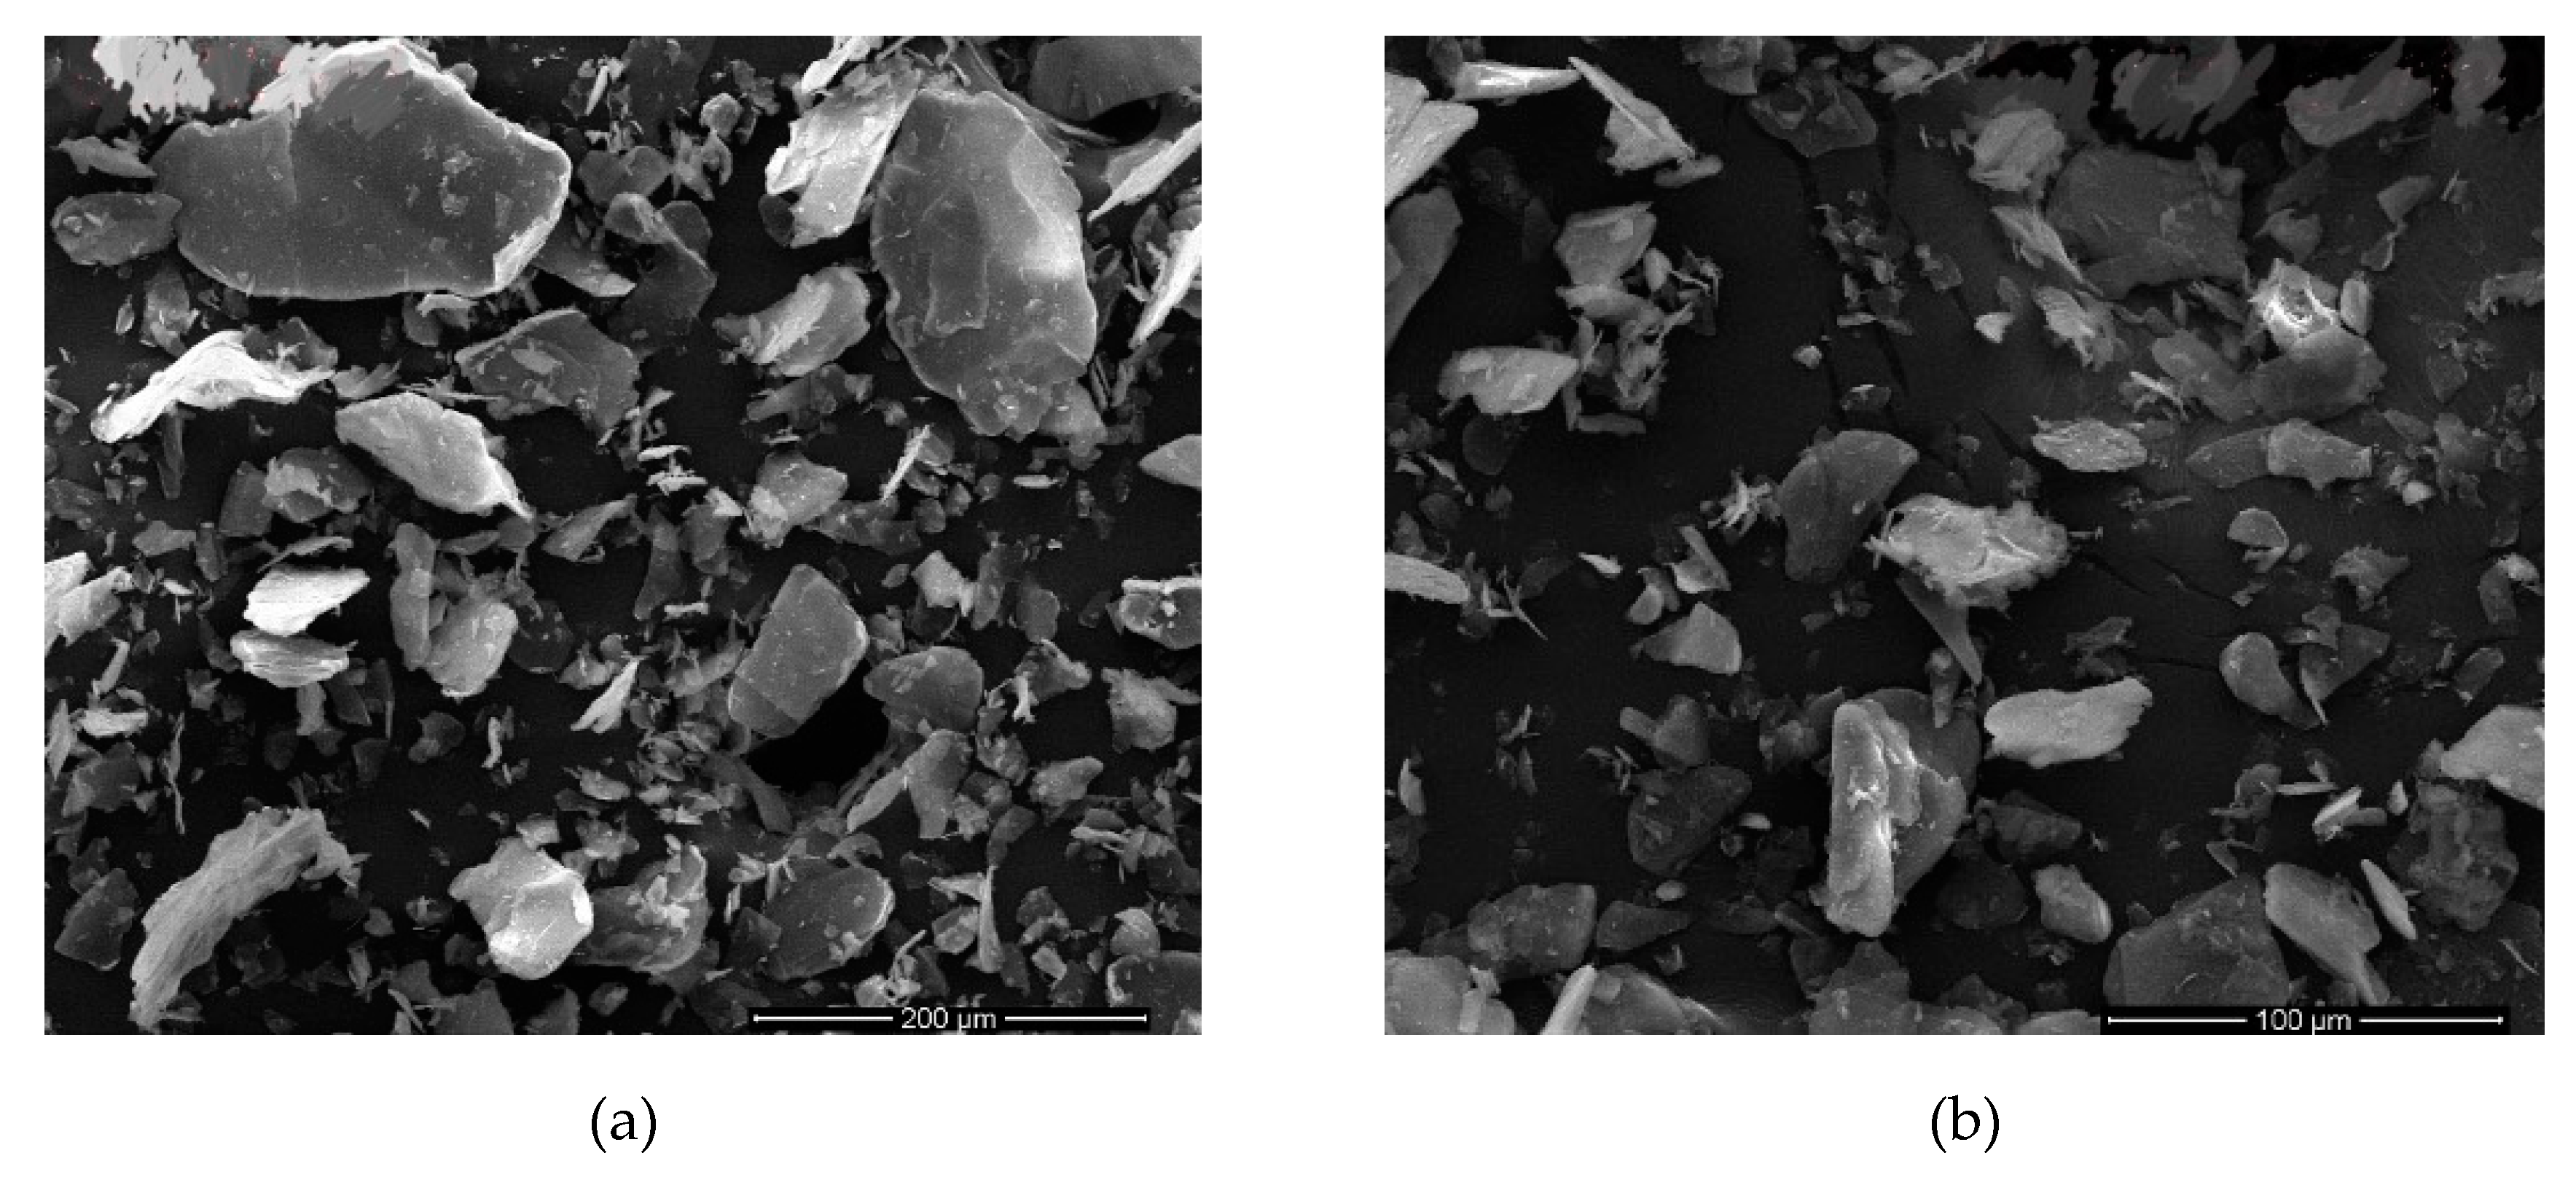
Figure 13 shows the samples with 9 h sonication time in
Table 7,
Figure 14 shows the different sonication times (12 h) of the samples given in the same
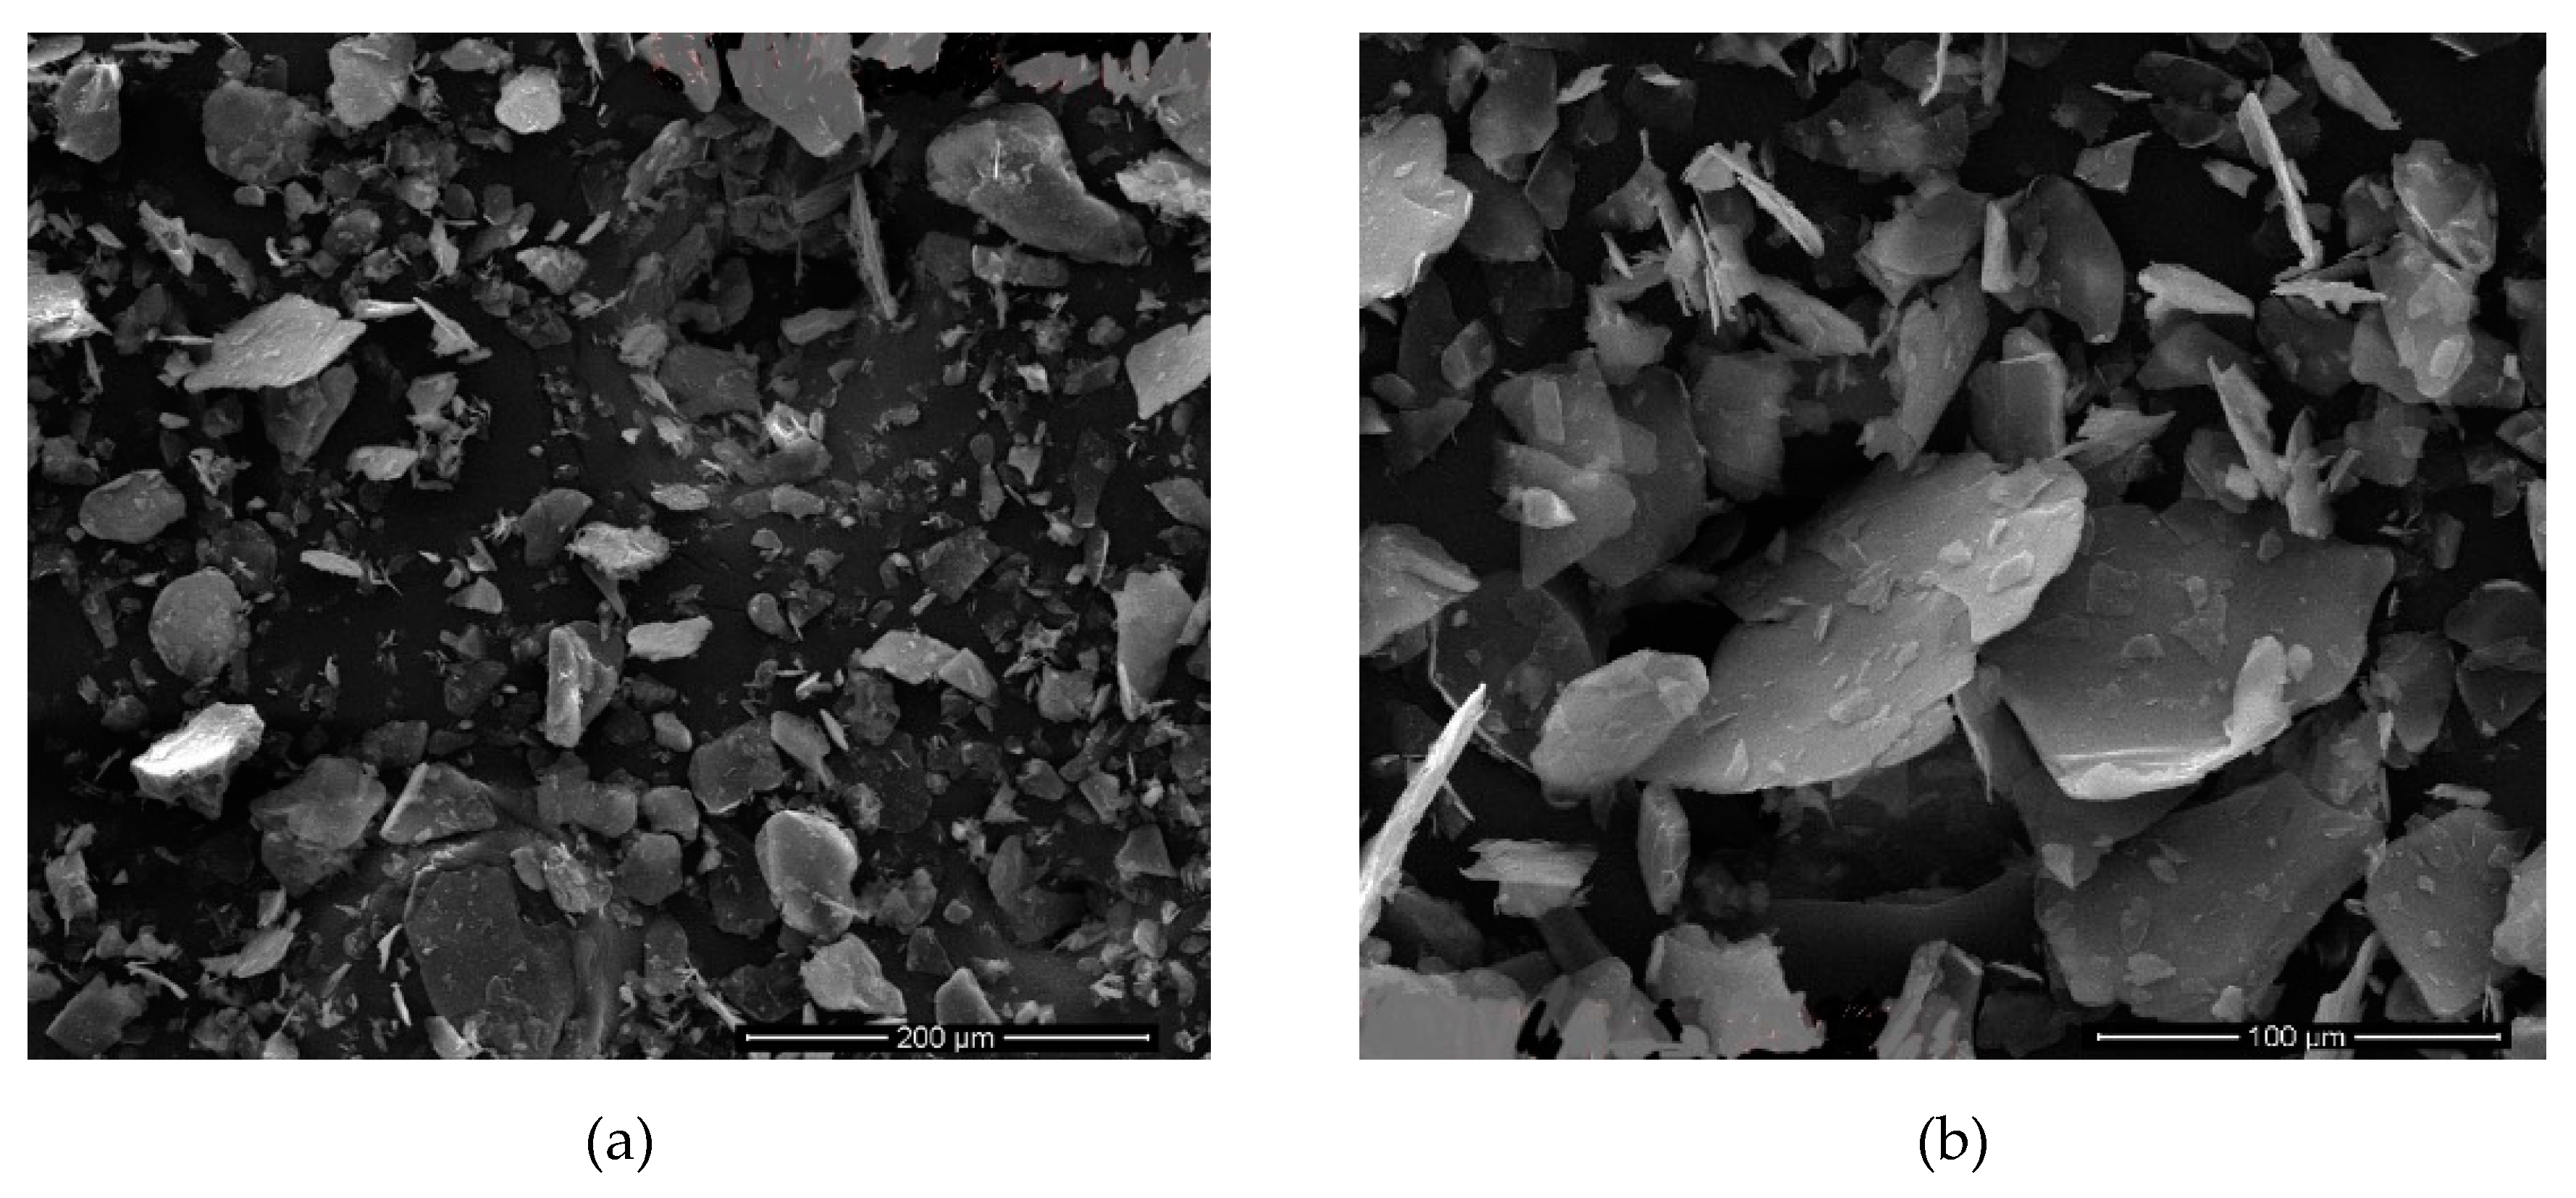
Table 7. In these images, it is clearly observed that the thickness of the mica particles is much higher. It can be said that the crumbs in the images are caused by the sonication intensity due to the lower delamination and the higher horizontal lengths of the samples. This may have caused pollution in the images.
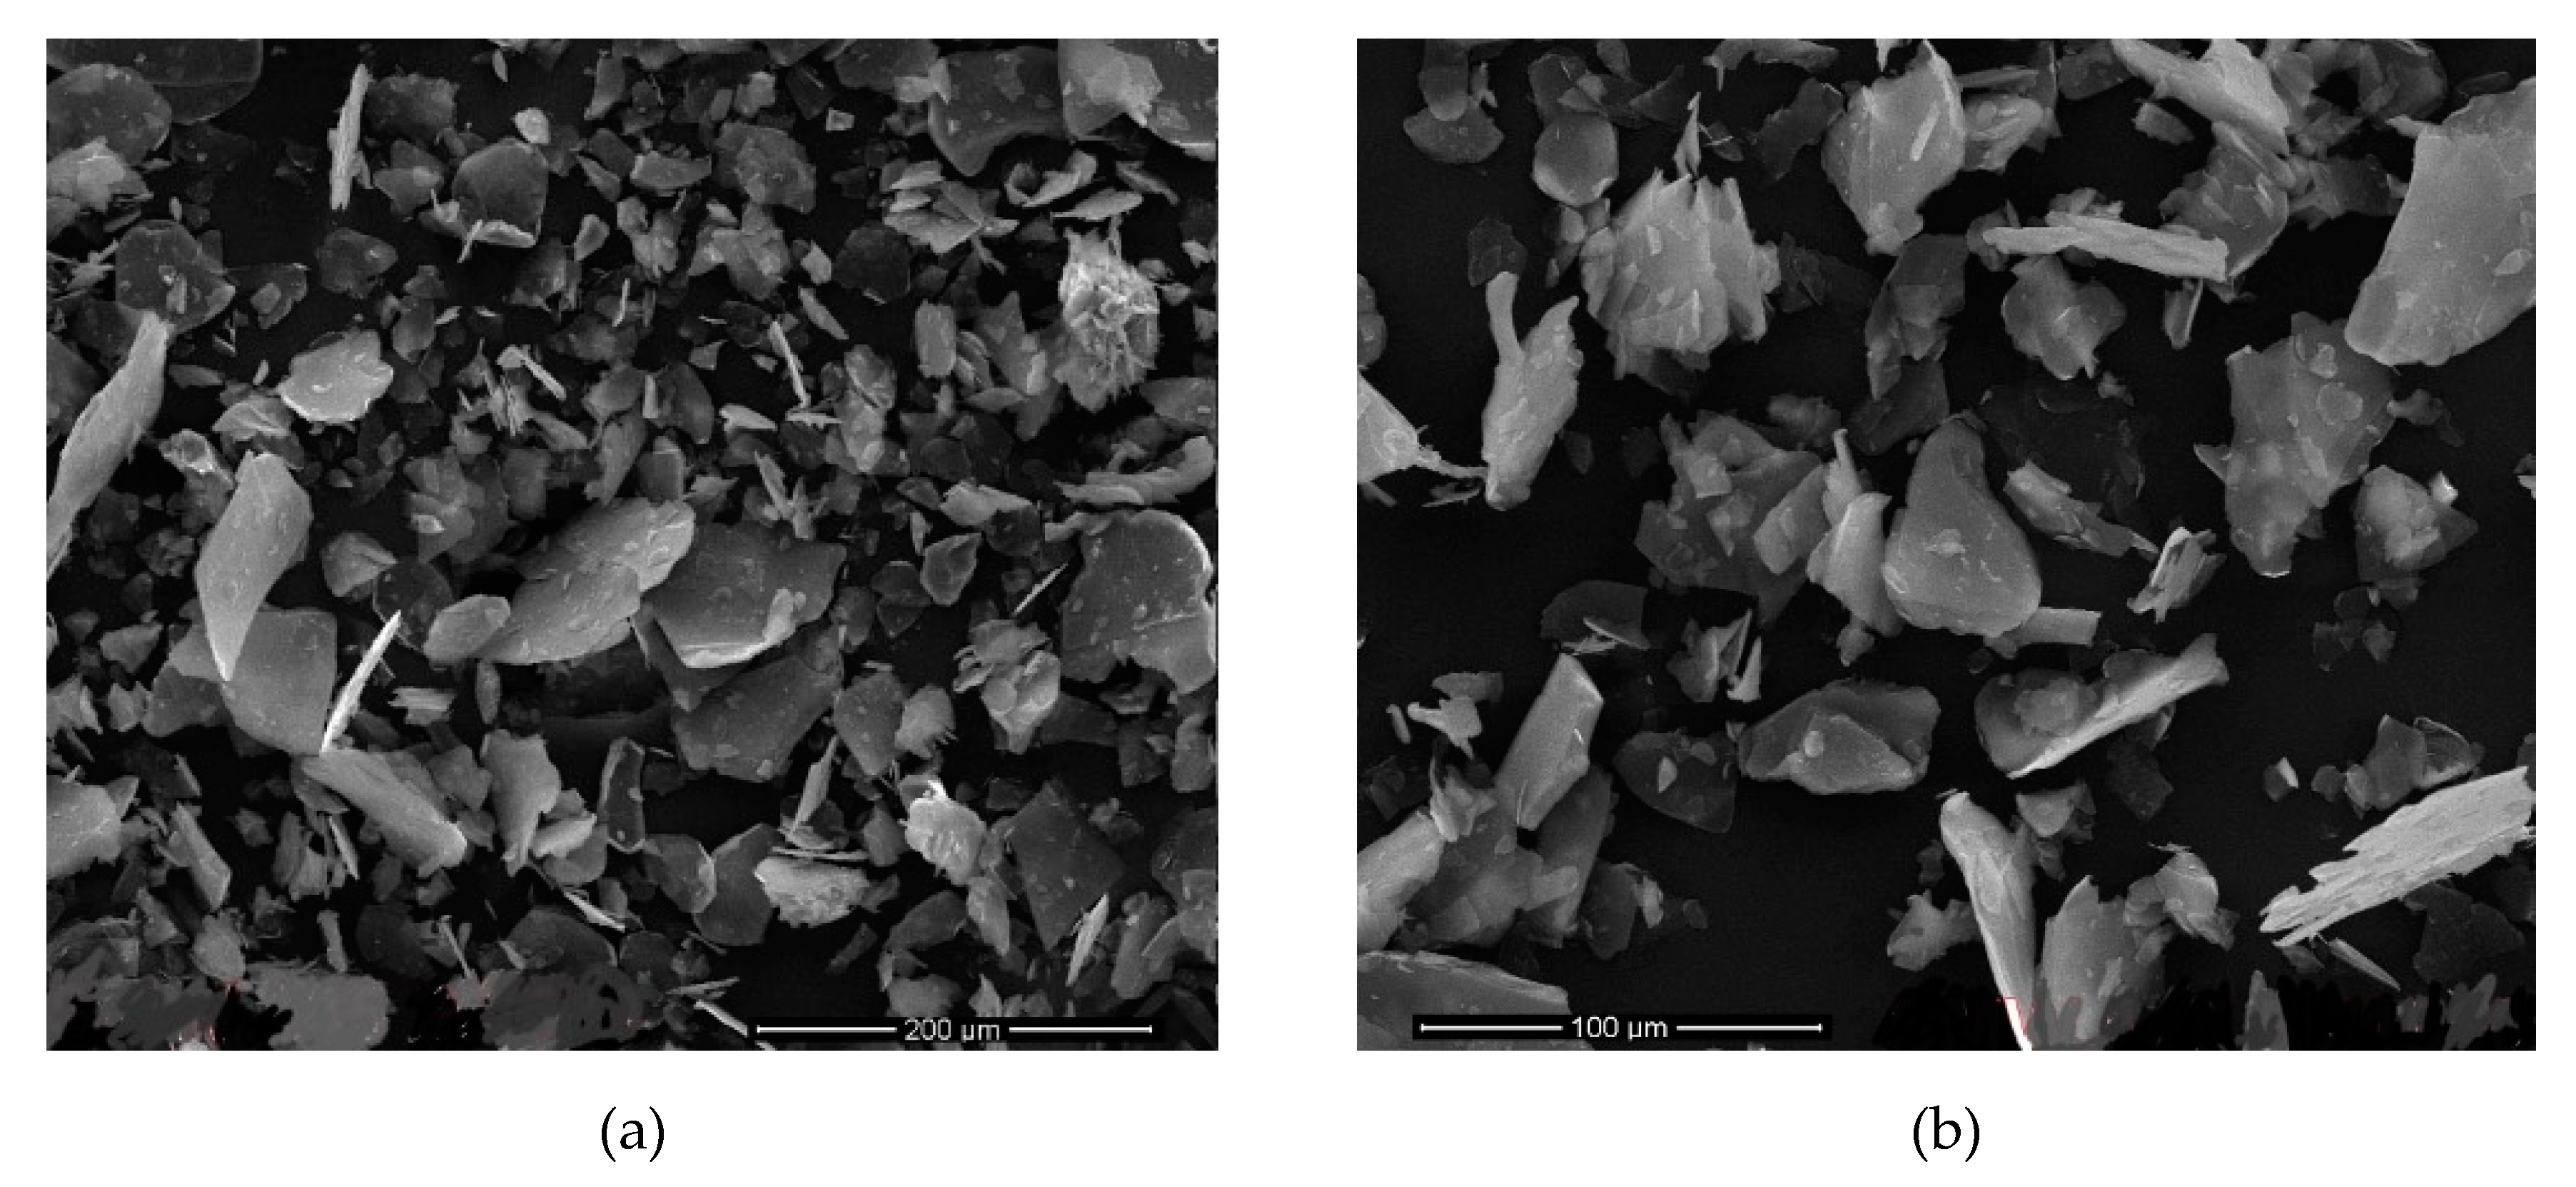
Figure 15 shows the images of samples in
Table 5 that the sonication time was 9 h. It is clear from these images that the thickness of the mica particles is much higher. It is also evident in the images that these samples have thicker (
c) calculated values compared to others.
After all results were examined, it was determined that the most successful result belongs to the nanomica materials obtained in sonication time of 7, 9, 12 h of the M
X2C2 (
d = 51 Å) sample (
Table 9,
Figure 5,
Figure 6,
Figure 7 and
Figure 8). In addition, it was found that the M
x2c3 (
d = 48.5 Å,
Table 8,
Figure 9 and
Figure 10) sample with a sonication time of 9 h gave very good results.
In order to determine the best pigment performance for TiO
2 pigment coating of nanosized mica samples, D65 illuminant
L* (lightness) was measured on the best samples selected in CIE optical properties analysis by using angle variation spectrophotometer. Pearlescent Index, PI values were also given in
Table 10,
Table 11 and
Table 12 in order to simplify the comparison.
As expected, angle values increase with L* values decreasing in all samples. It was clear from the tables that MX2C2 (d = 51 Å) nanosized mica with the highest AR value (520) and 9 h sonication time, also has the highest PI and L* values.


