Geochemical Signature and Magnetic Fabric of Capinha Massif (Fundão, Central Portugal): Genesis, Emplacement and Relation with W–Sn Mineralizations


Abstract
1. Introduction
2. Regional Geology
3. Fundão–Serra da Estrela–Capinha Region
3.1. Geology and Field Relationships
- The Ordovician group is represented by Manteigas granite (482 ± 6 Ma, [27]), which is a biotite-rich, coarse-grained, porphyritic granodiorite with clear foliation with tonalites and monzonitic granites that constitute the composite and zoned pluton of Fundão [66,67,68]. Recent geochronological data yielded an Ordovician age (478.1 ± 0.5 Ma and 478.4 ± 0.5 Ma, respectively, for tonalite and monzogranite) for the Fundão pluton [69].
- The late-D3 group is represented by Peroviseu (on the east side of VMF) and Seia (on the west side of VMF), which comprise the Peroviseu–Seia granite (PS) and Castelo Branco granite (CB). The PS is biotite-rich, coarse- to very coarse-grained porphyritic granite. The distribution of K feldspar is generally random, although an E–W magma flow, marked by slightly oriented K feldspar, was recognized. These granites occasionally have some enclaves with granodioritic to tonalitic composition. CB is a complex zoned pluton; from the core to the periphery, it is composed of muscovite–biotite granite, biotite ± muscovite porphyritic granodiorite and muscovite–biotite granite.
- The late- to post-D3 group is represented by biotite-rich monzonitic granites (Belmonte–Covilhã granite). Belmonte–Covilhã (BC) is a biotite-rich, coarse-grained, porphyritic monzogranite and displays well-defined deformation patterns with oriented K feldspar megacrysts. The contacts between the BC and PS are, generally, gradual. On the other hand, the contact between the BC and the metasediments have an NE–SW trend and are characterized by the occurrence of mottled schists and hornfels due to the thermal metamorphism related to the BC emplacement.
- The post-D3 granite group is composed of two-mica leucogranites—Capinha (CG), Estrela, Fráguas, Atalaia and non-outcropping Panasqueira granite.
- ○
- CG is a muscovite > biotite, medium-grained, incipient porphyritic granite. CG occurs as a small circular circumscribed body exposed over an area of about 7 km2, intruding into the low-grade metamorphic Schist–Greywackes of SGC, ~15 km to the north–east of Fundão village (Figure 2). CG intrudes the contact between the PS granite and the SGC and cuts the foliations of the SGC. In the whole extension, the contacts with steeply dipping metasediments are sharp and nearly vertical, with no apparent structural deformations, suggesting that the granite was not forcibly emplaced. The textural characteristics of CG are homogeneous in the whole area, without any magmatic flow foliation or superimposed deformation.
- ○
- The two-mica leucogranite group is characterized by irregular bodies intruding in the BC, Fráguas (on the east side of VMF), Estrela (on the west side of VMF) and Atalaia (on the east side of VMF). The Estrela muscovite-rich granite is located at the highest point of the Portugal mainland (~2000 m high) in the Serra da Estrela mountain. Fráguas granite is irregular and elongated NW–SE, suggesting structural control of its emplacement. The dominant facies are composed by two-mica, medium-grained granites, although coarse-grained facies also occur. Fráguas granite exhibits a gradual petrographic zonation corresponding to the biotite-rich facies in the central part and muscovite-rich facies in the peripheries [70]. The Estrela and Fráguas granites occupy the dome areas of the BC biotite-rich porphyritic granite. Atalaia granite is a tourmaline–muscovite, medium-grained, porphyritic granite located in the north–eastern side of the Fundão pluton [66,68].
- ○
- In the Panasqueira area, where no granites outcrop, underground mining crosses a greisen cupula. Several authors [71,72,73,74,75,76,77,78,79] suggested that this greisen cupola is connected to a non-outcropping granite dome. Subsequent research surveys intercepted a two-mica fresh granite (with muscovite that is dominantly secondary in origin), which was dated in [80] to ca. 289 ± 4 Ma (whole-rock Rb–Sr) with a high 87Sr/86Sri ratio of 0.713.
3.2. Regional Brittle Deformation
- The 60° N–70° E fracturing system is well marked in the contact between PS and BC biotite-rich porphyritic granites and metasedimentary rocks.
- The 100° N–110° E fractures control the emplacement of the PS granites recorded in the E–W magmatic flow by the K feldspar orientation and its reactivation during the late-Variscan stages, which promoted the emplacement of Sn aplite-pegmatites and W mineralized quartz veins.
- The 30° N–40° E and its conjugate 150° N–160° E are well represented in the study area by the regional quartz veins with post-Variscan U mineralizations.
3.3. Mineralizations
4. Materials and Methods
4.1. Sampling Procedure
4.2. Petrography and Microstructures
4.3. Whole Rock Geochemistry
4.4. Anisotropy of Magnetic Susceptibility
4.5. Fracturing
5. Results
5.1. Main Petrographic and Mineralogic Features
5.1.1. Petrography and Microstructural Study
5.1.2. Magnetic Mineralogy
5.1.3. Capinha Granite: Geochemical Characterization
5.1.4. Comparative Study between Capinha, Peroviseu–Seia, Belmonte–Covilhã and Fráguas Granites
Major and Trace Elements
Rare Earth Elements
5.2. Anisotropy of Magnetic Susceptibility
5.2.1. Scalar Parameters
Bulk Magnetic Susceptibility (Km)
Paramagnetic Anisotropy (Ppara)
Magnetic Ellipsoid Shape Parameter (T)
5.2.2. Directional Magnetic Parameters
5.3. Fracturing
5.3.1. Outcrop Fracturing
5.3.2. Microfracturing
6. Discussion
6.1. Sequence of Magmatic Episodes
6.2. Interpretation of the Scalar Magnetic Parameters of Capinha Granite
6.3. Magnetic/Magmatic Fabric in Capinha: Shape and Possible Feeder Zone
6.4. Integration of the Capinha Magnetic/Magmatic Fabric in Previous Studies
6.5. The Fault System in the FSEC Region
6.6. Tectonic Constraints and Emplacement Mechanism
6.7. FSEC Granites and Their Metallogenic Implications
- W quartz veins in the contact SGC/Peroviseu–Seia granite near Capinha (e.g., Peroviseu, Mata, Ribeiro do Salgueiro, Caverna and Covões);
- W quartz veins in Capinha granite (e.g., Castelo Velho);
- W (Sn) quartz veins in the Peroviseu–Seia granite near Salgueiro (e.g., Pombal Lameiros, Veias and Malta).
6.8. Capinha Granite: Syn- and Post-Emplacement Model
7. Conclusions
- Studying the geochemical behaviors of FSEC granites allowed us to identify distinct and independent differentiation trends, namely, Peroviseu–Seia (PS), Belmonte–Covilhã (BC), Fráguas and Capinha. The Fráguas and Capinha are more evolved than BC and BC.
- Capinha granite has a homogeneous spatial distribution in Km, displaying values below 73.4 µSI, thereby indicating that magnetic mineralogy is dominated by paramagnetic minerals such as biotite, which is classified as an ilmenite-type granite. The generally low magnetic anisotropy in the whole area is typical of post-Variscan muscovite–biotite granites, where Ppara corresponds to a weak orientation of the fabric and also a low degree of deformation. The highest values were found in the peripheries, especially in the north–eastern direction, corresponding to the late-deformation patterns caused by the solidification of magma against the host rocks. The magnetic ellipsoid shapes are, in general, oblate, indicating a planar fabric, which may indicate the roof of the granite suit. Prolate shapes were found in the north–eastern zone, fitting the zones with high Ppara.
- The granite displays NE–SW striking foliations associated with NNE–SSW magnetic lineations parallel to the long axis of the pluton, showing that the acquisition of the magnetic fabric resulted from magma stretching parallel to the magma flow (from NNE to SSW), at the end of the last ductile Variscan deformation phase (D3). This enhanced the role of 155° N ± 15° E and 25° N ± 25° E structures on the magma’s ascent and emplacement. The general sub-horizontal magnetic fabric suggests that the outcrop is the roof of the suit. Vertical foliations associated with vertical lineations in the north–eastern boundary suggest the location of a deep feeder zone.
- The ascent of the magma in the dyke structures at high structural levels, as well as the lateral spread of the magma in the contrasting rheologic boundary, allowed the construction of an asymmetric tongue-shaped laccolith, with its root located in the north–eastern zone.
- After complete consolidation, the late-Variscan faulting indicates the reactivation of inherited structures, and the first brittle deformation was recorded in the FIP, with the main compression being oriented NE–SW. After the rotation of the maximum compression to NNW–SSE, during Alpine orogeny, a second stage of brittle deformation was registered, developing fractures in the granite (generally NE–SW (20° N–50° E) oriented).
- The FSEC region is characterized by several metallic occurrences, and the spatial distribution of the distinct types of mineralizations is not accidental. The Sn mineralizations in pegmatites and quartz veins with cassiterite are hosted by PS and BC granites, but only those near Fráguas granite, suggesting that the mineralization source is related to the Fráguas (Sn ~62 ppm) granite. Therefore, the primary W and W–Sn deposits are the result of hydrothermal systems commonly related to magmatic rocks with a granitic composition and are developed in apical high-level portions of granites, such as Capinha and Panasqueira.
Author Contributions
Funding
Acknowledgments
Conflicts of Interest
Appendix A

| ID | Latitude | Longitude | Elevation (Above Sea) | Methods Applied | Samples Collected |
|---|---|---|---|---|---|
| 1 | 40°13′23.520″ N | 7°21′41.760″ W | 585 m | Petrography, microstructures, whole rock geochemistry, anisotropy of magnetic susceptibility and fluid inclusion planes | 4 oriented cores |
| 2 | 40°13′17.400″ N | 7°21′48.240″ W | 600 m | Anisotropy of magnetic susceptibility | 6 oriented cores |
| 3 | 40°13′28.200″ N | 7°22′5.520″ W | 570 m | Anisotropy of magnetic susceptibility | 6 oriented cores |
| 4 | 40°13′10.200″ N | 7°22′13.080″ W | 598 m | Petrography, microstructures, whole rock geochemistry, anisotropy of magnetic susceptibility and fluid inclusion planes | 5 oriented cores |
| 5 | 40°13′24.960″ N | 7°22′19.920″ W | 577 m | Anisotropy of magnetic susceptibility | 5 oriented cores |
| 6 | 40°13′7.680″ N | 7°22′33.960″ W | 541 m | Anisotropy of magnetic susceptibility | 4 oriented cores |
| 7 | 40°12′50.639″ N | 7°22′42.637″ W | 518 m | Anisotropy of magnetic susceptibility | 7 oriented cores |
| 8 | 40°12′41.040″ N | 7°22′34.680″ W | 529 m | Anisotropy of magnetic susceptibility | 4 oriented cores |
| 9 | 40°12′22.680″ N | 7°22′11.640″ W | 519 m | Anisotropy of magnetic susceptibility | 5 oriented cores |
| 10 | 40°12′38.160″ N | 7°21′52.920″ W | 564 m | Petrography, microstructures, anisotropy of magnetic susceptibility and fluid inclusion planes | 5 oriented cores |
| 11 | 40°13′4.071″ N | 7°21′32.912″ W | 546 m | Petrography, microstructures, whole rock geochemistry, anisotropy of magnetic susceptibility and fluid inclusion planes | 5 oriented cores |
| 12 | 40°12′52.001″ N | 7°21′46.878″ W | 556 m | Anisotropy of magnetic susceptibility | 5 oriented cores |
| 13 | 40°12′30.841″ N | 7°21′36.885″ W | 568 m | Anisotropy of magnetic susceptibility | 4 oriented cores |
| 14 | 40°12′36.830″ N | 7°21′55.803″ W | 567 m | Anisotropy of magnetic susceptibility | 4 oriented cores |
| 15 | 40°12′21.098″ N | 7°21′59.448″ W | 533 m | Petrography, microstructures, whole rock geochemistry, anisotropy of magnetic susceptibility and fluid inclusion planes | 5 oriented cores |
| 16 | 40°12′6.106″ N | 7°22′7.633″ W | 516 m | Anisotropy of magnetic susceptibility | 5 oriented cores |
| 17 | 40°12′33.197″ N | 7°21′5.113″ W | 497 m | Petrography, microstructures, anisotropy of magnetic susceptibility and fluid inclusion planes | 5 oriented cores |
| 18 | 40°11′55.571″ N | 7°21′51.777″ W | 474 m | Petrography, microstructures, whole rock geochemistry, anisotropy of magnetic susceptibility and fluid inclusion planes | 5 oriented cores |
| 19 | 40°12′30.487″ N | 7°22′40.665″ W | 506 m | Petrography, microstructures, whole rock geochemistry, anisotropy of magnetic susceptibility and fluid inclusion planes | 5 oriented cores |
| 20 | 40°12′15.987″ N | 7°22′19.970″ W | 499 m | Anisotropy of magnetic susceptibility | 5 oriented cores |
| 21 | 40°13′12.7452″ N | 7°21′42.768″ W | 586 m | Anisotropy of magnetic susceptibility | 5 oriented cores |
| 22 | 40°13′1.92″ N | 7°22′3.774″ W | 673 m | Anisotropy of magnetic susceptibility | 5 oriented cores |
| 23 | 40°12′50.1732″ N | 7°22′13.098″ W | 655 m | Anisotropy of magnetic susceptibility | 4 oriented cores |
| 24 | 40°12′32.3496″ N | 7°22′32.0952″ W | 571 m | Anisotropy of magnetic susceptibility | 5 oriented cores |
| 25 | 40°12′44.514″ N | 7°22′16.3416″ W | 626 m | Anisotropy of magnetic susceptibility | 5 oriented cores |
| 26 | 40°12′54.9864″ N | 7°22′25.2372″ W | 606 m | Anisotropy of magnetic susceptibility | 5 oriented cores |
| 27 | 40°13′9.9372″ N | 7°22′38.0388″ W | 523 m | AMS Anisotropy of magnetic susceptibility | 5 oriented cores |
| 28 | 40°12′47.7612″ N | 7°21′2.3796″ W | 482 m | Anisotropy of magnetic susceptibility | 5 oriented cores |
| 29 | 40°12′36.234″ N | 7°21′8.01″ W | 500 m | Anisotropy of magnetic susceptibility | 6 oriented cores |
| 30 | 40°12′52.7947″ N | 7°21′43.3656″ W | 545 m | Anisotropy of magnetic susceptibility | 6oriented cores |
| Q1 and Q2 | 40°12′21.91″ N | 7°21′20.18″ W | 481 m | Whole rock geochemistry | About 20 kg |

References
- Bouchez, J.L.; Gleizes, G.; Djouadi, M.T.; Rochette, P. Microstructure and magnetic susceptibility applied to emplacement kinematics of granites: The example of the Foix pluton (French Pyrenees). Tectonophysics 1990, 184, 157–171. [Google Scholar] [CrossRef]
- Gleizes, G.; Dédélec, A.; Bouchez, J.L. Magnetic susceptibility of Mont-Louis Andorra Ilmenite-Type granite (Pyrenees): A New Tool for the Petrographic Characterization and Regional Mapping of Zoned Granite Plutons. J. Geophys Res. 1993, 98, 4317–4331. [Google Scholar] [CrossRef]
- Paterson, S.R.; Fowler, T.K.; Schmidt, K.L.; Yoshinobu, A.S.; Yuan, E.S.; Miller, R.B. Interpreting magmatic fabric patterns in plutons. Lithos 1998, 44, 53–82. [Google Scholar] [CrossRef]
- Park, A.F. Granites and mineralization. In Petrology; Encyclopedia of Earth Science; Springer: Boston, MA, USA, 1989. [Google Scholar] [CrossRef]
- Sial, A.N.; Bettencourt, J.S.; De Campos, C.P.; Ferreira, V.P. Granite-related ore deposits: An introduction. J. Geol. Soc. Lond. Spec. Publ. 2011, 350, 1–5. [Google Scholar] [CrossRef]
- Pirajno, F. Hydrothermal Processes and Mineral Systems, 1st ed.; Springer: Dordrecht, The Netherlands, 2009. [Google Scholar] [CrossRef]
- Hrouda, F. Magnetic Anisotropy of rocks and its application in geology and geophysics. Geophys Surv. 1982, 5, 37–82. [Google Scholar] [CrossRef]
- Tarling, D.H.; Hrouda, F. The Magnetic Anisotropy of Rocks, 1st ed.; Chapman and Hall: London, UK, 1993; ISBN 978-0-412-49880-0. [Google Scholar]
- Knight, M.D.; Walker, G.P.L. Magma flow directions in dikes of the Koolau complex, Oahu, determined from magnetic fabric studies. J. Geophys Res. 1988, 93, 4301–4319. [Google Scholar] [CrossRef]
- Bouchez, J.L. Granite is never isotropic: An introduction to AMS studies of granitic rocks. In Granite: From Segregation of Melt to Emplacement Fabrics; Bouchez, J.L., Hutton, D.H.W., Stephens, W.E., Eds.; Kluwer Academic Publishers: Dordrecht, The Netherlands, 1997; pp. 95–112. [Google Scholar]
- Pitcher, W.S. The nature, ascent and emplacement of granitic magmas. J. Geol. Soc. Lond. 1979, 136, 627–662. [Google Scholar] [CrossRef]
- Borradaile, G.J. Magnetic susceptibility, petrofabrics and strain. Tectonophysics 1988, 156, 1–20. [Google Scholar] [CrossRef]
- Bouchez, J.L.; Diot, H. Nested granites in question: Contrasted emplacement kinematics of independent magmas in the Zaër pluton, Morocco. Geology 1990, 18, 966–969. [Google Scholar] [CrossRef]
- Borradaile, G.J.; Jackson, M. Anisotropy of magnetic susceptibility (AMS): Magnetic petrofabrics of deformed rocks. J. Geol. Soc. Lond. 2004, 238, 299–360, Special Publications. [Google Scholar] [CrossRef]
- Borradaile, G.J.; Jackson, M. Structural geology, petrofabrics and magnetic fabrics (AMS, AARM, AIRM). J. Struct. Geol. 2010, 32, 1519–1551. [Google Scholar] [CrossRef]
- Ishihara, S. Major molybdenum deposits and related granitic rocks in Japan. Geol. Surv. Jpn. Rept. 1971, 239, 1–178. [Google Scholar]
- Ishihara, S. The magnetite-series and ilmenite-series granitic rocks. Min. Geol. 1977, 27, 293–305. [Google Scholar] [CrossRef]
- Rochette, P. Magnetic susceptibility of the rock matrix related to magnetic fabric studies. J. Struct. Geol. 1987, 9, 1243–1257. [Google Scholar] [CrossRef]
- Pueyo-Anchuela, O.; Casas-Sainz, A.M.; Pueyo, E.P.; Juan, A.P.; Imaz, A.G. Analysis of the ferromagnetic contribution to the susceptibility by low field and high field methods in sedimentary rocks of the Southern Pyrenees and Northern Ebro foreland basin (Spain). Terra Nova 2013, 25, 307–314. [Google Scholar] [CrossRef]
- Nédélec, A.; Bouchez, J.L. Granites: Petrology, Structure, Geological Setting, and Metallogeny, English Translation; Oxford University Press: Oxford, UK, 2015; ISBN 978-0-19-870561-1. [Google Scholar]
- Takagi, T. Origin of magnetite- and ilmenite-series granitic rocks in the Japan arc. Am. J. Sci. 2004, 304, 169–204. [Google Scholar] [CrossRef]
- Bea, F.; Montero, P.; Molina, J.F. Mafic Precursors, Peraluminous Granitoids, and Late Lamprophyres in the Avila Batholith: A Model for the Generation of Variscan Batholiths in Iberia. J. Geol. 1999, 107, 399–419. [Google Scholar] [CrossRef]
- Dias, G.; Leterrier, J. The genesisof felsic-mafic plutonic associations: A Sr and Nd isotopic study of the Hercynian Braga Granitoid Massif (Northern Portugal). Lithos 1994, 32, 207–223. [Google Scholar] [CrossRef]
- Castro, A.; Patiño Douce, A.E.; Corretgé, L.G.; de la Rosa, J.D.; El-Biad, M.; El-Hmidi, H. Origin of peraluminous granites and granodiorites, Iberian massif, Spain: An experimental test of granite petrogenesis. Contrib. Mineral. Petrol. 1999, 135, 255–276. [Google Scholar] [CrossRef]
- Dias, G.; Simões, P.P.; Ferreira, N.; Leterrier, J. Mantle and Crustal Sources in the Genesis of Late-Hercynian Granitoids (NW Portugal):Geochemical and Sr-Nd Isotopic Constraints. Gondwana Res. 2002, 5, 287–305. [Google Scholar] [CrossRef]
- Janousek, V.; Braithwaiteb, C.J.R.; Bowesb, D.R.; Gerdesc, A. Magma-mixing in the genesis of Hercynian calc-alkaline granitoids: An integrated petrographic and geochemical study of the Sázava intrusion, Central Bohemian Pluton, Czech Republic. Lithos 2004, 78, 67–99. [Google Scholar] [CrossRef]
- Neiva, A.M.R.; Williams, I.S.; Ramos, J.M.F.; Gomes, M.E.P.; Silva, M.M.V.G.; Antunes, I.M.H.R. Geochemical and isotopic constraints on the petrogenesis of Early Ordovician granodiorite and Variscan two-mica granites from the Gouveia area, central Portugal. Lithos 2009, 111, 186–202. [Google Scholar] [CrossRef]
- Neiva, A.M.R.; Silva, P.B.; Corfu, F.; Ramos, J.M.F. Sequential melting and fractional crystallization: Granites from Guarda-Sabugal area, central Portugal. Chem. Der Erde 2011, 71, 227–245. [Google Scholar] [CrossRef]
- Villaseca, C.; Bellido, F.; Pérez-Soba, C.; Billström, K. Multiple crustal sources for post-tectonic I-type granites in the Hercynian Iberian Belt. Miner. Petrol. 2009, 96, 197–211. [Google Scholar] [CrossRef]
- Martins, H.C.B.; Sant’Ovaia, H.; Noronha, F. Late-Variscan emplacement and genesis of the Vieira do Minho composite pluton, Central Iberian Zone: Constraints from U–Pb zircon geochronology, AMS data and Sr–Nd–O isotope geochemistry. Lithos 2013, 162–163, 221–235. [Google Scholar] [CrossRef]
- Costa, M.M.; Neira, A.M.R.; Azevedo, M.R.; Corfu, F. Distinct sources for syntectonic Variscan granitoids: Insights from the Aguiar da Beira region, Central Portugal. Lithos 2014, 196–197, 83–98. [Google Scholar] [CrossRef]
- Pereira, M.F.; Díez Fernández, R.; Gama, C.; Hofmann, M.; Gärtner, A.; Linnemann, U. S-type granite generation and emplacement during a regional switch from extensional to contractional deformation (Central Iberian Zone, Iberian autochthonous domain, Variscan Orogeny). Int. J. Earth Sci. 2018, 107, 251–267. [Google Scholar] [CrossRef]
- Neiva, J.M.C. Jazigos portugueses de volframite e cassiterite. Com. Serv. Geol. Portugal 1944, 25, 1–251. [Google Scholar]
- Thadeu, D. Carta Mineira de Portugal. Notícia Explicativa. Ser. Geol. Port. 1965, 1–46. [Google Scholar]
- Schermerhorn, L.J.G. Framework and devolution of Hercynian mineralization in the Iberian Meseta. Leidse Geol. Medelelingen 1981, 52, 23–56. [Google Scholar]
- Neiva, A.M.R. Portuguese Granites Associated with Sn-W and Au Mineralizations. Bull. Geol. Soc. Finl. 2002, 74, 79–101. [Google Scholar] [CrossRef]
- Noronha, F.; Ribeiro, M.A.; Almeida, A.; Dória, A.; Guedes, A.; Lima, A.; Martins, H.C.B.; Sant’Ovaia, H.; Nogueira, P.; Martins, T.; et al. Jazigos filonianos hidrotermais e aplito-pegmatíticos espacialmente associados a granitos (norte de Portugal). In Geologia de Portugal; Dias, R., Araújo, A., Terrinha, P., Kullberg, J.C., Eds.; -Geologia Pré-mesozóica de Portugal: Escolar Editora, Évora, 2006; Volume 2, pp. 403–438. ISBN 972-778-094-6. [Google Scholar]
- Mateus, A.; Noronha, F. Sistemas mineralizantes epigenéticos na Zona Centro Ibérica; expressão da estruturação orogénica meso—A tardivarisca. In Ciências Geológicas: Ensino, Investigação e sua História; Cotelo Neiva, J.M., Ribeiro, A., Mendes Victor, L., Noronha, F., Magalhães Ramalho, M., Eds.; Geologia Aplicada, Chapter 1; Associação Portuguesa de Geólogos/Sociedade Geológica de Portugal: Lisboa, Portugal, 2010; Volume 2, pp. 47–61. ISBN 978-989-96669-1-7. [Google Scholar]
- Matte, P. Tectonics and Plate Tectonics Model for the Variscan Belt of Europe. Tectonophysics 1986, 126, 329–374. [Google Scholar] [CrossRef]
- Ribeiro, A.; Iglésias, M.; Ribeiro, M.L.; Pereira, E. Modéle géodynamique des Hercynides Ibériques. Mem. Serv. Geol. Port. 1983, 69, 291–293. [Google Scholar]
- Ribeiro, A.; Quesada, C.; Dallmeyer, R.D. Geodynamic evolution of the Iberian Massif. In Pre-Mesozoic Geology of Iberia; Dallmeyer, R.D., Martínez Garcia, E., Eds.; Springer-Verlag: Berlin/Heidelberg, Germany, 1990; pp. 399–410. [Google Scholar]
- Quesada, C. Geological constraints on the Paleozoic tectonic evolution of tectonostratigraphic terranes in the Iberian Massif. Tectonophysics 1991, 185, 225–245. [Google Scholar] [CrossRef]
- Dias, R.; Ribeiro, A.; Romão, J.; Coke, C.; Moreira, N. A review of the arcuate structures in the Iberian Variscides; constraints and genetic models. Tectonophysics 2016, 681, 170–194. [Google Scholar] [CrossRef]
- Ribeiro, A. Contribution à l’étude de Traás-os-Montes Oriental. Mem. Serv. Geol Port. 1974, 24. [Google Scholar]
- Noronha, F.; Ramos, J.M.F.; Rebelo, J.A.; Ribeiro, A.; Ribeiro, M.L. Essai de corrélation des phases de déformation hercynienne dans le Nord-Ouest Péninsulaire. Bol. Soc. Geol. Port. 1979, 21, 227–237. [Google Scholar]
- Dias, R.; Ribeiro, A. The Ibero-Armorican Arc: A collision effect against an irregular continent? Tectonophysics 1995, 246, 113–128. [Google Scholar] [CrossRef]
- Julivert, M.; Fontboté, J.M.; Ribeiro, A.; Conde, L. Mapa Tectónico de la Península Ibérica y Baleares. Escala 1: 1,000,000. Memoria Explicativa. Inst. Geol. Min. España 1974, 113. [Google Scholar]
- Farias, P.; Gallastegui, G.; Gonzalez Lodeiro, F.; Marquinez, J.; Martin Parra, L.M.; Martínez Catalan, J.R.; de Pablo Maciaá, J.G.; Rodriguez Fernandez, L.R. Aportaciones al Conocimiento de la Litoestratigrafia y Estructura de Galícia Central. IX Reunião de Geologia do Oeste Peninsular, Porto, 1985; Memórias Museu Laboratório Mineralogia Geologia da Faculdade Ciências Universidade Porto: Porto, Portugal, 1987; Volume 1, pp. 411–431. [Google Scholar]
- Lagarde, J.L.; Capdevila, R. Granites and continental collision: Examples from Carboniferous granitoids in the Hercynian Range of Western Europe. Bull. Soc. Géol Fr. 1992, 163, 597–610. [Google Scholar]
- Iglésias, M.; Choukroune, P. Shear zones in the Iberian Arc. J. Struct. Geol. 1980, 2, 63–68. [Google Scholar] [CrossRef]
- Díez Fernaández, R.; Pereira, M.F. Extensional orogenic collapse captured by strike-slip tectonics: Constraints from structural geology and U-Pb geochronology of the Pinhel shear zone (Variscan orogen, Iberian Massif). Tectonophysics 2016, 691, 290–310. [Google Scholar] [CrossRef]
- Bea, F.; Pesquera, A.; Montero, P.; Torres-Ruiz, J.; Gil-Crespo, P.P. Tourmaline 40Ar/39Ar chronology of tourmaline-rich rocks from Central Iberia dates the main Variscan deformation phases. Geol. Acta 2009, 7, 399–412. [Google Scholar] [CrossRef]
- Scarrow, J.H.; Molina, J.F.; Bea, F.; Montero, P.; Vaughan, A.P.M. Lamprophyre dikes as tectonic markers of late orogenic transtension timing and kinematics: A case study from the Central Iberian Zone. Tectonics 2011, 30, TC4007. [Google Scholar] [CrossRef]
- Arthaud, F.; Matte, P.H. Les décrochements tardi hercyniens du Sud-Ouest del’Europe. Géométrie et essai de reconstitution des conditions de la déformation. Tectonophysics 1975, 25, 139–171. [Google Scholar] [CrossRef]
- Ribeiro, A.; Antunes, M.T.; Ferreira, M.P.; Rocha, R.B.; Soares, A.F.; Zbyszewski, G.; Almeida, F.M.; Carvalho, D.; Monteiro, J.H. Introdution à la géologie générale du Portugal; Mem Serv Geol Portugal: Lisbon, Portugal, 1979. [Google Scholar]
- Pereira, E.; Ribeiro, A.; Meireles, C. Cisalhamentos hercínicos e controlo das mineralizações de Sn-W, Au e U na Zona Centro-Ibérica, em Portugal. Cuad. Lab. Xeolo Laxe 1993, 18, 89–119. [Google Scholar]
- Marques, F.O.; Mateus, A.; Tassinari, C. The Late-Variscan fault network in central-northern Portugal (NW Iberia): A re-evaluation. Tectonophysics 2002, 359, 255–270. [Google Scholar] [CrossRef]
- Ferreira, N.; Iglésias, M.; Noronha, F.; Pereira, E.; Ribeiro, A.; Ribeiro, M.L. Granitóides da Zona Centro Ibérica e seu enquadramento geodinêmico. In Geología de los Granitoides y Rocas Asociadas del Macizo Hesperico; Bea, F., Carnicero, A., Gonzalo, J., Lopez Plaza, M., Rodriguez Alonso, M., Eds.; Libro de Homenaje a L.C. García de Figuerola; Editorial Rueda: Madrid, Spain, 1987; pp. 37–51. [Google Scholar]
- Dias, G.; Noronha, F.; Ferreira, N. Variscan plutonism in the Central Iberian zone (Northern Portugal). Eurogranites 2000. Field meeting, Guidebook. [Google Scholar]
- Martins, H.C.B. Geoquímica e petrogénese de granitóides tarditectónicos e pós-tectónicos. Implicações metalogénicas. Ph.D. Thesis, University of Traás-os-Montes e Alto Douro, Vila Real, Portugal, 1998. [Google Scholar]
- Neiva, A.M.R.; Williams, I.S.; Lima, S.M.; Teixeira, R. U–Pb and 39Ar/40Ar data constraining the ages of the source, emplacement and recrystallization/cooling events from late- to post-D3 Variscan granites of the Gouveia area, central Portugal. Lithos 2012, 153, 72–83. [Google Scholar] [CrossRef]
- Sousa, M.B. Litostratigrafia e estrutura do “Complexo Xisto-Grauvaáquico ante-ordovícico”—Grupo do Douro (Nordeste de Portugal). Ph.D. Thesis, University of Coimbra, Coimbra, Portugal, 1982. [Google Scholar]
- Sequeira, A.J.D. O Grupo das Beiras (Complexo Xisto-Grauvaáquico) entre Zebreira e Penamacor e a sua relação com o Ordovícico; Resumos do III Congresso Nacional de Geologia: Coimbra, Portugal, 1991. [Google Scholar]
- Sequeira, A.J.D.; Sousa, M.B. O Grupo das Beiras (Complexo Xisto-Grauvaáquico) da região de Coimbra-Lousã. Memórias e Notícias. Publ. Mus. Lab. Mineral. Geol. Univ. Coimbra 1991, 112, 1–13. [Google Scholar]
- Meireles, C.A.P.; Sequeira, A.J.S.; Castro, P.; Ferreira, N. New data on the lithostratigraphy of Beiras Group (Schist Greywacke Complex) in the region of Góis-Arganil-Pampilhosa da Serra (Central Portugal). Cuad Lab Xeolo Laxe 2013, 37, 105–124. [Google Scholar]
- Busink, R.W. Geochemistry of the Panasqueira Tungsten-Tin Deposit, Portugal. Ph.D. Thesis, University of Utrecht (Rijksuniversiteit Utrecht), Utrecht, The Netherlands, 1951. [Google Scholar]
- Derré, C.; Lécolle, M. Contrôles structuraux de la mise en place des granites et des minéralisations de la zone de Fundão-Escarigo (Beira Baixa, Portugal). In IX Reunião sobre a Geologia do Oeste Peninsular; Pub Mus Lab Mineral e Geol, Fac Ciências do Porto: Porto, Portugal, 1985. [Google Scholar]
- Portugal Ferreira, M.; Alves, E.I.; Regêncio Macedo, C.A. A zonalidade interna de um plutonito: Estruturas condicionantes e idades de evolução (plutonite do Fundão, Portugal Central). Mem. Not. Publ. Mus. Lab. Miner. Geol. Univ. Coimbra 1985, 99, 167–186. [Google Scholar]
- Antunes, I.M.H.R.; Neiva, A.M.R.; Corfu, F. U-Pb Early Ordovician emplacement ages and K-Ar Variscan recrystallization ages of the Fundão granitic pluton, central Portugal. In Proceedings of the European Mineralogical Conference, Frankfurt, Germany, 24–28 September 2012; 2012; Volume 1. EMC2012-747. [Google Scholar]
- Farinha Ramos, J. Mineralizações de metais raros de Seixo Amarelo-Gonçalo. Contribuição para o seu conhecimento. Ph.D. Thesis, University of Lisbon, Lisbon, Portugal, 1998. [Google Scholar]
- Thadeu, D. Geologia do Couto Mineiro da Panasqueira. Com. Serv. Geol. Port. 1951, 32, 5–64. [Google Scholar]
- Bloot, C.; Wolf, L.C. Geological features of the Panasqueira tin-tungsten ore- ocurrence (Portugal). Bol. Soc. Geol. Port. 1953, 11, 2–75. [Google Scholar]
- Clark, A.H. Preliminary study of the temperatures and confining pressures of granite emplacement and mineralization, Panasqueira, Portugal. Trans. Inst. Min. Metall. 1964, 73, 813–824. [Google Scholar]
- Conde, L.N.; Pereira, V.; Ribeiro, A.; Thadeu, D. Jazigos Hipogénicos de Estanho e volfrêmio. I Congresso Hispano-Luso-Americano de Geologia Económica. Direção Geral de Minas e Serviços Geológico. Lisboa 1971, 81. [Google Scholar]
- Kelly, W.C.; Rye, R.O. Geologic, fluid inclusion, and stable isotope studies of the tin-tungsten deposits of Panasqueira, Portugal. Econ. Geol. 1979, 74, 1721–1822. [Google Scholar] [CrossRef]
- Marignac, C. Geologic, fluid inclusions, and stable isotope studies of the Tin- Tungsten Deposits of Panasqueira, Portugal—A discussion. Econ. Geol. 1982, 77, 1263–1266. [Google Scholar] [CrossRef]
- Neiva, A.M.R. Geochemistry of Greisenized Granites and Metasomatic Schist of Tungsten-Tin Deposits in Portugal. In Chemical Transport in Metasomatic Processes; Helgeson, H.C., Ed.; NATO ASI Series (Series C: Mathematical and Physical Sciences); Springer: Dordrecht, The Netherlands, 1987; Volume 218, pp. 681–699. [Google Scholar]
- Snee, L.W.; Sutter, F.; Kelly, W.C. Thermochronology of economic mineral deposits: Dating the stages of mineralization at Panasqueira, Portugal by high-precision 40Ar/39Ar age-spectrum techniques on muscovite. Econ. Geol. 1988, 83, 335–354. [Google Scholar] [CrossRef]
- Noronha, F.; Dória, A.; Dubessy, J.; Charoy, B. Characterization and timing of the different types of fuids present in the barren and ore-veins of the W-Sn deposit of Panasqueira, Central Portugal. Miner. Depos. 1992, 27, 72–79. [Google Scholar] [CrossRef]
- Priem, H.N.A.; den Tex, E. Tracing crustal evolution in the NW Iberian Peninsula through Rb-Sr and U-Pb systematics of Paleozoic granitoids: A review. Phys. Earth Planet. Int. 1984, 35, 121–130. [Google Scholar] [CrossRef]
- Ávila Martins, J.; Cândido de Medeiros, A.; Peres, A.M.; Teixeira, A.; Pilar, L.; Fernandes, A.P. Carta Geológica de Portugal na escala 1/50,000 da Folha 21-A (Sabugal). Serv. Geol. Port. 1964. [Google Scholar]
- Teixeira, C.; Martins, J.A.; Cândido de Medeiros, A.; Mesquita, L.P.; Peres, A.M.; Pilar, L. Carta Geológica de Portugal na escala 1/50,000. Notícia explicativa da folha 21-A (Sabugal). Serv. Geol. Port. 1965, 25. [Google Scholar]
- Neiva, A.M.R.; Ramos, J.M.F. Geochemistry of granitic aplite-pegmatite sills and petrogenetic links with granites, Guarda-Belmonte area, central Portugal. Eur. J. Miner. 2010, 22, 837–854. [Google Scholar] [CrossRef]
- Antunes, I.M.H.R.; Neiva, A.M.R.; Silva, M.M.V.G.; Corfu, F. Geochemistry of S-type granitic rocks from the reversely zoned Castelo Branco pluton (central Portugal). Lithos 2008, 103, 445–465. [Google Scholar] [CrossRef]
- Whitney, D.L.; Evans, B.W. Abbreviations for names of rock-forming minerals. Am. Miner. 2010, 95, 185–187. [Google Scholar] [CrossRef]
- Sistema de Informação de ocorrências e Recursos Minerais Portugueses (SIORMP). Available online: http://geoportal.lneg.pt/geoportal/egeo/bds/siorminp/ (accessed on 8 May 2020).
- Jelinek, V. Characterization of the magnetic fabric of rocks. Tectonophysics 1981, 79, 63–67. [Google Scholar] [CrossRef]
- Chadima, M.; Jelinek, V. Anisoft 4.2.—Anisotropy data browser. Contrib. Geophys. Geodesy 2009, 38, 41. [Google Scholar]
- Bouchez, J.L.; Bernier, S.; Rochette, P.; Guineberteau, B. Log des susceptibilités magnétiques et anisotropies de susceptibilité dans le granite de Beauvoir: Conséquences pour sa mise em place. Géologie De La Fr. Brgm 1987, 2–3, 223–232. [Google Scholar]
- Nogueira, P.; Noronha, F. PLANIF: Um Programa de Anaálise de imagens para o Estudo de Microestruturas das rochas. IV Congresso Nacional de Geologia, Porto, 1995; Borges, F.S., Marques, M.M., Eds.; Mem Mus Labor Miner Geol Factory Ciênc University: Porto, Portugal, 1995; Volume 4, pp. 379–382. [Google Scholar]
- Nogueira, P. Estudo de paleofluidos mineralizantes (Au, Ag, As) e sua migração. Aplicação a regiões auríferas do Norte de Portugal. Ph.D. Thesis, University of Porto, Porto, Portugal, 1997. [Google Scholar]
- Simmons, G.; Richter, D. Microcracks in rock. In The Physics and Chemistry of Minerals and Rocks; Strens, R.G.J., Ed.; Wiley: New York, NY, USA, 1976; pp. 105–137. [Google Scholar]
- Roedder, E. Fluid inclusion evidence on the genesis of ores in sedimentary and volcanic rocks. In Handbook of Stratabound and Stratiform Ore Deposits; Wolf, K.H., Ed.; Elsevier: Amsterdam, The Netherlands, 1976; Volume 2, pp. 67–110. [Google Scholar]
- Roedder, E. Fluid inclusions. Rev. Miner. 1984, 12, 644. [Google Scholar]
- Blenkinsop, T.G. Visualizing structural geology: From Excel to Google Earth. Comput Geosci. UK 2012, 45, 52–56. [Google Scholar] [CrossRef]
- Allmendinger, R.W.; Cardozo, N.C.; Fisher, D. Structural Geology Algorithms: Vectors & Tensors; Cambridge University Press: Cambridge, UK, 2013. [Google Scholar]
- Cardozo, N.; Allmendinger, R.W. Spherical projections with OSXStereonet. Comput. Geosci. 2013, 51, 193–205. [Google Scholar] [CrossRef]
- Paterson, S.R.; Ardill, K.; Vernon, R.; Zak, J. A review of mesoscopic magmatic structures and their potential for evaluating the hypersolidus evolution of intrusive complexes. J. Struct. Geol. 2019, 125, 134–147. [Google Scholar] [CrossRef]
- Stipp, M.; Stünitz, H.; Heilbronner, R.; Schmid, S.M. The eastern Tonale fault zone: A ‘natural laboratory’ for crystal plastic deformation of quartz over a temperature range from 250 to 700 °C. J. Struct. Geol. 2002, 24, 1861–1884. [Google Scholar] [CrossRef]
- Tukerian, K.K.; Wedepohl, K.H. Distribution of the Elements in some major units of the Earth’s Crust. Geol. Soc. Am. Bul. 1961, 72, 175–192. [Google Scholar]
- Blatt, H.; Tracy, R.J.; Owens, B. Petrology: Igneous, Sedimentary, and Metamorphic, 3rd ed.; W.H. Freeman: New York, NY, USA, 1996. [Google Scholar]
- Frost, B.R.; Barnes, C.G.; Collins, W.J.; Arculus, R.J.; Ellis, D.J.; Frost, C.D. A Geochemical Classification for Granitic Rocks. J. Petrol. 2001, 42, 2033–2048. [Google Scholar] [CrossRef]
- Miyashiro, A. Volcanic rock series in island arcs and active continental margins. Am. J. Sci. 1970, 274, 321–355. [Google Scholar] [CrossRef]
- Peacock, M.A. Classification of igneous rock series. J. Geol. 1931, 39, 54–67. [Google Scholar] [CrossRef]
- Shand, S.J. The Eruptive Rocks, 2nd ed.; John Wiley: New York, NY, USA, 1943; p. 444. [Google Scholar]
- De la Roche, H.; Leterrier, J.; Grandclaude, P.; Marchal, M. A classification of volcanic and plutonic rocks using R1,R2-diagrams and major element analysis—Its relationships with current nomenclature. Chem. Geol. 1980, 29, 183–210. [Google Scholar] [CrossRef]
- Debon, F.; Le Fort, P. A cationic classification of common plutonic rocks and their magmatic associations: Principles, method, applications. Bull. Min. 1988, 111, 493–510. [Google Scholar] [CrossRef]
- Batchelor, R.A.; Bowden, P. Petrogenetic interpretation of granitoid rock series using multicationic parameters. Chem. Geol. 1985, 48, 43–55. [Google Scholar] [CrossRef]
- Evensen, N.M.; Hamilton, P.J.; O’Nions, R.K. Rare-earth abundances in chondritic meteorites. Geochim Cosmochim. Acta 1978, 42, 1199–1212. [Google Scholar] [CrossRef]
- Wedepohl, K.H. The composition of the continental crust. Geochim. Cosmochim. Acta 1995, 59, 1217–1232. [Google Scholar] [CrossRef]
- Shaw, D.M. A review of K-Rb fractionation trends by covariance analysis. Geochim. Cosmochim. Acta 1968, 32, 573–601. [Google Scholar] [CrossRef]
- Ahrens, L.H.; Pinson, W.H.; Kearns, M. Association of rubidium and potassium and their abundance in common igneous rocks and meteorites. Geochim. Cosmochim. Acta 1952, 2, 229–242. [Google Scholar] [CrossRef]
- El Bouseily, A.M.; El Sokkary, A.A. The relation between Rb, Ba and Sr in granitic rocks. Chem. Geol. 1975, 16, 207–219. [Google Scholar] [CrossRef]
- Neiva, A.M.R.; Neiva, J.M.C.; Parry, S.J. Geochemistry of the granitic rocks and their minerals from Serra da Estrela, Central Portugal. Geochim. Cosmochim. Acta 1987, 51, 439–454. [Google Scholar] [CrossRef]
- Jelinek, V. Statistical processing of anisotropy of magnetic susceptibility measured on groups of specimens. Stud. Geophys. Geod. 1978, 22, 50–62. [Google Scholar] [CrossRef]
- Hancock, P.L. Brittle microtectonics: Principles and practice. J. Struct. Geol. 1985, 7, 437–457. [Google Scholar] [CrossRef]
- Anders, M.H.; Laubach, S.E.; Scholz, C.H. Microfractures: A review. J. Struct. Geol. 2014, 69, 377–394. [Google Scholar] [CrossRef]
- Patiño Douce, A.E. What do experiments tell us about the relative contributions of crust and mantle to the origin of granitic magmas? Geol. Soc. Lond. Spec. Publ. 1999, 168, 55–75. [Google Scholar] [CrossRef]
- Holtz, F.; Johannes, W. Genesis of peraluminous granites. I. Experimental investigation of melt compositions at 3 and 5 kb and various H2O activities. J. Petrol. 1991, 32, 935–958. [Google Scholar] [CrossRef]
- Patiño Douce, A.E.; Harris, N. Experimental constraints on Himalayan Anatexis. J. Petrol. 1998, 39, 689–710. [Google Scholar] [CrossRef]
- Sant’Ovaia, H.; Martins, H.C.B.; Noronha, F. Oxidized and reduced Portuguese Variscan granites associated with W and Sn hydrothermal lode deposits: Magnetic susceptibility results. Comun. Geol. 2013, 100, 33–39, ISSN 0873-948X; e-ISSN 1647-581X. [Google Scholar]
- Sant’Ovaia, H.; Olivier, P.; Ferreira, N.; Noronha, F.; Leblanc, D. Magmatic structures and kinematics emplacement of the Variscan granites from Central Portugal (Serra da Estrela and Castro Daire areas). J. Struct. Geol. 2010, 32, 1450–1465. [Google Scholar] [CrossRef]
- Corry, C.E. Laccoliths; mechanics of emplacement and growth. Geol. Soc. Am. Spec. Pap. 1988, 220, 1–110. [Google Scholar] [CrossRef]
- Clemens, J.D.; Mawer, C.K. Granitic magma transport by fracture propagation. Tectonophysics 1992, 204, 339–360. [Google Scholar] [CrossRef]
- Paterson, S.R.; Fowler, T.K. Re-examination pluton emplacement processes. J. Struct. Geol. 1993, 15, 191–206. [Google Scholar] [CrossRef]
- Romaán-Berdiel, T.; Brun, J.P.; Gapais, D. Analogue models of laccolith formation. J. Struct. Geol. 1995, 17, 1337–1346. [Google Scholar] [CrossRef]
- Román-Berdiel, T.; Gaspais, D.; Brun, J.P. Granite intrusion along strike–slip zones in experiment and nature. Am. J. Sci. 1997, 297, 651–678. [Google Scholar] [CrossRef]
- Román-Berdiel, T. Geometry of granite emplacement in the upper crust: Contributions of analogue modelling. In Understanding Granites: Integrating New and Classical Techniques; Castro, A., Fernández, C., Vigneresse, J.L., Eds.; Geological Society of London: London, UK, 1999; Volume 168, p. 77. [Google Scholar] [CrossRef]
- Petford, N.; Cruden, A.R.; McCaffrey, J.W.; Vigneresse, J.L. Granite magma formation, transport and emplacement in the Earth’s crust. Nature 2000, 408, 669–673. [Google Scholar] [CrossRef] [PubMed]
- Castro, A. Structural pattern and ascent model in the Central Extremadura batholith, Hercynian belt, Spain. J. Struct. Geol. 1986, 8, 633–645. [Google Scholar] [CrossRef]
- Hutton, D.H.W.; Dempster, T.J.; Brown, P.E.; Becker, S.D. A new mechanism of granite emplacement: Intrusion in active extensional shear zones. Nature 1990, 343, 452–455. [Google Scholar] [CrossRef]
- Vigneresse, J.L.; Clemens, J.F. Granitic magma ascent and emplacement: Neither dispirism nor neutral buoyancy. In Salt, Shale and Igneous Diapirsin and around Europe; Venderville, B., Mart, Y., Vigneresse, J.L., Eds.; Geological Society of London: London, UK, 2000; Volume 174, pp. 1–19. [Google Scholar]
- Lehmann, B. Metallogeny of Tin; Lecture Notes in Earth Sciences; Springer: Berlin, Germany, 1990. [Google Scholar]
- Activation Laboratories Lda. Official Page. Available online: https://actlabs.com/geochemistry/lithogeochemistry-and-whole-rock-analysis/lithogeochemistry/ (accessed on 13 January 2020).


| Lithology | Dating | Description | Mineralogy |
|---|---|---|---|
| Schist–Greywacke Complex (SGC) and derivate metamorphic series | |||
| Schists and greywackes | Neoproterozoic | Sequences characterized by the interlayering of fine-to-medium-grained, gray to greenish color greywackes and fine- to medium-grained shining phyllites. | The main mineralogy of greywackes is quartz, K feldspar, chlorite and sericite; this biotite can occur in zones where the metamorphic effect is more intense. The schist is mostly composed of quartz, biotite and muscovite; K feldspar, tourmaline and graphite are present as accessories in mineralogy. |
| Ordovician granites | |||
| Manteigas granite | 482 ± 6 Ma [27] | Biotite-rich, coarse-grained, porphyritic granodiorite with clear foliation. | Quartz, microcline, plagioclase, biotite, chlorite, sphene, apatite, zircon, rutile, magnetite and ilmenite. |
| Fundão granite | 478.1 ± 0.5 Ma and 478.4 ± 0.5 Ma for tonalite and monzogranite, respectively [69] | The Fundão intrusive complex consists of granodioritic zoned pluton. The central part features granodiorites and an outermost zone of biotite granite. | Quartz, K feldspar (microcline), plagioclase (oligoclase-andesine), biotite, muscovite, apatite, topaz, allanite, epidote, sphene, rutile, ilmenite and pyrite. |
| Late-D3 granites | |||
| Peroviseu–Seia granite (PS) | 304.1 ± 3.9 Ma [83] | Biotite-rich, coarse- to very coarse-grained porphyritic granite. | Quartz, microperthite microcline, plagioclase, biotite, chlorite, muscovite, zircon, apatite, monazite, ilmenite, rutile and rare cordierite. |
| Castelo Branco granite (CB) (Alpedrinha and Penamacor) | 310 ± 1 Ma [84] | CB is a complex zoned pluton composed by muscovite–biotite granite in the core, which is surrounded by biotite ± muscovite porphyritic granodiorites and muscovite–biotite granite in the peripheries. | Quartz, microperthitic microcline, plagioclase, biotite, some chlorite, muscovite, tourmaline, monazite, apatite, zircon, ilmenite and rutile. The CB also contains magmatic andalusite, sillimanite and cordierite. |
| Late- to post-D3 granites | |||
| Belmonte–Covilhã granite (BC) | 300 ± 1 Ma [28] | Biotite-rich, coarse-grained, porphyritic granite. | Quartz, K feldspar, plagioclase, biotite ± muscovite ± chlorite, zircon, rutile, sphene, tourmaline, ilmenite, fluorite and opaques. Rare andalusite can occur. |
| Post-D3 granites | |||
| Fráguas | 299 ± 3 Ma [28] | Muscovite > biotite, medium- and medium- to fine-grained granites. | Quartz, K feldspar (microcline, albite, albite–oligoclase and microperthite), fresh biotite, zircon. The K feldspars are strongly altered to sericite and kaolin. |
| Atalaia granite | n.d. | Tourmaline muscovite, medium-grained, porphyritic granite. | Quartz, K feldspar, albite, muscovite or bleached biotite and tourmaline. |
| Estrela granite | n.d. | Muscovite-rich, medium-grained granite. | Quartz, K feldspar (microcline), albite muscovite and tourmaline. |
| Capinha granite | n.d. | Muscovite > biotite, medium-grained, incipient porphyritic granite. | Quartz, K feldspar (microcline >> orthoclase), plagioclase (albite–oligoclase), micas (muscovite > biotite ± chlorite), apatite, zircon, rutile and metallic phases. The plagioclase is strongly altered to sericite and kaolin. |
| Mineral% | Capinha Granite (n = 8) | |||
|---|---|---|---|---|
| Min | Max | σ | ||
| Qz | 35.29 | 37.58 | 36.45 | 0.7 |
| Pl | 25.31 | 28.26 | 26.64 | 1 |
| Or | 25.18 | 26.69 | 26 | 0.52 |
| Crn | 3.93 | 5.34 | 4.68 | 0.4 |
| Hyp | 1.02 | 3.47 | 2.19 | 0.75 |
| Ilm | 0.4 | 0.66 | 0.45 | 0.08 |
| Mag | 0.49 | 1.83 | 1.1 | 0.45 |
| Hem | 0 | 1.35 | 0.17 | 0.45 |
| Ap | 0.53 | 0.88 | 0.8 | 0.11 |
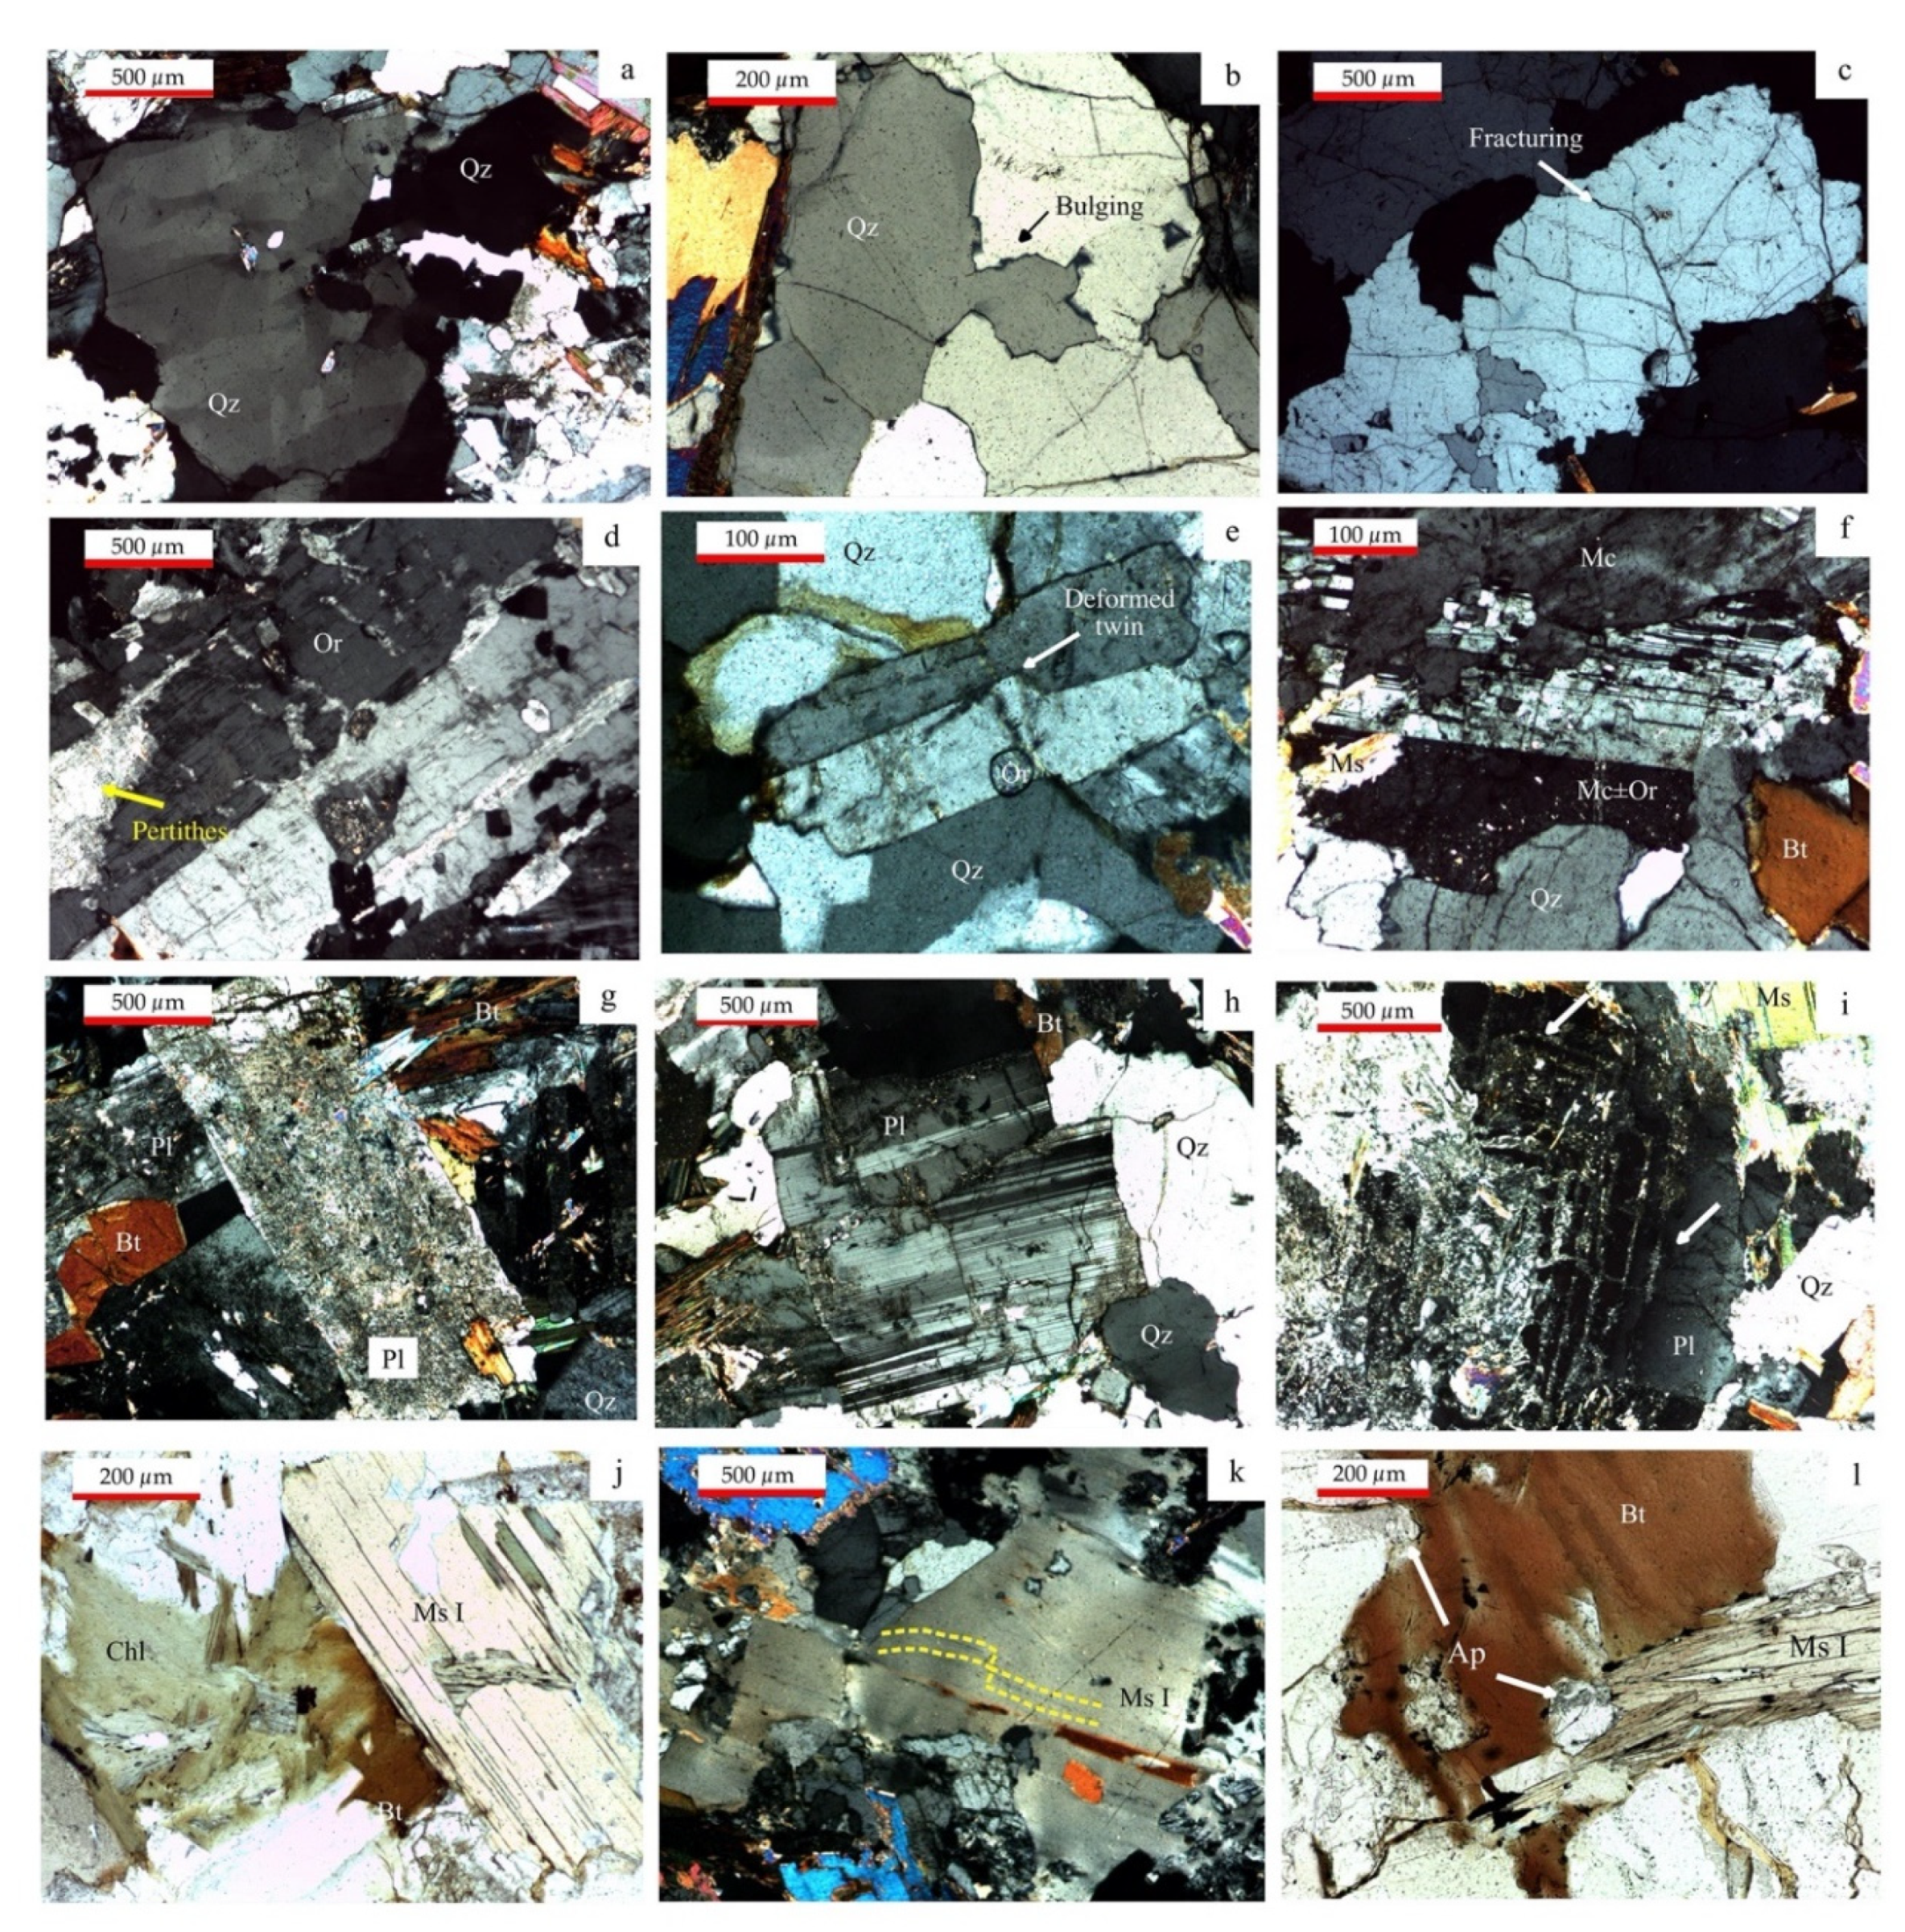
| Mineral | Occurrence | Magmatic to Submagmatic | Low-T Solid State | Other Observations |
|---|---|---|---|---|
| Quartz (Qz) | Anhedral to subhedral inequigranular crystals; very variable sizes ranging from a few µm up to 500 µm. | No preferred orientation; inclusions in other igneous crystals; evident undulose extinction (Figure 4a). | Scarce subgranulation and sutured boundaries with recrystallized bulges (Figure 4b); strongly fractured (Figure 4c). | Local, poorly defined chess-board patterns are present. |
| K feldspar | The orthoclase (Or) and microcline (Mc) occur in well-developed crystals; microcline is more abundant than orthoclase and exhibits crystals up to 500 µm. Orthoclase occurs in small crystals, ca. 200 µm. | Eu- to subhedral crystals; growth twins common in both K feldspars; orthoclase displays perthites, venules and bands (Figure 4d); eu- to subhedral inclusions in other igneous crystals, generally albite–oligoclase. | Slightly glide and/or deformed twins (Figure 4e); altered to fine-grained white micas (sericitization). | Occasionally, the orthoclase is replaced by microcline, displaying Carlsbad twins together with cross-hatched twins (Figure 4f); microcline and orthoclase exhibit a poikilitic texture characterized by small inclusions of quartz, orthoclase and micas. |
| Plagioclase (Pl) | Plagioclase, namely, albite–oligoclase, occurs in well-developed crystals (≥500 µm). | Eu- to subhedral crystals; slightly zoned (oscillatory); growth twins common parallel to the long axis; eu- to subhedral inclusions in other igneous crystals, generally, in the microcline. | Strongly altered to very fine-grained white micas (sericitization) and clays (Figure 4g); deformed twins (Figure 4h); fracturing infilled by iron oxides. | Sporadically, metal phases occur associated with the plagioclase; commonly, the replacement of the albite–oligoclase develops through the zoning planes (Figure 4i). |
| Phyllosilicates | Three types were identified: primary muscovite (Ms I, the most abundant), biotite (Bt) and chlorite (Chl) (Figure 4j). They occur in anhedral to subhedral crystals with frayed ends, isolated or in clusters of several flakes; sizes ranging between 100 and 500 µm. | Ms and Bt are, generally, subhedral, with well-defined cleavage; randomly distributed; eu- to subhedral inclusions in other igneous crystals. | Muscovite presents slight deformation (kinking) (Figure 4k); biotite is, frequently, replaced by chlorite and also by secondary muscovite (Ms II). | Inclusions of small clusters of eu- to subhedral zircons (lengths lower than 50 µm) in Bt, promoting the origin of pleochroic halos; inclusions of subhedral platy crystals of ilmenite (sizes lower than 100 µm) parallel to the cleavage planes of biotite and/or chlorite; very fine-grained reeds of rutile (lower than 30 µm in length) associated with the chloritization of Bt; inclusions of apatite (100 to 200 µm) and monazite (< 30 µm) in Bt, showing euhedral to subhedral shapes (Figure 4l). |
| Element | Capinha Granite | Min | Max | σ | WAGC | ||||||||
|---|---|---|---|---|---|---|---|---|---|---|---|---|---|
| 1 | 4 | 11 | 15 | 18 | 19 | Q1 | Q2 | ||||||
| SiO2 | 72.57 | 73.34 | 72.07 | 72.87 | 72.44 | 73.41 | 72.76 | 72.61 | 72.07 | 73.41 | 72.76 | 0.42 | 72.04 |
| Al2O3 | 14.82 | 14.97 | 14.33 | 15.1 | 14.97 | 14.75 | 14.94 | 14.51 | 14.33 | 15.1 | 14.8 | 0.24 | 14.42 |
| Fe2O3 | 0.97 | 0.66 | 1.69 | 1.04 | 1.26 | 1.03 | 0.89 | 0.55 | 0.55 | 1.69 | 1.01 | 0.33 | 1.22 |
| MnO | 0.051 | 0.034 | 0.037 | 0.031 | 0.043 | 0.036 | 0.038 | 0.038 | 0.031 | 0.051 | 0.04 | 0.01 | 0.05 |
| FeO | 1.1 | 1.3 | 0.3 | 1 | 0.8 | 1.1 | 1.2 | 1.5 | 0.3 | 1.5 | 1.04 | 0.34 | 1.68 |
| MgO | 0.5 | 0.44 | 0.41 | 0.51 | 0.44 | 0.54 | 0.67 | 0.67 | 0.41 | 0.67 | 0.52 | 0.09 | 0.71 |
| CaO | 0.54 | 0.6 | 0.6 | 0.5 | 0.62 | 0.73 | 0.61 | 0.63 | 0.5 | 0.73 | 0.6 | 0.06 | 1.82 |
| Na2O | 2.96 | 3.08 | 3.22 | 3.01 | 3.32 | 3.19 | 3 | 2.93 | 2.93 | 3.32 | 3.09 | 0.13 | 3.69 |
| K2O | 4.5 | 4.38 | 4.48 | 4.33 | 4.26 | 4.29 | 4.5 | 4.44 | 4.26 | 4.5 | 4.4 | 0.09 | 4.12 |
| TiO2 | 0.229 | 0.231 | 0.212 | 0.223 | 0.21 | 0.223 | 0.233 | 0.231 | 0.21 | 0.23 | 0.22 | 0.01 | 0.3 |
| P2O5 | 0.37 | 0.38 | 0.35 | 0.33 | 0.37 | 0.36 | 0.35 | 0.36 | 0.33 | 0.38 | 0.36 | 0.01 | 0.12 |
| LOI | 1.25 | 1.32 | 1.05 | 1.26 | 0.98 | 1.02 | 1.34 | 1.56 | 0.98 | 1.56 | 1.22 | 0.18 | n.d. |
| Total | 99.86 | 100.7 | 98.76 | 100.2 | 99.72 | 100.7 | 100.5 | 100 | – | – | – | – | 100.17 |
| Sc | 5 | 5 | 5 | 5 | 5 | 5 | 5 | 5 | 5 | 5 | 5 | 0 | – |
| Be | 4 | 4 | 4 | 4 | 6 | 4 | 4 | 4 | 4 | 6 | 4.25 | 0.66 | – |
| V | 22 | 23 | 20 | 21 | 20 | 22 | 23 | 22 | 20 | 23 | 21.63 | 1.11 | – |
| Cr | 150 | 160 | 150 | 160 | 160 | 180 | 170 | 170 | 150 | 180 | 162.5 | 9.68 | – |
| Co | 5 | 4 | 3 | 2 | 7 | 4 | 4 | 4 | 2 | 7 | 4.13 | 1.36 | – |
| Ni | <20 | 60 | <20 | <20 | 20 | 30 | <20 | <20 | 20 | 60 | 36.67 | 17 | – |
| Cu | <10 | 40 | 10 | 30 | <10 | < 10 | <10 | <10 | 10 | 40 | 26.67 | 12.47 | – |
| Zn | 70 | 50 | 60 | 50 | 90 | 60 | 60 | 60 | 50 | 90 | 62.5 | 11.99 | 39 |
| Ga | 19 | 19 | 19 | 20 | 19 | 19 | 20 | 19 | 19 | 20 | 19.25 | 0.43 | – |
| Ge | 2 | 2 | 3 | 2 | 2 | 2 | 2 | 2 | 2 | 3 | 2.13 | 0.33 | – |
| As | 18 | 16 | 72 | 42 | 49 | 19 | 44 | 42 | 16 | 72 | 37.75 | 17.99 | – |
| Rb | 258 | 247 | 258 | 249 | 268 | 239 | 253 | 248 | 239 | 268 | 252.50 | 8.26 | 170 |
| Sr | 72 | 68 | 74 | 64 | 69 | 70 | 61 | 61 | 61 | 74 | 67.38 | 4.58 | 100 |
| Y | 13 | 13 | 11 | 13 | 13 | 12 | 12 | 11 | 11 | 13 | 12.25 | 0.83 | 40 |
| Zr | 76 | 79 | 78 | 77 | 71 | 77 | 77 | 77 | 71 | 79 | 76.5 | 2.24 | 175 |
| Nb | 10 | 10 | 10 | 10 | 9 | 10 | 10 | 10 | 9 | 10 | 9.88 | 0.33 | 28 |
| Mo | 2 | 3 | 2 | 2 | 3 | 3 | 2 | 3 | 2 | 3 | 2.5 | 0.5 | – |
| Ag | <0.5 | <0.5 | <0.5 | <0.5 | <0.5 | <0.5 | <0.5 | <0.5 | – | – | – | – | – |
| In | <0.2 | <0.2 | <0.2 | <0.2 | <0.2 | <0.2 | <0.2 | <0.2 | – | – | – | – | – |
| Sn | 9 | 14 | 20 | 24 | 24 | 12 | 16 | 16 | 9 | 24 | 16.88 | 5.09 | 3 |
| Sb | <0.5 | <0.5 | <0.5 | <0.5 | <0.5 | <0.5 | <0.5 | <0.5 | – | – | – | – | – |
| Cs | 14.9 | 16.7 | 15.7 | 17.6 | 21.3 | 11.3 | 18.5 | 17.9 | 11.3 | 21.3 | 16.74 | 2.74 | – |
| Ba | 263 | 250 | 261 | 241 | 248 | 247 | 239 | 239 | 239 | 263 | 248.5 | 8.72 | 340 |
| Ta | 2.3 | 2.1 | 2.1 | 2.2 | 2 | 2.3 | 2.2 | 2.2 | 2 | 2.3 | 2.18 | 0.1 | 4 |
| W | 6 | 8 | 11 | 12 | 12 | 9 | 10 | 9 | 6 | 12 | 9.63 | 1.93 | 2.2 |
| Tl | 1.6 | 1.4 | 1.6 | 1.5 | 1.7 | 1.5 | 1.5 | 1.5 | 1.4 | 1.7 | 1.54 | 0.09 | – |
| Pb | 23 | 22 | 25 | 23 | 22 | 25 | 23 | 23 | 22 | 25 | 23.25 | 1.09 | – |
| Bi | < 0.4 | 1.9 | 0.9 | 1.3 | 0.8 | 0.7 | 1.5 | 1.3 | 0.7 | 1.9 | 1.2 | 0.4 | – |
| Th | 6.7 | 7 | 6.8 | 6.3 | 6.4 | 6.7 | 7.2 | 6.7 | 6.3 | 7.2 | 6.73 | 0.27 | 17 |
| U | 10.6 | 12.6 | 10.2 | 11.1 | 15.8 | 13.3 | 12.1 | 10.1 | 10.1 | 15.8 | 11.98 | 1.81 | 3 |
| Hf | 2 | 2.2 | 2.2 | 2.1 | 2.3 | 2.3 | 2.1 | 2.1 | 2 | 2.3 | 2.16 | 0.1 | 3 |
| K/Rb | 144.8 | 147.22 | 144.16 | 144.37 | 131.96 | 149.02 | 147.66 | 148.63 | 131.96 | 149.02 | 144.73 | 5.15 | – |
| Rb/Sr | 3.58 | 3.63 | 3.49 | 3.89 | 3.88 | 3.41 | 4.15 | 4.07 | 3.41 | 4.15 | 3.76 | 0.26 | – |
| R1 | 3747 | 3792 | 3673 | 3779 | 3703 | 3786 | 3752 | 3762 | 3673 | 3792 | 3749.25 | 39.04 | – |
| R2 | 227.93 | 232.85 | 225.08 | 226.89 | 234.99 | 249.56 | 245.03 | 242.96 | 225.08 | 249.56 | 235.66 | 8.60 | – |
| A | 30.56 | 29.23 | 19.64 | 35.73 | 25.92 | 21.62 | 28.6 | 25.43 | 19.64 | 35.73 | 27.09 | 4.78 | – |
| B | 28.99 | 27.02 | 25.48 | 28.91 | 27.01 | 30.28 | 33.5 | 33.42 | 25.48 | 33.5 | 29.33 | 2.76 | – |
| A/CNK | 1.38 | 1.37 | 1.28 | 1.43 | 1.34 | 1.31 | 1.37 | 1.35 | 1.28 | 1.43 | 1.35 | 0.04 | – |
| A/NK | 1.52 | 1.53 | 1.41 | 1.57 | 1.49 | 1.49 | 1.52 | 1.51 | 1.41 | 1.57 | 1.51 | 0.04 | – |
| REE | Capinha Granite | Min | Max | σ | ||||||||
|---|---|---|---|---|---|---|---|---|---|---|---|---|
| 1 | 4 | 11 | 15 | 18 | 19 | Q1 | Q2 | |||||
| La | 15.8 | 15.3 | 14.1 | 13.7 | 14.2 | 14.1 | 14.9 | 14.3 | 13.7 | 15.8 | 14.55 | 0.67 |
| Ce | 32.6 | 32.4 | 29.8 | 29.1 | 30.5 | 30.3 | 32 | 30.2 | 29.1 | 32.6 | 30.86 | 1.21 |
| Pr | 3.71 | 3.78 | 3.47 | 3.26 | 3.54 | 3.58 | 3.64 | 3.51 | 3.26 | 3.78 | 3.56 | 0.15 |
| Nd | 14.1 | 14.3 | 13.8 | 12.9 | 13.3 | 12.7 | 14.4 | 13.5 | 12.7 | 14.4 | 13.63 | 0.59 |
| Sm | 3.2 | 3.4 | 3 | 2.9 | 3 | 2.9 | 3 | 3 | 2.9 | 3.4 | 3.05 | 0.16 |
| Eu | 0.48 | 0.56 | 0.53 | 0.54 | 0.49 | 0.46 | 0.44 | 0.51 | 0.44 | 0.56 | 0.50 | 0.04 |
| Gd | 2.9 | 3.3 | 2.8 | 2.9 | 3.3 | 2.6 | 2.7 | 2.9 | 2.6 | 3.3 | 2.93 | 0.24 |
| Tb | 0.4 | 0.5 | 0.4 | 0.5 | 0.5 | 0.4 | 0.4 | 0.4 | 0.4 | 0.5 | 0.44 | 0.05 |
| Dy | 2.5 | 2.8 | 2.3 | 2.3 | 2.5 | 2.3 | 2.4 | 2.2 | 2.2 | 2.8 | 2.41 | 0.18 |
| Ho | 0.4 | 0.5 | 0.4 | 0.4 | 0.4 | 0.4 | 0.4 | 0.4 | 0.4 | 0.5 | 0.41 | 0.03 |
| Er | 1.1 | 1.2 | 1.1 | 1.1 | 1.2 | 1 | 1 | 1 | 1 | 1.2 | 1.09 | 0.08 |
| Tm | 0.16 | 0.16 | 0.16 | 0.18 | 0.16 | 0.14 | 0.16 | 0.14 | 0.14 | 0.18 | 0.16 | 0.01 |
| Yb | 1 | 1 | 0.9 | 1.1 | 0.9 | 0.9 | 0.9 | 0.9 | 0.9 | 1.1 | 0.95 | 0.07 |
| Lu | 0.13 | 0.14 | 0.13 | 0.14 | 0.14 | 0.11 | 0.14 | 0.12 | 0.11 | 0.14 | 0.13 | 0.01 |
| REE(Tot) | 78.48 | 79.34 | 72.89 | 71.02 | 74.13 | 71.89 | 76.48 | 73.08 | 71.02 | 79.34 | 74.66 | 2.89 |
| LREE(Tot) | 69.41 | 69.18 | 64.17 | 61.86 | 64.54 | 63.58 | 67.94 | 64.51 | 61.86 | 69.41 | 65.65 | 2.63 |
| HREE(Tot) | 8.59 | 9.6 | 8.19 | 8.62 | 9.1 | 7.85 | 8.1 | 8.06 | 7.85 | 9.6 | 8.51 | 0.55 |
| (La/Lu)N | 12.62 | 11.34 | 11.26 | 10.16 | 10.53 | 13.31 | 11.05 | 12.37 | 10.16 | 13.31 | 11.58 | 1.02 |
| (La/Sm)N | 3.11 | 2.83 | 2.96 | 2.97 | 2.98 | 3.06 | 3.13 | 3 | 2.83 | 3.13 | 3.01 | 0.09 |
| (Gd/Lu)N | 2.77 | 2.93 | 2.68 | 2.57 | 2.93 | 2.94 | 2.4 | 3 | 2.4 | 3 | 2.78 | 0.20 |
| (Eu/Eu)N | 0.24 | 0.25 | 0.28 | 0.28 | 0.24 | 0.25 | 0.23 | 0.26 | 0.23 | 0.28 | 0.25 | 0.02 |
| Element | Peroviseu–Seia (n = 5) | Belmonte–Covilhã (n = 3) | Fráguas (n = 3) | Capinha (n = 8) | ||||||||||||
|---|---|---|---|---|---|---|---|---|---|---|---|---|---|---|---|---|
| Min | Max | σ | Min | Max | σ | Min | Max | σ | Min | Max | σ | |||||
| SiO2 | 67.12 | 72.4 | 70.06 | 1.81 | 71.14 | 73.31 | 72.13 | 0.9 | 73.36 | 74.13 | 73.68 | 0.33 | 72.07 | 73.41 | 72.76 | 0.42 |
| Al2O3 | 14.04 | 15.76 | 14.9 | 0.63 | 14.29 | 14.86 | 14.65 | 0.25 | 14.34 | 14.89 | 14.64 | 0.23 | 14.33 | 15.1 | 14.8 | 0.24 |
| Fe2O3 | 0.4 | 0.79 | 0.62 | 0.13 | 0.42 | 0.68 | 0.55 | 0.11 | 0.19 | 0.28 | 0.22 | 0.04 | 0.55 | 1.69 | 1.01 | 0.33 |
| MnO | 0.04 | 0.05 | 0.05 | 0.005 | 0.03 | 0.04 | 0.04 | 0.005 | 0.05 | 0.07 | 0.06 | 0.01 | 0.03 | 0.05 | 0.04 | 0.01 |
| FeO | 1.86 | 2.96 | 2.36 | 0.46 | 1.09 | 1.65 | 1.42 | 0.24 | 0.85 | 1.52 | 1.17 | 0.27 | 0.30 | 1.50 | 1.04 | 0.34 |
| MgO | 0.48 | 1.3 | 0.77 | 0.3 | 0.3 | 0.65 | 0.45 | 0.15 | 0.17 | 0.22 | 0.19 | 0.02 | 0.41 | 0.67 | 0.52 | 0.09 |
| CaO | 0.87 | 1.47 | 1.12 | 0.2 | 0.67 | 0.9 | 0.75 | 0.1 | 0.39 | 0.48 | 0.43 | 0.04 | 0.50 | 0.73 | 0.6 | 0.06 |
| Na2O | 2.49 | 2.89 | 2.67 | 0.16 | 2.74 | 3.47 | 3.09 | 0.3 | 2.97 | 3.24 | 3.13 | 0.11 | 2.93 | 3.32 | 3.09 | 0.13 |
| K2O | 4.84 | 5.27 | 5.05 | 0.16 | 5.04 | 5.12 | 5.09 | 0.03 | 4.42 | 4.73 | 4.6 | 0.13 | 4.26 | 4.5 | 4.4 | 0.09 |
| TiO2 | 0.33 | 0.72 | 0.48 | 0.14 | 0.16 | 0.32 | 0.26 | 0.07 | 0.08 | 0.13 | 0.11 | 0.02 | 0.21 | 0.23 | 0.22 | 0.01 |
| P2O5 | 0.2 | 0.36 | 0.29 | 0.06 | 0.22 | 0.29 | 0.26 | 0.03 | 0.28 | 0.4 | 0.34 | 0.05 | 0.33 | 0.38 | 0.36 | 0.01 |
| F | 0.1 | 0.25 | 0.16 | 0.06 | 0.12 | 0.17 | 0.15 | 0.02 | 0.12 | 0.49 | 0.31 | 0.15 | n.d. | n.d. | n.d. | n.d. |
| LOI | 0.98 | 2.18 | 1.36 | 0.45 | 0.93 | 1.46 | 1.11 | 0.25 | 1.06 | 1.21 | 1.12 | 0.07 | 0.98 | 1.56 | 1.22 | 0.18 |
| Total | 99.73 | 99.99 | 99.87 | 0.1 | 99.73 | 100.05 | 99.94 | 0.15 | 99.87 | 100.14 | 100 | 0.11 | 98.75 | 100.74 | 100.06 | 0.61 |
| Nb | 11 | 18 | 14.4 | 3.01 | 14 | 21 | 17 | 2.94 | 17 | 23 | 20.67 | 2.62 | 9 | 10 | 9.88 | 0.33 |
| Zn | 48 | 66 | 59 | 7.25 | 62 | 71 | 66.5 | 4.5 | 35 | 71 | 53 | 18 | 50 | 90 | 62.5 | 11.99 |
| Sn | 11 | 18 | 13.4 | 2.42 | 21 | 38 | 28 | 7.26 | 39 | 76 | 62 | 16.39 | 9 | 24 | 16.88 | 5.09 |
| Li | 108 | 600 | 241.6 | 181.84 | 193 | 400 | 289.33 | 85.11 | 688 | 1100 | 829 | 191.68 | n.d. | n.d. | n.d. | n.d. |
| Zr | 112 | 208 | 164.4 | 34.06 | 76 | 145 | 112.67 | 28.34 | 29 | 65 | 48.33 | 14.82 | 71 | 79 | 76.5 | 2.24 |
| Y | 19 | 30 | 23.6 | 3.77 | 15 | 22 | 18 | 2.94 | 10 | 19 | 14.33 | 3.68 | 11 | 13 | 12.25 | 0.83 |
| Sr | 66 | 152 | 96 | 35.2 | 51 | 60 | 55 | 3.74 | 21 | 33 | 27 | 4.9 | 61 | 74 | 67.38 | 4.58 |
| Ba | 226 | 600 | 368.4 | 146.13 | 172 | 263 | 208.33 | 39.35 | 46 | 82 | 61.33 | 15.17 | 239 | 263 | 248.5 | 8.72 |
| Rb | 228 | 299 | 274 | 26.1 | 190 | 351 | 290 | 71.28 | 465 | 607 | 523.33 | 60.68 | 239 | 268 | 252.5 | 8.26 |
| Th | 12 | 27 | 18.25 | 6.14 | 12 | 13 | 12.5 | 0.5 | 7 | 7 | 7 | 0 | 6.3 | 7.2 | 6.73 | 0.27 |
| W | n.d. | n.d. | 3 | n.d. | n.d. | n.d. | 3 | n.d. | n.d. | n.d. | 2 | n.d. | 6 | 12 | 9.63 | 1.93 |
| K/Rb | 136.88 | 182.42 | 154.38 | 15.19 | 119.21 | 222.84 | 157.08 | 46.68 | 63.73 | 84.45 | 73.96 | 8.46 | 131.96 | 149.02 | 144.73 | 5.15 |
| Fe2O3(Tot) | 2.47 | 4.08 | 3.24 | 0.62 | 1.63 | 2.38 | 2.13 | 0.35 | 1.14 | 1.88 | 1.53 | 0.31 | 2.02 | 2.25 | 2.17 | 0.07 |
| Rb/Sr | 1.5 | 4.53 | 3.27 | 1.16 | 3.52 | 6.88 | 5.29 | 1.38 | 18.39 | 22.14 | 19.66 | 1.76 | 3.41 | 4.15 | 3.76 | 0.25 |
| A/CNK | 1.17 | 1.36 | 1.26 | 0.07 | 1.15 | 1.32 | 1.23 | 0.07 | 0.92 | 1 | 0.96 | 0.03 | 1.28 | 1.43 | 1.35 | 0.04 |
| A/NK | 1.39 | 1.66 | 1.51 | 0.1 | 1.31 | 1.48 | 1.39 | 0.07 | 1.39 | 1.5 | 1.45 | 0.05 | 1.41 | 1.57 | 1.5 | 0.04 |
| Rare Earth Element | Peroviseu–Seia (PS) n = 5 | Belmonte–Covilhã (BC) n = 3 | Fráguas n = 3 | Capinha n = 8 |
|---|---|---|---|---|
| La | 23.7 | 25.8 | 10.65 | 14.55 |
| Ce | 53.8 | 50.7 | 24.4 | 30.86 |
| Pr | 6.4 | 5.99 | 2.9 | 3.56 |
| Nd | 24.2 | 23.7 | 10.8 | 13.63 |
| Sm | 5.2 | 4.6 | 2.6 | 3.05 |
| Eu | 0.57 | 0.65 | 0.15 | 0.5 |
| Gd | 4.3 | 4.04 | 2.45 | 2.93 |
| Tb | 0.73 | 0.6 | 0.42 | 0.44 |
| Dy | 4.1 | 3.13 | 2.65 | 2.41 |
| Ho | 0.77 | 0.68 | 0.45 | 0.41 |
| Er | 1.9 | 1.54 | 1.15 | 1.09 |
| Tm | 0.3 | 0.23 | 0.17 | 0.16 |
| Yb | 11.8 | 1.5 | 1 | 0.955 |
| Lu | 0.3 | 0.22 | 0.15 | 0.13 |
| LREE(Tot) | 113.3 | 110.79 | 51.35 | 65.65 |
| HREE(Tot) | 14.2 | 11.94 | 8.44 | 8.52 |
| REE(Tot) | 128.07 | 123.38 | 59.94 | 74.67 |
| (La/Sm)N | 2.87 | 3.53 | 2.58 | 3.00 |
| (Gd/Yb)N | 1.93 | 2.18 | 1.98 | 2.49 |
| (La/Yb)N | 8.89 | 11.61 | 7.19 | 10.34 |
| (Eu/Eu*)N or EuN | 0.18 | 0.23 | 0.09 | 0.25 |
| Site | n | Km | σ | Ppara | T | σ | Magnetic Lineation | K3D | K3I | Magnetic Foliation | E12 | E23 | E31 | SE | |
|---|---|---|---|---|---|---|---|---|---|---|---|---|---|---|---|
| K1D | K1I | ||||||||||||||
| 1 | 7 | 89.6 | 9.4 | 4.44 | −0.17 | 0.3 | 194 | 43 | 297 | 13 | 27° NE; 77° E | 1.52 | 2.86 | 0.99 | 0.04 |
| 2 | 7 | 79.9 | 4.71 | 1.39 | 0.11 | 0.52 | 139 | 35 | 272 | 45 | N2° E; 45° E | 10.3 | 8.61 | 3.07 | 0.05 |
| 3 | 12 | 72.1 | 5.42 | 1.6 | −0.04 | 0.15 | 302 | 10 | 190 | 65 | N280° E; 25° NE | 7.24 | 7.36 | 3.88 | 0.06 |
| 4 | 8 | 71 | 4.58 | 1.77 | 0.69 | 0.15 | 42 | 2 | 265 | 87 | N355° E; 3° E | 18.94 | 3.68 | 3.1 | 0.06 |
| 5 | 7 | 79.5 | 3.96 | 0.85 | −0.37 | 0.44 | 263 | 7 | 62 | 83 | N152° E; 7° SW | 4.29 | 14.6 | 2.86 | 0.04 |
| 6 | 8 | 80.9 | 5.82 | 1.89 | 0.07 | 0.21 | 201 | 15 | 68 | 69 | N158° E; 21° SW | 6.7 | 5.79 | 3.26 | 0.06 |
| 7 | 12 | 77.6 | 4.65 | 1.19 | 0.41 | 0.27 | 255 | 34 | 79 | 56 | N169° E; 34° SW | 12.19 | 4.94 | 2.99 | 0.07 |
| 8 | 7 | 17.4 | 0.88 | 0.61 | 0.47 | 0.21 | 53 | 11 | 259 | 78 | N349° E; 12° E | 39.97 | 17.7 | 13.2 | 0.15 |
| 9 | 9 | 76.6 | 3.93 | 2.31 | 0.55 | 0.3 | 190 | 33 | 336 | 52 | N66° E; 38° SE | 8.04 | 2.22 | 1.59 | 0.04 |
| 10 | 9 | 74.7 | 3.64 | 1.87 | 0.44 | 0.12 | 6 | 6 | 250 | 76 | N340° E; 14° NE | 5.11 | 2.18 | 1.54 | 0.03 |
| 11 | 8 | 69.2 | 2.98 | 1.43 | 0.47 | 0.46 | 262 | 19 | 129 | 63 | N219° E; 27° NW | 21.98 | 8.84 | 4.61 | 0.08 |
| 12 | 7 | 74.5 | 6.46 | 1.19 | 0.06 | 0.52 | 31 | 5 | 138 | 73 | N228° E; 17° NW | 7.74 | 6.44 | 2.54 | 0.04 |
| 13 | 6 | 75.1 | 8.15 | 1.27 | 0.36 | 0.26 | 209 | 4 | 15 | 86 | N105° E; 4° SW | 9.78 | 4.92 | 3.25 | 0.04 |
| 14 | 6 | 78.2 | 4.38 | 2.15 | 0.56 | 0.2 | 321 | 5 | 228 | 25 | N318° E; 65° NE | 7.22 | 1.97 | 1.48 | 0.04 |
| 15 | 9 | 76.9 | 2.78 | 1.71 | 0.33 | 0.39 | 189 | 3 | 66 | 85 | N156° E; 5° SW | 14.98 | 7.17 | 4.81 | 0.08 |
| 16 | 7 | 66.1 | 3.32 | 1.25 | 0.45 | 0.18 | 97 | 7 | 286 | 83 | N16° E; 7° SE | 8.53 | 3.8 | 2.61 | 0.03 |
| 17 | 6 | 61 | 3.2 | 0.65 | 0.04 | 0.66 | 68 | 14 | 330 | 28 | N60° E; 62° SE | 9.58 | 11.1 | 2.83 | 0.05 |
| 18 | 10 | 74.8 | 4.75 | 1.7 | 0.08 | 0.26 | 70 | 26 | 217 | 59 | N307° E; 31° NE | 6.53 | 5.7 | 2.91 | 0.05 |
| 19 | 6 | 87.9 | 3.86 | 2.18 | −0.33 | 0.24 | 156 | 38 | 281 | 36 | N11° E; 54° SE | 3.13 | 7.22 | 2.08 | 0.05 |
| 20 | 9 | 76.2 | 4.2 | 1.36 | 0.5 | 0.23 | 167 | 13 | 33 | 71 | N123° E; 19° SW | 11.47 | 3.04 | 2.2 | 0.03 |
| 21 | 8 | 66.4 | 4.47 | 2.79 | 0.53 | 0.26 | 64 | 8 | 256 | 82 | N166° E; 8° NE | 9.81 | 2.6 | 2.05 | 0.05 |
| 22 | 9 | 78.7 | 7.59 | 2.53 | 0.67 | 0.16 | 185 | 1 | 87 | 82 | N177° E; 8° W | 8.44 | 1.42 | 1.18 | 0.03 |
| 23 | 8 | 72.5 | 3.04 | 1.65 | 0.29 | 0.2 | 246 | 8 | 353 | 64 | N83° E; 26° SE | 6.31 | 3.1 | 2.03 | 0.03 |
| 24 | 7 | 73.4 | 2.06 | 1.89 | 0.53 | 0.2 | 314 | 1 | 45 | 36 | N135° E; 54° SW | 12.64 | 3.67 | 2.87 | 0.05 |
| 25 | 5 | 64.5 | 3.67 | 2.32 | 0.47 | 0.15 | 243 | 4 | 139 | 77 | N49° E; 13° NW | 6.56 | 3.12 | 1.74 | 0.04 |
| 26 | 6 | 79.5 | 9.76 | 2.1 | 0.18 | 0.17 | 196 | 6 | 97 | 55 | N7° E; 35° NW | 3.45 | 2.6 | 1.47 | 0.03 |
| 27 | 6 | 89.7 | 30.7 | 2.22 | 0.46 | 0.27 | 171 | 24 | 316 | 62 | N226° E; 28° SE | 5.2 | 1.5 | 1.02 | 0.02 |
| 28 | 6 | 75 | 6.74 | 2.64 | −0.23 | 0.26 | 12 | 20 | 140 | 60 | N50° E; 30° NW | 4.1 | 11.6 | 2.82 | 0.07 |
| 29 | 6 | 69.7 | 5.39 | 1.78 | 0.27 | 0.6 | 193 | 13 | 296 | 45 | N206° E; 45° SE | 22.13 | 10.4 | 4.67 | 0.08 |
| 30 | 6 | 73.3 | 4.95 | 8.04 | 0.42 | 0.09 | 199 | 5 | 21 | 85 | N111° E; 5° SW | 6.1 | 2.75 | 1.93 | 0.09 |
| Min | 17.4 | 0.88 | 0.61 | −0.37 | 0.09 | n.d. | 1.52 | 1.42 | 0.99 | 0.02 | |||||
| Max | 89.67 | 30.7 | 8.04 | 0.69 | 0.66 | 39.97 | 17.7 | 13.2 | 0.15 | ||||||
| σ | 12.29 | 5.06 | 1.33 | 0.29 | 0.14 | 7.48 | 3.99 | 2.16 | 0.03 | ||||||
| 73.4 | 5.65 | 2 | 0.3 | 0.28 | 166 | 5 | 328 | 85 | N58° E; 5° SE | 10 | 5.8 | 2.9 | 0.05 | ||
| Feature | Description |
|---|---|
| Fieldwork | |
| Altitude (min, max) | 461,670 m |
| Outcrop shape | Circular circumscribed body |
| Outcrop area | 7 km2 |
| Relationship with surrounding rocks | Sharp contact between the granite and the surrounding rocks |
| Grain size | Medium-grained |
| Texture | Slightly porphyritic (K feldspar megacrysts ~1 cm) |
| Enclaves | No enclaves were observed |
| Fracturing | Moderately fractured: 40° N–50° E, 30° N–40° E, 20° N–30° E and 0° N–10° E, corresponding to 46.29%. |
| Deformation patterns | No deformation patterns were observed, except for the fracturing |
| Petrography | |
| Main mineralogy | Quartz (~40%), K feldspar (~25%) and Na plagioclase (albite and albite–oligoclase, ~20%) |
| Accessory mineralogy | Muscovite, biotite, chlorite, apatite, rutile, zircon, monazite and opaque mineralogy (~15%) |
| Opaque mineralogy | Ilmenite, hematite, arsenopyrite and pyrite |
| Later alterations | Sericitization of Na plagioclase, chloritization, the muscovitization of biotite and the oxidation of Fe-bearing minerals |
| Microstructures | Essentially magmatic to submagmatic with low-T solid stage microstructures |
| Microfracturing | |
| Fluid inclusion planes | 40° N–50° E, 50° N–60° E, 60° N–70° E, 70° N–80° E |
| Absolute frequency | 16.24%, 11.11%, 10.26% and 9.4%, respectively |
| Anisotropy of magnetic susceptibility | |
| Magnetic susceptibility (Km) | 73.4 µS.I. |
| Paramagnetic anisotropy (Ppara) | 2.0% |
| Magnetic ellipsoid shape (T) | 0.3 |
| Magnetic foliation | 58° NE; 5° SE |
| Magnetic lineation | 5°/196° N |
© 2020 by the authors. Licensee MDPI, Basel, Switzerland. This article is an open access article distributed under the terms and conditions of the Creative Commons Attribution (CC BY) license (http://creativecommons.org/licenses/by/4.0/).
Share and Cite
Gonçalves, A.; Sant’Ovaia, H.; Noronha, F. Geochemical Signature and Magnetic Fabric of Capinha Massif (Fundão, Central Portugal): Genesis, Emplacement and Relation with W–Sn Mineralizations. Minerals 2020, 10, 557. https://doi.org/10.3390/min10060557
Gonçalves A, Sant’Ovaia H, Noronha F. Geochemical Signature and Magnetic Fabric of Capinha Massif (Fundão, Central Portugal): Genesis, Emplacement and Relation with W–Sn Mineralizations. Minerals. 2020; 10(6):557. https://doi.org/10.3390/min10060557
Chicago/Turabian StyleGonçalves, Ana, Helena Sant’Ovaia, and Fernando Noronha. 2020. "Geochemical Signature and Magnetic Fabric of Capinha Massif (Fundão, Central Portugal): Genesis, Emplacement and Relation with W–Sn Mineralizations" Minerals 10, no. 6: 557. https://doi.org/10.3390/min10060557
APA StyleGonçalves, A., Sant’Ovaia, H., & Noronha, F. (2020). Geochemical Signature and Magnetic Fabric of Capinha Massif (Fundão, Central Portugal): Genesis, Emplacement and Relation with W–Sn Mineralizations. Minerals, 10(6), 557. https://doi.org/10.3390/min10060557