Article

An X-ray Absorption Near-Edge Structure (XANES) Study on the Oxidation State of Chromophores in Natural Kunzite Samples from Nuristan, Afghanistan

1
Gemmological Institute, China University of Geosciences, Wuhan 430074, China
2
Gems & Jewellery Centre of Excellence, University of Engineering & Technology Peshawar, Peshawar 25120, Pakistan
3
Private Scientific Consultant, D-24558 Henstedt-Ulzburg, Germany
4
Department of Jewelry Technology, Dahan Institute of Technology, Hualian, Taiwan
5
Synchrotron Light Research Institute, 111 University Avenue, Muang, Nakhon Ratchasima 30000, Thailand
*
Author to whom correspondence should be addressed.
Minerals 2020, 10(5), 463; https://doi.org/10.3390/min10050463
Submission received: 26 April 2020 / Revised: 16 May 2020 / Accepted: 17 May 2020 / Published: 20 May 2020
(This article belongs to the Special Issue X-ray Absorption Spectroscopy of Synthetic and Natural Minerals)

Abstract

:
Kunzite, the pink variety of spodumene is famous and desirable among gemstone lovers. Due to its tenebrescent properties, kunzite always remains a hot research candidate among physicists and mineralogists. The present work is continuing the effort towards value addition to kunzite by enhancing its color using different treatments. Before color enhancement, it is essential to identify the chromophores and their oxidation states. In this paper, the authors investigated the main impurities in natural kunzite from the Nuristan area in Afghanistan and their valence states. Some impurities in the LiAlSi2O6 spodumene structure were identified and quantified by using sensitive techniques, including Laser Ablation Inductively Coupled Plasma Mass Spectrometry (LA-ICP-MS), UV−VIS and X-ray absorption near-edge structure (XANES). LA-ICP-MS indicated many trace elements as impurities in kunzite, among which Fe and Mn are the main elements responsible for coloration. The oxidation states of these two transition elements were determined by the XANES technique. The study reveals that Mn is present in both Mn2+ and Mn3+ oxidation states, while Fe is present only in Fe3+ oxidation state.

1. Introduction

The silicate materials are of special interest for science and technology due to their wide applications in optical and semi-conductor devices [1]. Spodumene (LiAlSi2O6) is widely utilized in ceramics and glass manufacturing and is an important source of Li. It is a member of the pyroxene mineral group and normally the stable low-temperature type of spodumene (α-spodumene) crystallizes in a monoclinic crystal system with space group C2/c. According to Figure 1 it has two inequivalent metal cation sites M1 and M2 in the same crystallographic plane [2]. Aluminum occupies the slightly distorted M1 site, which is octahedrally coordinated with an average metal oxygen distance of 1.92Å; while the M2 site is occupied by Li, which is also six-fold coordinated with an average metal-oxygen distance of 2.23Å [3,4]. There is only one type of tetrahedral site, which is completely occupied by silicon in pyroxene and is not involved in producing colors. O(1), O(2) and O(3) are three crystallographically non-equivalent oxygen atoms in the spodumene crystal structure. The oxygen atom “O(3)” is referred to as a bridging oxygen and is bonded to two silicon atoms, whereas O(1) and O(2) are both non-bridging oxygen atoms [5].
In spodumene, both atoms (Li and Al) can be replaced by transition metal elements, such as Mn, Fe, Cr and others, as it belongs to the group of allochromatic minerals. According to the gemmological point of view, the minor and trace elements are mostly responsible for producing color in allochromatic gemstones. Furthermore, the gemstones and common minerals can be differentiated through minor and trace elements [6], and in particular, when V3+, Cr3+, Mn3+, Fe2+, Fe3+ and Mn2+ exist in high concentration, they can produce strong coloration in gemstones. The d-orbital electrons of these transition elements are responsible for coloration [7]. The distribution of trace elements in the gemstones also works as a “fingerprint” in finding the locality of their mining origin [7]. In a gemstone, the existence of trace and light lithophile elements can also be used to distinguish between natural and synthetic samples, as well as to give evidence about its synthesis methodology [8,9,10].
Spodumene possesses three varieties (kunzite, triphane and hiddenite) with brilliant colors and they are used as semi-precious gemstones. The two well-known varieties kunzite and hiddenite were named after the esteemed American geologists and collectors George F. Kunz and William E. Hidden, respectively [11]. Kunzite is a major source of Li, which is used in different materials, such as mobile phones and automotive batteries, in lithium carbonate production, ceramics and as flux agent [12,13].
Due to its pink to lilac hue kunzite is more acceptable for use in jewelry. The lilac color shows up when the Mn/Fe concentration ratio is larger than 1 [14]. Spodumene is a comparatively new mineral in scientific studies, being discovered in the last two centuries while its gem quality has only been known for about 100 years [15]. Spodumene in the green and dark pink color (kunzite) is acceptable to people for use in jewelry, but if the color is light pink then people do not like it, just like pink topaz. In fact, the color of gemstones is very important in the jewelry industry and one important factor is that gemstones are valued by their color. The light pink colored kunzite is abundantly available on the Pakistan gemstone market and needs color enhancement for value addition and to enable it for use in jewelry. People perform color treatment locally without knowing any standard parameters and ways, resulting in a lot of kunzite going to waste every year, although different quantitative analyses and EPR were already used and the results were published regarding the oxidation state of kunzite. However, there has not yet been reported an X-ray absorption near edge structure (XANES) study for checking the chromophore oxidation states in kunzite. It is the purpose of this paper to evaluate the oxidation states of the color-causing chromophore in kunzite by using the XANES technique.
X-ray absorption spectroscopy using intense synchrotron radiation looks to be the method of choice for materials that are generally low in concentration and/or small in total sample size [16]. This technique is atomic specific and is even sensitive to low concentration (10 ppm or lower) as well as low sample mass (~µg with third-generation synchrotron sources). Chemical information such as valence, coordination geometry, bond distances, and ligand coordination numbers can be obtained with high accuracy [17]. As gemstones are precious, non-destructive techniques are usually preferred for their analysis. XANES is a non-destructive and element-selective technique and the samples need virtually no chemical parameters. Furthermore, this technique applies to both crystalline materials and also to amorphous phases [18]. Here we only focus on the energy position of the absorption edges from which the oxidation numbers can be derived. Evaluation of the extended X-ray absorption fine structure (EXAFS) showing up in a photon energy regime about 50 eV above the edge energy cannot be evaluated because of noise issues. Thus, the bond lengths and coordination numbers are not derived here.
The aim of this study is to develop methods and parameters in order to enhance the kunzite color for value addition but before doing any treatment it is necessary to confirm the chemistry and the oxidation states of the coloring elements in the samples used for the current research.

2. Samples Site, Materials and Analytical Methods

2.1. Samples Site

The sample material for this study was kunzite from the Nuristan District, Afghanistan. Literally hundreds of thousands of carats of fine kunzite have emerged from the Nuristan region, northwest of Kabul since active mining began there in the early 1970s [11]. The spodumene crystals from the Nuristan region are among the best variety of this mineral ever found [19].
The kunzite samples for the current research were collected from a mine owner (named Khalid Habib, main dealer of Afghanistan kunzite and Swat emeralds) in Namak Mandi Peshawar, Khyber Pakhtunkhwa (KPK), Pakistan.

2.2. Sample Preparation

Figure 2A,B and Figure 3 show kunzite samples before cutting and after cutting, the samples for the current research work were selected on color variation basis. The kunzite crystals were cut into 21 cut stones with different cutting styles (Figure 2B) and 6 wafers with dimensions 2 cm × 2 cm × 0.5 cm (length, width and thickness, respectively) and both surfaces were polished with diamond powder as shown in Figure 3.

2.3. Analytical Methods

2.3.1. LA-ICP-MS

Quantitative chemical analyses of major and trace elements were performed with LA-ICP-MS at Wuhan Sample Solution Analytical Technology Co., Ltd., Wuhan, China. The GeolasPro laser ablation system(Coherent, Inc., Santa Clara, CA, USA) used in the tests was developed by COMPexPro102 (Coherent, Inc., Santa Clara, CA, USA) and the ArF 193nm Laser by MicroLas optical system (Coherent, Inc., Santa Clara, CA, USA) The ICP-MS system used in the 7900 ICP-MS was from Agilent Technologies, Inc., Santa Clara, CA, USA. The carrier gas was helium and argon was used as the makeup gas to adjust the sensitivity. The laser beam spot diameter is 44 µm having an intensity of 5.5 J/cm2. Glass reference materials BHVO-2G, BCR-2G, BIR-1G and NIST 610 were used. Every two samples, analyses were followed by calibration of the instrument by SRM610, in order to correct the time-dependent drift of sensitivity and the mass discrimination.

2.3.2. X-ray Absorption Near-Edge Structure (XANES)

Pre-edge and XANES spectra at the Fe K-edge and Mn K-edge were collected at the Beam Line BL5.2 XAS, Synchrotron Light Research Institute (SLRI), Thailand. The storage ring operation conditions were 1.2 GeV electron energy and 100 mA. The beam size at the sample position was 20 mm (width) × 1 mm (height). A Ge (220) double-crystal monochromator with 2d spacing of 4.001 Å and a silicon drift detector were used for these experiments. The XANES data were collected in the fluorescence mode with the sample positioned 45° with respect to the beam. Moreover, the fluorescence spectra were collected by fixed energy-range windows which did not include both the elastic and the inelastic/Compton signals. The measured fluorescence intensity IF is proportional to the X-ray absorption coefficient μ(E) and the incident intensity I0 (IF ~ μ(E)*I0), from which μ(E) ~ IF/I0 is derived.

2.3.3. UV−Visible Spectroscopy

In order to correlate the observed color to the specific chromophore, precise measurements of the absorption feature through a known optical path in the UV−visible spectrometer were required. For UV−visible spectroscopy the same kunzite samples as for XANES were used. In addition, to check the absorption spectrum along the c-axis, a wafer from each sample was cut perpendicular to the c-axis and polished. UV−visible spectra were collected with a PerkinElmer Lambda650 UV/Vis spectrometer equipped with mercury and tungsten light sources and photomultiplier tube/PbS detector that were built into an integrating sphere. In order to do the precise and accurate quantitative analyses, a custom-made sample holder was used to conform to the precise positioning of the sample area in a 3 mm diameter window. The spectra were collected at the Gemmological Institute, China University of Geosciences, Wuhan.

3. Results and Discussion

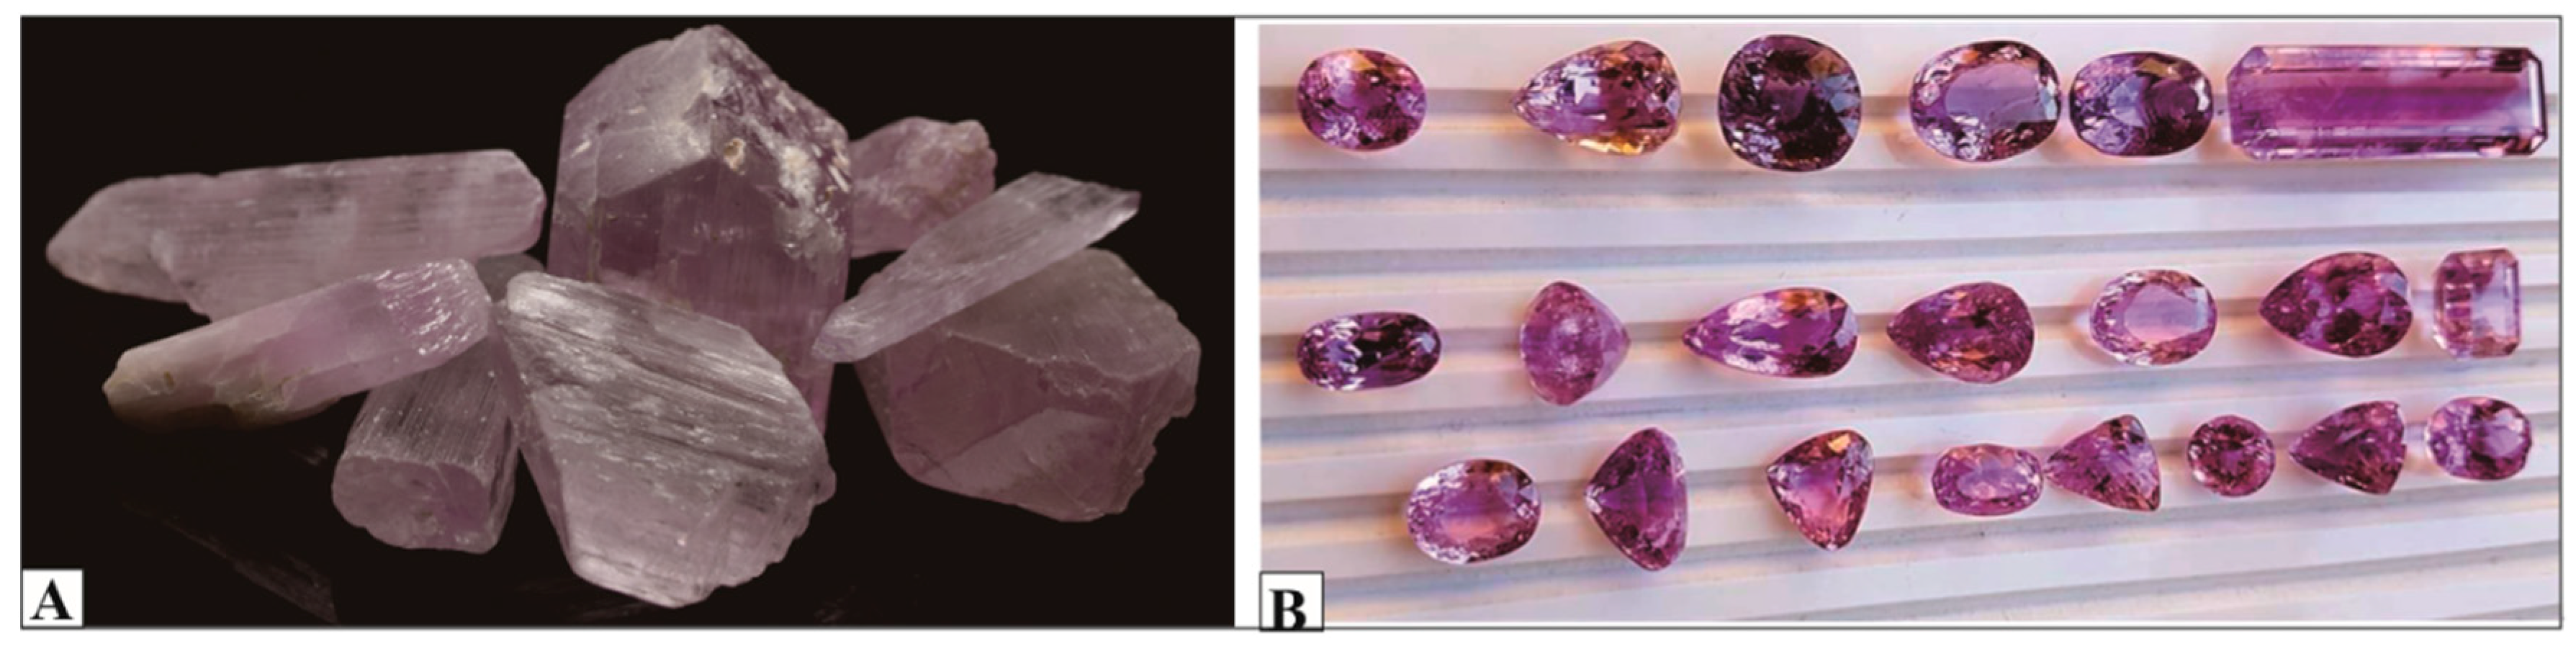
3.1. Gemmological Observations
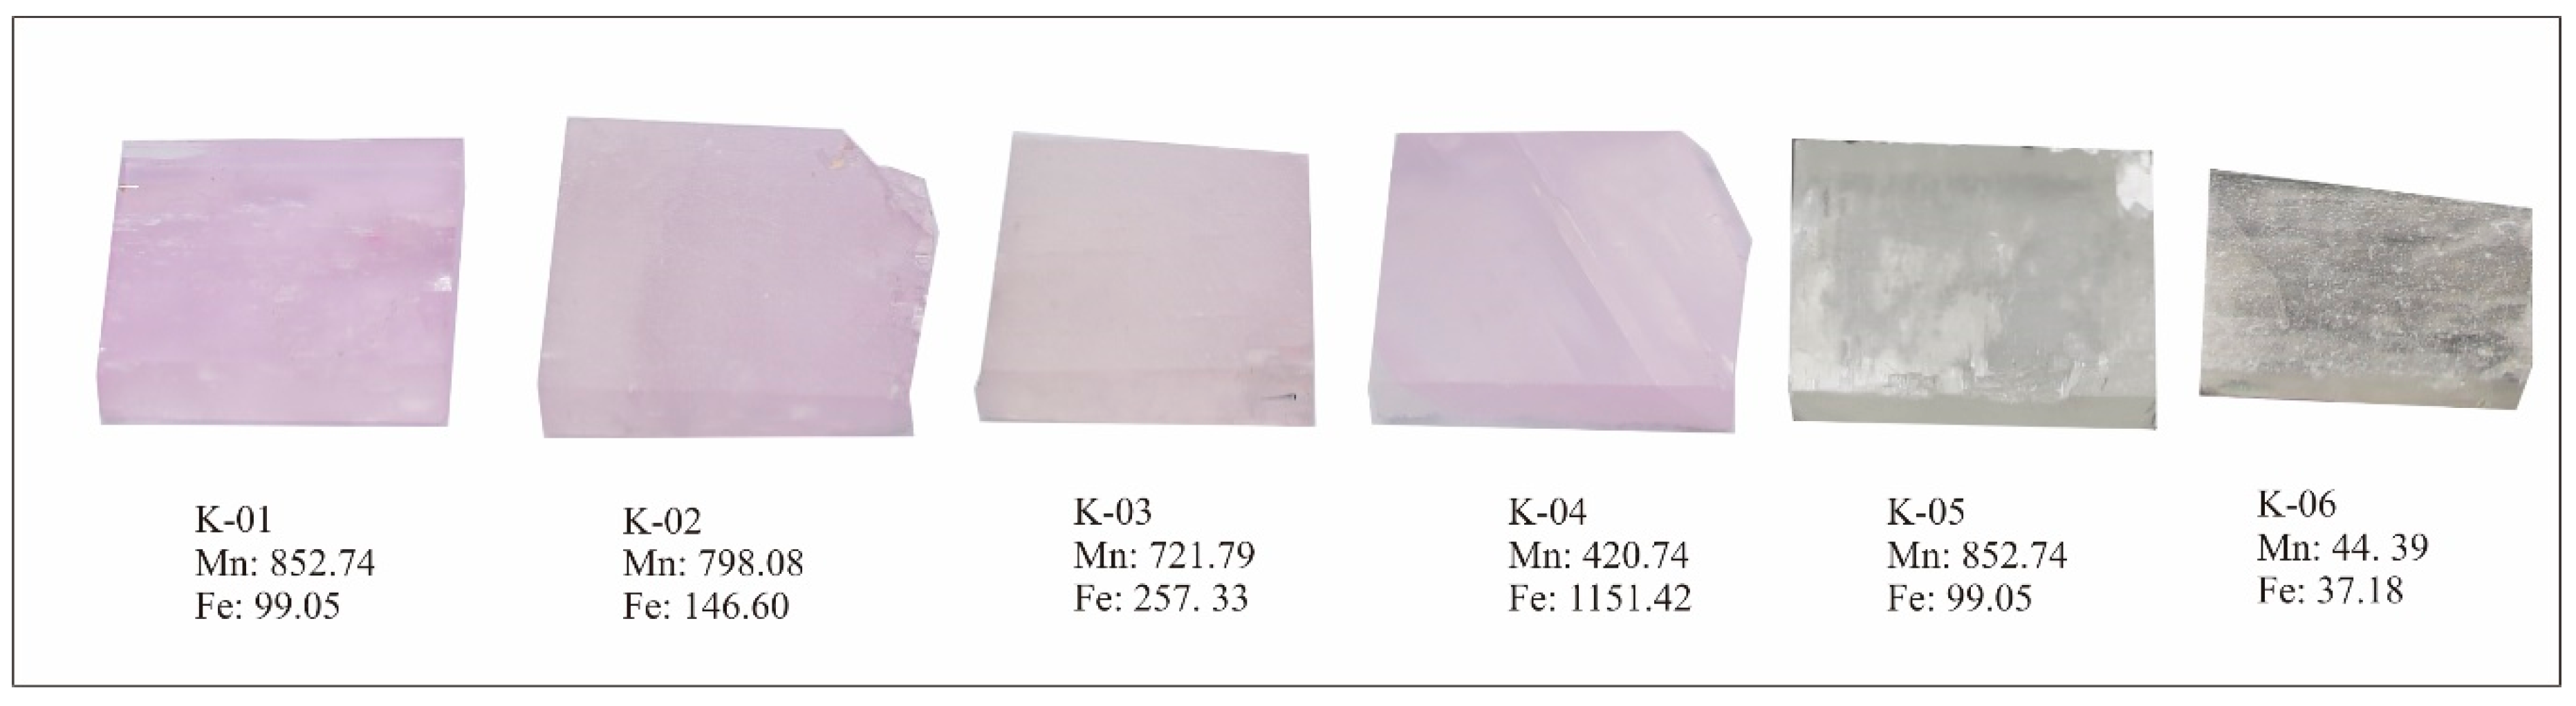
Spodumene belongs to the monoclinic crystal system and is usually found in prismatic form, highly flattened, and strongly striated along the c-axis {100} direction. Spodumene shows good {110} cleavage with the angle between {110} and {110} at about 87 degrees and has a parting on {100} and {010}. The fracture is from uneven to sub-conchoidal and is brittle having a directional hardness from 6.5 to 7.5 [3,20]. The refractive index was checked by using a standard refractometer and the values were noted, = 1.661, = 1.663 and = 1.676. Similarly, the pleochroism was checked in different directions by using a calcite dichroscope and showed colors from pink-green and pink to colorless (trichroic).

3.2. LA-ICP-MS

The quantitative chemical analyses of 27 kunzite samples were performed and the concentration average of major and trace elements are shown in Table 1 and Table 2, respectively. The main chromophores for producing color are Mn and Fe. The lilac color in kunzite occurs when the Mn/Fe ratio is larger than 1 [14], while the Mn/Fe concentration ratios in the investigated samples were 1.96.

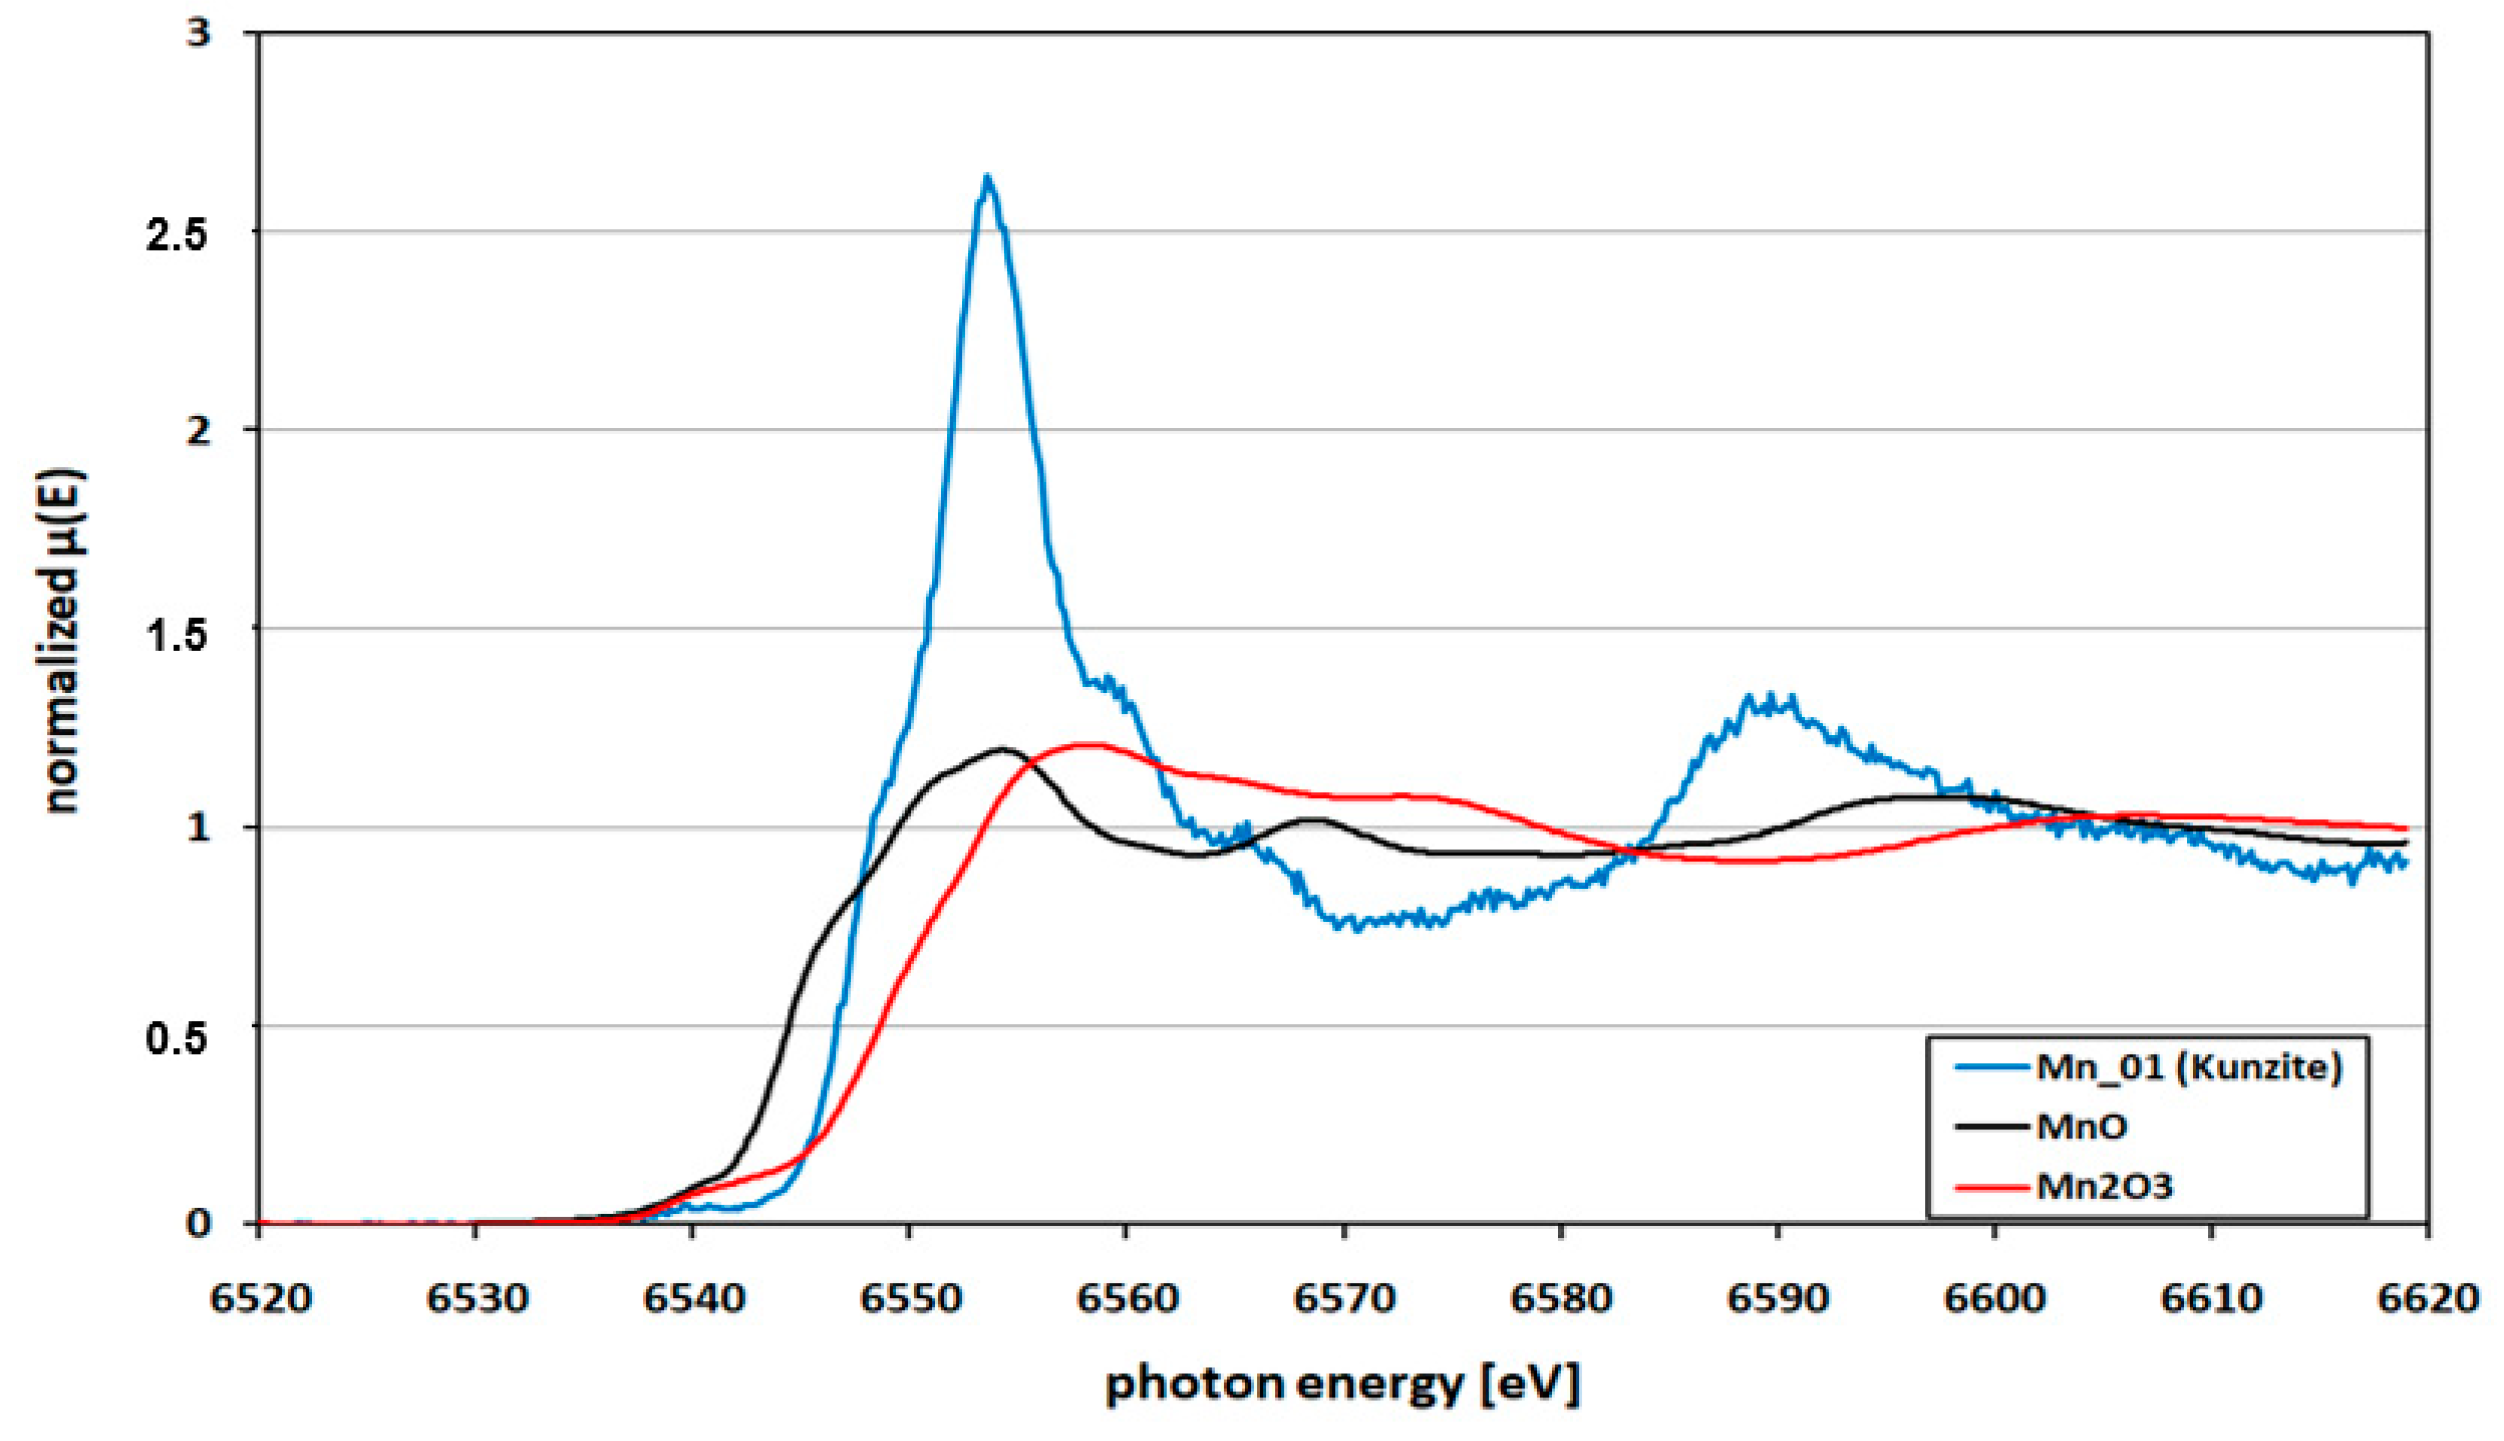
3.3. X-ray Absorption Spectroscopic Analysis

X-ray absorption spectroscopy (XAS) is the study of X-ray beams absorbed by an electron near and above the core-level binding energies of an atom. XAS is associated with the chemical and physical states of the absorbing atoms. Therefore, it is sensitive to the valence state, bond lengths and the coordination numbers of the neighboring atoms [21,22]. The study of a sample based on XAS provides significant evidence of the above properties on the atomic scale. Fundamentally, each XAS spectrum from an absorbing atom is divided into three characteristics regions named the pre-edge, X-ray absorption near edge structure (XANES) and the extended X-ray absorption fine structure (EXAFS). The pre-edge region in the spectrum is associated with the transitions from core electrons to bound states, such as from 1s to nd, (n + 1) s or (n + 1) p orbitals of the K edge. The second part is the XANES region which gives information about the valence states of the absorbing atom, while the EXAFS analysis gives us information about the geometric structure, such as bond distances and coordination numbers of the neighboring atoms. The fine structure in the EXAFS region, is due to the interference of outgoing and incoming electron waves, and is thus dependent on the immediate environment surrounding the absorbing atom [23]. In the current study the XAS experiments were performed in order to evaluate the oxidation states of Mn and Fe in kunzite samples. The XANES spectra of Mn and Fe are shown below in Figure 4 and Figure 5, while the EXAFS spectra were very weak, and indistinguishable from background noise due to the low concentration of Mn and Fe in the samples.
The above mentioned prepared samples (shown in Figure 3) were used for XANES analyses, the XANES spectra and the EXAFS interference functions were extracted from the measured absorption spectra using the Athena and Artemis software programs [24].

3.3.1. Distribution of Mn

Figure 4 shows the Mn K-edge XANES spectra of the kunzite sample K-01 (spectrum: Mn-01) together with those of standard oxides MnO and Mn2O3. In total six kunzite samples were checked; all showed the same shape, very similar to the one in Figure 4. The edge position was defined as the first maximum of 1st derivative of the normalized XANES spectra. The edge of the present kunzite samples was just between those of the standard oxides, suggesting a mixed valence state of Mn (i.e., Mn2+ and Mn3+). This showed that the investigated samples of kunzite contain Mn in Mn2+ and Mn3+ oxidation states. A second definition of the position of the K-edge was the use of the inflection point at the edge jump. Thus, the positions were alternatively evaluated by normalizing the obtained data for Mn K-edge of kunzite samples then taking the first derivative and by using the linear combination process to compare the obtained spectrum with a mixture of the standard MnO and Mn2O3 spectra.

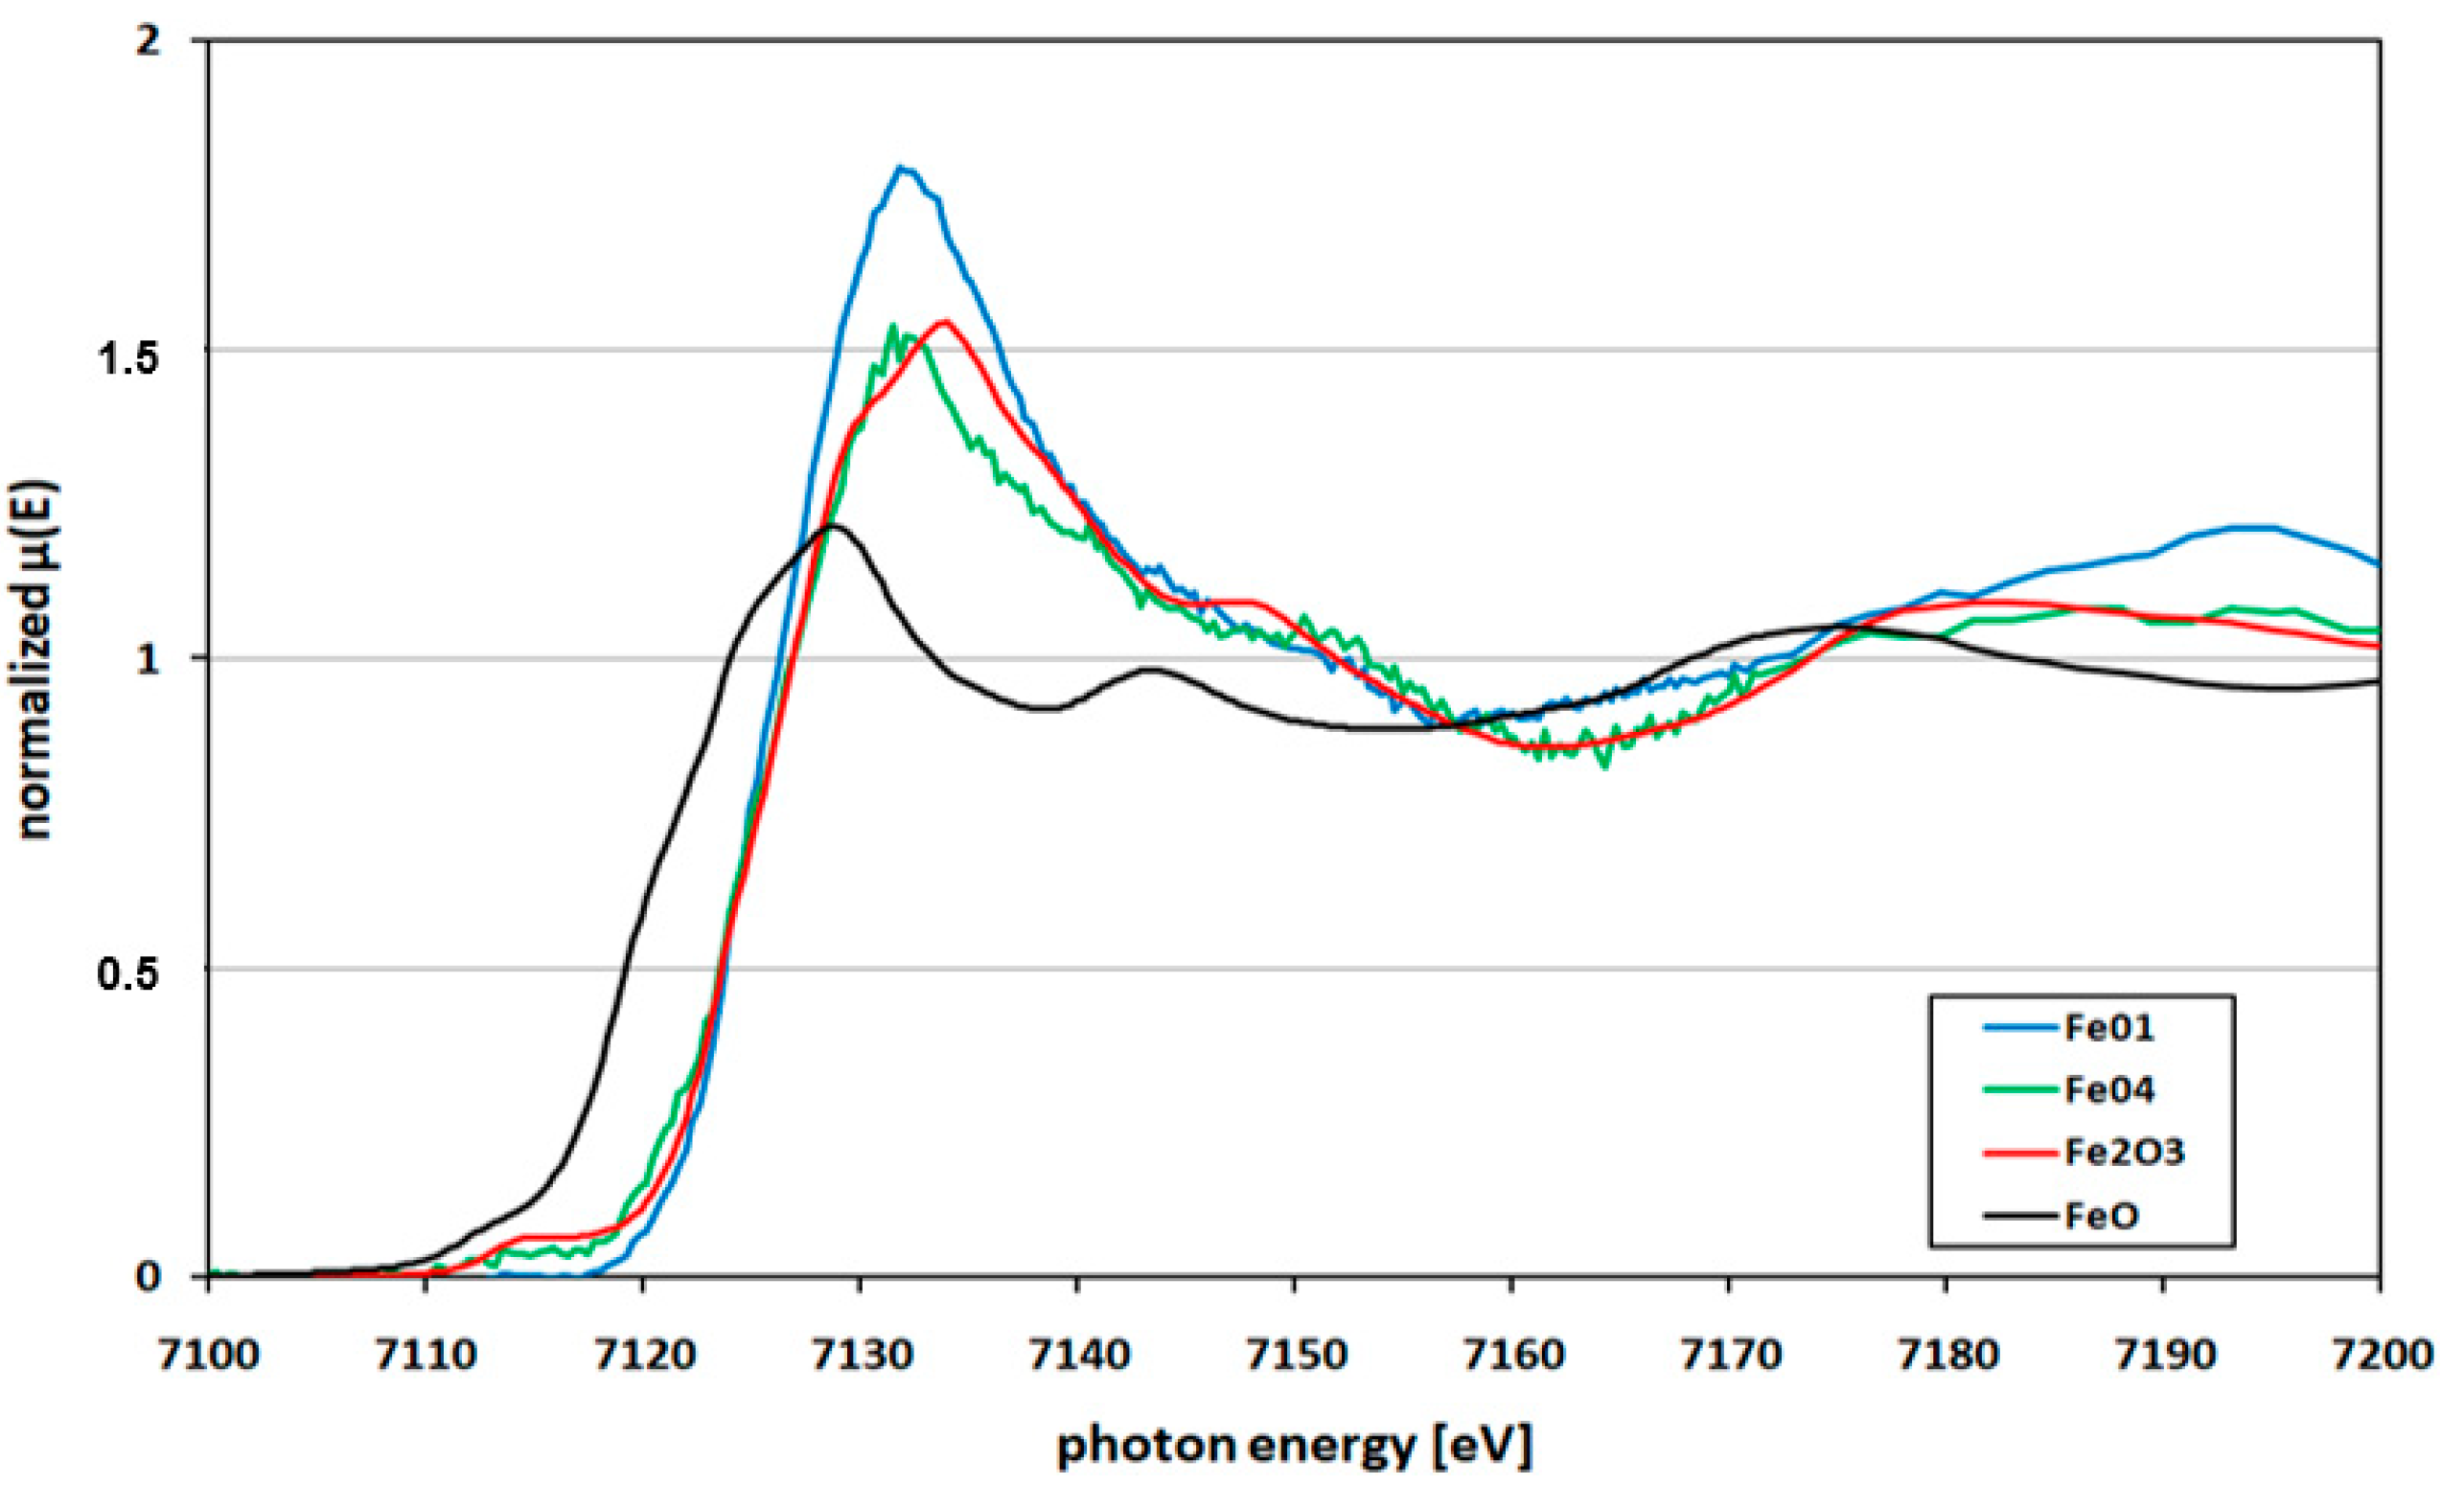
3.3.2. Distribution of Fe

Figure 5 shows the Fe K-edge XANES spectra of kunzite sample K-01 and K-04 (spectra Fe-01 and Fe-04) as an example together with those of standard oxides of FeO and Fe2O3. In this case the same six samples were tested for Fe oxidation state. The edge positions of the analyzed kunzite samples were exactly matching with standard oxide Fe2O3, which clearly shows the Fe present solely in Fe3+ oxidation state.

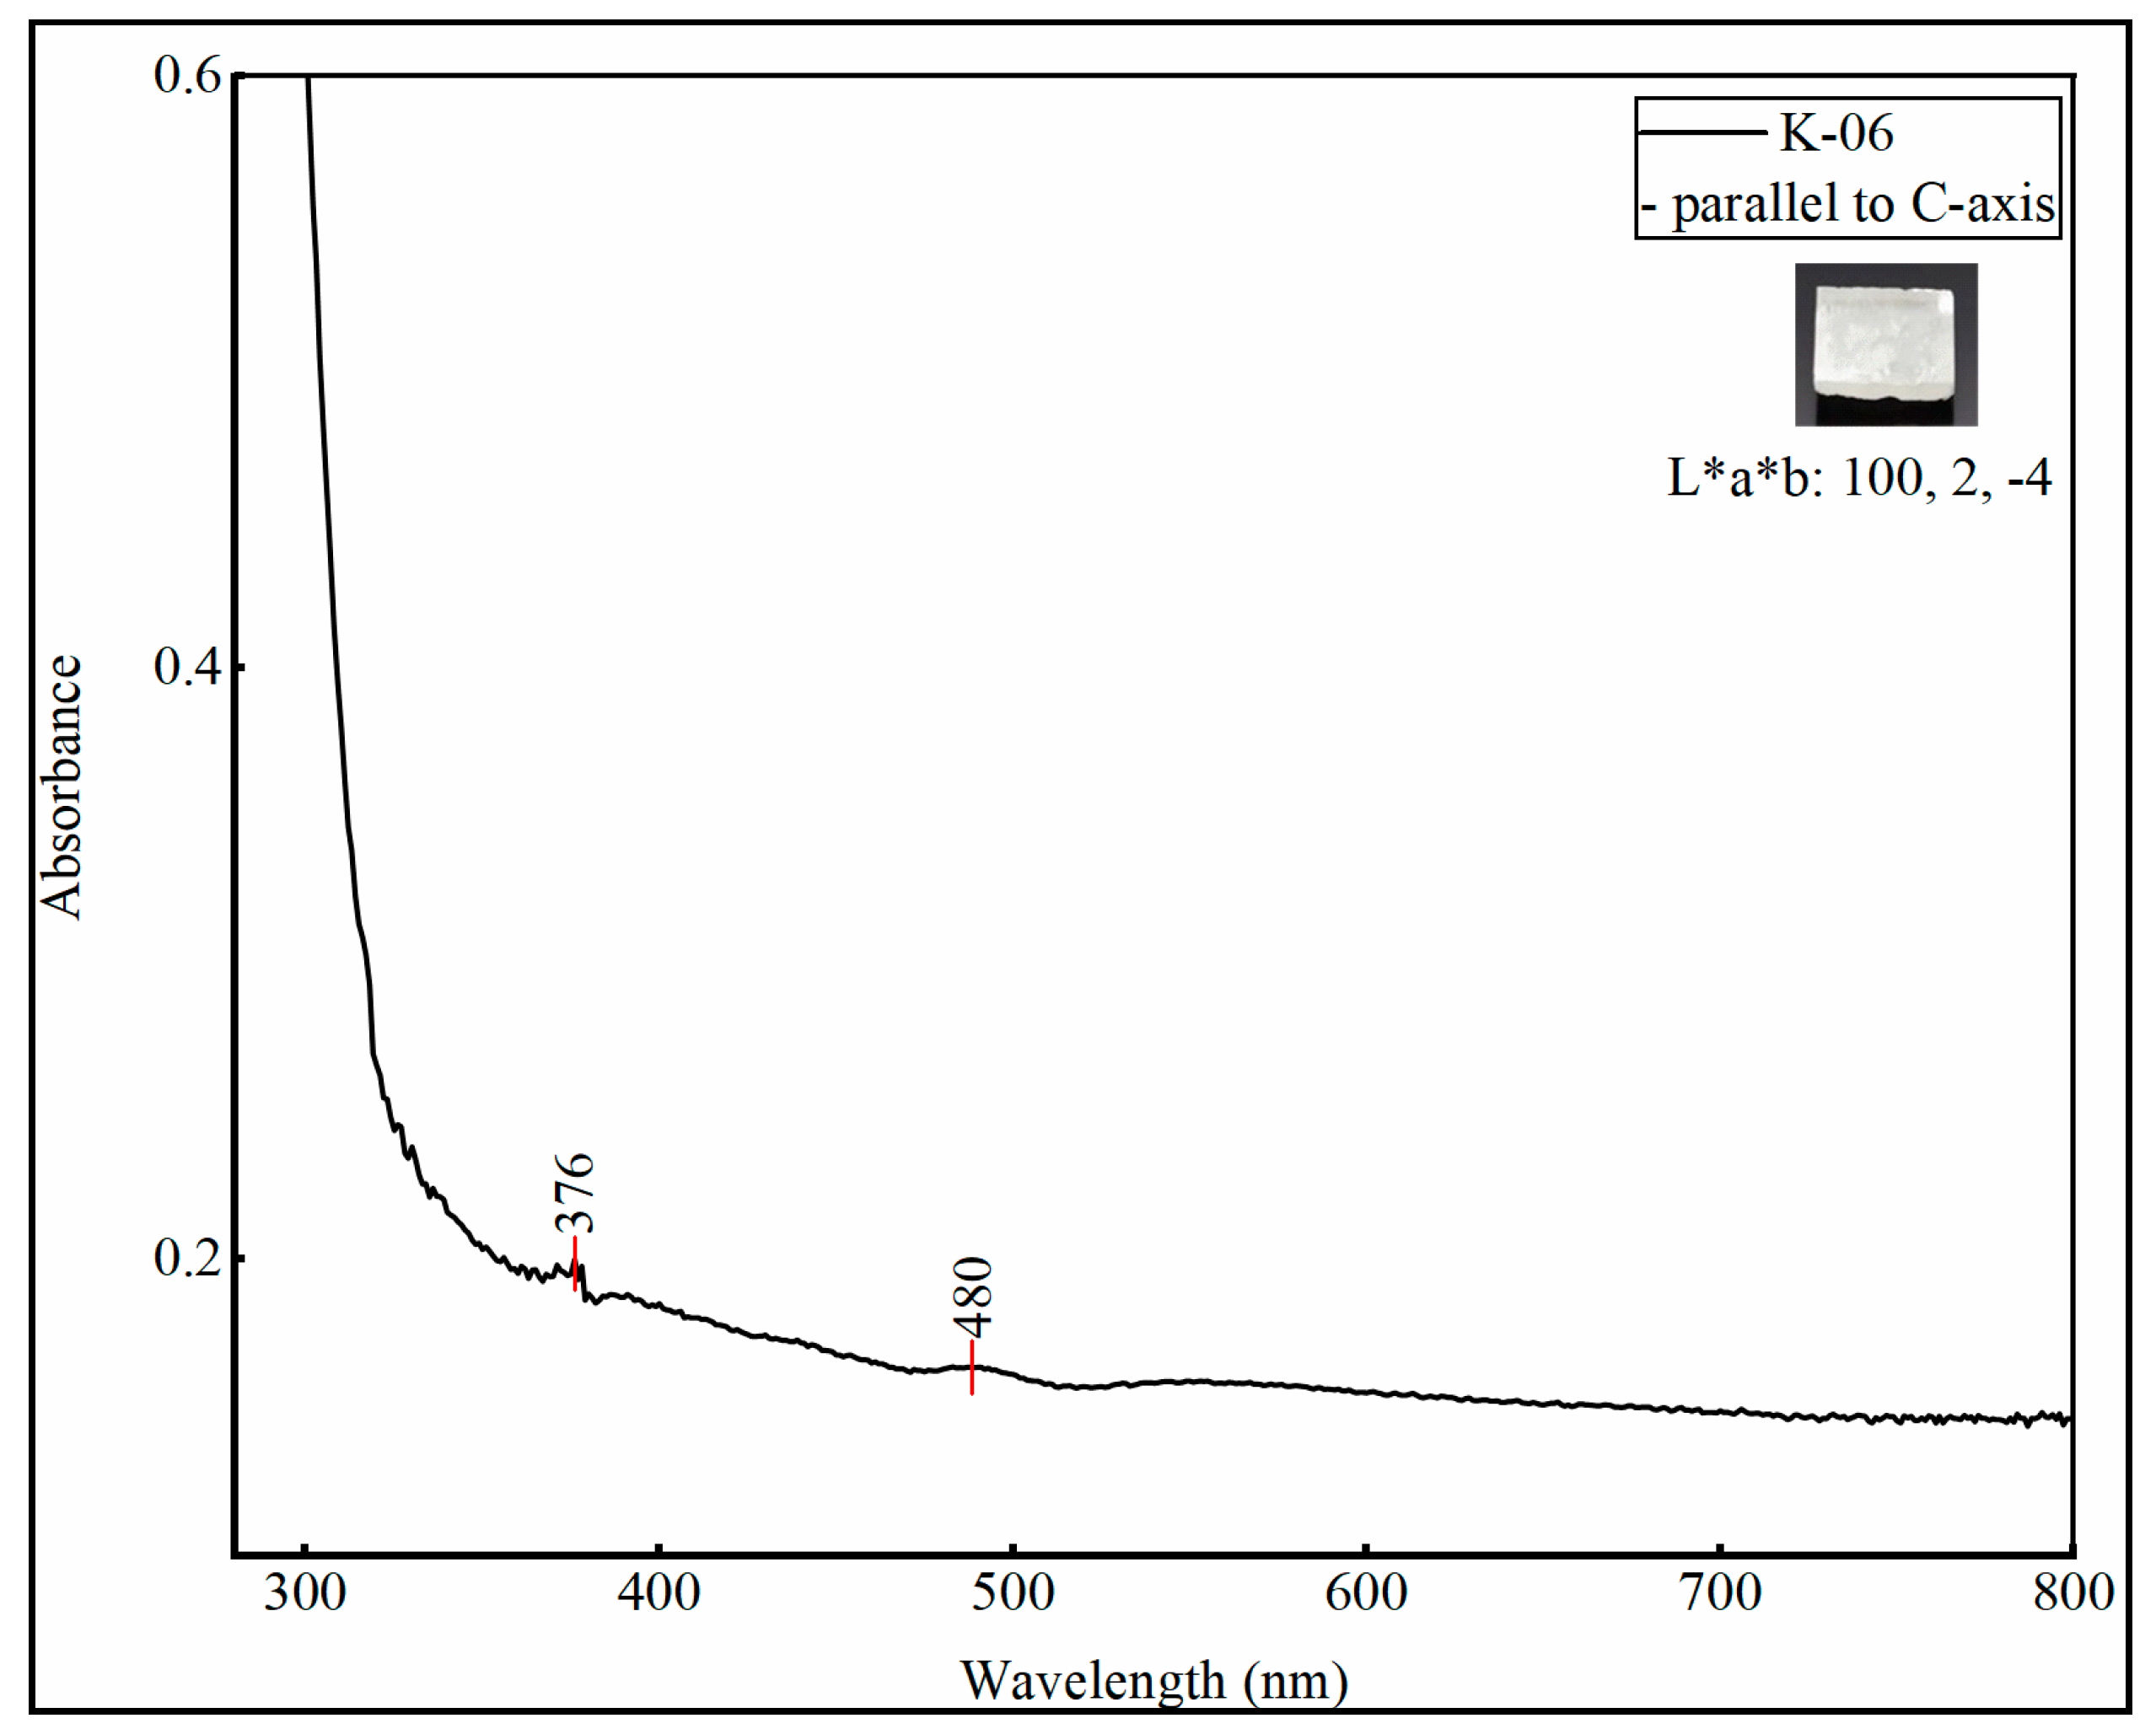
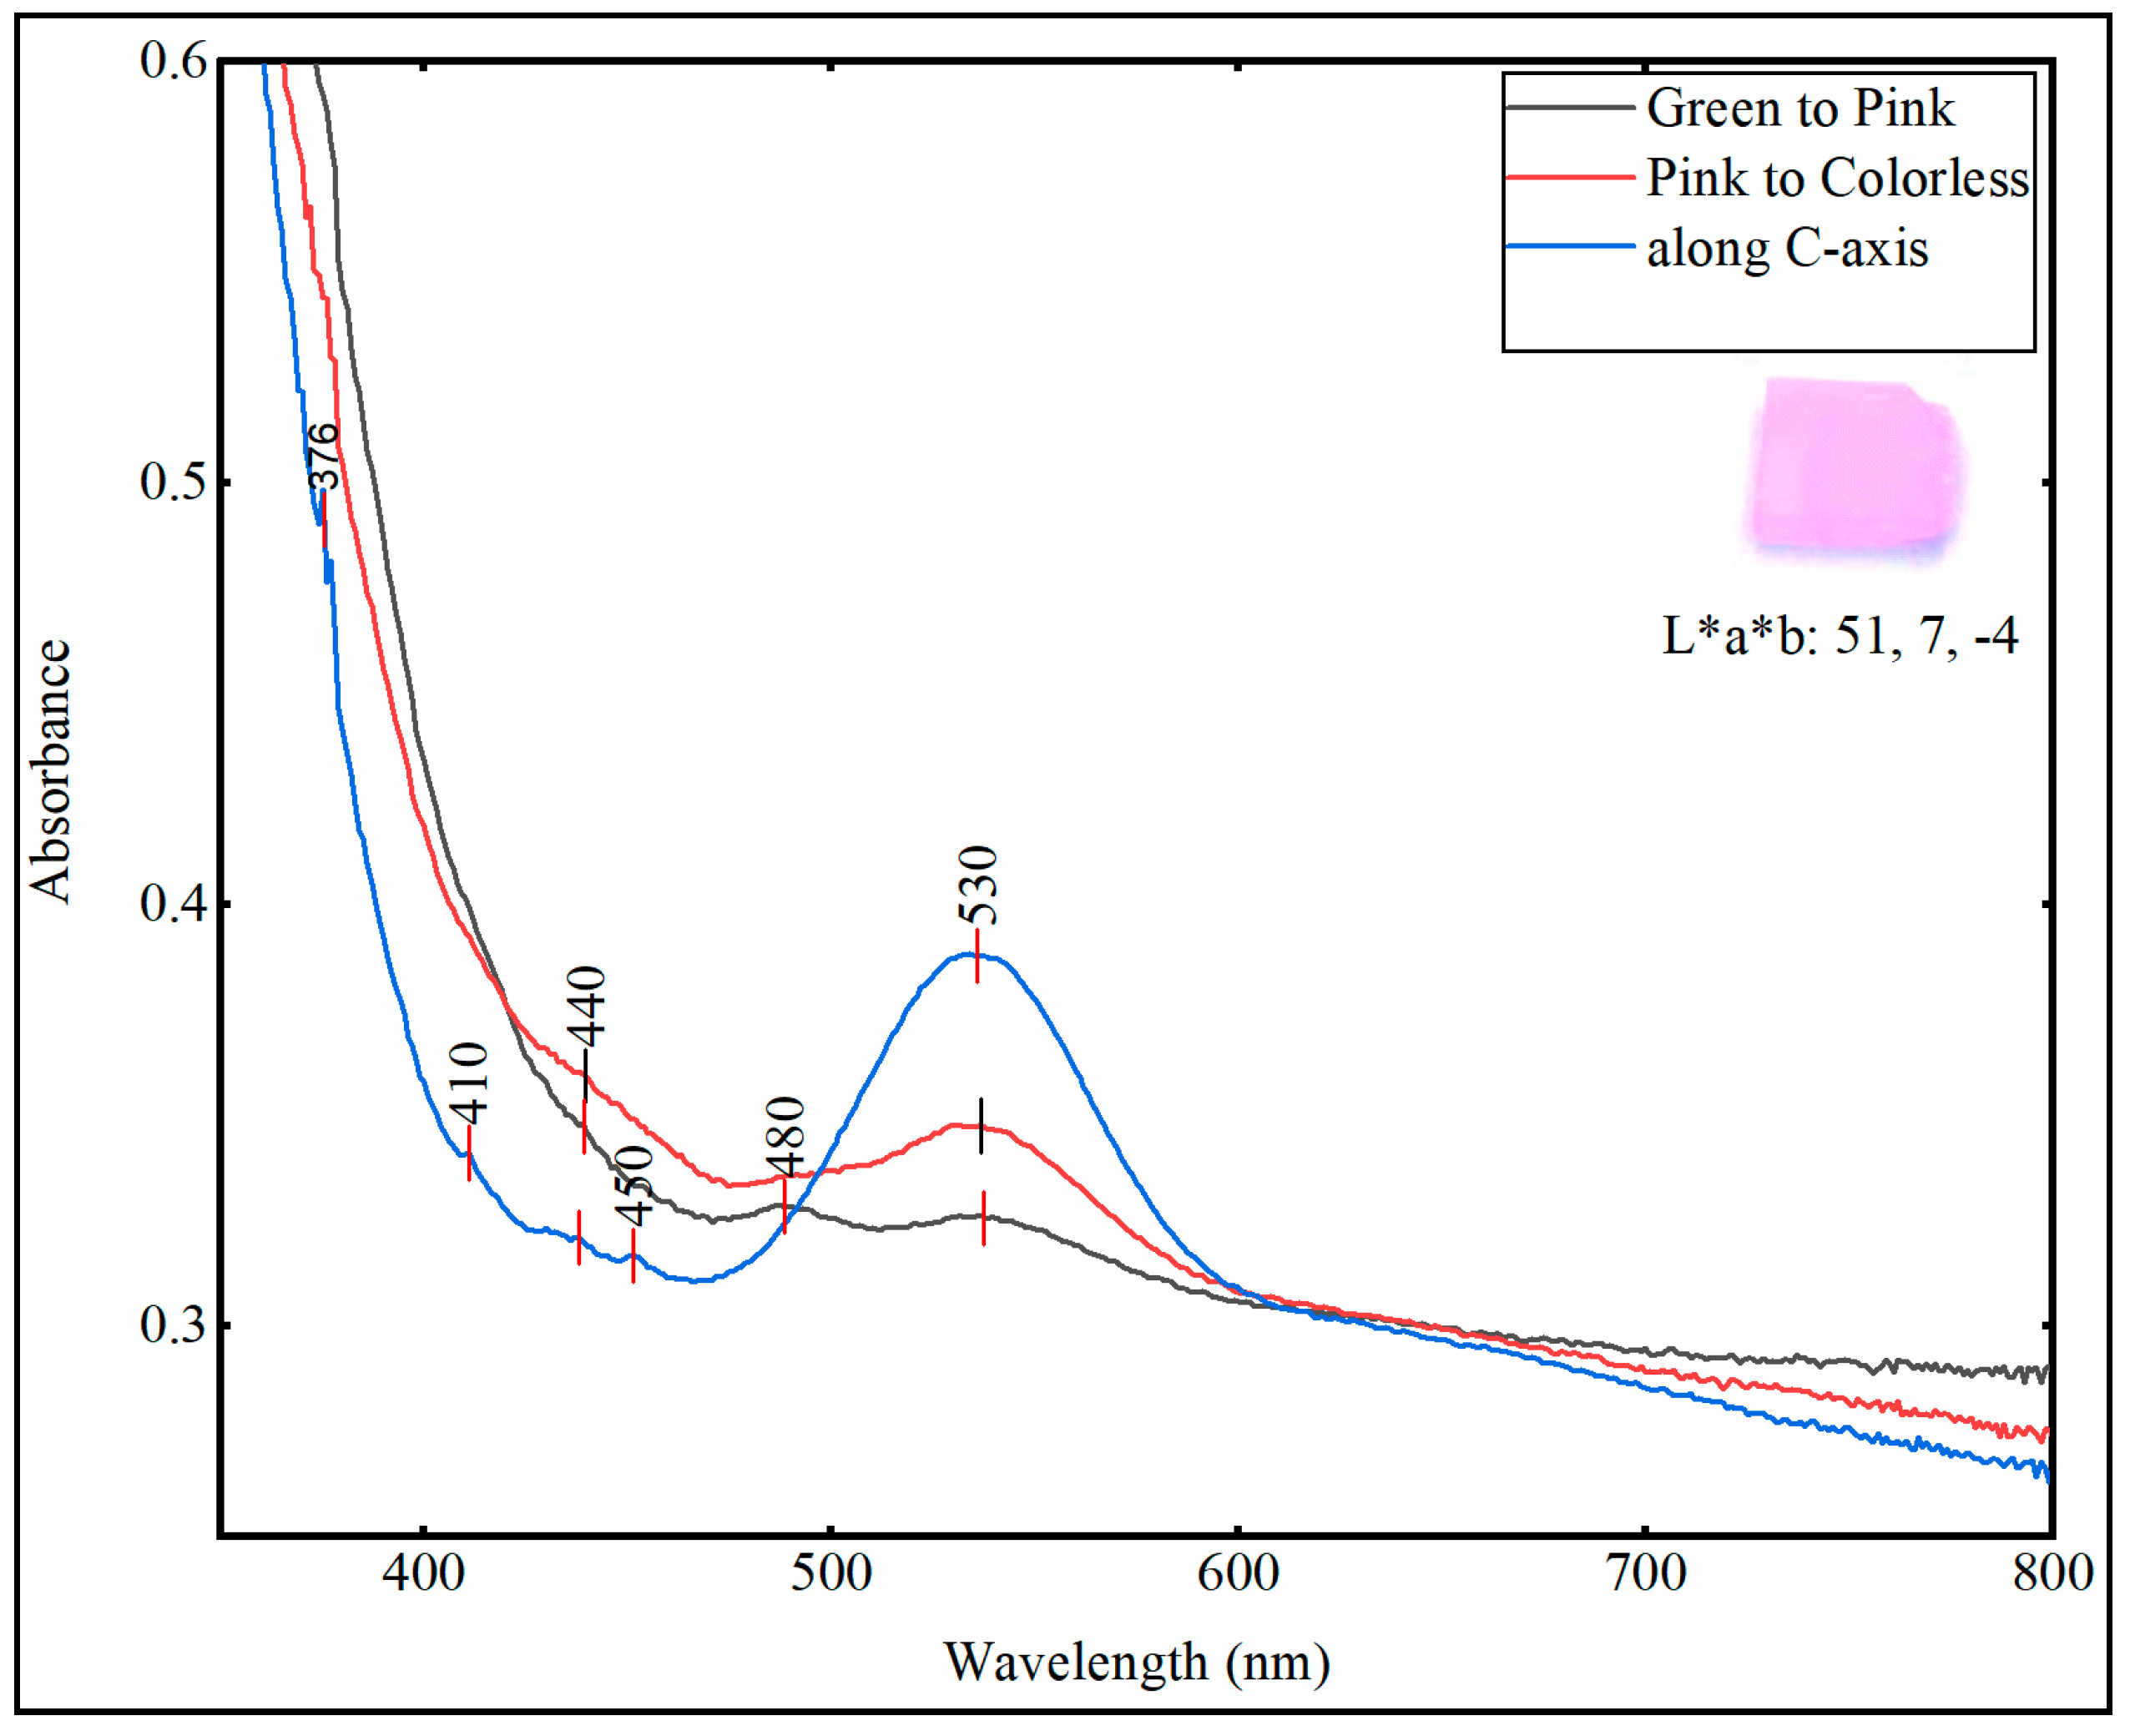
3.4. UV—Visible Spectroscopy

Kunzite belongs to the monoclinic crystal system and is therefore trichroic, i.e., shows three colors when checked through the dichroscope. The pleochroism was checked in all optical directions by using a gemmological handheld calcite dichroscope. The pleochroism varied from green-pink and pink to colorless, the UV—visible spectra of all the samples were checked in these optical directions and also along the direction parallel to the c-axis. All the kunzite samples, except sample K-06 exhibited the absorbance peaks in the same wavelength regions, with little variation in peak intensity due to the variation in chromophore concentration.
The sample K-06 (white spodumene) due to the very low concentration of chromophores, did not show any significant absorbance in the visible region as depicted in Figure 6; there was only a little absorption at 376 nm and 480 nm. All the samples (K-01 to K-05) showed very weak absorption bands in the ultraviolet region at 376 nm and in the visible region between 400 to 500 nm (410, 440, 450 and 480 nm), the absorption is due to Fe3+ [25,26], in Figure 7 only one spectrum is represented for explanation. There was a strong absorption band at 530 nm and the absorbance was intense along c-axis as compared to another optical axes. The absorption in this region was due to Mn3+ ions, which was correlated to the original lilac color of kunzite [1,27].

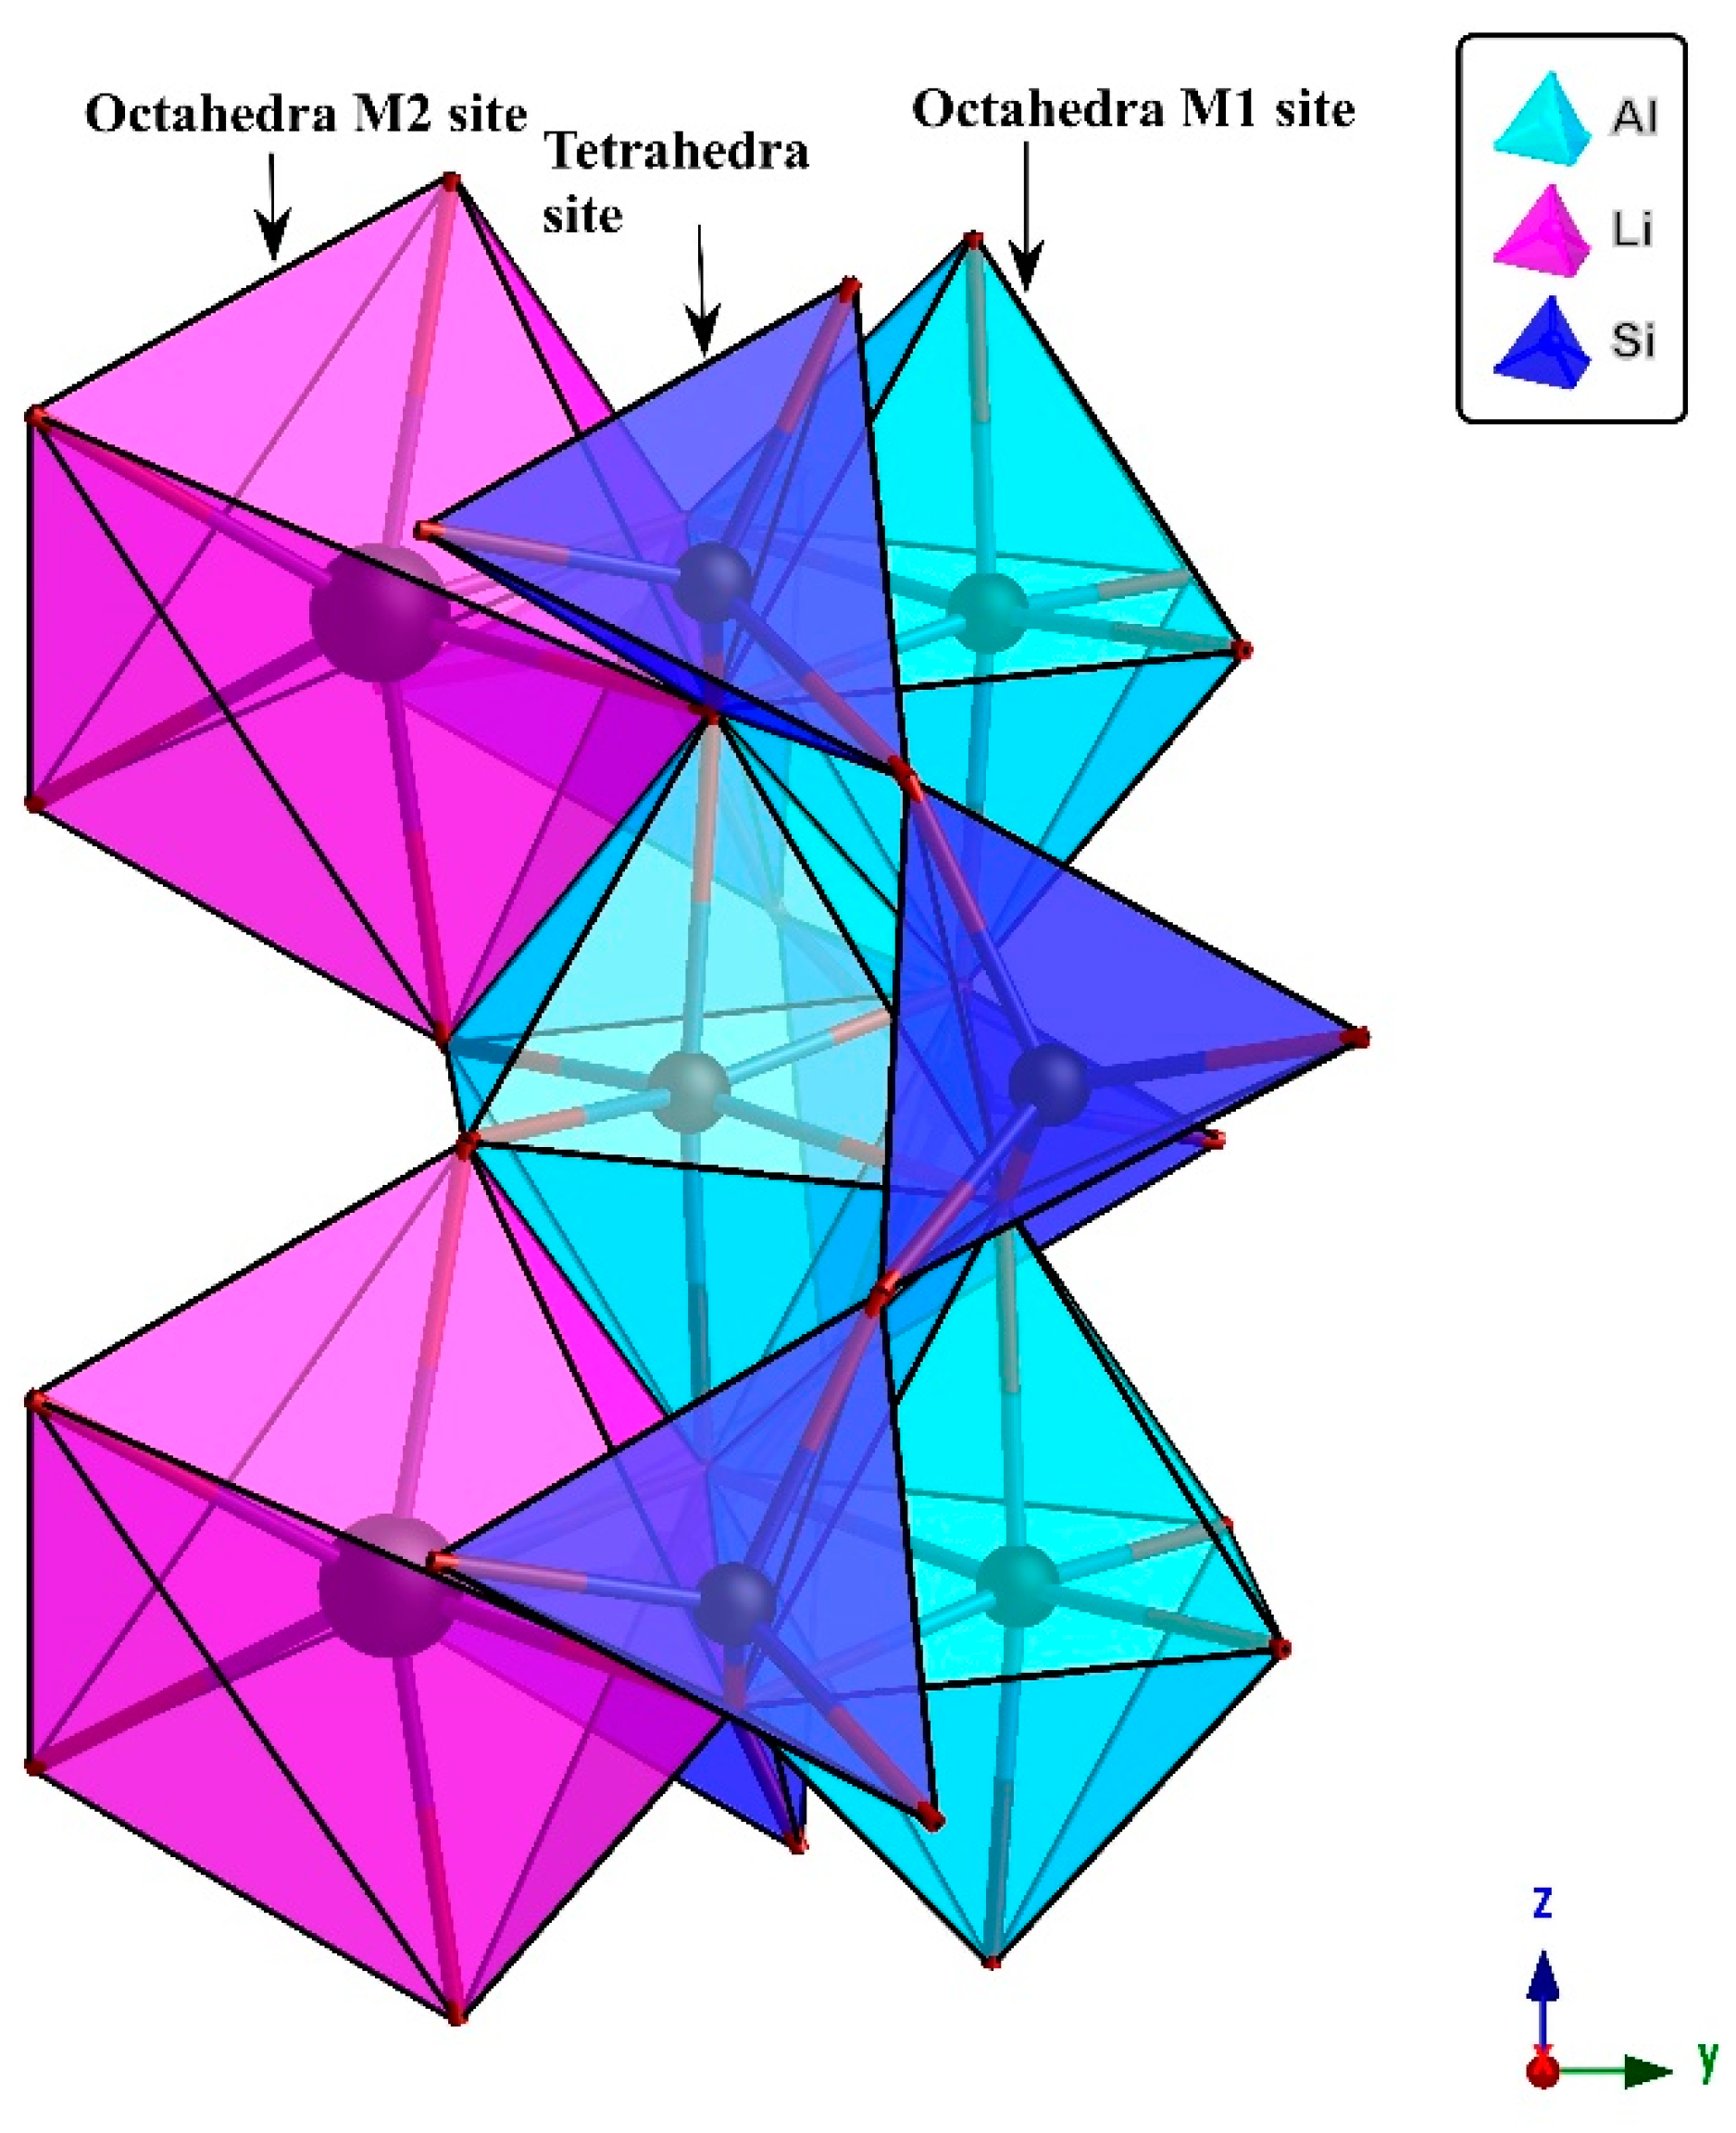
3.5. Ionic Structure Consideration

The valence state and ionic size play an important part in their incorporation as best possible chromophores. Mn3+ and Fe3+ have the same valence states, i.e., isovalent and charge-balanced. Their ionic radii are very close to those of Al3+ in six-folded coordinated octahedral sites, and thus facilitate substitution into the octahedral site of Al3+, i.e., the M1 site in kunzite [10,28]. Therefore, considering the ionic radius, isovalent Mn3+ is a preferred chromophore due to the close matching of both the ionic charge and the ionic size with Al3+. On the other hand, Mn2+ has an appreciably greater ionic size than Al3+ and requires additional charge compensation to fit into the Al3+ octahedral site. The ionic radius of Mn2+ is close to Li and thus facilitates substitution into the M2 site in kunzite, while the tetrahedral site is occupied by Si [13,20]. However, in the case of Mn2+ d-d electronic transition is spin-forbidden and also no Jahn−Teller distortion is possible for this ion [29]. Due to the absence of Jahn−Teller distortion and spin-forbidden transition, Mn2+ produces near colorless or weak coloration as compared to Mn3+ [7,30]. Therefore, Mn2+ is not the best choice for pink color in kunzite.
Similarly, trivalent ferric ion Fe3+, having the same electronic structure as Mn2+, is also a weak chromophore and produces noticeable color only at higher concentrations. For example, to get an intense yellow color in sapphire, it requires at least 1000 ppm Fe3+. This is an important consideration to understand the comparatively weak contribution of Fe3+ to coloration [28,30].
Both Mn2+ and Mn3+ can occur in six-folded octahedral coordination, and are the known cause of red or pink colors in a variety of minerals e.g., rhodonite, andalusite, grossular, morganite, tourmaline (pink and red) and kunzite [31]. Mn2+, when coordinated to oxygen ligands (Mn2+-O2-) produces relatively weak absorption bands as compared to Mn3+, due to weak oscillator strength or a low cross-section involving spin-forbidden transitions [30].

4. Conclusions

In the current study the quantitative analyses of chromophores responsible for coloration was carried out by LA-ICP-MS. The results show that the concentration of Mn is higher in kunzite as compared to Fe. The oxidation states of Mn and Fe were checked through XANES, which confirm the presence of Mn in both the Mn2+ and the Mn3+ oxidation states in kunzite while Fe is present in the Fe3+ state. The UV−visible spectra confirm that lilac-pink colored kunzite is due to a broad peak given by Mn3+ at 530 nm. It is also concluded that the higher the concentration of Mn3+ in kunzite, the deeper the pink color will be and it will be more valuable. The locality used in this study has both Mn2+ and Mn3+ in kunzite and has a light pink color. It is suggested that its color can be enhanced by changing the Mn from Mn2+ to Mn3+ by using some treatments. This change will make its color become deeper and will help in value addition to the kunzite.

Author Contributions

Formal analysis, H.U.R., C.C., P.K.; conceptualization, methodology, software, writing original draft, H.U.R; writing-review and editing, G.M., Y.L.T., C.C., A.H.S.; funding acquisition, resource, Y.L.T., A.H.S.; conceptualization, project administration, supervision, A.H.S. All authors have read and agreed to the published version of the manuscript.

Funding

This research is funded in part by a grant (No: CIGTXM-S201841) from The Gemmological Institute, China University of Geosciences (Wuhan).

Acknowledgments

This paper is GIC contribution CIGTWZ-2020008. We are also grateful to Siam Photon Laboratory, Synchrotron Light Research Institute (SLRI), Nakhon Ratchasima 30000, Thailand, for providing lab facilities free of cost. We are also thankful to the editorial staff of Minerals and the anonymous reviewers for their positive and constructive reviews which polished the article.

Conflicts of Interest

The authors declare no conflict of interest.

References

  1. Souza, S.; Watanabe, S.; Lima, A.; Lalic, M. Thermoluminescent mechanism in lilac spodumene. Acta Phys. Pol. Ser. A. 2007, 112, 1001. [Google Scholar] [CrossRef]
  2. d’Amorim, R.A.P.O.; de Vasconcelos, D.A.A.; de Barros, V.S.M.; Khoury, H.J.; Souza, S.O. Characterization of α-spodumene to OSL dosimetry. Radiat. Phys. Chem. 2014, 95, 141–144. [Google Scholar] [CrossRef]
  3. Walker, G.; Jaer, A.E.; Sherlock, R.; Glynn, T.J.; Czaja, M.; Mazurak, Z. Luminescence spectroscopy of Cr 3+ and Mn 2+ in spodumene (LiAlSi2O6). J. Lumin. 1997, 72–74, 278–280. [Google Scholar] [CrossRef]
  4. Isotani, S.; Watari, K.; Mizukami, A.; Bonventi, W.; Ito, A.S. UV optical absorption spectra analysis of spodumene crystals from Brazil. Phys. B Condens. Matter 2007, 391, 322–330. [Google Scholar] [CrossRef]
  5. Cameron, M.; Sueno, S.; Prewitt, C.T.; Papike, J.J. High-temperature crystal chemistry of acmite, diopside, hedenbergite jadeite, spodumene and ureyite. Am. Mineral. J. Earth Planet. Mater. 1973, 58, 594–618. [Google Scholar]
  6. Mattson, S.M.; Rossman, G.R. Identifying characteristics of charge transfer transitions in minerals. Phys. Chem. Miner. 1987, 14, 94–99. [Google Scholar] [CrossRef]
  7. Rossman, G.R. The geochemistry of gems and its relevance to gemology: Different traces, different prices. Elements 2009, 5, 159–162. [Google Scholar] [CrossRef]
  8. Schmetzer, K. Surface treatment of gemstones, especially topaz—An update of recent patent literature. Gemmology 2004, 7. [Google Scholar] [CrossRef]
  9. Shigley, J.E.; McClure, S.F. Laboratory-treated gemstones. Elements 2009, 5, 175–178. [Google Scholar] [CrossRef]
  10. Rossi, M.; Dell’Aglio, M.; De Giacomo, A.; Gaudiuso, R.; Senesi, G.S.; De Pascale, O.; Capitelli, F.; Nestola, F.; Ghiara, M.R. Multi-methodological investigation of kunzite, hiddenite, alexandrite, elbaite and topaz, based on laser-induced breakdown spectroscopy and conventional analytical techniques for supporting mineralogical characterization. Phys. Chem. Miner. 2014, 41, 127–140. [Google Scholar] [CrossRef]
  11. Bowersox, G.W. A status report on gemstones from Afghanistan. Gems Gemol. 1985, 21, 192–204. [Google Scholar] [CrossRef]
  12. Lagache, M.; Sebastian, A. Experimental study of Li-rich granitic pegmatites: Part II. Spodumene + albite + quartz equilibrium. Am. Miner. 1991, 76, 611–616. [Google Scholar]
  13. Ogundare, F.; Alatishe, M.; Chithambo, M.; Costin, G. Thermoluminescence of kunzite: A study of kinetic processes and dosimetry characteristics. Nucl. Instrum. Methods Phys. Res. Sect. B Beam Interact. Mater. At. 2016, 373, 44–51. [Google Scholar] [CrossRef]
  14. Ito, A.S.; Isotani, S. Heating effects on the optical absorption spectra of irradiated, natural spodumene. Radiat. Eff. 1991, 116, 307–314. [Google Scholar] [CrossRef]
  15. Yonghua, D.; Lishi, M.; Ping, L.; Yong, C. First-principles calculations of electronic structures and optical, phononic, and thermodynamic properties of monoclinic α-spodumene. Ceram. Int. 2017, 43, 6312–6321. [Google Scholar] [CrossRef]
  16. Koningsberger, D.C. X-Ray Absorption: Principles, Applications, Techniques of EXAFS, SEXAFS, and XANES; John Wiley and Sons: Hoboken, NJ, USA, 1988. [Google Scholar]
  17. Ressler, T.; Wong, J.; Roos, J.; Smith, J.L. Quantitative speciation of Mn-bearing particulates emitted from autos burning MMT-added gasolines using XANES spectroscopy. Environ. Sci. Technol. 2000, 34, 950–958. [Google Scholar] [CrossRef] [Green Version]
  18. Hayashi, H.; Abe, H. Gel-state dependencies of brown patterns of Mn–Fe-based prussian blue analogues studied by combined X-ray spectroscopies. Bull. Chem. Soc. Jpn. 2017, 90, 807–819. [Google Scholar] [CrossRef]
  19. Bariand, P.; Poullen, J.F. Famous mineral localities: The pegmatities of Laghman, Nuristan, Afghanistan. Miner. Rec. 1978, 9, 301–308. [Google Scholar]
  20. Cook, R.B. Connoisseur’s choice: Spodumene var. Kunzite, Nuristan, Afghanistan. Rocks Miner. 1997, 72, 340–343. [Google Scholar] [CrossRef]
  21. Teo, B.K. EXAFS: Basic Principles and Data Analysis; Springer Science & Business Media: Berlin, Germany, 2012; Volume 9. [Google Scholar]
  22. Phan, T.L.; Zhang, P.; Yang, D.S.; Nghia, N.X.; Yu, S.C. Local structure and paramagnetic properties of Zn1-xMnxO. J. Appl. Phys. 2011, 110, 063912. [Google Scholar] [CrossRef]
  23. Haeger, T. Study of impurity in blue spinel from the Luc Yen mining area, Yen Bai province, Vietnam. Vietnam J. Earth Sci. 2018, 40, 47–55. [Google Scholar]
  24. Ravel, B.; Newville, M. ATHENA, ARTEMIS, HEPHAESTUS: Data analysis for X-ray absorption spectroscopy using IFEFFIT. J. Synchrotron Radiat. 2010, 12, 537–541. [Google Scholar] [CrossRef] [PubMed] [Green Version]
  25. Oliveira, R.A.P.; Mello, A.C.S.; Lima, H.R.B.R.; Campos, S.S.; Souza, S.O. Radiation detection using the color changes of lilac spodumene. In Proceedings of the INAC 2009: International Nuclear Atlantic Conference Innovations in Nuclear Technology for a Sustainable Future, Rio de Janeiro, RJ, Brazil, 27 September–2 October 2009. [Google Scholar]
  26. Farges, F.; Panczer, G.; Benbalagh, N.; Riondet, G. The grand sapphire of Louis Xiv and the ruspoli sapphire: Historical and gemological discoveries. Gems Gemol. 2015, 51. [Google Scholar] [CrossRef]
  27. Souza, S.; Ferraz, G.; Watanabe, S. Effects of Mn and Fe impurities on the TL and EPR properties of artificial spodumene polycrystals under irradiation. Nucl. Instrum. Methods Phys. Res. Sect. B Beam Interact. Mater. At. 2004, 218, 259–263. [Google Scholar] [CrossRef]
  28. Lu, R. Color origin of lavender jadeite: An alternative approach. Gems Gemol. 2012, 48, 273–283. [Google Scholar] [CrossRef]
  29. Fridrichová, J.; Bačík, P.; Ertl, A.; Wildner, M.; Dekan, J.; Miglierini, M. Jahn-Teller distortion of Mn3+-occupied octahedra in red beryl from Utah indicated by optical spectroscopy. J. Mol. Struct. 2018, 1152, 79–86. [Google Scholar] [CrossRef]
  30. Burns, R.G. Mineralogical Applications of Crystal Field Theory, 2nd ed.; Cambridge University Press: Cambridge, UK, 1993; Volume 5. [Google Scholar] [CrossRef] [Green Version]
  31. Sugiyama, K.; Arima, H.; Konno, H.; Kawamata, T. Distribution of Mn in pink elbaitic tourmaline from Mogok, Myanmar. J. Miner. Petrol. Sci. 2016, 111, 1–8. [Google Scholar] [CrossRef] [Green Version]
Figure 1. This polyhedral model of a spodumene crystal, using the crystal refinement data of [5] was drawn through CrystalMaker X software, with the following unit cell parameters (a: 9.46, b: 8.412 and c: 5.224 Å, α: 90, β: 110 and γ: 90 degree). There is a total of 40 atoms in one complete unit cell. The basic building blocks: AlO6 (M1) and LiO6 (M2) are at octahedral, while SiO4 are at tetrahedral positions as labeled in the picture. The crystallographic orientation is shown at the bottom right corner, projected down the x-axis.
Minerals 10 00463 g001
Figure 2. (A) Photograph of the kunzite crystals before cutting, (B) photograph of the 21 cut kunzite crystals.
Minerals 10 00463 g002
Figure 3. Six kunzite samples which were cut into wafers with dimensions 2 cm × 2 cm × 0.5 cm, (length, width, and thickness, respectively). These samples were used for X-ray absorption near-edge structure (XANES) and UV−VIS spectra. These samples were selected according to the Mn and Fe concentration and each sample’s value is written below the sample in ppm (average).
Minerals 10 00463 g003
Figure 4. Mn K-edge XANES spectrum of kunzite from Nuristan, Afghanistan, (Mn-01, represents kunzite sample K-01) versus MnO and Mn2O3 standards. The edge position of the kunzite is just between the MnO and Mn2O3.
Minerals 10 00463 g004
Figure 5. Fe K-edge XANES spectra of kunzite from Nuristan, Afghanistan, (Fe-01, Fe-04 represent kunzite samples) versus FeO and Fe2O3 standards.
Minerals 10 00463 g005
Figure 6. The graph shows the UV−visible spectrum of sample K-06, whose color is totally white and only shows a little absorbance due to Fe when measured along the C-axis. Color coordinates (CIE L*a*b) were taken by using uvwinlab\meth900 and D65 illuminant in transmission mode.
Minerals 10 00463 g006
Figure 7. All kunzite samples (K-01 to K-05) show the absorbance peaks at the same wavelengths, with little variation in peak intensity, therefore only one spectrum is taken here for explanation. The spectra were taken in three different optical directions by using gemmological calcite dichroscope and they are marked as: ‘green to pink’, ‘pink to colorless’ and ‘along C-axis’. Color coordinates (CIE L*a*b) were taken by using uvwinlab\meth900 and D65 illuminant in transmission mode.
Minerals 10 00463 g007
Table 1. Elemental concentration of major elements in wt.% in the kunzite samples.
Oxides MinimumMaximumAverage
SiO264.02664.96064.051
Al2O327.51328.21627.974
Li2O7.5287.7397.621
TiO205.6670.0003
FeO00.1490.0362
MnO0.0030.1170.0694
Na2O0.0640.1550.133
K2O00.0350.0015
P2O50.0350.0610.055
CaO04.3310.3795
Table 2. Elemental concentration of the trace elements in ppm in the kunzite samples.
Elements (ppm)Minimum Maximum Average
Sn19.74300.424126.1673
Ga50.54286.63773.6148
Ge7.79468.00728.4366
B8.03584.44123.2575
Zn025.1766.5206
Cd02.5900.7602
Be02.0500.6742
Pb05.9230.63
Cu01.1670.3265
Sc00.8590.2615
Rb00.5850.2319
Mo00.6560.155
Hf00.4630.15
Cr01.4980.1249
Cs0 0.7500.1
The elements detected during the analyses having a concentration less than 0.1 ppm are, V, Co, Sr, Y, Zr, Nb, Ag, Ba, La, Ce, Pr, Nd, Sm, Eu, Gd, Tb, Dy, Ho, Er, Tm, Yb, Lu, Ta, W, Hg, Tl, Bi< 0.1 ppm.

