1. Introduction
With the scarcity of high-grade mineral resources, the separation process of lower-grade clay-bearing ore brings about more challenges in mineral processing plants. As has been proposed, montmorillonite characteristics have great influence on the slurry rheology, surface properties of tailing, and efficiency of reagents. Therefore, raw ore containing montmorillonite leads to adverse effects on the process performance, such as floatation, dewatering, and wastewater treatment. Thus, understanding of surface properties, rheological characteristics, and particle interaction of montmorillonite are essential when dealing with the aforementioned difficulties in the dewatering process [
1].
Yield stress and viscosity are the essential factors to evaluate rheological properties of aqueous suspensions of montmorillonite. The increased solid concentration of montmorillonite suspension leads to an increase in yield stress and apparent viscosity. It also affects the rheological behaviors, which are transformed from Newtonian to Bingham plastic to shear thinning material with yield stress. In particular, the initial stress increases with aging time because of the full hydration in enough time [
2,
3]. It was shown that the addition of ionic strength (0.02–0.2 M) decreased the apparent viscosity and changed rheological behaviors of the suspension. In addition, the divalent cation salts were more effective in reducing the yield stress and apparent viscosity than monovalent cation salts [
3]. The systems with the reagent of polyacrylamide (PAM) and montmorillonite were always discovered in the process of dewatering. The molecular simulation method established that the viscosity of the PAM between hydrated clay layers reduced with an increase of either temperature (from 298 to 343 K) or shear rate (from 2.27 × 10
9 to 1.36 × 10
10 s
−1) [
4]. In the research of montmorillonite with adsorbed phosphate additives, the magnitude of yield stress was remarkably smaller than with pure montmorillonite samples. As a result, the adsorbed phosphate additives formed a steric layer and decreased the strength of the attractive interparticle forces. Especially at alkali pH, the yield stress was entirely dispersed with the presence of adsorbed phosphate [
5]. The montmorillonite coagulated rapidly in the suspension of high NaCl concentration, and the floc size distribution was approximate to log normal [
6]. The scaling relation between the maximum size of floc (D
max) and the shear rate (G) was an approach to D
max ~ G
−γ, for which a value of
γ close to 0.5 revealed an equilibrium between the formation and breakup of flocs. However, when the value of
γ was more than 0.5, the flocs were restructured directly [
7].
There are several fundamental parameters that could determine the interaction of particles, such as layer charge, cation exchange, edge charge density, and particle structure. At a low pH value, the card-house structure is formed due to Edge
+–Face
− interaction. However, at a high pH value, Face
−–Face
− interaction causes the band-like structure [
8]. By using extended DLVO theory, the total Face–Face, Edge–Edge, and Face–Edge energy of interaction in Na-Mt suspension on the basis of DLVO theory, the yield stress of the suspension and viscosity of the flocs are decreased from acid to alkali, which is mainly caused by the interaction of face-to-edge attraction [
9]. A quite different rheological behavior was discovered from a composite of Na-montmorillonite and needle-shaped sepiolite. The suspension of these two ingredients showed a very low or no yield stress at acid pH and approached the maximum value of pH 8–12. Because the magnesium is released from sepiolite at low pH, its hydrolysis products are formed and adsorbed on particle surfaces gradually with the increase of the pH value [
10]. The acid–base environment shows a significant influence on the rheological properties of montmorillonite suspension. Nevertheless, it has little effect on the zeta potential. Montmorillonite particles in water did not display a point of net zero charge (PZC) or the isoelectric point. The results of zeta potential are negatively charged at all pH [
11,
12]. The point of zero charge of zero proton charge (PZNPC) for σ
0,H = 0 is appropriate for surface charge heterogeneity of montmorillonite lamellae. Therefore, the pH
PZC of the amphoteric edge sites (pH
PZC,edge) is distinct [
13,
14,
15]. For the Wyoming montmorillonite, pH
PZC,edge is in the pH range from 6 to 7 with the variation of ionic strength in the suspension [
16]. The diverse acids (such as fulvic and polyacrylic acids), the electrolyte type, and its concentration (such as 10
−3–10
−1 M KNO
3, 10
−3–10
−2 M NaCl) were used to analyze the pH
PZC,edge with the pH value of 6.5 [
9,
15,
17].
In the absence of Ca
2+ ion montmorillonite suspensions, the high basal surface repulsion leads to clay platelets, which forms in an Edge–Edge orientation. However, with the addition of Ca
2+ ions, the structure of clay platelets is converted from both Edge–Edge and Edge–Face to a Face–Face orientation [
18]. The high permeability of water and ions was observed in Ca-montmorillonite because of the extra-lamellar swelling between tactoids, instead of between the single platelets [
19,
20]. Surface charge density is an important factor in affecting ion–ion correlation in montmorillonite suspension. In a composed system with counterions (Na
+ and Ca
2+), Ca
2+ leads montmorillonite to a nonswelling behavior in a higher surface charge density. Otherwise, a swelling behavior is observed when Na
+ dominates in the slit [
20]. The combination of wide-angle X-ray scattering (WAXS), small-angle X-ray scattering (SAXS), and transmission X-ray microscopy (TXM) provided an efficient method to understand the coagulation mechanism of Na-montmorillonite. At a neutral pH, the Na-Mt is completely coagulated by the interactions of Face
−–Face
−, and the stacks of these particles have a slight mismatch between layers [
21,
22]. There are two main driving forces that determine the clay minerals’ surface chemistry: ion pairing and hydration energy of ions. The weakly paired ions (I
− and Cs
+) with the minimum hydration energy interact strongly with the clay minerals’ surface. On the contrary, the high hydration energy ions (Na
+ and F
−) have a high charge density to retrain their interaction with the clay minerals’ surface [
23].
Besides, the effect of pH value and ionic strength on the coagulation structure of montmorillonite suspension reflects on the sedimentation and filtration behavior. The influence of pH value on the sedimentation rate is remarkable at low salt concentration for the dominant appearance of the Edge/Face association [
24]. However, the limited effect of pH value on sediment height at higher salt concentration was regarded as the shielding effect by the compression of the electric double layer [
25]. Particle association has an important effect on the filtration behavior such as thickness, moisture ratio, and permeability [
26]. An addition of clay hybrids decreases low-temperature low-pressure and high-temperature high-pressure fluid loss, which is greatly related to the restructure of clay platelet association [
27]. The filtration behavior is enhanced with an addition of the water-soluble ionic liquid and the filtration control additive (PASV), on account of the cation exchange and the elimination of the stabilization of the bentonite dispersion state, respectively [
28,
29].
In particular, researchers show much concern for the pH-dependent charges on broken edges of montmorillonite layers and the different coagulation modes between particles. In this paper, the height of the sediment bed, rheological behavior, and filtration performance of Na-Mt suspensions are investigated by analyzing particle surface charge properties, interactions between particles, and association modes as a function of the electrolyte concentrations and pH.
2. Materials and Methods
2.1. Material Preparation and Characterization
The Na-montmorillonite raw sample purchased from Chifeng Liaoyu Coal Company was composed mainly of Na-Mt with low amounts of quartz and cristobalite. The montmorillonite–water suspension was prepared by adding the samples and water in a desired solid concentration. Analytical grade HCl, NaOH, and NaCl were used as Na-Mt modified reagent for acid–base environment regulation and cation exchange in the present study. The size of analytical grade Al2O3 and SiO2 powders were 1 μm and 50 nm, respectively. All the water used in this work was ultrapure water distilled and deionized by UPR-II series ultrapure water machine (ULUPure, Chengdu, China) with the electrical resistivity of 18.2 MΩ/cm, heavy metal ions ≤ 0.1 ppb, and microparticles ≤ 1 /mL; by doing so, the effects of impurities on the suspension and aggregation behaviors were minimized.
The purification method [
30] consisted of replacing the exchangeable cations with Na
+ ions followed by washing with water. Washing removed excess salts and also enabled fine impurities to be separated. The raw Na-montmorillonite sample (30 g) was carefully dispersed in 1 L of 1 M NaCl solution by stirring at 500 rpm for about 12 h and then shaking overnight. Afterwards, the suspension was separated into four centrifuge bottles and then centrifuged at 3000 rpm for 5 min. This cycle of Na
+ exchange procedure was repeated three times. The sediment of the Na
+-exchanged clay mineral was washed with water. The washing procedure was the same as that for the Na
+ exchange with stir, shake, and centrifugation cycles, which was also repeated three times. Finally, the purified Na-montmorillonite sample had achieved sufficient exchange and removed excess salts and fine impurities. The cation exchange capacity (CEC) of the purified Na-Montmorillonite was 103.8 cmol/kg.
The raw Na-Mt sample (2 g), Na
+-exchanged sample without washing (200 mL), and purified sample (200 mL) were all dried in an oven at 105 °C for the X-ray diffraction (XRD) measurements.
Figure 1 displays the XRD pattern of the sample, which was measured by a MiniFlex 600 (Rigaku, Tokyo, Japan) with Cu Kα radiation at 40 kV voltage and a scanning speed of 5°/min from 0° to 70°. It shows that the purified Na-Mt materials had nearly no impurities, indicating that the sample was high-purity Na-Mt.
Figure 1a shows the mineral composition of the raw sample of Na-Mt, and low amounts of quartz and cristobalite. After replacing the exchangeable cations with Na
+ ions and centrifugation, the surface of the particles was covered by the residuals of sodium chloride as can be seen in
Figure 1b. Then, by applying the washing procedure and centrifugation, the heights of the diffraction peaks of Na-Mt were apparently greater than those of preceding samples at 2θ = 6.1°, which are shown in
Figure 1c. The increased crystal component of Na-Mt indicated that the sample was extremely purified.
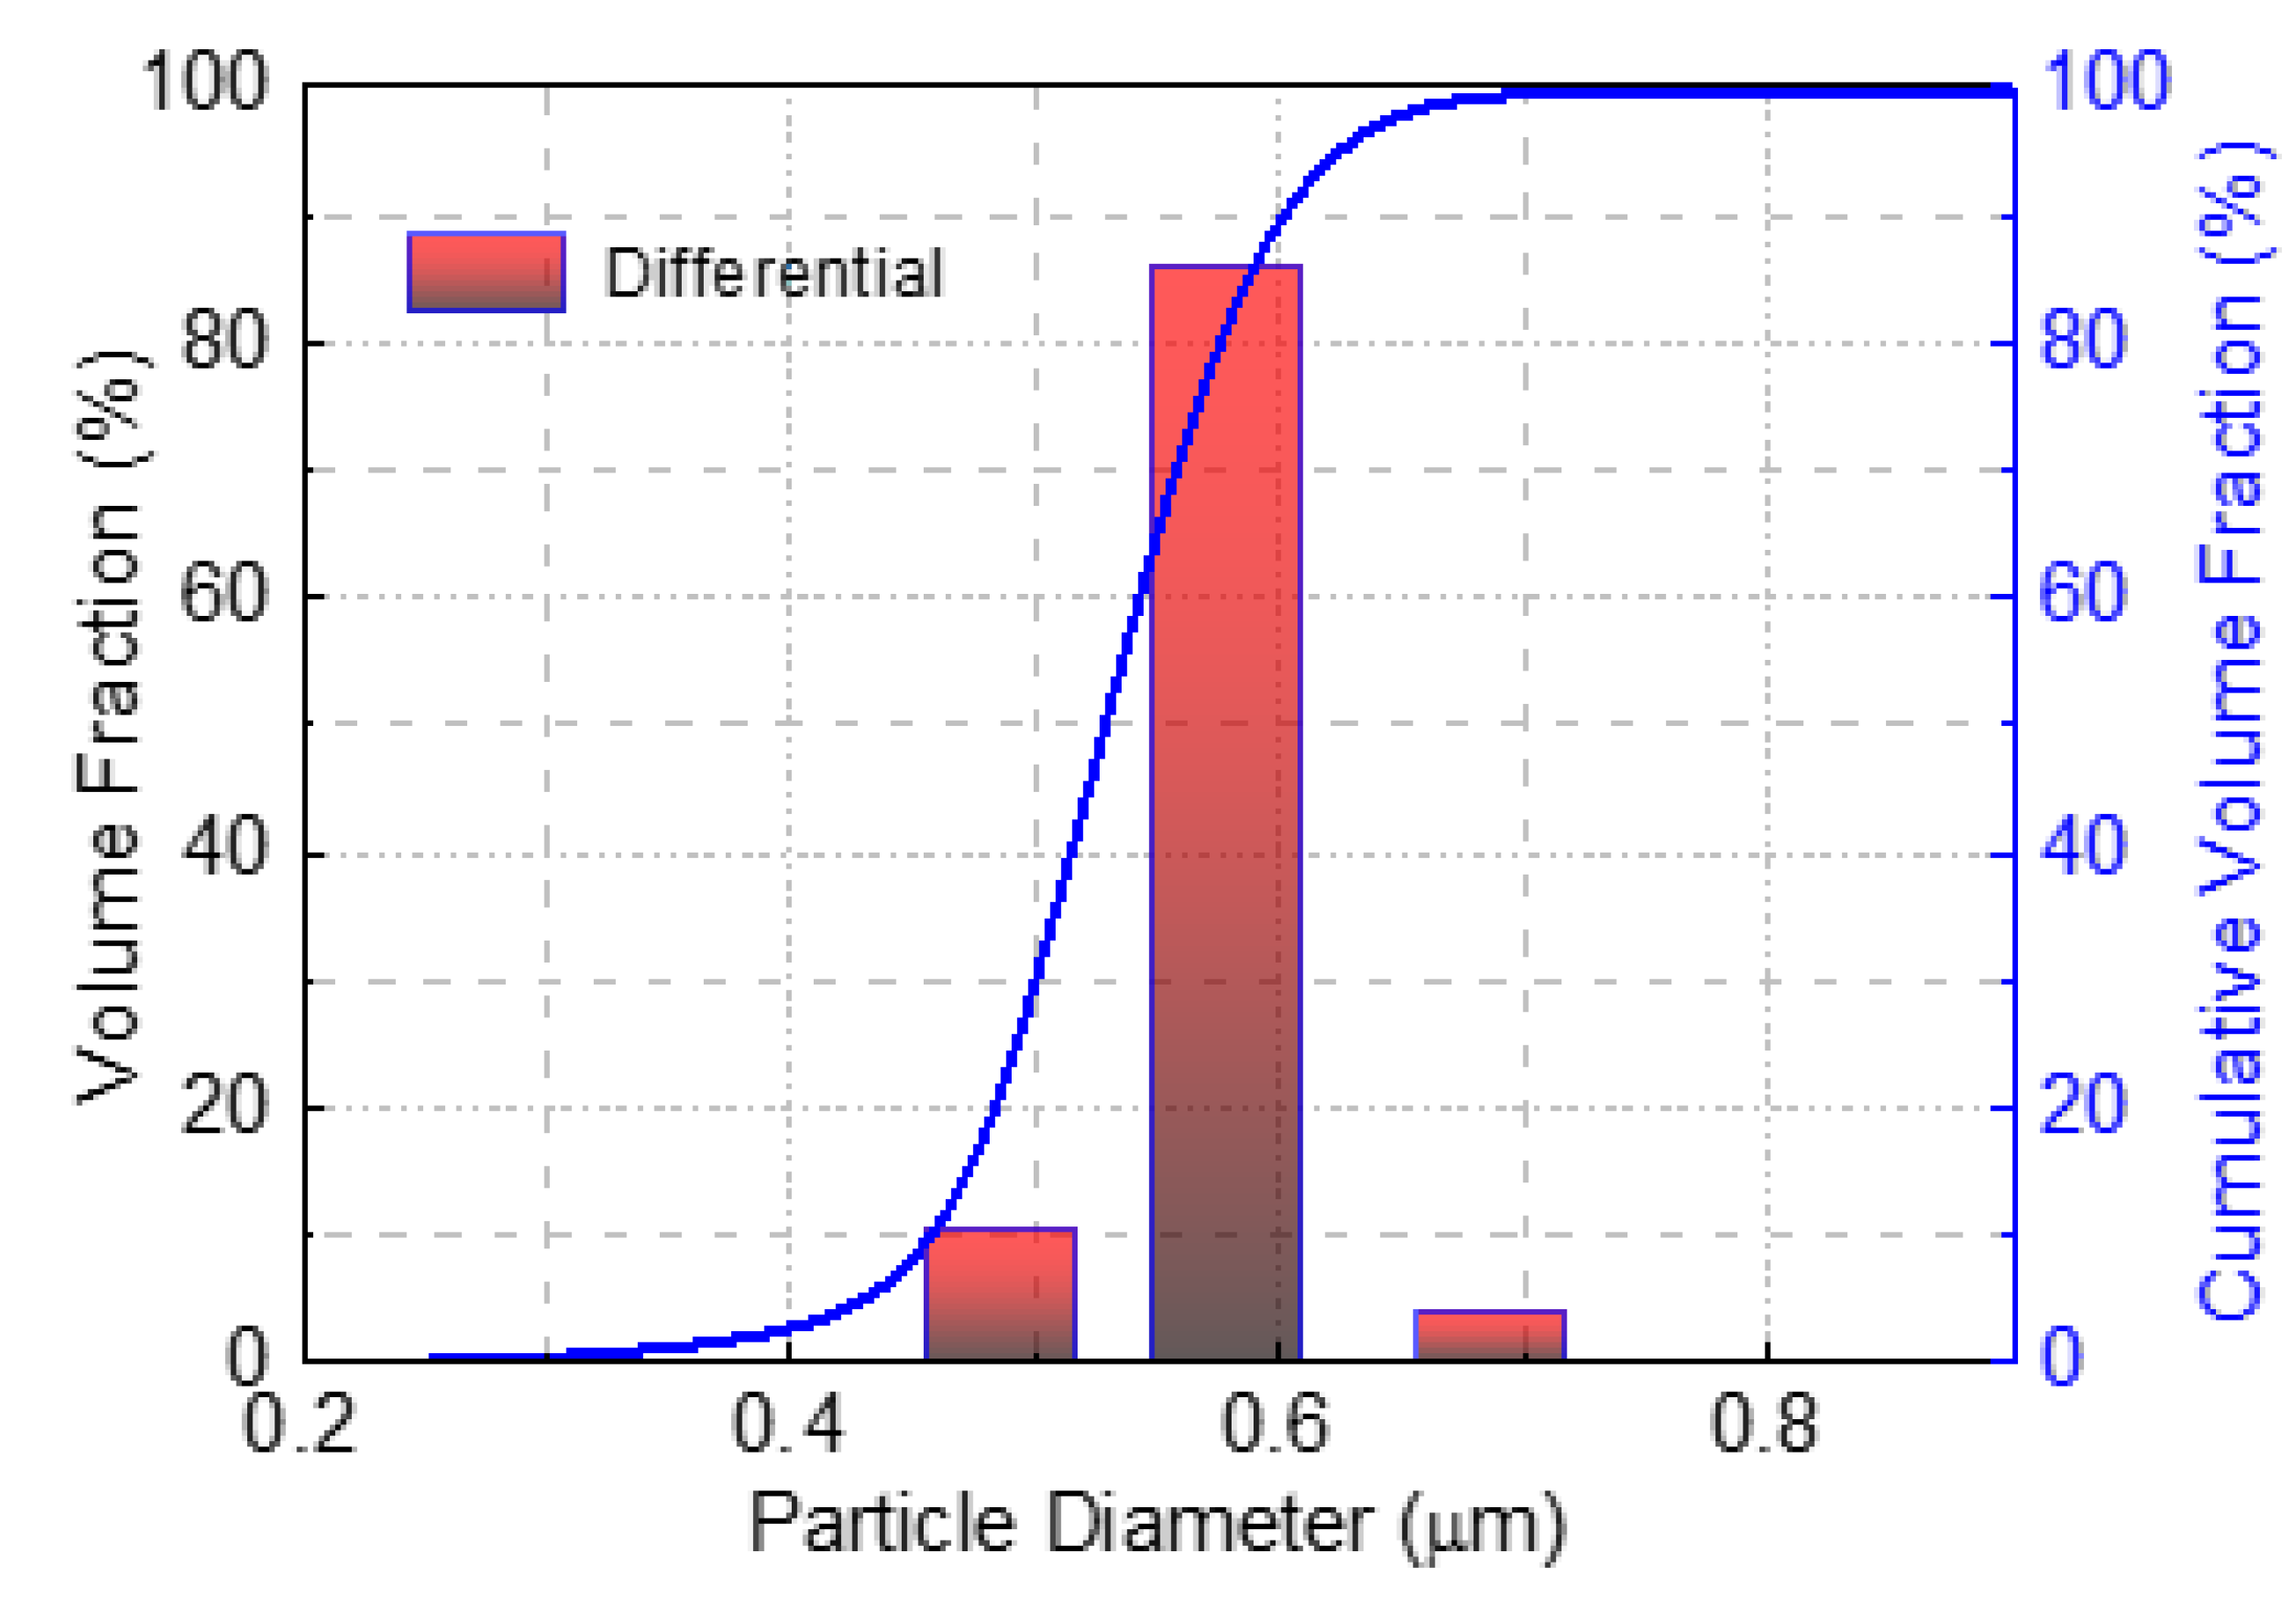
The particle size distribution of the montmorillonite–water suspension was measured by a Microtrac S3500 laser diffraction particle size analyzer (MICROTRAC MRB, Osaka, Japan). The suspension was fully dispersed by ultrasound for 10 min to show the particle size distribution.
Figure 2 depicts that the median diameter (d
50) of montmorillonite particles was around 500 nm.
The morphologies of the raw and highly purified Na-montmorillonite particles are shown in
Figure 3, which was taken with a JSM-7100F scanning electron microscope (SEM, JEOL Ltd., Tokyo, Japan). The purified Na-Mt sample was dried in an oven at 105 °C. The SEM image of the raw Na-Mt sample was taken at an accelerating voltage of 15.0 kV and a working distance of 12.1 mm, and the SEM image of the purified Na-Mt sample was taken at an accelerating voltage of 5.0 kV and a working distance of 13.7 mm. As can be observed, most of the surface area of the powder was contributed by the lamellar of the montmorillonite rather than spherical in shape.
All suspensions were diluted by mixing the purified Na-montmorillonite with ultrapure water to the required mass ratio of 1:1000. The initial or natural pH of these suspensions was 7.7. All the filtration experiments were performed in a thermostat water bath at the desired temperature of 25 °C. Three different ionic strengths of 10−3, 10−2, and 10−1 M of NaCl were used in the experiments. A known volume of the Na-Mt suspension with a known concentration (Cc) of 1 g/L at an appropriate ionic strength was continuously stirred at 500 rpm overnight to mix extensively. When pH adjustment was required, droplets of concentrated HCl and NaOH were added. Concentrated NaOH (1 mol/L) and HCl (1 mol/L) solutions were used to change the pH of the three different ionic strengths of Na-Mt suspensions. The pH was increased or decreased incrementally by adding the base or an acid, so as not to cause excessive dilution to the samples. The prepared samples were then sonicated with an ultrasonic processor UH-250A (400 W and 20 kHz) and a sound enclosure UH-S2 (Jinghui Ltd., Shenzhen, China) for three times (at least 60 s at 80% amplitude for each time) and left to cool. Then, the samples were shaken overnight to make sure the suspensions at different pH were stabilized. The pH was measured with a PHSJ-3F pH electrode and a pH meter (INESA, Shanghai, China). Finally, the three different ionic strengths of samples were respectively adjusted to the endpoint of pH around 6.0, 7.7, 8.1, and 9.2, respectively.
2.2. Zeta Potential Measurements
Zeta potential measurements of Na-montmorillonite, Al
2O
3, and SiO
2 were carried out using a Nano-ZS zeta potential analyzer (Malvern, Worcestershire, UK). An average value of three measurements was taken to represent a reported zeta potential of Na-Mt suspension for a given condition. The Na-Mt samples for zeta potential measurements were using the adjusted salt-pH Na-Mt. The Al
2O
3 and SiO
2 samples (1 g) were dispersed in 200 mL of 10
−2 M NaCl solution by stirring at 500 rpm for about 30 min, separately. Then, each suspension was adjusted with variable pHs ranging between 3 and 9. After that, 1.5 mL suspension was transferred to a sample cell for zeta potential measurements. In this work, we used Al
2O
3 and SiO
2 to simulate the surface groups of montmorillonite edges. The zeta potential of montmorillonite edges (ζ
edge) can be calculated by Equation (1) [
9,
17]:
where
and
are the zeta potential of Al
2O
3 and SiO
2, respectively.
2.3. Sedimentation and Transmittance Measurements
Prior to sedimentation and filtration experiments, the different types of prepared Na-montmorillonite suspensions (Cc = 1 g/L) were stirred using a stirrer at 350 rpm for 6 h to obtain a homogenous and representative sample. The constant and proper velocity of stirring allows the Na-Mt particles throughout the suspension and also avoids the particle structure to be broken by an excessive shear. After the stir was completed, 250 mL of each prepared sample was taken and then placed in a measuring cylinder with a stopper. The diameter of the 250 mL measuring cylinder was 42 mm. The height of the sediment bed and the test of transmittance were measured after the samples settled for 12 h. The liquids for transmittance tests were taken from the sediment bed, located at the 30 mL tick mark of the measuring cylinder, with an adjustable volume pipettor. The test was measured by a 721 visible spectrophotometer (Shanghai Jinghua Ltd., Shanghai, China) and the ultraviolet rays (UV) were set at 800 nm.
2.4. Rheological Measurements
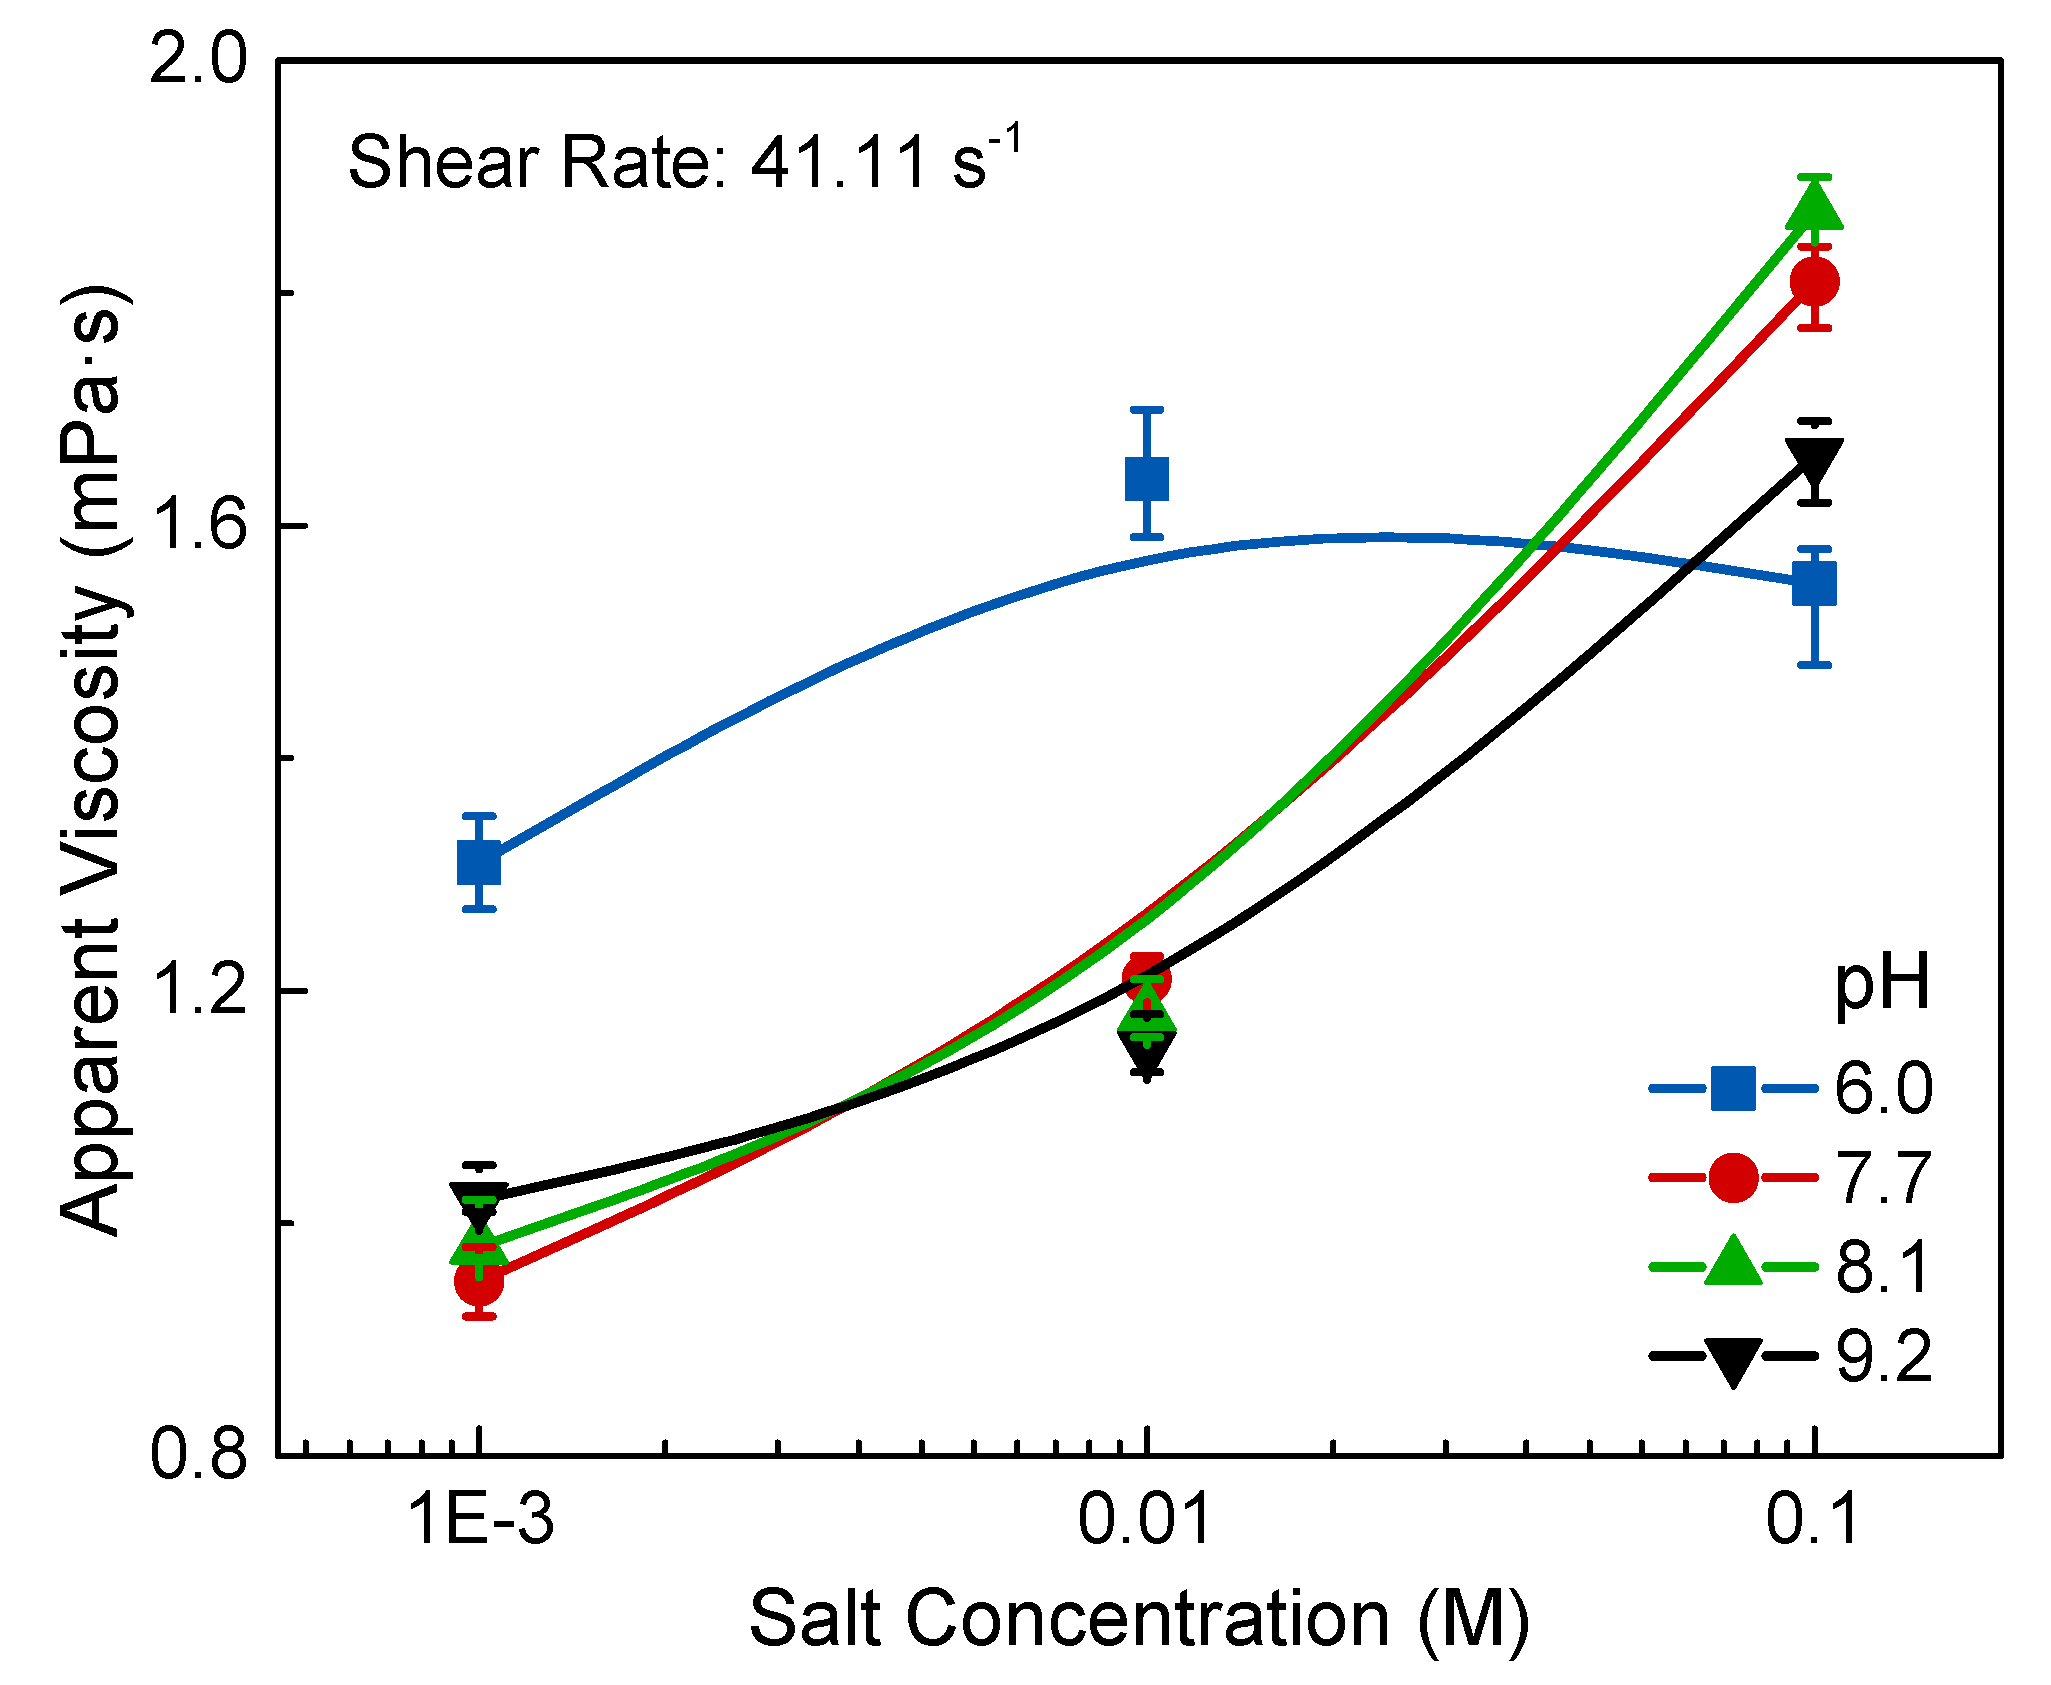
The rheological measurements were performed with an NDJ-9S rotational viscometer (Shanghai Pingxuan Ltd., Shanghai, China) using a small sample of salt-pH Na-montmorillonite suspension (30 mL). The sample was stirred slowly with a magnetic stirrer for 5 min in a low constant temperature trough, which was set at 25 °C. This step was in case the sample settled and also prevented the particle structure from being broken by stirring. Then, the sample was introduced into a rotating outer cylinder carefully. After the rotating inner cylinder (φ = 12.5 mm) and the fixed outer cylinder (φ = 15 mm) were settled, viscometric data were obtained at a rotational speed of 60 rpm. Each value was recorded for 6 to 8 times and averaged at the end. The shear rate of the inner cylinder wall (
) was calculated from the following Equation (2):
where
is the rotational speed,
is the radii of the rotating inner cylinder, and
is the radii of the outer cylinder. According to the rotational speed, the shear rate was calculated to be 41.11 s
−1.
2.5. Filtration Measurements
A schematic of the experimental filtration devices is shown in
Figure 4. The system includes a conditioning tank with an impeller for stirring, a filtration unit with a sand core, a 250 mL vacuum flask, an HD camera for recording data, and a vacuum pump with a vacuum and a pressure regulator.
The filtration experiments were carried out with different ionic strengths and pH of Na-montmorillonite samples at an indoor temperature of 25 ± 2 °C. The sample was placed into a 500 mL beaker and stirred at 350 rpm for 6 h. Then, 20 mL of the sample from the beaker was carefully transferred into the measuring cylinder without spillage. The 0.45 μm of millipore filter membrane was made by polypropylene and placed on the filtration unit with a sand core. The pressure valve was opened after the sample was transferred, and the pressure was adjusted to 0.06 MPa. The HD camera and a stopwatch were then initiated to record the volume of the sample and filtration time, in order to evaluate the filtration rate. The filtration experiment was finished when all 20 mL of the liquid sample had been filtrated.
The average specific cake resistance
for the constant pressure of filtration was calculated using experimental data and equations based on Darcy’s law (Equation (3)). The procedure of determining
from experimental data is widely applied, and has been introduced in the literature [
31,
32]. The integrated form of the general filtration equation (Equation (3)) is given by:
where
is filtration time (s),
is the volume of filtrate (m
3),
is the average specific cake resistance (m/kg),
is the viscosity of the liquid (Pa·s),
is the filtration concentration (kg/m
3),
is the filtration area (m
2),
is the pressure difference (Pa), and
is the resistance of the filter medium (m
−1). In this work, the resistance of the filter medium was omitted, thus Equation (4) applies for the average specific resistance of the cake [
33]:
where
is the symbol for the experimentally determined slope
t/V2 in the calculation.
4. Discussion
The dispersed and coagulated states of montmorillonite particles are closely related to the surface charges, which in turn are a function of the electrolyte concentration and pH. As mentioned in the introduction, the main contributions to the surface charges of montmorillonite are the permanent negative charges on the basal plane by the isomorphic substitution and pH-dependent charges on the edge [
34]. The results of zeta potential experiments were also consistent with this theory as shown in
Figure 5 and
Figure 6. In this work, the point of zero charge of edge surface (pH
PZC,edge) was the site at pH = 6.8. When pH ~ 6.0 < pH
PZC,edge, the Na-montmorillonite layers with edge
+ and face
− are anisotropically coagulated by electrostatic attraction (
Figure 10b). Since the acidic Na-Mt suspensions are very sensitive to salts, particles coagulate spontaneously at a very low salt concentration, as shown in
Figure 7a. When the pH is increased beyond the point of zero charge of the edges, the edges become negatively charged. Due to the effect of electrostatic repulsion, the Na-Mt particles dispersed with a stable distance in the dilute suspensions at the salt concentration of 10
−3 M (
Figure 10a). The dispersed suspensions presented without a sharp interface between supernatant and sediment bed in sedimentation experiments as shown in
Figure 7, and also had the minimum apparent viscosity in rheology experiments as shown in
Figure 9. However, as the electrolyte concentration increased, the NaCl increased the concentration of the counterions in the particle diffusion layer and some counterions were squeezed out of the stern layer. Thereby, the potential of the electric double layer decreased, causing the diffusion layer to be compressed and the electrostatic repulsion between the particles to decrease. With the increase of NaCl concentration at pH > pH
PZC,edge, Na-Mt suspension prefers to form as isotropic samples, and continuing to increase the addition of NaCl, the Van der Waals attraction as a short-range applied force increases significantly and overcomes the electrostatic repulsion until the distance between particles reduces to a certain extent. The Na-Mt particles coagulate as Face/Face network structure ultimately (
Figure 12c). The sedimentation results in NaCl concentration from 10
−2 to 10
−1 M at pH > pH
PZC,edge is consistent with this theory. Gabriel, J. et al. [
35] previously used polarized light microscopy to observe the textures of birefringent gels and also found these coagulation behaviors of isotropic and stabilized nematic phase at NaCl concentrations ranging from 10
−2 to 10
−1 M. The size of coagulated flocs enlarged with the increase of salt concentration [
15]. The sedimentation rate accelerated and the sediment bed reduced with an increase in salt concentration, which is shown in
Figure 7. The rheological behavior of a suspension can sensitively indicate the interactions between particles [
2,
36]. The rheology of Na-Mt suspension is affected by its dispersion, arrangement, and association mode between particles. As observed in
Figure 9, the behavior of Na-Mt suspension is influenced by the gradually formed band-type network structure (Face/Face), which can prominently improve the apparent viscosity with the increase of salt concentration.
However, the coagulation and rapid settling of mineral particles in the suspension does not necessarily represent the optimal conditions for the dewatering process, as observed in
Figure 7 and
Figure 11. Rheological properties affect the stability of the network structure of filter cake, and further affect the porosity of cake and the permeability of water [
37,
38]. The influence of electrolyte concentration and pH on the interaction between particles, as well as the different coagulation modes, plays an important role in the vacuum filtration process. We found that the filtration efficiency of the anisotropic three-dimensional card-house network structure flocs (Edge/Face association) is much lower than the Face/Face coagulation at a similar sedimentation rate and height of sediment bed, which is even lower than the dispersed state of suspension in the same NaCl concentration. Santiwong, S.R et al. [
39] found that the opposite effect is related to a change in arrangements of particles or particle assemblages in filter cakes, although the Face/Face mode coagulation formed a more compact and less permeable filter cake. Benna, M. [
40] also observed that the filter cake is the thickest and contains the most moisture ratio at acidic pH. Therefore, we conjecture that the anisotropic three-dimensional card-house network structure has a relatively sealed structure space in the aqueous solution. With this special structure, it is difficult for water molecules to flow out of the structure space under the action of external forces. Besides, it affects the removal of water molecules in the filtration process seriously [
41,
42,
43], as shown in
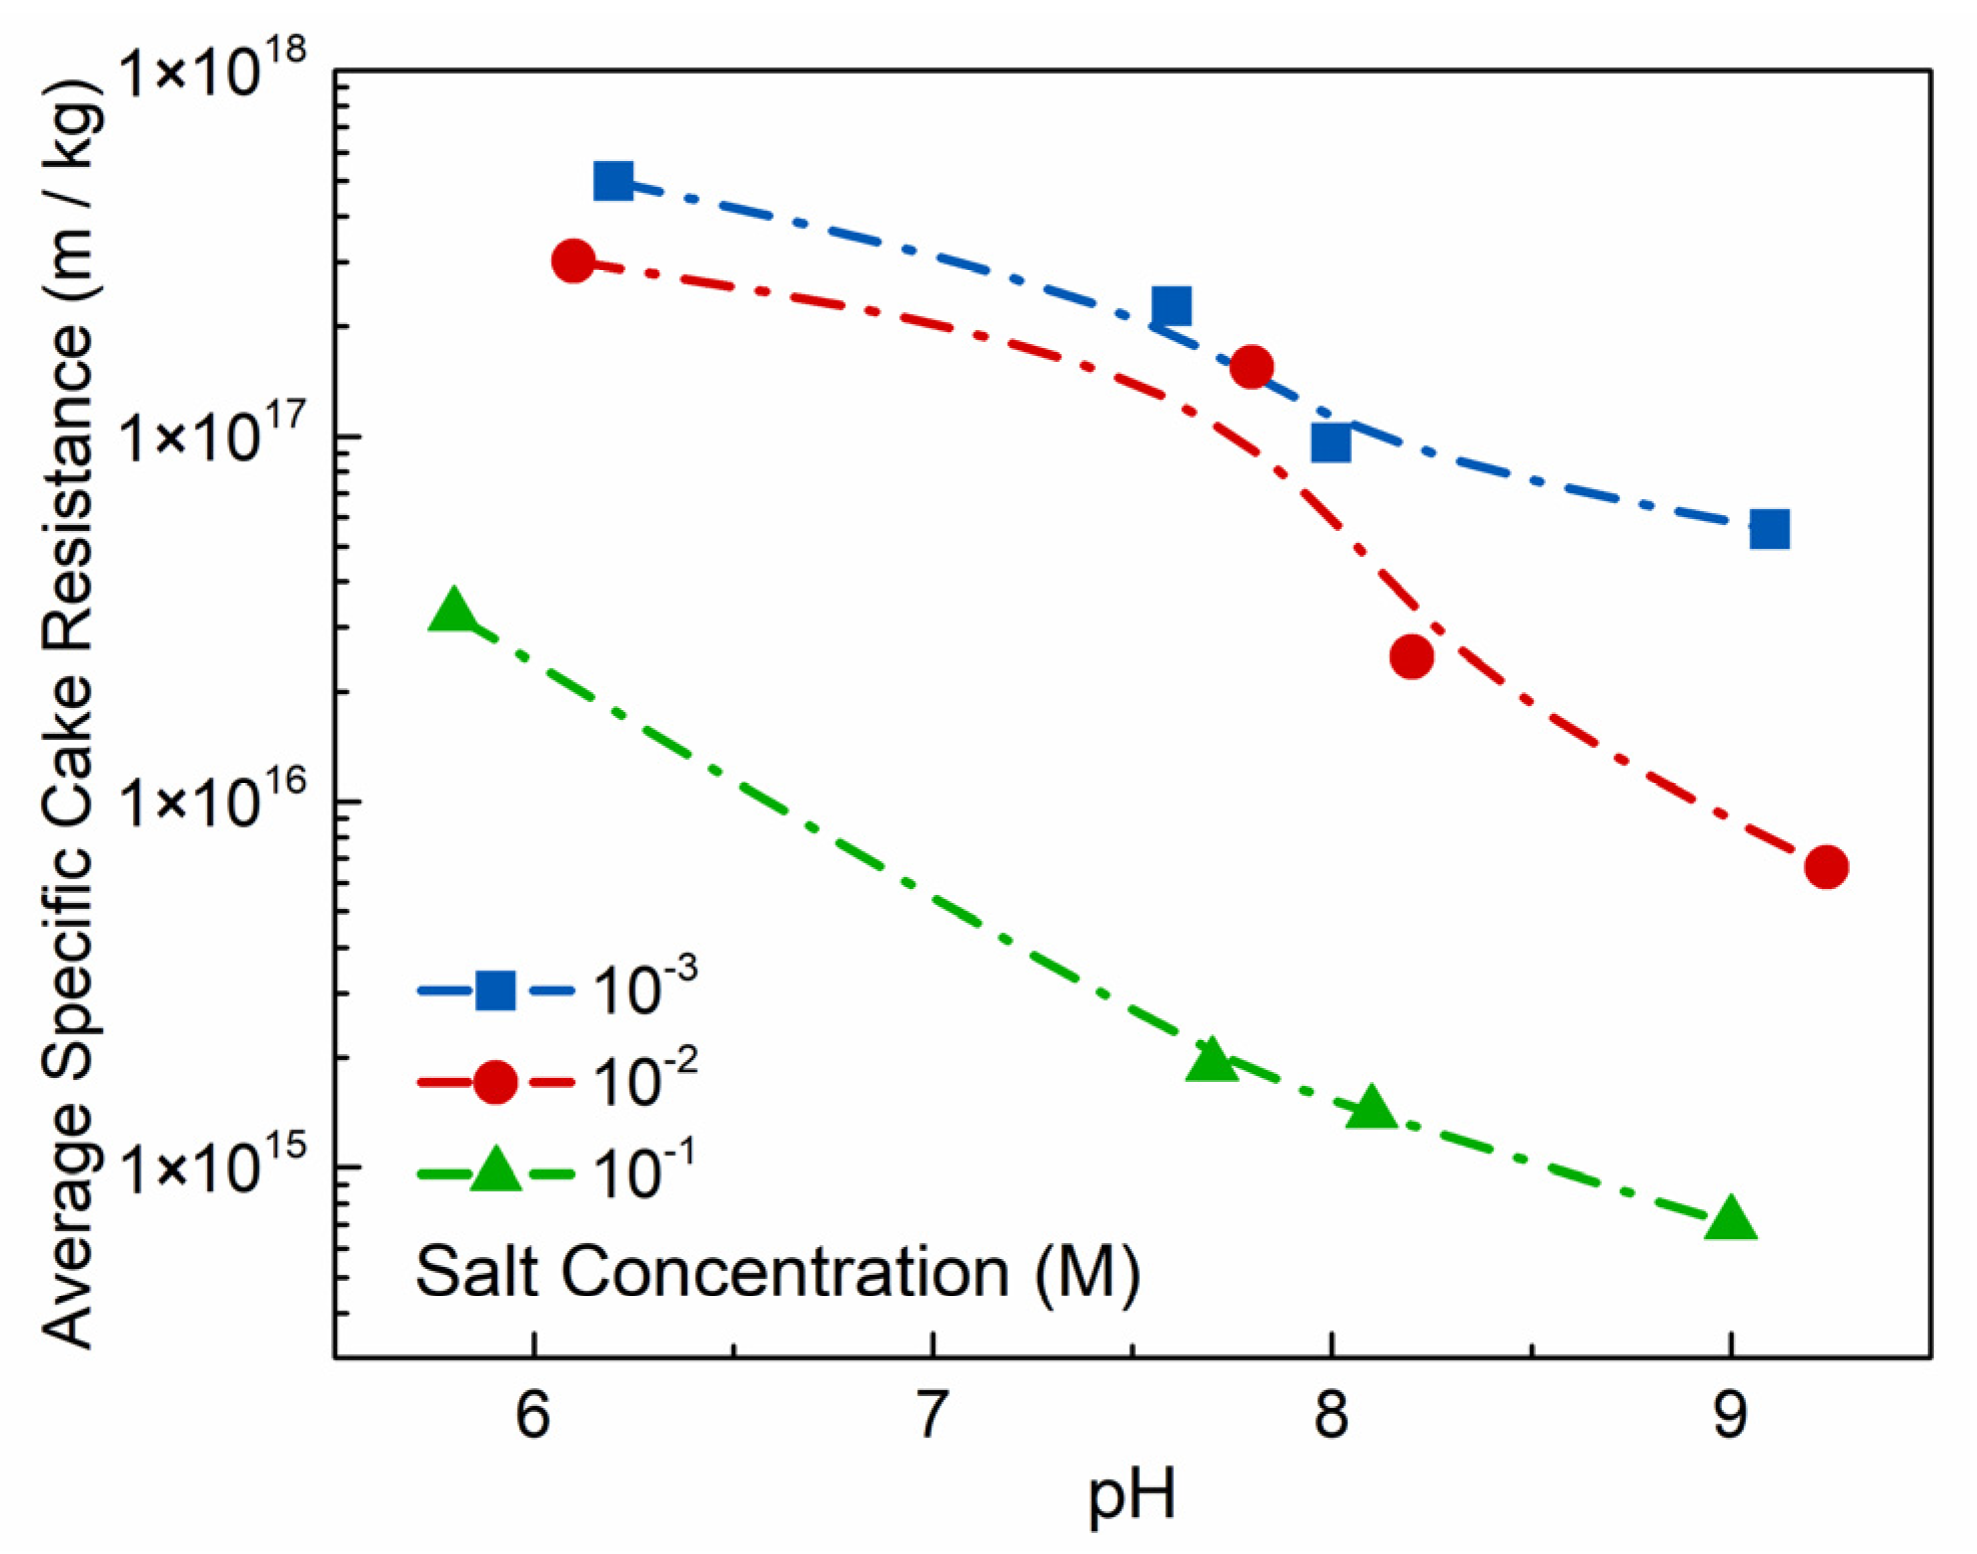
Figure 12b. In
Figure 11, the average specific cake resistance as an important parameter to measure the ease of filtration is decreased with pH and salt concentration increase. In terms of the impact on pH, increasing pH leads to the edge-OH
− transformation into edge-OH
2− due to the increasing OH
− in the suspension [
15]. Due to the Edge/Face connection breaking gradually, water molecules become free water, which is beneficial to the dewatering process. Tombacz, E. and Szekeres, M. [
15] also found that the formation of layers ordered in parallel to each other with pH increased, because the intensity of basal plane reflection increased markedly with increasing pH. In terms of impact on salt concentration, Edge/Face interaction reduces with the increasing salt concentration at pH < pH
PZC,edge. However, the addition of electrolyte also suppresses the electrical double layer on the particle surfaces and the shielding effect of the extended double layers at the edges is reduced [
44]. Thus, addition of salt concentration will not induce the Face/Face network structure, and Edge/Face mode coagulation will still form with reduction of floc strength. This will facilitate the removal of water molecules in the network structure under external forces. At pH > pH
PZC,edge, the effect of salt concentration on the electric double layer will inhibit the osmotic expansion and reduce the water molecules between the Na-Mt layers [
45,
46]. At high salt concentration, the Na-Mt layers coagulated by overlapping of the faces, forming large flocs with Face/Face network structure, as shown in
Figure 12c. In this case, the water molecules in the structure space are reduced greatly, and they are easier to be squeezed out.
5. Conclusions
The Na-Mt suspension is adjusted by pH and salt concentration so that the surface charge of the Na-Mt particles changes. The positive or negative charge of the pH-dependent edge is formed by the transfer of H+ or OH− from the aqueous phase. Increasing the salt concentration can inhibit the development of the electric double layer of the particles. Two factors change the interaction force between particles, making them appear in dispersed or coagulated state in the suspension, which is reflected in sedimentation, rheology, and filtration experiments. When pH < pHPZC,edge, the Na-Mt suspension can coagulate spontaneously at low salt concentration. However, when pH increases over pHPZC,edge, the coagulation does not occur until the salt concentration increases to 10−1 M. Besides, with the increases of pH or salt concentration, the viscosity and filtration rate increase, and the average specific cake resistance reduces. We propose that this phenomenon is related to the change of particle coagulation structure in the suspension, but further work should be conducted to verify this. In other words, coagulation or rapid settling is not the necessary condition to enhance filtration performance. Specifically, the three-dimensional Edge/Face network structure in Na-Mt suspension is relatively sealed and may block water molecules from being squeezed out of the structure in the filtration process. However, with the increasing of pH value and electrolyte concentration, the overlapping Face/Face association reduces the interlayer spacing and interlayer water molecules, thus enhancing the filtration performance significantly.


 and
and 


