The Paleoproterozoic Kandalaksha-Kolvitsa Gabbro-Anorthosite Complex (Fennoscandian Shield): New U–Pb, Sm–Nd, and Nd–Sr (ID-TIMS) Isotope Data on the Age of Formation, Metamorphism, and Geochemical Features of Zircon (LA-ICP-MS)


Abstract
1. Introduction
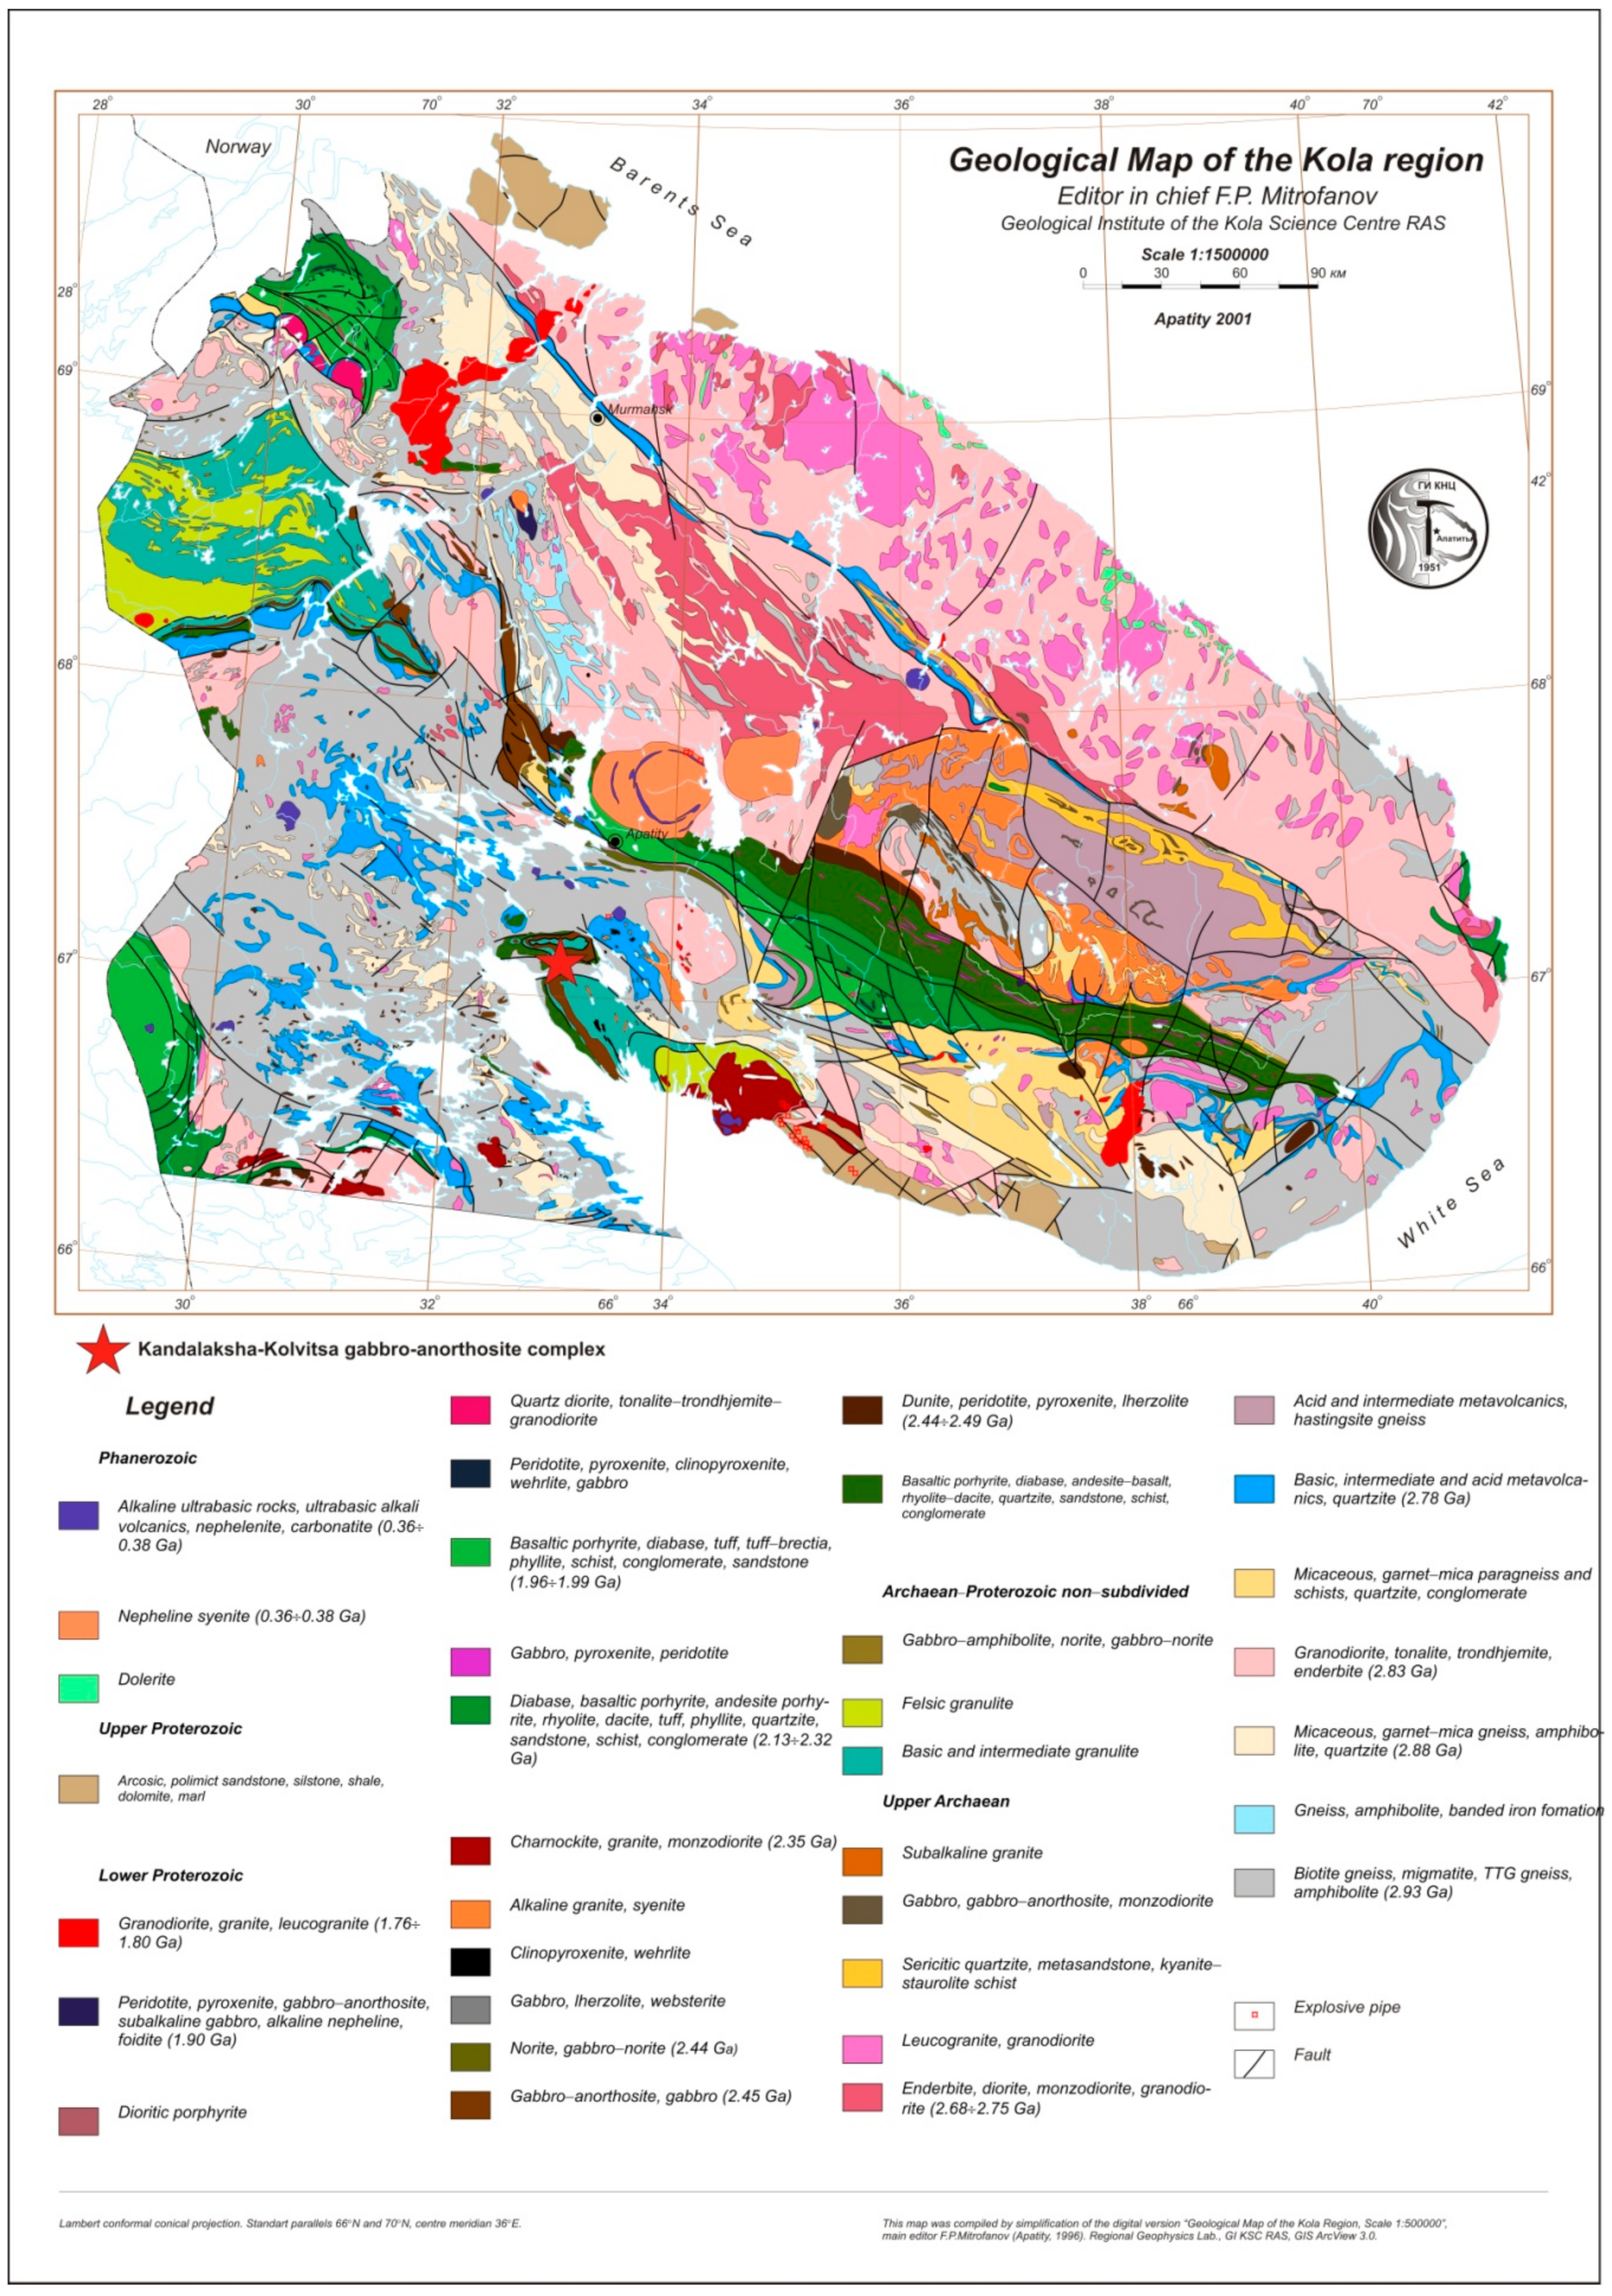
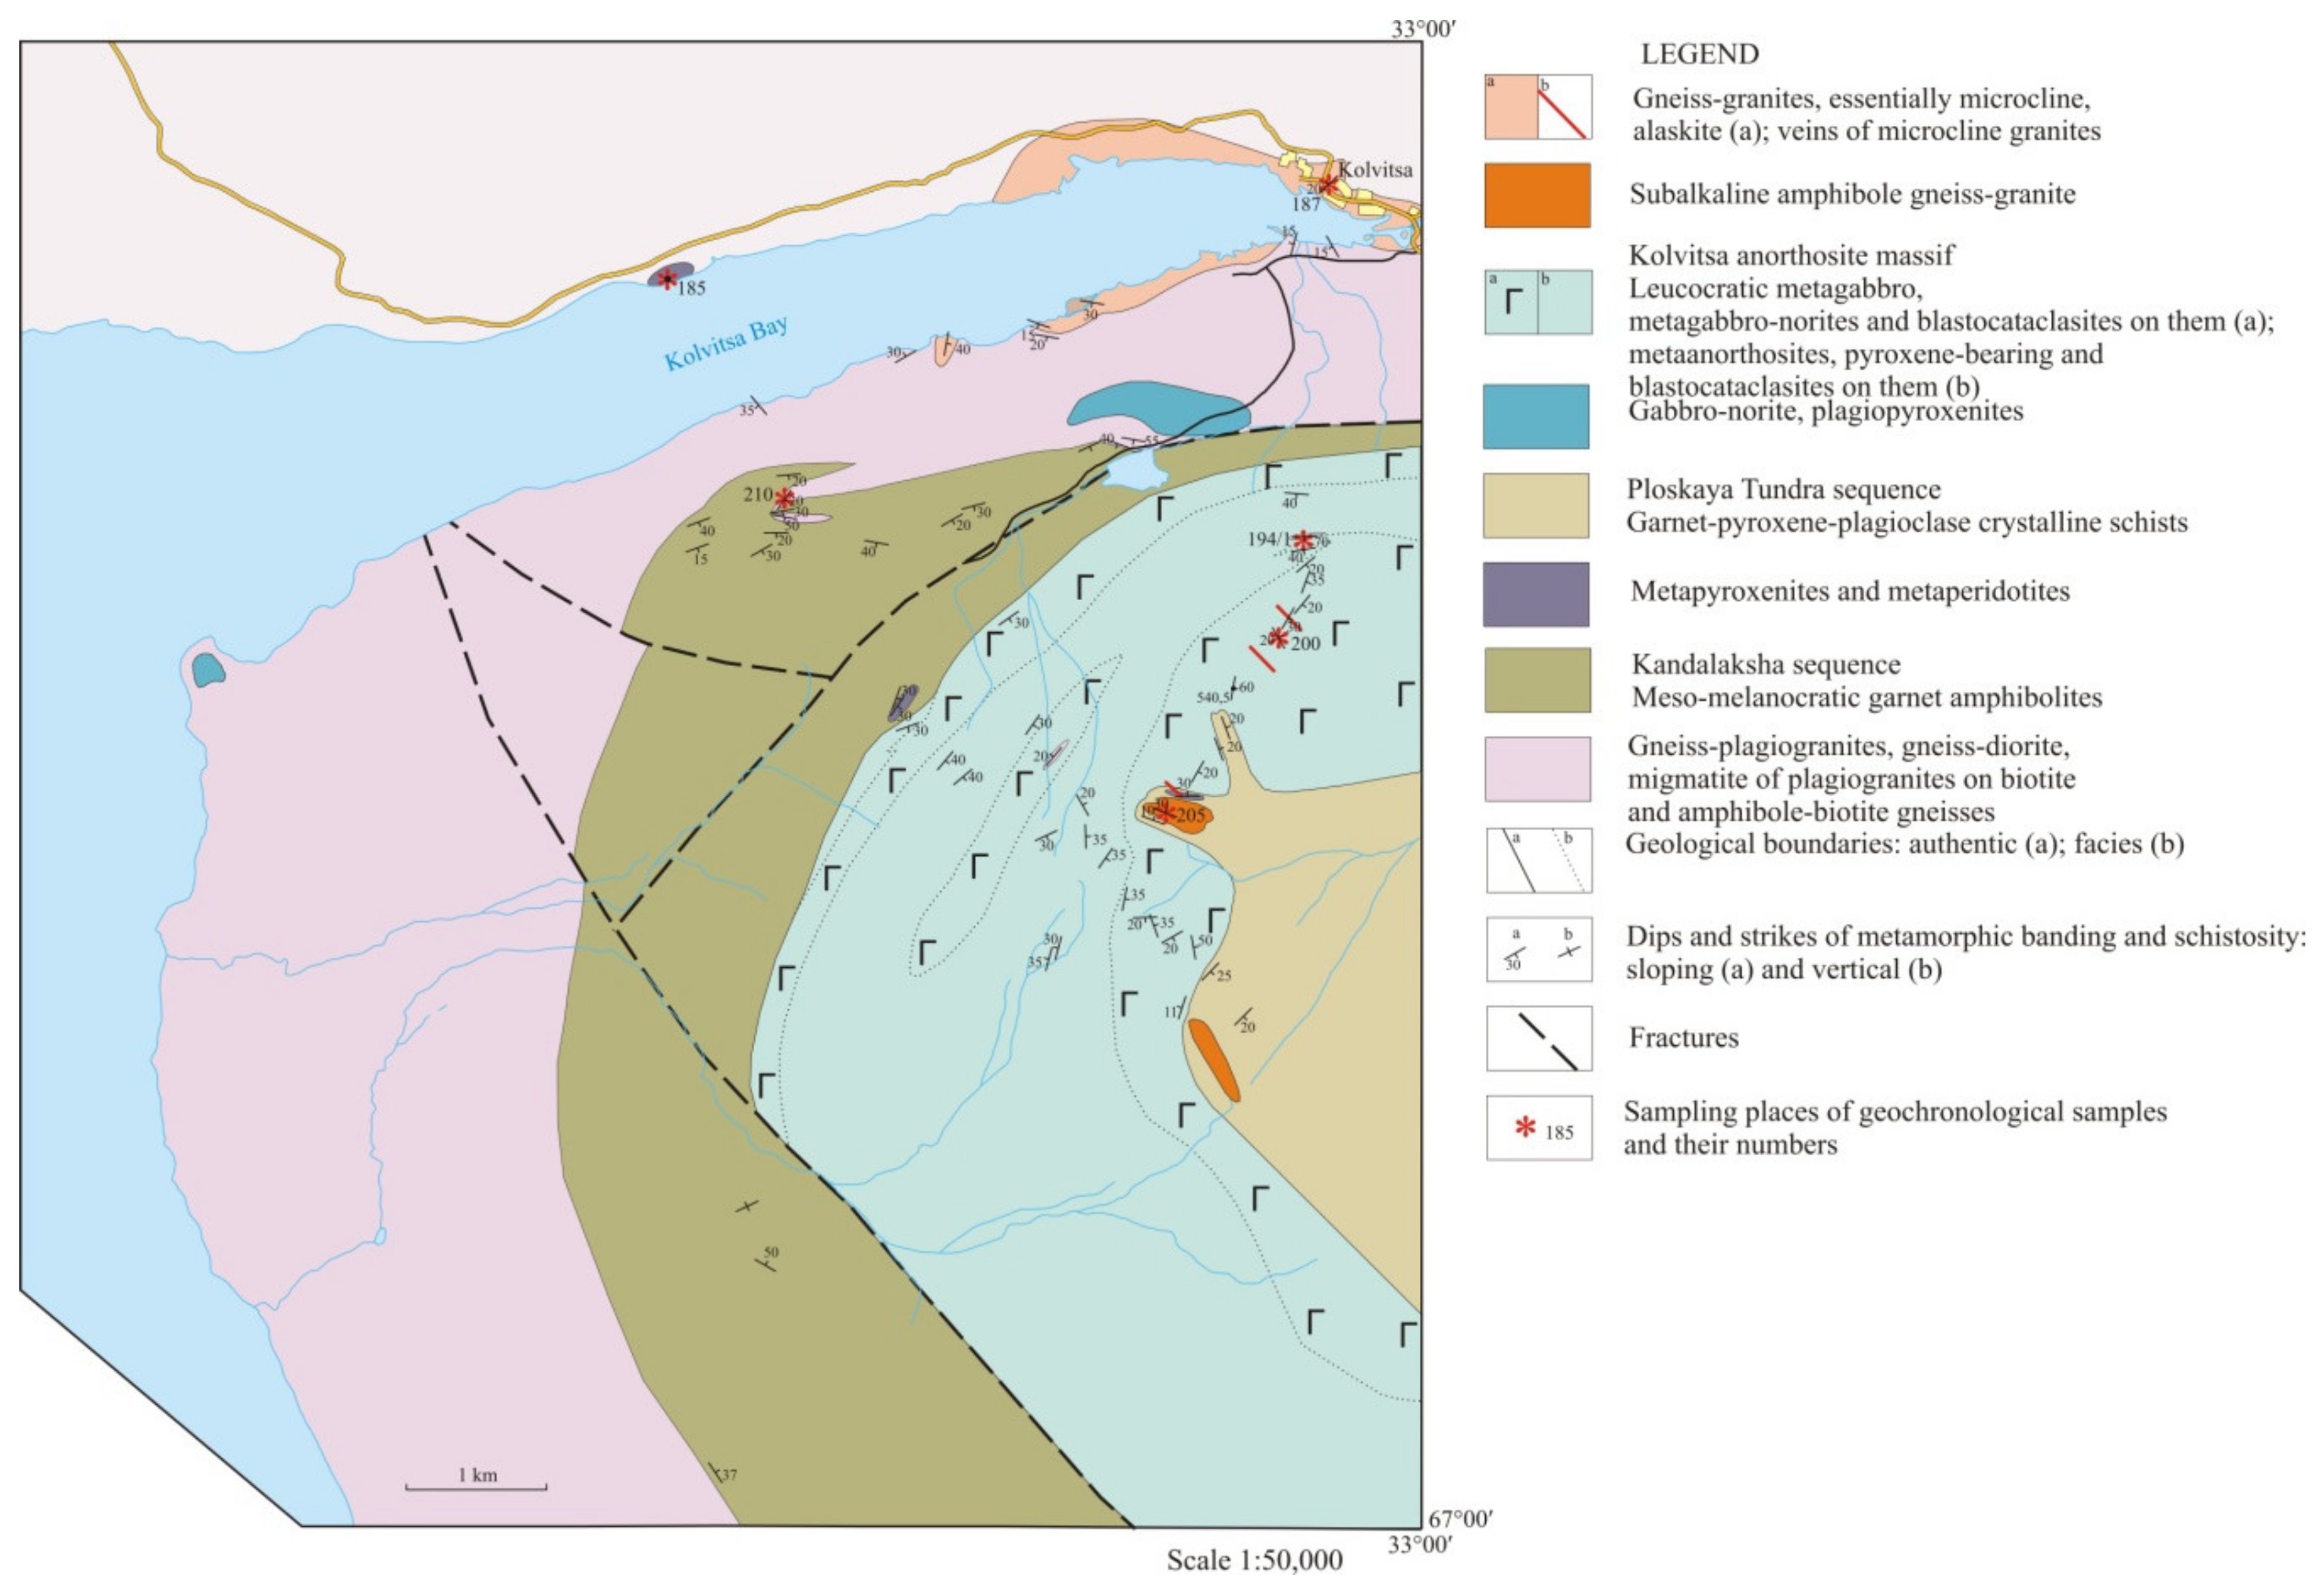
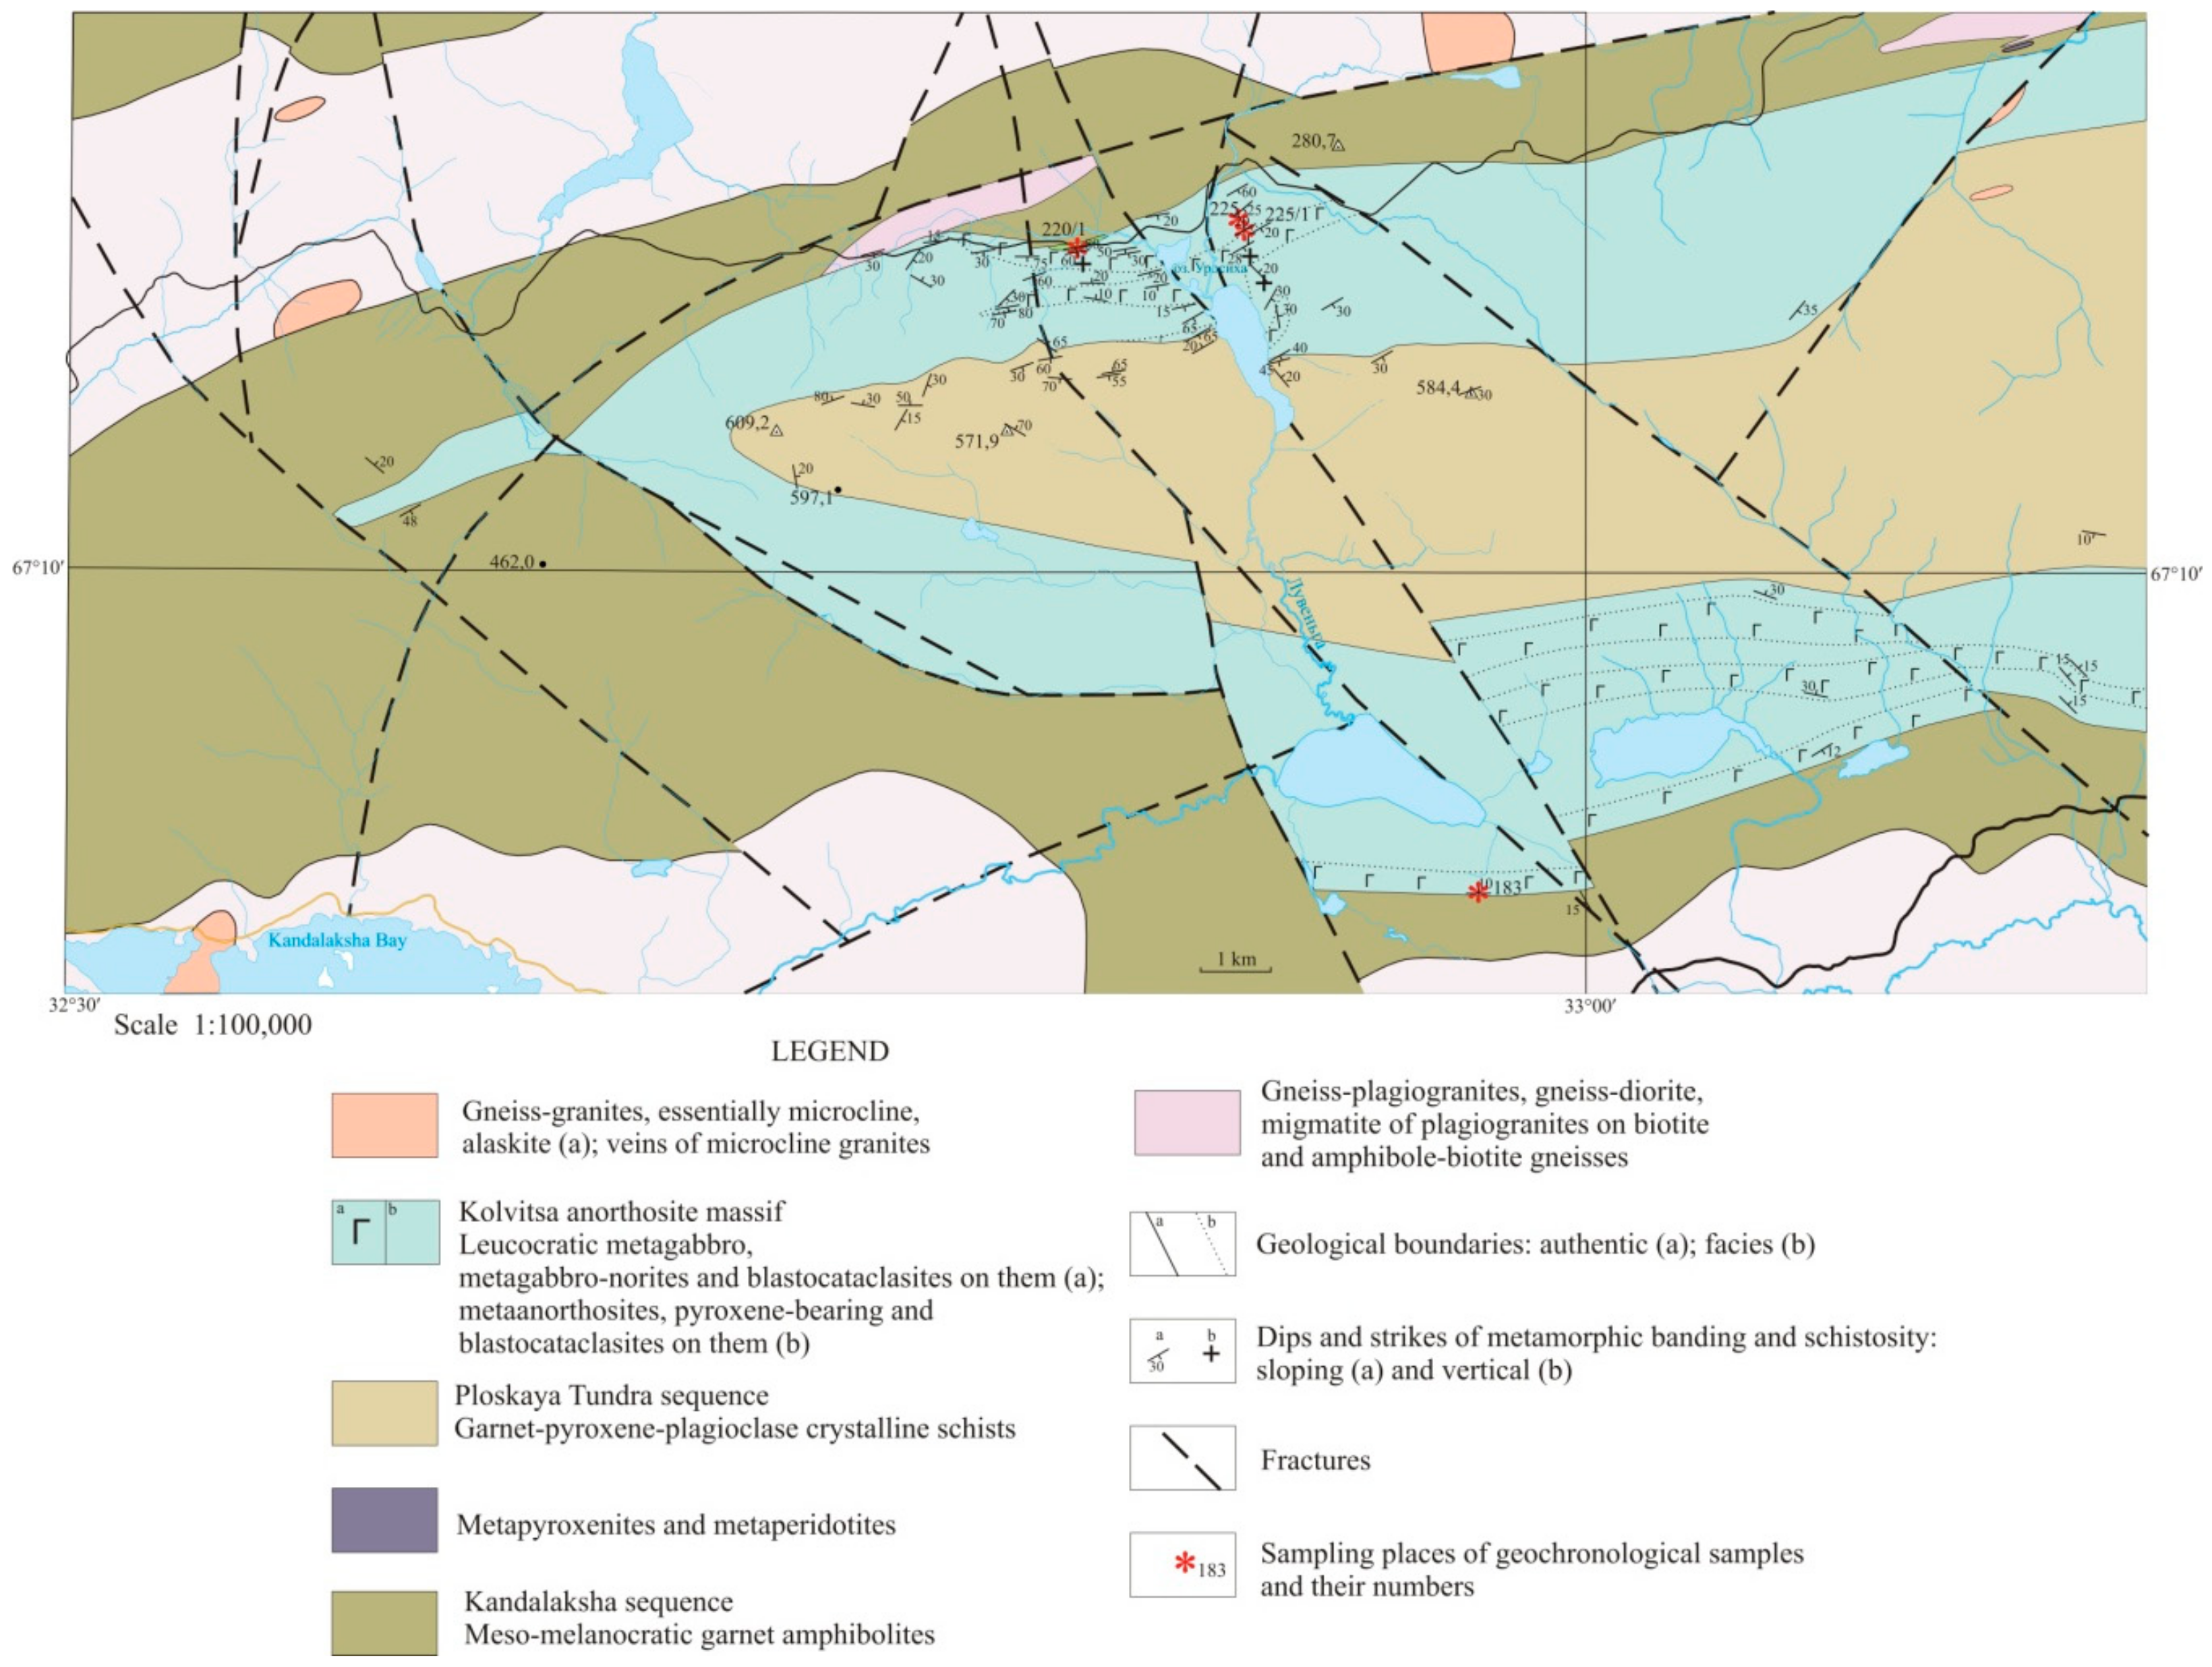
2. Geological Setting
3. Materials and Methods
3.1. LA-ICP-MS
3.2. U–Pb Dating
3.3. Sm–Nd Dating
3.4. Rb-Sr Method for Whole-Rock Samples
4. Results
4.1. Rock Samples and Minerals
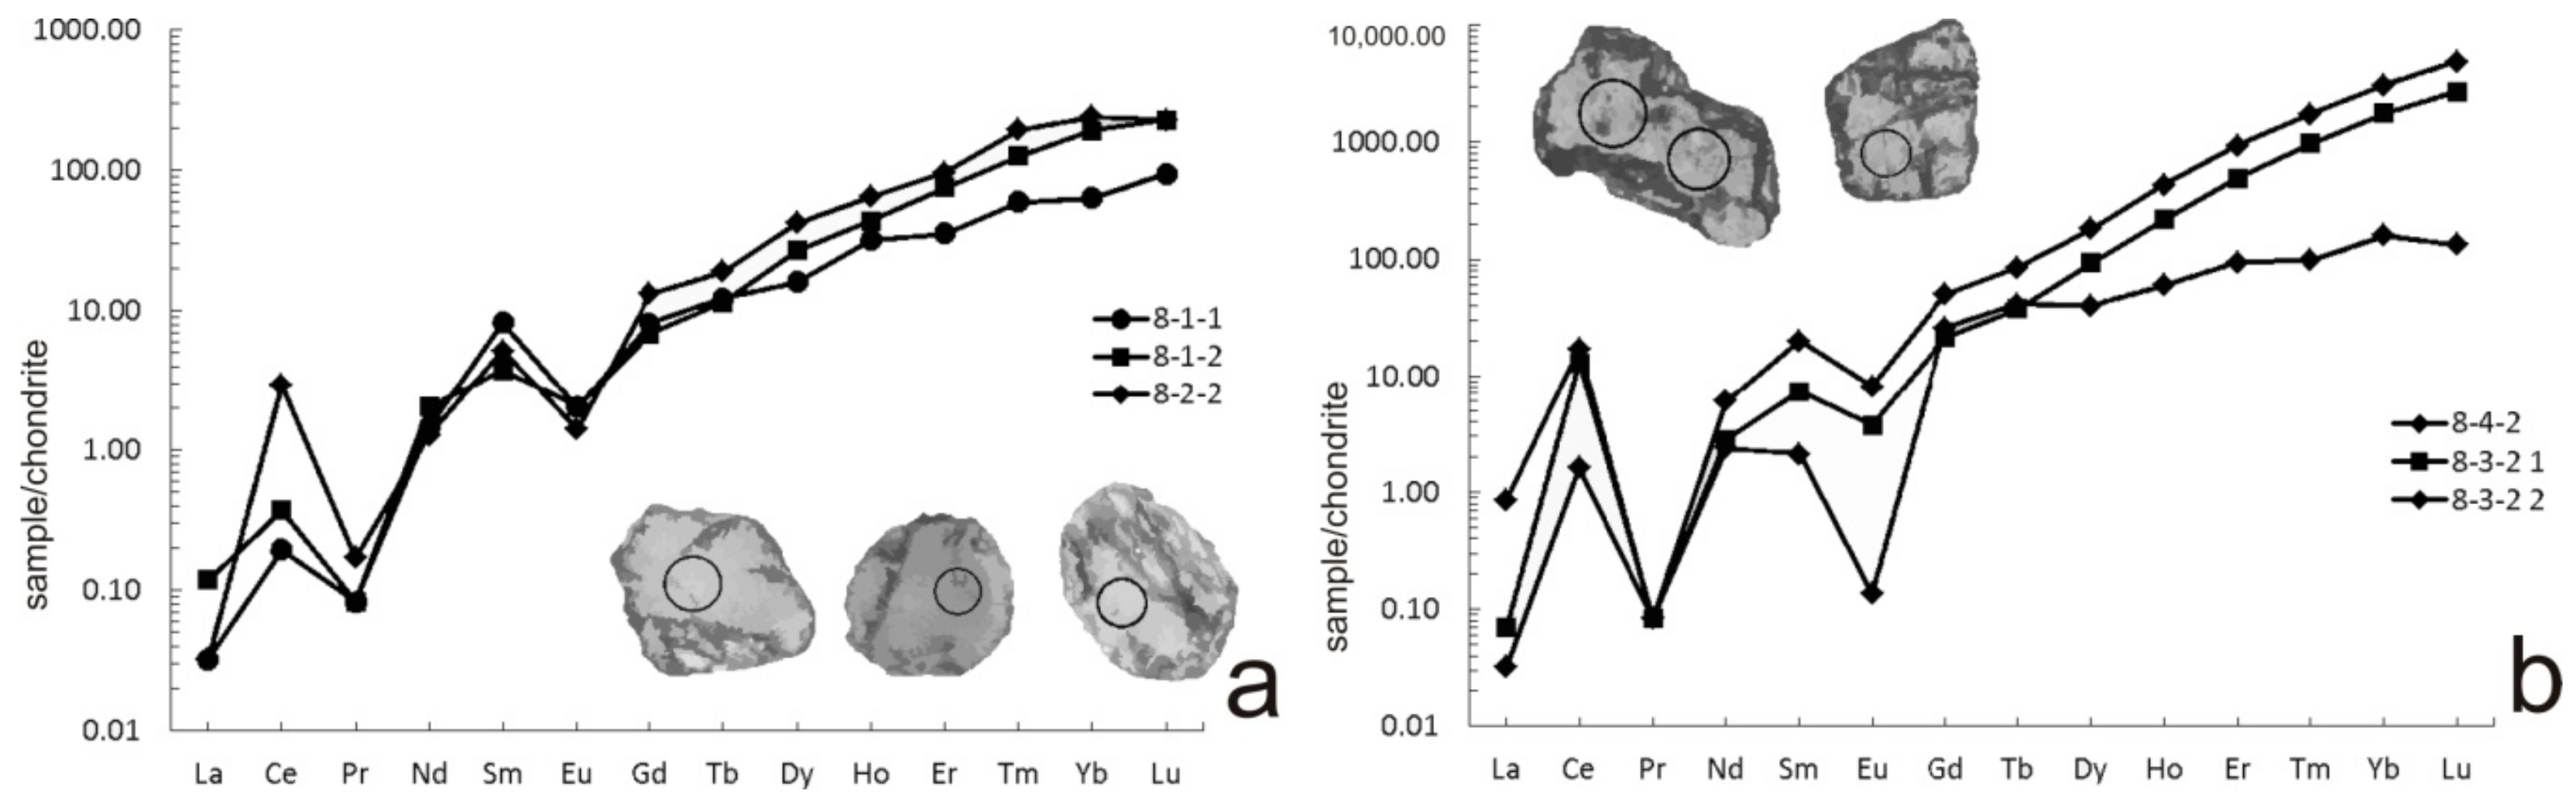
4.2. Trace Element Geochemistry of Zircon
4.3. Results of U–Pb and Sm–Nd Dating
4.4. Geochemical Nd–Sr Data
5. Discussion
- The age range of the formation was 2530 Ma to 2400 Ma, according to U–Pb and Sm–Nd geochronological data;
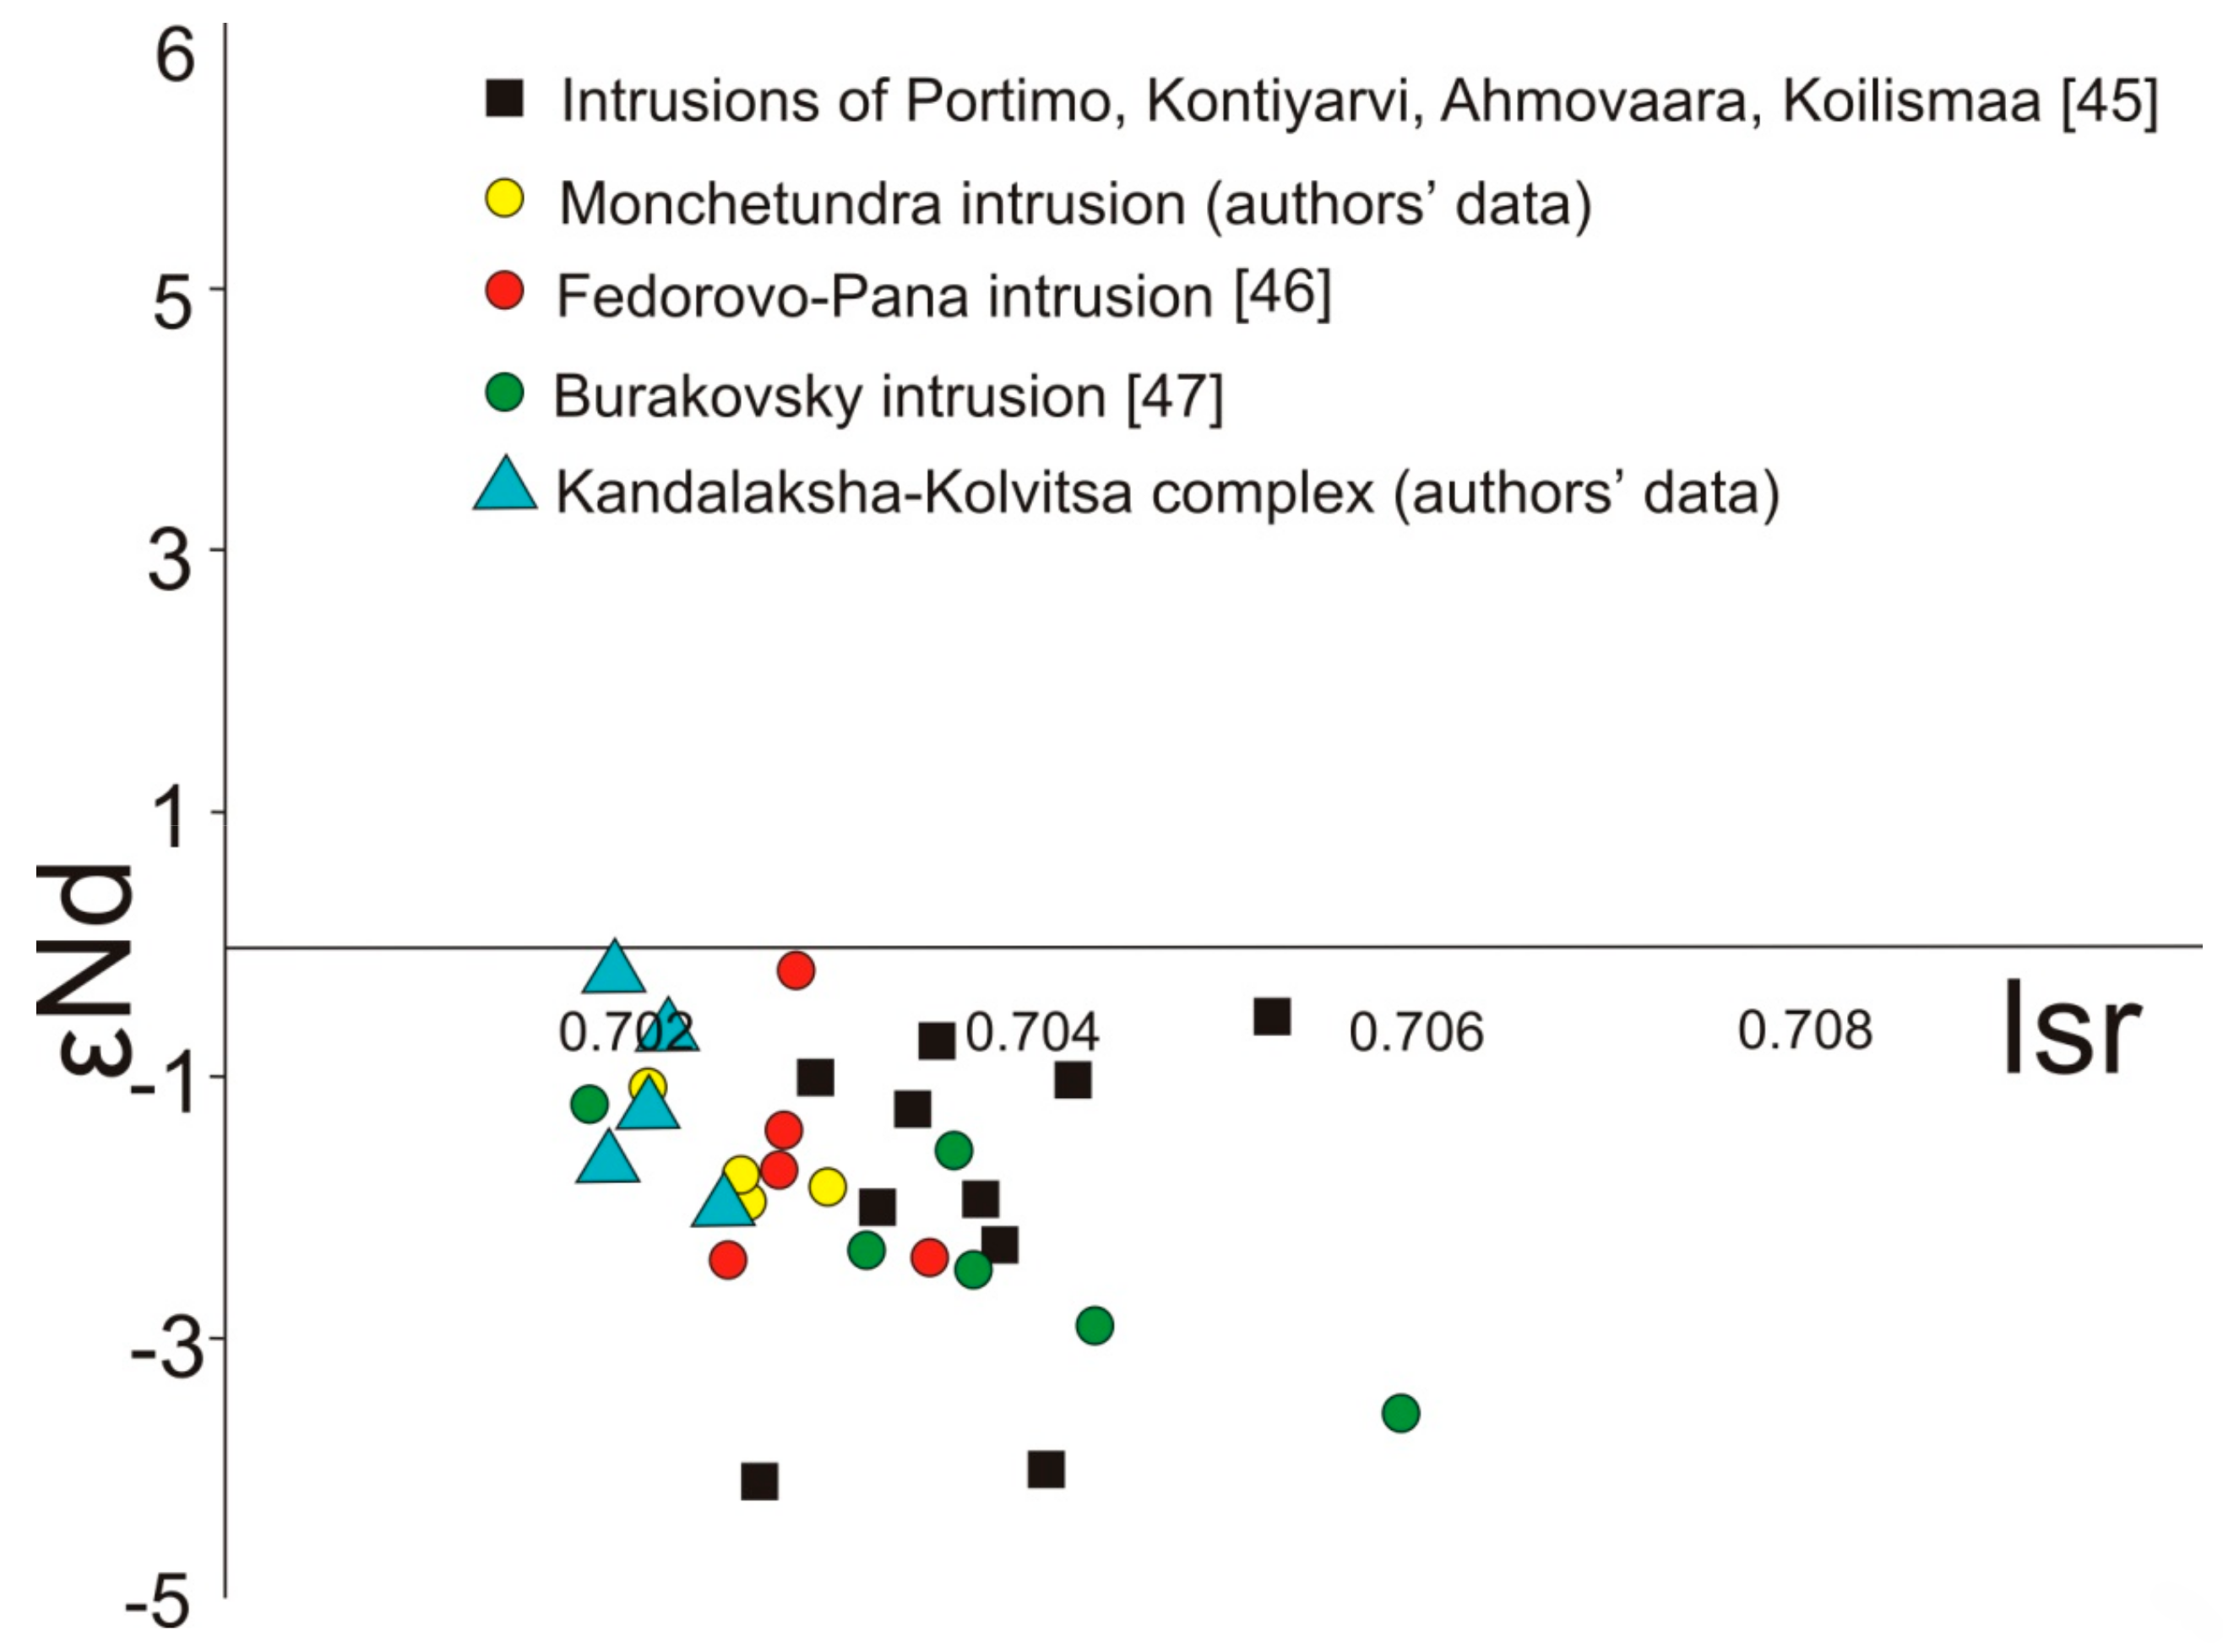
- The mantle reservoir, which is a source of the magmas that produced the massifs, was rich in lithophile elements. ISr values varied from 0.702 to 0.706, εNd(T) values varied from −0.02 to −3, and model Sm–Nd ages of the TDM protoliths were 2.8–3.3 Ga.
6. Conclusions
Author Contributions
Funding
Conflicts of Interest
References
- Polat, A.; Appel, P.W.U.; Fryer, B.; Windley, B.; Frei, R.; Samson, I.M.; Huang, H. Trace element systematics of the Neoarchean Fiskenæsset anorthosite complex and associated meta-volcanic rocks, SW Greenland: Evidence for a magmatic arc origin. Precambrian Res. 2009, 175, 87–115. [Google Scholar] [CrossRef]
- Polat, A.; Fryer, B.J.; Appel, P.W.U.; Kalvig, P.; Kerrich, R.; Dilek, Y.; Yang, Z. Geochemistry of anorthositic differentiated sills in the Archean (~2970Ma) Fiskenæsset Complex, SW Greenland: Implications for parental magma compositions, geodynamic setting, and secular heat flow in arcs. Lithos 2011, 123, 50–72. [Google Scholar] [CrossRef]
- Hoffmann, J.E.; Svahnberg, H.; Piazolo, S.; Scherstén, A.; Münker, C. The geodynamic evolution of Mesoarchean anorthosite complexes inferred from the Naajat Kuuat Complex, southern West Greenland. Precambrian Res. 2012, 196–197, 149–170. [Google Scholar] [CrossRef]
- Mitrofanov, F.P. Prospecting indicators for new industrial deposits of Ro–Pt–Pd and Co–Cu–Ni and Cr ores on the Kola Peninsula. Otechestvennaya Geol. 2006, 4, 3–9. (In Russian) [Google Scholar]
- Mitrofanov, F.P. Geological Map of the Kola region. Scale 1:500000; GIS ArcView 3.0; Regional Geophysics Lab., GI KSC RAS: Apatity, Russia, 1996; Available online: http://www.geokniga.org/maps/5457 (accessed on 9 March 2020).
- Mitrofanov, F.P.; Bayanova, T.B.; Korchagin, A.U.; Groshev, N.Y.; Malitch, K.N.; Zhirov, D.V.; Mitrofanov, A.F. East Scandinavian and noril’sk plume mafic large igneous provinces of Pd–Pt ores: Geological and metallogenic comparison. Geol. Ore Depos. 2013, 55, 305–319. [Google Scholar] [CrossRef]
- Mitrofanov, F.P.; Balagansky, V.V.; Balashov, Y.A.; Gannibal, L.F.; Dokuchaeva, V.S.; Nerovich, L.I.; Radchenko, M.K.; Rünginen, G.I. U–Pb age of gabbro-anorthosites of the Kola Peninsula. Dokl. Akad. Nauk 1993, 331, 1. (In Russian) [Google Scholar]
- Frisch, T.; Jackson, H.; Glebovitsky, V.A.; Efimov, M.M.; Bogdanova, M.N.; Parrish, P.P. U–Pb geochronology of zircon of the Kolvitsa gabbro-anorthosite complex, southern part of the Kola Peninsula, Russia. Petrologiya 1995, 3, 248–254. (In Russian) [Google Scholar]
- The Early Precambrian of the Baltic Shield; Glebovitsky, V.A., Ed.; Nauka: St. Petersburg, Russia, 2005; p. 711. (In Russian) [Google Scholar]
- Balagansky, V.V.; Timmerman, M.Y.; Kislitsyn, R.V.; Daily, J.S.; Balashov, Y.A.; Gannibal, L.F.; Sherstennikova, O.G.; Rünginen, G.I. Isotope age of rocks of the Kolvitsa belt and Umba block (south-eastern flank of the Lapland Granulite Belt), Kola Peninsula. Vest. MSTU 1998, 1, 19–32. (In Russian) [Google Scholar]
- Nikolaev, A.I.; Drogobuzhskaya, S.V.; Bayanova, T.B.; Kaulina, T.V.; Lyalina, L.M.; Novikov, A.I.; Steshenko, E.N. REE distribution in zircon from reference rocks of the Arctic region: evidence from study by the LA-ICP-MS method. Doklady Earth Sci. 2016, 470, 1037–1041. [Google Scholar] [CrossRef]
- Steshenko, E.N.; Nikolaev, A.I.; Bayanova, T.B.; Drogobuzhskaya, S.V.; Chashchin, V.V.; Serov, P.A.; Lyalina, L.M.; Novikov, A.I. The Paleoproterozoic Kandalaksha anorthosite massif: New U–Pb (ID-TIMS) data and geochemical features of zircon. Doklady Earth Sci. 2017, 477, 1454–1457. [Google Scholar] [CrossRef]
- Steshenko, E.N.; Nikolaev, A.I.; Bayanova, T.B.; Drogobuzhskaya, S.V.; Chashchin, V.V.; Serov, P.A.; Lyalina, L.M.; Novikov, A.I.; Elizarov, D.V. The Paleoproterozoic Kolva anorthosite block: New data on the U–Pb age (ID TIMS) and geochemical features of zircon. Doklady Earth Sci. 2018, 479, 366–370. [Google Scholar] [CrossRef]
- Certificate of Analysis. Standard Reference Material 612. In Trace Element in Glass; NIST: Gaithersburg, MD, USA, 2012; pp. 1–4. [Google Scholar]
- Pearce, N.J.G.; Perkins, W.T.; Westgate, J.A. A compilation of new and published major and trace element data for NIST SRM 610 and NIST SRM 612 glass reference materials. Geostand. Newslett. 1997, 21, 115–144. [Google Scholar] [CrossRef]
- Jochum, K.P.; Weis, U.; Stoll, B.; Kuzmin, D.; Yang, Q.; Raczek, I.; Jacob, D.E.; Stracke, A.; Birbaum, K.; Frick, D.A.; et al. Determination of reference values for NIST SRM 610–617 Glasses Following ISO Guidelines. Geostand. Geoanalyt. Res. 2011, 35, 397–429. [Google Scholar] [CrossRef]
- Reischmann, T.; Brugmann, G.E.; Jochum, K.P.; Todt, W.A. Trace element and isotopic composition of baddeleyite. Miner. Petrol. 1995, 53, 155–164. [Google Scholar] [CrossRef]
- Schmitt, A.K.; Chamberlain, K.R.; Swapp, S.M.; Harrison, T.M. In situ U–Pb dating of micro-baddeleyite by secondary ion mass spectrometry. Chem. Geol. 2010, 269, 386–395. [Google Scholar] [CrossRef]
- Li, Q.L.; Li, X.H.; Liu, Y.; Tang, G.Q.; Yanga, J.H.; Zhu, W.G. Precise U–Pb and Pb-Pb dating of Phanerozoic baddeleyite by SIMS with oxygen flooding technique. J. Anal. At. Spectrom. 2010, 25, 1107–1113. [Google Scholar] [CrossRef]
- Krogh, T.E. A low-contamination method for hydrothermal dissolution of zircon and extraction of U and Pb for isotopic age determinations. Geochim. Cosmochim. Acta 1973, 37, 485–494. [Google Scholar] [CrossRef]
- Schärer, U.; Gower, C.F. Crustal evolution in Eastern Labrador: Constraints from precise U–Pb ages. Precambrian Res. 1988, 38, 405–421. [Google Scholar] [CrossRef]
- Schärer, U.; Wilmart, E.; Duchesne, J.C. The short duration and anorogenic character of anorthosite magmatism: U–Pb dating of the Rogaland Complex, Norway. Earth Planet. Sci. Lett. 1996, 139, 335–350. [Google Scholar] [CrossRef]
- Ludwig, K.R. PBDAT: A Computer Program for Processing Pb–U–Th Isotope Data, Version 1.22; Open-File Report 88-542; United States Geological Survey: Reston, VA, USA, 1991; 33p. [Google Scholar]
- Ludwig, K.R. ISOPLOT/Ex: A Geochronological Toolkit for Microsoft Excel, Version 2.05; Berkeley Geochronology Center Special Publication: Berkeley, CA, USA, 1999; Volume 1, p. 49. [Google Scholar]
- Steiger, R.; Jäger, E. Subcommission on geochronology: Convention on the use of decay constants in geo- and cosmochronology. Earth Planet. Sci. Lett. 1977, 36, 359–362. [Google Scholar] [CrossRef]
- Stacey, J.S.; Kramers, J.D. Approximation of terrestrial lead isotope evolution by a two-stage model. Earth Planet. Sci. Lett. 1975, 26, 207–221. [Google Scholar] [CrossRef]
- Raczek, I.; Jochum, K.P.; Hofmann, A.W. Neodymium and strontium isotope data for USGS reference materials BCR-1, BCR-2, BHVO-1, BHVO-2, AGV-1, AGV-2, GSP-1, GSP-2 and eight MPI-DING reference glasses. Geostand. Geoanalytical Res. 2003, 27, 173–179. [Google Scholar] [CrossRef]
- Tanaka, T.; Togashi, S.; Kamioka, H.; Amakawa, H.; Kagami, H.; Hamamoto, T.; Yuhara, M.; Orihashi, Y.; Yoneda, S.; Shimizu, H.; et al. JNdi-1: A neodymium isotopic reference in consistency with LaJolla neodymium. Chem. Geol. 2000, 168, 279–281. [Google Scholar] [CrossRef]
- Ludwig, K.R. ISOPLOT/Ex—A geochronological toolkit for Microsoft Excel, Version 3.6. Berkeley Geochronol. Cent. Spec. Publ. 2008, 4, 76. [Google Scholar]
- Bouvier, A.; Vervoort, J.D.; Patchett, P.J. The Lu–Hf and Sm–Nd isotopic composition of CHUR: Constraints from unequilibrated chondrites and implications for the bulk composition of terrestrial planets. Earth Plan. Sci. Lett. 2008, 273, 48–57. [Google Scholar] [CrossRef]
- Goldstein, S.J.; Jacobsen, S.B. Nd and Sr isotopic systematics of river water suspended material implications for crystal evolution. Earth Plan. Sci. Lett. 1988, 87, 249–265. [Google Scholar] [CrossRef]
- Weis, D.; Kieffer, B.; Maerschalk, C.; Barling, J.; De Jong, J.; Williams, G.A.; Hanano, D.; Pretorius, W.; Mattielli, N.; Scoates, J.S.; et al. High-precision isotopic characterization of USGS reference materials by TIMS and MC-ICP-MS. Geochem. Geophys. Geosystems 2006, 7, Q08006. [Google Scholar] [CrossRef]
- Boynton, W.V. Cosmochemistry of the rare earth elements: Meteorite studies. In Developments in Geochemistry; Henserson, P., Ed.; Elsevier: Amsterdam, the Netherlands, 1984; pp. 63–114. [Google Scholar]
- Hoskin, P.W.O.; Schaltegger, U. The composition of zircon and igneous and metamorphic petrogenesis. Rev. Mineral. Geochem. 2003, 53, 27–62. [Google Scholar] [CrossRef]
- Watson, E.B.; Wark, D.A.; Thomas, J.B. Crystallization thermometers for zircon and rutile. Contrib. Mineral. Petrol. 2006, 151, 413–433. [Google Scholar] [CrossRef]
- Bayanova, T.B.; Corfu, F.; Todt, V.; Poller, U.; Levkovich, N.; Apanasevich, E.; Zhavkov, V. Heterogeneity of the 91500 and TEMORA-1 Standards for U–Pb Dating of Single Zircons. In Proceedings of the XVIII Symposium on Geochemistry of Isotopes dedicated to Acad, Moscow, Russia, 14–16 November 2007; pp. 42–43. (In Russian). [Google Scholar]
- Bibikova, E.V.; Bogdanova, S.V.; Glebovitsky, V.A.; Klaisson, S.; Sheld, T. Stages of the White Sea mobile belt evolution according to the data of U–Pb zircon geochronology (ion microprobe analyzer NORDSIM). Petrologiya 2004, 12, 227–244. (In Russian) [Google Scholar]
- Kaulina, T.V. Formation and Transformation of Zircon in Polymetamorphic Complexes; Kola Science Centre RAS: Apatity, Russia, 2010; p. 144. (In Russian) [Google Scholar]
- Mezger, K.; Hanson, G.N.; Bohlen, S.R. High-precision U–Pb ages of metamorphic rutile: application to the cooling history of high-grade terrains. Earth Plan. Sci. Lett. 1989, 96, 106–118. [Google Scholar] [CrossRef]
- Bayanova, T.B. The Age of Reference Geological Complexes of the Kola Region and Duration of Magmatism Processes; Nauka: St. Petersburg, Russia, 2004; p. 174. (In Russian) [Google Scholar]
- Pozhilenko, V.I.; Gavrilenko, B.V.; Zhirov, D.V.; Zhabin, S.V. Geology of Ore Areas of the Murmansk Region; Kola Science Centre RAS: Apatity, Russia, 2002; p. 359. (In Russian) [Google Scholar]
- Serov, P.A. Age Frontiers of the PGE Occurrence Formation in the Fedorovo-Pana Layered Massif, according to Sm–Nd and Rb–Sr Isotope Characteristics; Cand. Sci. (Geol.-mineral.) Thesis; AutoAbstr: Voronezh, Russia, 2008; p. 20. (In Russian) [Google Scholar]
- Bayanova, T.; Korchagin, A.; Mitrofanov, A.; Serov, P.; Ekimova, N.; Nitkina, E.; Kamensky, I.; Elizarov, D.; Huber, M. Long-lived mantle plume and polyphase evolution of Palaeoproterozoic PGE intrusions in the Fennoscandian Shield. Minerals 2019, 9, 59. [Google Scholar] [CrossRef]
- Lebedeva, Y.M.; Glebovitsky, V.A.; Bushmin, S.A.; Bogomolov, E.S.; Savva, E.V.; Lokhov, K.I. The age of high-bar metasomatism in shift areas under the collision metasomatism in the Lapland Granulite Belt: Sm–Nd method of dating parageneses from sillimanite-orthopyroxene rocks of the Porya Guba cover. Doklady Akad. Nauk 2010, 432, 99–102. (In Russian) [Google Scholar]
- Huhma, H.; Cliff, R.; Perttunen, V.; Sakko, M. Sm–Nd and Pb isotopic study of mafic rocks associated with early Proterozoic continental rifting: The Perapohja schist belt in northern Finland. Contrib. Mineral. Petrol. 1990, 104, 369–379. [Google Scholar] [CrossRef]
- Mitrofanov, F.P.; Bayanova, T.B.; Ludden, J.N.; Korchagin, A.U.; Chashchin, V.V.; Nerovich, L.I.; Serov, P.A.; Mitrofanov, A.F.; Zhirov, D.V. Origin and Exploration of the Kola PGE-bearing Province: New Constraints from Geochronology. In Ore Deposits: Origin, Exploration, and Exploitation; Decree, S., Robb, L., Eds.; Wiley: Hoboken, NJ, USA, 2019; pp. 3–36. [Google Scholar]
- Amelin, Y.V.; Semenov, V.S. U–Nd and Sr isotopic deochemistry of mafic layered intrusions in the eastern Baltic Shield: implications for the evolution of Paleoproterozoic continental mafic magmas. Contrib. Miner. Petrol. 1996, 124, 255–272. [Google Scholar] [CrossRef]
- Fu, B.; Page, F.Z.; Cavosie, A.J.; Fournelle, J.; Kita, N.T.; Lackey, J.S.; Wilde, S.A.; Valley, J.W. Ti-in-zircon thermometry: Applications and limitations. Contrib. Mineral. Petrol. 2008, 156, 197–215. [Google Scholar] [CrossRef]


| Elements | Sample Numbers * | ||||
|---|---|---|---|---|---|
| 8-1-1 | 8-1-2 | 8-2-2 | 8-3-2 | 8-4-2 | |
| Contents, ppm | |||||
| Y | 46.5 | 95.2 | 160.8 | 1095 | 126.9 |
| La | 0.01 | 0.04 | 0.01 | 0.14 | 0.01 |
| Ce | 0.16 | 0.30 | 2.36 | 12.1 | 1.30 |
| Pr | 0.01 | 0.01 | 0.02 | 0.01 | 0.01 |
| Nd | 0.88 | 1.22 | 0.77 | 2.66 | 1.43 |
| Sm | 1.60 | 0.74 | 1.01 | 2.66 | 0.41 |
| Eu | 0.15 | 0.15 | 0.10 | 0.43 | 0.01 |
| Gd | 2.10 | 1.77 | 3.41 | 9.30 | 6.68 |
| Tb | 0.58 | 0.54 | 0.91 | 2.92 | 1.97 |
| Dy | 5.19 | 8.62 | 13.6 | 44.6 | 13.0 |
| Ho | 2.30 | 3.13 | 4.67 | 23.4 | 4.29 |
| Er | 7.50 | 15.8 | 20.4 | 150.4 | 19.8 |
| Tm | 1.93 | 4.12 | 6.33 | 44.1 | 3.18 |
| Yb | 13.3 | 40.1 | 50.5 | 503.8 | 33.4 |
| Lu | 3.05 | 7.37 | 7.32 | 121.8 | 4.33 |
| Total REE | 38.8 | 84.0 | 111.4 | 918.4 | 89.8 |
| Sample Number | Contents, Ti, ppm | Temperature, °C | T;aver. °C | ||
| 8-1-1 | 10.6 | 746.5 | 778 | ||
| 8-1-2 | 27.1 | 837.0 | |||
| 8-3-2 1 | 22.1 | 815.6 | |||
| 8-3-2 2 | 11.7 | 754.9 | |||
| 8-4-2 1 | 21.3 | 812.1 | |||
| 8-4-2 2 | 8.12 | 723.2 | |||
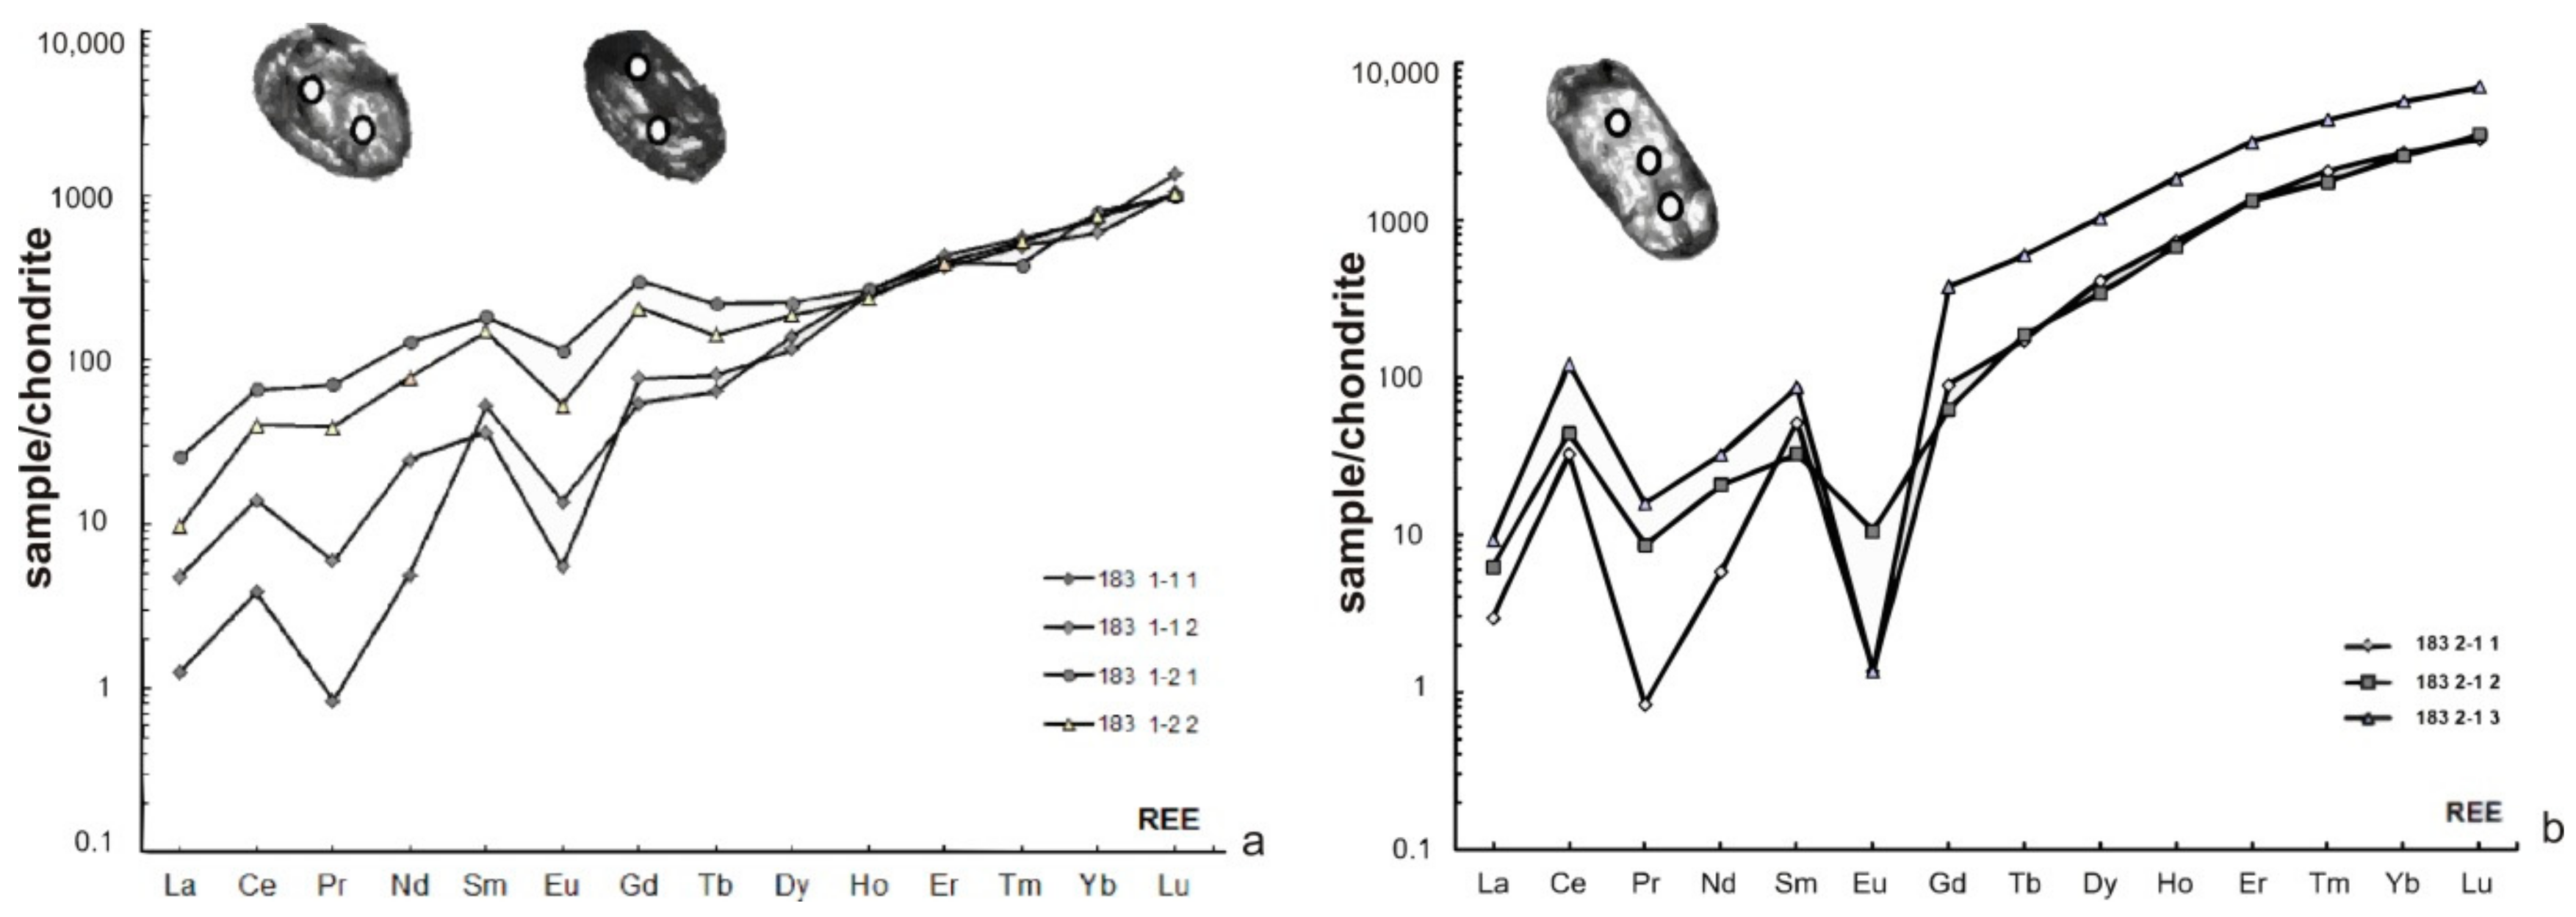
| Elements | Sample Numbers * | ||
|---|---|---|---|
| 183 1-1 | 183 1-2 | 183 2-1 | |
| Contents, ppm | |||
| La | 1.52 | 5.43 | 1.91 |
| Ce | 12.6 | 42.4 | 53.3 |
| Pr | 1.18 | 6.56 | 1.01 |
| Nd | 14.2 | 61.3 | 11.8 |
| Sm | 7.57 | 32.1 | 11.1 |
| Eu | 1.30 | 6.09 | 0.32 |
| Gd | 17.1 | 65.1 | 45.9 |
| Tb | 3.95 | 8.50 | 15.1 |
| Dy | 37.1 | 65.5 | 191.3 |
| Ho | 16.7 | 18.0 | 77.7 |
| Er | 79.1 | 82.1 | 404.9 |
| Tm | 16.6 | 14.6 | 88.0 |
| Yb | 145.0 | 160.9 | 764.1 |
| Lu | 37.4 | 32.0 | 148.5 |
| Total | 391.3 | 600.5 | 1815.0 |
| Sample Number | Contents, Ti, ppm | Temperature, °C | Taver. °C |
| 183 1-1 | 33.8 | 860.8 | 843.7 |
| 183 2-1 1 | 36.7 | 869.7 | |
| 183 2-1 2 | 19.0 | 800.7 | |
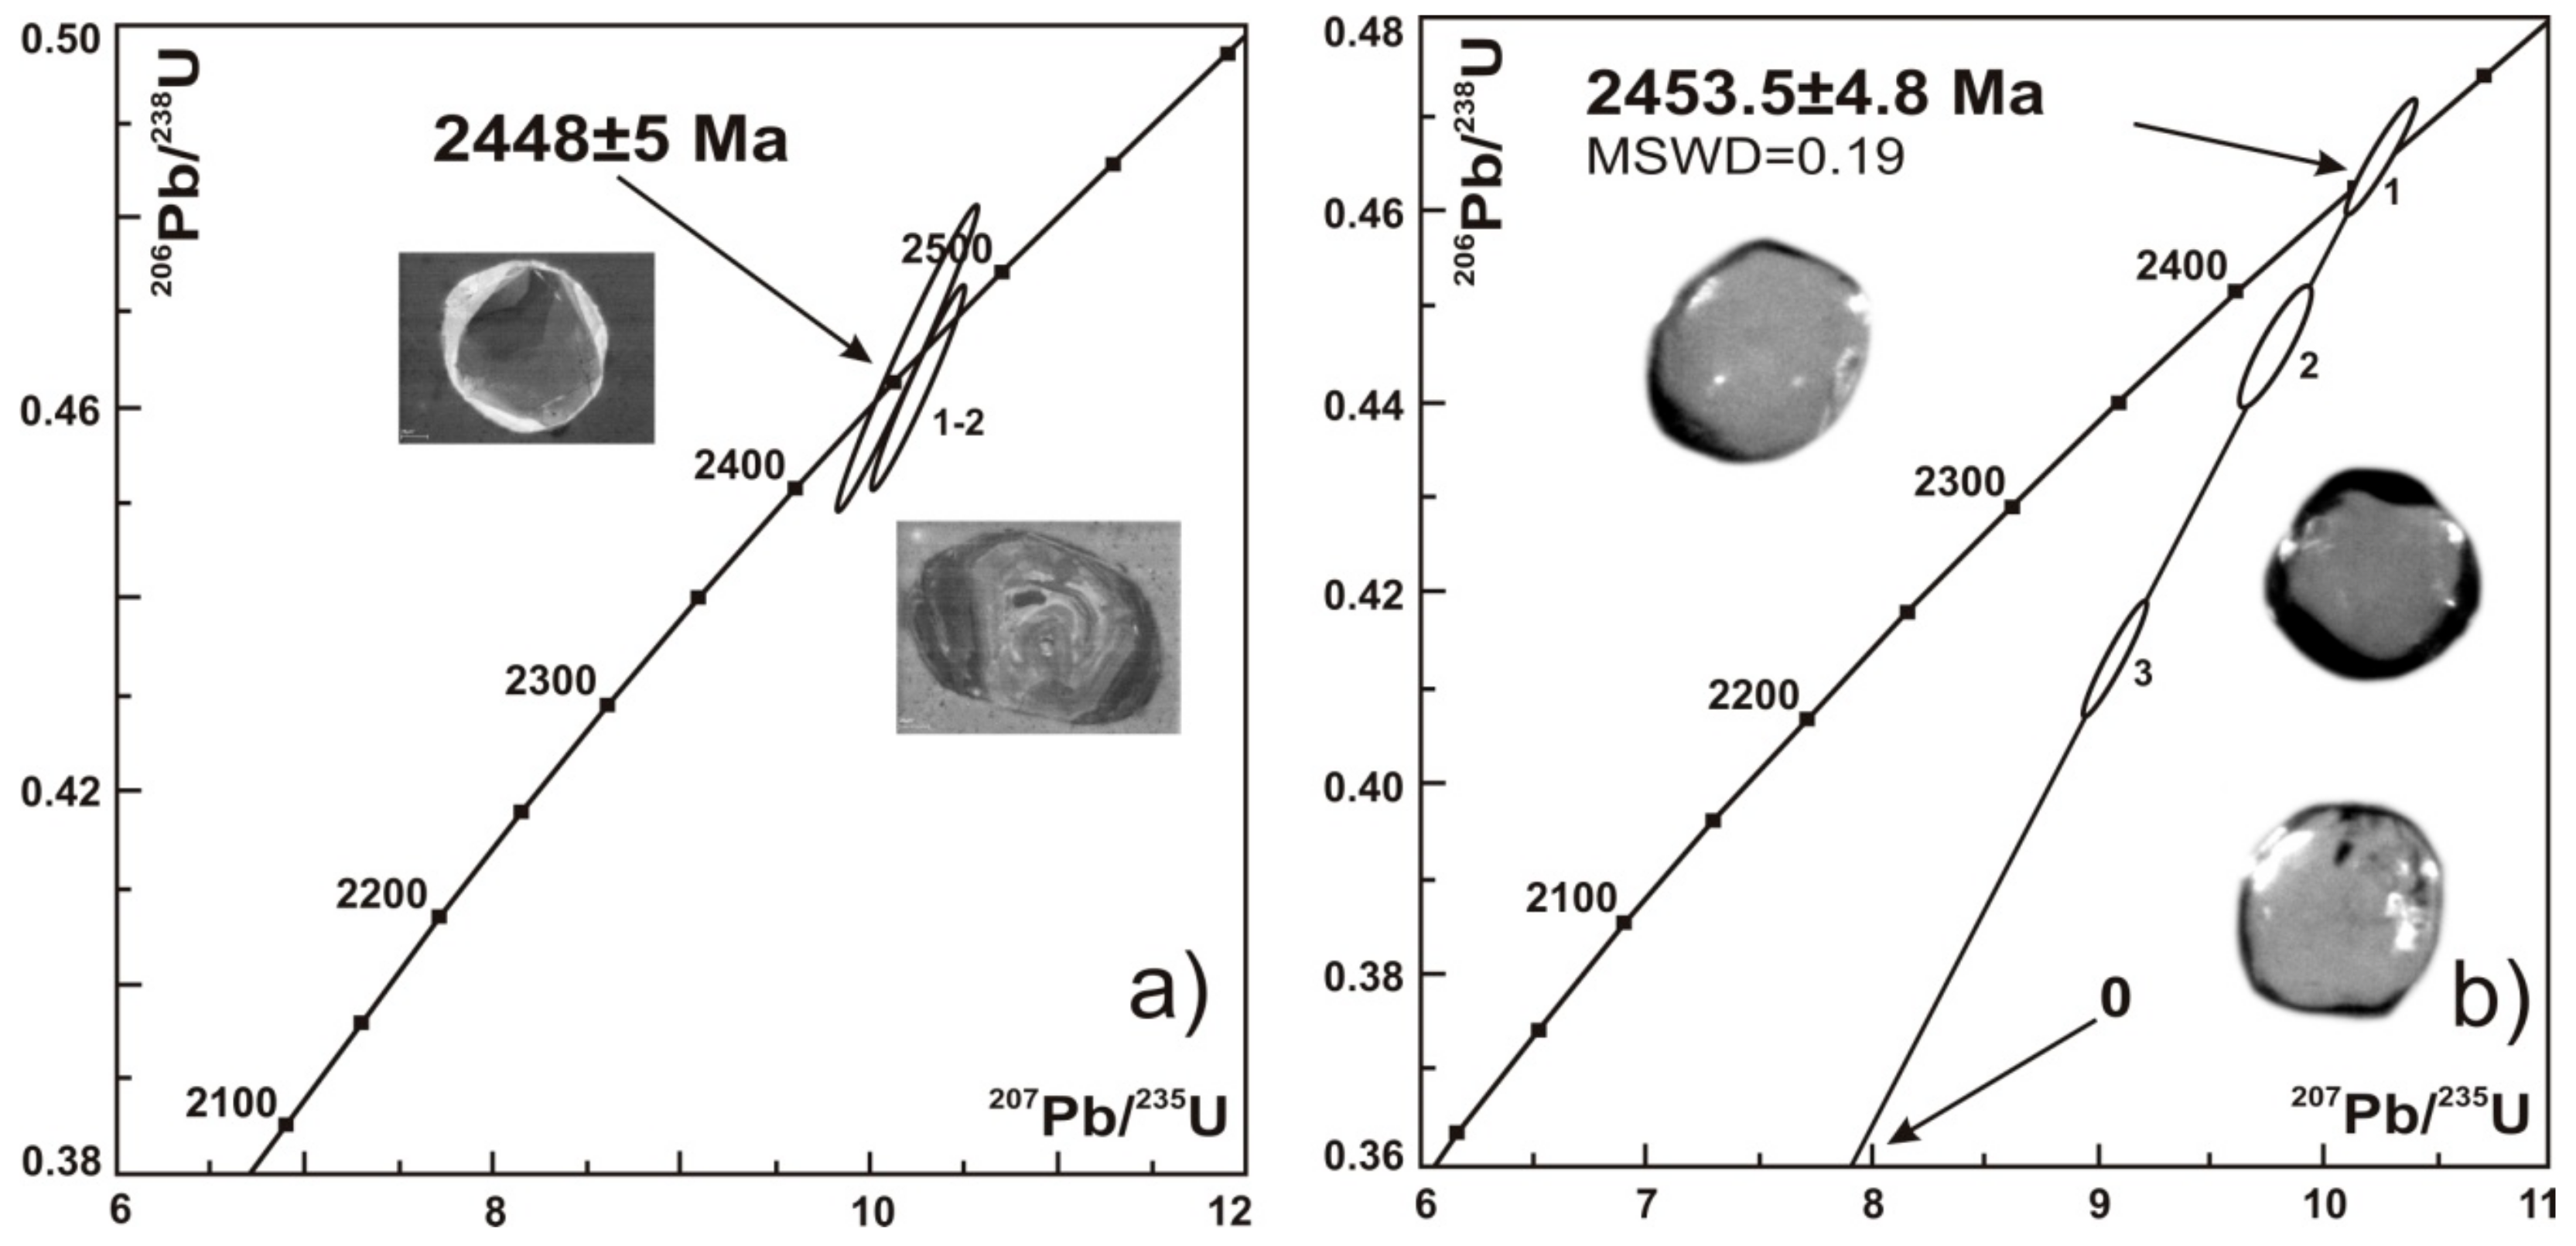
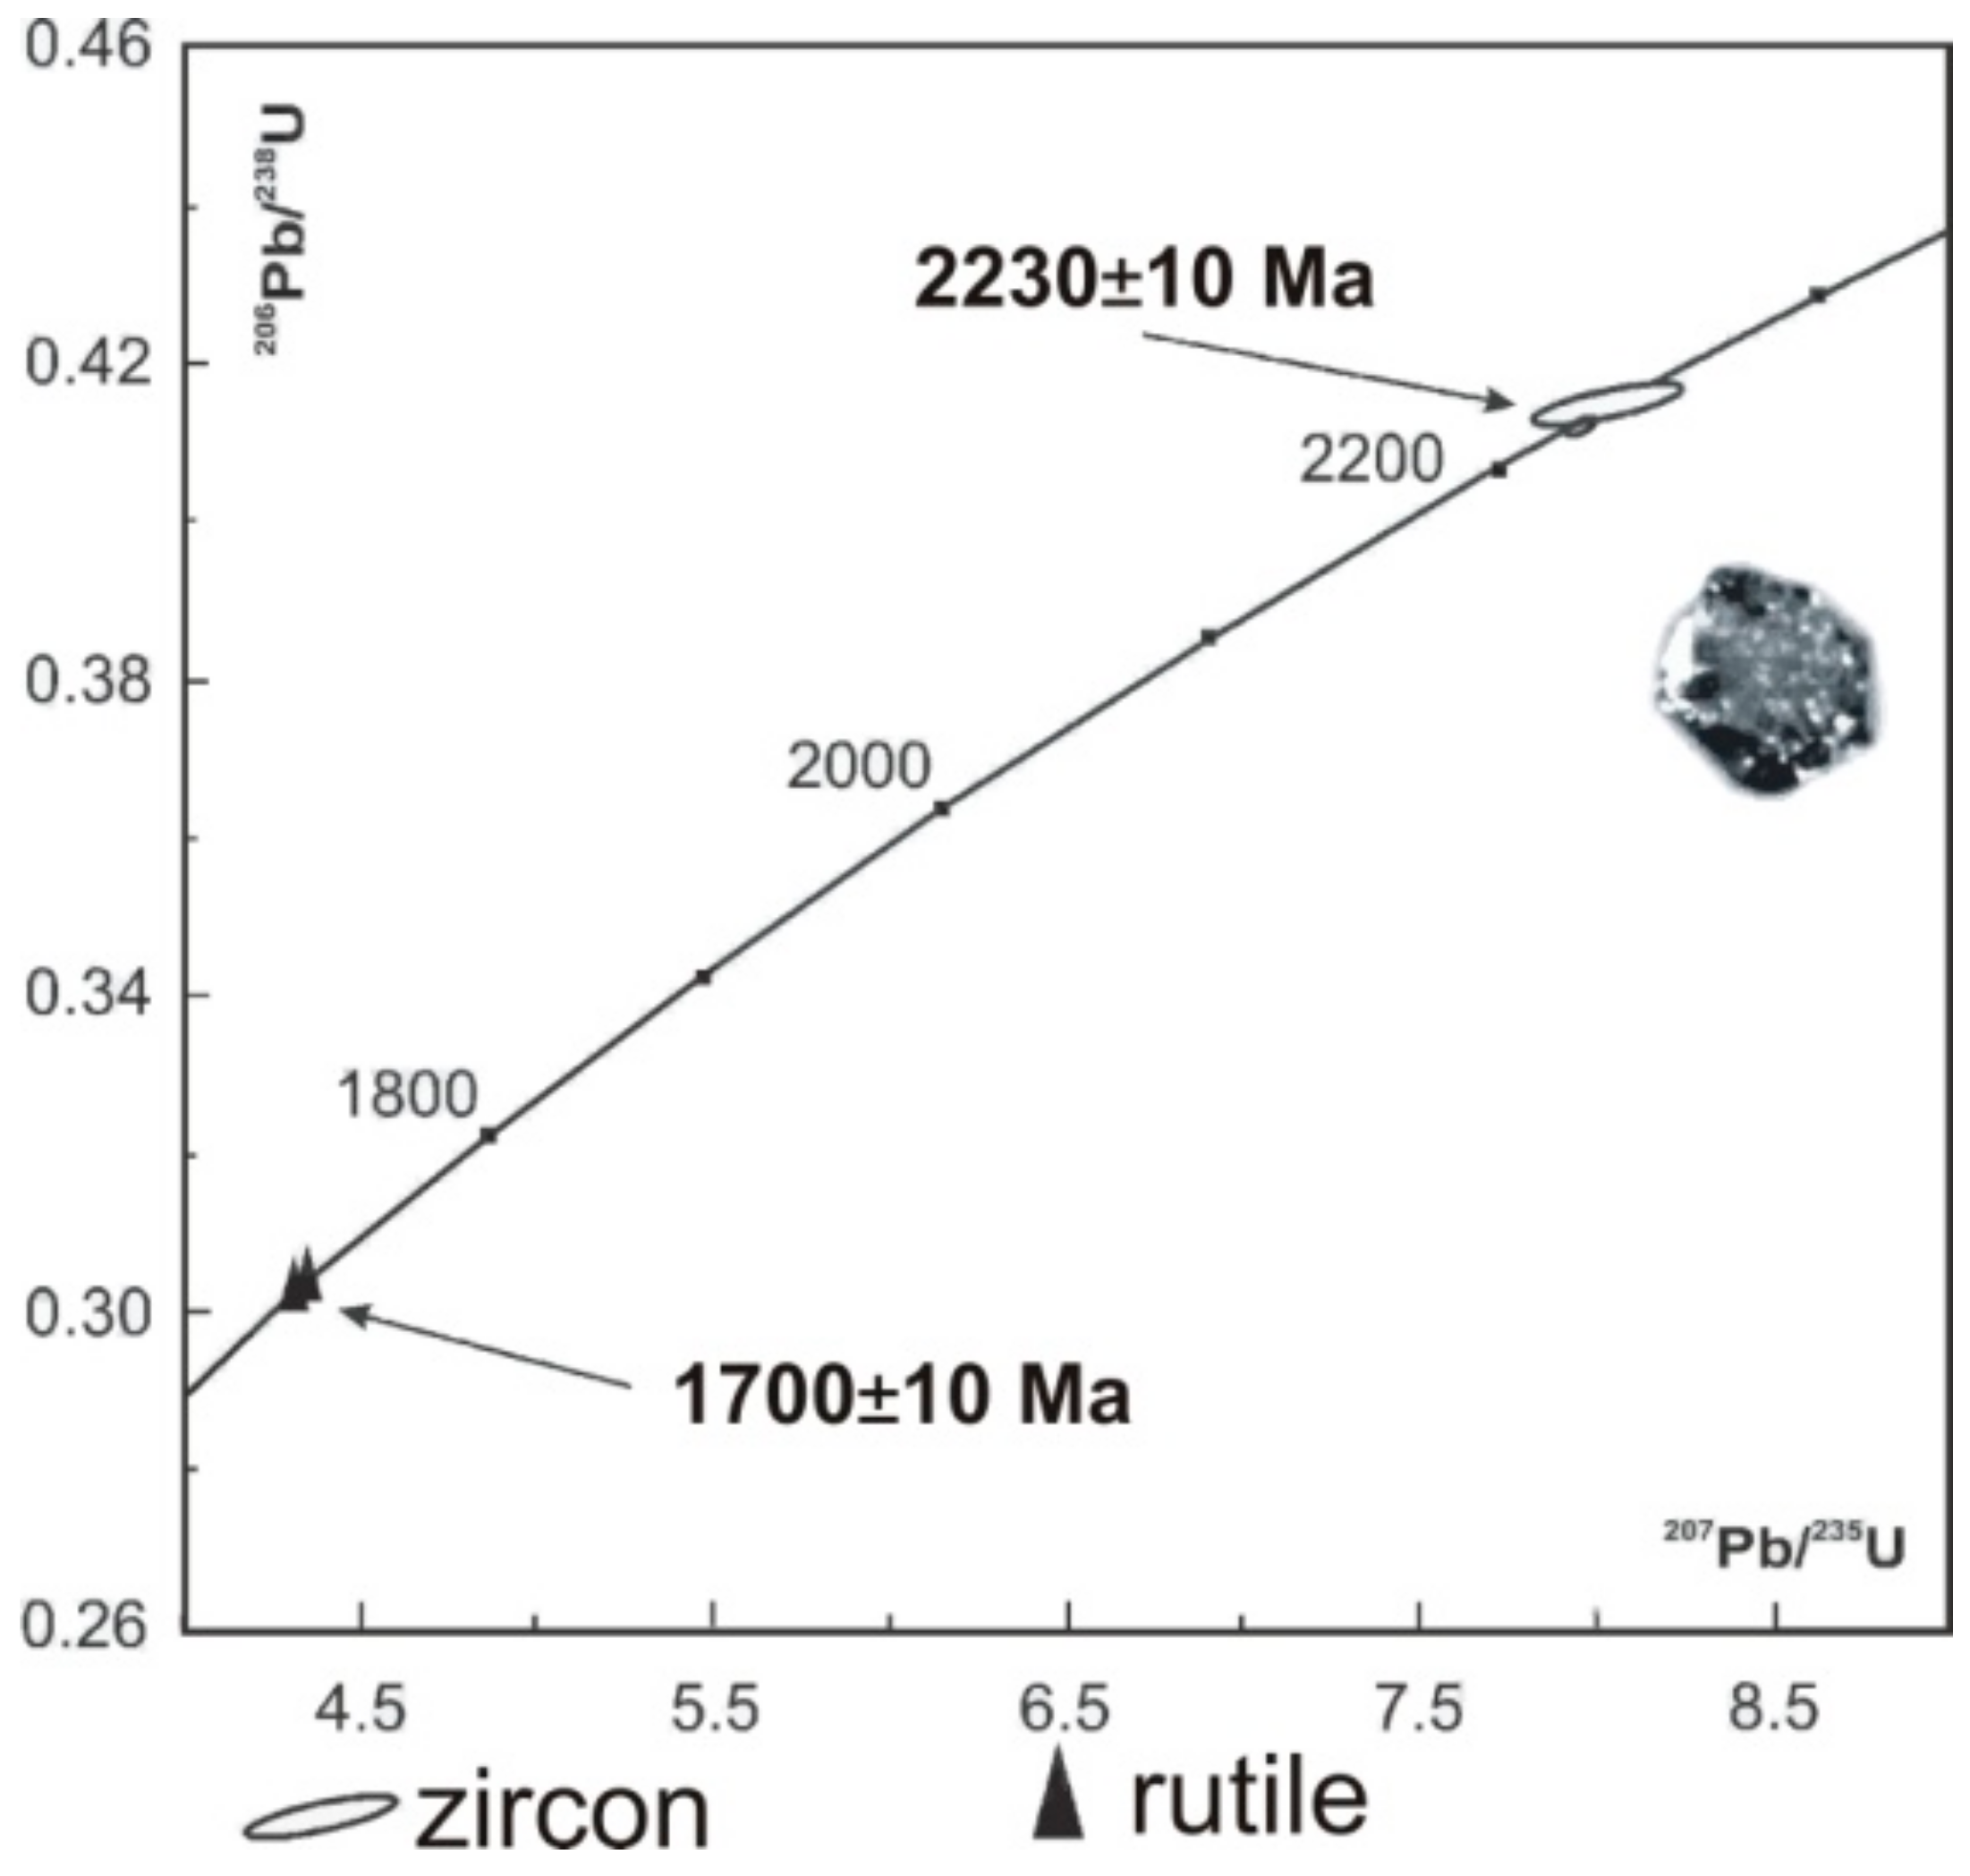
| Weighted Portion (mg) | Contents, ppm | Isotope Ratios * | Isotope Ratios and Age, Ma ** | % Dis. | ||||||
|---|---|---|---|---|---|---|---|---|---|---|
| Pb | U | 206Pb/204Pb | 206Pb/238U | 207Pb/235 U | 207Pb/206Pb | 206Pb/238U | 207Pb/235U | 207Pb/206Pb | ||
| Kolvitsa massif, metagabbro (sample 200), magmatic zircon | ||||||||||
| 0.0475 | 11.94 | 15.97 | 209.32 | 0.462 ± 0.008 | 10.274 ± 0.190 | 0.1613 ± 0.0006 | 2448 ± 44 | 2460 ± 46 | 2470 ± 8 | 0.9 |
| 0.0800 | 11.08 | 15.17 | 726.92 | 0.464 ± 0.018 | 10.225 ± 0.389 | 0.1644 ± 0.0011 | 2448 ± 93 | 2452 ± 93 | 2461 ± 17 | 0.5 |
| Kandalaksha massif, metagabbro (sample 183), magmatic zircon | ||||||||||
| 0.095 | 46.09 | 48.60 | 141.81 | 0.466 ± 0.006 | 10.281 ± 0.131 | 0.1583 ± 0.0005 | 2468 ± 30 | 2451 ± 31 | 2437 ± 8 | −1.3 |
| 0.200 | 33.34 | 24.40 | 82.01 | 0.446 ± 0.005 | 9.798 ± 0.139 | 0.1595 ± 0.0011 | 2375 ± 29 | 2416 ± 34 | 2451 ± 17 | 3.1 |
| 0.093 | 74.20 | 45.76 | 68.52 | 0.413 ± 0.005 | 9.087 ± 0.119 | 0.1596 ± 0.0006 | 2228 ± 27 | 2347 ± 31 | 2452 ± 10 | 9.1 |
| Kandalaksha massif, anorthosite (sample 225/1), zircon | ||||||||||
| 0.200 | 12.51 | 13.51 | 74.95 | 0.4151 ± 0.0002 | 8.048 ± 0.0016 | 0.1406 ± 0.0003 | 2238 ± 12 | 2236 ± 47 | 2235 ± 40 | −0.13 |
| 0.063 | 21.08 | 40.39 | 781.17 | 0.4121 ± 0.0002 | 7.968 ± 0.0024 | 0.1402 ± 0.0002 | 2224 ± 10 | 2227 ± 10 | 2230 ± 3 | 0.27 |
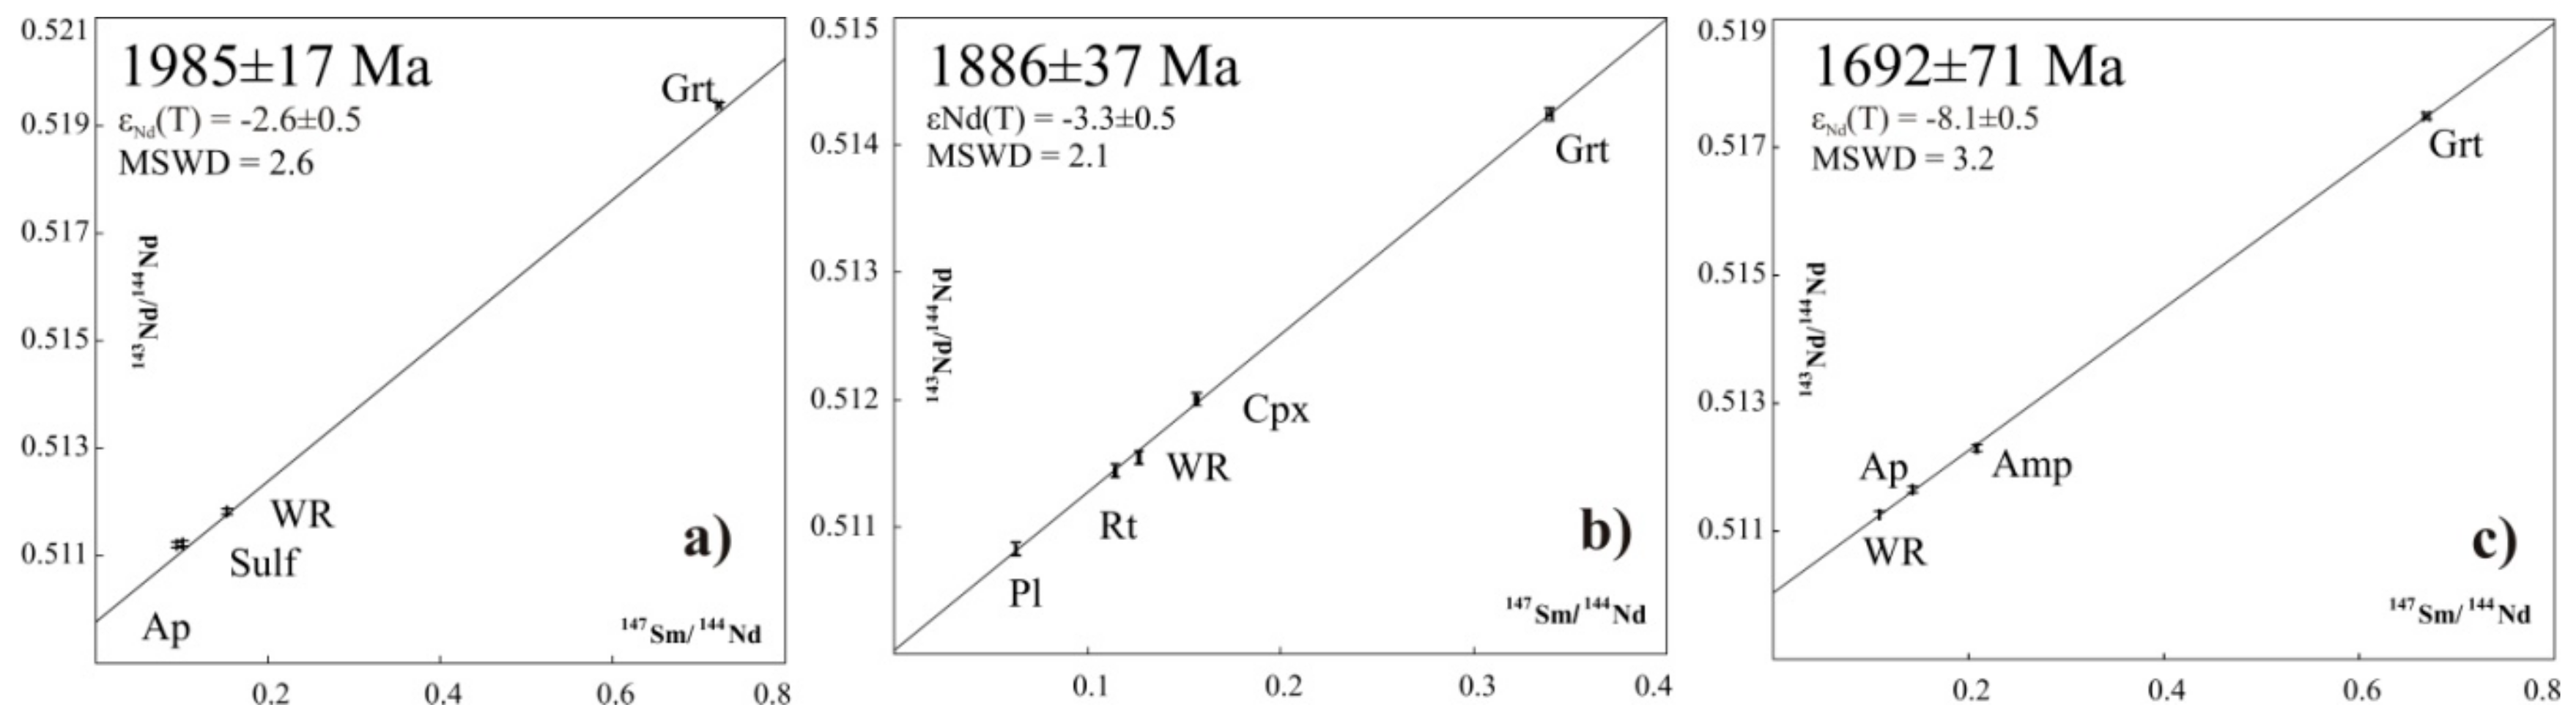
| Sample | Contents, mkg/g | Isotope Ratios | TDM, Ma | ||
|---|---|---|---|---|---|
| Sm | Nd | 147Sm/144Nd | 143Nd/144Nd | ||
| Sample 225/1, anorthosite, Kandalaksha massif | |||||
| 225/1 WR | 0.419 | 2.00 | 0.1265 | 0.511544 ± 8 | 2796 |
| 225/1 Pl | 0.181 | 1.743 | 0.0627 | 0.510823 ± 34 | |
| 225/1 Ru | 0.399 | 2.11 | 0.1143 | 0.511440 ± 24 | |
| 225/1 Cpx | 2.40 | 9.26 | 0.1564 | 0.512000 ± 7 | |
| 225/1 Gr | 0.513 | 0.915 | 0.3392 | 0.514235 ± 20 | |
| Sample 183, metagabbro, Kandalaksha massif | |||||
| 183 WR | 0.459 | 2.553 | 0.1087 | 0.511263 ± 31 | 2728 |
| 183 Ap | 20.1 | 85.2 | 0.1427 | 0.511653 ± 15 | |
| 183 Amf | 2.39 | 6.93 | 0.2084 | 0.512290 ± 8 | |
| 183 Gr-3 | 1.252 | 1.131 | 0.6689 | 0.517489 ± 17 | |
| Sample 200, metagabbro, Kolvitsa massif | |||||
| 200 WR | 0.845 | 3.35 | 0.1524 | 0.511823 ± 9 | 3300 |
| 200 Sulf | 0.068 | 0.435 | 0.0940 | 0.511204 ± 23 | |
| 200 Ap | 23.5 | 140.4 | 0.1011 | 0.511226 ± 12 | |
| 200 Gr | 0.660 | 0.552 | 0.7234 | 0.519387 ± 17 | |
| Contents, mkg/g | Isotope Ratios | T, Ma | ISr | Contents, mkg/g | Isotope Ratios | TDM, Ma | εNd(T) | Age, Ga | ||||
|---|---|---|---|---|---|---|---|---|---|---|---|---|
| Rb | Sr | 87Rb/86Sr | 87Sr/86Sr | Sm | Nd | 147Sm/144Nd | 143Nd/144Nd | |||||
| Sample 220/1, metanorite, Kandalaksha massif | ||||||||||||
| 16.49 | 259.0 | 0.1796 | 0.70744 ± 18 | 2100 | 0.7020 | 0.155 | 0.916 | 0.1025 | 0.511116 ± 31 | 2776 | −0.02 | |
| Sample 225/1, anorthosite, Kandalaksha massif | ||||||||||||
| 0.419 | 2.003 | 0.1265 | 0.511544 ± 8 | 2796 | −1.23 | 1.9 | ||||||
| Sample 183, metagabbro, Kandalaksha massif | ||||||||||||
| 7.37 | 367.3 | 0.0566 | 0.70426 ± 16 | 2453 | 0.7023 | 0.459 | 2.553 | 0.1087 | 0.511263 ± 31 | 2728 | −1.25 | 1.7 |
| Sample 185, metaperidotite, Kandalaksha massif | ||||||||||||
| 13.73 | 90.6 | 0.4277 | 0.71758 ± 17 | 2450 | 0.7024 | 1,407 | 6,489 | 0,131015 | 0,511532 ± 7 | 2969 | −0.95 | |
| Sample 200, metagabbro, Kolvitsa massif | ||||||||||||
| 6.59 | 249.6 | 0.0745 | 0.70516 ± 12 | 2448 | 0.7025 | 0.845 | 3.354 | 0.1524 | 0.511823 ± 9 | 3282 | −1.96 | 1.9 |
| Sample 205, subalkaline gneiss-granite, Kolvitsa massif | ||||||||||||
| 89.12 | 114.9 | 2.1884 | 0.78443 ± 18 | 2383 | 0.7091 | |||||||
| Sample 194/1, metagabbro, Kolvitsa massif | ||||||||||||
| 2.78 | 427.0 | 0.0184 | 0.70221 ± 15 | 2450 | 0.7016 | |||||||
| Sample 210, gneiss-plagiogranite, TTG-?, Kolvitsa massif | ||||||||||||
| 60.93 | 235.7 | 0.729350 | 0.72950 ± 19 | 2450 | 0.70193 | 2.007 | 10.835 | 0.111983 | 0.511192 ± 9 | 2920 | −1.59 | |
| Sample 276, garnet-plagioclase crystal schist, Kolvitsa massif | ||||||||||||
| 10.42 | 211.55 | 0.138969 | 0.70742 ± 14 | 6.891 | 20.935 | 0.198946 | 0.512396 ± 9 | −5.53 | ||||
© 2020 by the authors. Licensee MDPI, Basel, Switzerland. This article is an open access article distributed under the terms and conditions of the Creative Commons Attribution (CC BY) license (http://creativecommons.org/licenses/by/4.0/).
Share and Cite
Steshenko, E.N.; Bayanova, T.B.; Serov, P.A. The Paleoproterozoic Kandalaksha-Kolvitsa Gabbro-Anorthosite Complex (Fennoscandian Shield): New U–Pb, Sm–Nd, and Nd–Sr (ID-TIMS) Isotope Data on the Age of Formation, Metamorphism, and Geochemical Features of Zircon (LA-ICP-MS). Minerals 2020, 10, 254. https://doi.org/10.3390/min10030254
Steshenko EN, Bayanova TB, Serov PA. The Paleoproterozoic Kandalaksha-Kolvitsa Gabbro-Anorthosite Complex (Fennoscandian Shield): New U–Pb, Sm–Nd, and Nd–Sr (ID-TIMS) Isotope Data on the Age of Formation, Metamorphism, and Geochemical Features of Zircon (LA-ICP-MS). Minerals. 2020; 10(3):254. https://doi.org/10.3390/min10030254
Chicago/Turabian StyleSteshenko, Ekaterina N., Tamara B. Bayanova, and Pavel A. Serov. 2020. "The Paleoproterozoic Kandalaksha-Kolvitsa Gabbro-Anorthosite Complex (Fennoscandian Shield): New U–Pb, Sm–Nd, and Nd–Sr (ID-TIMS) Isotope Data on the Age of Formation, Metamorphism, and Geochemical Features of Zircon (LA-ICP-MS)" Minerals 10, no. 3: 254. https://doi.org/10.3390/min10030254
APA StyleSteshenko, E. N., Bayanova, T. B., & Serov, P. A. (2020). The Paleoproterozoic Kandalaksha-Kolvitsa Gabbro-Anorthosite Complex (Fennoscandian Shield): New U–Pb, Sm–Nd, and Nd–Sr (ID-TIMS) Isotope Data on the Age of Formation, Metamorphism, and Geochemical Features of Zircon (LA-ICP-MS). Minerals, 10(3), 254. https://doi.org/10.3390/min10030254