Article

Assessment of the Mode of Occurrence and Radiological Impact of Radionuclides in Nigerian Coal and Resultant Post-Combustion Coal Ash Using Scanning Electron Microscopy and Gamma-Ray Spectroscopy

by
Ilemona C. Okeme
1,*,
Thomas B. Scott
1,
Peter G. Martin
1,
Yukihiko Satou
2,
Theophilus I. Ojonimi
3 and
Moromoke O. Olaluwoye
4
1
Interface Analysis Centre, School of Physics, HH Wills Physics Laboratory, University of Bristol, Bristol BS8 1TL, UK
2
Collaborative Laboratories for Advanced Decommissioning Science, Japan Atomic Energy Agency, Tomioka-Machi, Futaba-gun, Fukushima 979-1151, Japan
3
Department of mining engineering, University of Jos, Jos 930222, Nigeria
4
Department of Physics, Adeyemi College of Education, Ondo 351101 Nigeria
*
Author to whom correspondence should be addressed.
Minerals 2020, 10(3), 241; https://doi.org/10.3390/min10030241
Submission received: 11 February 2020 / Revised: 4 March 2020 / Accepted: 5 March 2020 / Published: 7 March 2020

Abstract

:
Natural radionuclide concentrations in coal and coal ash can occur at levels sufficient to raise potential health and environmental concerns when (re)suspended or disposed into the environment. To evaluate such concerns, this study characterized coal and simulant coal ash samples obtained from two Nigerian coal mines (Okaba and Omelewu) using high resolution gamma spectroscopy combined with scanning electron microscopy and energy dispersive spectroscopy. Discrete uraninite particles were observed dispersed within the coal ash samples, alongside U and Th containing mineral grains (monazite and zircon) with monazite the most abundant radioactive mineral particles. The pitted and cracked surface morphologies of these radioactive particles (with sizes between 10 μm and 80 μm) indicate their susceptibility for disintegration into more harmful and readily inhalable PM2.5 aerosol particles, with the potential to deliver a localized dose and cause chronic respiratory diseases. The results of activity concentrations and radiological hazard indices for the coal ash samples from both mines were between three and five times higher than world average in soil, which imply that these coal ash materials should be suitably contained in slurry ponds to prevent hazards due to increased risk of prolonged indoor exposure to gamma radiation, radon gas, and inhalation of liberated radioactive particles.

1. Introduction

Naturally occurring radionuclide concentrations in coal and associated coal ash (made up of fly ash and bottom ash) can occur at levels well above typical background levels (albeit dependent upon the origin of the precursor coal), enough to raise potential human health and environmental impact concerns [1]. This can result from potential prolonged external and internal exposure to gamma and alpha radiation emitted by these radioactive and chemotoxic species (U, Th, Ra, and their associated decay products), where coal dust and coal ash are released into the environment in the form of associated soil amendment, emissions from mines and smoke stacks, direct disposal to landfills, discharges into rivers, and through their use as raw material in the construction of residential dwellings [1,2].
The mode of occurrence, distribution, and concentration of radionuclides in coal vary significantly across regions and coal fields due to several factors including geologic conditions of a coal basin, organic matter, type of source rocks/intra-seam non-coal partings, and influence of marine water and hydrothermal fluids [3,4]. This resultantly determines the degree of concentration of these radionuclides in the associated coal-derived ash. Fly ash with particle sizes in the range of 2 µm to 150 µm, the major inorganic by-product produced at 1200–1700 °C during the combustion of pulverized coal, contain elevated levels of technologically enhanced naturally radioactive materials (TENORM), compared to the feed coal, as a result of (i) the elimination of carbon during combustion and (ii) the radionuclide bearing minerals (uraninite, monazite, xenotime, and zircon) possessing volatilization temperatures considerably greater than that in which the coal is burnt, within such species hence partitioned into the coal ash [1]. One study has previously shown that radionuclide concentrations in coal are strongly coal rank dependent, with the concentration highest in low rank deposits such as lignite and sub-bituminous coals [1]. Additional studies have also shown that typical NORM concentrations in coal ash range from 3 to 10 times the concentrations in the precursor coal [1,5,6].
The NORM commonly found in coal consists of primordial 238U and 232Th alongside their decay products, in addition to a component of 40K [1]. This, in addition U and Th minerals of detrital origin, is a consequence of coal measures, when deeply buried under layers of other strata serving as “traps” for circulating hydrothermal fluids [3,7]. To capture the fate, transport and health risks associated with these radionuclides (which are functions of their mode of occurrence, particle size, and morphology [8]), there exists the need to complement these techniques (such as bulk inductively coupled plasma mass spectrometry (ICP–MS), and gamma-ray spectroscopy) with microanalytical techniques such as scanning electron microscopy (SEM) combined with energy dispersive spectroscopy (EDS). Such sub-microns SEM–EDS provides valuable information on particulate mineral phases, particle sizes, and morphology with spatial resolution; however, existing studies complementing the traditional bulk characterization techniques with SEM–EDS are wholly inadequate [7].
To address the absence of a stable power supply in the country, the Nigerian Government has reached an advanced stage in plans to construct coal-fired power plants [9]. These plants, with the consequential increase in coal mining that will result, is in addition to the significant volume of coal that is already mined for coal briquette production, and for use as furnace fuel during cement production [10,11]. There is no known existing radioactivity data on coal-derived ash and the precursor coal from Okaba and Omelewu mines. It is yet to be fully understood if these activities will exert on Nigerians serious health risks such as chronic respiratory diseases and exposure to radionuclides, internally and externally. Therefore, there is the need to determine the occurrence, distribution, activity concentration, and associated health risks of these radionuclides in coal and its resultant ash to assess whether they are within internationally recognized average values or represent potential hazards to the Nigerian population.
In this work, Nigerian coal and simulated coal ash samples from two coal mines were assessed to determine the occurrence, distribution, activity concentration and radiological hazard indices for the radionuclides 226Ra and 228Ra (in U and Th decay series, respectively) and 40K, using combined SEM–EDS and gamma-ray spectroscopy. Coal samples from Okaba and Omelewu coal mines were studied in this work as these coal mines have been earmarked as the coal source mines for the proposed coal plants when completed. Results from this work serve to provide crucial baseline data generally useful for the Nigerian Government, wider scientific community, and safety legislation.

2. Materials and Methods

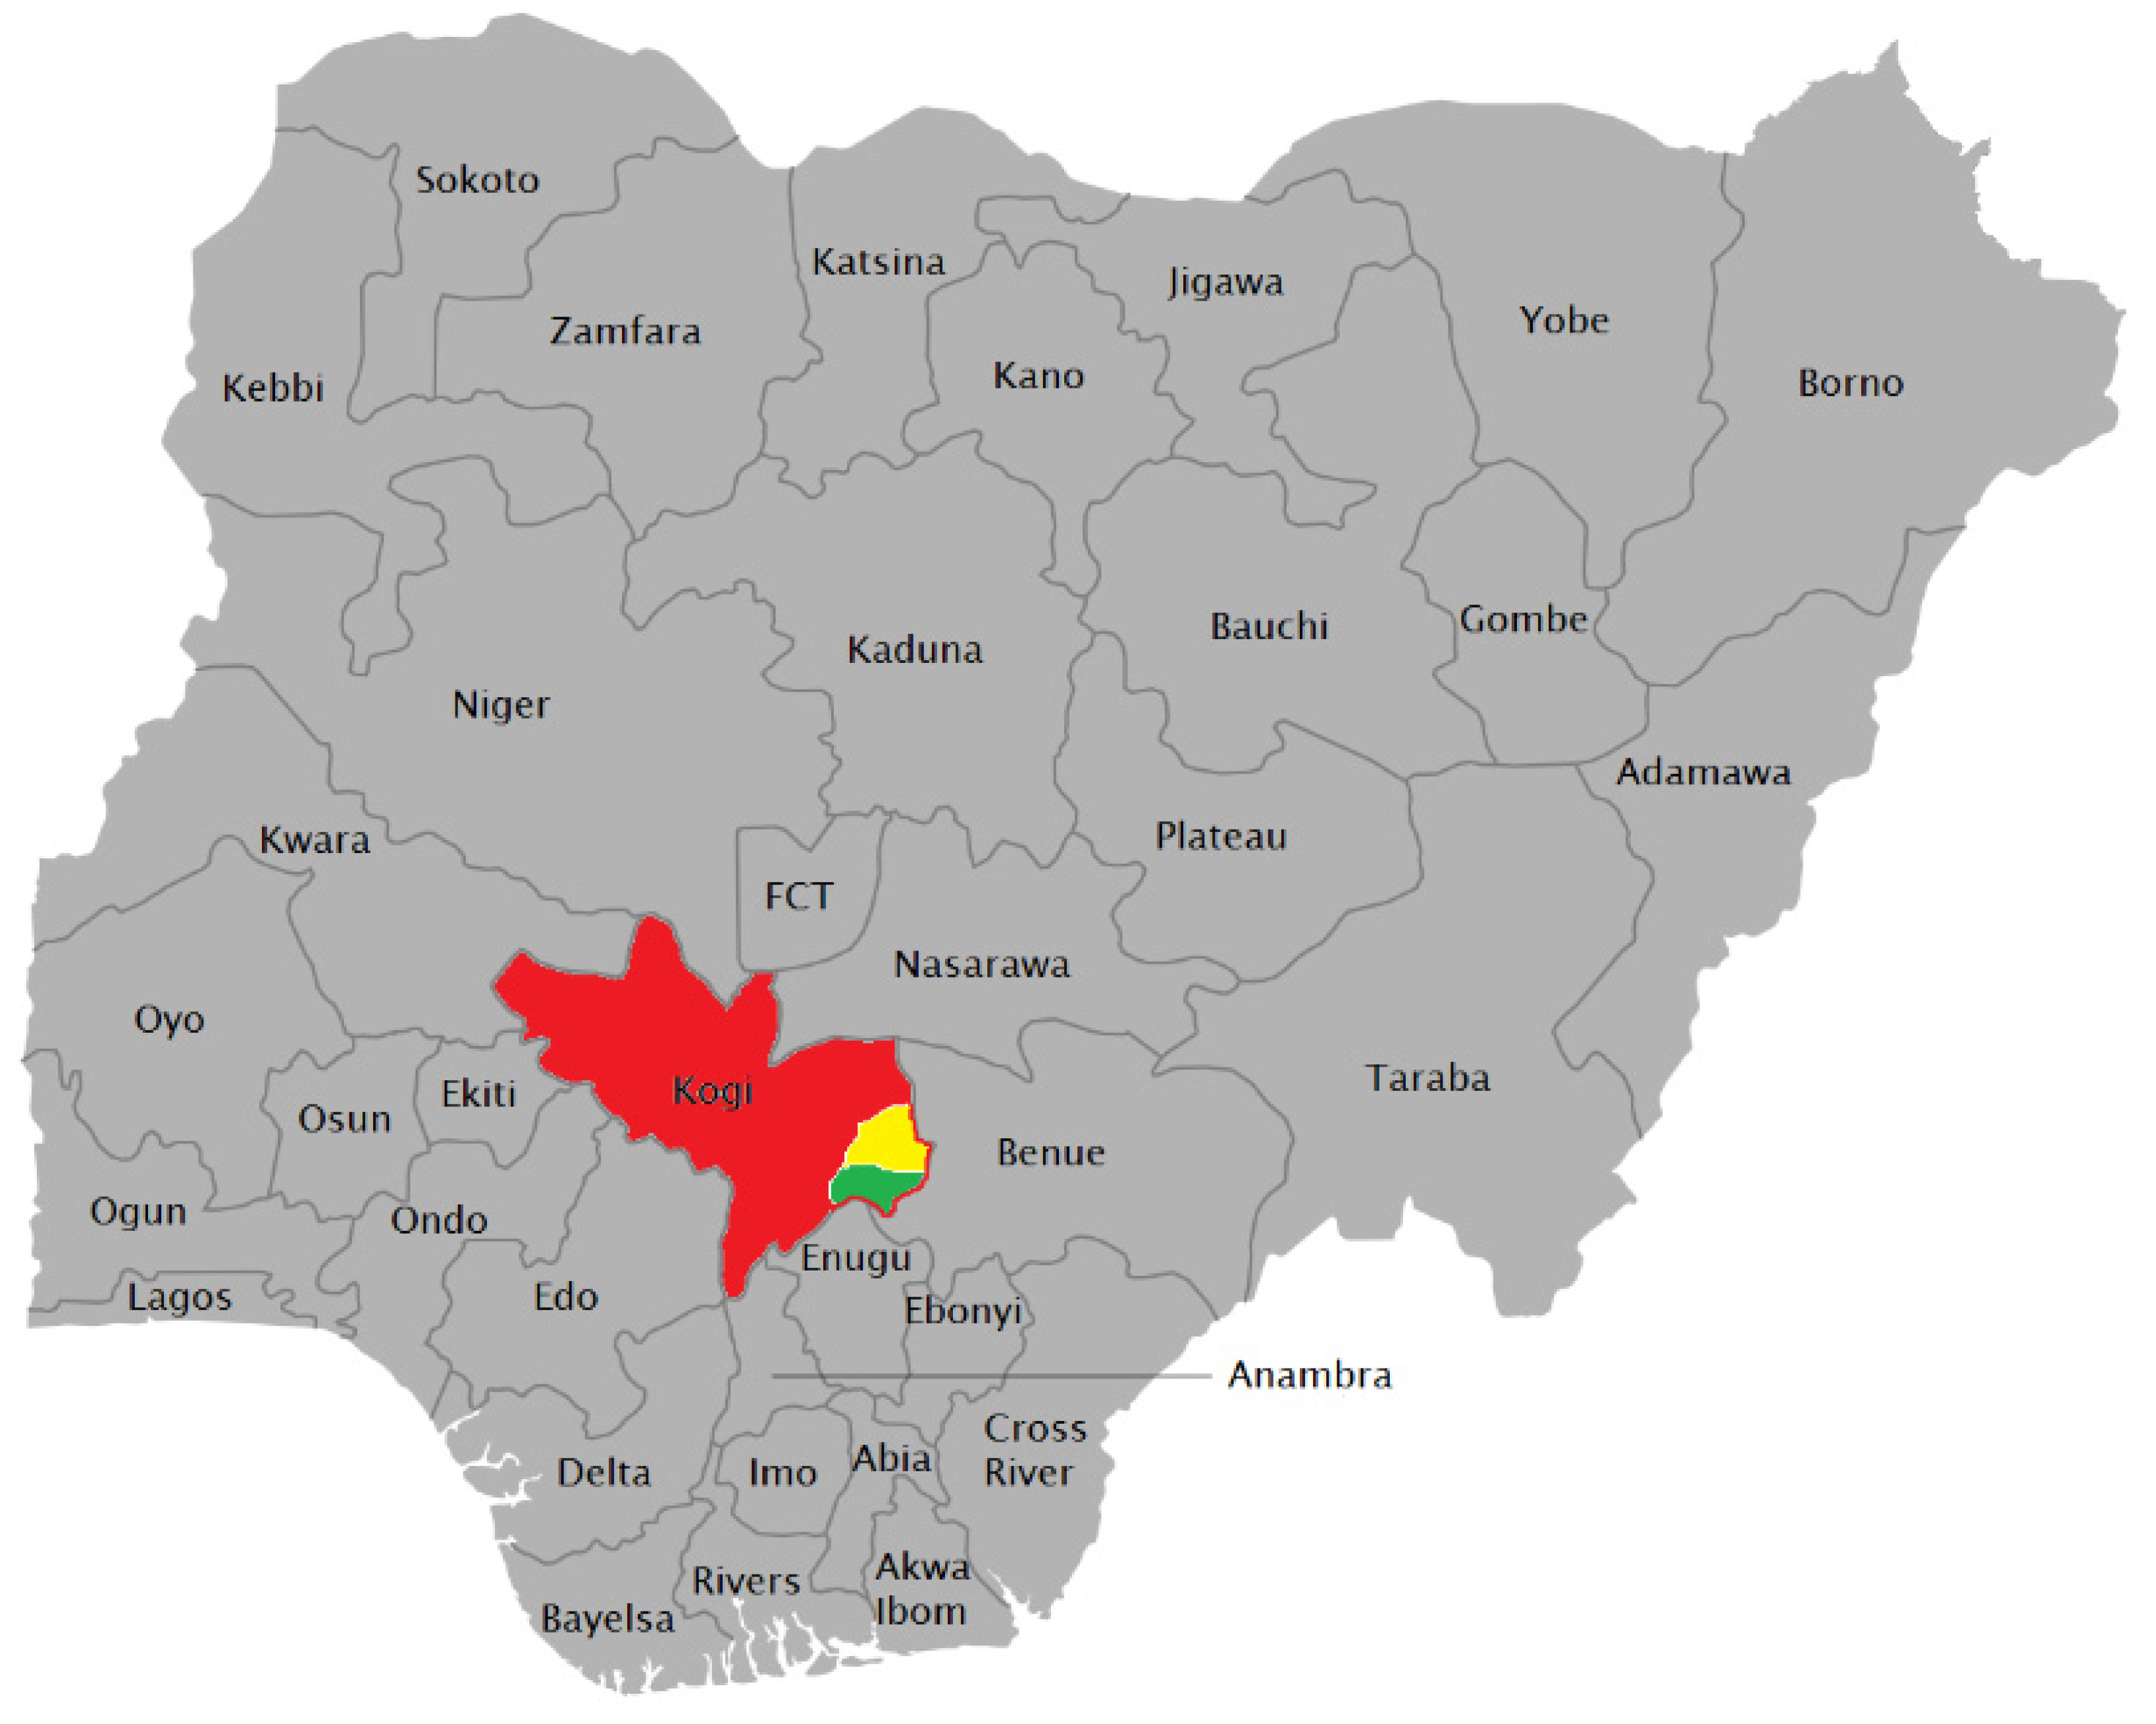
2.1. Samples and Samples Collection

The study examines material sourced from two open-pit coal mines located in Kogi state, Nigeria, as shown in Figure 1. One mine, the Okaba coal mine, is located in Okaba town within the Ankpa Local Government Area (LGA), and the second Omelewu coal mine is located in Imane within the Olamaboro LGA. Though located in neighboring LGAs, these coal mines are over 100 km apart. These coal mines host sub-bituminous coal and belong to the Kogi mining district, comprising an area of 225,000 hectare [12]. Further information on the coal from these mines (such as proximate and ash analysis) and the geologic setting can be found in [12,13,14].
Fifteen coal samples were collected from each coal mine using a stratified random sampling methodology to ensure that samples collected were representative of the full variability within the mine. The raw samples (each approximately 1000 g) were packed in polythene bags and transported to the UK for analysis.

2.2. Simulant Preparation

The samples were crushed using a mortar and pestle and oven-dried at 100 °C for 30 min in order to remove any moisture. The material was then pulverized and homogenized before being passed through a 150 μm wire mesh sieve (to simulate the coal ash particles size range). To simulate coal ash within the laboratory, sub-samples of each coal sample (between 300 g and 400 g) were combusted using a muffle furnace at a temperature of 1100 °C while completely burning off the organic matter content. This selection of combustion temperature (1100 °C) approximated the temperature used in coal-fired power plants burning low rank coal such as sub-bituminous coal [16]. The implication of burning low rank coal at a low temperature is that it is more likely for U and Th to exist as discrete particles rather than being encapsulated in the glassy component of ash, since the melting temperatures of glass-forming aluminosilicate minerals are higher than this combustion temperature. Sieve analysis revealed that about 80% of these coal ash materials fell in the particle size range of 1 to 300 µm, which translated to 80% fly ash and 20% bottom ash.

2.3. High Resolution Gamma-Ray Spectroscopy

A total of 30 samples (15 coal samples and 15 coal ash samples) per coal mine were prepared for gamma-ray spectrometric analysis using a high resolution P-type coaxial ORTEC, GEM-13180 high purity germanium (HPGe) detector (10% relative efficiency, 1.71 keV resolution at 1.33 MeV Co-60, ORTEC, Oak Ridge, TN, USA). The detector was energy calibrated using a high specific activity multi-nuclide point-source (model 7603, Eckert and ZieglerTM [17]) with gamma-ray emission lines spanning the full range of the radionuclides of interest (40 keV to 1836 keV). Efficiency calibration was performed using IAEA certified reference material (IAEA-385, sea sediment) as a calibration standard. A pair of IAEA-385 reference material was repackaged and sealed in Marinelli beakers and petri-style dishes (the same geometry as the samples) and kept for 30 days for secular equilibrium to be re-established. Decay corrections were also made during efficiency calibration. The suitability of IAEA-385 as reference material for efficiency calibration was based on a 90% match in its matrix and the matrix of the experimental samples following a prior laboratory based X-ray fluorescence (XRF) analysis. To ensure secular equilibrium was attained between decay products of 226Ra and 228Ra in the samples prior to analyses, 200 g of coal in snap-on lid re-usable re-entrant mini Marinelli beakers (from Ga-ma and associates Inc., Ocala, FL, USA [18]), and 40 g of coal ash in petri-style dishes were kept for 30 days [1,19]. The beakers and petri-style dishes were made airtight by sealing using PVC tape to prevent the escape of gaseous 222Rn and 220Rn from the samples, thereby maintaining secular equilibrium [19]. For large volume samples, re-usable re-entrant mini Marinelli beakers give greater geometric detection efficiencies by positioning greater amounts of sample volume as close to the detector as possible [20]. Once secular equilibrium was attained, each sample was counted for twenty-four hours to minimize the statistical counting error, with the specific activity calculated from the background corrected photopeak intensity. To reduce the background contribution to photo peak intensity, the detector was shielded in a 10 cm wall lead covering lined with 2 mm copper and cadmium foils.

Activity Concentration Determination

To determine the activity concentration of both U and Th via their strong gamma-emitting decay products (226Ra, 228Ra, and 228Th) and also that of 40K, the following equation [21] was used:
Specific   activity :   A   ( Bqkg 1 ) = N ε . M . T . Υ
where N is the background corrected net count, ε is the radionuclide photo peak efficiency, M is mass of the sample in kg, T is counting time in seconds, and γ is gamma yield of the radionuclide.
The activity concentration of 226Ra was determined by averaging the activity concentrations of its decay products 214Pb (352 keV) and 214Bi (609 keV) that occurred in secular equilibrium. Similarly, the activity concentrations of 228Ra and 228Th were determined from their decay products 228Ac (911 keV) and 208Tl (583 keV), respectively. 232Th was determined from the average value of 228Ra and 228Th activity concentration. The 40K activity was determined using its characteristic gamma emission energy of 1461 keV [21]. The gamma yield value for each radionuclide was obtained from NuDat 2.7 (National Nuclear Data Center, Brookhaven National Laboratory, Upton, NY, USA) [22].

2.4. Radiological Hazard Indices

To determine the radiological hazard associated with coal and disposal of large volumes of coal ash into the environment (in the form of direct disposal to landfills and mine land reclamation), the exposure to radiation arising from radionuclides present in the studied samples was determined in terms of several different but related dose indices. All radiation doses were calculated using dose conversion coefficients and occupancy factors provided by the United Nations Committee on the Effects of Atomic Radiation, UNSCEAR 2000 [23].

2.4.1. Radium Equivalent

Resulting from the nonuniform distribution of the radionuclides in each sample, to represent total activity due to all the radionuclides (40K, 226Ra, and 232Th) in a sample by a single value, a common index termed the radium equivalent (Raeq) was used [24]. The Raeq activity is a widely used radiation hazard index employed to estimate the suitability of any material to be utilized as a component within building construction based on the total activity concentration of the radionuclides, and the possible external exposure risks to inhabitants of such buildings [24]. To calculate radium equivalent, the following equation [25] was used:
Raeq (Bqkg−1) = ARa + 1.43ATh + 0.077AK
where ARa, ATh, and AK are the activity concentrations of 226Ra, 232Th, and 40K, respectively. This estimates that 370 Bqkg−1 of 226Ra, 259 Bqkg−1 of 232Th, and 4810 Bqkg−1 of 40K equate to the same gamma-ray dose rate [25].

2.4.2. Absorbed Dose

To calculate the amount of ionizing energy deposited in an exposed person per unit mass at one meter above the ground surface (termed the absorbed dose, D), the following equation was used:
D (nGyh−1) = (0.462ARa + 0.604ATh + 0.0417AK)
where ARa, ATh, and AK are the activity concentrations of 226Ra, 232Th, and 40K, respectively. The dose coefficients of ARa, ATh, and AK in Equation (3) (in units of nGyh−1 per Bqkg−1) were obtained from [23].

2.4.3. Annual Effective Dose Equivalent

The severity of any radiological hazard is estimated based on the annual radiation dose received by a person working or living in the radiation environment. The outdoor annual effective dose depends upon the conversion coefficient from the absorbed dose in air to the effective dose, alongside outdoor occupancy factors. To calculate the biological impact of such exposure, the absorbed dose (D) is converted to an annual effective dose equivalent (AEDE) using the following equation [24]:
AEDE (µSvy–1) = D(nGyh−1) × 8760 h × 0.2 × 0.7 (SvGy−1) × 10−3
where D is the absorbed dose calculated using Equation (3), 0.7 SvGy−1 is the dose conversion coefficient from absorbed dose to effective dose, and 0.2 is the outdoor occupancy factor.

2.5. Electron Microscopy Analysis

For analysis using the electron microscope (imaging and compositional), coal and simulant coal ash samples were prepared by depositing a fine layer of the powdered material onto a 12 mm low elemental background adhesive carbon (Leit) disc mounted onto a standard SEM pin-stub. The samples were then examined using a Zeiss SIGMA™ (Zeiss, Carl-Zeiss, Oberkochen, Germany) field emission SEM fitted with secondary electron (Everhart Thornley SE2) and backscattered electron (AsB) detectors, using the instrument’s variable pressure (VP) mode to negate against the requirement for a conductive coating while preventing surface (sample) charging. Using the tuned backscattered electron detector, radioactive particles containing high atomic (Z) number uranium and thorium appeared as bright (white) spots against the background sample/mount. To determine the composition, and subsequently the weight percent (wt. %) elemental composition of such particles, the current and operating voltage were increased and an EDAXTM Octane Plus energy dispersive spectroscopy (EDS) system using a Peltier cooled Silicon Drift Detector (SDD), EDAX, Mahwah, NJ, USA) mounted onto the SEM was used. A consistent voltage of 30 kV, aperture of 120 μm, and 200 s acquisition (in high current mode) was used to analyze each sample, with data analysis undertaken using the associated EDAX TEAM™ software (V6.39, EDAX, Mahwah, NJ, USA).

3. Results and Discussion

3.1. Gamma Spectroscopy

3.1.1. Activity Concentration

Results of activity concentration analysis for 40K, 232Th, 228Ra, and 226Ra in native coal samples from Omelewu and Okaba mines are shown in Table 1 and Table 2, respectively. The mean activity concentration of 40K, 232Th, and 226Ra in Okaba coal samples were 122.96 Bqkg−1, 18.43 Bqkg−1, and 16.19 Bqkg−1, respectively. Conversely, the mean activity concentration of 40K, 232Th, and 226Ra in Omelewu coal samples were 79.32 Bqkg−1, 41.76 Bqkg−1, and 42.51 Bqkg−1, respectively. Compared with the adopted world average concentrations in soil (400 Bqkg−1, 35 Bqkg–1, and 30 Bqkg−1 for 40K, 232Th, and 226Ra, respectively) shown in Table 1 and Table 2, the mean activity concentration values in Okaba coal samples were two to three times lower than the world average concentrations [23], and the mean values of 232Th and 226Ra in Omelewu coal samples were marginally higher than the adopted world average in soil. These results of activity concentration imply a uniform distribution of 232Th, 228Ra, and 226Ra and a significantly nonuniform distribution of 40K in the coal samples from both mines. These values of activity concentration in the coal samples represent a low contribution to natural background radiation and are comparable to similar studies in China, India, Serbia, and Turkey [26,27,28,29].
In both the Okaba and Omelewu simulant coal ash samples, the results of activity concentration of 40K, 232Th, 228Ra, and 226Ra are shown in Table 3 and Table 4, respectively. The mean values of activity concentration of 40K, 232Th, 228Ra, and 226Ra in Okaba coal ash were 995.65 Bqkg−1, 153.28 Bqkg−1, 138.41 Bqkg−1, and 153.44 Bqkg−1, respectively. For Omelewu coal ash, the mean values of activity concentration of 40K, 232Th, 228Ra, and 226Ra were 312.96 Bqkg−1, 131.92 Bqkg−1, 121.25 Bqkg−1, and 240.89 Bqkg−1, respectively. The mean activity concentration of 40K, 232Th, and 228Ra in Okaba coal ash were higher than the UNSCEAR 1988 world fly ash average [30], with 226Ra about two times less than the average. In Omelewu coal ash, the activity concentration of 40K, 232Th, and 228Ra were also higher than the UNSCEAR 1988 average in fly ash, with the 226Ra concentration equal to the world average. These results of activity concentration in the coal samples from both mines imply a uniform distribution of 232Th, 228Ra, and 226Ra and a largely nonuniform distribution of 40K.
Compared with the UNSCEAR 2000 average values in soil, the mean activity concentration of 232Th, 228Ra, and 226Ra in Okaba coal ash samples were five times higher. 226Ra, 232Th, and 228Ra were observed to have been concentrated in Okaba coal ash relative to the precursor coal by a factor of 9 to 10. A mean total radium value of 291.86 Bqkg−1 recorded for Okaba coal ash (Table 3), represents a nine-fold concentration relative to a mean total radium of 33.69 Bqkg−1 in the precursor coal (Table 1). In Omelewu simulant coal ash samples, the mean activity concentration of 226Ra and 232Th were seven and four times higher, respectively, than the UNSCEAR 2000 average values in soil. Both 232Th and 226Ra were observed to be concentrated in the combustion-derived coal ash by a factor of three and six, respectively.
Using the mean values, the enrichment of 226Ra and 228Ra in Okaba coal ash compared to Omelewu coal ash was higher by a factor of two, which invokes higher association of 226Ra and 228Ra in Okaba precursor coal with organic matter than in Omelewu precursor coal, and 226Ra and 228Ra were released into the ash as a consequence of the combustion process. This is supported by the lower percentage ash content of Okaba coal [13,14]. Similarly, compared to 228Ra, 226Ra was found to be more preconcentrated in the coal ash samples from both mines and consequently, a difference of 1.25 to 1.5 in the enrichment factors across ash samples from both mines. This difference also implies a higher organic association of both 226Ra and 228Ra in Okaba coal. A mean total radium value of 362.14 Bqkg−1 recorded for Omelewu coal ash (Table 4), represents an approximate five-fold increase in mean total radium relative to a mean total radium of 77.64 Bqkg−1 in the precursor coal (Table 2).
These values for activity concentration in the coal ash samples imply that the Okaba and Omelewu coal ash material is enriched in 226Ra, 228Ra, and 228Th, contributing significantly to the natural background radiation. Elevated values of total radium activity concentration in Okaba and Omelewu coal ash samples (with average of 291.86 Bqkg−1 and 362.14 Bqkg−1, respectively) suggests potentially high radon release rates from buildings constructed using such coal ash material, which consequently represents a serious health hazard for occupants of such buildings due to exposure to gamma radiation from radium, alongside radon inhalation [31]. These activity concentration results (of U and Th progenies) for Okaba and Omelewu experimental coal ash samples are also comparable to coal ash samples from the Appalachian, Illinois, and Powder River basin coal mines (USA) and coal mines in Xijiang, Guangxi, and Sichuan provinces in China, which are known to be highly radioactive [3,19].

3.1.2. Radiological Hazard Indices
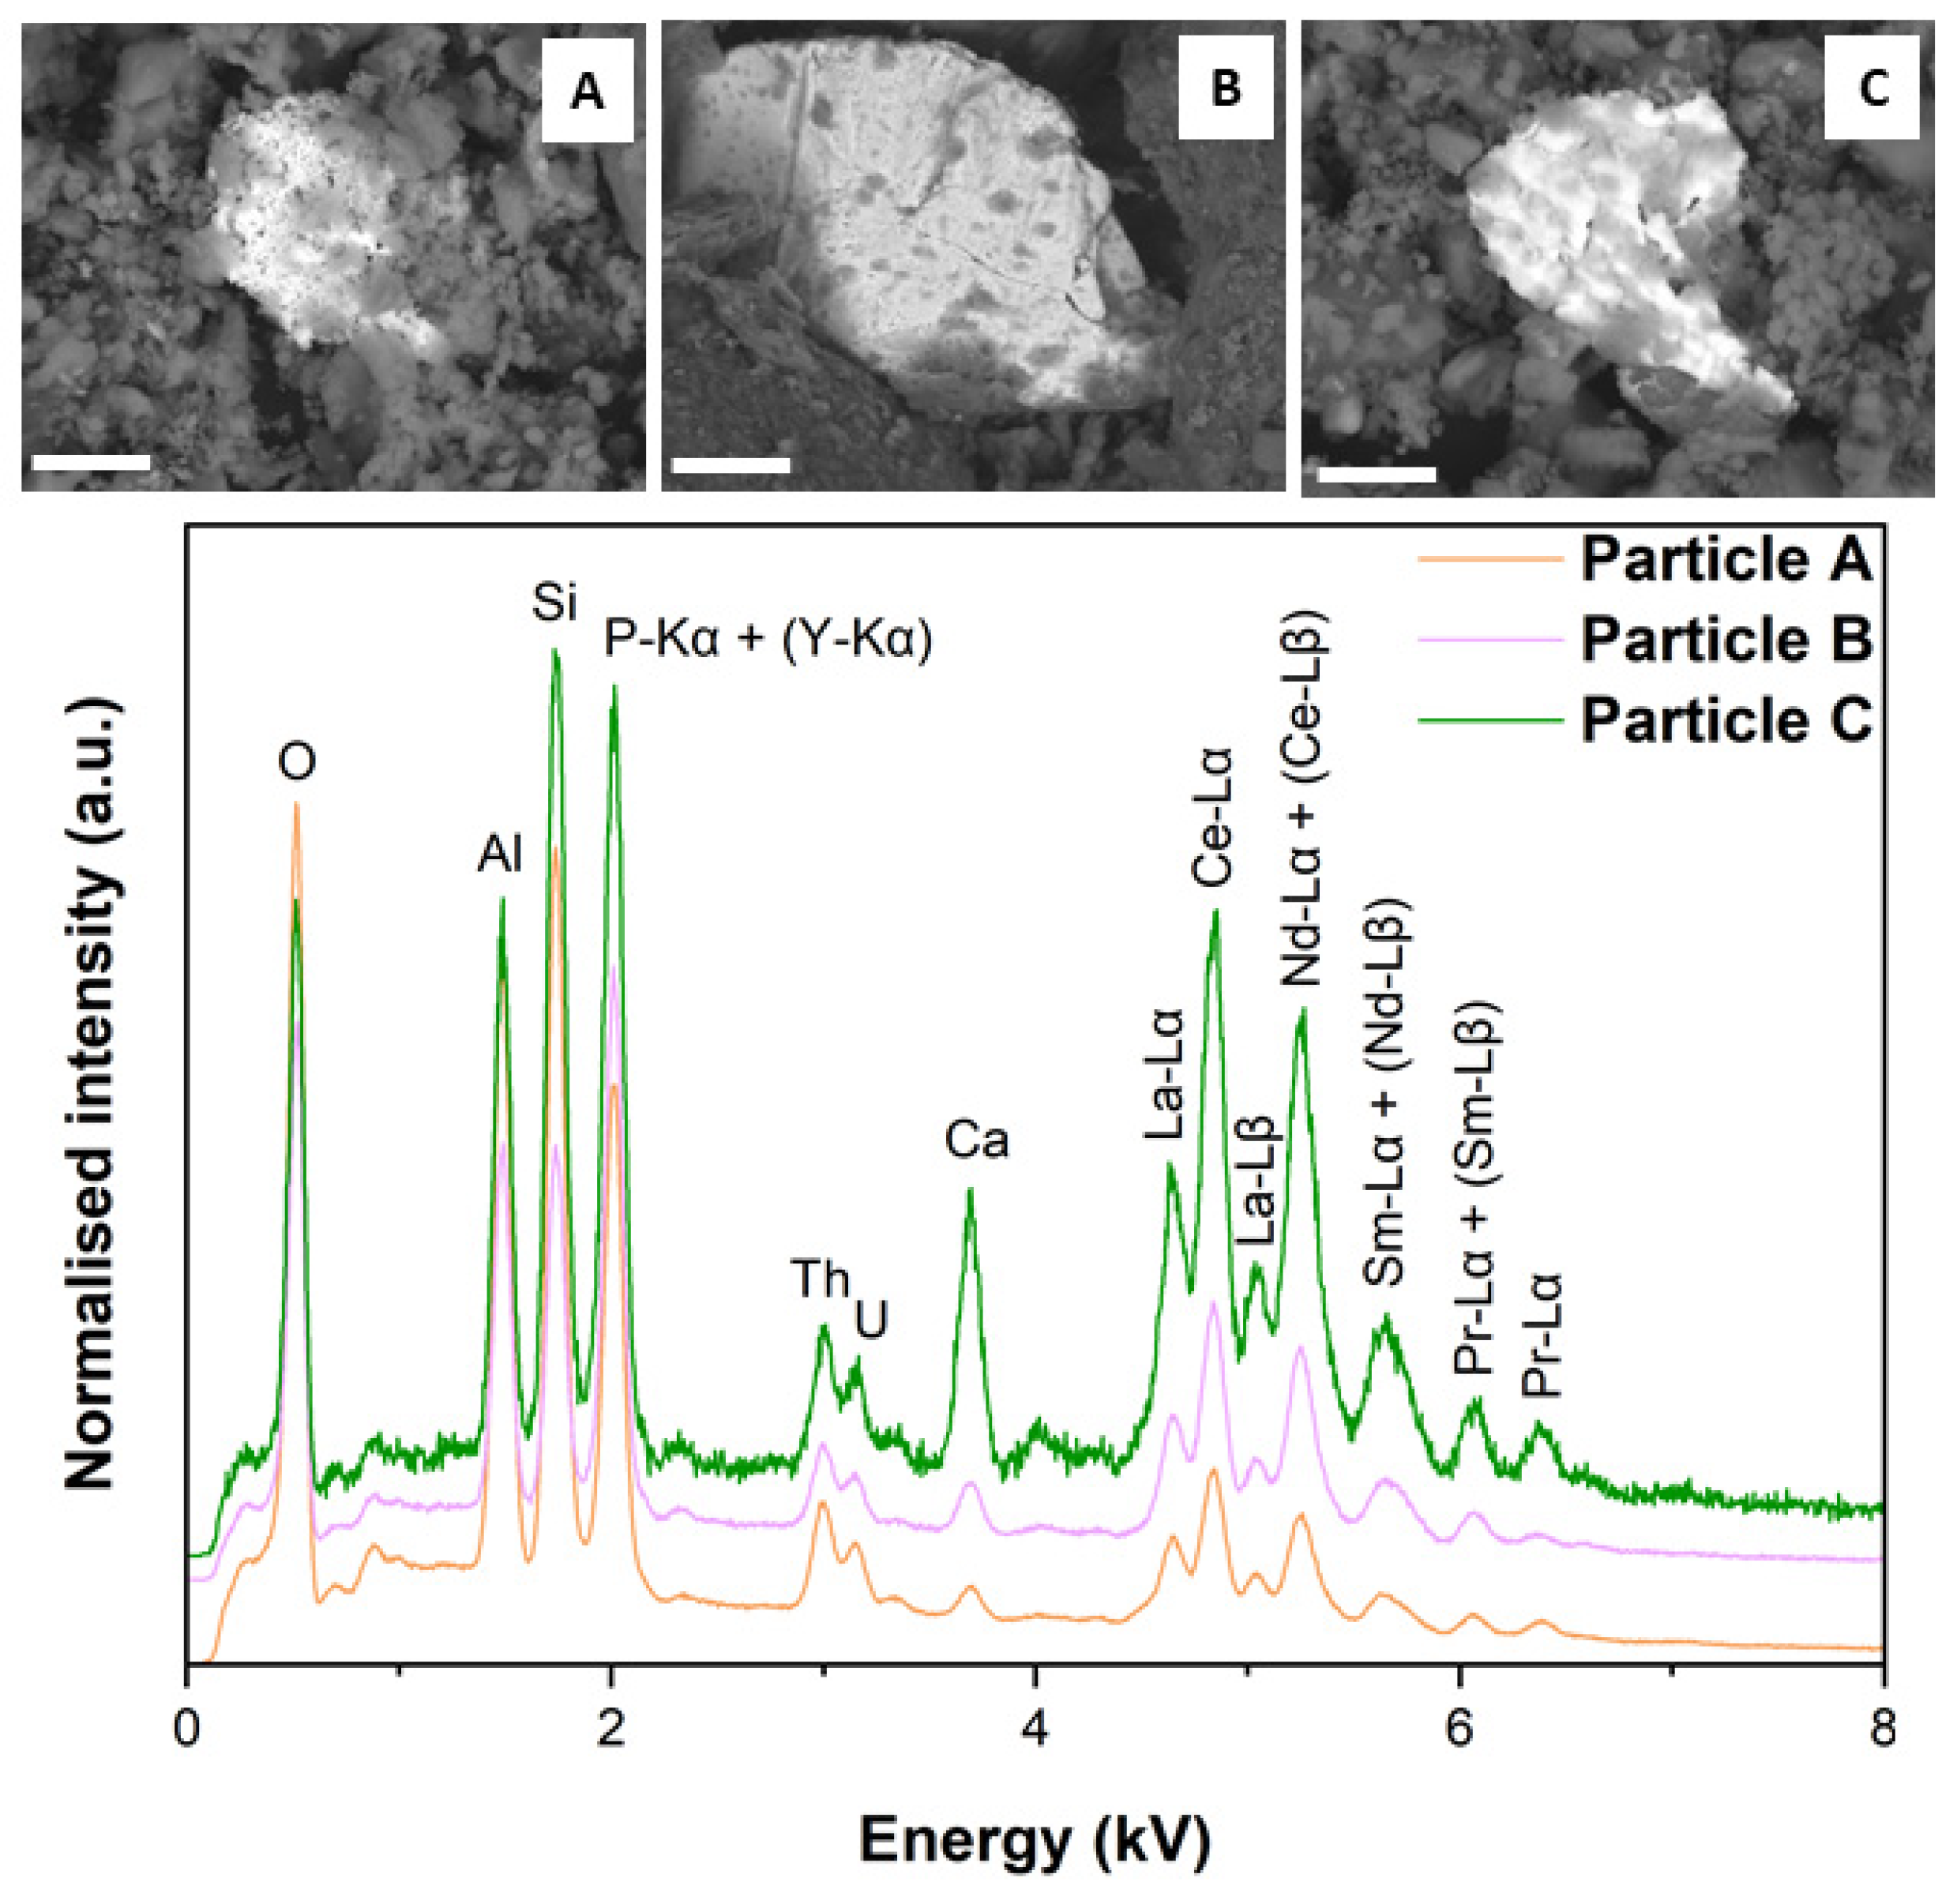
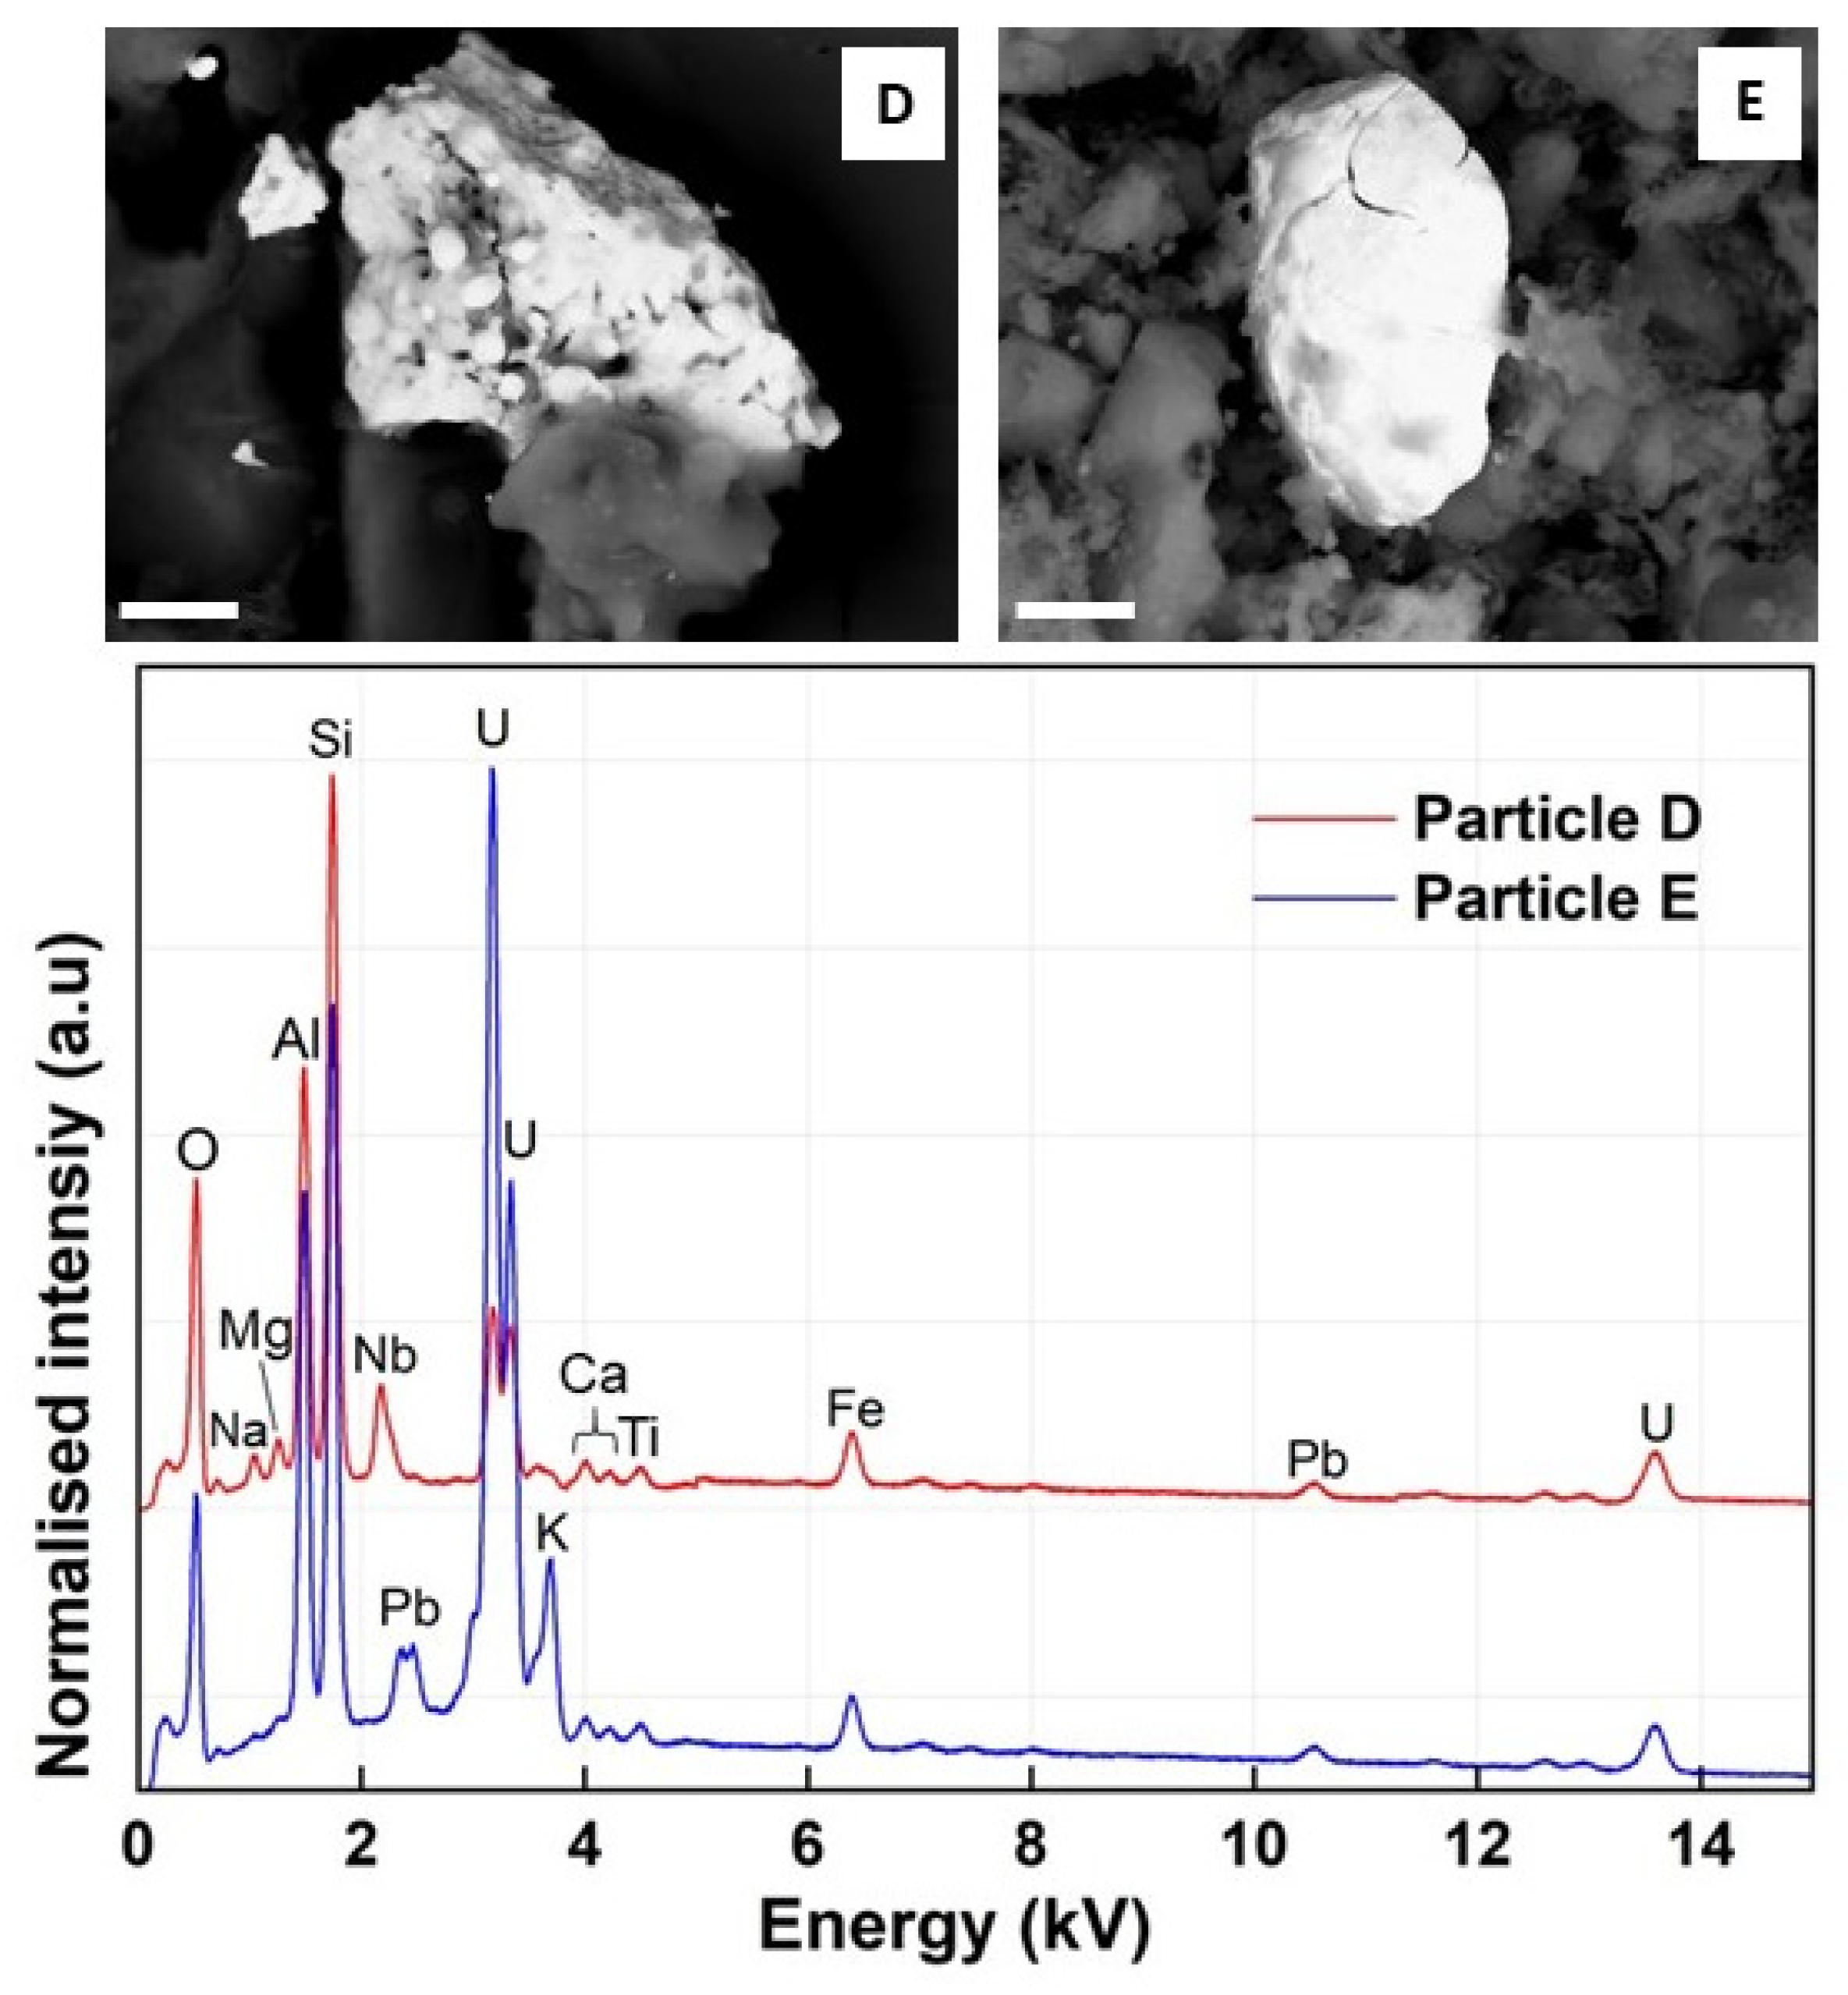
Table 5, Table 6, Table 7 and Table 8 show results of estimated absorbed dose (D), annual effective dose equivalent (AEDE), and radium equivalent (Raeq), respectively, for coal and simulant coal ash samples for both mines. The mean values of D, AEDE, and Raeq in Okaba and Omelewu coal samples (Table 5 and Table 6) were 23.74 nGyh−1, 29.12 µSvy–1, and 52.02 Bqkg−1; and 48.17 nGyh−1, 59.08 µSvy−1, and 108.33 Bqkg−1, respectively. These values were well below the world average values of 59 nGyh−1, 70 µSvy−1, and 370 Bqkg–1, respectively. In Okaba and Omelewu coal samples (Table 7 and Table 8), the mean values of D, AEDE, and Raeq (204.99 nGyh−1, 251.40 µSvy1, 449.30 Bqkg−1; 204.02 nGyh−1, 250.21 µSvy1, 453.63 Bqkg−1, respectively) were higher than the world average, with AEDE being over three-times higher than the world average, with the mean AEDE representing a 10% increase in the world annual natural background effective dose [32]. These imply that disposal of large volumes of coal ash from both mines to landfills and use for mine reclamation and for construction of residential buildings has the implication of markedly increasing the annual effective dose from external exposure to gamma emitting decay products of U and Th, and internal exposure due to inhalation of U, Th, radon gas, and related decay products of both. These results imply that caution should be taken during the disposal and use of these coal ash materials; these coal ash materials should be properly stored in slurry ponds to prevent exposure to gamma radiation, ingestion, and inhalation of (re)suspended particles, and leaching of radionuclides into the environment. These potential health impacts represent a significant finding and represent major safety implications for the Nigerian people if such coal ash material is not properly stored, exposing the people to radiation via inhalation and ingestion.

3.2. SEM–EDS

Despite extensive analysis of the carbonaceous coal material within the SEM using the systems backscattered electron detector, no discrete U or Th composition particles were observed to exist. Such an apparent observation could be the result of inherent sampling bias; however, this may conversely arise from their non-existence within the coal, rather occurring encapsulated within the bulk carbonaceous material. This encapsulation would serve to partially protect the U in the coal from the prevalent oxidizing environmental conditions, which would significantly reduce its environmental mobility over oxidized (+6) species of U [33]. It is following combustion of the coal materials that such particle fragments are liberated into the coal ash material.
Figure 2 and the accompanying Table 9 show the SEM images, EDS spectra, and compositional breakdown (in wt. % ± percentage error, δ) of monazite particles A, B, and C, detected in the coal ash samples. Figure 3 (and Table 9) show the SEM images, EDS spectra, and compositional breakdown (in wt. % ± δ) of uraninite particles D and E. Discrete U and Th accessory minerals (monazite, xenotime, and zircon) with characteristically weathered surfaces were found within coal ash samples from both mines, as shown in Figure 2. Uraninite particles (thought to have precipitated from hydrothermal fluids during coalification [3]) were also found in the coal ash samples, with residual radiogenic Pb from the decay of U, alongside Fe and Nb present in the bulk material or indicative of possible substitution of radiogenic Pb from later fluid-circulation events after initial formation of the uraninite during coalification [34]. These radioactive particles (with sizes between 10 μm and 80 μm) have pitted and cracked surface morphologies, with the tendency to further fragment into more harmful bits (particulate matter, PM2.5), thereby increasing its risk of inhalation and localized radiation dose. Given favorable redox conditions and in the presence of Fe(III) and Mn(III) (hydr)oxides, the less soluble and immobile UO2 would form the more soluble and mobile (+6) species by re-oxidation, consequently gradually leaching U and its decay products into the environment, contaminating land and water over a long period of time [35,36,37].

4. Conclusions and Future Work

Complementing the gamma spectrometric technique with the SEM–EDS has provided important insights into the mode of occurrence and distribution of radioactive particles in simulated coal ash alongside the radioactivity and the potential human and environmental hazard of such material. This study has shown the occurrence of U and Th containing monazite and uraninite particles in coal ash samples from both Okaba and Omelewu coal mines in Nigeria, with results of activity concentration and radiological hazard indices being three to five times higher than the UNSCEAR 2000 world average. These results of activity concentration and radiological hazard indices are comparable to results for some coal ash samples from the Appalachian, Illinois, and Powder River basin coal mines (USA) and coal mines in Xijiang, Guangxi, and Sichuan provinces in China, which are known to have high 228Ra and 226Ra activity concentration values [3,19]. Consequently, these results imply that caution (in the form of percentage of coal ash used in concrete) should be taken when coal ash from the combustion of coal from these mines are to be used in building residential houses. Storage of this coal ash should be in properly lined slurry ponds to prevent indoor exposure to above background effective dose arising from gamma radiation, radon gas, and the inhalation of fugitive particles.
Alternatively, this material could be used as filler in asphalt pavements and in the production of geopolymers (with improved compressive strength and fire resistance) for nuclear waste encapsulation [38,39]. Future work will investigate radioactivity and radon exhalation rate from bricks and concrete made from these coal ash materials following established criteria, and also the economic viability of extracting rare earth elements [40] from these coal ash samples by determining mass concentrations of the rare earth elements via ICP–MS.

Author Contributions

I.C.O. and T.B.S. contributed to the conception of the study. I.C.O., T.I.O., M.O.O., and Y.S. contributed significantly to samples collection, preparation, and analyses; I.C.O. and P.G.M. performed the data analyses and wrote the manuscript. All authors have read and agreed to the published version of the manuscript.

Funding

This research received no external funding and the APC was funded by Thomas B. Scott.

Acknowledgments

The authors acknowledge the support of the Collaborative Laboratories for Advanced Decommissioning Science (CLADS), Japan Atomic Energy Agency, for carrying out the preliminary autoradiographic analyses of the coal ash samples. The SEM used in this work to conduct imaging and EDS analysis was purchased following funding by the EPSRC (Reference: EP/K040340/1).

Conflicts of Interest

The authors declare no conflict of interest.

References

  1. Nancy, E.L.; James, C.H.; Heileen, H.-K.; Ross, K.; Taggart, A.V. Naturally Occurring radioactive materials in coals and coal combustion residuals in the United States. Environ. Sci. Technol. 2015, 49, 11227–11233. [Google Scholar] [CrossRef]
  2. Ruhl, L.; Vengosh, A.; Dwyer, G.S.; Hsu-Kim, H.; Deonarine, A.; Bergin, M.; Kravchenko, J. Survey of the potential environmental and health impacts in the immediate aftermath of the coal ash spill in kingston, tennessee. Environ. Sci. Technol. 2009, 43, 6326–6333. [Google Scholar] [CrossRef] [PubMed] [Green Version]
  3. Chen, J.; Chen, P.; Yao, D.; Huang, W.; Tang, S.; Wang, K.; Liu, W.; Hu, Y.; Zhang, B.; Sha, J. Abundance, distribution, and modes of occurrence of uranium in Chinese coals. Minerals 2017, 7, 239. [Google Scholar] [CrossRef] [Green Version]
  4. Chen, J.; Chen, P.; Yao, D.; Huang, W.; Tang, S.; Wang, K.; Liu, W.; Hu, Y.; Li, Q.; Wang, R. Geochemistry of uranium in Chinese coals and the emission inventory of coal-fired power plants in China. Int. Geol. Rev. 2017, 621–637. [Google Scholar] [CrossRef]
  5. Karangelos, D.; Petropoulos, N.; Anagnostakis, M.; Hinis, E.; Simopoulos, S. Radiological characteristics and investigation of the radioactive equilibrium in the ashes produced in lignite-fired power plants. J. Environ. Radioact. 2004, 77, 233–246. [Google Scholar] [CrossRef] [PubMed]
  6. Manolopoulou, M.; Papastefanou, C. Behavior of natural radionuclides in lignites and fly ashes. J. Environ. Radioact. 1992, 16, 261–271. [Google Scholar] [CrossRef]
  7. Arbuzov, S.I.; Maslov, S.G.; Volostnov, A.V.; Il’enok, S.S.; Arkhipov, V.S. Modes of Occurrence of Uranium and Thorium in Coals and Peats of Northern Asia. Solid Fuel Chem. 2012, 46, 52–66. [Google Scholar] [CrossRef]
  8. Salbu, B.; Lind, O.C.; Skipperud, L. Radionuclide speciation and its relevance in environmental impact assessments. J. Environ. Rad. 2004, 74, 233–242. [Google Scholar] [CrossRef]
  9. Kogi Power Station. 2012. Available online: www.sourcewatch.org/index.php/Kogi_power_station (accessed on 5 June 2018).
  10. Energy Mix Report. ETA-ZUMA Launches Coal Briquette Production Plant-Kogi State. 2018. Available online: www.energymixreport.com/eta-zuma-launches-coal-briquette-production-plant-kogi/ (accessed on 7 June 2018).
  11. Franklin Alli Cement Manufacturers Cut Power Cost with Investments in Coal. 2017. Available online: www.vanguardngr.com/2017/11/cement-manufacturers-cut-power-cost-coal-investments/ (accessed on 8 June 2018).
  12. Ministry of Solid Minerals Development, Federal Republic of Nigeria. Feasibility Study: Nigerian Coal Resource Development. Available online: https://electricityinnigeria.com/ (accessed on 18 March 2019).
  13. Mohammed, U.; Garba, U.M.; Priscilla, E.; Azare, K.I.; Usman, S.; Onoduku, Y.; Mohammad, S. Characterisation and ash chemistry of selected Nigerian coals for solid fuel combustion. Petoleum Coal. 2016, 58, 646–654. [Google Scholar]
  14. Afu, D.J.; Ifeola, E.O.; Adesida, P.A. Omelewu coal characterization for powering power plant at Dangote cement factory, Obajana, Kogi state, Nigeria. Am. J. Eng. Res. 2018, 7, 143–152. [Google Scholar]
  15. Wikipedia Map of Nigerian States with Names. 2019. Available online: https://en.wikipedia.org/wiki/File:Map_of_Nigerian_States_with_names.png (accessed on 4 July 2019).
  16. Stanislav, V.V.; Christina, G.V. Methods for Characterization of Composition of Fly Ashes from Coal-Fired Power Stations: A Critical Overview. Energy Fuels 2005, 19, 1084–1098. [Google Scholar] [CrossRef]
  17. Eckert & Ziegler. Reference & Calibration Sources Product Information. Available online: www.ezag.com/ (accessed on 4 January 2019).
  18. Ga-Ma and Associates Inc. Snap-on Lid Marinelli Beakers for Solid and Liquid Samples; Ga-Ma and Associates Inc.: Ocala, FL, USA.
  19. Lauer, N.; Vengosh, A.; Dai, S. Naturally Occurring Radioactive Materials in Uranium-Rich Coals and Associated Coal Combustion Residues from China. Environ. Sci. Technol. 2017, 51, 13487–13493. [Google Scholar] [CrossRef] [PubMed]
  20. Gordon, R.G. Practical Gamma-Ray Spectrometry; John Wiley and Sons: Sussex, UK, 2008. [Google Scholar]
  21. Isinkaye, O.M.; Nnamdi, N.; Jibiri, A.; Olomide, A. Radiological health assessment of natural radioactivity in the vicinity of Obajana cement factory, North Central Nigeria. J. Med. Phys. 2015, 52–59. [Google Scholar] [CrossRef] [PubMed]
  22. National Nuclear Data Center, Brookhaven National Laboratory, USA. Available online: http://www.nndc.bnl.gov/ (accessed on 19 January 2019).
  23. United Nation Scientific Committee on Effects of Atomic Radiation (UNSCEAR). Sources and Effects of Ionizing Radiation; Report to the General Assembly with Scientific Annexes; UNSCEAR: New York, NY, USA, 2000. [Google Scholar]
  24. El-Taher, A. Gamma spectroscopic analysis and associated radiation hazards of building materials used in Egypt. Radiat. Prot. Dosim. 2009, 2, 166–173. [Google Scholar] [CrossRef] [PubMed]
  25. Beretka, J.; Mathew, P.J. Natural radioactivity of Australian building materials, industrial wastes and by-products. Health Phys. 1985, 48, 87–95. [Google Scholar] [CrossRef] [PubMed]
  26. Lu, X.; Jia, X.; Wang, F. Natural radioactivity of coal and its by-products in the Baoji coal-fired power plant, China. Curr. Sci. 2006, 91, 1508. [Google Scholar]
  27. Mandal, A.; Sengupta, D. Radioelemental study of Kolaghat thermal power plant, West Bengal, India: Possible environmental hazards. Environ. Geol. 2003, 44, 180–186. [Google Scholar] [CrossRef]
  28. Kisić, D.M.; Miletić, S.R.; Radonjić, V.D.; Radanović, S.B.; Filipovic, J.Z.; Gržetić, I.A. Natural radioactivity of coal and fly ash at the Nikola Tesla B TPP. Hem. Ind. 2013, 67, 729–738. [Google Scholar] [CrossRef]
  29. Cevik, U.; Damla, N.; Nezir, S. Radiological characterization of Cayirhan coal-fired power plant in Turkey. Fuel 2007, 2509–2513. [Google Scholar] [CrossRef]
  30. United Nation Scientific Committee on Effects of Atomic Radiation (UNSCEAR). Sources and Effects of Ionizing Radiation; Report to the General Assembly with Scientific Annexes; UNSCEAR: New York, NY, USA, 1988. [Google Scholar]
  31. Labrincha, J.; Puertas, F.; Schroeyers, W.; Kovler, K. Naturally occurring radioactive materials in construction. Integr. Radiat. Prot. Reuse 2017, 183–252. [Google Scholar] [CrossRef]
  32. UNSCEAR. Sources and Effects of Ionizing Radiation; Report to the General Assembly Scientific Annexes A and B; UNSCEAR: New York, NY, USA, 2008; Volume I. [Google Scholar]
  33. Wang, Y.; Bagnoud, A.; Suvorona, E.; McGivney, E. Geochemical control on uranium (IV) mobility in a mining-impacted wetland. Environ. Sci. Technol. 2014, 48, 10062–10072. [Google Scholar] [CrossRef] [PubMed] [Green Version]
  34. Alexandre, P.; Kyser, T.K. Effects of cationic substitutions and alteration in uraninite, and implications for the dating of uranium deposits. Can. Mineral. 2005, 43, 1005–1017. [Google Scholar] [CrossRef]
  35. Burns, P.C.; Finch, R. Uranium-Mineralogy, Geochemistry and the Environment; Reviews in Mineralogy 38; Mineralogical Society of America: Washington, DC, USA, 1999. [Google Scholar]
  36. Sani, R.K.; Peyton, B.M.; Dohnalkova, A.; Amonette, J.E. Re-oxidation of reduced uranium with iron (III) (hydr)oxides under sulfate-reducing conditions. Environ. Sci. Technol. 2005, 2059–2066. [Google Scholar] [CrossRef] [PubMed]
  37. Ulrich, K.U.; Ilton, E.S.; Veeramani, H.; Sharp, J.O.; Bernier-Latmani, R.; Schofield, E.J.; Bargar, J.R.; Glammar, D.E. Comparative dissolution kinetics of biogenic and chemogenic uraninite under oxidizing conditions in the presence of carbonate. Geochim. ET Cosmochim. Acta 2009, 73, 6065–6083. [Google Scholar] [CrossRef]
  38. Leay, L.; Potts, A.; Donoclift, T. Geopolymers from fly ash and their gamma irradiation. Mater. Lett. 2018, 227, 240–242. [Google Scholar] [CrossRef]
  39. Zoorob, S.E.; Cabrera, J.G. Design and construction of a road pavement using fly ash in hot rolled asphalt. Stud. Environ. Sci. 1997, 71, 149–165. [Google Scholar] [CrossRef]
  40. U.S. Department of Energy, National Energy Technology Laboratory. Characterization of Rare Earth Element Minerals in Coal Utilization By-products. 2017. Available online: https://edx.netl.doe.gov/dataset/characterization-of-rare-earth-element-minerals-in-coal-utilization-byproducts (accessed on 8 May 2019).
Figure 1. Map of Nigerian states showing the location of Ankpa LGA (yellow) and Olamaboro LGA (green), both in Kogi state (red). Modified from [15].
Minerals 10 00241 g001
Figure 2. (Top) backscattered electron images of three monazite particles (A and B in Okaba coal ash; C in Omelewu coal ash). (Bottom) associated EDS spectra with emission peaks identified (scale bars = 10 μm).
Minerals 10 00241 g002
Figure 3. (Top) backscattered electron images of two uraninite particles (D in Okaba coal ash and E in Omelewu coal ash). (Bottom) associated EDS spectra with emission peaks identified (scale bars = 5 μm).
Minerals 10 00241 g003
Table 1. Activity concentration of radionuclides in Omelewu coal samples (Bqkg−1).
Coal Samples40K232Th228Ra226RaTotal Radium
OMC181.40 ± 4.9832.23 ± 1.2727.00 ± 1.6732.35 ± 1.1759.35
OMC280.24 ± 4.8431.94 ± 1.2527.33 ± 1.6730.22 ± 1.0957.55
OMC353.40 ± 3.6428.77 ± 1.1424.92 ± 1.5328.56 ± 1.0353.48
OMC4105.95 ± 5.6746.88 ± 1.7437.93 ± 2.2147.06 ± 1.6484.99
OMC590.09 ± 5.1544.71 ± 1.6836.89 ±2.1745.03 ± 1.5781.92
OMC688.75 ± 5.0843.72 ± 1.6436.33 ± 2.1346.74 ± 1.6383.07
OMC790.10 ± 5.0046.37 ± 1.7238.56 ± 2.2345.74 ± 1.5984.30
OMC896.52 ± 5.5048.25 ± 1.8141.54 ± 2.4250.99 ± 1.7892.53
OMC984.10 ± 4.9336.55 ± 1.4031.43 ± 1.8840.46 ± 1.4271.89
OMC1050.35 ± 3.3166.56 ± 2.4055.98 ± 3.1459.22 ± 2.03115.20
OMC1145.91 ± 3.3933.06 ± 1.2927.55 ± 1.6930.95 ± 1.1158.50
OMC1283.02 ± 4.8741.25 ± 1.5635.28 ± 2.0843.97 ± 1.5479.25
OMC1380.19 ± 4.8541.85 ± 1.5935.14 ± 2.0945.34 ± 1.5980.48
OMC1478.12 ± 4.7642.07 ± 1.6035.47 ± 2.1045.44 ± 1.6080.91
OMC1581.68 ± 4.9142.20 ± 1.6035.60 ± 2.1145.57 ± 1.6081.17
Min.
Max.
45.91 ± 3.39
105.95 ± 5.67
28.77 ± 1.14
66.56 ± 2.40
27.00 ± 1.67
55.98 ± 3.14
28.56 ± 1.03
59.22 ± 2.03
53.48
115.20
Mean79.32 ± 16.9141.76 ± 9.1735.13 ± 7.3242.51 ± 8.5477.64
UNSCEAR 2000 soil average [23]40030303565
% of UNSCEAR 200020139117121119
Table 2. Activity concentration of radionuclides in Okaba coal samples (Bqkg−1).
Coal Samples40K232Th228Ra226RaTotal Radium
OKC182.09 ± 6.3118.43 ± 0.9216.83 ± 1.3013.84 ± 0.63 30.67
OKC246.60 ± 3.8012.57 ± 0.6313.26 ± 0.9819.43 ± 0.7632.69
OKC377.11 ± 6.5016.59 ± 0.9016.52 ± 1.3412.08 ± 0.5928.60
OKC4165.99 ± 9.7422.11 ± 1.0420.89 ± 1.5020.12 ± 0.8341.01
OKC5174.21 ± 10.2721.27 ± 1.0319.43 ± 1.4516.21 ± 0.7035.64
OKC6116.26 ± 7.6921.10 ± 1.0018.87 ± 1.4023.52 ± 0.9542.39
OKC7224.58 ± 12.4827.14 ± 1.2627.68 ± 1.9216.86 ± 0.7444.54
OKC8139.32 ± 8.5325.38 ± 1.1421.80 ± 1.5327.52 ± 1.0749.32
OKC9145.05 ± 9.0216.97 ± 0.8718.42 ± 1.3712.67 ± 0.5931.09
OKC10119.32 ± 7.9717.99 ± 0.9118.05 ± 1.3615.57 ± 0.6933.62
OKC11127.04 ± 7.4316.27 ± 0.7714.07 ± 1.0418.23 ± 0.7332.30
OKC12192.01 ± 11.6623.04 ± 1.1319.66 ± 1.5216.20 ± 0.7435.86
OKC1374.63 ± 5.7519.36 ± 0.9418.55 ± 1.3713.95 ± 0.6232.50
OKC1487.53 ± 6.864.82 ± 0.405.03 ± 0.615.02 ± 0.3210.05
OKC1572.61 ± 5.6513.50 ± 0.7213.47 ± 1.0711.63 ± 0.5425.10
Min.
Max.
46.60 ± 3.80
224.58 ± 12.48
4.82 ± 0.40
27.14 ± 1.26
5.03 ± 0.61
27.68 ± 1.92
5.02 ± 0.32
27.52 ± 1.07
10.05
49.32
Mean122.96 ± 50.8018.43 ± 5.5417.50 ± 4.9916.19 ± 5.3333.69
UNSCEAR 2000 soil average [23] 40030303565
% of UNSCEAR 20003161584652
Table 3. Activity concentration of radionuclides in Okaba simulant coal ash samples (Bqkg−1).
Coal Ash Samples40K232Th228Ra226RaTotal Radium
OKA11330.79 ± 68.14241.29 ± 7.56218.87 ± 11.86187.93 ± 7.08406.80
OKA21146.74 ± 60.37160.13 ± 6.88146.84 ± 9.74190.42 ± 7.09337.26
OKA3991.76 ± 54.23169.20 ± 7.14140.09 ± 9.31180.38 ± 6.79320.26
OKA4900.92 ± 51.20127.69 ± 5.75114.43 ± 7.98143.12 ± 5.55257.55
OKA51159.41 ± 62.15152.40 ± 6.68135.92 ± 9.23156.34 ± 6.06292.26
OKA61165.76 ± 62.68161.95 ± 7.03141.50 ± 9.57140.71 ± 5.53282.21
OKA7698.89 ± 41.08177.87 ± 7.32151.83 ± 9.76172.86 ± 6.47324.69
OKA8882.02 ± 49.40180.89 ± 7.51147.79 ± 9.67176.79 ± 6.63324.58
OKA91412.72 ± 74.87163.33 ± 7.32158.41 ± 10.77176.85 ± 6.85335.26
OKA101360.02 ± 71.68136.41 ± 6.29133.83 ± 9.31154.85 ± 6.08288.68
OKA111137.84 ± 62.58133.34 ± 6.12125.18 ± 8.79157.93 ± 6.15283.11
OKA121119.74 ± 64.46145.70 ± 6.77138.15 ± 9.79145.71 ± 5.87283.86
OKA13485.95 ± 33.47145.12 ± 6.34137.55 ± 9.18116.86 ± 4.67254.41
OKA14622.25 ± 41.66103.56 ± 5.09104.09 ± 7.6599.38 ± 4.24203.47
OKA15519.97 ± 35.55100.30 ± 4.7881.99 ± 6.21101.49 ± 4.23183.48
Min.
Max.
485.95 ± 33.47
1360.02 ± 71.68
100.30 ± 4.78
241.29 ± 7.56
81.99 ± 6.21
218.87 ± 11.86
99.38 ± 4.24
190.42 ± 7.09
183.48
406.80
Mean995.65 ± 301.03153.28 ± 34.15138.41 ± 29.72153.44 ± 29.36291.86
UNSCEAR 1988 coal ash average [30]26570130240-
UNSCEAR 2000 soil average [23]40030303565
% of UNSCEAR 2000249511461438449
Table 4. Activity concentration of radionuclides in Omelewu simulant coal ash samples (Bqkg–1).
Coal Ash Samples40K232Th228Ra226RaTotal Radium
OMA1295.00 ± 21.68130.49 ± 5.50124.48 ± 8.02222.84 ± 7.95347.32
OMA2280.90 ± 23.34127.58 ± 5.78140.06 ± 9.27225.17 ± 8.22365.23
OMA3395.27 ± 25.74122.17 ± 5.18117.32 ± 7.59201.43 ± 7.24318.75
OMA4332.90 ± 25.31123.73 ± 5.46111.64 ± 7.64215.51 ± 7.87327.15
OMA5451.19 ± 31.07120.53 ± 5.46125.88 ± 8.47216.81 ± 7.93342.69
OMA6371.47 ± 24.79112.07 ± 4.8098.39 ± 6.58212.78 ± 7.62311.17
OMA7199.53 ± 19.75129.73 ± 5.83121.90 ± 8.41230.72 ± 8.48352.62
OMA8324.30 ± 25.68137.84 ± 6.05128.01 ± 8.65253.57 ± 9.18381.58
OMA9351.50 ± 25.87155.93 ± 6.53131.69 ± 8.67261.51 ± 9.34393.20
OMA10299.89 ± 24.48157.59 ± 6.73141.05 ± 9.36283.75 ± 10.19424.80
OMA11232.33 ± 18.93129.90 ± 5.47111.01 ± 7.33272.47 ± 9.63383.48
OMA12310.47 ± 22.31140.72 ± 5.82124.83 ± 8.03257.19 ± 9.10382.02
OMA13298.25 ± 20.97135.88 ± 5.56118.41 ± 7.56257.92 ± 9.07376.33
OMA14267.12 ± 19.06129.90 ± 5.29111.33 ± 7.10250.21 ± 8.79361.54
OMA15284.26 ± 19.83124.72 ± 5.13112.78 ± 7.18251.42 ± 8.83364.20
Min.
Max.
199.53 ± 19.75
451.19 ± 31.07
112.07 ± 4.80
155.93 ± 6.53
98.39 ± 6.58
141.05 ± 9.36
201.43 ± 7.24
283.75 ± 10.19
311.17
424.80
Mean312.96 ± 62.88131.92 ± 12.35121.25 ± 11.13240.89 ± 24.53362.14
UNSCEAR 1988 fly ash average [30]26570130240-
UNSCEAR 2000 soil average [23]40030303565
% of UNSCEAR 2000 78440404688557
Table 5. Radiological hazard indices for radionuclides in Okaba coal samples.
Coal SamplesAbsorbed Dose
D (nGyh1)
Annual Effective Dose Equivalent
AEDE (µSvy1)
Radium Equivalent
Raeq (Bqkg1)
OMC137.81 ± 0.9646.37 ± 1.1884.71 ± 2.19
OMC236.60 ± 0.9344.89 ± 1.1482.07 ± 2.13
OMC332.80 ± 0.8540.22 ± 1.0473.81 ± 1.95
OMC454.48 ± 1.3266.81 ± 1.62122.26 ± 3.01
OMC551.57 ± 1.2763.24 ± 1.55115.90 ± 2.90
OMC651.70 ± 1.2663.41 ± 1.55116.09 ± 2.88
OMC752.90 ± 1.2964.87 ± 1.58118.99 ± 2.95
OMC856.73 ± 1.3969.57 ± 1.70127.42 ± 3.17
OMC944.28 ± 1.0954.30 ± 1.3499.20 ± 2.48
OMC1069.66 ± 1.7385.43 ± 2.12158.28 ± 4.00
OMC1136.18 ± 0.9444.37 ± 1.1681.76 ± 2.17
OMC1248.69 ± 1.2059.71 ± 1.47109.35 ± 2.74
OMC1349.57 ± 1.2360.79 ± 1.50111.36 ± 2.80
OMC1449.66 ± 1.2360.90 ± 1.51111.62 ± 2.82
OMC1549.95 ± 1.2361.26 ± 1.51112.21 ± 2.82
Min.
Max.
32.80 ± 0.85
69.66 ± 1.73
40.22 ± 1.04
85.43 ± 2.12
73.81 ± 1.95
158.28 ± 4.00
Mean48.17 ± 9.1859.08 ± 11.66108.33 ± 21.63
World average [23,25]5970˂370
% of world average818429
Table 6. Radiological hazard indices for radionuclides in Omelewu coal samples.
Coal SamplesAbsorbed Dose (D)(nGyh−1)Annual Effective Dose Equivalent (AEDE)(µSvy−1)Radium Equivalent (Raeq)(Bqkg−1)
OKC120.95 ± 0.6825.69 ± 0.8346.52 ± 1.54
OKC218.51 ± 0.5422.70 ± 0.6640.99 ± 1.21
OKC318.82 ± 0.6723.08 ± 0.8241.74 ± 1.50
OKC429.57 ± 0.8436.27 ± 1.0364.52 ± 1.86
OKC527.60 ± 0.8233.85 ± 1.0160.04 ± 1.81
OKC628.46 ± 0.8133.90 ± 1.0062.65 ± 1.82
OKC733.55 ± 0.9841.14 ± 1.2172.96 ± 2.17
OKC833.85 ± 0.9241.52 ± 1.1374.54 ± 2.06
OKC922.15 ± 0.7027.17 ± 0.8648.11 ± 1.54
OKC1023.03 ± 0.7228.25 ± 0.8850.48 ± 1.60
OKC1123.55 ± 0.6528.88 ± 0.8051.28 ± 1.44
OKC1229.41 ± 0.9136.07 ± 1.1163.93 ± 1.99
OKC1321.25 ± 0.6826.06 ± 0.8347.38 ± 1.55
OKC148.88 ± 0.4010.89 ± 0.4918.65 ± 0.84
OKC1516.55 ± 0.5520.30 ± 0.6836.53 ± 1.24
Min.
Max.
8.88 ± 0.40
33.85 ± 0.92
10.89 ± 0.49
41.52 ± 1.13
18.65 ± 0.84
74.54 ± 2.06
Mean23.74 ± 6.7829.12 ± 8.3152.02 ± 14.81
World average [23,25]5970˂370
% of world average404214
Table 7. Radiological hazard indices for radionuclides in Okaba simulant coal ash samples.
Coal Ash SamplesD (nGyh−1)AEDE (µSvy−1)Raeq (Bqkg−1)
OKA1288.06 ± 6.29353.27 ± 7.72635.45 ± 13.95
OKA2232.51 ± 5.86285.15 ± 7.19507.70 ± 12.99
OKA3226.88 ± 5.79278.26 ± 7.10498.70 ± 12.95
OKA4180.81 ± 4.82221.75 ± 5.91395.09 ± 10.67
OKA5212.63 ± 5.55260.76 ± 6.81463.55 ± 12.28
OKA6211.44 ± 5.60259.31 ± 6.87462.06 ± 12.45
OKA7216.44 ± 5.61265.44 ± 6.87481.03 ± 12.71
OKA8227.71 ± 5.85279.27 ± 7.17503.38 ± 13.18
OKA9239.27 ± 6.27293.44 ± 7.69519.19 ± 13.77
OKA10210.65 ± 5.59258.34 ± 6.86454.64 ± 12.18
OKA11200.95 ± 5.34246.44 ± 6.55436.22 ± 11.73
OKA12202.01 ± 5.59247.75 ± 6.86440.28 ± 12.36
OKA13161.91 ±4.61198.56 ± 5.66361.80 ± 10.52
OKA14134.41 ± 4.04164.84 ± 4.95295.38 ± 9.01
OKA15129.15 ± 3.79158.39 ± 4.65284.96 ± 8.49
Min.
Max.
129.15 ± 3.79
288.06 ± 6.29
158.39 ± 4.65
353.27 ± 7.72
284.96 ± 8.49
635.45 ± 13.95
Mean204.99 ± 40.79251.40 ± 50.02449.30 ± 89.15
World average [23,25]5970˂370
% of world average 347359121
Table 8. Radiological hazard indices for radionuclides in Omelewu simulant coal ash samples.
Coal Ash SamplesD (nGyh−1)AEDE (µSvy−1)Raeq (Bqkg−1)
OMA1194.07 ± 5.03238.01 ± 6.17432.16 ± 11.31
OMA2192.80 ± 5.25236.45 ± 6.44429.24 ± 11.80
OMA3183.33 ± 4.70224.84 ± 5.77406.57 ± 10.54
OMA4188.18 ± 5.02230.78 ± 6.16418.08 ± 11.26
OMA5191.78 ± 5.10235.20 ± 6.25423.91 ± 11.38
OMA6181.48 ± 4.67222.57 ± 5.73401.64 ± 10.43
OMA7193.27 ± 5.33237.03 ± 6.54431.60 ± 12.00
OMA8213.93 ± 5.70262.36 ± 6.99475.65 ± 12.77
OMA9229.66 ± 5.94281.65 ± 7.29511.56 ± 13.36
OMA10238.78 ± 6.30292.84 ± 7.73532.20 ± 14.15
OMA11214.03 ± 5.60262.49 ± 6.86476.12 ± 12.49
OMA12216.76 ± 5.56265.84 ± 6.82482.33 ± 12.45
OMA13213.67 ± 5.44262.04 ± 6.67475.19 ± 12.17
OMA14205.20 ± 5.23251.65 ± 6.41456.54 ± 11.69
OMA15203.34 ± 5.19249.38 ± 6.36451.66 ± 11.58
Min.
Max.
181.48 ± 4.67
238.78 ± 6.30
222.57 ± 5.73
292.84 ± 7.73
401.64 ± 10.43
532.20 ± 14.15
Mean204.02 ± 16.90250.21 ± 20.73453.63 ± 38.20
World average [23,25]5970˂370
% of world average 346357123
Table 9. Elemental composition (wt. % ± δ) of particles A, B, C, D, and E determined via EDS analysis as shown in Figure 2 and Figure 3. ND: not detected.
ElementParticle AParticle BParticle CParticle DParticle E
O17.77 ± 8.0024.96 ± 8.0613.58 ± 8.3527.34 ± 9.3020.11± 7.45
Al 8.79 ± 8.195.85 ± 8.059.29 ± 8.044.99 ± 7.675.12 ± 7.71
Si 9.99 ± 7.407.20 ± 6.9110.80 ± 7.2319.95 ± 6.6933.78 ± 6.83
P 3.98 ± 7.4112.74 ± 6.0210.10 ± 6.74NDND
NbNDNDND14.32 ± 4.45ND
PbNDNDND2.45 ± 10.788.32 ± 8.81
FeNDNDND4.36 ± 2.881.39 ± 7.03
TiNDNDND0.18 ± 17.120.13 ± 14.41
Th 2.44 ± 12.632.61 ± 12.362.33 ± 11.20NDND
U 1.34 ± 11.911.35 ± 11.950.82 ± 21.3128.86 ± 1.4434.93 ± 2.09
KNDNDND0.12 ± 16.132.37 ± 6.88
Ca 1.17 ± 8.131.06 ± 10.871.00 ± 12.050.10 ± 15.210.15 ± 17.12
Y 2.60 ± 9.843.81 ± 8.621.94 ± 9.11NDND
La 12.87 ± 4.9911.36 ± 5.7813.61 ± 5.13NDND
Ce 24.52 ± 2.9421.13 ± 3.4224.45 ± 2.96NDND
Nd 10.96 ± 6.449.01 ± 7.0811.04 ± 6.05NDND
Sm 4.76 ± 11.912.60 ± 11.282.60 ± 9.34NDND
Pm 1.52 ± 15.131.86 ± 17.822.99 ± 15.46NDND

