Abstract
The Laowan deposit is a typical gold deposit in the Qinling-Dabie metallogenic belt, which produces the most gold resources in Central China. After being explored for decades, follow-up exploration requires additional theoretical support. In this study, the factor analysis (FA) and spectrum–area (S–A) multifractal model were used to process multi-element geochemical data from 369 samples collected in the study area for identifying the geochemical anomalies associated with gold mineralization. The results showed that: (1) the mean Au content in this region is up to 1000 times higher than the Au background values of the upper crust of the South Qinling unit; (2) the factor analysis revealed that Au, Ag, Cu, As, Sb, and S can be used as direct ore-prospecting criteria; (3) the observed elemental zonation is consistent with the zonation of metallic elements in the magmatic–hydrothermal system. This supports the magmatic–hydrothermal origin of the Laowan deposit; (4) the spectrum–area fractal model can help to decompose the geochemical patterns in a complex geological setting. The decomposed geochemical anomaly map obtained by the S–A multifractal model indicated that highly anomalous areas have a great relationship with the Au occurrence and can be a guidance for further exploration in the study area.
1. Introduction
Geochemical exploration is a significant method for finding various types of ore deposits in mineral exploration [1,2,3,4,5,6,7,8]. Many deposits have been discovered by geochemical data processing and anomaly identification [9]. Geochemical exploration data includes numerous elements. The complexity and diversity of geological processes lead to different element associations [10]. Some element associations are closely related to specific types of mineralization, which can be used to guide ore-prospecting [11].
Factor analysis (FA) is one of the most popular multivariate analysis methods for reducing the dimensionality of datasets. It is a useful tool for combining several correlated variables into a single factor that represents a certain inherent feature in order to summarize the multivariate information [12]. Thus, it has been widely used to recognize geochemical association related to the specific type of mineralization: e.g., [13,14,15,16,17,18].
Explorative geochemistry methods can be used to distinguish genuine anomalies and background values [19,20,21,22]. Two different types of mathematical models—e.g., [23,24,25]—have been developed to determine the threshold that is effective in separating geochemical anomalies from the background: (1) frequency-based and (2) spatial–frequency-based methods [26]. The former is based on the frequency distributions of geochemical exploration data. They include probability graphs [27] and multivariate data analysis techniques [13,28,29], which are helpful for geochemical data analysis: e.g., [30,31,32,33]. The second group of models considers not only frequency but also spatial distributions of data. Since Mandelbrot [34] first proposed the concept of fractals, fractal technology has been widely used in geosciences and has become a powerful tool for separating different geochemical populations: e.g., [23,35,36,37,38,39,40,41,42,43,44,45,46,47]. Geochemical exploration data generally don’t conform to a normal distribution, but rather a lognormal distribution [48], and the enrichment and distribution of trace elements are characterized by multifractals [49]. Fractal models include a concentration–area model (C–A) [23], a spectrum–area model (S–A) [50], a concentration–distance model (C–D) [51], a local singularity index [37], and a concentration–volume model (C–V) [52]. These methods do not only incorporate the frequency distributions of geochemical data, but also involve spatial self-similar properties.
The Qinling-Dabie metallogenic belt is a vital gold production region in Central China. The Laowan deposit—the study area in this paper—is one of the typical gold deposits in this region. It has been explored for over 40 years and needs more theoretical support to search for the concealed ore bodies on the edge of the mining area to increase the service life of the mines. Many studies in this area have focused on the geology of the Laowan gold deposit, ore-controlling structures, sources of ore-forming materials, and the relationship between Laowan granite and gold ore-formation: e.g., [53,54,55,56]. Some studies, such as [55,56,57,58], suggest that this deposit is of magmatic–hydrothermal origin and closely related to Yanshanian magmatism in time and space [58]. However, the ways of recognizing the geological process associated with gold mineralization and identifying geochemical anomalies are still the focus of the exploration of the deposit.
In this study, factor analysis (FA) combined with the spectrum–area (S–A) multifractal model were used to process 15 element concentrations in the Laowan gold deposit. The aims of this study were to: (1) explore the elemental associations, which can provide information for ore-prospecting; (2) search for genetic evidence of ore deposits through the zoning of geochemical elements; and (3) outline the geochemical anomalies by the S–A multifractal model according to the results of the FA to delineate the ore-forming target area in the periphery of the study area.
2. Geological Setting
The study area is located in the Qinling-Dabie orogenic system, which is the tectonic convergence of the Northern and Southern tectonic plates of China (Figure 1). This area is characterized by strong deformation, a complex structure, and multi-stage superposition after long-term tectonic evolution [59,60,61,62,63]. A series of precious metal deposits have been discovered in this area, in which the orogenic gold deposit is dominant and mainly occurs in a number of distinct belts both in quartz veins and altered metamorphic rocks [64]. The Jinning period was the main subduction-collision orogenic period. During the late Caledonian to early Variscan period, the area underwent intense tectonic processes, such as inner-continent subduction-compression, thrusting, shearing, and brittle tectonics, forming a series of NW (North-West)-trending fault structures. The orogenic process was complete by the Indo–Chinese epoch. After the Indosinian period, the area entered a period of continental tectonic evolution, mainly characterized by intraplate extension, uplift, and fault-block activity, accompanied by post-orogenic magmatic activity and metallic mineralization [65].
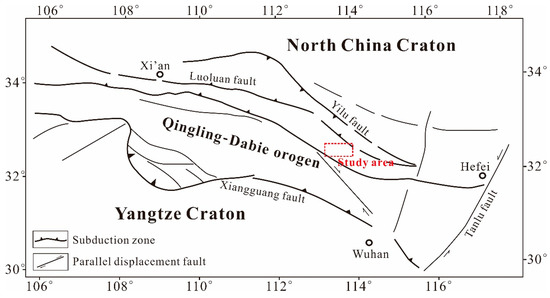
Figure 1.
Location and geological map of the Qinling-Dabie orogenic belt (modified from [66]).
The Laowan gold deposit is located in the East of the Qinling-Dabie orogenic belt and the Laowan ductile shear zone. The Northern and Southern sides are bounded by the Laowan and the Songpa ductile shear belt. The main host rock of the Laowan deposit is a metamorphic rock series from the Guishan Formation of the middle Mesoproterozoic period, which has undergone many ductile and brittle shear activities (Figure 2). The lithology is mainly mica-quartz schist and plagioclase-hornblende schist, and mylonitic silicified rocks [53,54,58,67]. The original rocks are basic volcano-clastic sedimentary [53].
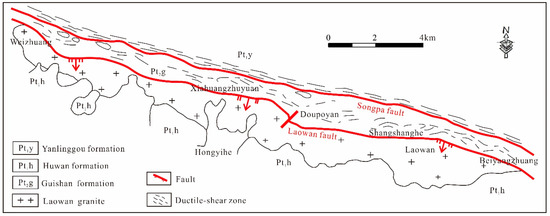
Figure 2.
Geological overview map of Laowan deposit, Henan province (modified from 1:2000 geological maps from No.1 Institute of Geology and Exploration, Henan Geology and Exploration Bureau).
The Laowan ductile shear zone is the ore-controlling structure of the deposit, which has obvious deformation marks and various deformation fabrics. In addition, the fault is well-developed in the region, including the Laowan fault on the Northern side and the Songpa fault on the Southern sides, and several groups of brittle fault structures in the N–NW (North-northwest) and N–NE (Northh-northeast) directions [58]. The N–NW trending fault is the main ore-bearing structure in the area. The Laowan fault is a post-mineralization structure [67]. The Songpa fault was dominated by a ductile strike-slip in the early stages and superimposed brittle fractures in the later stages. The fault was formed early and revived after emplacement by granite porphyry dykes in the later stages. This caused the granite porphyry dykes to be cataclastic, with the local mineralization of gold and silver.
Magmatic rocks are relatively developed in the mining area, including numerous granite porphyry and variable gabbro. The Laowan granitoid intrusion with an age of 133 Ma [68], 127 Ma (test by author, unpublished) is distributed across the Laowan fault zone and was formed in the middle–late Yanshanian period with the gold deposit [53]. The lithology is feldspar biotite granite. The granite porphyry dykes, with an age of 139 Ma [58], are mainly distributed along the Songpa fault. The edge of the dykes is highly fractured and formed gold, silver, and other polymetallic mineralization. The lithology is feldspar biotite granite.
The mineralization of the Laowan deposit can be divided into three stages (Figure 3): (1) the quartz oxide stage corresponds to the early stage of mineralization, and the mineral assemblage is quartz–magnetite–pyrite–gold; (2) the quartz polymetallic sulfide stage and the mineral assemblage is quartz–pyrite–sphalerite–gold, which is the main mineralization stage; (3) the quartz carbonate stage represents the late stage of mineralization, and the mineral assemblage is quartz–calcite–pyrite. The main ore types are altered amphibolic rocks, quartz–sericite–pyrite type, and quartz–feldspathic–pyrite type [56]. The time of the Laowan gold deposit is 138 ± 2 Ma obtained by 39Ar/40Ar dating of hydrothermal muscovite [55]. Figure 4 shows the mineral composition and symbiosis of ore as well as the occurrence of gold.
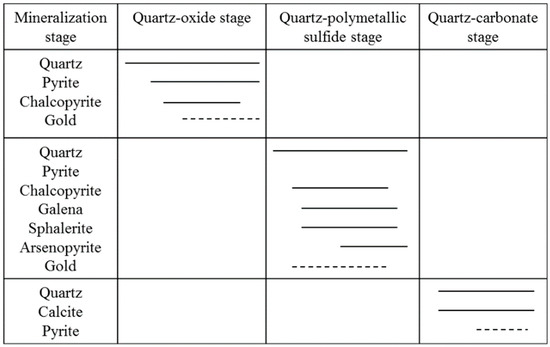
Figure 3.
Paragenetic sequence of ore minerals and the main ore stages of Laowan gold deposit (adapted from [55]). Solid lines indicate a high amount of the mineral and the dotted lines indicate a small amount of the mineral.
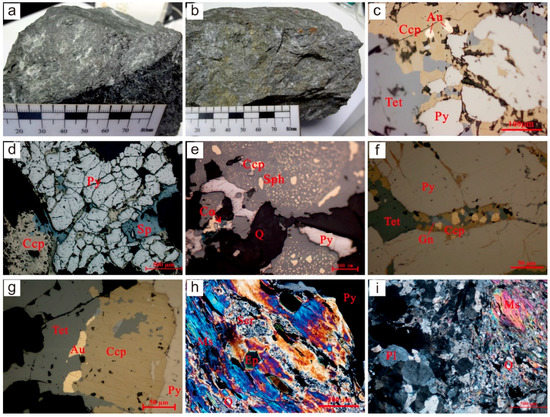
Figure 4.
The mineral composition of ore: (a) quartz–sericite type ore; (b) altered amphibolic type ore; (c) gold occurs in chalcopyrite; (d) cataclastic texture of pyrite; (e) emulsion texture: chalcopyrite is distributed in sphalerite as tiny milk drops; (f) galena is symbiotic with chalcopyrite; (g) tetrahedrite is symbiotic with chalcopyrite, and gold is distributed in tetrahedrite in irregular granular or veined form; (h,i) parallel extinction of muscovite.
3. Dataset and Methods
3.1. Sampling
In this study, the geochemical dataset was based on the analyses of 369 hand samples collected within an area of approximately 10 km2. The samples covered four ore sections: Pengjialaozhuang, Shangshanghe, Laowan, and Beiyangzhuang (Figure 5). The geochemical profiles were roughly perpendicular to the main ore-controlling structures in the study area. A global positioning system (GPS) was used to locate the samples, and the error on location was less than 5 m. The lithologies contained cataclasite, schist, granitoid, quartz–feldspathic veins, and quartz veins. The continuous sample picking method was used to uniformly collect rocks of the same lithology to form one sample. The sampling density was increased where the lithologies were complex. The weight of each sample was more than 500 g. Prior to elemental analysis, the rocks were dried, broken, washed, mixed, and divided (the error in division was less than 1%) in the detection institute, according to the standard (No.DZ/T0258-2014) issued by the Ministry of Land and Resources of the China, Beijing, China. For each sample, 15 elements, including Au, Ag, Cu, Pb, Zn, As, Sb, Bi, Hg, W, Mo, Sn, F, Co, and Ni, were determined at the Mineral Resources Supervision and Testing Center of Henan province, Zhengzhou, China. The analytical schemes for each element are shown in Table 1.
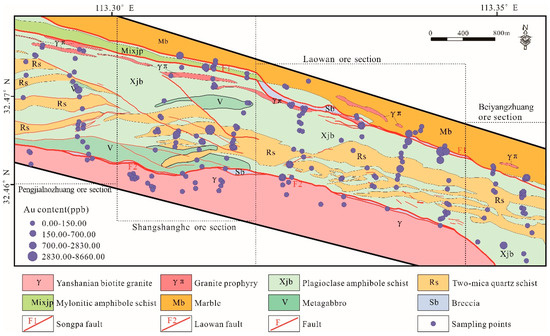
Figure 5.
Simplified geological map of the Laowan gold deposit with sampling locations (the size of the sample point represents the concentration of Au).

Table 1.
Analytical schemes and detection limits for 15 elements.
3.2. Factor Analysis
FA, which was outlined by Reimann et al. [13], is a powerful tool for processing geochemical data [69]. This method simplifies the interpretation of a complex dataset by reducing high-dimensional data to a few representative factors that cannot be observed directly, but represent certain features inherent in the original dataset: e.g., [12,70,71]. FA concentrates on the potential processes controlling the data distribution rather than the responses [12].
In usual model assumptions [69], the FA model is defined as:
where y denotes the random vector, with the factor f of the dimension k < D. e denotes the error term, and denotes the loading matrix. has a diagonal form, and the diagonal elements represent uniqueness or unique variance [12].
This can also be used to solve complex questions of geological genesis, as well as the mineralization superposition problem [72], and determine the vectors towards concealed ore deposits [13]. By grouping related variables to form factors, the reduction of variables and simplification of data interpretation can be realized [68]. The results include scree plots, factor score maps, and loading plots that have been widely used to interpret geochemical data: e.g., [72,73,74,75]. Generally, the data were log-transformed and tested to determine whether all variables were normally distributed before FA [13]. The Kaiser–Meyer–Olkin index [76] and the test of sphericity [77] are often used to measure if FA is useful and appropriate for the data. The relevant calculations of FA in this study were calculated by SPSS software (25.0, IBM, Chicago, IL, USA).
3.3. Spectrum–Area Multifractal Model
Based on the fractal theory, Cheng et al. [23] proposed the C–A fractal model, concerning the relationship between the concentration value () and the area (A) enclosed by the contour value ρ:
where A () represents the area enclosed by the contour value ; is the threshold defining contour . a1 and a2 (greater than 0) are fractal dimensions that can be estimated from slopes of straight lines in the log–log plot of A () versus . ∝ denotes proportionality [78].
Based on the argument that geochemical patterns in the spatial domain could be considered as superimposed signals of different frequencies, Cheng et al. [50] proposed the S–A model based on the C–A model to separate geochemical anomalies from the background levels and characterize the spectral energy density–area relationship in the frequency domain:
where S represents the spectral energy density, and A (≥S) symbolizes the area of the wavenumber with a threshold above S. β denotes the anisotropic scaling exponent, d represents the degree of overall concentration, while ∝ denotes proportionality [78].
According to the anisotropic scale characteristics in the frequency domain, the S–A multifractal model decomposes the spatial model into several components. After lots of practice, it has proved to be useful for breaking down complex geochemical patterns: e.g., [7,40,79,80,81].
4. Results and Discussion
4.1. Statistical Analysis
In this study, a descriptive statistical analysis was performed on the concentrations of 15 significant elements from 369 samples. The statistical parameters (mean and standard deviation) and mean background values of these elements in the upper continental crust of the South Qinling unit [82] are given in Table 2. The coefficient of variation (CV) is used to represent the dispersion of data. The mean of Au content is 1232.14 ng/g, which is much higher than the background values in the upper continental crust of the South Qingling unit (1.10 ng/g) [82]. The CV values for Au, Ag, Sb, Bi, Mo, and Hg are over five, indicating the inhomogeneous distribution of these elements, meaning that they were more likely to be concentrated proximally to ore.

Table 2.
Geochemical characteristics of trace elements in different lithologies in Laowan gold deposit (the units of the elements are ppm except Au and Hg).
The Q–Q plot is a powerful tool for visualizing element distributions [83]. The Q–Q plots (Figure 6) indicated that the geochemical data processed by log-transformation did not obey normal distribution. The data parallel to the line represents the dominant background value in the geochemical data. In contrast, the data at both ends represent a relatively small number of anomalies, which are of great significance.
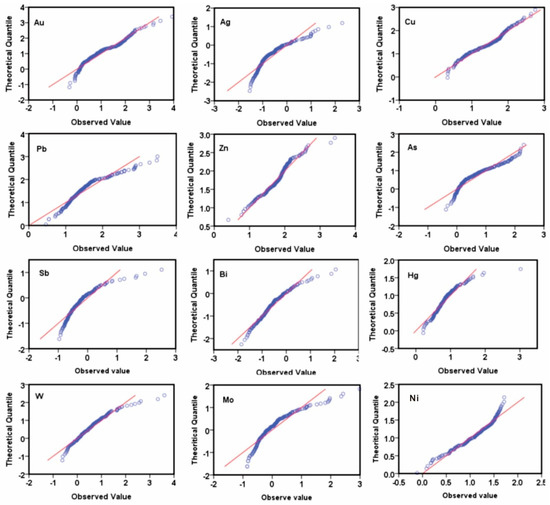
Figure 6.
Q–Q plots of log-transformed sectional primary elements data.
This study also took the contents of selected elements in different lithologies into account to consider the effect of hosting rocks. Due to the limited number of samples of metagabbro and granite porphyry dykes, and the complexity and diversity of the genesis of quartz veins, their statistical significances were limited, so are not discussed in this study.
As shown in Table 2, Au content was highest in the fracture zone, followed by mica-quartz schist in the Guishan Formation. Ag and Sb had the highest contents in marble, followed by the fracture zone. As content in mica-quartz schist was the highest, followed by the fracture zone. The contents of siderophile elements such as Cu, Co, and Ni were highest in the fracture zone, followed by the Guishan Formation, which reflects that the basement rock of the strata was basic rock. In summary, the fracture zone had good potential for gold mineralization, and the Guishan Formation was mean ore-bearing stratum.
4.2. Elemental Association
Some elements can be a guide to discover mineral deposits because they are spatially associated with specific types of mineralization. In contrast, the remaining elements might reflect other geological processes or events unrelated to mineralization [9]. An R-type factor analysis was used to determine the ore-forming elemental association. The principal component extraction [84] was used to extract uncorrelated components, which represented most of the variability carried on the data variables. According to the varimax rotation technique [85], the factor loadings matrix was rotated orthogonally to minimize the number of high-load variables on each factor. All variables in the factor analysis were used to construct a scatter plot (Figure 7). Four variables with eigenvalues greater than 1.0 were selected, providing a cumulative explained variance of 75.91%.
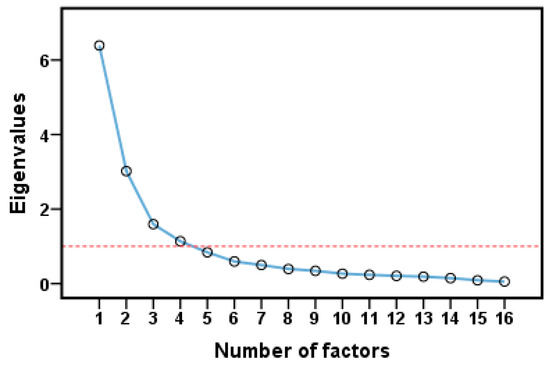
Figure 7.
Scree plot of the factor analysis (after varimax rotation).
The results of the FA are shown in Table 3. Communalities represent the common factor variance extracted from each element, with a higher value indicating a better explanation of variables. According to the results, Factor 1 (F1) was dominated by Cu, Co, Ni, V, and Fe; Factor 2 (F2) was dominated by Au, Ag, Cu, As, Sb, and S; Factor 3 (F3) was dominated by Bi, F, Mo, and Sn; and Factor 4 was dominated by Pb and Zn.

Table 3.
Loadings of factor analysis carried out with all 16 analyzed elements (after varimax rotation).
Group F1 consisted of siderophile elements that occur mainly in minerals, such as olivine and pyroxene, and are related to basic and ultrabasic rocks representing the Guishan Formation. Group F2 represented the main metallogenic element association. These elements mainly precipitate in mid–low temperature environments and are a sulphophile element, which corresponds to the mineral assemblage in the quartz–polymetallic sulfide stage. Therefore, this factor represents the main metallogenic stage. Cu was present both in group F1 and group F2 because it has both siderophile and sulphophile properties. Group F3 indicated high-temperature hydrothermal metasomatism, which is closely related to crust source granite. Group F4 may represent Pb–Zn mineralization or the primary halo near the gold ore bodies.
As illustrated in the factor score maps (Figure 8), the areas with the highest scores in group F1 were widely distributed between the Songpa and Laowan faults, and highly consistent with the distribution areas of the Guishan Formation. The factor scores of group F1 were also high in the local area, where the Guishan Formation was in contact with the Laowan granite. Areas with high factor scores in group F2, which was the main ore-forming element association, were mainly distributed in the middle of the Shangshanghe and Laowan ore sections, with other high anomalies distributed around granite porphyry dykes. On the other hand, the factor scores in group F2 in the area near the Laowan granite and the Southwest and Northeast of the study area were lower. The highest scores from group F3 were mainly around granite porphyry dykes. There were also low anomalies around the Laowan granite. The covered area of the Guishan Formation in the central part of the study area had low anomalies with small local areas, which may represent undiscovered concealed intrusions. Areas with high factor scores in group F4 were mainly distributed in areas around granite porphyry dykes and the Central area of the junction between the Shangshanghe and Laowan ore sections, coinciding with the anomalous areas in group F2 and F3.
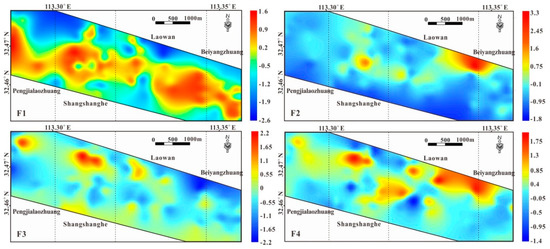
Figure 8.
Factor score in the study area (F1: Cu–Co–Ni–V–Fe; F2: Au–Ag–Cu–As–Sb–S; F3: Bi–F–Mo–Sn; F4: Pb–Zn).
The distribution correlations of the factor score anomalies were overlapping or neighboring. The zonation of ore elements was around granite porphyry dykes, suggesting that ore-forming fluids may have emanated from these intrusions, which also provided thermodynamic. The distribution of anomalies in group F2 and the main metallogenic element showed an obvious overlap, indicating that the Guishan Formation was the main ore-bearing formation. The areas where anomalies from group F4 overlapped with those of the main ore-forming elements may have been the primary halo around the gold ore bodies, while the areas where the anomalies of group F4 overlapped with granite porphyry dykes may represent another polymetallic mineralization.
Overall, the distribution of anomalies across the four factors was generally controlled by regional ductile shear structures. The neighboring characteristics of the distributions displayed a zonation pattern that approximated Bi–Mo and Pb–Zn in the middle and distal Au–Ag. The gold mineralization system in a low-temperature environment was furthest from the magmatic activity center, while the Bi–Mo association in a high-temperature environment was close to the magmatic activity center, and the Pb–Zn mineralization system was in the middle of the two, showing superposition characteristics. This zonation feature was consistent with the zonation rule of metallic elements in a magmatic–hydrothermal liquid system related to intrusion [86]—that is, in a high-temperature system, Bi–Mo was concentrated closest to the center of the magmatic–hydrothermal metallogenic system, while gold, silver, and other elements were relatively far away from the magmatic–hydrothermal metallogenic system.
Based on the distribution of each factor and the metallogenic model, we inferred that ore-forming fluid might emanate from granite porphyry dykes, migrate along with the ductile shear structure in a NW–SE direction under the activation of Yanshanian magmatic activity, and, finally, precipitate in the secondary fault. From the center of the magmatic activity to the periphery, the element associations in the study area showed zonation patterns of Mo → Pb–Zn → Au–Ag. Combined with the age of the deposit (138 Ma) [55] versus the intrusions (127–139 Ma) [58,67] with the spatial distribution of element associations, the gold and polymetallic metallogenesis of the Laowan deposit had close spatial and temporal relationships with Yanshanian magmatism (especially the granite porphyry), which supported the magmatic–hydrothermal origin of the Laowan deposit. This study not only verified the previous views on the source of ore-formation and the genetic mechanism of the Laowan deposit, but also could be used as an independent statistical validation of the element zonation model proposed by the predecessors [58].
4.3. S–A Multifractal Analysis
The S–A fractal method was applied to decompose the mixed geochemical populations and identify geochemical anomalies in the first factor scores. Before multifractal analysis, the interpolation of point data to raster maps was used. ArcGIS software developed by Esri was used to set the search radius to 20 points, then, the inverse distance weighted (IDW) method was used for interpolation, and the raster data after interpolation was obtained. GeoFractal software (2.0, State Key Laboratory of Geological Processes and Mineral Resources, Wuhan, China) [87] was used for S–A fractal analysis.
Fourier transform was used to transform the spatial distribution pattern of the F1 factor scores into the power spectrum density and area, and the least-squares method was used to fit three lines (Figure 9). Two thresholds (0.365 and 6.897) were selected, and the three lines produced represented noise, giving values of y = −0.09x + 5.22 with R2 = 0.81, an anomaly of y = −0.44x + 5.36 with R2 = 0.99, and a background of y = −0.63x + 6.04 with R2 = 1.00, from left to right (Figure 9).
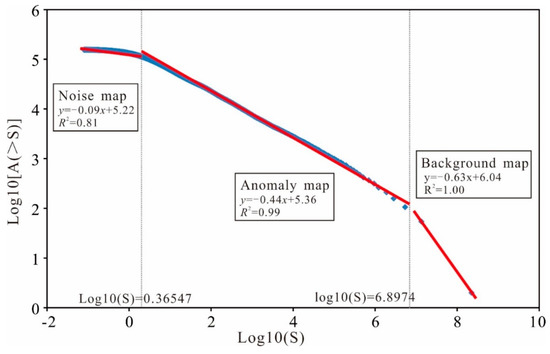
Figure 9.
Log–log plot of spectrum density (S) versus the area with greater than or equal to S.
The anomaly and background separated by the above method are shown in Figure 10, and the drill holes that reached the ore bodies are projected on the figure (shown as black triangles). As seen in Figure 10, the background value was not evenly distributed in the study area. These drill holes were not only distributed in the areas with high background values, but also in areas with low background values, indicating that the traditional methods of identifying geochemical anomalies, such as calculating the mean and standard deviation, are not effective when the background value distribution is not uniform. The areas with high background values were mostly related to the Guishan Formation and granite porphyry dykes, suggesting that they may provide the metal source for the formation of the ore deposits. It can also be seen from the anomaly map in Figure 10 that the morphology of the anomalies was controlled by the ductile shear zone. The anomaly map of the S–A analysis provided a tool for heightening weak geochemical anomalies. Most drill holes with encountered ore were distributed in or near the areas with high anomaly values, and a little deviation may have been caused by the angles of the drill holes, indicating that this S–A fractal model had an excellent predictive effect in this study area and presented valid targets for further exploration. Combined with the viewpoints above, few prospecting targets were divided into the periphery of the Shangshanghe and Laowan ore sections, which are the main mining areas (Figure 11).
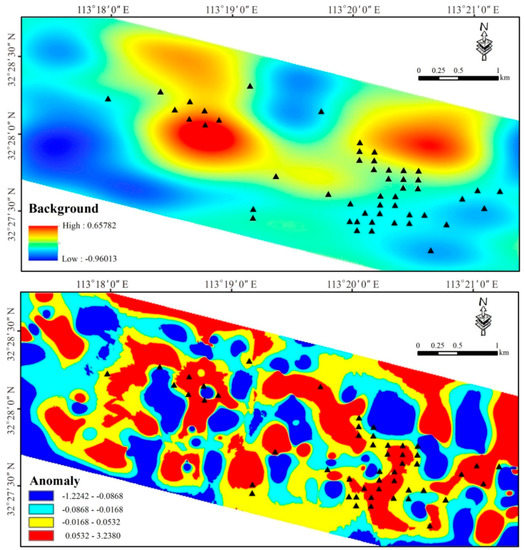
Figure 10.
The decomposed map of major ore-forming elements (F2: Au–Ag–Cu–As–Sb–S) for background and anomaly (black triangle presenting drillings with ore encountered.
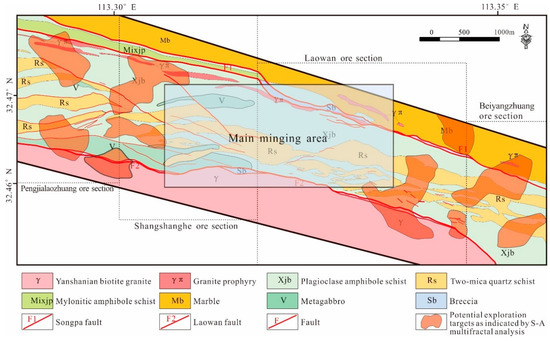
Figure 11.
Predictive mapping of potential exploration targets, as indicated by the anomaly map of S–A multifractal analysis.
5. Conclusions
In this study, the Laowan gold deposit in the Qinling-Dabie metallogenic belt illustrated how the geochemical exploration method could be applied to identify the geochemical anomalies associated with gold mineralization. Factor analysis was used to reveal the Au polymetallic association, which can be used as direct ore-prospecting criteria. We established a resource to potentially evaluate the model at the periphery of the mining area using S–A multifractal analysis. The following conclusions were obtained:
(1) The factor analysis model in this study revealed that the gold polymetallic elements of the Laowan gold deposit was Au, Ag, Cu, As, Sb, and S. The distribution of factors also portrayed the metallogenic patterns that the ore-forming fluids were mainly from granite porphyry dykes and the Guishan Formation, and migrated along the NW–SE striking faults under the activation and re-melting of Yanshanian magma;
(2) From the center of magmatic activity, which is granite porphyry dykes, to the periphery, the element associations in the study area displayed Bi–Mo → Pb–Zn → Au–Ag. This zonation characteristic suggests that the Laowan gold deposit is magmatic–hydrothermal deposit and more likely related to Yanshanian magmatism;
(3) The hybrid method combining FA and S–A fractal modelling is a useful tool for identifying geochemical anomalies. The former is used to integrate multi-element concentration values, and the latter is applied to decompose mixed geochemical patterns in a complex geological setting.
Author Contributions
Conceptualization, S.C. and R.W.; methodology, R.W. and J.Z.; software, R.W.; validation, S.C., R.W. and J.C. (Jianli Chen); formal analysis, J.C. (Jianli Chen); investigation, S.C., R.W. and J.C. (Jianli Chen); resources, S.C. and J.C. (Jinduo Chen); data curation, S.C.; writing—original draft preparation, R.W.; writing—review and editing, S.C. and J.Z.; visualization, J.Z.; supervision, S.C. and J.C. (Jinduo Chen); project administration, S.C. and J.C. (Jinduo Chen); funding acquisition, S.C. and J.C. (Jinduo Chen). All authors have read and agreed to the published version of the manuscript.
Funding
This work was supported by the Geological Exploration Foundation of Henan province (China) (Grant. No. 2015-258).
Acknowledgments
We thank the first geological exploration institute of geology and mineral exploration and development bureau of Henan province (China) to help us do the sampling work and give us support. This work was supported by the Geological Exploration Foundation of Henan province (China) (Grant. No. 2015-258). We would also like to thank Abd Alwahed Dagestani from Business School of Central South University for helping to improve an earlier version of our manuscript.
Conflicts of Interest
The authors declare no conflict of interest.
References
- Clarke, D.S.; Govett, G.J.S. Southwest Pacific epithermal gold: A rock-geochemistry perspective. J. Geochem. Explor. 1990, 35, 225–240. [Google Scholar] [CrossRef]
- Gray, J.E.; Goldfarb, R.J.; Detra, D.E.; Slaughter, K.E. Geochemistry and exploration criteria for epithermal cinnabar and stibnite vein deposits in the Kuskokwim River region, southwestern Alaska. J. Geochem. Explor. 1991, 41, 363–386. [Google Scholar] [CrossRef]
- Hronsky, J.M.A.; Groves, D.I. Science of targeting: Definition, strategies, targeting and performance measurement. Aust. J. Earth Sci. 2008, 55, 3–12. [Google Scholar] [CrossRef]
- Carranza, E.J.M.; Sadeghi, M. Predictive mapping of prospectivity and quantitative estimation of undiscovered VMS deposits in Skellefte district (Sweden). Ore. Geol. Rev. 2010, 38, 219–241. [Google Scholar] [CrossRef]
- Carranza, E.J.M. Analysis and mapping of geochemical anomalies using logratio-transformed stream sediment data with censored values. J. Geochem. Explor. 2011, 110, 167–185. [Google Scholar] [CrossRef]
- Pazand, K.; Hezarkhani, A.; Ataei, M.; Ghanbari, Y. Application of multifractal modeling technique in systematic geochemical stream sediment survey to identify copper anomalies: A case study from Ahar, Azarbaijan, Northwest Iran. Chem. der Erde Geochem. 2011, 71, 397–402. [Google Scholar] [CrossRef]
- Zuo, R. Identifying geochemical anomalies associated with Cu and Pb–Zn skarn mineralization using principal component analysis and spectrum–area fractal modeling in the Gangdese Belt, Tibet (China). J. Geochem. Explor. 2011, 111, 13–22. [Google Scholar] [CrossRef]
- Cheng, Q. Singularity theory and methods for mapping geochemical anomalies caused by buried sources and for predicting undiscovered mineral deposits in covered areas. J. Geochem. Explor. 2012, 122, 55–70. [Google Scholar] [CrossRef]
- Zuo, R.; Wang, J.; Chen, G.; Yang, M. Identification of weak anomalies: A multifractal perspective. J. Geochem. Explor. 2015, 148, 12–24. [Google Scholar] [CrossRef]
- Parsa, M.; Maghsoudi, A.; Yousefi, M.; Sadeghi, M. Recognition of significant multi-element geochemical signatures of porphyry Cu deposits in Noghdouz area, NW Iran. J. Geochem. Explor. 2016, 165, 111–124. [Google Scholar] [CrossRef]
- Zuo, R. Selection of an elemental association related to mineralization using spatial analysis. J. Geochem. Explor. 2018, 184, 150–157. [Google Scholar] [CrossRef]
- Filzmoser, P.; Hron, K.; Reimann, C.; Garrett, R. Robust factor analysis for compositional data. Comput. Geosci. UK 2009, 35, 1854–1861. [Google Scholar] [CrossRef]
- Reimann, C.; Filzmoser, P.; Garrett, R.G. Factor analysis applied to regional geochemical data: Problems and possibilities. Appl. Geochem. 2002, 17, 185–206. [Google Scholar] [CrossRef]
- Kumru, M.N.; Bakac, M. R-mode factor analysis applied to the distribution of elements in soils from the Aydın basin, Turkey. J. Geochem. Explor. 2003, 77, 81–91. [Google Scholar] [CrossRef]
- El-Makky, A.M. Statistical analyses of La, Ce, Nd, Y, Nb, Ti, P, and Zr in bedrocks and their significance in geochemical exploration at the Um Garayat Gold mine area, Eastern Desert, Egypt. Nat. Resour. Res. 2011, 20, 157–176. [Google Scholar] [CrossRef]
- Sadeghi, M.; Billay, A.; Carranza, E.J.M. Analysis and mapping of soil geochemical anomalies: Implications for bedrock mapping and gold exploration in Giyani area, South Africa. J. Geochem. Explor. 2015, 154, 180–193. [Google Scholar] [CrossRef]
- He, J.; Yao, S.; Zhang, Z.; You, G. Complexity and productivity differentiation models of metallogenic indicator elements in rocks and supergene media around Daijiazhuang Pb–Zn deposit in Dangchang County, Gansu Province. Nat. Resour. Res. 2013, 22, 19–36. [Google Scholar] [CrossRef]
- He, F.; Wang, Z.; Fang, C.; Wang, L.; Geng, X. Identification and assessment of Sn-polymetallic prospects in the Gejiu western district, Yunnan (China). J. Geochem. Explor. 2014, 145, 106–113. [Google Scholar] [CrossRef]
- Levitski, A.F.B.B. “Dipole” CHIM:Concept and application. J. Geochem. Explor. 1996, 57, 101–114. [Google Scholar] [CrossRef]
- Bajc, A.F. A comparative analysis of enzyme leach and mobile metal ion selective extractions; case studies from glaciated terrain, northern Ontario. J. Geochem. Explor. 1998, 1–3, 113–148. [Google Scholar] [CrossRef]
- Singer, D.A.; Kouda, R. Some Simple Guides to Finding Useful Information in Exploration Geochemical Data. Nat. Resour. Res. 2001, 2, 137–147. [Google Scholar] [CrossRef]
- Williams, T.M.; Gunn, A.G. Application of enzyme leach soil analysis for epithermal gold exploration in the Andes of Ecuador. Appl. Geochem. 2002, 17, 367–385. [Google Scholar] [CrossRef]
- Cheng, Q.; Agterberg, F.P.; Ballantyne, S.B. The separation of geochemical anomalies from background by fractal methods. J. Geochem. Explor. 1994, 51, 109–130. [Google Scholar] [CrossRef]
- Grunsky, E.C.; Smee, B.W. The differentiation of soil types and mineralization from multi-element geochemistry using multivariate methods and digital topography. J. Geochem. Explor. 1999, 67, 287–299. [Google Scholar] [CrossRef]
- Harris, J.R.; Wilkinson, L.; Grunsky, E.; Heather, K.; Ayer, J. Techniques for analysis and visualization of lithogeochemical data with applications to the Swayze greenstone belt, Ontario. J. Geochem. Explor. 1999, 67, 301–334. [Google Scholar] [CrossRef]
- Zuo, R.; Xia, Q.; Wang, H. Compositional data analysis in the study of integrated geochemical anomalies associated with mineralization. Appl. Geochem. 2013, 28, 202–211. [Google Scholar] [CrossRef]
- Sinclair, A.J. Selection of threshold values in geochemical data using probability graphs. J. Geochem. Explor. 1974, 3, 129–149. [Google Scholar] [CrossRef]
- Miesch, A.T. Estimation of the geochemical threshold and its statistical significance. J. Geochem. Explor. 1981, 16, 49–76. [Google Scholar] [CrossRef]
- Stanley, C.R.; Sinclair, A.J. Comparison of probability plots and the gap statistic in the selection of thresholds for exploration geochemistry data. J. Geochem. Explor. 1989, 32, 355–357. [Google Scholar] [CrossRef]
- Kürzl, H. Exploratory data analysis: Recent advances for the interpretation of geochemical data. J. Geochem. Explor. 1988, 30, 309–322. [Google Scholar] [CrossRef]
- Bounessah, M.; Atkin, B.P. An application of exploratory data analysis (EDA) as a robust non-parametric technique for geochemical mapping in a semi-arid climate. Appl. Geochem. 2003, 18, 1185–1195. [Google Scholar] [CrossRef]
- Reimann, C. Geochemical mapping: Technique or art? Geochem. Explor. Environ. Anal. 2005, 5, 359–370. [Google Scholar] [CrossRef]
- Chiprés, J.A.; Castro-Larragoitia, J.; Monroy, M.G. Exploratory and spatial data analysis (EDA-SDA) for determining regional background levels and anomalies of potentially toxic elements in soils from Catorce-Matehuala, Mexico. Appl. Geochem. 2009, 24, 1579–1589. [Google Scholar] [CrossRef]
- Mandelbrot, B. How Long Is the Coast of Britain? Statistical Self-Similarity and Fractional Dimension. Science 1967, 156, 636–638. [Google Scholar] [CrossRef] [PubMed]
- Bölviken, B.; Stokke, P.R.; Feder, J.; Jössang, T. The fractal nature of geochemical landscapes. J. Geochem. Explor. 1992, 43, 91–109. [Google Scholar] [CrossRef]
- Rantitsch, G. The fractal properties of geochemical landscapes as an indicator of weathering and transport processes within the Eastern Alps. J. Geochem. Explor. 2001, 73, 27–42. [Google Scholar] [CrossRef]
- Cheng, Q. Mapping singularities with stream sediment geochemical data for prediction of undiscovered mineral deposits in Gejiu, Yunnan Province, China. Ore. Geol. Rev. 2007, 32, 314–324. [Google Scholar] [CrossRef]
- Zuo, R.; Cheng, Q.; Agterberg, F.P.; Xia, Q. Application of singularity mapping technique to identify local anomalies using stream sediment geochemical data, a case study from Gangdese, Tibet, western China. J. Geochem. Explor. 2009, 101, 225–235. [Google Scholar] [CrossRef]
- Afzal, P.; Khakzad, A.; Moarefvand, P.; Omran, N.R.; Esfandiari, B.; Alghalandis, Y.F. Geochemical anomaly separation by multifractal modeling in Kahang (Gor Gor) porphyry system, Central Iran. J. Geochem. Explor. 2010, 104, 34–46. [Google Scholar] [CrossRef]
- Cheng, Q.; Xia, Q.; Li, W.; Zhang, S.; Chen, Z.; Zuo, R.; Wang, W. Density/area power-law models for separating multi-scale anomalies of ore and toxic elements in stream sediments in Gejiu mineral district, Yunnan Province, China. Biogeosciences 2010, 7, 3019–3025. [Google Scholar] [CrossRef]
- Yousefi, M.; Carranza, E.J.M. Prediction-area (P-A) plot and C-A fractal analysis to classify and evaluate evidential maps for mineral prospectivity modeling. Comput. Geosci. UK 2015, 79, 69–81. [Google Scholar] [CrossRef]
- Zhao, J.; Zuo, R.; Chen, S.; Kreuzer, O.P. Application of the tectono-geochemistry method to mineral prospectivity mapping: A case study of the Gaosong tin-polymetallic deposit, Gejiu district, SW China. Ore. Geol. Rev. 2015, 71, 719–734. [Google Scholar] [CrossRef]
- Parsa, M.; Maghsoudi, A.; Carranza, E.J.M.; Yousefi, M. Enhancement and mapping of weak multivariate stream sediment geochemical anomalies in Ahar Area, NW Iran. Nat. Resour. Res. 2017, 26, 443–455. [Google Scholar] [CrossRef]
- Xiong, Y.; Zuo, R.; Wang, K.; Wang, J. Identification of geochemical anomalies via local RX anomaly detector. J. Geochem. Explor. 2018, 189, 64–71. [Google Scholar] [CrossRef]
- Wang, Z.; Dong, Y.; Zuo, R. Mapping geochemical anomalies related to Fe–polymetallic mineralization using the maximum margin metric learning method. Ore. Geol. Rev. 2019, 107, 258–265. [Google Scholar] [CrossRef]
- Zhao, J.; Chen, S.; Zuo, R.; Zhou, M. Controls on and prospectivity mapping of volcanic-type uranium mineralization in the Pucheng district, NW Fujian, China. Ore. Geol. Rev. 2019, 112, 103028. [Google Scholar] [CrossRef]
- Zhao, J.; Chen, S.; Zuo, R. Identifying geochemical anomalies associated with Au-Cu mineralization using multifractal and artificial neural network models in the Ningqiang district, Shaanxi, China. J. Geochem. Explor. 2016, 164, 54–64. [Google Scholar] [CrossRef]
- Reimann, C.; Filzmoser, P. Normal and lognormal data distribution in geochemistry: Death of a myth. Consequences for the statistical treatment of geochemical and environmental data. Environ. Geol. 2000, 39, 1001–1014. [Google Scholar] [CrossRef]
- Agterberg, F.P. Multifractal Simulation of Geochemical Map Patterns; Springer: New York, NY, USA, 2001; pp. 327–346. [Google Scholar]
- Cheng, Q.; Xu, Y.; Grunsky, E. Integrated Spatial and Spectrum Method for Geochemical Anomaly Separation. Nat. Resour. Res. 2000, 9, 43–52. [Google Scholar] [CrossRef]
- Li, C.; Ma, T.; Shi, J. Application of a fractal method relating concentrations and distances for separation of geochemical anomalies from background. J. Geochem. Explor. 2003, 77, 167–175. [Google Scholar] [CrossRef]
- Afzal, P.; Alghalandis, Y.F.; Khakzad, A.; Moarefvand, P.; Omran, N.R. Delineation of mineralization zones in porphyry Cu deposits by fractal concentration–volume modeling. J. Geochem. Explor. 2011, 108, 220–232. [Google Scholar] [CrossRef]
- Xie, Q.; Xu, X.; Yue, S. Isochron age of the Laowan gold deposit and Laowan granite, Tongbai region, Henan Province and its implications. Geol. J. China Univ. 2000, 25, 546–553. [Google Scholar]
- Xie, Q.; Xu, X.; Yue, S.; Pan, C.; Li, Y. Metallogenisis of Laowan gold deposit from Tongbai, Henan Province. Miner. Depos. 2002, 21, 47–52. [Google Scholar]
- Zhang, G.; Li, H.; Wang, C. 40Ar-39Ar age of muscovite from the Laowan gold deposit in Henan and its significance. Acta Geosci. Sin. 2008, 25, 45–50. [Google Scholar]
- Chen, J.; Sun, B.B.; Li, P.; Pei, M.; Ren, Q. The properties of ore-forming fluids and isotope geochemical tracing of the Laowan gold deposit, Henan Province. Acta Petrol. Min. 2017, 36, 713–724. [Google Scholar]
- Pan, C.; Yue, S. Research on the forming era of Laowan gold deposit in Henan Province and its lead isotope. J. Hefei Univ. Technol. 2002, 25, 9–13. [Google Scholar]
- Yang, M.; Fu, J.; Ren, A. Recognition of Yanshanian magmatic-hydrothermal gold and polymetallic gold mineralization in the Laowan gold metallogenic belt, Tongbai Mountains: New evidence from structural controls, geochronology and geochemistry. Ore. Geol. Rev. 2015, 69, 58–72. [Google Scholar] [CrossRef]
- Zhang, G.; Meng, Q.; Lai, S. Tectonics and structure of Qinling orogenic belt. Sci. China Chem. 1995, 38, 1379–1394. [Google Scholar]
- Chen, Y.J.; Pirajno, F.; Qi, J.P.; Jing, L.; Wang, H.H. Ore geology, fluid geochemistry and genesis of the Shanggong gold deposit, eastern Qinling Orogen, China. Resour. Geol. 2010, 56, 99–116. [Google Scholar] [CrossRef]
- Deng, J.; Yang, L.; Gao, B.; Sun, Z.; Guo, C.; Wang, Q.; Wang, J. Fluid Evolution and Metallogenic Dynamics during Tectonic Regime Transition: Example from the Jiapigou Gold Belt in Northeast China. Resour. Geol. 2010, 59, 140–152. [Google Scholar] [CrossRef]
- Chen, Y.; Wang, Y. Fluid inclusion study of the Tangjiaping Mo deposit, Dabie Shan, Henan Province: Implications for the nature of the porphyry systems of post-collisional tectonic settings. Int. Geol. Rev. 2011, 53, 635–655. [Google Scholar] [CrossRef]
- Deng, J.; Wang, Q.; Xiao, C.; Yang, L.; Liu, H.; Gong, Q.; Zhang, J. Tectonic-magmatic-metallogenic system, Tongling ore cluster region, Anhui Province, China. Int. Geol. Rev. 2011, 53, 449–476. [Google Scholar] [CrossRef]
- Mao, J.; Xie, G.; Zhang, Z.; Li, X.; Wang, Y.; Zhang, C.; Li, Y. Mesozoic large-scale metallogenic pulses in North China and corresponding geodynamic settings. Acta Petrol. Sin. 2005, 21, 169–188. [Google Scholar]
- Liu, W.; Wang, G. Mesozoic thrust and nape tectonic in northern Huaiyang Region. Geosci. (J. Grad. Sch. China Univ. Geosci.) 1999, 13, 143–149. [Google Scholar]
- Song, C.Z.; Zhang, G.W.; Ren, S.; Li, J.; Huang, W. The research on deformation features of some structural zones in the Qinling-Dabieshan orogenic belt. J. Northwest Univ. (Nat. Sci. Ed.) 2009, 39, 368–380. [Google Scholar]
- Chen, L.; Dai, L.; Wang, T.; Luo, P.; Xia, G. Geochemical characteristics and genesis of the Laowan gold deposit in Henan Province. Geoscience 2009, 23, 277–284. [Google Scholar]
- Liu, Y.F.; Jiang, S.H.; Fang, D.H.; Liu, Y. Zircon SHRIMP U-Pb dating of Laowan granite in Tongbai area, Henan Province, and its geological implications. Acta Petrol. Mineral. 2008, 27, 519–523. [Google Scholar]
- Tripathi, V.S. Factor analysis in geochemical exploration. J. Geochem. Explor. 1979, 11, 263–275. [Google Scholar] [CrossRef]
- Basilevsky, A.T. Statistical Factor Analysis and Related Methods: Theory and Applications; John Wiley & Sons: New York, NY, USA, 1994; p. 737. [Google Scholar]
- Johnson, R.A.; Wichern, D.W. Applied Multivariate Statistical Analysis; Prentice-Hall: Upper Saddle River, NJ, USA; London, UK, 2007; Volume 5, p. 816. [Google Scholar]
- Dong, Q.; Chen, J.; Tang, Y. Application of R type factor analysis in mineralization prognosis: By an example of Huangbuling gold deposit, Shandong Province. Geol. Prospect. 2008, 44, 64–68. [Google Scholar]
- Van Helvoort, P.J.; Filzmoser, P.; van Gaans, P.F. Sequential Factor Analysis as a new approach to multivariate analysis of heterogeneous geochemical datasets: An application to a bulk chemical characterization of fluvial deposits (Rhine-Meuse delta, The Netherlands). Appl. Geochem. 2005, 20, 2233–2251. [Google Scholar] [CrossRef]
- Ijmker, J.; Stauch, G.; Kai, H.; Diekmann, B.; Dietze, E.; Opitz, S.; Wünnemann, B.; Lehmkuhl, F. Environmental conditions in the Donggi Cona lake catchment, NE Tibetan Plateau, based on factor analysis of geochemical data. J. Asian Earth Sci. 2012, 44, 176–188. [Google Scholar] [CrossRef]
- Li, T.; Xia, Q.; Chang, L.; Wang, X.; Liu, Z.; Wang, S. Deposit density of tungsten polymetallic deposits in the eastern Nanling metallogenic belt, China. Ore. Geol. Rev. 2018, 94, 73–92. [Google Scholar] [CrossRef]
- Kaiser, H.F. An index of factorial simplicity. Psychometrika 1974, 39, 31–36. [Google Scholar] [CrossRef]
- Bartlett, M.S. Tests of Significance in Factor Analysis. Br. J. Psychol. 1950, 3, 77–85. [Google Scholar] [CrossRef]
- Zuo, R.; Xia, Q.; Zhang, D. A comparison study of the C-A and S-A models with singularity analysis to identify geochemical anomalies in covered areas. Appl. Geochem. 2013, 33, 165–172. [Google Scholar] [CrossRef]
- Zuo, R.; Xia, Q. Application fractal and multifractal methods to mapping prospectivity for metamorphosed sedimentary iron deposits using stream sediment geochemical data in eastern Hebei province, China. Geochmica Cosmochim. Acta 2009, 73, 827–833. [Google Scholar]
- Zuo, R.; Carranza, E.J.M.; Cheng, Q. Fractal/multifractal modelling of geochemical exploration data. J. Geochem. Explor. 2012, 122, 1–3. [Google Scholar] [CrossRef]
- Parsa, M.; Maghsoudi, A.; Yousefi, M.; Carranza, E.J.M. Multifractal interpolation and spectrum–area fractal modeling of stream sediment geochemical data: Implications for mapping exploration targets. J. Afr. Earth Sci. 2017, 128, 5–15. [Google Scholar] [CrossRef]
- Gao, S.; Luo, T.C.; Zhang, B.R.; Zhang, H.F.; Han, Y.; Zhao, Z.D.; Hu, Y.K. Chemical composition of the continental crust as revealed by studies in East China. Geochim. Cosmochim. Acta 1998, 62, 1959–1975. [Google Scholar] [CrossRef]
- Cheng, Q. Spatial and scaling modelling for geochemical anomaly separation. J. Geochem. Explor. 1999, 65, 175–194. [Google Scholar] [CrossRef]
- Kung, S.Y.; Diamantaras, K. A Neural Network Learning Algorithm for Adaptive Principal Component Extraction (APEX). In Proceedings of the International Conference on Acoustics, Speech, and Signal Processing, Albuquerque, NM, USA, 3–6 April 1990; Volume 2, pp. 861–864. [Google Scholar]
- Hartmann, K.; Wünnemann, B. Hydrological changes and Holocene climate variations in NW China, inferred from lake sediments of Juyanze palaeolake by factor analyses. Quat. Int. 2009, 194, 28–44. [Google Scholar] [CrossRef]
- Mao, J.; Ye, H.; Wang, R.; Dai, J.; Jian, W.; Xiang, J.; Zhou, K.; Meng, F. Mineral deposit model of Mesozoic porphyry Mo and vein-type Pb-Zn-Ag ore deposits in the eastern Qinling, Central China and its implication for prospecting. Geol. Bull. China 2009, 28, 72–79. [Google Scholar]
- Wang, J.; Zuo, R. A MATLAB-based program for processing geochemical data using fractal/multifractal modeling. Earth Sci. Inform. 2015, 8, 937–947. [Google Scholar] [CrossRef]
© 2020 by the authors. Licensee MDPI, Basel, Switzerland. This article is an open access article distributed under the terms and conditions of the Creative Commons Attribution (CC BY) license (http://creativecommons.org/licenses/by/4.0/).