Article

Effect of Cu2+ on the Activation to Muscovite Using Electrochemical Pretreatment

1
School of Resources Engineering, Xi’an University of Architecture and Technology, Xi’an 710055, China
2
Henan Province Key Laboratory of Water Pollution Control and Rehabilitation Technology, Pingdingshan 467036, China
3
Northwest Mining and Geological Exploration Bureau for Nonferrous Metals, Xi’an 710061, China
*
Author to whom correspondence should be addressed.
Minerals 2020, 10(3), 206; https://doi.org/10.3390/min10030206
Submission received: 18 January 2020 / Revised: 21 February 2020 / Accepted: 22 February 2020 / Published: 25 February 2020
(This article belongs to the Special Issue Surface Chemistry in Mineral Processing and Extractive Metallurgy)

Abstract

:
In this study, electrochemistry pretreatment flotation of muscovite was carried out and the flotation behavior and mechanism of muscovite in the system of sodium oleate and Cu2+ion was characterized by solution pH value detection, solution conductivity detection, zeta potential, infrared spectrum and the electronic energy spectrum. The results indicated that under the conditions of muscovite mass of 10.00 g, pulp mass concentration of 13.33%, flotation speed of 1750 r/min, sodium oleate concentration of 9.20 × 10⁻⁴ mol/L and Cu2+ concentration of 6 × 10⁻⁵ mol/L, electrochemical pretreatment of Cu2+ could strengthen the activation of muscovite. Electrochemical pretreatment of Cu2+ solution can inhibit the hydrolysis of copper ions, increase the content of Cu2+ in the solution, strengthen the adsorption of Cu2+ on the muscovite surface, and enhance the electrostatic adsorption of sodium oleate on the muscovite surface, thereby strengthening the physical and chemical adsorption of sodium oleate on the muscovite surface.

1. Introduction

Electrochemical flotation process is a hotpot in the field of mineral processing in recent years. It mainly focuses on the electrochemical pretreatment of flotation medium, pulp or pharmacy, which plays a boosting role in improving the index of flotation concentrate [1,2,3,4].
Ahmadi [5] pointed out that compared with the conventional bioleaching, the electrochemical bioleaching of chalcopyrite flotation concentrate leads to about 35%more copper recovery. It seems that the main reason for increasing copper recovery by electrochemical bioleaching is the control of redox potential between 400 and 425 mV. In this range of potential, the precipitation of ironoxy-hydroxides on the chalcopyrite surface, which act as a diffusion barrier and prevent chalcopyrite dissolution, is significantly reduced. This leads to a higher electrochemical reduction of chalcopyrite andimproves dissolution. Chander and Fuerstenau [6] found that chalcocite could be separated from molybdenite through appropriate choice of the potential of flotation. Meng et al. [7] found that chalcopyrite began to oxidize quickly at a much lower potential than enargite. Enargite was floated well at a potential higher than +0.2 V vs. SCE (Saturated calomel electrode) while chalcopyrite was completely depressed at a potential higher than +0.2 V vs. SCE. Selective flotation revealed that enargite can be successfully removed from chalcopyrite through controlling the pulp potential higher than +0.2 V and lower than +0.55 V vs. SCE. In order to exploit the Northparkes copper and gold mine in New South Wales, Australia, containing arsenopyrite, it is necessary to remove the arsenopyrite existing in the raw ore. Smith et al. [8] separated arsenopyrite from chalcopyrite and bornite by electrochemical control flotation process. At the potential of −150 mV and the pH value of 12, about 52% of the low arsenic and high copper concentrate was obtained, which provided a good way for the removal of arsenic from copper minerals. Nguyen et al [9] carried out a study on the adsorption of electrochemically regulated flotation collectors for arsenopyrite. The results indicated that when the oxidation potential was +516 mV, the mineral recovery reached the highest. This experiment proves that arsenite can be effectively separated by potential regulation. Zhou et al. [10] conducted a flotation test study on a complex lead–zinc ore in Jing Dong Tailings Company of Fujian province. The result showed that in the electrochemical potential controlling flotation processing, using DDTC as collector, the separation potential range of galena and sphalerite with pyrrhotite can be achieved. Flotation circuit of lead–zinc–silver tailing ore was achieved. Li et al. [11] showed that in the presence of Cu2+ ion, and a wide pH range of 2.0 to 12.0, the floatability of pyrrhotite and marmatite was strong, so marmatite could not be separated from pyrrhotite. The technique of electrochemical flotation was used to separate marmatite from pyrrhotite in the presence of Cu2+. Pyrrhotite can be depressed and marmatite be floated through controlling the potential of flotation. Marmatite can be separated from pyrrhotite in the pulp potential range of −0.25 V to 0 V vs. SHE (Normal Hydrogen Electrode) at pH 11.2 solution.
Different studies have found that electrochemical treatment can change the properties of the flotation agent, therefore changing the state of the drug itself, the chemical composition, the pH value and the redox potential value, as well as the proportion of ions, molecules and colloidal particles formed in the flotation agent solution, and thereby affecting the flotation effect of the target mineral [12,13,14]. Conventional flotation methods of mica include the acid cation method, basic anion and cation method and the combined flotation method [15].
However, there are few studies on the application of electrochemical flotation technology for the flotation of muscovite. Some studies have shown that adding a certain amount of Cu2+ can activate the target mineral in the flotation process of muscovite [16]. Based on this finding, the paper takes the flotation behavior of muscovite in the sodium oleate system as the entry point, and reveals the activation mechanism of Cu2+ with electrochemical pretreatment for enhancing the activation of muscovite, which is expected to provide a reference for the actual mineral flotation of muscovite [17].

2. Materials and Methods

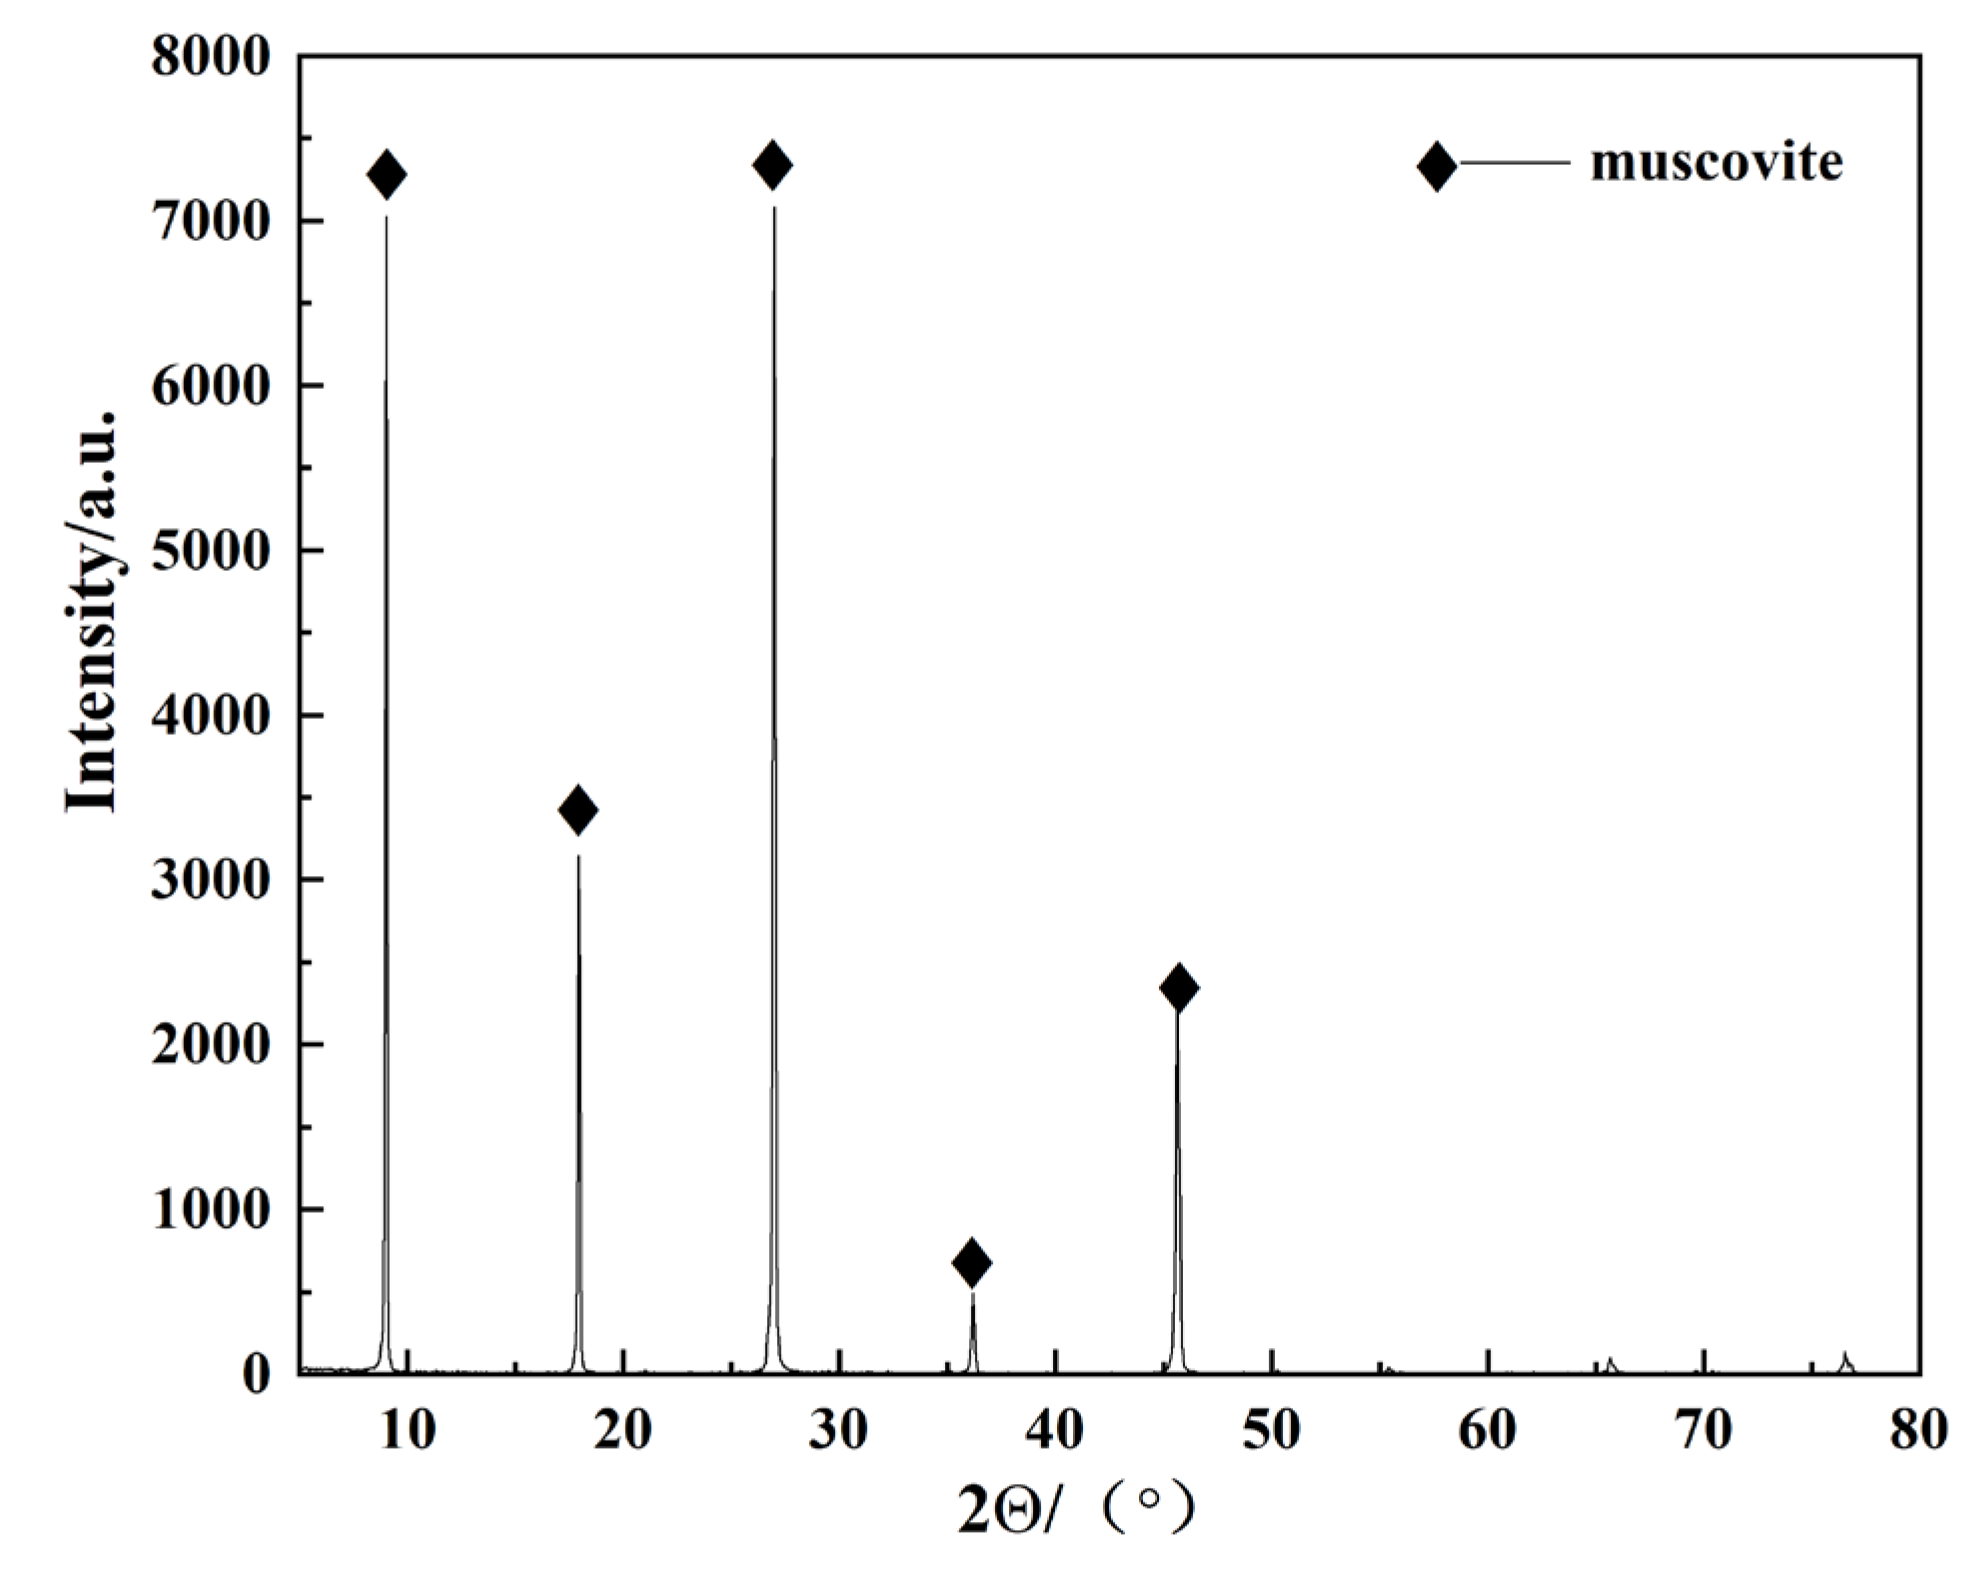
2.1. Materials and Reagents

Coarse concentrate of hand separation in a muscovite mine from Henan province was used in this experiment. First, the original ore sample was processed by the processes of crushing, shaking table purification, screening and acid pickling, and then the acid pickling muscovite sample was washed to neutral by distilled water. Finally, the ore sample was filtered and dried at low temperature for flotation tests. In order to understand the chemical composition and crystallization of the mica ore, the test conducted multi-element analysis and XRD characterization of the samples, and the results are shown in Figure 1 and Table 1.
Figure 1 shows that the muscovite owned high purity and good crystallinity. According to Table 1, the muscovite samples mainly contained elements of K, Si, Al, etc., and the combined Na2O and K2O content was 11.34%; combined with the theoretical content of potassium and sodium, muscovite purity can reach more than 95%.
The sodium hydroxide (NaOH), copper sulfate (CuSO4·5H2O) and sodium oleate (C18H33NaO2) used in this study were all analytically pure. They were purchased from Tianjin BASF reagent plant, Tianjin Guangfu Research Institute and Tianjin Zhiyuan chemical reagent plant, respectively. Distilled water was used in all tests.

2.2. Methods

2.2.1. Electrolysis Experiment

The electrochemical pretreatment of flotation reagent solution was studied by using DC regulated power supply (ka3005p, Shenzhen preeminent Instrument Co., Ltd., Shenzhen, China). which is shown in Figure 2. During the pretreatment, a certain concentration of CuSO4 solution was prepared first, and a certain amount of CuSO4 solution was added into the electrolytic cell. Then, the current and electrolysis time were adjusted, the type of electrode plate was selected and the distance between the plates was fixed, and then the electrode plate and DC voltage were stabilized. The power supply was connected with electrode wire, the switch pressed, and electrolysis started. Its process can be expressed by the following reaction formula:
C u S O 4 C u 2 + + S O 4 2
C u 2 + + H 2 O C u ( O H ) + + H +
C u ( O H ) + + H 2 O C u ( O H ) 2 + H +
C u ( O H ) 2 + H 2 O C u ( O H ) 2 + H +
C u ( O H ) 2 + H 2 O C u ( O H ) 4 2 + H +
When the two plates are made of graphite, the following reactions will take place near the cathode plate and anode plate:
cathodic   reaction : C u 2 + + 2 e = C u
anodic reaction :   2 O H = O 2 + 2 H +
The electrochemical pretreatment conditions of Cu2+ are shown in Table 2.
Finally, the electrolyzed copper sulfate solution wastaken out from the electrolytic cell and placed in a beaker for the subsequent flotation test and related solution property detection.

2.2.2. Micro-Flotation Tests

In the flotation tests, the hanging cell flotation machine FGC(5-35) (Wuhan lock grinding equipment manufacturing Co., Ltd, Wuhan, China) was used, with the rotating speed of 1750 r/min. In each test, the muscovite 10.00 g was placed into the flotation cell, adding appropriate distilled water to adjust the pulp concentration to 13.33%. After stirring 1 min, sodium hydroxide was added to the pulp to achieve the best pH value in 2 min, then the proper amount of the collector and adjustment agent were added after electrochemical pretreatment and mixing the slurry. Finally, the foam products were filtered and dried, and the recovery rate after weighing was calculated. The flotation test flow is shown in Figure 3.

2.2.3. Zeta Potential Characterization

The zeta potential on the muscovite surface was determined with a ZetaSizer 3000 Malvern Instrument (Malvern Instruments, Malvern, UK). The overcrushing samples were ground to less than 5 μm by agate grinding. The suspension was prepared by adding 20 ± 1 mg of muscovite sample to 20 mL of distilled water and adding pH adjusting agent in turn, after electrochemical pretreatment of adjusting agent. The suspension was conditioned for 15 min. Suspension with or without 200 or 400 mg/L of muscovite was placed on a rotating shaker for 30 min. The zeta potential was measured in accordance with the procedures described in the instrument manual. The reported results were the average of at least three full repeats of the experiment.

2.2.4. FTIR Spectroscopy Characterization

FTIR spectra of muscovite were recorded to examine the functional groups of muscovite before and after adsorbing electrochemical regulator. The experimental samples of 2.00 g were added into the 100 mL centrifuge tube with 40 mL of liquid, where the concentration of electrochemical regulator was 8000 mg/L (400 mg/L × 20 times). Then, the samples were shaken at a centrifugal speed of 100 rpm for 30 min. FTIR spectra were recorded over the region of 600–4000 cm−1. The samples were examined in KBr pellets (3 mg/300 mg KBr). All samples were analyzed with a Lumex FTIR-08 spectrophotometer [18].

2.2.5. XPS Measurements

The chemical compositions of the muscovite surfaces were determined by XPS on a Thermo Scientific ESCALAB 250Xi, using an Al Kα X-ray source operated at 200 W with 20 eV pass energy. The sample preparation method was the same as that of the FTIR spectra experiment, with the vacuum pressure ranging from 10−9 to 10−8 Torr and a take-off angle of 90°, which was used for collecting and analyzing data using Thermo Scientific Avantage 4.52 software.

3. Results and Discussion

3.1. Influence of Cu2+ on Flotation Behavior of Muscovite without Electrochemical Pretreatment

In order to compare the effect of copper ion on the floatability of muscovite before and after electrochemical pretreatment, the effects of different concentrations of Cu2+ on the floatability of muscovite before electrochemical pretreatment were tested. The test conditions were as follows: the muscovite sample was 10.00 g, pulp concentration 13.33%, Cu2+ concentration 6 × 10⁻⁵ mol/L, and sodium oleate (without pretreatment) concentration 9.20 × 10⁻⁴ mol/L. Electrochemical pretreatment conditions, test flow and the results are shown in Table 2, in Figure 3, and in Figure 4, respectively.
Figure 4 shows that the recovery rate of muscovite gradually increased with the increase of Cu2+ concentration when the pH value of the pulp was 12. When the concentration of Cu2+ was 8 × 10⁻⁵ mol/L, the recovery rate of muscovite was 80.90%, which indicated that Cu2+ can greatly improve the floatability of muscovite.

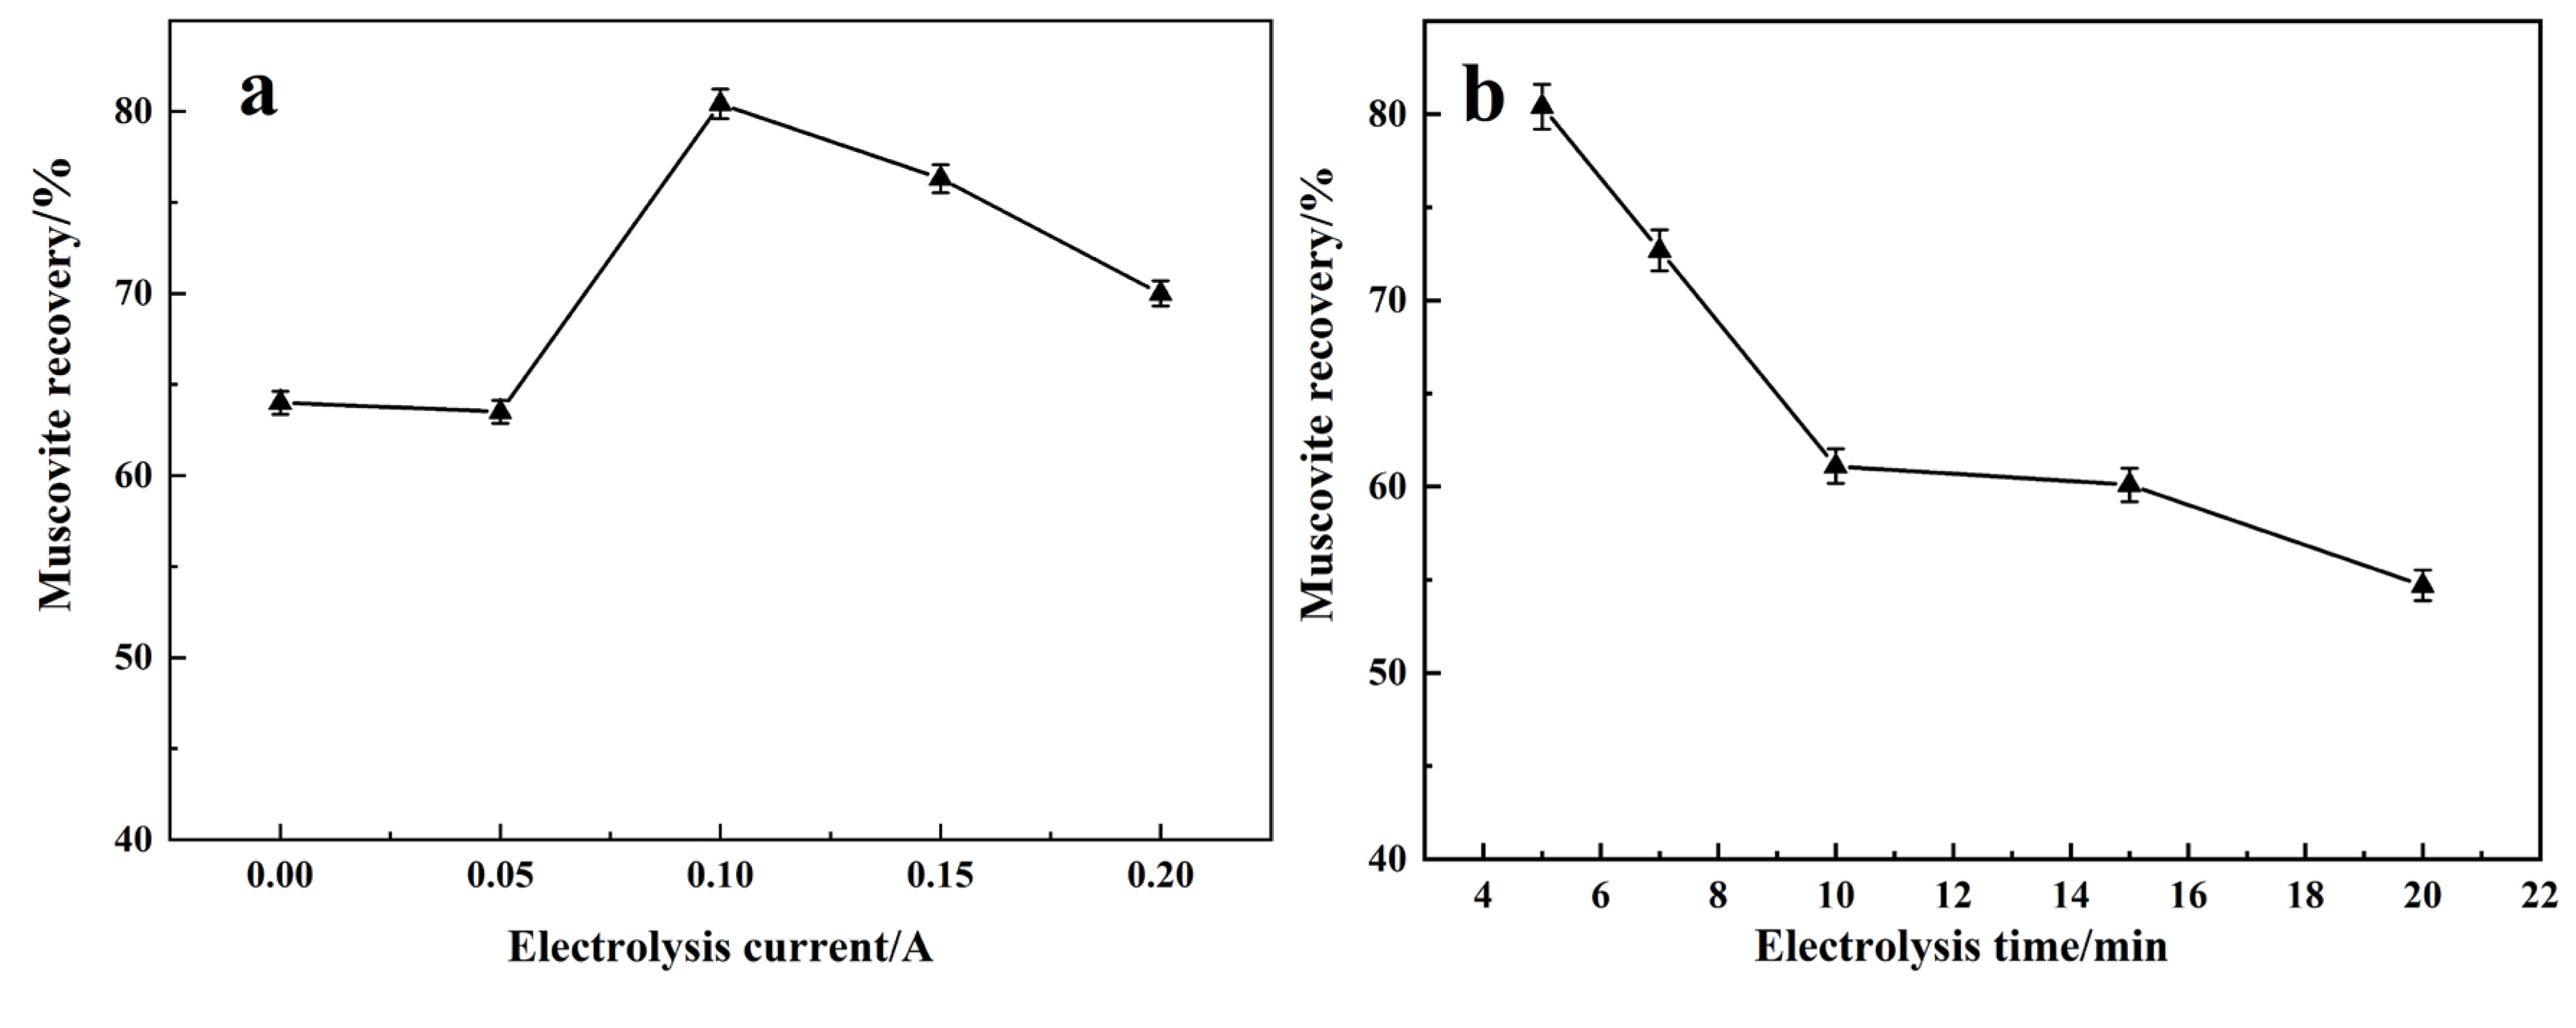
3.2. Effects of Electrochemical Pretreatment for Cu2+on Flotation Behavior of Muscovite under Distinct Conditions

When the pH value was 12, the effects of Cu2+ on the floatability of muscovite as a function of electrolysis current, time, plate distance and electrode material type are shown in Figure 5.
As shown in Figure 5a, the recovery of muscovite was basically unchanged with the increasing of electrolysis current from 0 A to 0.05 A. From 0.05 A to 0.2 A, the recovery of muscovite increased first and then decreased with the increase of electrolysis current. When the electrolysis current was 0.1 A, the recovery of muscovite reached the maximum (about 80.40%). It indicates that electrochemical pretreatment of Cu2+ can enhance sharply the activation of muscovite during a suitable current range. Figure 5b shows that the recovery of muscovite decreased with the increase of electrolysis time. When the pretreatment time increased from 5 min to 20 min, the recovery of muscovite decreased from 80.40% to 54.70%. Therefore, prolonging the electrolysis time is not conducive to strengthening the activation of muscovite by Cu2+. Figure 5c shows that the recovery of muscovite decreased first and then increased with the increase of the distance between the plates. When the electrode plate spacing was5.5 cm, the recovery of muscovite was reduced to 58.60%. This indicates that plate spacing can influence activation properties of Cu2+, but changing the plate spacing is not a good choice. In addition, it can be seen from Figure 5d that the electrode plate material type had little effect on the activation of Cu2+.

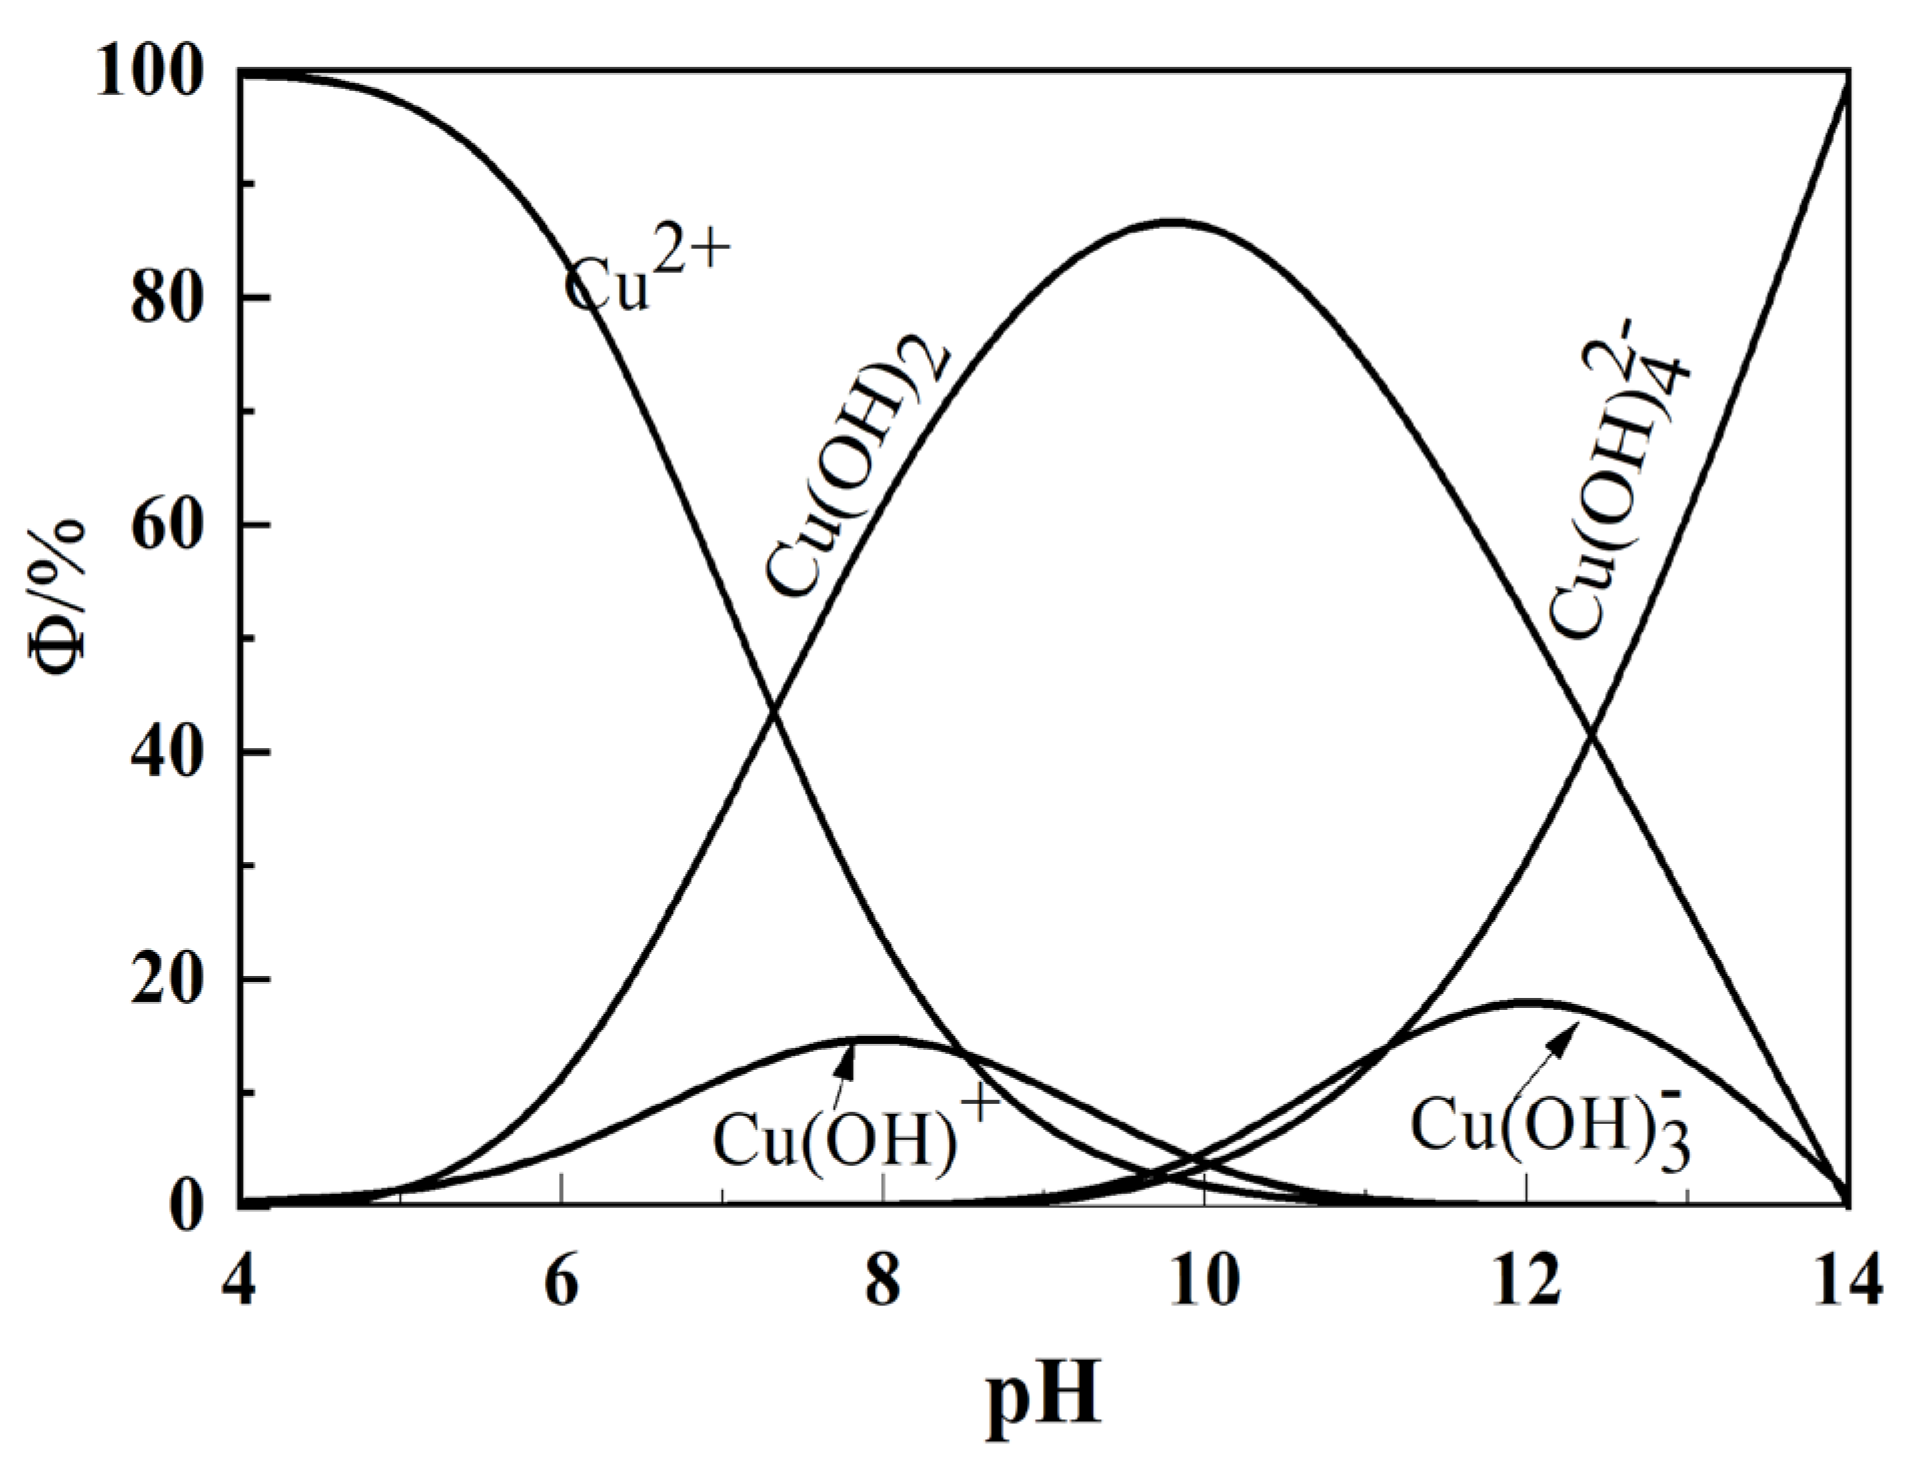
3.3. Effect Mechanism of Electrochemical Pretreatment of Cu2+ on Flotation Behavior of Muscovite

The pH value of copper sulfate solution was detected by acidity meter to understand the effect of the distinct pretreatment conditions. The results are shown in Figure 7. Before that, the paper calculated the distribution coefficient of Cu2+ components under different pH values, and the results are shown in Figure 6.
Figure 6 shows that Cu2+ existed in many forms in the solution. When the pH value was less than 4, Cu2+ was the main component in the solution. When the pH value was more than 4 and less than 10, the content of Cu2+ decreased with the increase of the pH value, while the content of Cu(OH)2 and Cu(OH)+ increased. In addition, when the pH value was more than 9, Cu(OH)3 and Cu(OH)42− began to form in the solution, in which the content of Cu(OH)3 increasedfirst and then decreased with the increase of the pH value, and the content of Cu(OH)42− increased with the increase of the pH value [19].
It can be seen from Figure 7a that the pH of the solution was about 3.3 when the copper sulfate solution was not electrochemically pretreated. After electrochemical pretreatment with distinct electrolysis current, the pH of the copper sulfate solution decreased. According to the relationship between the Cu2+ component distribution coefficient and the pH value of solution, the Cu2+ content in the solution increased with the increase of electrolytic current. According to Figure 6, the Cu2+ content in the solution increased with the increase of electrolytic current. As shown in Figure 7b, when the electrolysis time increased from 5 min to 20 min, the pH value of the copper sulfate solution gradually decreased. Since H+ was generated in the vicinity of the anode plate during electrochemical pretreatment of the copper sulfate solution, the concentration of H+ in the solution increased, so that the pH of the solution decreased, but the Cu2+ content increased. According to Figure 6, the Cu2+ content in the solution increased with the increase of electrolysis time. Figure 7c exhibits that the pH value of the copper sulfate solution changed little as the distance increased between the plates. According to Figure 6, the Cu2+ content in the solution did not change much under this condition. It can be seen from Figure 7d that when the copper sulfate solution was electrochemically pretreated, the anode plate material influenced the pH value of the solution. Taking copper or lead plate as anode plate materials, the pH value of the copper sulfate solution was higher than that of graphite and stainless steel as the anode, which can be ascribed to oxidation dissolution of copper and oxidation behavior of lead. According to Figure 6, when the anode plate was made of copper and lead, the content of Cu2+ in the CuSO4 solution was higher than that of graphite and stainless steel.

3.4. Zeta Potential Effect of Cu2+ on Muscovite Surface under Different Electrochemical Pretreatment Conditions

For understanding the influence of Cu2+ on zeta potential on the muscovite surface under distinct electrochemical pretreatment conditions, zeta potential of the muscovite surface was detected after electrochemical pretreatment, and the concentration of Cu2+ was 6 × 10⁻⁵ mol/L with a pH value of 12. The tested results are shown in Figure 8.
According to Figure 8a, zeta potentials on the muscovite surface first increased positively and then slightly negatively with the increase of electrolysis current of Cu2+. At the electrolysis current of 0.1 A, the maximum zeta potential of −23.36 mV was obtained. According to Figure 8b, zeta potential on the muscovite surface increased negatively with the increase of electrolysis time for Cu2+. When the electrolysis of Cu2+ solution was 20 min, zeta potential on the muscovite surface was −36.52 mV. According to the analysis of the hydrolysis reaction, electrode reaction and solution pH value of copper ions, the small electrochemical pretreatment current and the short pretreatment time will result in a low precipitation rate of copper near the cathode plate, and the amount of precipitation was very small. The small consumption of Cu2+ in the solution resulted in the content of Cu2+ in the solution as very small, while oxygen was released and hydrogen ions were generated near the anode plate. The increase of hydrogen ions in the solution led to the left movement of the hydrolysis reaction of copper ions, which led to the increase of the overall content of Cu2+ in the solution. The decrease of the content of Cu(OH)3 and Cu(OH)2 led to the increase of the adsorbed Cu2+ on the muscovite surface, so that the zeta potential on the muscovite surface increased negatively. At a high erelectrochemical pretreatment current or a longer pretreatment time, the excessive deposition rate of elemental copper near the cathode plate will consume large amounts of Cu2+, making Cu2+ in the solution decrease as a whole, thereby decreasing its adsorption on the muscovite surface.

3.5. Infrared Spectrum Analysis of Muscovite Samples

Infrared spectroscopy was employedto study the adsorption state of sodium oleate and Cu2+ on the muscovite surface. The conditions of this action are shown in Table 3, and the results are shown in Figure 9.
Sample A underwent the joint action of untreated copper ions and sodium oleate. As can be seen from Figure 9, the absorption peak of wave number 3629 cm−1 corresponds to the vibration absorption peak of hydroxyl, and the other two peaks at 2935 cm−1 and 2860 cm−1 can be attributed to the vibration absorption peak of the C–H bond in the methyl group and methylene in sodium oleate, respectively [20,21]. Sample B, sample C and sample D had the joint action of treated copper ions and sodium oleate. Compared with sample A, the intensity of vibration absorption peak of the C–H bond corresponding to methylene and methyl groups of sodium oleate in sample B and C is significantly enhanced, indicating that the increased adsorption of sodium oleate on the sample surface. According to electrode reaction analysis, solution conductivity analysis, solution pH analysis and potential analysis, the reason is that electrochemical pretreatment conditions of the copper sulfate solution can inhibit the hydrolysis of copper ions, increase the Cu2+ content in the copper sulphate solution, strengthen the Cu2+ adsorption on the muscovite surface, and enhance electrostatic adsorption of sodium oleate on the muscovite surface, thereby strengthening the physical and chemical adsorption of sodium oleate on the muscovite surface.

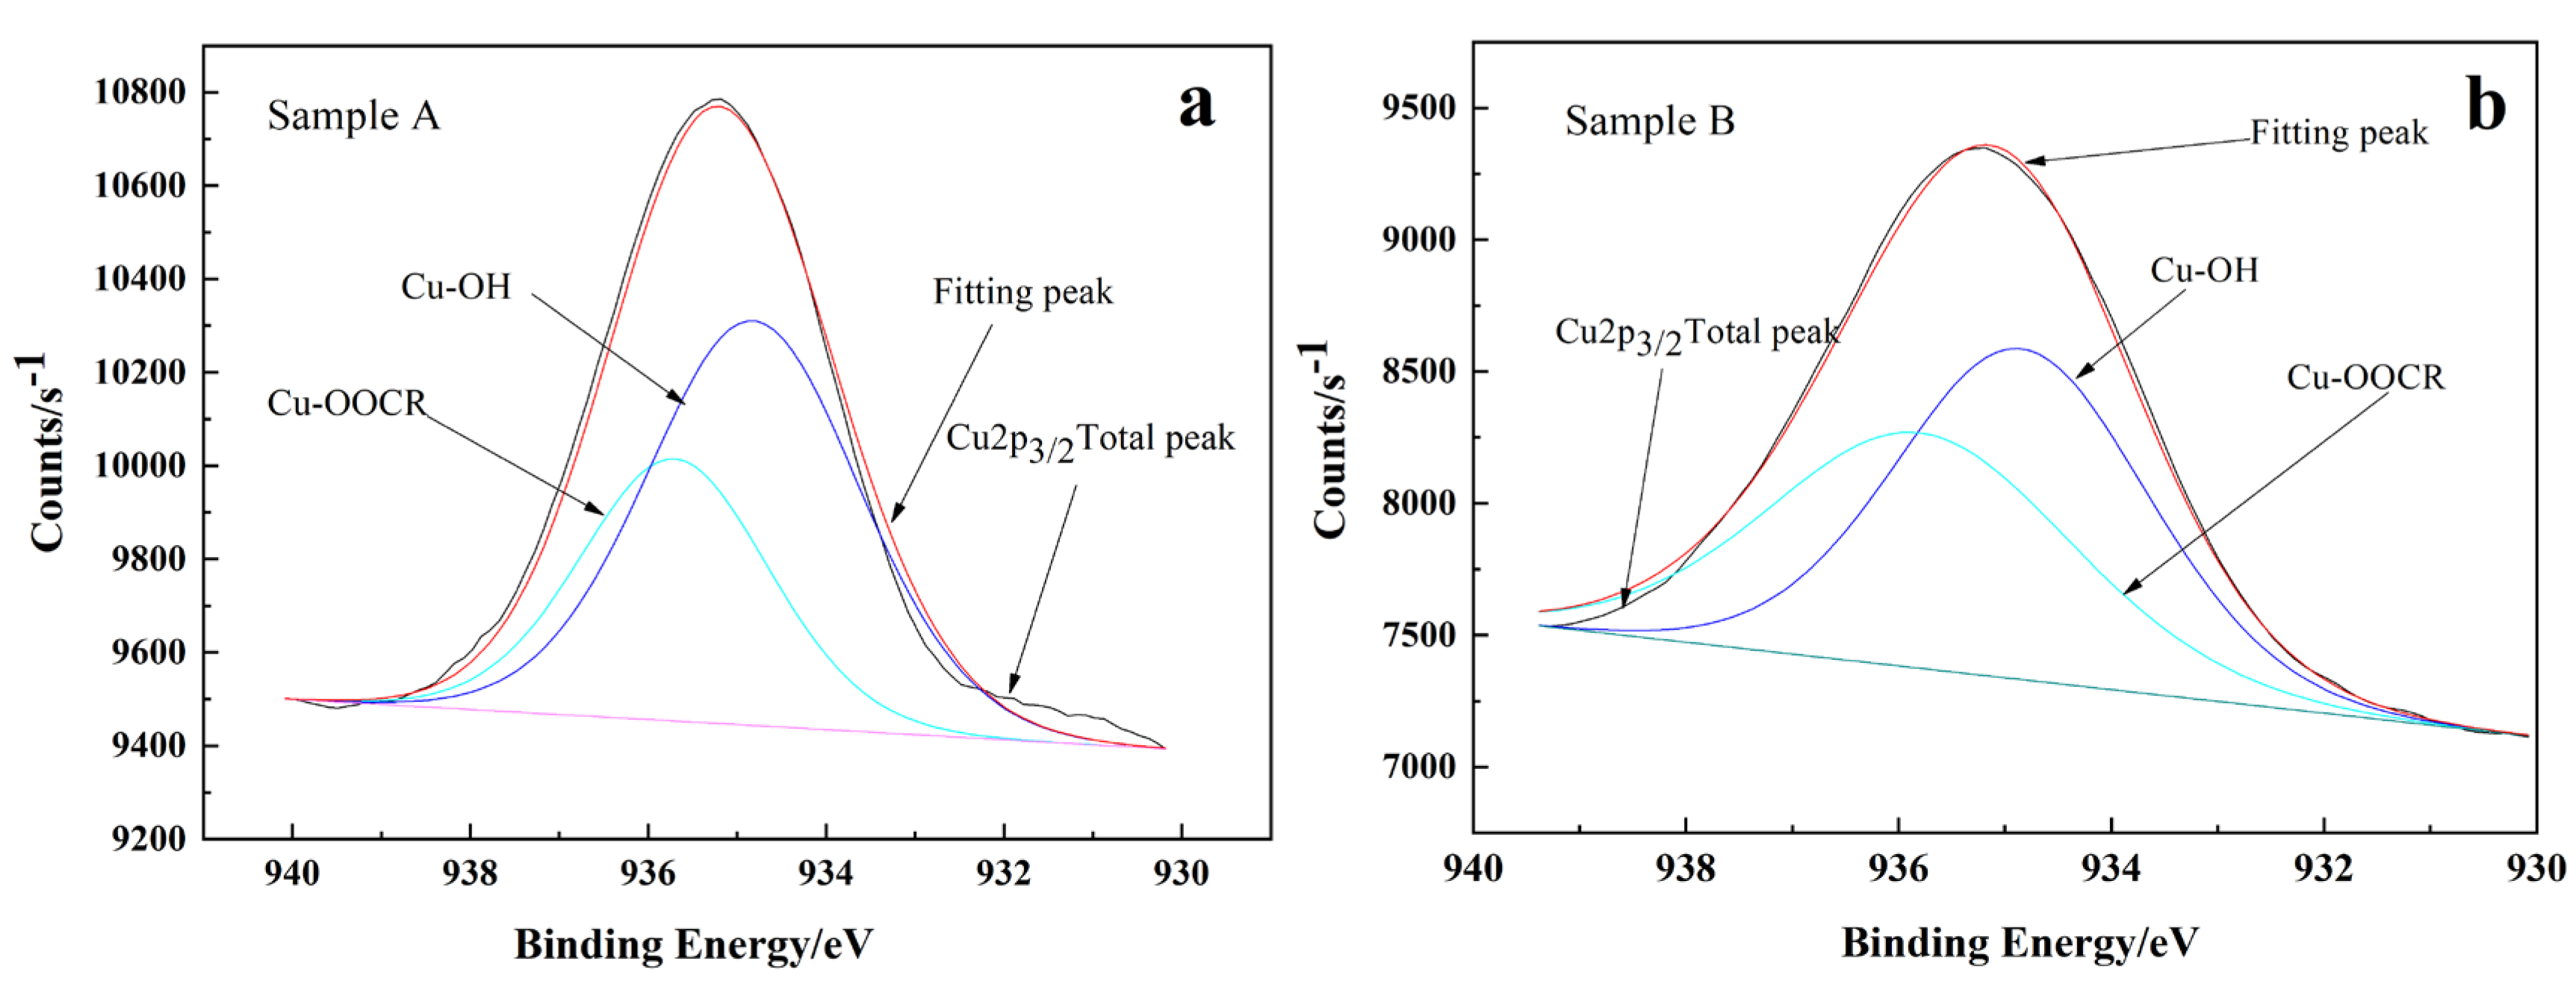
3.6. XPS Analysis of Muscovite Samples

To understand the valence bond morphology of Cu2+ on the muscovite surface before and after electrochemical pretreatment, XPS characterization was carried out on the muscovite samples treated with sodium oleate and untreated Cu2+ and the electrochemically pretreated muscovite samples treated with Cu2+. The conditions of activation are shown in Table 3, and the results are shown in Figure 10.
As can be seen from sample A in Figure 10, copper elements appeared on the surface of the sample after the action of copper ions, indicating that copper ions adsorbed on the surface of muscovite. Compared with sample A, the characteristic peaks of each element on the surface of sample B were changed. Therefore, the electron binding energy and relative content of the main elements on the surface of the sample were analyzed. The results are shown in Table 4.
According to Table 4, compared with sample A, the content of carbon and copper on the surface of sample B increased by 11.26% and 0.34%, respectively. Copper ions and oleate ions adsorbed on the muscovite surface after electrochemical pretreatment significantly increased. Compared with sample A, it was also found that the binding energy of Cu2p3/2 on the surface of sample B was changed, which indicates that the chemical environment of Cu is changed by electrochemical pretreatment with appropriate conditions. In order to further understand the valence bond morphology of Cu on the muscovite surface, the paper divided the peak of the spectrogram of the copper element, and the results are shown in Figure 11 and Table 5.
According to Figure 11 and Table 5, the Cu–OOCR valence bond appeared at the sample surface after the action of copper ions, indicating that the oleic acid group had chemical adsorption on the muscovite surface. Compared with sample A, the Cu–OOCR ratio on the surface of sample B was increased by 10.57%, which indicates that the content of copper oleate on the surface of muscovite increased after the electrochemical pretreatment of copper ions. The main reason lies in that electrochemical pretreatment of copper ion solution will inhibit the hydrolysis of copper ion and increase the concentration of copper ion in the solution, which will lead to the increase of adsorbed copper ion content on the muscovite surface and further strengthen the physical and chemical adsorption of oleic acid root on the muscovite surface [22].

4. Conclusions

(1) In 9.20 × 10⁻⁴ mol/L sodium oleate system, electrochemical pretreatment of Cu2+ solution can greatly enhance the activation of copper ions on muscovite when the electrolysis current is 0.1 A at the short electrolysis time.
(2) The electrochemical pretreatment of the Cu2+ solution can inhibit the hydrolysis of copper ions, increase the content of Cu2+ in the solution, strengthen the adsorption of Cu2+ on the muscovite surface. The electrostatic adsorption of sodium oleate on the mica surface is enhanced, and then the physical and chemical adsorption of sodium oleate is also strengthened.

Author Contributions

Y.W. (Yubin Wang) and Y.W. (Yaru Wang) conceived of and designed the experiments; Y.W. (Yan Wang) prepared the samples and performed the experiments; Y.W. (Yubin Wang), Y.W. (Yaru Wang) analyzed the data; and Y.W. (Yubin Wang), Y.W. (Yaru Wang), W.X. and S.L. contributed to the writing and revising of the paper. All authors have read and agreed to the published version of the manuscript.

Funding

This research was funded by the Henan Province Key Laboratory of Water Pollution Control and Rehabilitation Technology (CJSP2018005), Key R&D projects of Shaanxi Science and Technology Department (2018GY-088).

Conflicts of Interest

The authors declare no conflict of interest.

References

  1. Wang, D.; Jiao, F.; Qin, W.; Wang, X. Effect of surface oxidation on the flotation separation of chalcopyrite and galena using sodium humate as depressant. Sep. Sci. Technol. 2018, 53, 961–972. [Google Scholar] [CrossRef]
  2. Bas, A.D.; Larachi, F. The effect of flotation collectors on the electrochemical dissolution of gold during cyanidation. Miner. Eng. 2019, 130, 48–56. [Google Scholar] [CrossRef]
  3. Moslemi, H.; Gharabaghi, M. A review on electrochemical behavior of pyrite in the froth flotation process. J. Ind. Eng. Chem. 2017, 47, 1–18. [Google Scholar] [CrossRef]
  4. Kim, H.; You, J.; Gomez-Flores, A.; Solongo, S.K.; Hwang, G.; Zhao, H.B.; Lee, B.C.; Choi, J. Malachite flotation using carbon black nanoparticles as collectors: Negative impact of suspended nanoparticle aggregates. Miner. Eng. 2019, 137, 19–26. [Google Scholar] [CrossRef]
  5. Ahmadi, A.; Schaffie, M.; Manafi, Z.; Ranjbar, M. Electrochemical bioleaching of high grade chalcopyrite flotation concentrates in a stirred bioreactor. Hydrometallurgy 2010, 104, 99–105. [Google Scholar] [CrossRef]
  6. Chander, S.; Fuerstenau, D.W. Electrochemical flotation separation of chalcocite from molybdenite. Int. J. Miner. Process. 1983, 10, 89–94. [Google Scholar] [CrossRef]
  7. Meng, X.Y.; Zhao, H.B.; Sun, M.L.; Zhang, Y.S.; Zhang, Y.J.; Lv, X.; Kim, H.; Vainshtein, M.; Wang, S.; Qiu, G.Z. The role of cupric ions in the oxidative dissolution process of marmatite: A dependence on Cu2+ concentration. Sci. Total Environ. 2019, 675, 213–223. [Google Scholar] [CrossRef]
  8. Smith, L.K.; Bruckard, W.J. The separation of arsenic from copper in a Northparkes copper–gold ore using controlled-potential flotation. Int. J. Miner. Process. 2007, 84, 15–24. [Google Scholar] [CrossRef]
  9. Plackowski, C.; Bruckard, W.J.; Nguyen, A.V. Surface characterisation, collector adsorption and flotation response of enargite in a redox potential controlled environment. Miner. Eng. 2014, 65, 61–73. [Google Scholar] [CrossRef]
  10. Zhou, G.Y.; Li, W.J.; Chen, Y.; Song, Y.S. Study on Recovery of Lead-Zinc Tailing Ore by Electrochemical Flotation. Appl. Mech. Mater. 2014, 675–677, 1451–1454. [Google Scholar] [CrossRef]
  11. Quan, L. Electrochemical Flotation Separation of Marmatite from Pyrrhotite in the Presence of Copper Ion. Trans. Nonferrous Met. Soc. China 2000, 10, 90–92. [Google Scholar]
  12. Xiao, W.; Zhao, Y.; Yang, J.; Ren, Y.; Yang, W.; Huang, X.; Zhang, L. Effect of Sodium Oleate on the Adsorption Morphology and Mechanism of Nanobubbles on the Mica Surface. Langmuir 2019, 35, 9239–9245. [Google Scholar] [CrossRef] [PubMed]
  13. Xiao, W.; Ren, Y.; Yang, J.; Cao, P.; Wang, J.; Qin, W.; Qiu, G. Adsorption mechanism of sodium oleate and styryl phosphonic acid on rutile and amphibole surfaces. Trans. Nonferrous Met. Soc. China 2019, 29, 1939–1947. [Google Scholar] [CrossRef]
  14. Huang, X.; Zhu, T.; Duan, W.; Liang, S.; Li, G.; Xiao, W. Comparative studies on catalytic mechanisms for natural chalcopyrite-induced Fenton oxidation: Effect of chalcopyrite type. J. Hazard. Mater. 2020, 381, 120998. [Google Scholar] [CrossRef] [PubMed]
  15. Chimonyo, W.; Wiese, J.; Corin, K.; O’Connor, C. The use of oxidising agents for control of electrochemical potential in flotation. Miner. Eng. 2017, 109, 135–143. [Google Scholar] [CrossRef]
  16. Zhang, Y.; Zhao, H.; Zhang, Y.; Liu, H.; Yin, H.; Deng, J.; Qiu, G. Interaction mechanism between marmatite and chalcocite in acidic (microbial) environments. Hydrometallurgy 2020, 191, 105217. [Google Scholar] [CrossRef]
  17. Woods, R. Electrochemical potential controlling flotation. Int. J. Miner. Process. 2003, 72, 151–162. [Google Scholar] [CrossRef]
  18. Xiao, W.; Jiao, F.; Zhao, H.B.; Qin, W.Q.; Qiu, G.Z.; Wang, J. Adsorption Structure and Mechanism of Styryl Phosphoric Acid at the Rutile-Water Interface. Minerals 2018, 8, 360. [Google Scholar] [CrossRef] [Green Version]
  19. Wang, H.; Wen, S.M.; Han, G.; Feng, Q.C. Effect of copper ions on surface properties of ZnSO4-depressed sphalerite and its response to flotation. Sep. Purif. Technol. 2019, 228, 9. [Google Scholar] [CrossRef]
  20. Liu, W.; Zhang, J.; Wang, W.; Deng, J.; Chen, B.; Yan, W.; Xiong, S.; Huang, Y.; Liu, J. Flotation behaviors of ilmenite, titanaugite, and forsterite using sodium oleate as the collector. Miner. Eng. 2015, 72, 1–9. [Google Scholar] [CrossRef]
  21. Meng, Q.; Feng, Q.; Ou, L. Effect of temperature on floatability and adsorption behavior of fine wolframite with sodium oleate. J. Cent. South Univ. 2018, 25, 1582–1589. [Google Scholar] [CrossRef]
  22. Li, F.; Zhong, H.; Wang, S.; Liu, G. The activation mechanism of Cu(II) to ilmenite and subsequent flotation response to α-hydroxyoctyl phosphinic acid. J. Ind. Eng. Chem. 2016, 37, 123–130. [Google Scholar] [CrossRef]
Figure 1. XRD pattern of muscovite.
Minerals 10 00206 g001
Figure 2. The electrolysis equipment and experimental process. (a), Electrochemical pretreatment of reagents; (b), DC regulated power supply.
Minerals 10 00206 g002
Figure 3. Flowchart of flotation test.
Minerals 10 00206 g003
Figure 4. Effects of different concentrations of Cu2+ on the recovery of muscovite (pH = 12, c (Sodium oleate) = 9.20 × 10⁻⁴ mol/L).
Minerals 10 00206 g004
Figure 5. Effects of Cu2+ on floatability of muscovite under different electrochemical treatment conditions (pH = 12, c (Sodium oleate) = 9.20 × 10⁻⁴ mol/L, c (Cu2+) = 6 × 10⁻⁵ mol/L). (a), electrolysis current; (b), electrolysis time; (c), plate distance; (d), electrode material types—A: graphite plate–graphite plate; B: copper plate–graphite plate; C: lead board–graphite plate; D: stainless steel plate–graphite.
Minerals 10 00206 g005aMinerals 10 00206 g005b
Figure 6. Distribution chart of Cu2+ composition and solution pH value.
Minerals 10 00206 g006
Figure 7. Influence of electrochemical pretreatment on pH value of copper sulfate solution. (c(Cu2+) = 6 × 10⁻⁵ mol/L). (a), electrolysis current; (b), electrolysis time; (c), plate distance; (d), electrode material types.
Minerals 10 00206 g007
Figure 8. Effect of electrochemical pretreatment on zeta potential of the muscovite surface with Cu2+ (pH = 12, c(Cu2+) = 6 × 10⁻⁵ mol/L). (a), electrolysis current; (b), electrolysis time.
Minerals 10 00206 g008
Figure 9. Infrared spectra of different muscovite samples (pH = 12, c(Sodium oleate) = 9.20 × 10⁻⁴ mol/L, c(Cu2+) = 6 × 10⁻⁵ mol/L).
Minerals 10 00206 g009
Figure 10. XPS spectra of muscovite samples (pH = 12, c(Sodium oleate) = 9.20 × 10⁻⁴ mol/L, c(Cu2+) = 6 × 10⁻⁵ mol/L).
Minerals 10 00206 g010
Figure 11. Peak-splitting fitting diagram of Cu2p3/2 on the muscovite surface. (a), without electrochemical pretreatment; (b), electrochemical pretreatment.
Minerals 10 00206 g011
Table 1. Results of chemical composition analysis of samples.
Chemical ConstituentsSiO2Na2OAl2O3K2O
Composition content/(wt)%48.160.7232.5010.62
Table 2. Electrochemical pretreatment conditions.
Test NumberElectrochemical Pretreatment Conditions
Electric Current Magnitude/AElectrolysis Time/minPLATE DISTANCE/cmElectrode Material Types (Anode–Cathodic)
avariable54.5graphite plate–graphite plate
b0.1variable4.5copper plate–graphite plate
c0.15variablelead board–graphite plate
d0.154.5variable
Table 3. Action conditions of different muscovite samples.
Sample NumbersReagent Concentration/mol/LElectrochemical Pretreatment
Conditions
Sodium OleateCu2+Electrolysis Current/AElectrolysis Time/minPlate Distance/cmElectrode Material Types (Anode–Cathodic)
A9.20 × 10−46 × 10−5
B9.20 × 10−46 × 10−50.154.5graphite plate–graphite plate
C9.20 × 10−46 × 10−50.254.5graphite plate–graphite plate
D9.20 × 10−46 × 10−50.1154.5graphite plate–graphite plate
Table 4. Electron binding energy and relative content of major elements on the surface of the sample.
Sample NumbersC/(wt)%Cu/(wt)%Cu2p3/2/eV
A19.540.57934.07
B30.800.91933.28
Table 5. Valence bond and proportion of Cu on mineral surface.
Sample NumbersTotal Peak AreaCu-OOCR Peak AreaCu-OH Peak AreaCu-OOCR Relative Content/%Cu-OH Relative Content/%
A4166.691518.252648.4436.4463.56
B6820.163205.893614.2747.0152.99

