Article

Effect of Crystal Chemistry Properties on the Distribution Characteristics of H2O and Na+ in Na-Montmorillonite Interlayer Space: Molecular Dynamics Simulation Study

1
College of Chemical and Environmental Engineering, Shandong University of Science and Technology, Qingdao 266590, China
2
School of Resources Environment and Materials, Guangxi University, Nanning 530004, China
*
Author to whom correspondence should be addressed.
Minerals 2020, 10(2), 162; https://doi.org/10.3390/min10020162
Submission received: 1 December 2019 / Revised: 10 February 2020 / Accepted: 11 February 2020 / Published: 12 February 2020
(This article belongs to the Special Issue Applied Geochemical Modeling)

Abstract

:
At monolayer hydration state, the spatial distribution of H2O and Na+ in the interlayer of Na-montmorillonite (Na-MT) with different crystal chemistry properties was investigated by the molecular dynamics simulation method. The simulation results show that when layer charge density increases, H2O will move and form hydrogen bonds with O in tetrahedral surfaces (Ot) at a distance of 1.676 ± 0.043 Å. The impact of isomorphic substitution on the relative concentration of H2O depends largely on the layer charge density of Na-MT, when layer charge density is high, H2O move obviously to both sides of Na-MT sheets with the increase of octahedral substitution ratio. Nevertheless, Na+ coordinate with Ot at a distance of 2.38 Å, and the effect of isomorphic substitution ratio on the diffusion of Na+ is opposite to that of H2O. The mobility of both H2O and Na+ decreases with the increase of layer charge density or tetrahedral substitution ratio. The radial distribution function of Na-Ow (O in H2O) shows that the coordination strength between Na+ and Ow decreases with the increase of layer charge density or tetrahedral substitution ratio, and Na+ are hydrated by four H2O at a Van der Waals radius of 2.386 ± 0.004 Å. The research results can provide a theoretical basis for the efficient application of Na-MT at the molecular and atomic levels.

1. Introduction

Montmorillonite (MT) is a typical layered aluminosilicate clay mineral and is abundant in mud stone and shale rock [1]. The structure of MT is one Al–O(OH) octahedral sheet sandwiched between two Si–O tetrahedral sheets [2]. Isomorphic substitution in the structure of MT is a requirement, that is Al3+ are substituted by Mg2+ in the octahedron and Si4+ are substituted by Al3+ in the tetrahedron [3]. As a result of heterovalent isomorphic substitution, the layers of MT are permanently negatively charged. Therefore, some exchangeable cations such as Na+, Ca2+ in the natural environment can enter the layers of MT to balance the negative charges between MT layers and form various types of MT [4,5].
MT has a wide range of applications in many fields due to its special crystal chemistry properties. It can not only be used for deposition of contaminants and radioactive waste because of its low permeability and good radionuclide retention ability [6,7], but also plays significant roles in the pharmaceutical industry, cosmetic products, and mining operations [8,9,10].
The crystal chemistry properties of MT have a great influence on its application performance and have been extensively studied experimentally by Fourier transform infrared (FTIR) spectroscopy, atomic force microscopy (AFM), X-ray diffraction (XRD), and X-ray photoelectron spectroscopy (XPS) techniques et al. in recent years [11,12,13,14,15]. However, the above methods make it difficult to visualize the crystal chemistry properties of MT from the microscopic perspective. It is well known that molecular simulation has become a popular tool to supplement theoretical research for MT. It can not only provide a detailed insight into the structure of MT at the molecular and atomic levels, but also describe the dynamic behavior of particles in the interlayer domain of MT accurately and explain the interaction mechanism of particles in MT [16,17,18].
Numerous works about the hydration mechanism of MT have been successfully undertaken by the molecular simulation method. Yi et al. investigated the Na-MT-water interface system by molecular dynamics simulation and experimental methods, and verified that there was a hydration shell on the surface of Na-MT with the thickness of approximately 16.3 Å [19], which was composed of six ordered water molecule layers [20]. Titiloye, J.O. et al. studied the structure and dynamics of methane in hydrated K-MT and Na-MT under conditions encountered in the sedimentary basin using computer simulation methods, and found that the K-MT surfaces had a higher affinity for methane than that of Na-form [21]. Voora et al. compared different MT with different interlaminar cations (Li+, Na+, K+, Mg2+, and Ca2+) by density functional theory (DFT), and found that the basal spacing correlated in a linear manner with the ionic radius of the interlayer cation [22]. Moreover, other researchers also found that cation with weak interaction force, such as Na+, would be hydrated easily [23,24,25]. Zhou et al. simulated the changes of the interlayer structure in Na-MT under the high temperature and pressure of basin conditions. Their results showed that the monolayer hydrate was more stable than the bilayer hydrate at a burial depth of 7.0 km, and with burial depth increased, the basal spacing of the monolayer and bilayer hydrates changed to varying degrees [26]. In addition, Akinwunmi et al. studied the swelling behavior of Na-MT and found that the swelling pressure appeared rapidly due to the temperature rising [27], however, Peng et al. found that it was the exchangeable cations that provided the dominant driving force for MT to swell through a molecular dynamic study [28].
Regarding the impact of crystal structure on the hydration properties of MT, Qiu et al. studied the effect of charge density on the hydration properties of Ca-MT by combining molecular dynamics simulation and experimental methods. We found that the polarity of Ca-MT sheets was strengthened when the charge density increased, so the interlayer particles were more likely to be drawn to tetrahedral surfaces [29], Shen et al. also drew a similar conclusion [30]. Wungu et al. compared the effect of isomorphic substitution or a non-isomorphic substitution on the geometric structure and electronic properties of MT using DFT calculations. They demonstrated that the isomorphic model possessed insulator-like behavior and was more stable than the conventional model based on the sorption energy [31].
It can be seen from above that the related factors (such as the types of interlayer cations, environmental conditions and crystal structure) affecting the hydration properties of MT have been studied by molecular simulation. However, the above literatures did not fully take into account the crystal structure characteristics of Na-MT in nature, such as the characteristics of layer charge density (from Wyoming to Cheto type) and the difference of isomorphic substitution sites in the structure of Na-MT.
In this work, according to the crystal structure characteristics of Na-MT in nature, 20 types of Na-MT crystal models with different crystal chemistry properties were established. Furthermore, a molecular dynamics simulation was performed to study the influence mechanism of layer charge density and isomorphic substitution sites on the spatial distribution of H2O and Na+ in the interlayer domain of Na–MT. The research results are useful for understanding the hydration properties of Na–MT with different crystal chemical properties at the atomic and molecular levels.

2. Simulation Details

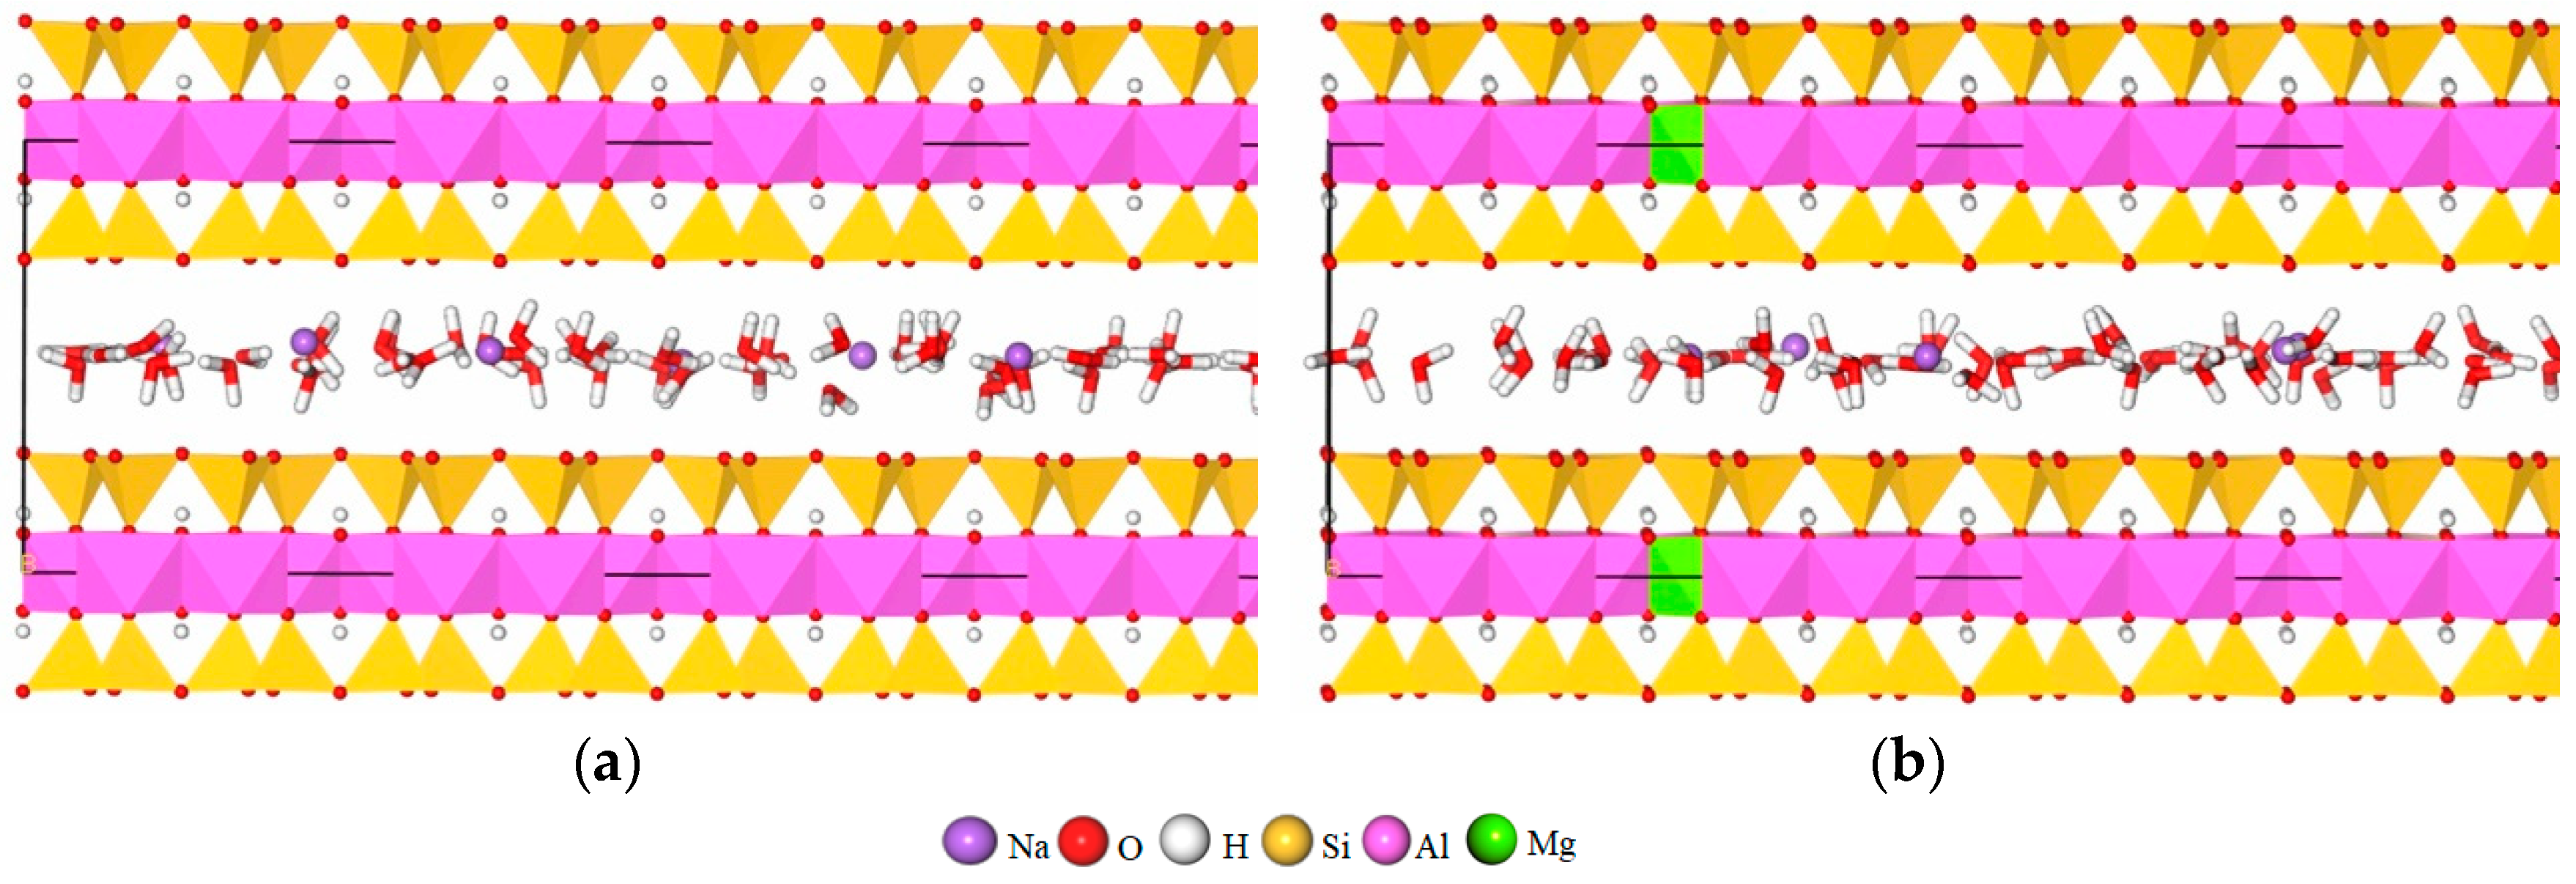
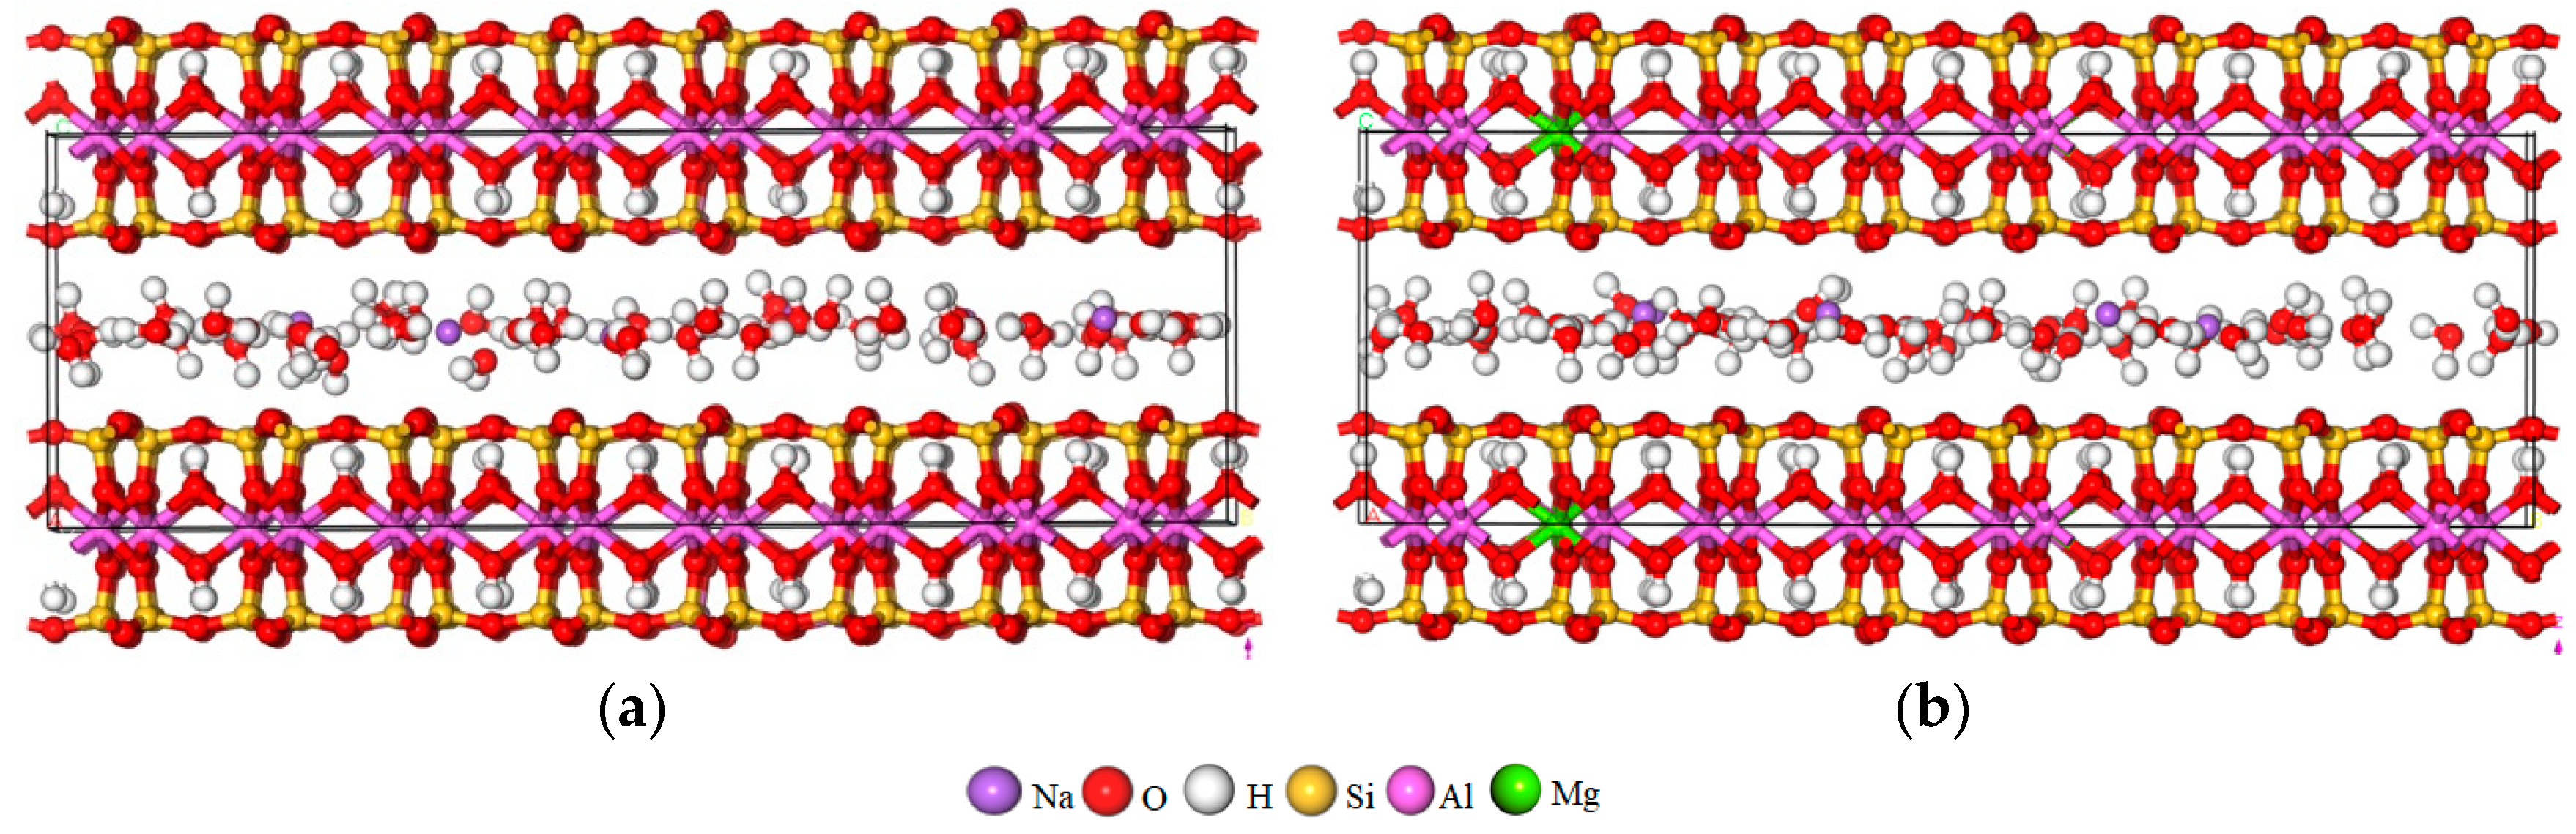
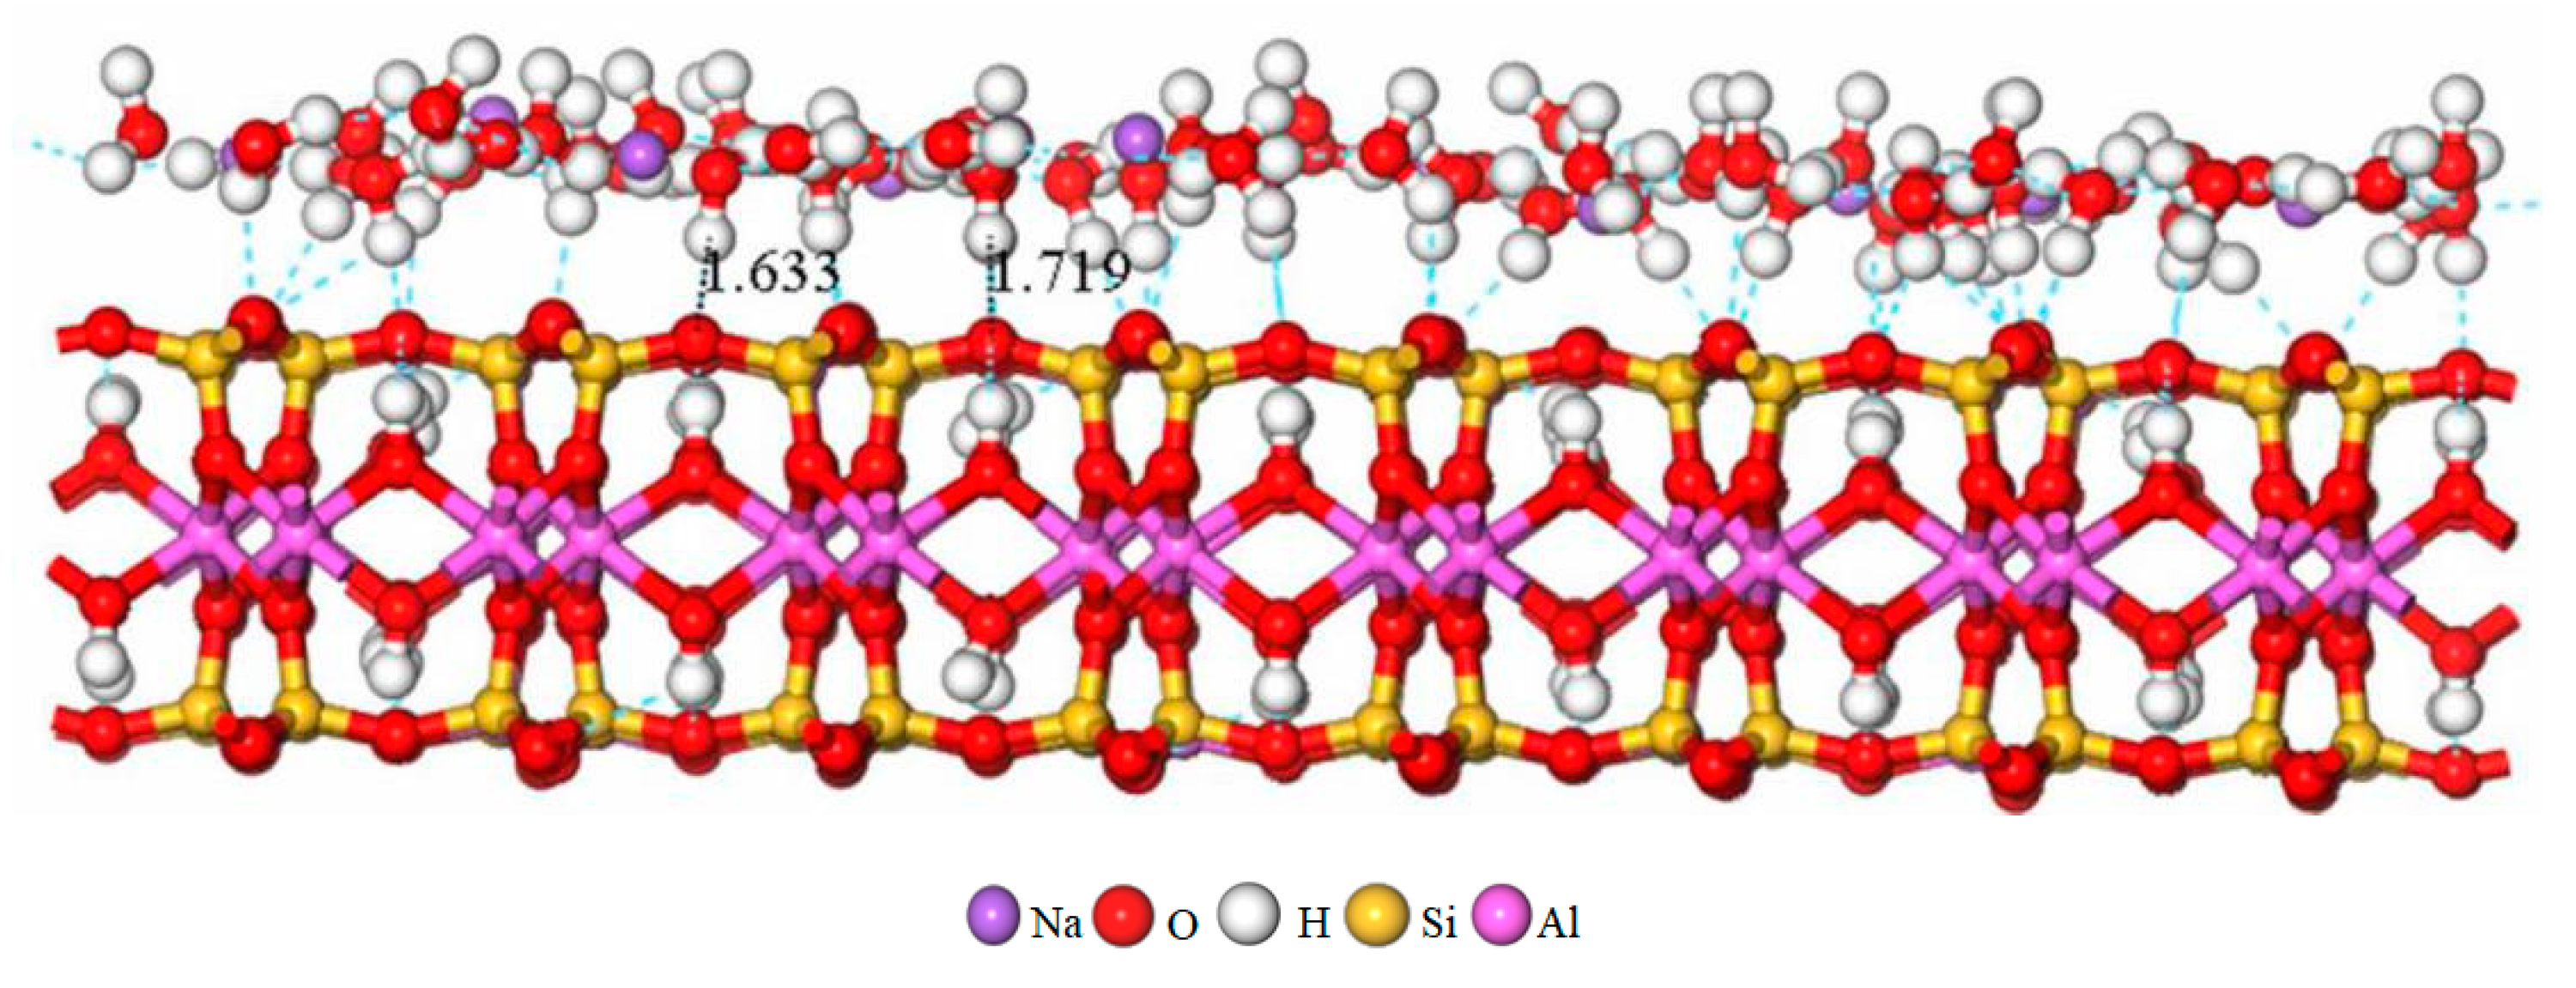
2.1. Model Establishment

The Na-MT models which contain different layer charge density and isomorphic substitution sites were established firstly. The semi-crystal structure formula of these models was Nax + y(Al2 – xMgx)(Si4 – yAly)O10(OH)2 nH2O, where x + y is the layer charge density, x is the number of magnesium atoms in the octahedron that replace aluminum atoms, y is the number of aluminum atoms in the tetrahedron that replace silicon atoms. The space group of Na-MT is C2/m [32]. The fundamental parameters of the Na-MT model in the simulation were originated from empirical models introduced by Chang et al. [33]: a = 0.520 nm, b = 0.897 nm, the value of c depends on the amount of H2O, α = γ = 90.0°, and β = 99.0°. The Na-MT model consists of two TOT layers, each containing replicated pyrophyllite cells in the form of 4a × 4b × 1c along x, y, and z directions, respectively.
According to the research purposes and crystal structure of natural Na-MT [29], the established semi-cell layer charge of Na-MT was determined as 0.38, 0.50, 0.58 and 0.70 in this paper. The corresponding numbers of Na+ which balance the negative potential of Na-MT layers is 6, 8, 9 and 11. The four types of Na-MT were defined as Na-MT1, Na-MT2, Na-MT3 and Na-MT4, respectively. The isomorphic substitution mainly occurs in octahedron (Mg2+ substitutes Al3+) and tetrahedron (Al3+ substitutes Si4+), but always obeys Loewenstein’s rule that the substitution sites are random and two adjacent positions can not be replaced at the same time [34]. The ratio of octahedral substitution sites to tetrahedral substitution sites was set as 0:6, 2:4, 3:3, 4:2 and 6:0, and was denoted as 0-6, 2-4, 3-3, 4-2 and 6-0, respectively. Eventually, twenty types of Na-MT crystal models with different crystal chemistry properties were established. For example, when the layer charge density of Na-MT was 0.38, the ratio of octahedral sites to tetrahedral sites was 0:6, it was recorded as Na-MT10-6, and more detailed description was shown in Table 1.
Natural Na-MT usually contains one layer H2O and the value of c is about 12.5 Å [5,35,36]. To simulate the influence mechanism of crystal chemistry properties on the spatial distribution of H2O and Na+, sixty four H2O molecules were added into the interlayer domain of Na-MT randomly by the adsorption location module to form one layer of H2O, and the the corresponding c value of Na-MT was about 12.5 Å. In the adsorption location module, the parameters were set as follow, the number of cycles was 5, steps per cycle were 5 × 10⁴, geometry optimization and automated temperature control were selected. Three dimensional periodic boundary conditions were applied to all of the simulation systems [17,32]. The established models of Na-MT are shown in Figure 1 (Take Na-MT10-6 and Na-MT16-0 as examples).

2.2. Simulation Parameters

The geometry optimization and molecular dynamics simulation were accomplished based on the Forcite module of Material Studio 7.0 [37]. Firstly, the geometry optimization task was performed to fully relax the structure of the Na-MT model under the following conditions. (1) The Na-MT sheets were assumed to be rigid that the lattice parameters of a, b, α, and γ are fixed, but c and β are variable [38]. (2) The algorithm was set to smart, the RMS force was 0.1 kcal/mol/Å, the energy difference was 2 × 10⁻⁵ kcal/mol [39], the RMS displacement was 1 × 10⁻⁵ Å, and the RMS stress was 100 kPa. Secondly, after geometry optimization, the NPT ensembles (isobaric–isothermal ensemble: particle number (N), pressure (P) and temperature (T) are constant.) were run to balance the structure of Na-MT–water systems. The initial velocities were random, temperature was 298.0 K, pressure was 1 × 10⁻⁴ GPa, the time step was 0.5 fs, total simulation time was 500 ps, number of steps were 1 × 10⁶, the temperature control method was Nosé–Hoover [37], and the thermostat was Berendsen. Then, the NVT ensemble (canonical ensemble: particle number (N), volume (V) and temperature (T) are constant, total momentum are also constant) was employed to obtain atomic trajectories of particles in optimized systems [19]. In this part, the other parameters were the same as the last step, but total simulation time was 600 ps, it was run to ensure that the system has reached equilibrium, and the final models were used for analysis [26,40]. During the simulation, the simple point charge (SPC) model was used to represent the interaction of H2O [41,42], in which the geometrical structure of these molecules is rigid, the bond length is 1.0 Å and bond angle is 109.5° [43]. The CLAYFF force field which has been proved to work very well in previous simulation studies about MT was employed to describe the interatomic potential for Na-MT-water systems [44,45,46,47]. The short range van der Waals interaction was calculated based on the atom-based method, and the long-range electrostatic interaction was calculated by the Ewald summation method [48,49]. The hydration models of Na-MT for different layer charge density characteristics after geometry optimization are shown in Table 2 and Figure 2 (Take Na-MT10-6 and Na-MT16-0 as examples), and we can see that the d(001) values are close to the results obtained by Ferrage et al. that the d(001) value of Na-MT with one plane of H2O molecules in interlayer is about 11.5–13.0 Å [36].

3. Results and Discussion

To comprehensively study the influence of the crystal chemistry properties on the spatial distribution of particles in the Na-MT interlayer domain, the z-axis concentration profiles, self-diffusion coefficient and radial distribution function (RDF) were analyzed, respectively.

3.1. Z-Axis Concentration Profiles of Particles in Interlayer of Na-Montmorillonite (Na-MT)

The z-axis concentration profiles can reflect the density characteristic of particles in interlayer of Na-MT [4], therefore, the density variation tendency of H2O and Na+ can be predicted and the influence mechanism can be explained by analyzing the simulation results. In this part, it was calculated on the basis of NVT simulation results and the protocols are set as follows: the number of bins was 100, the width of smoothed profile was 1.0 bin.

3.1.1. Z-Axis Concentration Profiles of H2O

The z-axis concentration curves of H2O in interlayer of Na-MT with different crystal chemistry properties are shown in Figure 3 and Figure 4.
It can be seen from Figure 3 that H2O are mainly distributed near the central axis of interlayer domain in the range of −2.0 Å–+2.0 Å, but with the increase of layer charge density from 0.38 to 0.70, the relative concentration of H2O decreases from 10.20 to 8.55, which indicates that H2O move gradually towards both sides of Na-MT sheets with the increase of layer charge density. The reason is that with the increase of layer charge density of Na-MT, the polarity of Na-MT surfaces is strengthened, and the hydrogen bonding force between H2O and tetrahedral surfaces also increases. Therefore, the relative concentration of H2O decreases with the increase of layer charge. This conclusion fits well with our previous study [29].
Compared with the effect of layer charge density, the impact of isomorphic substitution on the distribution of H2O in Na-MT is limited, and it can be seen from Figure 4 that when the layer charge of Na-MT is low, the relative concentration curves of H2O almost coincide, such as Na-MT1 and Na-MT2. But when the layer charge of Na-MT is high, with the amount of octahedral substitution sites increasing, the strength of corresponding peaks decreases gradually, such as Na-MT37-2 and Na-MT39-0. This phenomenon is more obvious in Na-MT4. The reason is that octahedral charges locate in the middle of Na-MT layers, which are farther away from H2O than that of tetrahedral charges. When octahedral substitution sites increase in Na-MT with high layer charge, the hydrogen bonding force between both sides of Na-MT sheets and HW (H in H2O) are weakened because of the long-range spatial effect, which results in H2O no longer being trapped in the central axis of the interlayer space [43]. This simulation result is markedly different from our previous study about Ca-MT that isomorphic substitution has no significant effect on the z-axis density distribution of H2O [39]. It may be attributed to the lower basal spacing of Na-MT than that of Ca-MT, the distance between Ot (O in tetrahedron) and HW is closer in Na-MT than that of Ca-MT, so the impact of isomorphic substitution on the distribution of H2O is more obvious in Na-MT.

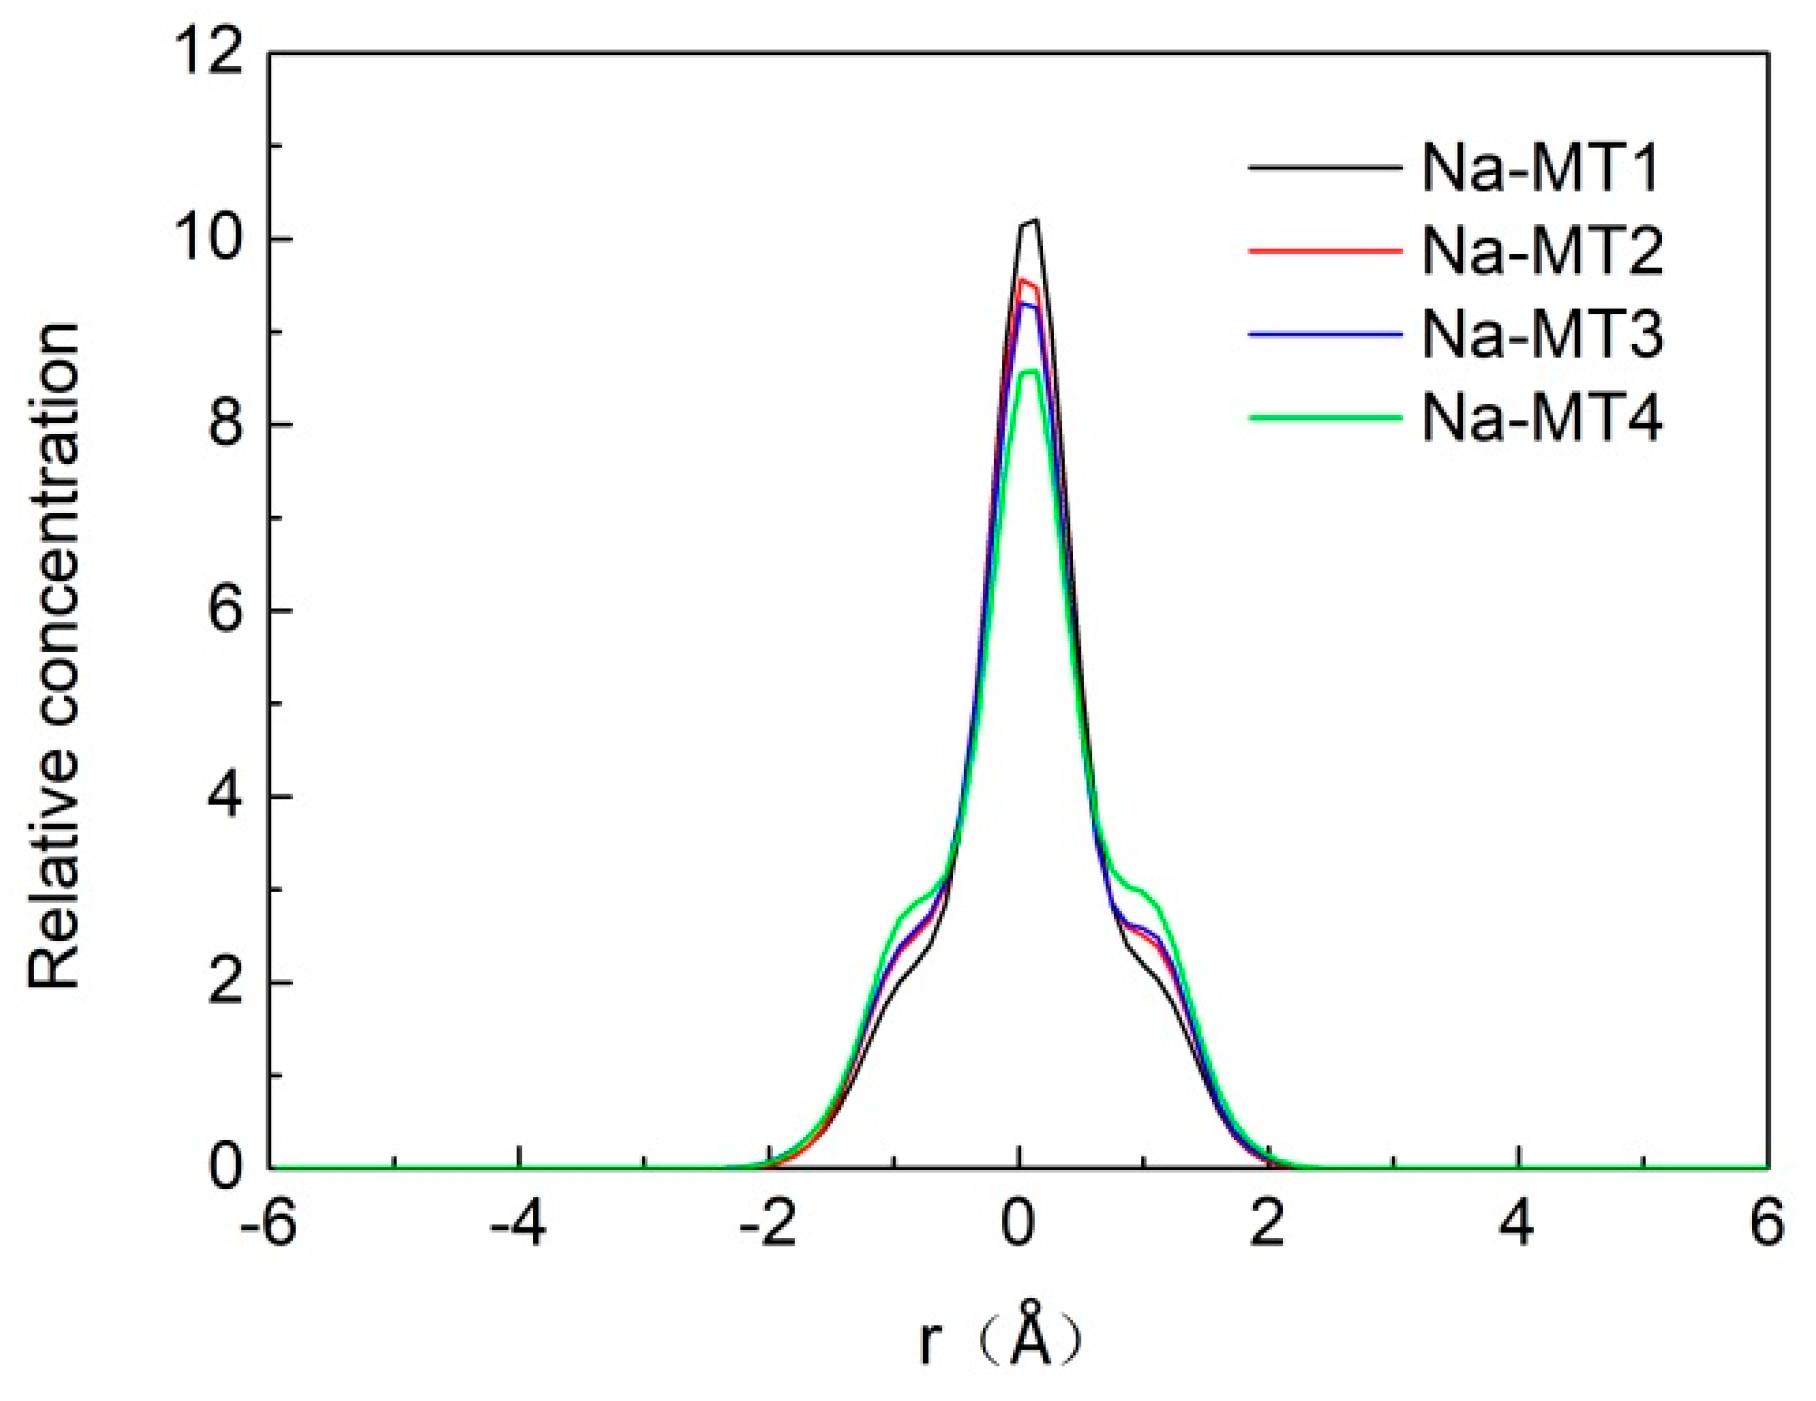
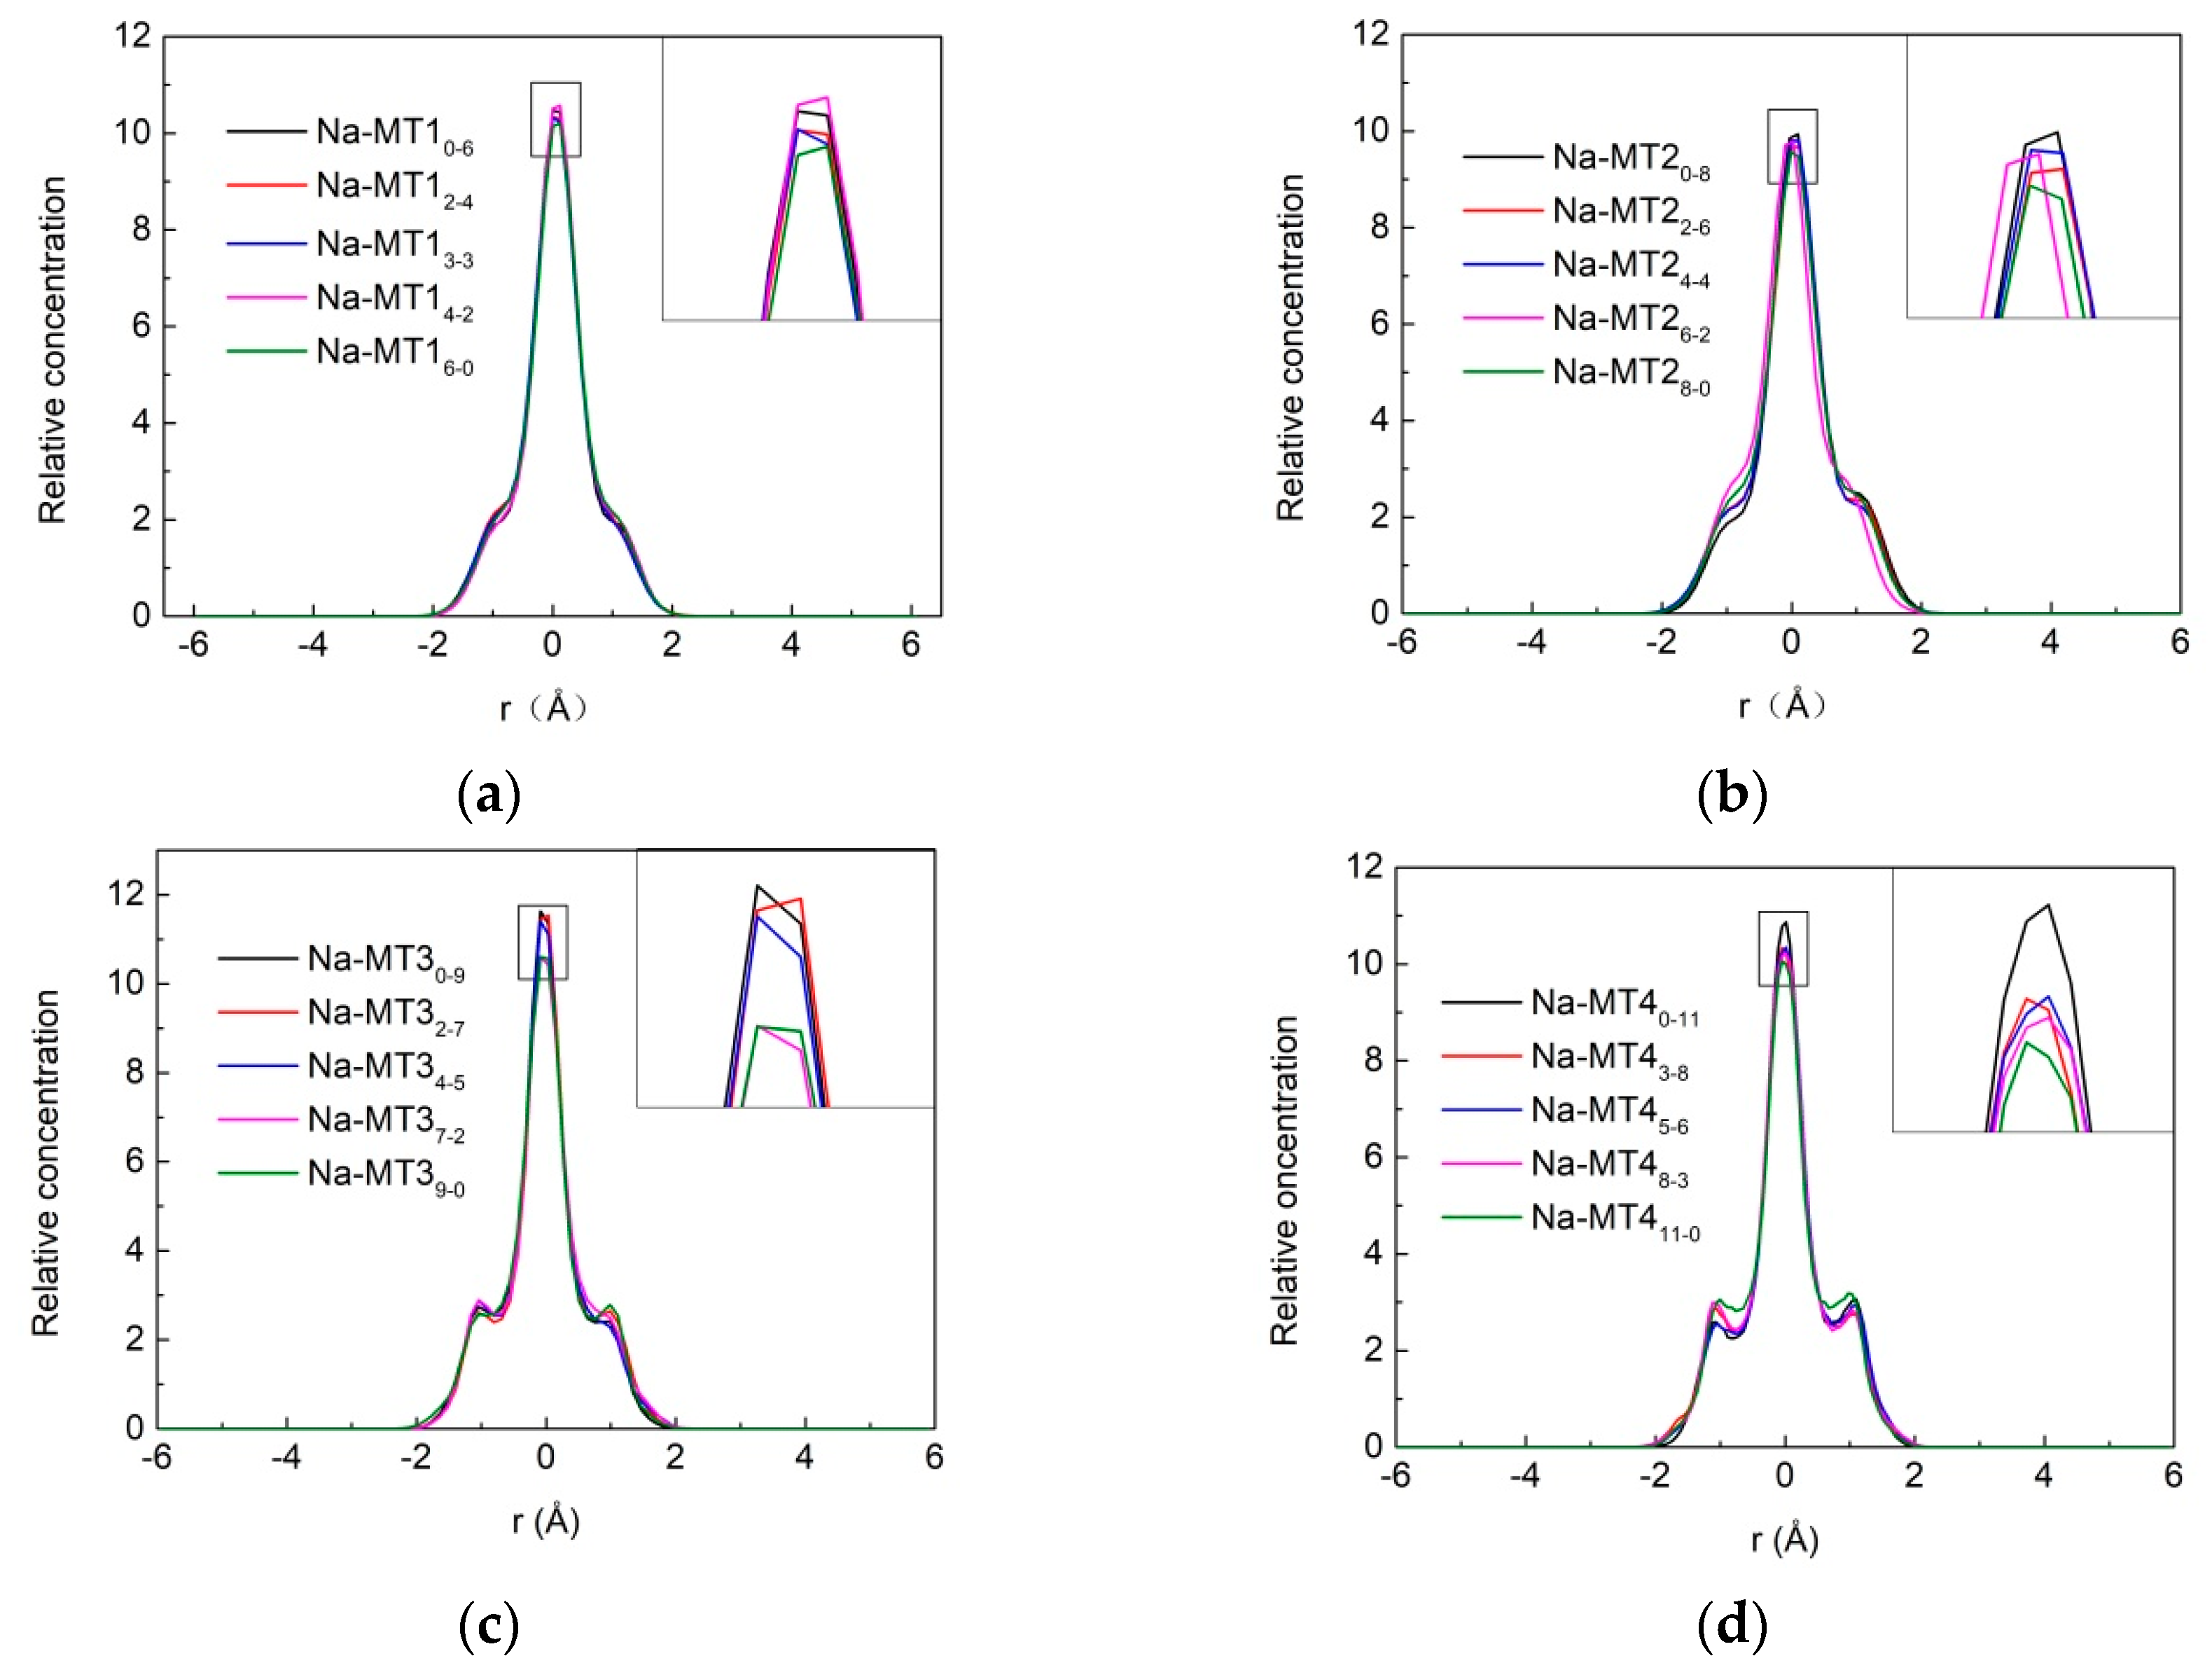
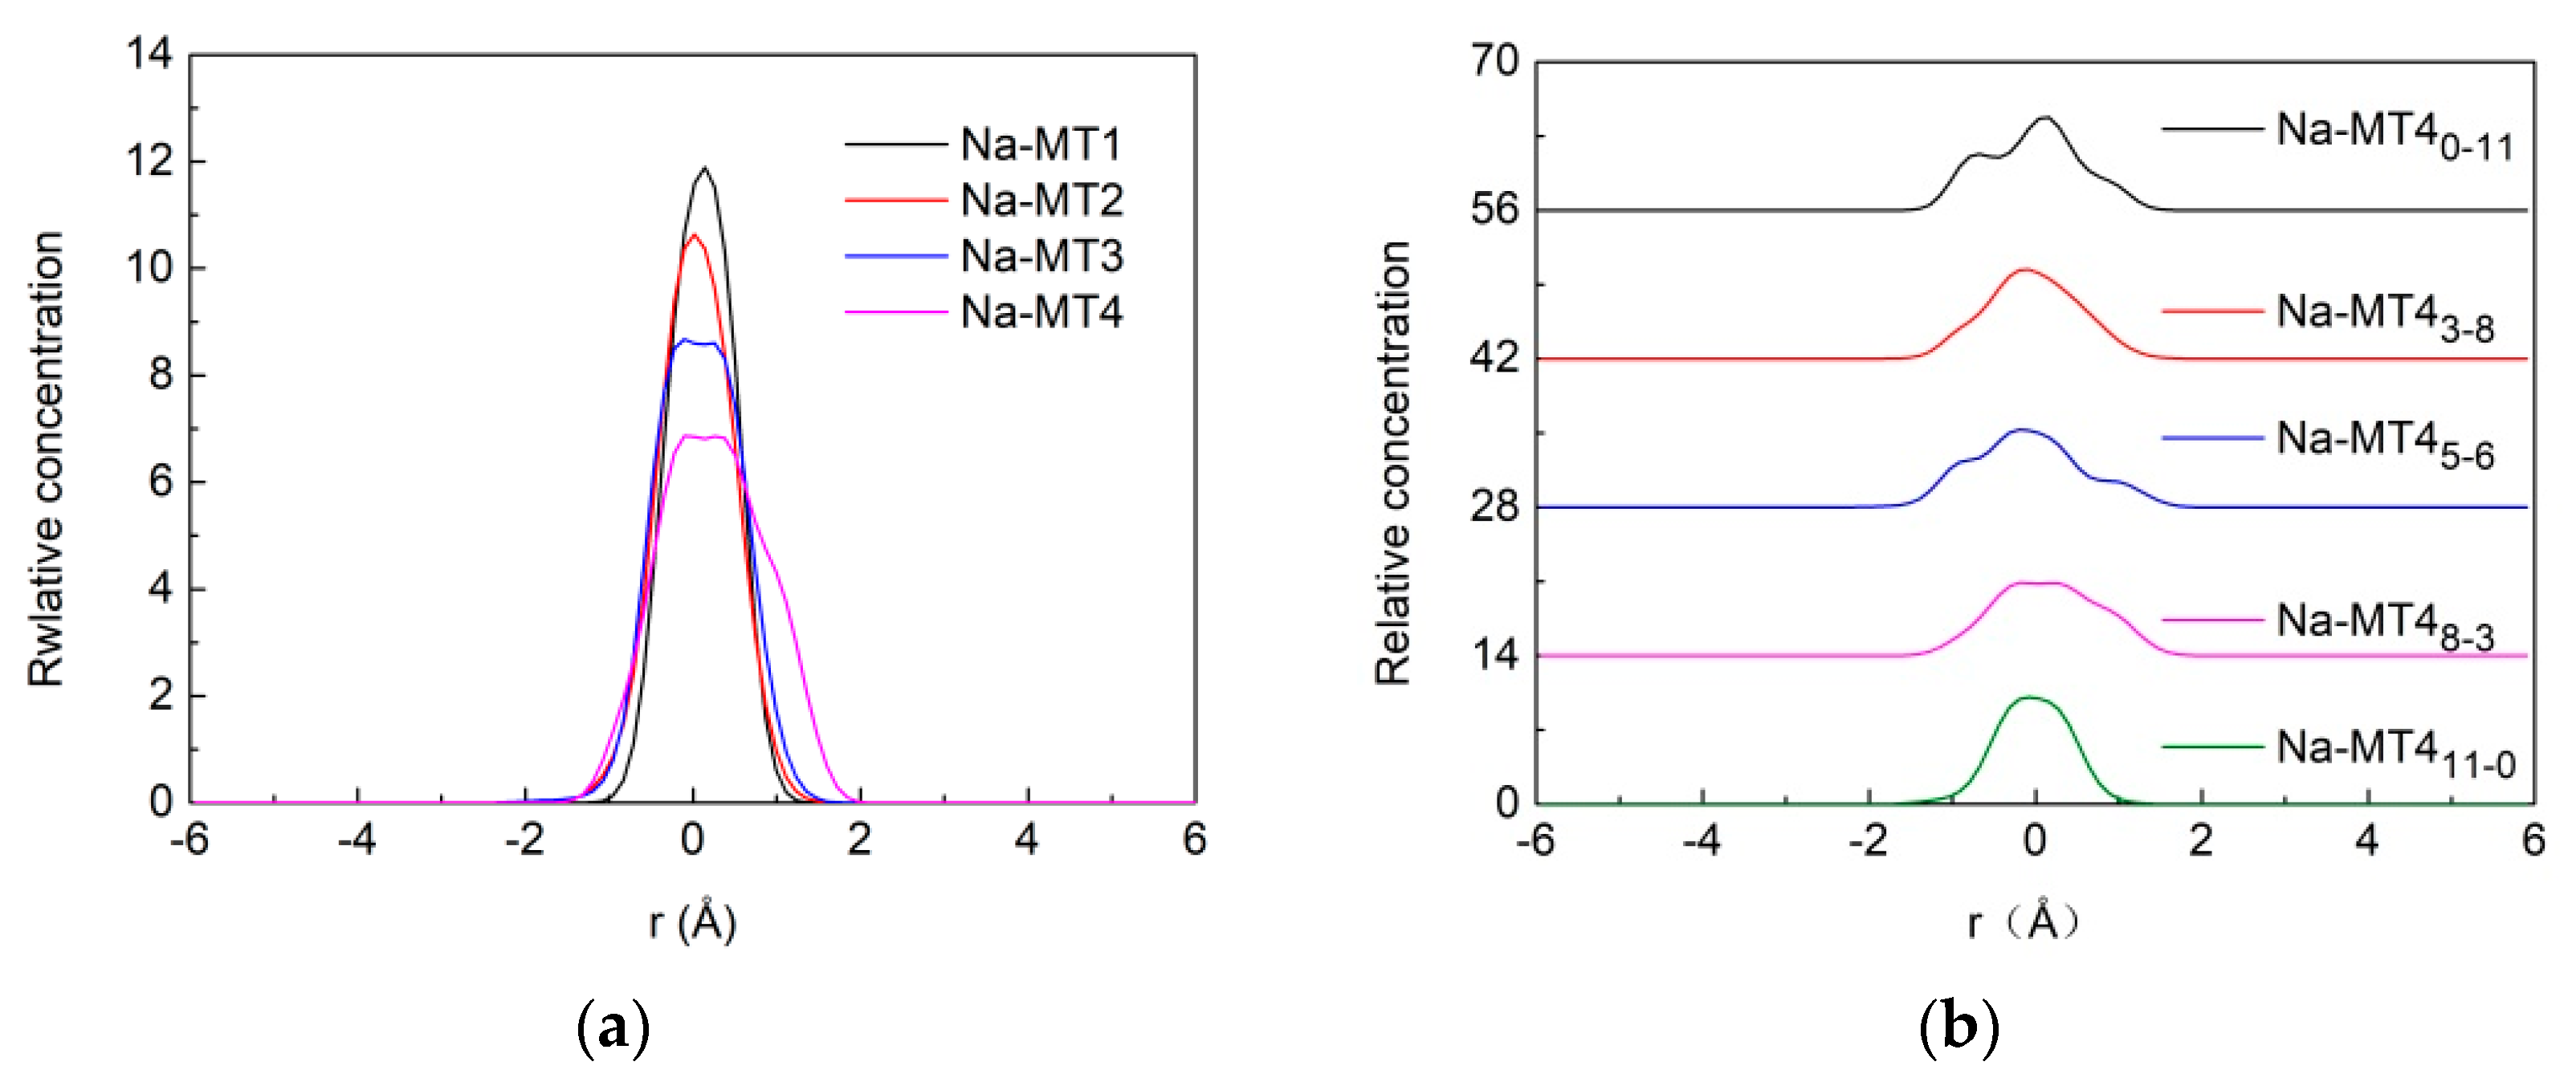
3.1.2. Z-Axis Concentration Profiles of Na+

The z-axis concentration curves of Na+ in interlayer of Na-MT with different crystal chemistry properties are presented in Figure 5.
As shown in Figure 5a, we can find that layer charge density has an obvious impact on the distribution of Na+ in Na-MT. The Na+ are mainly distributed near the central axis of the interlayer domain in the range of −1.5 Å–+1.5 Å, but with the increase of charge density from 0.38 to 0.70, the relative concentration of Na+ decreases clearly from 12.0 to 7.0. This simulation results show that Na+ tend to locate near the central axis of interlayer space in Na-MT1, and diffuse to both sides of Na-MT sheets with the increase of layer charge. The reason is that with the increase of the layer charge density of Na-MT, the negative charge sites generated by isomorphic substitution of Na-MT increase. Furthermore, under the action of electrostatic gravity, Na+ are attracted to the vicinity of the tetrahedral surfaces. As a result, the relative concentration of Na+ decreases. This result is consistent with our previous study on the distribution of Ca2+ between Ca-MT layers [39].
It can be seen from Figure 5b that the relative concentration curves of Na+ are unimodal and change gradually to irregular distribution as the amount of tetrahedral substitution sites increases. This indicates that Na+ are distributed along the central axis when isomorphic substitution mainly occurs in octahedral layers of Na-MT, but Na+ tend to move towards tetrahedral sheets when the amount of tetrahedral substitution sites increases [4]. In Na-MT with the same layer charge, Na+ are closer to the tetrahedral sheets than octahedral layers, when the amount of tetrahedral isomorphic substitution sites increases, the electrostatic interaction between Na+ and Na-MT tetrahedral isomorphic substitution sites will be strengthened due to the short-range spatial effect. Therefore, Na+ will shift from the central axis towards both sides of tetrahedral sheets with the increase of tetrahedral substitution sites.

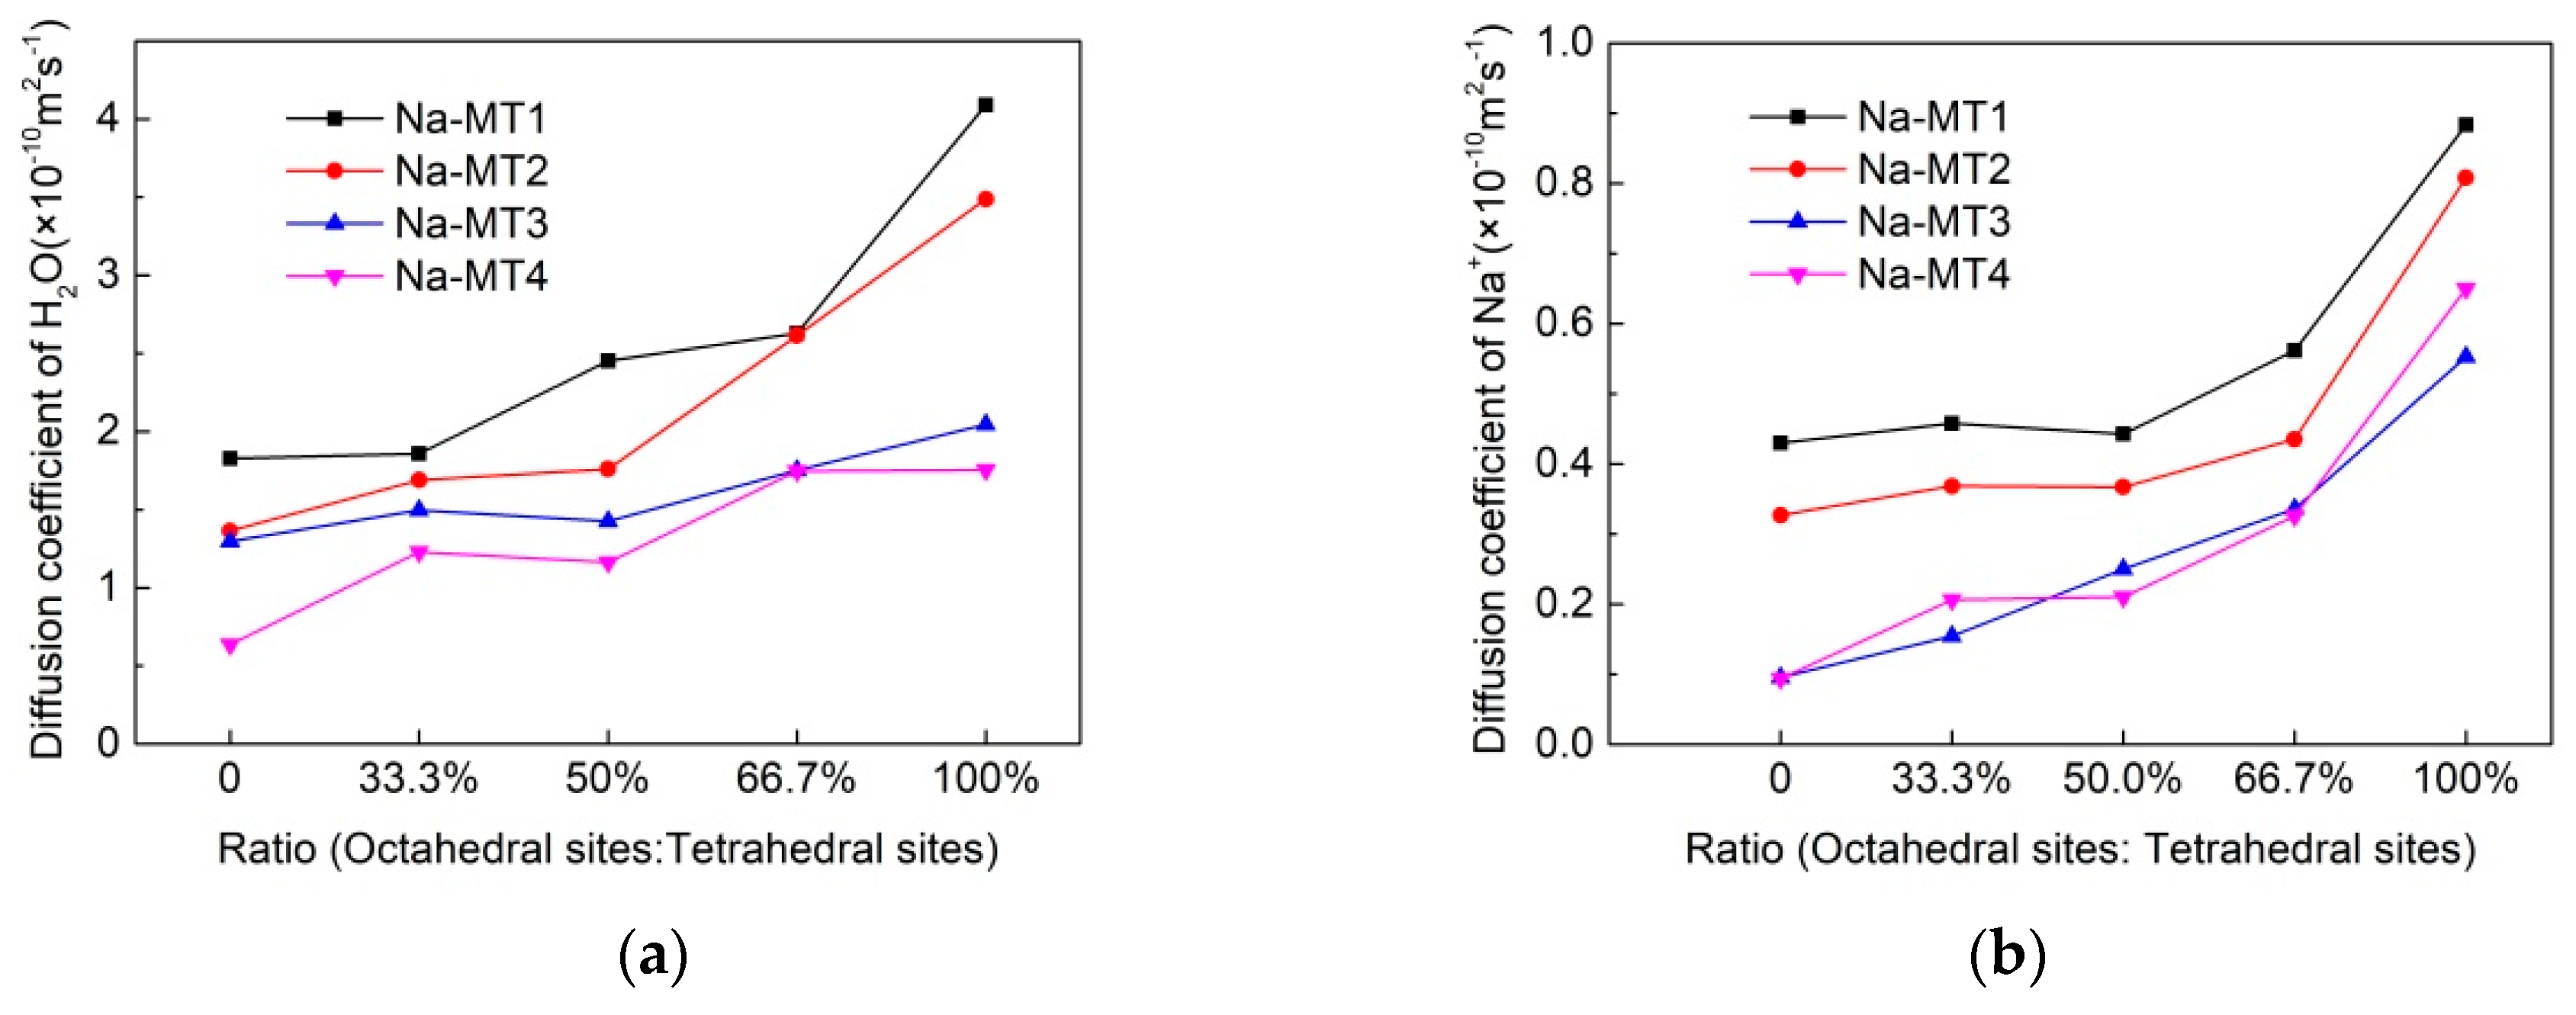
3.2. The Self-Diffusion Coefficient of Particles in Interlayer of Na-MT

The particles in the interlayer of Na-MT will move according to the equations of motion that define the system and have a tendency away from the original position when the system reaches equilibrium [20]. The diffusion coefficient, which can be represented by one-sixth of the slope of mean square displacement (MSD) curves, reflects the change degree of the interlayer particles with time. In order to study the mobility of H2O and Na+, a three-dimensional Einstein relation was used to calculate the self-diffusion coefficient:
D = 1 6 N lim t d d t | r i ( t ) r i ( 0 ) | 2
Here | r i ( t ) r i ( 0 ) | 2 represents the MSD of interlayer species, N is the total number of a given species in the simulation cell, ri(t) is the center-of-mass position of the ith atom at time t [43].
For diffusion coefficient, the results are gotten including two steps, the first step is that the MSD curves are outputted from the last 100 ps of NVT simulation, the second step is that the diffusion coefficient is obtained by linear fitting the MSD curves using Origin 9.0, and the one-sixth of the slope of regression equation is diffusion coefficient. Finally, the results are shown in Table 3 and Figure 6.
It can be seen from Table 3 and Figure 6a that the isomorphic substitution of Na-MT can obviously influence the mobility of H2O, with the increase of the octahedral substitution ratio, the self-diffusion coefficient of H2O in the interlayer of the four types of Na-MT increases. The reason is that the attraction force between Na-MT sheets and H2O is weakened because of the long-range spatial effect when the ratio of octahedral substitution increases. Moreover, it can also be seen from Figure 6a that the self-diffusion coefficient of H2O decreases with the increase of layer charge density. The reason is that with the increase of layer charge density, the available free space within the Na-MT interlayer is decreased (Table 2). At the same time, the polarity of Na-MT surfaces is enhanced, and the attraction force between H2O and Na-MT sheets increases, which results in the decrease of the self-diffusion coefficient of H2O [20].
It can also be seen from Table 3 and Figure 6b that the effect of crystal chemistry properties of Na-MT on the self-diffusion coefficient of Na+ is similar to that of H2O. With the increase of the tetrahedral substitution ratio or the layer charge density of Na-MT, the self-diffusion coefficient of Na+ decreases. When the layer charge density of Na-MT is 0.70 and the ratio of octahedral substitution sites to tetrahedral substitution sites is 0, the self-diffusion coefficient of Na+ and H2O reaches the minimum value of 0.0940 × 10⁻¹⁰ m2/s and 0.6381 × 10⁻¹⁰ m2/s, respectively, compared with H2O, the diffusion coefficient of Na+ is obviously lower. It can be explained that H2O is neutral and Na+ is positive, thus Na+ are fixed more easier than that of H2O by negatively charged Na-MT surfaces.

3.3. Radial Distribution Function (RDF) of Particles in Interlayer of Na-MT

The RDF is defined as the probability density of finding atom A at a distance away from atom B [46], which plays an important role in describing the aggregation characteristics between two types of atoms. The equation for RDF is:
g A B ( r ) = 1 4 π ρ B r 2 d N A B d r
Here g A B is the radial distribution for atom B around atom A, ρ B is the number density of atom B, r is the distance between atom A and atom B, NA–B is often denoted as coordination number N(r) for B around A. In this work, the RDF of Ot-Hw and Ot-Na, as well as the Na-Ow were investigated (Hw and Ow stand for the atom H and atom O in H2O respectively, Ot stands for the atom O in tetrahedral surfaces of Na-MT). In this part, the protocols are set as follows: the cutoff radius is 10.0 Å, the interval is 0.02 Å, and periodic self-interactions are included.

3.3.1. The RDF of Ot-Hw

The RDF of Ot-Hw in the interlayer of the four types of Na-MT with different crystal chemistry properties is shown in Figures 7 and 9, respectively. It can be seen from Figure 7 that the first peak of g(Ot-Hw) in Na-MT with different charge density appears at a distance of approximately 1.676 Å. Moreover, the intensity of the first peak of g(Ot-Hw) increases clearly from 0.5 to 0.8 with the increase of layer charge density. The result indicates that H2O are more tightly packed together near the tetrahedral surfaces in the interlayer domain of Na-MT. The reason is that with the increase of the layer charge density of Na-MT, the polarity of Na-MT surfaces increases, therefore, H2O are more likely attracted by stronger hydrogen bonding force and eventually form hydrogen bonds with Ot at the distance of 1.676 ± 0.043 Å away from tetrahedral surfaces (Figure 8, Na-MT40-11 is shown) [29,30].
It can be seen from Figure 9 that when the layer charge density of Na-MT is lower (a, b and c), the isomorphic substitution has no obvious effect on the g(Ot-Hw); only when the layer charge density is higher (d), the g(Ot-Hw) increase with the increase of amount of tetrahedral substitution sites. This phenomenon is consistent with the z-axis concentration distribution of H2O in the Section 3.1.1.

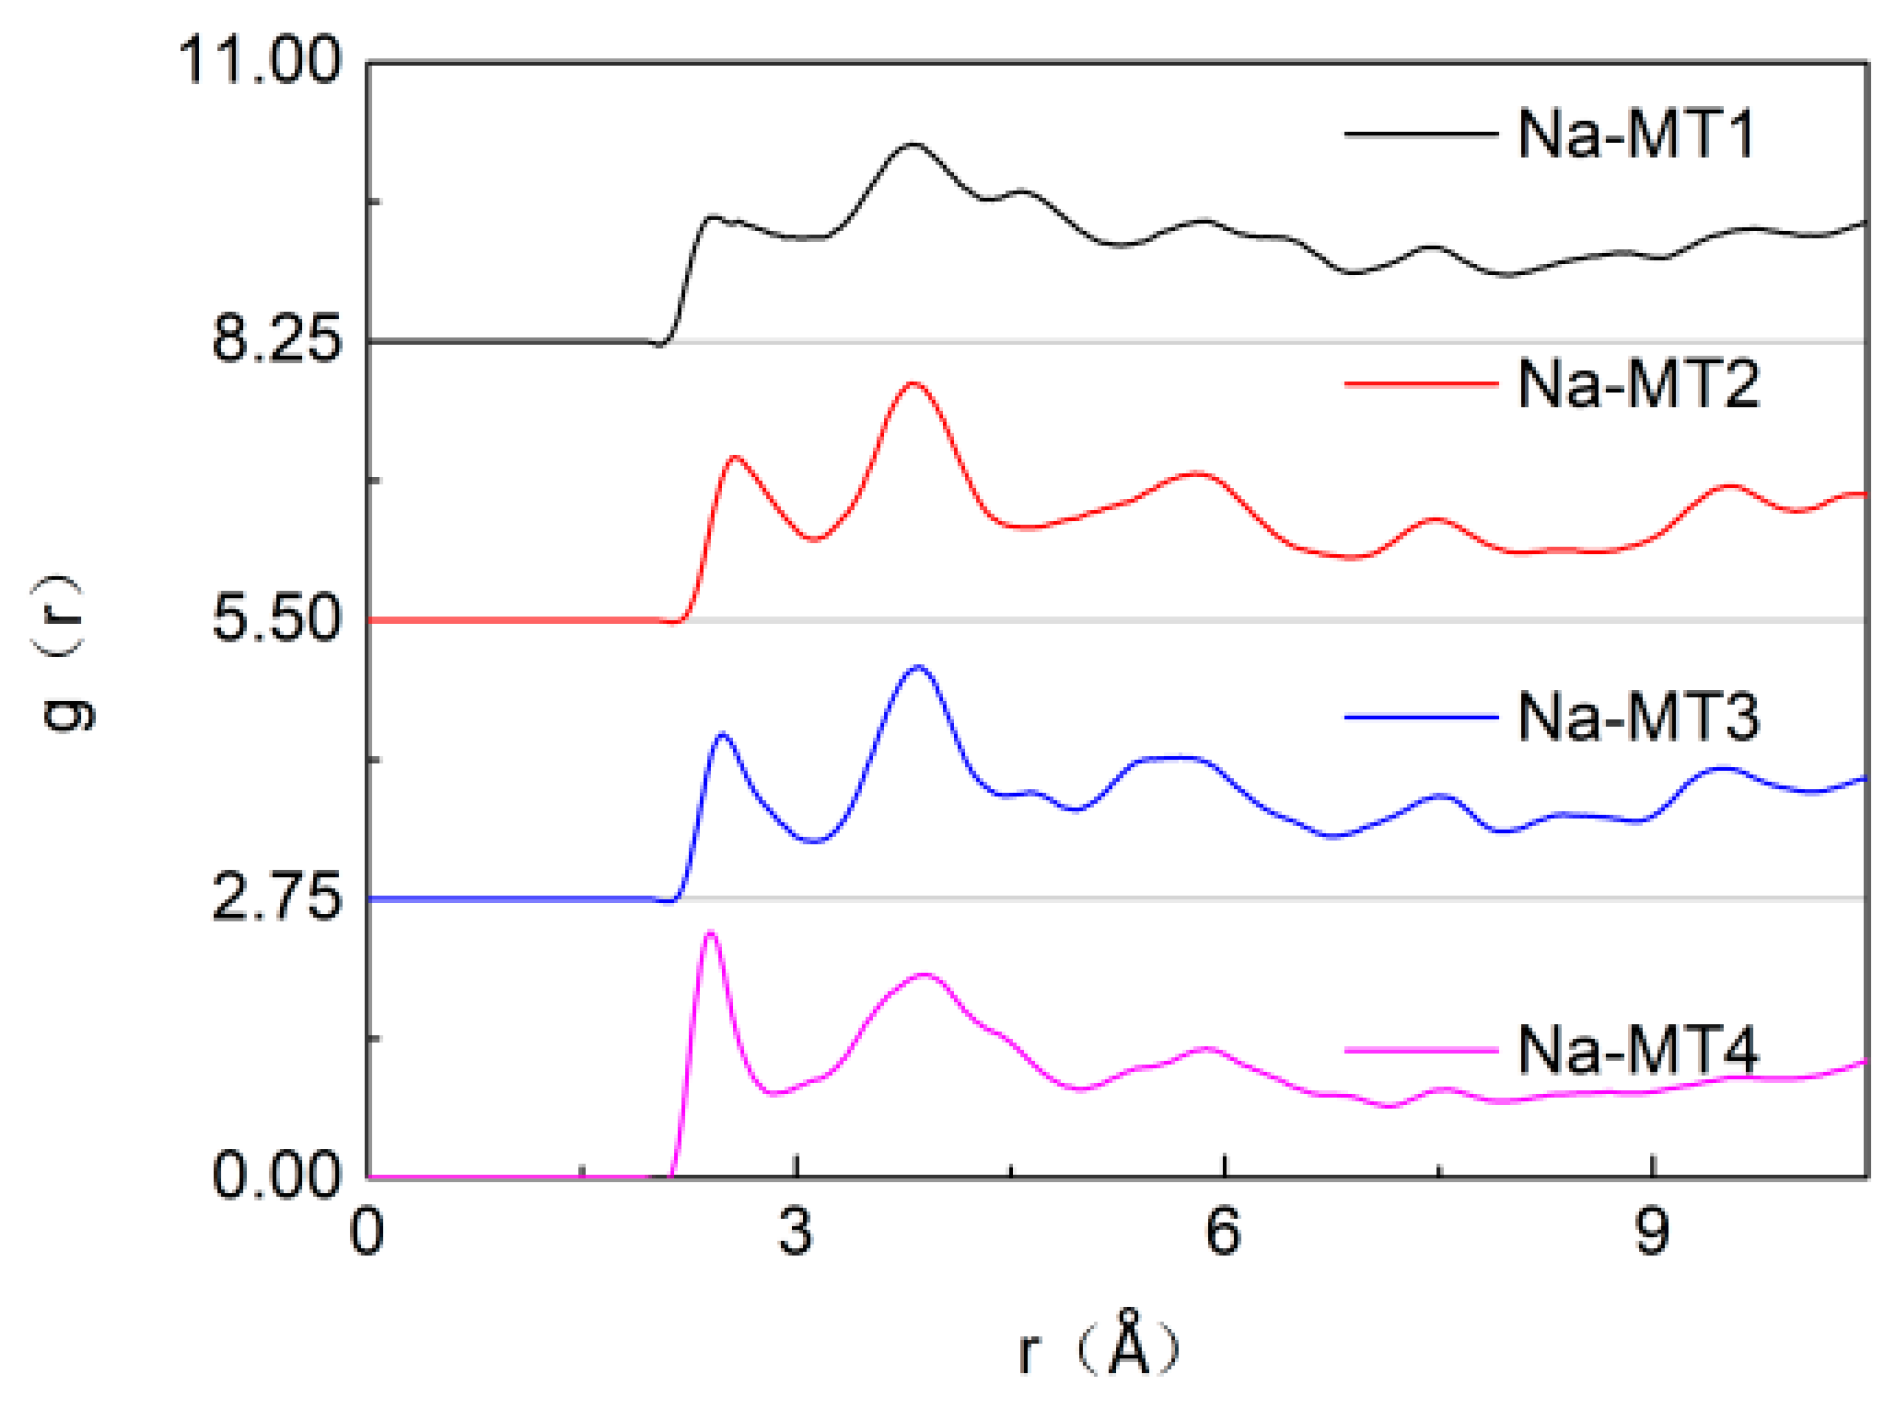
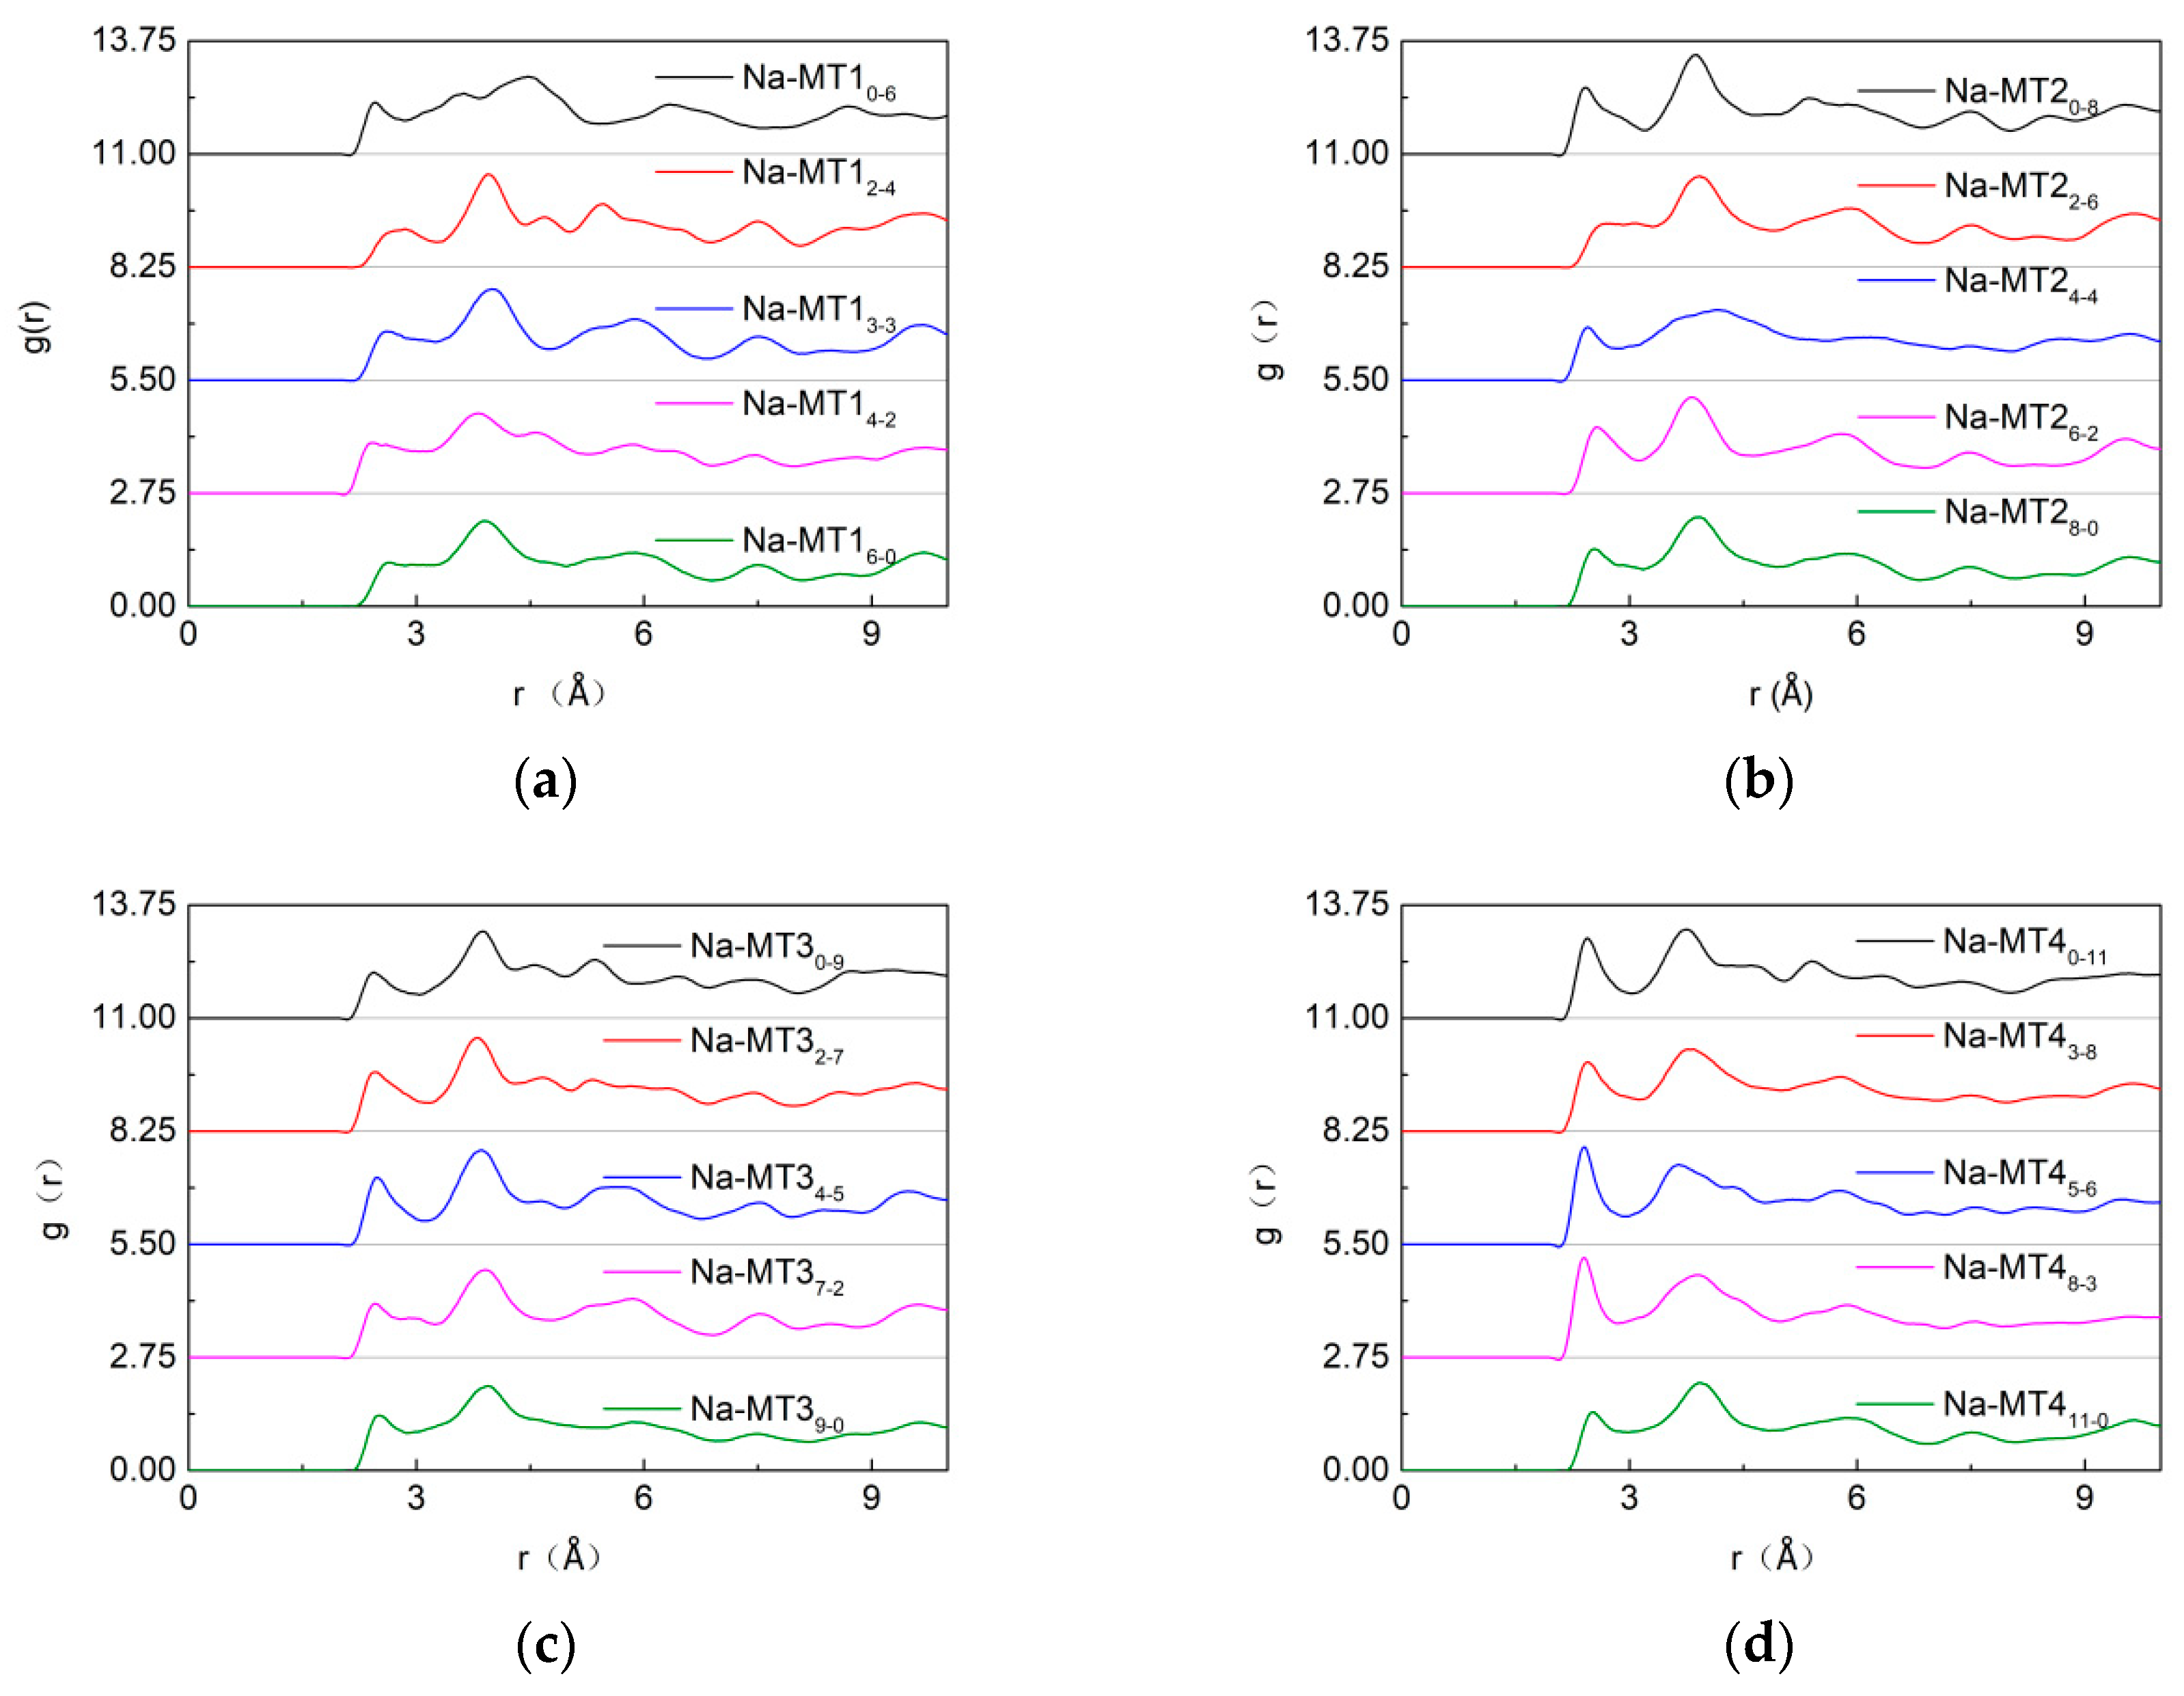
3.3.2. The RDF of Ot-Na

The influence of the crystal chemistry properties on g(Ot-Na) in Na-MT is shown in Figure 10 and Figure 11.
As can be seen from Figure 10, with the increase of layer charge density, the strength of the first peak of g(Ot-Na) increases. The reason is that the higher the layer charge density of the Na-MT, the stronger the polarity of the Na-MT surfaces. The simulation result indicates that under the action of strong polar force, most of the Na+ are attracted to the Na-MT surfaces and coordinate with Ot in the tetrahedral surfaces at a position of 2.38 Å. Compared with the coordination distance of 1.676 ± 0.043 Å between Hw and Ot which can be seen in Figure 8 in Section 3.3.1, the coordination distance is farther.
As can be seen from Figure 11, the impact of isomorphic substitution on the strength of g(Ot-Na) is slight when the layer charge density of Na-MT is lower (a, b and c). But when the layer charge density is higher, the strength of the first peak decreases obviously (d, Na-MT411-0). The reason is that tetrahedral charges are closer to Na+ than that of octahedral charges in Na-MT layers. The electrostatic attraction between both sides of Na-MT sheets and Na+ becomes weakened because of the long-range spatial effect when the octahedral substitution ratio increases, which results in the strength of the first peak of g(Ot-Na) decreasing in Na-MT411-0.

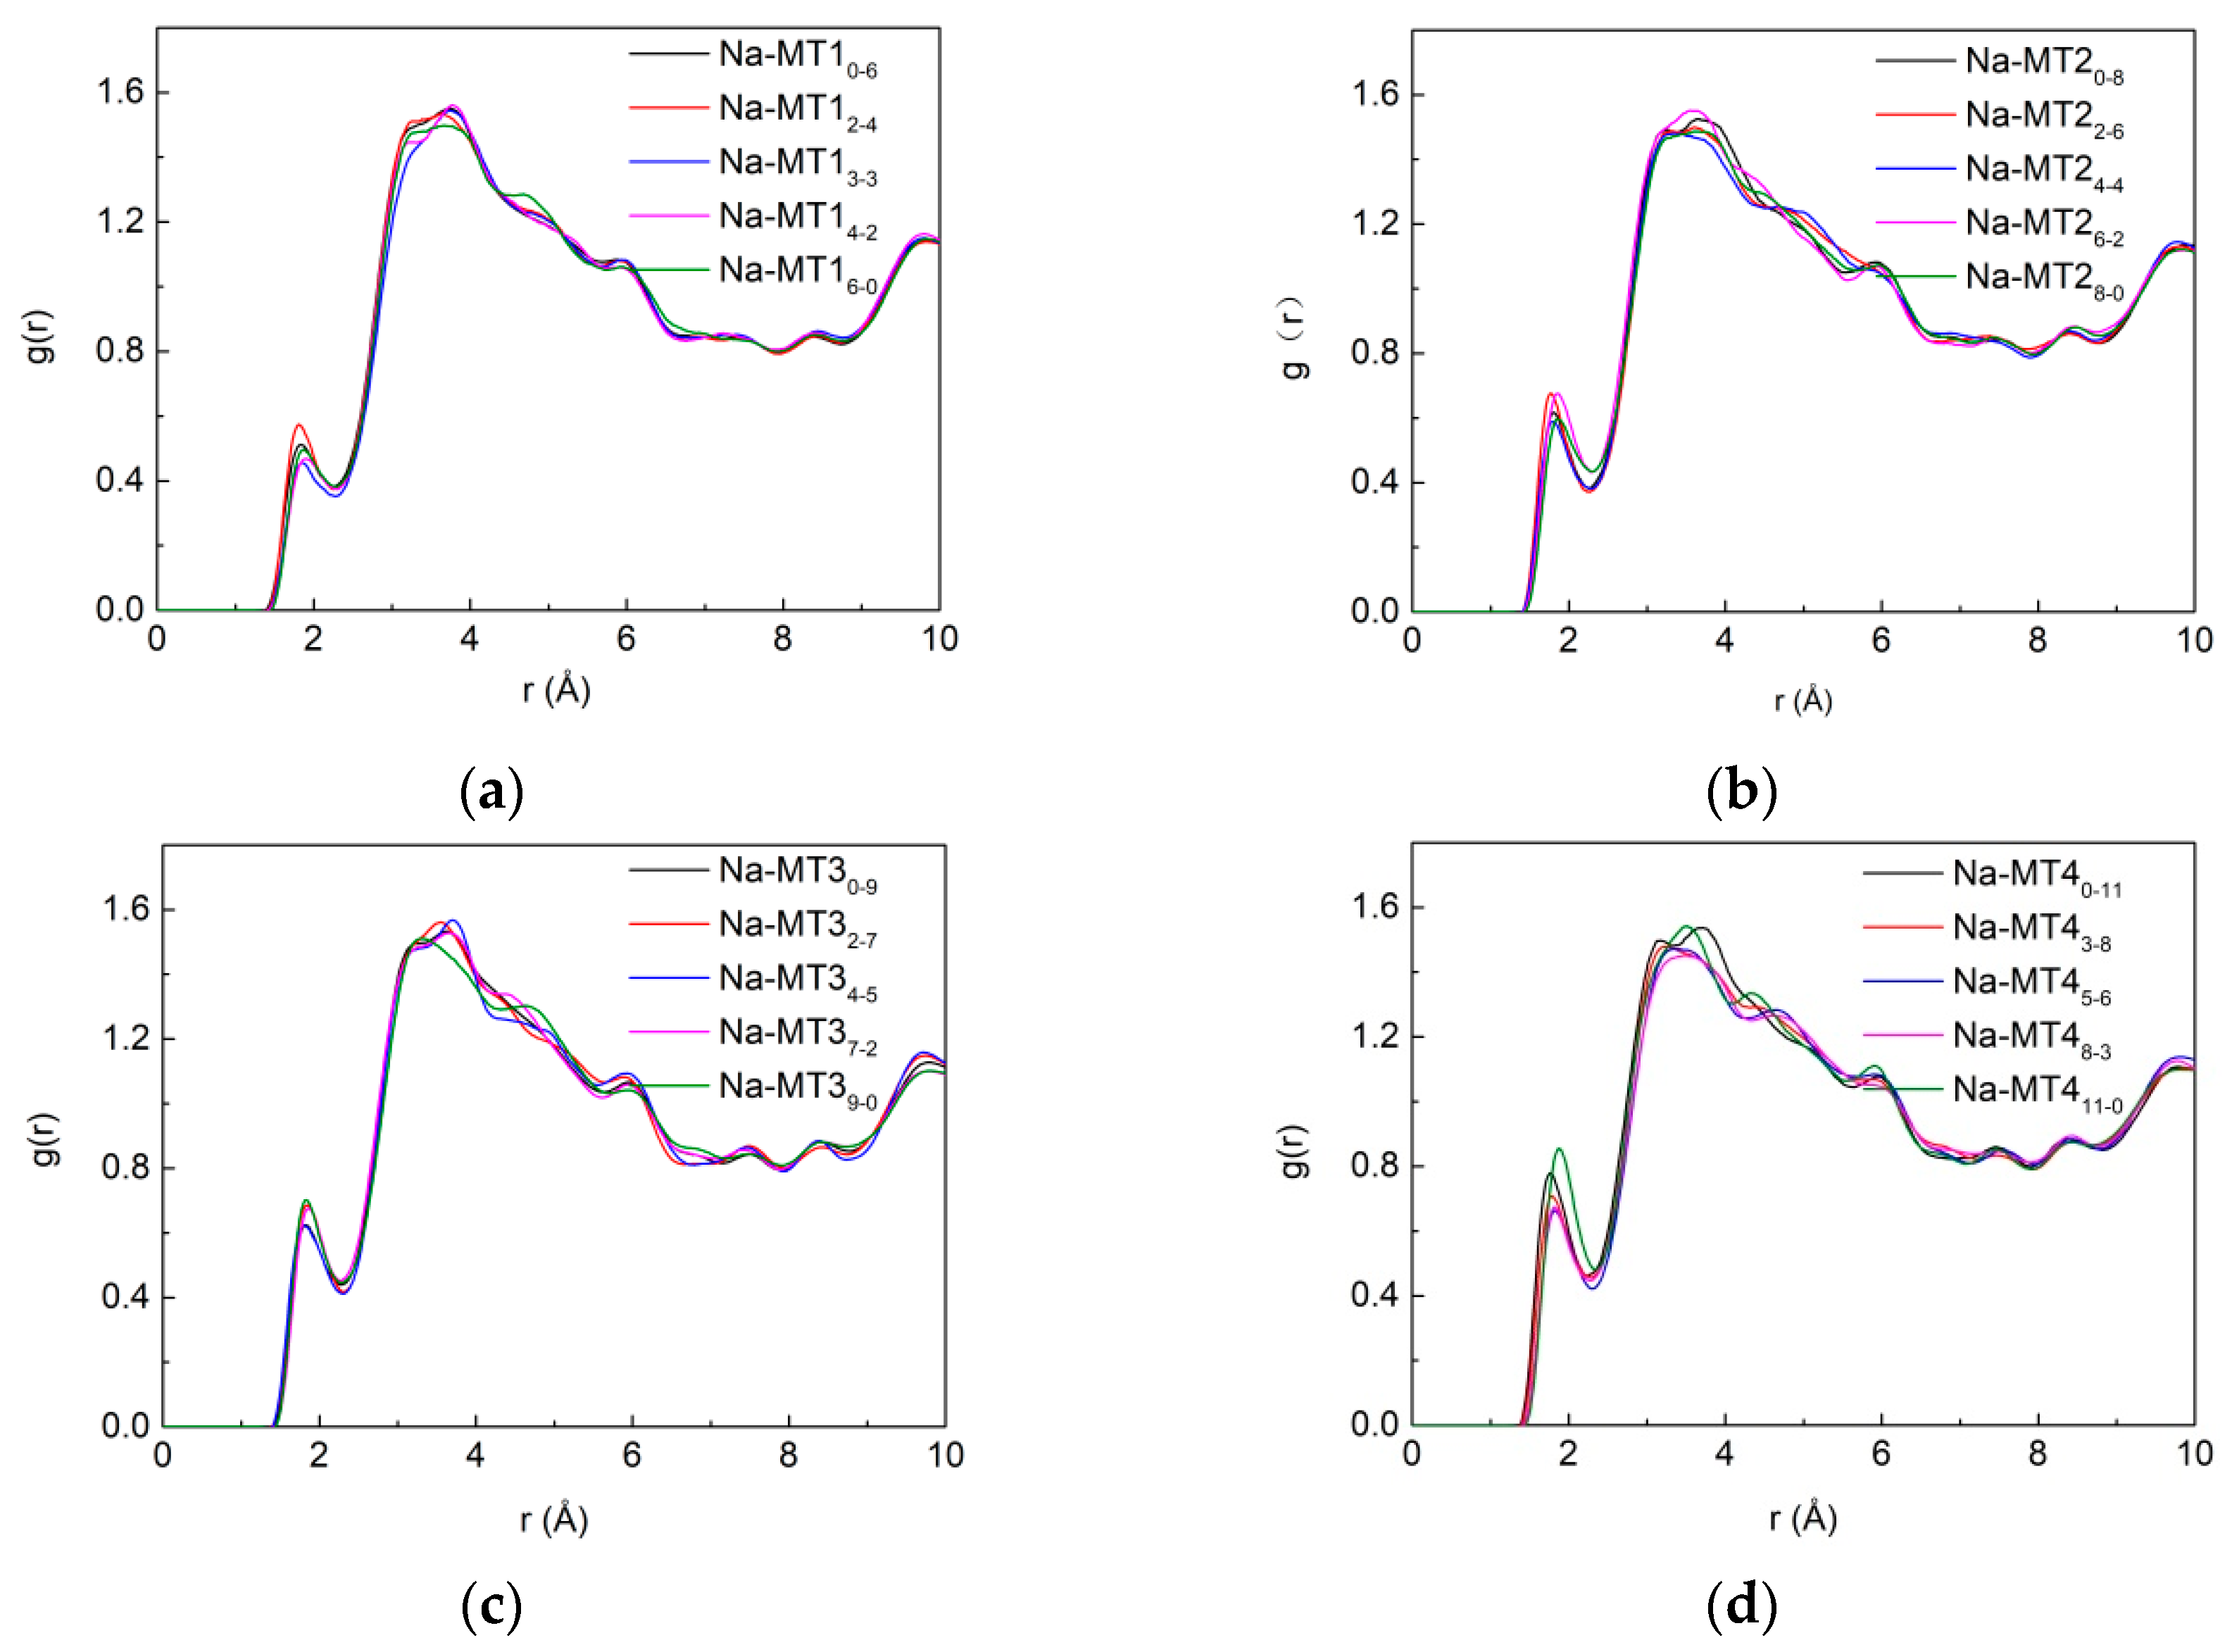
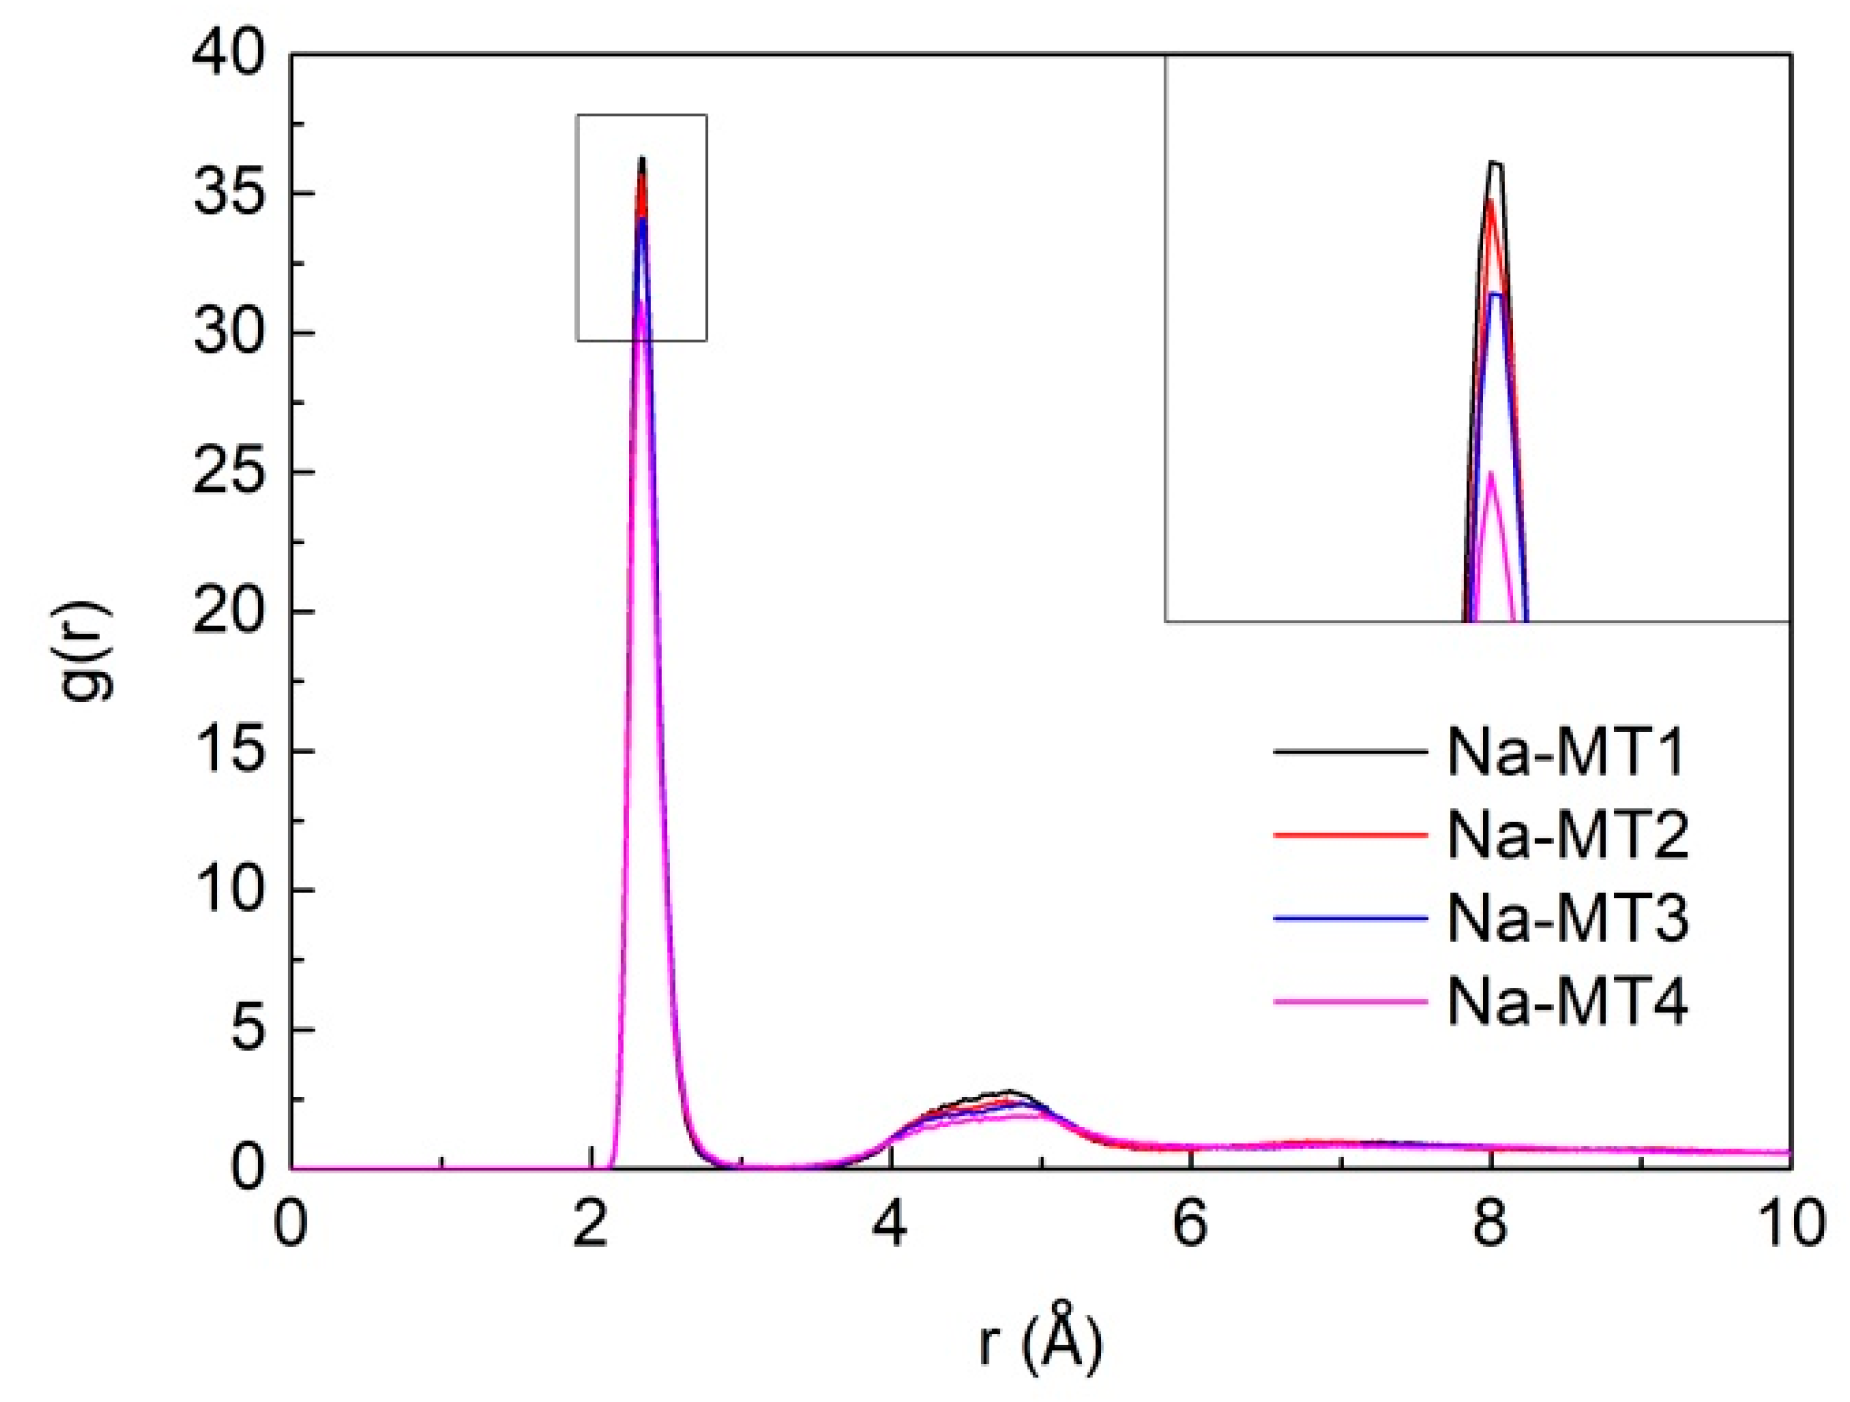
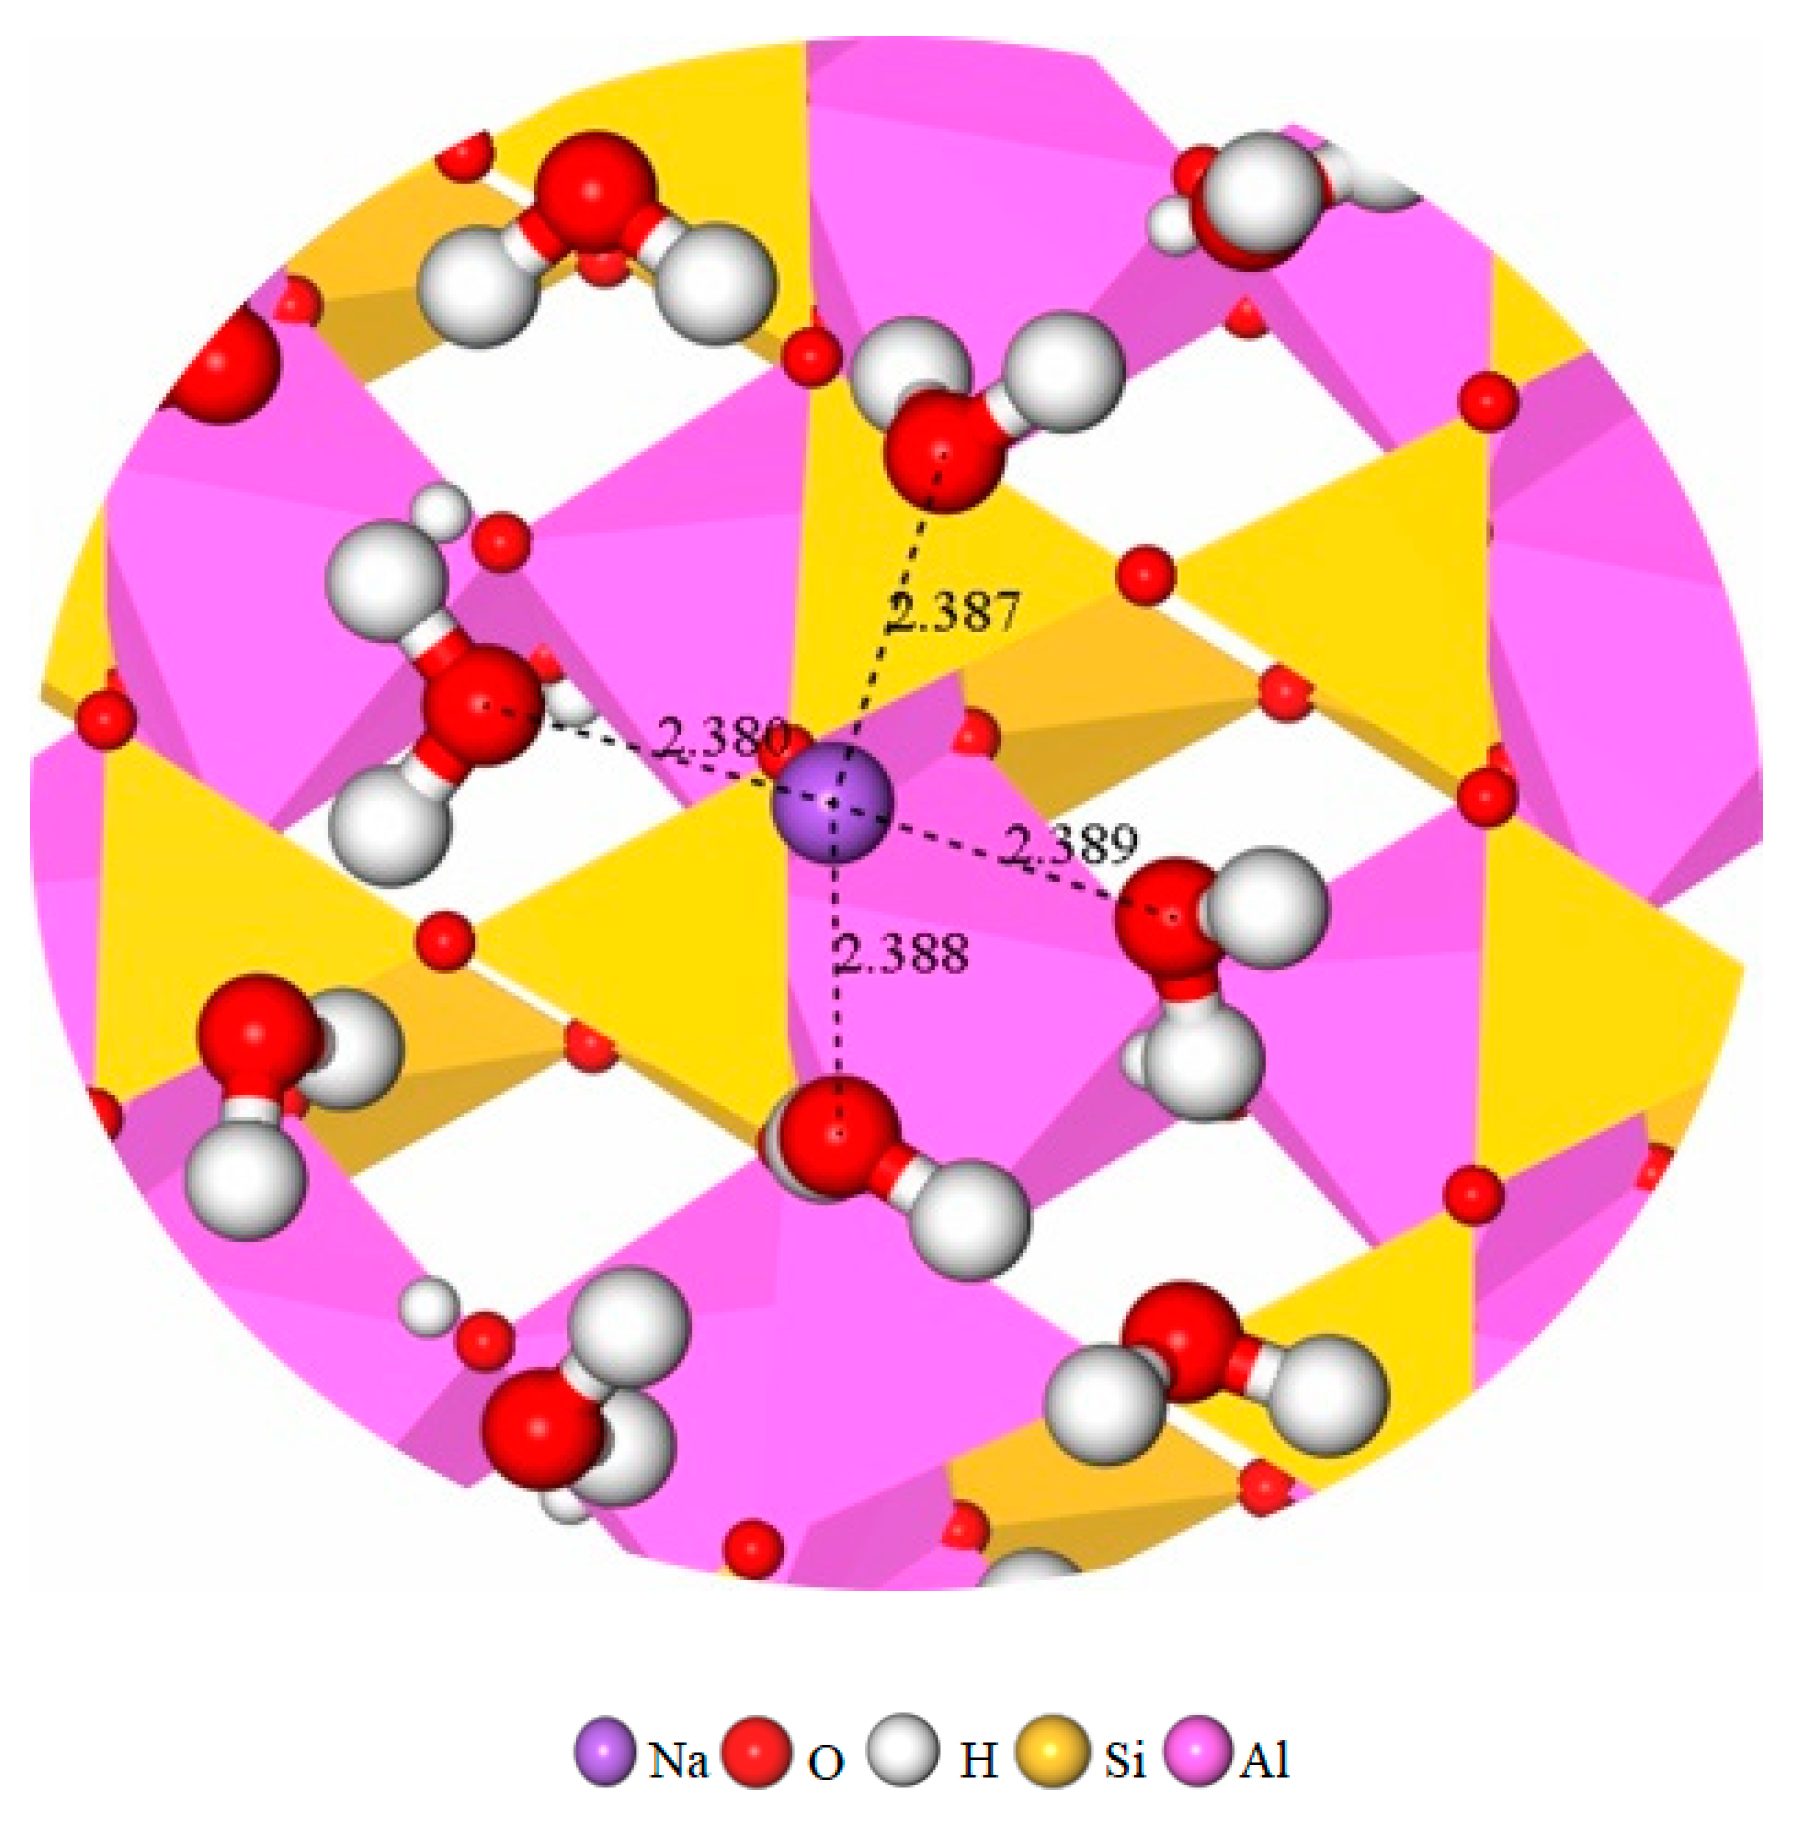
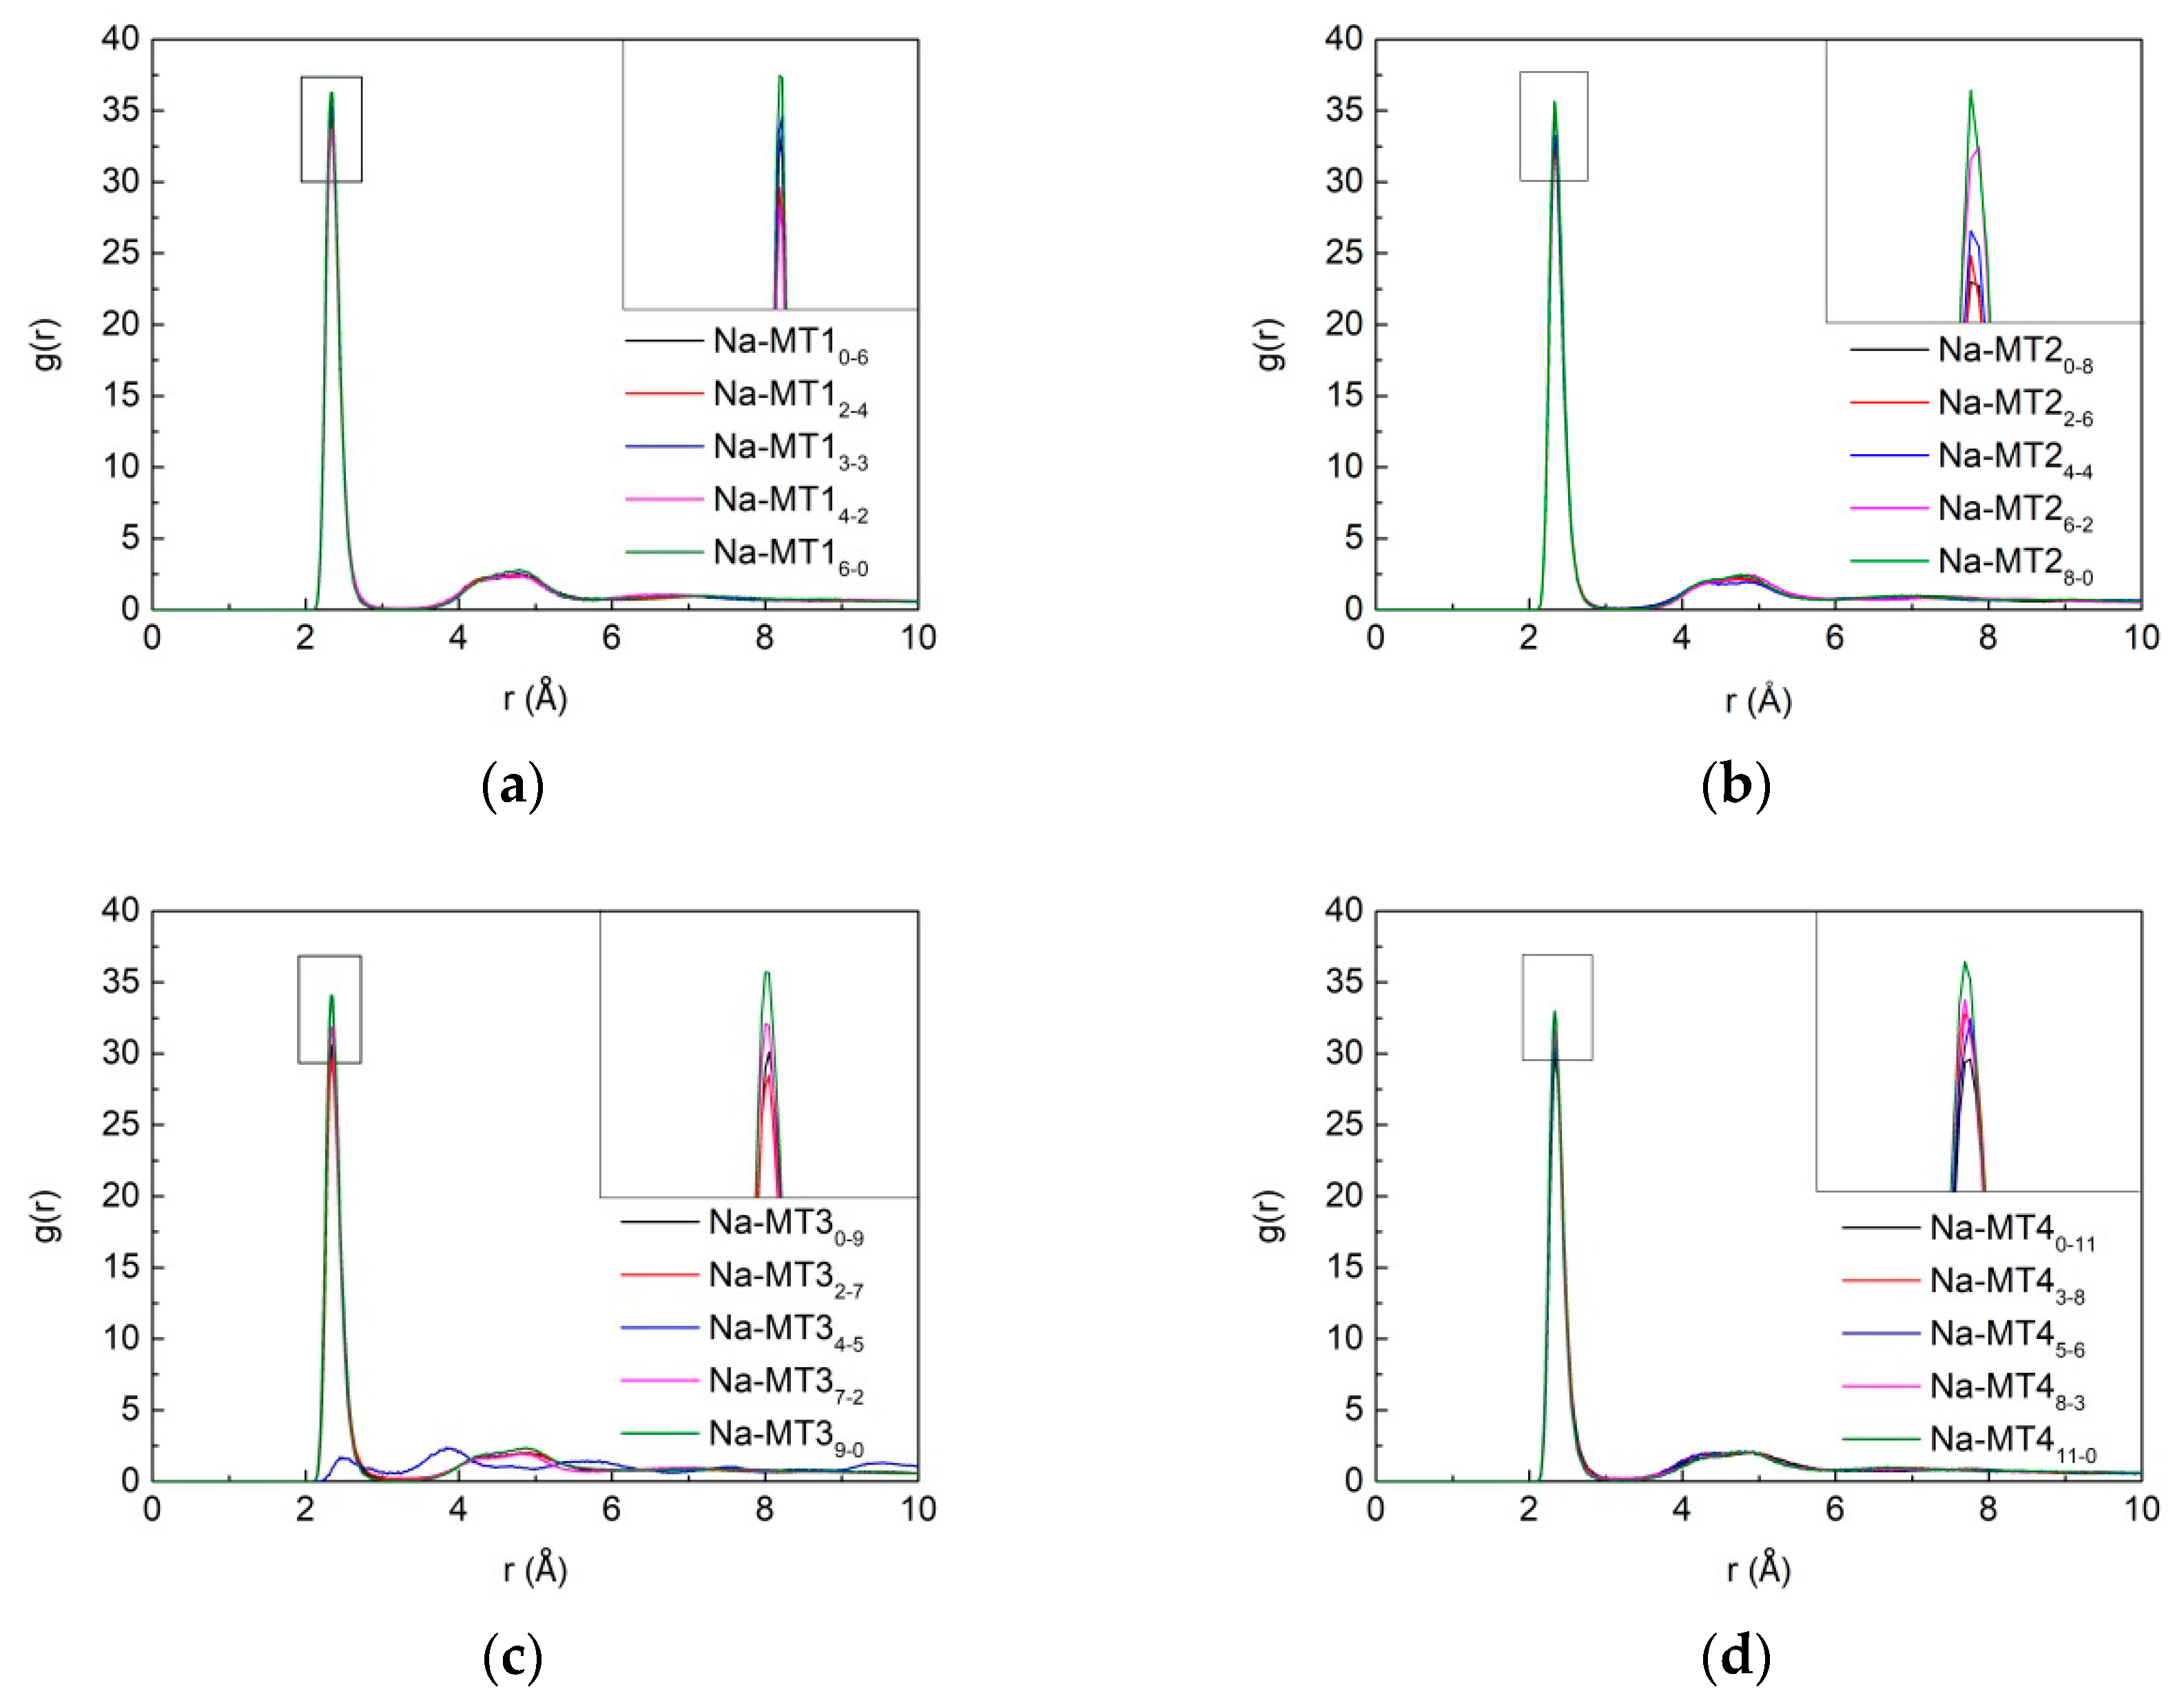
3.3.3. The RDF of Na-Ow

The RDF of Na-Ow in the interlayer of Na-MT with different layer charge density is presented in Figure 12. It can be seen from Figure 12 that the layer charge density of Na-MT has a significant effect on the strength of g(Na-Ow), the main peak of g(Na-Ow) appears at a distance of approximately 2.38 Å and the distance does not change any more with the increase of the layer charge density, which shows that H2O are fixed near the Na+ with a Van der Waals radius of 2.38 Å in Na-MT interlayer. The pictorial diagram about the coordination number and Van der Waals radius of Na+ are shown in Figure 13. This research result is in line with the conclusions acquired by Sun et al. and Seppälä et al. [6,50]. Besides, the strength of the main peak of the g(Na-Ow) increases gradually with the decrease of layer charge density. The reason is that the higher the charge density, the stronger the polarity of Na-MT surfaces. Most H2O in Na-MT interlayer are adsorbed on the Na-MT surfaces under the action of strong polarity gravity, and form hydrogen bonds with the Ot in the tetrahedral surfaces at a position of 1.676 ± 0.043 Å away from the tetrahedral surfaces (Figure 8). Therefore, the coordination strength between Na+ and atoms O in H2O is weakened.
Figure 14 is the RDF of Na-Ow with different isomorphic substitution sites. It can be seen that the isomorphic substitution sites in the structure of Na-MT can significantly influence the aggregation characteristics of Na-Ow ion pairs. With the increase of the octahedral substitution ratio, the strength of the main peak of g(Na-Ow) increases gradually. The reason is that with the increase of the amount of octahedral substitution sites, the distance between the negative potential and Na+ increases, and the electrostatic attraction between Ot in the tetrahedral surfaces and Na+ in Na-MT interlayer decreases due to the long-range spatial effect. As a result, fewer Na+ are transferred to the both sides of tetrahedral surfaces of Na-MT, and more Na+ coordinate with Ow in H2O near the central axis, which leads to the enhancement of the strength of g(Na-Ow).

4. Conclusions

In this work, the influence of layer charge density and isomorphic substitution sites on the spatial distribution of H2O and Na+ in the interlayer of Na-MT was investigated. The simulation results show that the distribution of H2O and Na+ is significantly related to the crystal chemistry properties of Na-MT. In the interlayer domain of Na-MT, H2O are mainly distributed in the range of −2.0 Å~+2.0 Å near the central axis, and when layer charge density increases, H2O tend to shift and form hydrogen bonds with Ot in tetrahedral surfaces at a distance of 1.676 ± 0.043 Å. The impact of isomorphic substitution on the distribution of H2O depends largely on the charge density of Na-MT, when layer charge density is high (such as Na-MT3 and Na-MT4), H2O in the interlayer domain obviously move towards both sides of Na-MT sheets with the increase of octahedral substitution ratio. Compared with H2O, Na+ are mainly concentrated in the range of −1.5 Å~+1.5 Å near the central axis of the Na-MT interlayer, and when layer charge density increases, Na+ also move towards Na-MT sheets and coordinate with Ot at a distance of 2.38 Å. But when layer charge is fixed, the diffusion trend of Na+ is opposite to that of H2O, and Na+ diffuse obviously to both sides of Na-MT sheets with the increase of tetrahedral substitution ratio. The diffusion coefficients of both H2O and Na+ decrease when layer charge density or tetrahedral substitution ratio increases. The radial distribution characteristics of Na-Ow reflect that the aggregation degree of Na-Ow ion pairs becomes worse with the increase of layer charge density or tetrahedral substitution ratio, and Na+ are hydrated by four H2O molecules at a Van der Waals radius of 2.386 ± 0.004 Å.

Supplementary Materials

The following are available online at https://www.mdpi.com/2075-163X/10/2/162/s1, The convergence plot of the system, calculation method and standard error of diffusion coefficient.

Author Contributions

Conceptualization, J.Q.; methodology, D.L.; software, D.L. and S.J.; validation, J.Q., G.W., G.L. and X.L.; formal analysis, G.C., Y.W. and G.Y.; investigation, D.L.; Resources, X.L.; data curation, D.L., S.J. and G.L.; Writing –original draft preparation, D.L.; Writing—review and editing, J.Q., P.W. and X.Z.; visualization, J.Q.; supervision, G.Y.; project administration, X.L.; funding acquisition, J.Q. and G.W. All authors have read and agreed to the published version of the manuscript.

Funding

This work was supported by grants from the National Nature Science Foundation of China: “Design of structure and gelling performance of Montmorillonite/Alkylammonium based on the adsorption properties of Alkylammonium on Montmorillonite” (No: 51774200) and “Study on the immobilization effect and mechanism of heavy metal in sulfide-mine tailings by chelating agent modified bentonite” (No: 51764003).

Acknowledgments

Thanks to the editors and reviewers for their efforts in this paper, and thanks to the virtual simulation laboratory of Shandong University of Science and Technology for software support.

Conflicts of Interest

The authors declare no conflict of interest.

References

  1. Zhang, W.N.; Hu, H.X.; Li, X.C.; Fang, Z.M. Changes in micromechanical properties of Na-montmorillonite caused by CO2/H2O sorption. Comput. Mater. Sci. 2017, 129, 178–183. [Google Scholar] [CrossRef]
  2. Churakov, S.V.; Kosakowski, G. An ab initio molecular dynamics study of hydronium complexation in Na-montmorillonite. Philos. Mag. 2010, 90, 2459–2474. [Google Scholar] [CrossRef]
  3. Wang, Q.; Zhu, C.; Yun, J.; Yang, G. Isomorphic Substitutions in Clay Materials and Adsorption of Metal Ions onto External Surfaces: A DFT Investigation. Phys. Chem. 2017, 121, 26722–26732. [Google Scholar] [CrossRef]
  4. Wu, L.M.; Cao, S.Y.; Lv, G.C. Influence of Energy State of Montmorillonite Interlayer Cations on Organic Intercalation. Adv. Mater. Sci. Eng. 2018, 2018, 1–8. [Google Scholar] [CrossRef] [Green Version]
  5. Michot, L.J.; Ferrage, E.; Jiménez-Ruiz, M.; Boehm, M.; Delville, A. Anisotropic Features of Water and Ion Dynamics in Synthetic Na- and Ca-Smectites with Tetrahedral Layer Charge. A Combined Quasi-elastic Neutron-Scattering and Molecular Dynamics Simulations Study. Phys. Chem. 2012, 116, 16619–16633. [Google Scholar] [CrossRef]
  6. Sun, L.L.; Tanskanen, J.T.; Hirvi, J.T.; Kasa, S.; Schatz, T.; Pakkanen, T.A. Molecular dynamics study of montmorillonite crystalline swelling: Roles of interlayer cation species and water content. Chem. Phys. 2015, 455, 23–31. [Google Scholar] [CrossRef]
  7. Lv, G.; Chang, P.-H.; Xing, X.; Jiang, W.-T.; Jean, J.-S.; Li, Z. Investigation of intercalation of diphenhydramine into the interlayer of smectite by XRD, FTIR, TG-DTG analyses and molecular simulation. Arab. J. Chem. 2017, 10, 855–861. [Google Scholar] [CrossRef] [Green Version]
  8. Maryan, A.S.; Montazer, M. Natural and organo-montmorillonite as antibacterial nanoclays for cotton garment. Ind. Eng. Chem. 2015, 22, 164–170. [Google Scholar] [CrossRef]
  9. Zhou, D.J.; Zhang, Z.P.; Tang, J.L.; Wang, F.W.; Liao, L.B. Applied properties of oil-based drilling fluids with montmorillonites modified by cationic and anionic surfactants. Appl. Clay Sci. 2016, 121, 1–8. [Google Scholar] [CrossRef]
  10. Wang, Y.; Lu, F.J.; Li, Y.J.; Wu, T.; Sun, D.J.; Zhang, G.C.; Huang, X.H.; Wang, G.P. Effects of Na–montmorillonite particles on the emulsification stability of polymer flooding produced water. Colloids Surf. Physicochem. Eng. Aspects. 2012, 410, 125–129. [Google Scholar] [CrossRef]
  11. Li, S.Z.; Wu, P.X.; Li, H.L.; Zhu, N.W.; Li, P.; Wu, J.H.; Wang, X.D.; Dang, Z. Synthesis and characterization of organo-montmorillonite supported iron nanoparticles. Appl. Clay Sci. 2010, 50, 330–336. [Google Scholar] [CrossRef]
  12. Bahranowski, K.; Gaweł, A.; Klimek, A.; Michalik-Zym, A.; Napruszewska, B.D.; Nattich-Rak, M.; Rogowska, M.S.; erwicka, E.M. Influence of purification method of Na-montmorillonite on textural properties of clay mineral composites with TiO2 nanoparticles. Appl. Clay Sci. 2017, 140, 75–80. [Google Scholar] [CrossRef]
  13. Holmboe, M.; Wold, S.; Jonsson, M. Porosity investigation of compacted bentonite using XRD profile modeling. J. Contam. Hydrol. 2012, 128, 19–32. [Google Scholar] [CrossRef] [PubMed]
  14. Viennet, J.-C.; Hubert, F.; Ferrage, E.; Tertre, E.; Legout, A.; Turpault, M.-P. Investigation of clay mineralogy in a temperate acidic soil of a forest using X-ray diffraction profile modeling: Beyond the HIS and HIV description. Geoderma 2015, 241, 75–86. [Google Scholar] [CrossRef]
  15. Ferrage, E.; Tournassat, C.; Rinnert, E.; Lanson, B. Influence of pH on the interlayer cationic composition and hydration state of Ca-montmorillonite: Analytical chemistry, chemical modelling and XRD profile modelling study. Geochim. Cosmochim. Acta 2005, 69, 2797–2812. [Google Scholar] [CrossRef] [Green Version]
  16. Yi, H.; Jia, F.F.; Zhao, Y.L.; Wang, W.; Song, S.X.; Li, H.Q.; Liu, C. Surface wettability of montmorillonite (0 0 1) surface as affected by surface charge and exchangeable cations: A molecular dynamic study. Appl. Surf. Sci. 2018, 459, 148–154. [Google Scholar] [CrossRef]
  17. Yang, N.N.; Liu, S.Y.; Yang, X.N. Molecular simulation of preferential adsorption of CO2 over CH4 in Na-montmorillonite clay material. Appl. Surf. Sci. 2015, 356, 1262–1271. [Google Scholar] [CrossRef]
  18. Suter, J.L.; Kabalan, L.; Khader, M.; Coveney, P.V. Ab initio molecular dynamics study of the interlayer and micropore structure of aqueous montmorillonite clays. Geochim. Cosmochim. Acta 2015, 169, 17–29. [Google Scholar] [CrossRef] [Green Version]
  19. Zhao, Y.L.; Yi, H.; Jia, F.F.; Li, H.L.; Peng, C.S.; Song, S.X. A novel method for determining the thickness of hydration shells on nanosheets: A case ofmontmorillonite in water. Powder Technol. 2017, 307, 74–79. [Google Scholar] [CrossRef]
  20. Yi, H.; Zhang, X.; Zhao, Y.L.; Liu, L.Y.; Song, S.X. Molecular dynamics simulations of hydration shell on montmorillonite (001) in water. Surf. Interface Anal. 2016, 48, 976–980. [Google Scholar] [CrossRef]
  21. Titiloye, J.O.; Skipper, N.T. Monte Carlo and molecular dynamics simulations of methane in potassium montmorillonite clay hydrates at elevated pressures and temperatures. J. Colloid Interface Sci. 2005, 282, 422–427. [Google Scholar] [CrossRef] [PubMed]
  22. Voora, V.K.; Al-Saidi, W.A.; Jordan, K.D. Density functional theory study of pyrophyllite and M-montmorillonites (M = Li, Na, K, Mg, and Ca): Role of dispersion interactions. J. Phys. Chem. A 2011, 115, 9695–9703. [Google Scholar] [CrossRef] [PubMed]
  23. Xing, X.B.; Lv, G.C.; Zhu, W.S.; He, C.; Liao, L.B.; Mei, L.F.; Li, Z.H.; Li, G.W. The binding energy between the interlayer cations and montmorillonite layers and its influence on Pb2+ adsorption. Appl. Clay Sci. 2015, 112, 117–122. [Google Scholar] [CrossRef]
  24. Mei, L.F.; Tao, H.S.; He, C.; Xin, X.B.; Liao, L.B.; Wu, L.M.; Lv, G.C. Cd2+ Exchange for Na+and K+ in the Interlayer of Montmorillonite: Experiment and Molecular Simulation. J. Nanomater. 2015, 2015. [Google Scholar] [CrossRef] [Green Version]
  25. Wu, L.M.; Liao, L.B.; Lv, G.C. Influence of interlayer cations on organic intercalation of montmorillonite. J. Colloid Interface Sci. 2015, 454, 1–7. [Google Scholar] [CrossRef] [PubMed]
  26. Zhou, J.H.; Lu, X.C.; Boek, E.S. Changes in the Interlayer Structure and Thermodynamics of Hydrated Montmorillonite under Basin Conditions: Molecular Simulation Approaches. Clays Clay Miner. 2016, 64, 503–511. [Google Scholar] [CrossRef]
  27. Akinwunmi, B.; Sun, L.L.; Hirvi, J.T.; Kasa, S.; Pakkanen, T.A. Influence of temperature on the swelling pressure of bentonite clay. Chem. Phys. 2019, 516, 177–181. [Google Scholar] [CrossRef]
  28. Peng, J.F.; Yi, H.; Song, S.X.; Zhan, W.Q.; Zhao, Y.L. Driving force for the swelling of montmorillonite as affected by surface charge and exchangeable cations: A molecular dynamic study. Results Phys. 2019, 12, 113–117. [Google Scholar] [CrossRef]
  29. Qiu, J.; Li, G.Q.; Liu, D.L.; Jiang, S.; Wang, G.F.; Chen, P.; Zhu, X.N.; Yao, G.; Liu, X.D.; Lyu, X.J. Effect of Layer Charge Density on Hydration Properties of Montmorillonite: Molecular Dynamics Simulation and Experimental Study. Int. J. Mol. Sci. 2019, 20, 3991–3997. [Google Scholar] [CrossRef] [Green Version]
  30. Shen, W.; Li, L.; Zhou, H.J.; Zhou, Q.; Chen, M.; Zhu, J.X. Effects of charge density on the hydration of siloxane surface of montmorillonite: A molecular dynamics simulation study. Appl. Clay Sci. 2018, 159, 10–15. [Google Scholar] [CrossRef]
  31. Wungu, T.D.K.; Diño, W.A.; Dipojono, H.K.; Kasai, H. Effect of Lithium Absorption at Tetrahedral Site and Isomorphic Substitution on Montmorillonite Properties: A Density Functional Theory Study. Jpn. J. Appl. Phys. 2011, 50, 055701. [Google Scholar]
  32. Zhang, X.; Yi, H.; Bai, H.Y.; Zhao, Y.L.; Min, F.F.; Song, S.X. Correlation of montmorillonite exfoliation with interlayer cations in the preparation of two-dimensional nanosheets. Rsc. Adv. 2017, 7, 41471–41478. [Google Scholar] [CrossRef] [Green Version]
  33. Chang, F.R.C.; Skipper, N.T.; Sposito, G. Computer Simulation of Interlayer Molecular Structure in Sodium Montmorillonite Hydrates. Langmuir 1995, 11, 2734–2741. [Google Scholar] [CrossRef]
  34. Tambach, T.J.; Bolhuis, P.G.; Hensen, E.J.M.; Smit, B. Hysteresis in Clay Swelling Induced by Hydrogen Bonding: Accurate Prediction of Swelling States. Langmuir 2006, 22, 1223–1234. [Google Scholar] [CrossRef] [PubMed]
  35. Wang, Q.; Huang, L. Molecular insight into competitive adsorption of methane and carbon dioxide in montmorillonite: Effect of clay structure and water content. Fuel 2019, 239, 32–43. [Google Scholar] [CrossRef]
  36. Ferrage, E. Investigation of smectite hydration properties by modeling experimental X-ray diffraction patterns: Part I. Montmorillonite hydration properties. Am. Mineral. 2005, 90, 1358–1374. [Google Scholar] [CrossRef] [Green Version]
  37. Zhang, X.; Yi, H.; Zhao, Y.L.; Min, F.F.; Song, S.X. Study on the differences of Na- and Ca-montmorillonites in crystalline swelling regime through molecular dynamics simulation. Adv. Powder Technol. 2016, 27, 779–785. [Google Scholar] [CrossRef]
  38. Yang, N.N.; Yang, X.N. Molecular simulation of swelling and structure for Na-Wyoming montmorillonite in supercritical CO2. Mol. Sim. 2011, 37, 1063–1070. [Google Scholar] [CrossRef]
  39. Qiu, J.; Li, G.Q.; Liu, D.L.; Jiang, S.; Wang, G.F.; Chen, P.; Zhu, X.N.; Cao, X.Q.; Lyu, X.J. Effect of Layer Charge Characteristics on the Distribution Characteristics of H2O and Ca(2+) in Ca-Montmorillonites Interlayer Space: Molecular Dynamics Simulation. Materials 2019, 12, 2318. [Google Scholar] [CrossRef] [Green Version]
  40. Vao-soongnern, V.; Pipatpanukul, C.; Horpibulsuk, S. A combined X-ray absorption spectroscopy and molecular dynamic simulation to study the local structure potassium ion in hydrated montmorillonite. J. Mater. Sci. 2015, 50, 7126–7136. [Google Scholar] [CrossRef]
  41. Zheng, Y.; Zaoui, A. Mechanical behavior in hydrated Na-montmorillonite clay. Phys. A 2018, 505, 582–590. [Google Scholar] [CrossRef]
  42. Underwood, T.; Erastova, V.; Greenwell, H.C. Ion Adsorption at Clay-mineral Surfaces: The Hofmeister Series For Hydrated Smectite Minerals. Clays Clay Miner. 2016, 64, 472–487. [Google Scholar] [CrossRef] [Green Version]
  43. Zheng, Y.; Zaoui, A. How water and counterions diffuse into the hydrated montmorillonite. Solid State Ionics 2011, 203, 80–85. [Google Scholar] [CrossRef]
  44. Liu, T.; Chen, Y.Q. A molecular dynamics study of the swelling patterns of Na/Cs-montmorillonites and the hydration of interlayer cations. Chin. Phys. B 2013, 22, 027103. [Google Scholar] [CrossRef]
  45. Zhou, Q.; Lu, X.C.; Liu, X.D.; Zhang, L.H.; He, H.P.; Zhu, J.X.; Yuan, P. Hydration of methane intercalated in Na-smectites with distinct layer charge: Insights from molecular simulations. J. Colloid Interface Sci. 2011, 355, 237–242. [Google Scholar] [CrossRef]
  46. Yan, K.F.; Li, X.S.; Xu, C.G.; Lv, Q.N.; Ruan, X.K. Molecular dynamics simulation of the intercalation behaviors of methane hydrate in montmorillonite. J. Mol. Model. 2014, 20, 2311. [Google Scholar] [CrossRef]
  47. Randall, T.C.; Liang, J.J.; Andrey, G.K. Molecular Models of Hydroxide, Oxyhydroxide, and Clay Phases and the Development of a General Force Field. J. Phys. Chem. 2004, 108, 1255–1266. [Google Scholar]
  48. Meleshyn, A.; Tunega, D. Adsorption of phenanthrene on Na-montmorillonite: A model study. Geoderma 2011, 169, 41–46. [Google Scholar] [CrossRef]
  49. Wang, J.F.; Gutierrez, M. Molecular simulations of clay minerals: A study considering the change of cell size and shape. Acta Geotech. 2010, 5, 151–167. [Google Scholar] [CrossRef]
  50. Seppälä, A.; Puhakka, E.; Olin, M. Effect of layer charge on the crystalline swelling of Na+, K+ and Ca2+ montmorillonites: DFT and molecular dynamics studies. Clay Miner. 2018, 51, 197–211. [Google Scholar] [CrossRef] [Green Version]
Figure 1. The models of Na-montmorillonite (Na-MT) before geometry optimization, (a) Na-MT10-6; (b) Na-MT16-0.
Minerals 10 00162 g001
Figure 2. The models of Na-MT after geometry optimization, (a) Na-MT10-6; (b) Na-MT16-0.
Minerals 10 00162 g002
Figure 3. The z-axis concentration curves of H2O in interlayer of Na-MT with different layer charge density.
Minerals 10 00162 g003
Figure 4. The z-axis concentration curves of H2O in interlayer of Na-MT with different isomorphic substitution sites, (a) Na-MT1; (b) Na-MT2; (c) Na-MT3; (d) Na-MT4.
Minerals 10 00162 g004
Figure 5. The z-axis concentration curves of Na+ in interlayer of Na-MT, (a) effect of layer charge density on the distribution of Na+; (b) effect of isomorphic substitution sites on the distribution of Na+ in interlayer of Na-MT4 (the concentration distribution of Na+ in interlayer of Na-MT1, Na-MT2 and Na-MT3 is similar to that of Na-MT4, thus here only Na-MT4 is displayed.)
Minerals 10 00162 g005
Figure 6. The self-diffusion coefficient of H2O and Na+ within the interlayer of Na-MT with different crystal chemistry properties, (a) H2O, (b) Na+.
Minerals 10 00162 g006
Figure 7. The RDF of Ot-Hw in Na-MT with different layer charge density.
Minerals 10 00162 g007
Figure 8. Hydrogen bonds are formed between H in H2O and O in tetrahedral surfaces at the distance of 1.676 ± 0.043 Å in Na-MT40-11.
Minerals 10 00162 g008
Figure 9. The RDF of Ot-Hw in Na-MT with different isomorphic substitution sites, (a) Na-MT1; (b) Na-MT2; (c) Na-MT3; (d) Na-MT4.
Minerals 10 00162 g009
Figure 10. The RDF of Ot-Na in Na-MT with different layer charge density.
Minerals 10 00162 g010
Figure 11. The RDF of Ot-Na in Na-MT with different isomorphic substitution sites, (a) Na-MT1; (b) Na-MT2; (c) Na-MT3; (d) Na-MT4.
Minerals 10 00162 g011
Figure 12. The RDF of Na-Ow in Na-MT with different layer charge density.
Minerals 10 00162 g012
Figure 13. Na+ coordinate with four H2O at a Van der Waals radius of 2.386 ± 0.004 Å in Na-MT10-6.
Minerals 10 00162 g013
Figure 14. The RDF of Na-Ow in Na-MT with different isomorphic substitution sites, (a) Na-MT1, (b) Na-MT2, (c) Na-MT3 and (d) Na-MT4.
Minerals 10 00162 g014
Table 1. The ratio of octahedron:tetrahedron (Oct:Td) substitutions.
Na-MT10-62-43-34-26-0
Oct:Td substitutions ratios033.3%50.0%66.7%100.0%
Na-MT20-82-64-46-28-0
Oct:Td substitutions ratios025.0%50.0%75.0%100.0%
Na-MT30-92-74-57-29-0
Oct:Td substitutions ratios022.2%44.4%77.8%100.0%
Na-MT40-113-85-68-311-0
Oct:Td substitutions ratios027.3%45.5%72.7%100.0%
Table 2. The crystal cell parameters of twenty Na-MT models after geometry optimization.
Na-MT10-62-43-34-26-0
Volume/Å39195.109165.039198.719140.919218.54
c/Å12.3012.2812.3412.2112.31
β/°99.7100.3100.599.299.2
Na-MT20-82-64-46-28-0
Volume/Å39143.399176.349176.069038.189168.08
c/Å12.2412.2712.2612.1212.30
β/°99.999.799.3100.5100.6
Na-MT30-92-74-57-29-0
Volume/Å39056.519037.139084.029138.529156.57
c/Å12.1112.11121412.2112.22
β/°99.5100.299.599.498.8
Na-MT40-113-85-68-311-0
Volume/Å39073.539132.799146.439165.339129.02
c/Å12.1612.2312.2212.2412.17
β/°100.1100.199.399.198.6
Table 3. The self-diffusion coefficient of H2O and Na+ in interlayer of Na-MT with different crystal chemistry properties (unit: ×10−10 m2/s, and the standard error were generated from linear fitting in Origin 9.0 and please see details in the Supplementary Materials).
SpeciesType033.3%50.0%66.7%100%
H2ONa-MT11.8282 ± 0.00001.8582 ± 0.00032.4531 ± 0.00022.6298 ± 0.00004.0896 ± 0.0002
Na-MT21.3651 ± 0.00021.6890 ± 0.00001.7600 ± 0.00022.6150 ± 0.00023.4874 ± 0.0002
Na-MT31.2979 ± 0.00041.4970 ± 0.00021.4260 ± 0.00021.7523 ± 0.00032.0442 ± 0.0002
Na-MT40.6381 ± 0.00011.2300 ± 0.00021.1637 ± 0.00021.7482 ± 0.00031.7549 ± 0.0001
Na+Na-MT10.4298 ± 0.00010.4578 ± 0.00010.4428 ± 0.00020.5617 ± 0.00010.8835 ± 0.0000
Na-MT20.3268 ± 0.00000.3683 ± 0.00020.3670 ± 0.00010.4352 ± 0.00030.8083 ± 0.0000
Na-MT30.0958 ± 0.00020.1545 ± 0.00030.2500 ± 0.00020.3360 ± 0.00050.5530 ± 0.0002
Na-MT40.0940 ± 0.00000.2060 ± 0.00020.2103 ± 0.00020.3258 ± 0.00030.6498 ± 0.0003

