Abstract
A representative collection of K-dioctahedral 1M micas ranging in composition from (Mg, Fe)-poor illites to aluminoceladonites through Mg-rich illites (Fe-poor varieties) and from Fe-bearing, Mg-rich illites to celadonites through Fe-illites, Al-glauconites and glauconites (Fe-bearing varieties) was studied by Fourier-transform infrared (FTIR) spectroscopy in the middle-infrared region. Analysis and comparison of the relationships between the band positions and cation compositions of Fe-poor and Fe-bearing K-dioctahedral micas provided a generalized set of FTIR identification criteria that include the band positions and profiles in the regions of Si–O bending, Si–O stretching, and OH-stretching vibrations. FTIR data allow unambiguous identification of illites, aluminoceladonites, and celadonites, as well as distinction between Fe-illites and illites proper, as well as between Al-glauconites and glauconites. Specifically, a sharp maximum from the AlOHMg stretching vibration at ~3600 cm−1, the presence of a MgOHMg stretching vibration at 3583–3585 cm−1, as well as characteristic band positions in the Si–O bending (435–439, 468–472 and 509–520 cm−1) and stretching regions (985–1012 and 1090–1112 cm−1) are clearly indicative of aluminoceladonite. The distinction between Fe-illites and Al-glauconites, which have similar FTIR features, requires data on cation composition and unit-cell parameters.
1. Introduction
Low-temperature K-dioctahedral micas, which are abundant in various geological settings, normally occur as fine-dispersed, interlayer-deficient varieties and 1M and 1Md polytypes. These micas display a wide diversity of isomorphous cation substitutions in the tetrahedral and octahedral sheets and form two intersecting isomorphous series. The first series includes varieties with iron contents of ≤0.3 cations per half-formula unit (p.h.f.u.), which range in composition from (Mg, Fe)-poor illites to aluminoceladonites through Mg-rich illites. The second series comprises Fe-bearing micas, from Fe-bearing, Mg-rich illites to celadonites through Fe-illites, Al-glauconites and glauconites [1,2,3,4,5,6,7,8]. Fe-bearing, Mg-rich illites with a total Fe content of ~0.3 cations p.h.f.u. are a common joint between the two mica series [8].
The complexity and heterogeneity of chemical composition and structural features, as well as the ambiguity in conventional nomenclature, complicate the identification of these mica varieties. Zviagina et al. [7,8] formulated a set of diagnostic criteria based on combinations of unit-cell parameters and cation composition variation ranges that are specific for each mica group in the two series. In particular, the distinctive features of aluminoceladonite, which has been often confused with illite, are reduced values of csinβ and |ccosβ/a| parameters in combination with b parameters that are smaller than those for Mg-rich illites, and slightly greater than those of (Mg, Fe)-poor illites. The compositional boundary between (Mg, Fe)-poor illite and Mg-rich illite occurs at Si ~3.4 and Mg + Fe2+ ~0.2 cations p.h.f.u., and that between Mg-rich illite and aluminoceladonite occurs at Si ~3.7 and Mg + Fe2+ ~0.6 cations p.h.f.u. [7].
The basic compositional parameters characterizing the Fe-bearing mica varieties are the total contents of Fe and Al cations and the ratio of octahedral Al cation contents to the total amount of octahedral Al and Fe3+ cations p.h.f.u., KAl. In particular, the KAl values are ~0.9 in Fe-bearing, Mg-rich illites, 0.65–0.75 in Fe-illites, 0.5–0.6 in Al-glauconites, <0.5 in glauconites and (in most cases) <0.2 in celadonites [8].
In certain instances, however, the composition and unit-cell parameters variation ranges for different mica groups may overlap (e.g., Al-glauconites and glauconites) leading to complications in the identification. Moreover, simulation of powder X-ray diffraction (XRD) patterns of finely dispersed dioctahedral Fe-bearing dioctahedral micas shows that they may display phase microheterogeneity [9]. This, in turn, may lead to the presence of atypical bands in the IR spectra of micas of highly heterogeneous compositions.
Important additional diagnostic information for K-dioctahedral 1M mica varieties may be obtained from Fourier-transform infrared (FTIR) spectroscopy data and, in particular, from the spectra in the middle-infrared (MIR) region. The MIR spectroscopy of K-dioctahedral micas is addressed in numerous studies (e.g., [7,8,10,11,12,13,14,15,16,17,18,19,20,21,22,23,24,25,26,27,28,29,30] and references therein). For the most part, however, these works either deal with high-temperature 2M1 varieties (muscovite and/or phengite) or cover a limited range of 1M mica compositions (e.g., illite or celadonite). Beran [20] deliberately chose not to include illite and glauconite in his survey of the IR spectroscopic data on micas, as these minerals were “vaguely defined” and occurred “in clay-size fractions”. Slonimskaya et al. [13] and Besson and Drits [17,18], who analyzed the 1M K-dioctahedral micas within a wide compositional range (illites, glauconites, aluminoceladonites and celadonites), only focused on the OH-stretching vibrations. The most recent IR studies deal with geological applications of spectroscopy data on white mica (e.g., [29,31] or with other groups of silicate minerals [32,33]).
Recently, a number of diagnostic features that include the band positions and profile in the regions of Si–O bending, Si–O stretching, and OH-stretching vibrations were suggested for the illite-aluminoceladonite series [7] and the Fe-bearing K-dioctahedral micas [8]. The objectives of the present work were to (a) compare the relationships between the band positions in all the diagnostic MIR spectral regions and cation compositions of Fe-poor K-dioctahedral micas with those observed in the Fe-bearing varieties; (b) to provide, on this basis, a generalized set of reliable FTIR identification criteria to supplement the diagnostic features obtained from X-ray diffraction and chemical data. For this purpose, MIR spectroscopy data were analyzed for a representative collection of samples of diverse compositions, from (Mg, Fe)-poor illites to aluminoceladonites through Mg-rich illites and from Fe-bearing, Mg-rich illites to celadonites through Fe-illites, Al-glauconites and glauconites.
2. Materials and Methods
2.1. Samples
The 43 samples studied range in composition from (Mg, Fe)-free illite to aluminoceladonite through Mg-rich illite, and from (Mg, Fe)-rich illite to celadonite through Fe-illite, Al-glauconite and glauconite (see Table 1 for the mineral identity, location, and the references to publications containing mineralogical characterizations). The chemical compositions and the corresponding crystal-chemical formulae (Table 2) for samples RM30, M422, Zempleni, KJMC3, 60/3, 602-1, 136, 68-69, PILT, BAB, TAIH, 69 and Z1 were taken from [5]; for aluminoceladonites Mal-4 and Mal-6, from [7]; for samples 37/71, 37/71a, 103 and 821-057, from [8]; and for the other samples, from the respective publications (see Table 1).

Table 1.
Sample description.
Table 2.
Sample description.
2.2. FTIR Spectroscopy
2.2.1. Experiment
The absorption spectra of samples RM30, RM35C, SG4, Zempleni, L-2A-1, 60/3, 602-1, Seifert, 99-3/5, 136, BSH11, KUL1, 68/69, PILT, 821-057, K294, GT 7-66, GT 8-69, 79/73, 372/70, TAIH, 69 and Z1 (Supplementary materials Figure S1) were recorded with a Nicolet ESP-260 FTIR spectrometer (Thermo Fisher Scientific, Waltham, MA, USA), and for samples Fuzz-5, Fuzz-6, Mal-4, Mal-6, 60, 560/3, 553/1, 2076, BSh12, KUL2, 400/3, 402/1, 551, 555A, 103, 37/71, 37/71A and 541 (Supplementary materials Figure S1), the IR spectra were obtained using a Bruker VERTEX 80v FTIR spectrometer (Bruker Optics, Ettlingen, Germany). Both spectrometers were equipped with an IR source, a KBr beam splitter and a DTGS KBr detector. For each sample, 128 (Nicolet) and 256 (Bruker) scans were recorded (on the Bruker spectrometer, in vacuum) in the MIR region (400–4000 cm−1) with a resolution of 4 cm−1.
All the samples were prepared using the KBr pressed-disc technique. To obtain a KBr pellet, 0.5 mg of sample was dispersed in 200 mg of KBr, the resulting mixture was placed in a 13 mm pellet die and pressed under vacuum for 15 min. The pellet was then placed into a glass desiccant box with CaCl2 and heated in a furnace at 105–150 °C for at least 20 h.
The IR absorbance conversion was made automatically with the Nicolet®Omnic Software Version 5.0 and the OPUS 7.0 software package (Bruker Ltd.).
2.2.2. Spectra Decomposition and Curve-Fitting
The OH-stretching regions of selected spectra were decomposed and fitted using the Galactic PeakSolveTM program. The baseline correction for the 3000–4000 cm−1 region was made using the linear function, as it provided better fitting results than the Concave Rubberband method. The second derivative method was used for initial estimation of the band positions. Although theoretically the vibrational bands should be Lorentzian, various instrumental and/or compositional factors may affect their shape leading to a Gaussian or mixed Gaussian–Lorentzian distribution [57,58]. Indeed, a variety of band shapes has been used previously for the decomposition of the OH-bending and OH-stretching regions of dioctahedral 2:1 phyllosilicates: Lorentzian [17,18,59], Gaussian [60,61] and mixed Gaussian-Lorentzian [62,63]. For the FTIR spectra under study, the best fitting results were obtained assuming a Lorentzian peak shape for each OH band in celadonites, a mixed Gaussian–Lorentzian shape for aluminoceladonites and Al-glauconites, and a Gaussian peak shape for illites, Fe-illites, and glauconites (Supplementary materials Table S1). The variable parameters were position, width at half-height and the intensity of each component. The complex wide absorption band of the residual water was included in the fitted spectrum as two broad maxima around 3200 and 3420 cm−1. The quality of spectra decomposition was estimated by the minimization function, χ2, the correlation coefficient, R2, and the agreement between cation compositions obtained from FTIR data and the crystal-chemical formulae.
3. Results and Discussion
The positions of the absorption bands in the FTIR spectra of the samples in the MIR region were assigned to specific vibration modes (Table 3 and Table 4) following the interpretations of [12,14,15,16,17,18,22,26,64]. The FTIR spectra of all the samples are typical for dioctahedral micas. The following FTIR regions were analyzed: the Si–O bending (600–400 cm−1), Si–O stretching (~1200–700 cm−1) and OH-stretching (3700–3500 cm−1) regions, as well as the 950–600 cm−1 region, which contains, along with the OH-bending bands, other types of vibrations and bands corresponding to admixtures (see below). Most of the diagnostic information for all the groups of mica varieties is provided by the three characteristic Si–O bending bands, the most intense absorption band(s) due to the Si–O stretching vibrations, and the positions and profile of the OH-stretching bands (Figure 1, Table 3).
Table 3.
Characteristic band positions (cm−1) in the Si–O bending, Si–O stretching, and OH-stretching regions in the FTIR spectra of K-dioctahedral 1M micas.
Table 4.
Positions (cm−1) of absorption bands of the mica structure and common admixtures in the 950–600 cm−1 region.
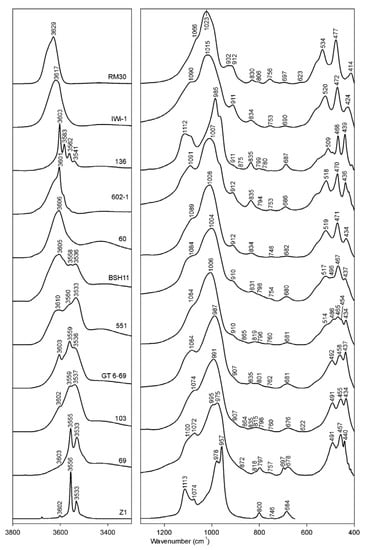
Figure 1.
Selected FTIR spectra of K-dioctahedral 1M micas: RM30-(Mg, Fe)-poor illite; Iwi-1- Mg-rich illite; 136—aliminoceladonite; 602-1—aluminoceladonite; 60—Mg-rich, Fe-bearing illite; BSH11—Fe-illite; 551—Al-glauconite; GT6-69 and 103—glauconites; 69—celadonite; Z1—celadonite.
3.1. Si–O Bending Vibration Modes
Three sharp bands in the region of 600–400 cm−1 are typical for all dioctahedral micas and are conventionally assigned to the Si–O (δ1), Si–O–Si (δ2) and Si–O–M (δ3) bending vibrations, where δ1 and δ3 are the lower- and the higher-wavenumber bands, respectively, and M = octahedral Al or Fe cation [19,26]. According to [12], the Si–O bending vibrations are strongly coupled with the vibrations of the octahedral cations and with translator vibrations of hydroxyl groups.
In Fe-poor K-dioctahedral 1M micas (the illite-aluminoceladonite series), strong correlations are observed between the spectroscopic characteristics of the Si–O bending region and both tetrahedral and octahedral cation composition. With increasing Si and Mg contents from (Mg, Fe)-poor illite to aluminoceladonite through Mg-rich illite, the two “outer” bands in the Si–O bending vibrations triplet (δ1 and δ3) move toward the “middle” one, so that δ1 and δ3 are shifted from 414 to 439 cm−1 and from 535 to 509 cm−1, respectively; the wavenumber of the “middle” Si–O–Si bending vibration, δ2, decreases slightly from 477 to 468 cm−1 (Figure 1; Table 3). These regularities are similar to those reported by [14] for the transition from synthetic muscovite to synthetic aluminoceladonite, although in the Si–O bending region, Velde [14] only discussed the shifts δ3 to lower wavenumbers.
Beran et al. [65] assigned the band at 437 cm−1 in silicate structures to Mg–O stretch + O–Si–O bend. The shift of the Si–O bending mode δ1 to greater wavenumbers in the series illite-aluminoceladonite may be therefore associated with the growing influence of the Mg–O stretching vibration, taking into account that the relative intensity of δ1 with respect to δ2 increases with increasing Mg contents (Figure 1). The correlations between the position of this band and IVAl and Mg contents are equally strong and described by a quadratic (Figure 2a) and linear (Figure 2b) regressions, respectively.
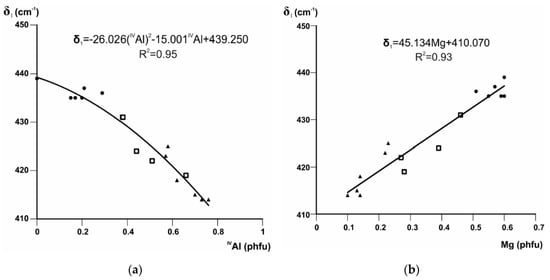
Figure 2.
Band positions (cm−1) of δ1 in Fe-poor K-dioctahedral 1M micas plotted vs. (a) IVAl and (b) Mg contents (cations p.h.f.u.). Symbols: triangle = (Mg,Fe)-poor illites, square = Mg-rich illites, circle = aluminoceladonites.
The absorption band δ2 is interpreted as the Si–O–Si bending vibration [20,22,64] coupled with Al–O–Al bend [65]. The decrease in δ2 with decreasing tetrahedral and octahedral Al and increasing octahedral Mg contents is described by quadratic regression equations with R2 = 0.77, 0.77 and 0.81, respectively, with considerable scatter (Figure 3a–c).
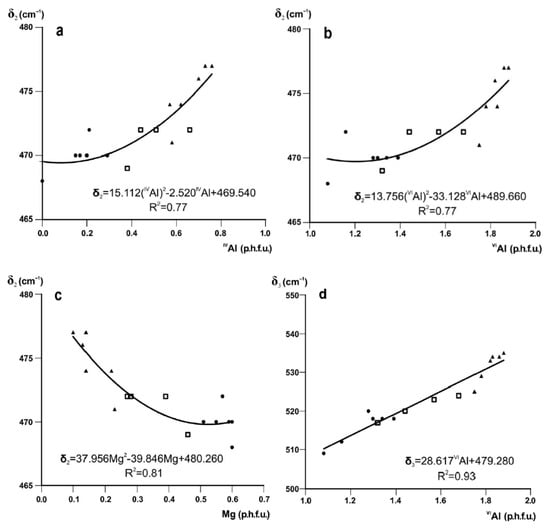
Figure 3.
Band positions (cm−1) of δ2 and δ3 in Fe-poor K-dioctahedral 1M micas plotted vs. octahedral cation contents: (a) δ2 vs. IVAl; (b) δ2 vs. VIAl; (c) δ2 vs. Mg; (d) δ3 vs. VIAl (cations p.h.f.u.). Symbols as in Figure 2.
The δ3 mode is assigned to Si–O–Al bending vibration (octahedral Al) [22]. The shift of δ3 to lower wavenumbers in the transition from muscovite-like illite to phengite-like illite to aluminoceladonite may be associated with the increasing Si–O–Al angle as a result of increasing tetrahedral elongation in combination with increasing octahedral sheet thickness. Experimental structural data show that the tetrahedral elongation angle Obas-T-Oap is ~110–111° in muscovite [66], ~112° in phengite [67] and ~113° in aluminoceladonite [68], while the octahedral sheet thickness simultaneously increases from ~2.090 to 2.164 Å [69,70]. The increase in the Si–O–Al angle should lower the vibration energy [14], so that the δ3 mode shifts to lower wavenumbers. The position of δ3 in the series illite-aluminoceladonite is strongly correlated with VIAl (R2 = 0.93, Figure 3d).
The equations given in Figure 2 and Figure 3d can be used to evaluate the amounts of tetrahedral Al, octahedral Mg, and octahedral Al cation contents with an esd of 0.06, 0.05, and 0.075 cations p.h.f.u., respectively [7].
A possible explanation for the band shifts in the Si–O bending region in the series (Mg, Fe)-poor illite–Mg-rich illite–aluminoceladonite is provided by a comparison of the spectra of samples RM30 and 136 (Mg, Fe-poor illite and aluminoceladonite, respectively) with that of pyrophyllite Al2Si4O10(OH)2 (Figure 4) in the region 550–400 cm−1. Owing to the identical tetrahedral cation composition, the spectrum of aluminoceladonite in the region of Si–O bending vibrations might be expected to be similar to that of pyrophyllite. In reality, however, the band positions in spectra of aluminoceladonite 136 and pyrophyllite differ dramatically: 439 vs. 419, 468 vs. 482 and 509 vs. 541 cm−1 (Figure 4). At the same time, the maximum absorption in the pyrophyllite spectrum is observed at positions close to those of the illites of muscovite-like composition having 0.70–0.85 IVAl (e.g., 414, 477 and 534 cm−1, sample RM30) (Figure 4). These results may imply that the influence of octahedral cation composition on the band positions in the Si–O bending region is stronger than that of the composition of the tetrahedral sheet and the presence or absence of the interlayer cations. In other words, the presence of the interlayer K and tetrahedral Al in the muscovite structure (as opposed to pyrophyllite) are mutually compensated, so that the similarity in the octahedral composition becomes a major factor responsible for the similarity of the muscovite and pyrophyllite spectra. In particular, the similar albeit slightly higher δ3 in pyrophyllite as compared to that of muscovite is associated with somewhat smaller tetrahedral elongation angle (109.4°) and octahedral sheet thickness (2.079 Å) in the pyrophyllite structure, as compared to 110–111° and 2.090–2.095 Å, respectively, in muscovite [69,70] leading to an even smaller Si–O–Al angle.
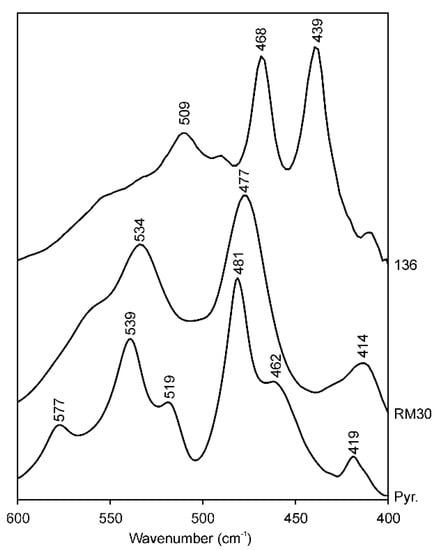
Figure 4.
FTIR spectra of (a) aluminoceladonite 136, (b) illite RM30 and (c) pyrophyllite (North Carolina) in the Si–O bending region (600–400 cm−1).
In the Si–O bending region of Fe-bearing, K-dioctahedral micas, the positions of the lower wavenumber band, δ1, varies within a narrow range (440–434 cm−1) for all the samples with a very loose trend to decreasing with increasing Fe contents. The position of the δ2 band, which corresponds to the Si–O–Si bending vibration, tends to decrease with decreasing Al and increasing Fe cation contents from ~470 cm−1 in illites and Fe-illites to 453–463 cm−1 in glauconites and celadonites. Simultaneously, the δ3 band shifts from 514–526 cm−1 corresponding to the Si–O–Al vibration, to 483–499 cm−1 (Si–O–Fe) (Table 3). The shift of the δ3 mode to lower wavenumbers with increasing Fe for Al substitution may be associated with an increase in the Si–O–VIM angle due to an increase in the octahedral sheet thickness, which, in turn, reduces the vibration energy [14]. Another reason is that an increase in the total mass of cations in the vibrating system for cations of the same valence (Si–O–Al vs. Si–O–Fe3+) decreases the wavenumber [18].
The samples in the Fe-bearing mica series therefore fall into two distinct groups: for KAl ≥ 0.6, δ2 is at 469 ± 2 cm−1 and δ3 is at 520 ± 6 cm−1; for KAl < 0.5, δ2 is at 458 ± 5 cm−1 and δ3 is at 491 ± 8 cm−1 (Figure 5a,b). Samples of highly heterogeneous cation composition, such as Fe-illites and Al-glauconites, display, in addition, vibration modes typical for δ2 and δ3 of glauconites and celadonites, either as distinct maxima of minor intensity or as shoulders. Specifically, in samples 551 and 555A (KAl~0.5), the Si–O bending region contains, in addition to the δ1 mode, two well-resolved bands at 465–469 cm−1 and 454–455 cm−1 and shoulders at 514–518 cm−1 and 486 cm−1 (Table 3, Figure 1 (sample 551), Figure 5). Similarly, the glauconite sample 402/1 (KAl = 0.40), in addition to δ2 at 453 cm−1, shows a second Si–O–Si bending band at 467 cm−1 (Table 3). These peculiarities reflect the phase microheterogeneity, which was revealed by XRD powder diffraction for samples 551 and 402/1 [9] and is likely to be present in sample 555A, as its cation composition is very close to that of sample 551. On the whole, the plots of δ2 and δ3 vs. Fetotal = Fe2+ + Fe3+ (Figure 5) show a wider scatter of points than similar dependencies of bending and stretching Si–O vibration band positions on cation composition in Fe-poor dioctahedral micas 1M. This may be associated with a much higher degree of crystal-chemical heterogeneity of Fe-bearing varieties and especially glauconites and Al-glauconites [9].
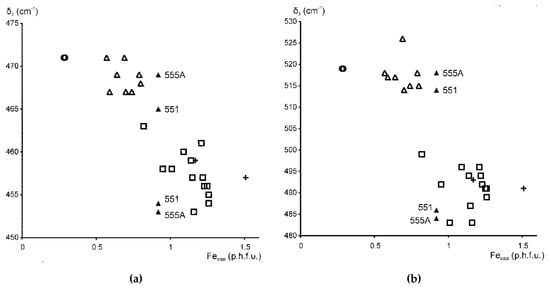
Figure 5.
Band positions (cm−1) of (a) δ2 and (b) δ3 in Fe-bearing K-dioctahedral 1M micas plotted vs. Fetotal contents (cations p.h.f.u.). Symbols: open circles—Fe-bearing Mg-rich illites (KAl = 0.9), open triangles—Fe-illites and Al-glauconites (KAl = 0.6–0.75), black triangles—Al-glauconites (KAl = 0.5), open squares—glauconites (KAl < 0.5), crosses—celadonites (KAl < 0.15).
3.2. Si–O Stretching Vibration Modes
In Fe-poor K-dioctahedral 1M micas, the profiles and positions of the bands in this region are correlated with both tetrahedral and octahedral cation composition. With decreasing Al for Si substitution in the series (Mg, Fe)-poor illite–Mg-rich illite–aluminoceladonite, the Si-O stretching band, ν(SiO) shifts from 1024 cm−1 (IVAl = 0.76, sample SG-4) to 985 cm−1 (IVAl = 0, sample 136), and the Si–O apical stretching mode, ν(SiOapical), transforms from a shoulder at 1067 cm−1 into a well-resolved band at 1112 cm−1 (Table 3, Figure 1). With increasing Si and decreasing octahedral Al contents, the non-bridging tetrahedral cation–anion (T–Oapical) distance is significantly shortened and strengthened with respect to the mean bridging (T–Obasal) distance due to increasing under-saturation of the apical oxygen anion with respect to negative charge. This effect is confirmed by numerous structure refinements of dioctahedral micas-2M1 [66,67,68] and can be described quantitatively in terms of the bond strength sum variation [70]. Accordingly, the two Si–O stretching modes become resolved, as ν(SiO) shifts to lower and ν(SiOapical) shifts to greater wavenumbers. Both trends can be described by quadratic regressions relating ν(SiO) and ν(SiOapical) to IVAl (Figure 6a,b), with the correlation coefficients R2 = 0.76 and 0.77, respectively. A much stronger correlation is observed between ν(SiO) and octahedral Al contents, VIAl (R2 = 0.94, Figure 6c).
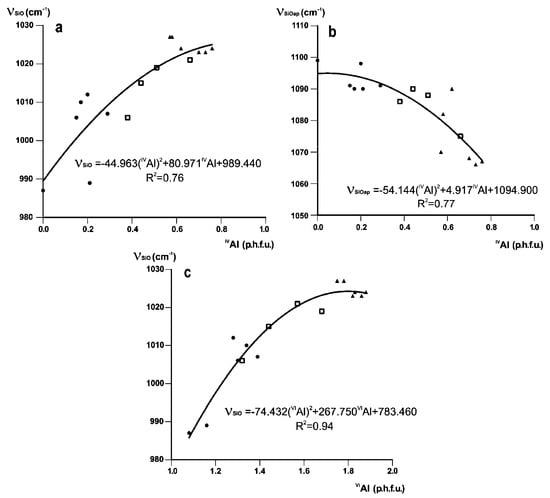
Figure 6.
Band positions (cm−1) of (a) ν(SiO) and (b) ν(SiOapical) plotted against IVAl contents (cations p.h.f.u.), and (c) ν(SiO) plotted vs. IVAl contents for Fe-poor K-dioctahedral 1M micas (cations p.h.f.u.). Symbols as in Figure 2.
In Fe-bearing K-dioctahedral micas 1M, the Si–O stretching region is the least informative as to the distinguishing features [8], as the ν(SiO) band is at 987–1017 cm−1 in Mg-rich, Fe-bearing illites, Fe-illites, Al-glauconites and glauconites show little or no correlation with either tetrahedral or octahedral cation composition. The ν(SiOapical) mode appears either as a distinct band or a shoulder within the 1070–1100 cm−1 range (Table 3). Celadonite is an exception showing either two sharp, well-resolved bands (978 and 1090 cm−1, sample TAIH) or two sharp bands (975 and 1082 cm−1) with shoulders at 995 and 1100 cm−1 (sample 69), or four sharp bands (957, 978, 1074 and 1113 cm−1, sample Z1) (Table 3, Figure 1).
3.3. The 950–600 cm−1 Region
The region 950–600 cm−1 contains, along with the OH bending bands, which are located on the low-wavenumber side of the Si–O stretch, a number of absorption bands corresponding to other types of vibrations (Al–O and Fe–O out-of-plane, Al–O–Si in-plane modes, etc.), which is a series hindrance to unambiguous interpretation of this spectral region.
In most cases, the micas in the illite-aluminoceladonite series display the δ(AlOHAl) vibration mode as a distinct band at 909–918 cm−1. Some muscovite-like illites (samples #1–4, Table 4; sample RM30, Figure 7) show a plateau resulting from a superposition of two bands at 912–918 and 932–934 cm−1. Aluminoceladonites 136 and Z2 show the δ(AlOHAl) mode as an inflection at 910–912 cm−1 on the low-wavenumber side of the ν(SiO) band (Figure 7, Table 4). Depending on the octahedral Al cation content, the δ(AlOHAl) band appears in the spectra of Fe-illites, Al-glauconites and glauconites, either as a distinct maximum (sample 560/3) or a shoulder, at 907–915 cm−1; in some glauconites, it can only be identified in the second derivative (Table 4). Celadonite TAIH with VIAl = 0.16 a.p.h.f.u. shows a week shoulder at 908 cm−1, whereas in the other celadonite spectra, this band is absent.
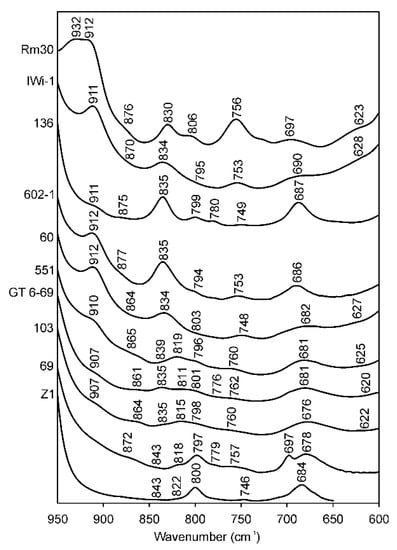
Figure 7.
FTIR spectra of selected samples in the region of 950–600 cm−1. RM30—(Mg, Fe)-poor illite; Iwi-1—Mg-rich illite; 136—aliminoceladonite; 602-1—aluminoceladonite; 60—Mg-rich, Fe-bearing illite; BSH11—Fe-illite; 551—Al-glauconite; GT6-69 and 103—glauconites; 69—celadonite; Z1—celadonite.
The band at ~875–880 cm−1, which either appears as a shoulder or can be identified in the second derivative in the spectra of illites and aluminoceladonites, is attributed to the Al–O–Al vibration [20]. Most of the Fe-bearing mica varieties show a shoulder at ~860–865 or ~870–880 cm−1 (Table 4), which, in most cases, is displayed as two components, 860–869 and 873–888 cm−1 in the second derivative. These bands should refer to δ(AlOHFe3+), which Farmer [12] identified at 890 cm−1, and Madejová et al. [26] at 865 cm−1.
Independent of Mg content, all illites, Fe-illites, and aluminoceladonites show distinct bands at 824–838 cm−1, the δ(AlOHMg) band coupled with the Al–O out-of-plane vibration [12,20] (Table 4). This band, therefore, cannot be considered as unambiguously indicative of Mg-rich illite or aluminoceladonite; and in Fe-illites, it may include a contribution from δ(Fe3+OH Fe3+) at ~820 cm−1. Al-glauconites, glauconites, and celadonites show a distinct band at 811–823 cm−1, δ(Fe3+OH Fe3+) and a weak band, shoulder or second-derivative minimum at 835–843 cm−1, which may correspond, depending on the cation composition, to δ(AlOHMg) and/or to a second δ(Fe3+OHFe3+) mode [71,72,73] (Al-glauconite KUL2 is an exception, showing a broad band at 824 cm−1 poorly resolved from a band at 801 cm−1). Gates [73] suggested that in natural nontronites, the band at 839–846 cm−1 is related to tetrahedral Fe3+. This might be true for celadonite TAIH, which may contain ~0.2 tetrahedral Fe3+ cations p.h.f.u., but not for samples 69 and Z1, which have no tetrahedral Fe3+ [18].
Depending on the cation composition, the distinct band or shoulder or a minimum in the second derivative at ~795–805 cm−1 present in all the spectra (Table 4) may refer to either the Al–O–Al vibration [20], to δ(Fe3+OHMg) and/or δ(Fe2+OH Fe3+) [12,26], or to silica or quartz admixtures [26,74]. The conventional assignment of the band at ~800 cm−1 to δ(Fe2+OH Fe3+) is in fair agreement with ab initio calculations (808 cm−1, [75]) but disagrees with the prediction of cation mass-valence sum (CM-VS) approach (766 cm−1, [72,73]), making the interpretation still more complicated. Other types of OH-linked cation pairs, such as Fe2+OHFe2+, AlOHFe2+ and MgOHMg, which are revealed in the OH-stretching region (see below), are difficult to identify in the OH-bending region. The corresponding bending bands are predicted at 714, 810 and 776 cm−1, respectively, by the CM-VS approach [72,73] and at 691, 820 and 765 cm−1, respectively, by ab initio calculations [75] and would therefore overlap with other types of absorption bands.
Attempts have been made to decompose and curve-fit the OH-bending region, though not for micas but for smectites and mixed-layer illite-smectites [60,62,73]. The interpretation of the OH-bending vibrations, however, is complicated not only by bands overlapping but also by the ambiguity in band attributions [72,73,75], as well as by the uncertainty in the baseline correction in the OH-bending region.
The band at ~750 cm−1 is conventionally attributed to the Al–O–Si in-plane vibration [12,16,26], although Beran [20] assigns it to the Al–O–Al in-plane vibration. In any event, the presence of this band indicates Al-for-Si substitution in the tetrahedral sheet. A well-defined band at 753 ± 3 cm−1 is observed in the spectra of all illites irrespective of the amount of tetrahedral Al cations, whereas Fe-illites, Al-glauconites and glauconites display a band or shoulder at 753–763 cm−1 (Table 4). Despite the very low or zero tetrahedral Al contents, all aluminoceladonites and celadonites show a weak but distinct absorption band at 746–760 cm−1 (except for celadonite 69, which nevertheless shows a shoulder at 757 cm−1). Further investigation is therefore needed to explain the presence of this band in celadonite and aluminoceladonite spectra.
The band at 686–699 cm−1 in the spectra of Fe-poor mica varieties (Table 4) is assigned to Si–O [64] or Si–O–AlVI [20] vibrations; the band at ~680–685 cm−1 in Fe-bearing micas is attributed to the Fe–O out-of-plane vibration [26]. In varieties of mixed cation composition, such as Fe-illites and Al-glauconites the band at 680–691 cm−1 may result from superposition of the above absorption bands. In celadonites, however, Weiszburg et al. [23] assigned this band to the second libration of Fe3+–OH–Mg and Fe3+–OH–Fe3+.
The band at 618–628 cm−1 in some of the illites and aluminoceladonites spectra (or spectra second derivatives) is most probably due to the presence of smectite interlayers (5%–16%, [7]) and corresponds to coupled Al–O and Si–O out-of-plane vibrations characteristic of Al-rich dioctahedral smectites [26]. The band at 620–625 cm−1 can be identified in the second derivatives of the spectra of several Fe-illites, Al-glauconites and glauconites, which contain 5%–10% of expandable layers.
The OH-bending bands may overlap not only with other types of vibrations of the mica structure but also with those of various common admixtures, such as quartz with characteristic absorption bands at 693–694 cm−1, 777–780 cm−1 and 797–801 cm−1, as well as amorphous silica (~800 cm−1) or cristobalite (792–796 cm−1) [74,76]. The various carbonate minerals display absorption bands at 1420–1480 cm−1, 860–890 cm−1 and 700–740 cm−1 [77]; goethite, a common admixture in Fe-rich micas, shows absorption at 890 and 797 cm−1 [78]. The presence of these admixtures may complicate the interpretation of the spectra. For example, in glauconites 79/73 and 372/70 and celadonites TAIH and 69, sharp absorption bands at 695–699 cm−1 in combination with bands at 1440–1450 cm−1 may indicate the presence of carbonate admixtures. At the same time, a weak shoulder at 779 cm−1 in combination with a band at 797 in sample 69 suggests that the sharp band at 698 may refer to quartz. In such cases the correct attribution of the absorption bands in the region of interest requires application of other methods, e.g., X-ray diffraction.
Partial overlap and coupling of the various bands, as well as the existing ambiguities in band assignments, complicate the interpretation of the 950–600 cm−1 region and make it less informative from the point of view of identification. On the other hand, in combination with the data on the Si–O bending and stretching modes, as well as the OH-stretching vibrations, the band positions in this region may provide helpful additional information.
3.4. The OH Stretching Vibration Modes
3.4.1. Methodology
The FTIR spectrum of a dioctahedral mica in the OH-stretching region results from a superposition of OH bands corresponding to specific types of OH-linked cation pairs. The relative integrated intensities of individual bands are proportional to the contents of the corresponding types of cations in the OH-sharing cis-octahedral sites with the absorption coefficients being the same for all cation-pair types [13,17,18].
The positions of the specific cation-OH-cation bands (Table 5), which were identified from spectra decomposition and curve-fitting of IR spectra of dioctahedral mica samples of diverse cation compositions [17,18], depend on the nature of cations in the two OH-sharing cis-octahedral sites and are determined by several competing factors. On the one hand, an increase in the total mass of cations bound to an OH group decreases the wavenumber. On the other hand, for cations having the same mass but different valences, two opposite trends interact. An increase in the total cation valence decreases the interaction within the OH group, but simultaneously increases the repulsion between the cations and the hydroxyl proton, thus weakening hydrogen bonds between OH and two apical oxygen anions in the octahedral sheet and strengthening the bond within the OH group. The latter effect dominates, and therefore an increase in the total cation valence increases the wavenumber. For the AlOHAl, AlOHMg and MgOHMg stretching vibrations, the valence effect prevails over the mass effect, and therefore ν(AlOHAl) > ν(AlOHMg) > ν(MgOHMg). In addition to the OH-stretching vibrations of the mica structure proper, Besson and Drits [17,18] identified the AlOHAl, AlOHFe3+ and Fe3+OHFe3+ bands of pyrophyllite- and ferripyrophyllite-like structural fragments present in interlayer-deficient micas at positions close to those observed in pyrophyllite and ferripyrophyllite spectra [12,79,80] (Table 5).
The assumption of the absorption coefficients being the same for all individual OH-stretching bands [13,18] allows the evaluation of the octahedral cation contents from FTIR data and therefore provides a criterion for the validity of the interpretation of the spectrum. The content of a cation Ri p.h.f.u. is given by Ri = 2Aii + ΣjAijj [18], so that, e.g.,
where Al is the amount of Al cations p.h.f.u., and AAlAl, AAlMg, AAlFe3+ and AAlFe2+ are the relative integrated intensities of the AlOHAl, AlOHMg, AlOHFe3+, and AlOHFe2+ bands, respectively. Correct band attributions and spectrum decomposition/curve-fitting should lead to agreement between the cation composition of the sample obtained from FTIR data and that provided by the crystal-chemical formula.
Al = 2AAlAl + AAlMg + AAlFe3+ + AAlFe2+,
3.4.2. Profiles and Positions of OH-Stretching Bands as a Function of Cation Composition
K-dioctahedral 1M micas display a variety of band positions and profiles in the OH-stretching region. In most cases (except aluminoceladonites and celadonites), they show a broad band, with or without modulations (Figure 1 and Figure 8), resulting from the superposition of individual cation-OH-cation vibrations. For selected samples, these individual bands were identified from spectrum decomposition and curve-fitting (Table 5, Figure 8). The validity of the spectra interpretation was confirmed by good agreement between cation compositions obtained from FTIR data and those provided by the crystal-chemical formulae (Table 6). The χ2 values varied from 1.13 to 6.04 (Table 5), and the R2 values were ~1.00 for all the decompositions.
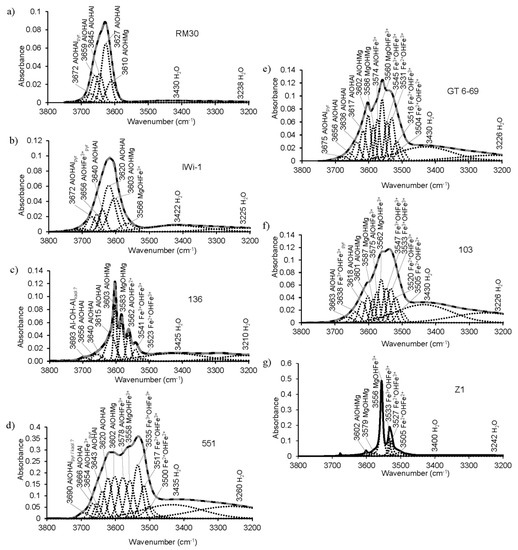
Figure 8.
Decomposition and curve-fitting of the FTIR spectra of selected samples in the OH-stretching region: (a)—RM30; (b)—IWi-1; (c)—136; (d)—551; (e)—GT6-69; (f)—103; (g)—Z1.
Table 6.
Octahedral cation compositions of selected samples (cations p.h.f.u.): c.a.—obtained from chemical analysis data; FTIR—calculated from relative integrated intensities of OH-stretching bands.
In both (Mg,Fe)-poor and Mg-rich illites, the OH-stretching region shows a single wide absorption band; the position of maximum absorption depends on the octahedral cation composition. In samples having 0.1–0.27 Mg cations p.h.f.u., the maximum absorption is determined by the AlOHAl vibration at 3627 ± 3 cm−1 (Table 3). For example, the OH-absorption band in sample RM30 results from the superposition of the AlOHMg band (3610 cm−1), three AlOHAl bands (3627, 3645, and 3659 cm−1) and the AlOHAl band of the pyrophyllite-like component (3672 cm−1) (Table 5, Figure 8a). The presence of three AlOHAl stretching bands is explained by the various Si/Al configurations in the vicinity of the OH-sharing Al-octahedra [17,20]. The number and actual positions of these bands can be also affected by Mg for Al substitutions in the adjacent octahedra, as well as by the nearest interlayer site being occupied or vacant [61]. The positions of the three AlOHAl stretching bands of the mica structure of sample RM30 are similar to those reported for synthetic muscovite (3659, 3644 and 3629 cm−1) [81]. In illite samples with the Mg contents of ~0.4 cations p.h.f.u., the maximum is either at 3606 cm−1, determined by the AlOHMg vibration (samples 60 and 60/3, Table 3), or at 3617 cm−1 resulting from the superposition of AlOHMg (3603 cm−1) and AlOHAl (3620 cm−1) (sample IWi-1, Table 5, Figure 8b). The other vibrations contributing to the broad OH-stretching band of Mg-rich illite IWi-1 include MgOHFe3+ (3566 cm−1), AlOHAl (3640 cm−1) and the AlOHFe3+ (3656 cm−1) and AlOHAl bands (3672 cm−1) of the pyrophyllite-like component (Figure 8b, Table 5). The position of the pyrophyllite-like AlOHFe3+ band is somewhat higher than observed by Farmer [12] and Lantenois et al. [80] (3647 and 3645 cm−1, respectively) but close to that reported by Besson and Drits [17,18] (3651–3654 cm−1).
The OH-stretching region of the aluminoceladonite spectra differs dramatically from that of illites. The spectra of samples 136 (Figure 1 and Figure 8c) and Z2 (not shown) consist of several sharp and well-resolved peaks, the most intense at 3603 cm−1 (AlOHMg), and MgOHMg, AlOHFe2+ and Fe3+OHFe3+ at 3583, 3559–3562 and 3538–3540 cm−1, respectively (Table 3). In addition, AlOHAl (3615, 3640 and 3656 cm−1) and Fe2+OHFe3+ (3523 cm−1) bands are revealed by spectrum decomposition and curve-fitting (Figure 8c). In the other aluminoceladonites, the OH-stretching region contains a wide absorption band with one sharp maximum at 3601–3606 cm−1 and poorly resolved bands that can be identified from decomposition and curve-fitting (e.g., sample 602-1, Figure 1, Table 5). As shown by Besson et al. [82], the resolution of the OH-stretching spectral region of dioctahedral 2:1 phyllosilicates, and aluminoceladonite in particular, is associated with the degree of the order–disorder in the octahedral cation distribution. The typical feature of the aluminoceladonite spectra is therefore the sharp maximum at ~3600 cm−1, which corresponds to the AlOHMg stretching vibration. Another characteristic feature is the presence of the MgOHMg absorption band at 3583–3585 cm−1, which can be identified either by visual inspection or, in the poorly resolved spectra, in the second derivative.
The FTIR spectra of Fe-illites and Al-glauconites in the OH-stretching region differ dramatically from those of illites and, in particular, Fe-bearing Mg-rich illites, as they contain two well-resolved broad bands (Figure 1): one, a superposition of individual vibrations that involve Fe and Mg, with the maximum corresponding to the Fe3+OHFe3+ band (3532 ± 4 cm−1), and another, resulting from vibrations involving Al and Mg, with the maximum corresponding to either AlOHMg at 3605 ± 5 cm−1 (most samples) or AlOHAl (3624 cm−1, sample 553/1), or a superposition of the AlOHMg and AlOHAl bands (3614 cm−1, samples 560/3, 551) (Table 3). For KAl ≥ 0.6, the “Al, Mg” band is either stronger than or of similar intensity as the “Fe” band (e.g., sample BSH11, Figure 1); for KAl~0.5, the “Fe” band is stronger (sample 551, Figure 1 and Figure 8d). The “Fe” band of Al-glauconite 551 is a superposition of the following individual vibrations: Fe2+OHFe2+ (3500 cm−1), Fe2+OHFe3+ (3517 cm−1), Fe3+OHFe3+ (3535 cm−1), MgOHFe3+ (3558 cm−1) and AlOHFe3+ (3578 cm−1), while the “Al, Mg” band involves AlOHMg (3602 cm−1) and AlOHAl (3620 cm−1, 3643 cm−1 and 3666 cm−1) modes, as well as AlOHFe3+ band of the pyrophyllite-like component at 3654 cm−1; the band at 3690 cm−1 refers to the AlOHAl of either a pyrophyllite-like component or a minor kaolin admixture (Figure 8d, Table 5). The individual bands’ positions within the “Fe” band in the spectrum of sample 555A are close to those of sample 551 but the intensity distribution is different; the band positions and intensity distribution in the “Al, Mg” region are similar to those in sample 551 but for the presence of the MgOHMg band at 3587 cm−1 and lower intensity of the AlOHFe3+ band (Table 5).
The OH-stretching vibration regions of glauconites, with few exceptions, show worse resolution, as compared to Al-glauconites. The distinguishing feature of glauconite spectra is the presence of maxima at 3533–3538 cm−1 and ~3550–3560 cm−1 (corresponding to Fe3+OHFe3+ and Fe3+OHMg, respectively), which can be either well- or poorly resolved (from sharp bands to shoulders) and have similar or different intensities (Figure 1, Table 3). For example, the OH-stretching region of sample 103 is a broad band with two poorly resolved maxima at ~3530 and ~3560 cm−1, and a shoulder at ~3600 cm−1 (corresponding to AlOHMg), whereas sample GT6-69 shows sharp bands at 3560 and 3602 cm−1, and a broad but distinct shoulder at ~3530 cm−1 (Figure 1). The spectrum decomposition and curve-fitting revealed similar types of individual cation-OH-cation bands at close positions with similar, albeit not identical, intensity distributions (Figure 8e,f, Table 5). There are, however, a few differences. The spectrum of sample GT6-69, which has more Al and less Fe (KAl = 0.38), shows three AlOHAl bands (3617, 3636 and 3656 cm−1) and a pyrophyllite-like AlOHAl band at 3675 cm−1, whereas in that of sample 103 (KAl = 0.24) there are two AlOHAl bands (3618 and 3663 cm−1). In sample 103, the band at 3638 cm−1 is identified as the Fe3+OHFe3+ band of the ferripyrophyllite-like structure fragments, as it is only this assignment that provides good agreement between the cation composition obtained from the FTIR data and that given by the crystal-chemical formula (Table 6). Although Besson and Drits [18] only found two AlOHAl bands in the OH-stretching regions of glauconites, the presence of three AlOHAl bands in the spectrum of sample GT6-69 may be associated with the highly heterogeneous cation composition, which, as shown by Drits et al. [9] can be realized as phase heterogeneity at micro- and nano-levels. The third AlOHAl band may therefore refer to Al-rich micro- or nanocrystals within the sample.
Unlike the glauconites studied by Besson and Drits [17,18] both samples 103 and GT6-69, as well as sample 37/71A (Table 5), display two Fe3+OHFe3+ bands at 3531–3533 cm−1 and 3545–3547 cm−1 of similar intensity, and no spectra decomposition in terms of a single Fe3+OHFe3+ band would lead to a good cation composition fit. The presence of two Fe3+OHFe3+ bands in micas with high Fe content in combination with complex tetrahedral and octahedral cation compositions may be associated with the heterogeneity in the local environments around the vibrating OH group. The total amounts of Fe cations obtained from the FTIR data are nearly identical to those in the crystal-chemical formulae for both samples 103 and GT6-69 (Table 6). For sample GT6-69, the oxidation state of Fe was not determined and all Fe was assumed to be trivalent [52]; the FTIR data, however, indicate the presence of 0.18 Fe2+ cations p.h.f.u. The ratio Fe3+/Fe2+ in sample 103 was assumed to be similar to that of sample 3771 based on a similar geological setting and overall cation composition [8]; according to the FTIR data, the actual content of Fe2+ should be higher than that in the crystal-chemical formula (0.23 vs. 011 cations p.h.f.u.) (Table 6).
The OH-stretching regions of celadonites differ dramatically from those of all the other Fe-bearing mica varieties (Figure 1 and Figure 8g). They show two sharp, well-resolved maxima, the stronger at 3555–3556 cm−1 (Fe3+OHMg) and a less intense one at 3532–3533 cm−1 (Fe3+OHFe3+). The AlOHMg stretching mode may appear as a minor sharp band (samples TAIH, not shown, and Z1, Figure 1 and Figure 8g). As in the case of aluminoceladonites, the high resolution of the OH-stretching spectral region of celadonites is associated with the high degree of ordering in the octahedral cation distribution [82]. In addition to the sharp MgOHFe3+ and Fe3+OHFe3+ bands, the spectrum decomposition and curve-fitting of celadonite Z1 reveals the presence of the Fe2+OHFe2+ band (3505 cm−1), the Fe2+OHFe3+ band (3527 cm−1), and the MgOHMg band at 3579 cm−1 (Figure 8g, Table 5). The band positions and intensity distribution in this decomposition are in agreement with those of [17,18] for sample Z1, except that the weak MgOHFe2+ (3542 cm−1), AlOH Fe3+ (3574 cm−1) and AlOHAl (3621 cm−1) bands reported by [17,18] were not found in this work. These minor discrepancies may be associated with the fact that different specimens of the same sample were used in the two studies in question.
On the whole, the results of the OH-stretching region decomposition and curve-fitting are in accordance with the interpretation and band assignments of [17,18]. The few differences include the presence of a second Fe3+OHFe3+ band and a third AlOHAl band in some glauconites with a high Fe content and highly heterogeneous cation composition, as well as slightly wider ranges of band position variations for specific cation-OH-cation vibration modes (Table 5).
4. Conclusions
The approach suggested for the interpretation of the FTIR spectroscopy data involves relationships between band positions and cation composition, and provides a set of distinguishing features and identification criteria for K-dioctahedral 1M micas that include the band positions and profile in the regions of Si–O bending, Si–O stretching and OH-stretching vibrations (Table 7). In particular, FTIR data allow unambiguous identification of illite and aluminoceladonite, which are often confused based on superficial interpretation of XRD data. Specifically, a sharp maximum from the AlOHMg stretching vibration at ~3600 cm−1, the presence of a MgOHMg stretching vibration at 3583–3585 cm−1, as well as characteristic band positions in the Si–O bending (435–439, 468–472 and 509–520 cm−1) and stretching regions (985–1012 and 1090–1112 cm−1) are typical of aluminoceladonite. Distinguishing between Mg-poor and Mg-rich illites based solely on FTIR data appears problematic, but the position of the Si–O bending modes and the maximum absorption in the region of OH-stretching vibrations may serve as additional criteria. Regression equations relating the band positions in the Si–O bending region with the contents of tetrahedral Al, octahedral Al and octahedral Mg allow evaluation of the contents of corresponding cations in illites and aluminoceladonites. According to FTIR characteristics, the Fe-bearing K-dioctahedral 1M micas are divided into 4 groups differing in the value of KAl = Al/(Al + VIFe3+), where Al and VIFe3+ are the amounts of Al and Fe3+ octahedral cations p.h.f.u.: Fe-bearing Mg-rich illites (KAl~0.9); Fe-illites (0.65 ≤ KA l≤ 0.75)/Al-glauconites (0.5 ≤ KAl ≤ 0.6), with Al-glauconites having KAl~0.5 forming a special subgroup; glauconites (KA l < 0.5); and celadonites (KAl < 0.2) (Table 7).
Table 7.
FTIR distinctive features for K-dioctahedral 1M micas (see text for details and explanation).
The band positions and profiles in the regions of Si–O bending, Si–O stretching and, most importantly, OH-stretching vibrations allow not only unambiguous identification of illites, aluminoceladonites and celadonites, but also distinction between Fe-illites and illites proper, as well as between Al-glauconites and glauconites. On the other hand, distinction between Fe-illites and Al-glauconites, which have similar FTIR features, requires data on cation composition and unit-cell parameters.
The 950–600 cm−1 region is less informative from the point of view of identification because of partial overlap and coupling of the various bands, as well as ambiguities in band assignments. In combination with the data on the Si–O bending and stretching modes, as well as the OH-stretching vibrations, the band positions in this region may, however, provide helpful additional information.
The band positions and profiles in the OH-stretching regions, especially for Fe-bearing K-dioctahedral micas, can serve as additional diagnostic criteria for phase heterogeneity realized at the micro- and nano-levels. The validity of the decomposition and curve-fitting of OH-stretching regions was confirmed by the good agreement between cation compositions obtained from FTIR data and those provided by the crystal-chemical formulae for a representative collection of samples in terms of a unique set of individual OH band positions that vary within narrow wavenumber intervals. For monomineralic samples with known cation compositions, the proportions of various types of cation-OH-cation configurations obtained from the decomposition of the OH-stretching regions, in combination of the data of other methods, such as Mössbauer and NMR spectroscopies, can be used to reconstruct the two-dimensional octahedral cation distribution [82,83,84] and thus reveal the mechanisms for structural transformations (e.g., release of Mg and Fe during diagenetic transformations of illite-smectites into illite-tobelite smectites) [83]. Further research is needed to find out to what extent the Al and Mg cation contents obtained from the data on Si–O bending band positions may be used for the interpretation of OH-stretching vibration regions of Al-rich, (Mg, Fe)-poor micas in the absence of chemical analysis data.
Supplementary Materials
The following are available online at https://www.mdpi.com/2075-163X/10/2/153/s1, Figure S1: FTIR spectra of K- dioctahedral 1M micas, Table S1: Parameters of IR spectra decomposition.
Author Contributions
All authors have read and agreed to the published version of the manuscript. B.B.Z. is responsible for investigation, methodology and writing—original draft preparation. V.A.D. is responsible for conceptualization, data curation, investigation, methodology, supervision and writing—review and editing. O.V.D. is responsible for investigation and visualization.
Funding
The authors acknowledge the financial support of the budget project #0135-2016-0010. The development and application of methodical approaches for sample treatment and preparation for FTIR investigation of 2:1 layered phyllosilicates was financially supported by the Russian Science Foundation (Project #16-17-10270).
Acknowledgments
The authors are grateful to Tatiana A. Ivanovskaya, Douglas McCarty, and Jan Środoń for providing some of the samples. Thanks are due to the anonymous reviewers for valuable comments.
Conflicts of Interest
The authors declare no conflict of interest. The funders had no role in the design of the study; in the collection, analyses, or interpretation of data; in the writing of the manuscript, or in the decision to publish the results.
References
- Środoń, J.; Eberl, D.D. Illite. In Micas: Reviews in Mineralogy; Bailey, S.W., Ed.; Mineralogical Society of America: Washington, DC, USA, 1984; Volume 13, pp. 495–544. [Google Scholar]
- Drits, V.A.; Kossovskaya, A.G. Clay Minerals: Micas and Chlorites; Nauka: Moscow, Russia, 1991; p. 175. (In Russian) [Google Scholar]
- Brigatti, M.F.; Guggenheim, S. Mica crystal chemistry and the influence of pressure, temperature and solid solution on atomistic models. In Micas: Crystal Chemistry and Metamorphic Petrology. Reviews in Mineralogy and Geochemistry; Mottana, A., Sassi, F.E., Thompson, J.B., Jr., Guggenheim, S., Eds.; Mineralogical Society of America: Washington, DC, USA; Accademia Nazionale dei Lincei: Roma, Italy, 2002; Volume 46, Chapter 1; pp. 1–97. [Google Scholar]
- Drits, V.A.; McCarty, D.K.; Zviagina, B.B. Crystal-chemical factors responsible for the distribution of octahedral cations over trans- and cis-sites in dioctahedral 2:1 layer silicates. Clays Clay Miner. 2006, 54, 131–153. [Google Scholar] [CrossRef]
- Drits, V.A.; Zviagina, B.B.; McCarty, D.K.; Salyn, A.L. Factors responsible for crystal-chemical variations in the solid solutions from illite to aluminoceladonite and from glauconite to celadonite. Am. Miner. 2010, 95, 348–361. [Google Scholar] [CrossRef]
- Wilson, M.D. Rock-Forming Minerals, Volume 3C, Sheet Silicates: Clay Minerals; The Geological Society: London, UK, 2013. [Google Scholar]
- Zviagina, B.B.; Drits, V.A.; Środoń, J.; McCarty, D.K.; Dorzhieva, O.V. The illite–aluminoceladonite series: Distinguishing features and identification criteria from X-ray diffraction and infrared spectroscopy data. Clays Clay Miner. 2015, 63, 378–394. [Google Scholar] [CrossRef]
- Zviagina, B.B.; Drits, V.A.; Sakharov, B.A.; Ivanovskaya, T.A.; Dorzhieva, O.V. Crystal-chemical regularities and identification criteria in Fe-bearing, K-dioctahedral 1M micas from X-ray diffraction and infrared spectroscopy data. Clays Clay Miner. 2017, 65, 234–251. [Google Scholar] [CrossRef]
- Drits, V.A.; Sakharov, B.A.; Ivanovskaya, T.A.; Pokrovskaya, E.V. Crystal-chemical microheterogeneity of Precambrian globular dioctahedral mica minerals. Lithol. Miner. Resour. 2013, 48, 503–528. [Google Scholar] [CrossRef]
- Farmer, C.V.; Russell, J.D. The infra-red spectra of layer silicates. Spectrochim. Acta 1964, 20, 1140–1173. [Google Scholar] [CrossRef]
- Farmer, V.C. The characterization of adsorption bonds in clays by infrared spectroscopy. Soil Sci. 1971, 112, 62–68. [Google Scholar] [CrossRef]
- Farmer, V.C. The layer silicates. In Infrared Spectra of Minerals, Monograph 4; Farmer, V.C., Ed.; Mineralogical Society: London, UK, 1974; Chapter 15; pp. 331–363. [Google Scholar]
- Slonimskaya, M.V.; Besson, G.; Dainyak, L.G.; Tchoubar, C.; Drits, V.A. Interpretation of the IR spectra of celadonites and glauconites in the region of OH-stretching frequencies. Clay Miner. 1986, 21, 377–388. [Google Scholar] [CrossRef]
- Velde, B. Infrared spectra of synthetic micas in the series muscovite-MgAl celadonite. Am. Miner. 1978, 63, 343–349. [Google Scholar]
- Velde, B. Clay Minerals: A Physico-Chemical Explanation of Their Occurrence. Developments in Sedimentology; Elsevier: Amsterdam, The Netherlands, 1985; Volume 40. [Google Scholar]
- Russell, J.D.; Fraser, A.R. Infrared methods. In Clay Mineralogy: Spectroscopic and Chemical Determinative Methods; Wilson, M.J., Ed.; Chapman & Hall: London, UK, 1994; pp. 11–67. [Google Scholar]
- Besson, G.; Drits, V.A. Refined relationships between chemical composition of dioctahedral fine-dispersed mica minerals and their infrared spectra in the OH stretching region. Part I. Identification of the OH stretching bands. Clays Clay Miner. 1997, 45, 158–169. [Google Scholar] [CrossRef]
- Besson, G.; Drits, V.A. Refined relationship between chemical composition of dioctahedral fine-dispersed mica minerals and their infrared spectra in the OH stretching region. Part II. The main factors affecting OH vibration and quantitative analysis. Clays Clay Miner. 1997, 45, 170–183. [Google Scholar] [CrossRef]
- Kloprogge, J.T.; Frost, R.L.; Hickey, L. Infrared absorption and emission study of synthetic mica-montmorillonite in comparison to rectorite, beidellite and paragonite. J. Mater. Sci. Lett. 1999, 18, 1921–1923. [Google Scholar] [CrossRef]
- Beran, A. Infrared spectroscopy of micas. In Micas: Crystal Chemistry and Metamorphic Petrology, Reviews in Mineralogy and Geochemistry; Mottana, A., Sassi, F.P., Thomson, J.B., Jr., Guggenheim, S., Eds.; Mineralogical Society of America: Washington, DC, USA; Accademia Nazionale dei Lincei: Roma, Italy, 2002; Volume 46, pp. 351–369. [Google Scholar]
- Post, J.L.; Borer, L. Physical properties of selected illites, beidellites and mixed-layer illite–beidellites from southwestern Idaho, and their infrared spectra. Appl. Clay Sci. 2002, 22, 77–91. [Google Scholar] [CrossRef]
- Madejová, J. FTIR techniques in clay mineral studies. Vib. Spectrosc. 2003, 31, 1–10. [Google Scholar] [CrossRef]
- Weiszburg, T.; Tóth, E.; Beran, A. Celadonite, the 10-Å green clay mineral of the manganese carbonate ore, Úrkút, Hungary. Acta Miner. Petrogr. 2004, 45, 65–80. [Google Scholar]
- Heller-Kallai, L.; Lapides, I. Dehydroxylation of muscovite: Study of quenched samples. Phys. Chem. Miner. 2015, 42, 835–845. [Google Scholar] [CrossRef]
- Singh, M.; Singh, L. Vibrational spectroscopic study of muscovite and biotite layered phyllosilicates. Indian J. Pure Appl. Phys. 2016, 54, 116–122. [Google Scholar]
- Madejová, J.; Gates, W.P.; Petit, S. IR spectra of clay minerals. In Infrared and Raman Spectroscopies of Clay Minerals; Gates, W.P., Klopprogge, J.T., Madejová, J., Bergaya, F., Eds.; Elsevier: Amsterdam, The Netherlands, 2017; Chapter 5; Volume 8, pp. 107–149. [Google Scholar]
- LeGras, M.; Laukamp, C.; Lau, I.; Mason, P. NVCL Spectral Reference Library—Phyllosilicates Part 2: Micas; CSIRO: Canberra, Australia, 2018.
- Mathian, M.; Hebert, B.; Baron, F.; Petit, S.; Lescuyer, J.-L.; Furic, R.; Beaufort, D. Identifying the phyllosilicate minerals of hypogene ore deposits in lateritic saprolites using the near-IR spectroscopy second derivative methodology. J. Geochem. Explor. 2018, 186, 298–314. [Google Scholar] [CrossRef]
- Ross, P.-S.; Bourke, A.; Schnitzler, N.; Conly, A. Exploration Vectors from Near Infrared Spectrometry near the McLeod Volcanogenic Massive Sulfide Deposit, Matagami District, Québec. Econ. Geol. 2019, 114, 613–638. [Google Scholar] [CrossRef]
- Shishelova, T.I.; Lipovchenko, E.L.; Shulga, V.V. Mica Dehydroxylation Mechanism. J. Appl. Spectr. 2019, 86, 817–821. [Google Scholar] [CrossRef]
- Grandjean, G.; Briottet, X.; Adeline, K.; Bourguignon, A.; Hohmann, A. Clay Minerals Mapping from Imaging Spectroscopy. In Geospatial Analyses of Earth Observation (EO) Data; Pepe, A., Ed.; IntechOpen: London, UK, 2019. [Google Scholar] [CrossRef]
- Della Ventura, G.; Hawthorne, F.C.; Iezzi, G. Synthesis and solid solution in “rubidium richterite”, Rb(NaCa)Mg5Si8O22(OH,F)2. Phys. Chem. Miner. 2019, 46, 759–770. [Google Scholar] [CrossRef]
- Yang, M.; Han, L.; Xu, Y.; Ke, H.; Zhou, N.; Dong, H.; Liu, S.; Qiao, G. Near Infrared Spectroscopic Study of Trioctahedral Chlorites and Its Remote Sensing Application. Open Geosci. 2019, 11, 815–828. [Google Scholar] [CrossRef]
- Eberl, D.D.; Środoń, J.; Lee, M.; Nadeau, P.H.; Northrop, H.R. Sericite from the Silverton Caldera, Colorado: Correlation among structure, composition, origin, and particle thickness. Am. Miner. 1987, 72, 914–934. [Google Scholar]
- Viczián, I. Hungarian investigations on the “Zempleni” illite. Clays Clay Miner. 1997, 45, 114–115. [Google Scholar] [CrossRef]
- Środoń, J.; Zeelmaekers, E.; Derkowski, A. The charge of component layers of illite-smectite in bentonites and the nature of end-member illite. Clays Clay Miner. 2009, 57, 649–671. [Google Scholar] [CrossRef]
- Środoń, J.; Clauer, N.; Huff, W.; Dudek, T.; Banaś, M. K-Ar dating of the Lower Palaeozoic K-bentonites from the Baltic Basin and the Baltic Shield: Implications for the role of temperature and time in the illitization of smectite. Clay Miner. 2009, 44, 361–387. [Google Scholar] [CrossRef]
- Grathoff, G.H.; Moore, D.M.; Kluessendorf, J.; Mikulic, D.G. The Waukesha illite, a Silurian Residuum from Karstification, Proposed as a Candidate for the Source Clay Repository. Program with abstracts. In Proceedings of the 32nd Annual Clay Minerals Society Meeting, Baltimore, MD, USA, 3–8 June 1995; p. 54. [Google Scholar]
- Ivanovskaya, T.A.; Tsipursky, S.I.; Yakovleva, O.V. Mineralogy of globular glauconites from Vendian and Riphean of the Ural and Siberia. Litologia i Poleznye Iskopaemye 1989, 3, 83–99. (In Russian) [Google Scholar]
- Seifert, F. X-ray powder data for Mg-A1-celadonite (leucophyllite) from Barcza, Poland. Contrib. Miner. Petrol. 1968, 19, 93–96. [Google Scholar] [CrossRef]
- Kardymowicz, I. O seladonicie z Barczy w Górach Swietokrzyskich. Geol. Quart. 1960, 4, 609–618. (In Polish) [Google Scholar]
- Sokolova, T.N.; Drits, V.A.; Sokolova, A.L.; Stepanov, S.S. Structural and mineralogical characteristics and conditions of formation of leucophyllite from salt-bearing deposits of Inder. Litologia i Poleznye Iskopaemye 1976, 6, 80–95. (In Russian) [Google Scholar]
- Środoń, J.; Paszkowski, M.; Drygant, D.; Anczkiewicz, A.; Banas, M. Thermal history of Lower Paleozoic rocks on the Peri-Tornquist margin of the East European Craton (Podolia, Ukraine) inferred from combined XRD, K-Ar, and AFT data. Clays Clay Miner. 2013, 61, 107–132. [Google Scholar] [CrossRef]
- Petrova, V.V.; Amarjargal, P. Zeolites of Mongolia; Nauka: Moscow, Russia, 1996; p. 150. (In Russian) [Google Scholar]
- Ivanovskaya, T.A.; Kats, A.G.; Florova, Z.B.; Tsipursky, S.I.; Yakovleva, O.V. Structure and lithomineralogical peculiarities of the Basal Lower Riphean in the Olenek Uplift (Osorkhayata Formation), Stratigrafiya. Geologicheskaya Korrelyatsiya 1993, 1, 84–92. (In Russian) [Google Scholar]
- Ivanovskaya, T.A. Globular glauconite-illite layer silicates in Middle Riphean Debengdinsk Formation of the Olenek Uplift. Lithol. Miner. Resour. 1994, 29, 595–605. [Google Scholar]
- Zaitseva, T.S.; Gorokhov, I.M.; Ivanovskaya, T.A.; Semikhatov, M.A.; Kuznetsov, A.B.; Mel’nikov, N.N.; Arakelyants, M.M.; Yakovleva, O.V. Mössbauer characteristics, mineralogy and isotopic age (Rb–Sr, K–Ar) of Upper Riphean glauconites from the Uk Formation, the southern Urals. Stratigr. Geol. Correl. 2008, 14, 227–247. [Google Scholar] [CrossRef]
- Ivanovskaya, T.A.; Zviagina, B.B.; Sakharov, B.A.; Zaitseva, T.S.; Pokrovskaya, E.V.; Dorzhieva, O.V. Globular layer silicates of the glauconite–illite composition in Upper Proterozoic and Lower Cambrian rocks. Lithol. Miner. Resour. 2015, 50, 452–477. [Google Scholar] [CrossRef]
- Ivanovskaya, T.A.; Tsipursky, S.I. First find of globular glauconite in the Lower Riphean, Anabar Uplift. Litologia i Poleznye Iskopaemye 1990, 25, 110–121. (In Russian) [Google Scholar]
- Nikolaeva, I.V. Minerals of the Glauconite Group in Sedimentary Formations; Nauka: Novosibirsk, Russia, 1977; p. 319. (In Russian) [Google Scholar]
- Drits, V.A.; Kameneva MYu Sakharov, B.A.; Dainyak, L.G.; Smoliar, B.B.; Bookin, A.S.; Salyn, A.L. Problems in Determination of the Actual Crystal Structure of Glauconites and Related Phyllosilicates; Nauka: Novosibirsk, Russia, 1993; p. 198. (In Russian) [Google Scholar]
- Thompson, J.R.; Hower, J. The mineralogy of glauconite. Clays Clay Miner. 1975, 23, 289–300. [Google Scholar] [CrossRef]
- Murav’ev, V.I. Mineral Parageneses of Glauconiee-Siliceous Formations; Nauka: Moscow, Russia, 1983; p. 208. (In Russian) [Google Scholar]
- Kimbara, K.; Shimoda, S. A ferric celadonite in amygdales of dolerite at Taiheizan, Akita prefecture, Japan. Appl. Clay Sci. 1973, 4, 143–150. [Google Scholar]
- Lazarenko, E.K.; Pavlishin, V.I. Relationship of celadonite and svitalskite. In Mineralogy of Sedimentary Rocks; Naukova Dumka: Kiev, Ukraine, 1976. (In Russian) [Google Scholar]
- Malkova, K.M. On the celadonite of Pobuzhye. In Collected Papers on Mineralogy. Lvov Geol. Soc. 1956, 10, 305–318. (In Russian) [Google Scholar]
- Strens, R.G., Jr. The comon chain, ribbon and ring silicates. In Infrared Spectra of Minerals, Monograph 4; Farmer, V.C., Ed.; Mineralogical Society: London, UK, 1974; Chapter 14; pp. 305–330. [Google Scholar]
- Chryssikos, G.D.; Gates, W.P. Spectral Manipulation and Introduction to Multivariate Analysis. In Infrared and Raman Spectroscopies of Clay Minerals; Gates, W.P., Klopprogge, J.T., Madejová, J., Bergaya, F., Eds.; Elsevier: Amsterdam, The Netherlands, 2017; Volume 8, Chapter 4; pp. 64–106. [Google Scholar]
- Madejová, J.; Komadel, P.; Číčel, B. Infrared study of octahedral site populations in smectites. Clay Miner. 1994, 29, 319–326. [Google Scholar] [CrossRef]
- Cuadros, J.; Sainz-Diaz, C.I.; Ramirez, R.; Hernandez-Laguna, A. Analysis of Fe segregation in the octahedral sheet of bentonitic illite-smectite by means of FTIR, 27Al MAS NMR and reverse Monte-Carlo simulations. Am. J. Sci. 1999, 299, 289–308. [Google Scholar] [CrossRef]
- Zviagina, B.B.; McCarty, D.K.; Środoń, J.; Drits, V.A. Interpretation of infrared spectra of dioctahedral smectites in the region of OH-stretching vibrations. Clays Clay Miner. 2004, 52, 399–410. [Google Scholar] [CrossRef]
- Vantelon, D.; Pelletier, M.; Michot, L.J.; Barres, O.; Thomas, F. Fe, Mg and Al distribution in the octahedral sheet of montmorillonites. An infrared study in the OH-bending region. Clay Miner. 2001, 36, 369–379. [Google Scholar] [CrossRef]
- Fialips, C.I.; Huo, D.; Yan, L.; Wu, J.; Stucki, J.W. Effect of Fe oxidation state on the IR spectra of Garfield nontronite. Am. Miner. 2002, 87, 630–641. [Google Scholar] [CrossRef]
- Madejová, J.; Komadel, P. Baseline studies of the Clay Minerals Society source clays: Infrared methods. Clays Clay Miner. 2001, 49, 410–432. [Google Scholar] [CrossRef]
- Beran, A.; Voll, D.; Schneider, H. IR spectroscopy as a tool for the characterization of ceramic precursor phases. In Spectroscopic Methods in Mineralogy, EMU Notes in Mineralogy; Beran, A., Libowitzky, E., Eds.; Eötvös University Press: Budapest, Hungary, 2004; Volume 6, pp. 189–226. [Google Scholar]
- Rothbauer Von, R. Untersuchung eines 2M1-muskovits mit neutronenstrahlen. Neues Jahrbuch für Mineralogie Monatshefte 1971, 1971, 143–154. [Google Scholar]
- Ivaldi, G.; Ferraris, G.; Curetti, N.; Compagnoni, R. Coexisting 3T and 2M1 polytypes in a phengite from Cima Pal (Val Savenca, western Alps): Chemical and polytypic zoning and structural characterization. Eur. J. Miner. 2001, 13, 1025–1034. [Google Scholar] [CrossRef]
- Smyth, J.R.; Jacobsen, S.D.; Swope, R.J.; Angel, R.J.; Arlt, T.; Domanik, K.; Holloway, J.R. Crystal structures and compressibilities of synthetic 2M1 and 3T phengite micas. Eur. J. Miner. 2000, 12, 955–963. [Google Scholar] [CrossRef]
- Lee, J.H.; Guggenheim, S. Single crystal X-ray refinement of pyrophyllite-1Tc. Am. Miner. 1981, 66, 350–357. [Google Scholar]
- Zviagina, B.B.; Drits, V.A. Structural regularities in 2M1 dioctahedral micas: The structure modeling approach. Am. Miner. 2012, 97, 1939–1954. [Google Scholar] [CrossRef]
- Goodman, B.A.; Russell, J.D.; Fraser, A.R. A Mössbauer and I.R. spectroscopy study of the structure of nontronite. Clays Clay Miner. 1976, 24, 53–59. [Google Scholar] [CrossRef]
- Gates, W.P. Infrared spectroscopy and the chemistry of dioctahedral smectites. In The Application of Vibrational Spectroscopy to Clay Minerals and Layered Double Hydroxides, CMS Workshop Lectures; Klopproge, J.T., Ed.; The Clay Mineral Society: Aurora, CO, USA, 2005; pp. 125–168. [Google Scholar]
- Gates, W.P. Cation mass—Valence sum (CM-VS) approach to assigning OH-bending bands in dioctahedral smectites. Clays Clay Miner. 2008, 56, 10–22. [Google Scholar] [CrossRef]
- Madejová, J.; Komadel, P. Information available from infrared spectra of the fine fraction of bentonites. In The Application of Vibrational Spectroscopy to Clay Minerals and Layered Double Hydroxides, CMS Workshop Lectures, Klopproge, J.T., Ed.; The Clay Mineral Society: Aurora, CO, USA, 2005; pp. 65–98. [Google Scholar]
- Martinez-Alonso, S.; Rustad, J.R.; Goetz, A.F.H. Ab initio quantum mechanical modelling of infrared vibrational frequencies of the OH group in dioctahedral phyllosilicates. Part 1: Methods, results and comparison to experimental data. Am. Miner. 2002, 87, 1215–1223. [Google Scholar] [CrossRef]
- Moenke, H.H.W. Silica, the three-dimensional silicates, borosilicates, and beryllium silicates. In Infrared Spectra of Minerals, Monograph 4; Farmer, V.C., Ed.; Mineralogical Society: London, UK, 1974; Chapter 16; pp. 365–380. [Google Scholar]
- White, W.B. The carbonate minerals. In Infrared Spectra of Minerals, Monograph 4; Farmer, V.C., Ed.; Mineralogical Society: London, UK, 1974; Chapter 12; pp. 227–284. [Google Scholar]
- Ryskin, Y.I. The vibrations of protons in minerals: Hydroxyl, water, and ammonium. In Infrared Spectra of Minerals, Monograph 4; Farmer, V.C., Ed.; Mineralogical Society: London, UK, 1974; Chapter 9; pp. 137–182. [Google Scholar]
- Chukhrov, F.V.; Gorshkov, A.I.; Rudnitskaya, E.S.; Berezovskaya, V.V.; Sivtsov, A.V. On vernadite. Izvestiya Akademii Nauk SSR, Seriya Geologicheskaya 1978, 6, 5–19. [Google Scholar] [CrossRef]
- Lantenois, S.; Bény, J.-M.; Muller, F.; Champallie, R. Integration of iron in natural and synthetic Al-pyrophyllites: An infrared spectroscopic study. Clay Miner. 2007, 42, 129–143. [Google Scholar] [CrossRef][Green Version]
- Langer, K.; Chatterjee, N.D.; Abraham, K. Infrared studies of some synthetic and natural 2M1 dioctahedral micas. N. Jb. Miner. Abh. 1981, 142, 91–110. [Google Scholar]
- Besson, G.; Drits, V.A.; Dayniak, L.G.; Smoliar, B.B. Analysis of cation distribution in dioctahedral micaceous minerals on the basis of IR spectroscopy data. Clays Clay Miner. 1987, 22, 465–478. [Google Scholar] [CrossRef]
- Dainyak, L.G.; Drits, V.A.; Zviagina, B.B.; Lindgreen, H. Cation redistribution in the octahedral sheet during diagenesis of illite-smectites from Jurassic and Cambrian oil source rock shales. Am. Miner. 2006, 91, 589–603. [Google Scholar] [CrossRef]
- Dainyak, L.G.; Rusakov, V.S.; Sukhorukov, I.A.; Zviagina, B.B.; Drits, V.A. An improved model for the interpretation of Mössbauer spectra of dioctahedral 2:1 trans-vacant Fe-rich micas: Refinement of parameters. Eur. J. Miner. 2009, 21, 995–1008. [Google Scholar] [CrossRef]


© 2020 by the authors. Licensee MDPI, Basel, Switzerland. This article is an open access article distributed under the terms and conditions of the Creative Commons Attribution (CC BY) license (http://creativecommons.org/licenses/by/4.0/).