Article

Characteristics of Organic Matter Particles and Organic Pores of Shale Gas Reservoirs: A Case Study of Longmaxi-Wufeng Shale, Eastern Sichuan Basin

1
State Key Laboratory of Shale Oil and Gas Enrichment Mechanisms and Effective Development, Beijing 100083, China
2
Engineering Department, Saint Francis University, Loretto, PA 15940, USA
3
College of Earth and Planetary Sciences, University of Chinese Academy of Sciences, Beijing 100049, China
*
Author to whom correspondence should be addressed.
Minerals 2020, 10(2), 137; https://doi.org/10.3390/min10020137
Submission received: 26 November 2019 / Revised: 21 January 2020 / Accepted: 25 January 2020 / Published: 6 February 2020
(This article belongs to the Special Issue Characterisation of Mudrocks: Textures and Mineralogy)

Abstract

:
Heterogeneity of organic matter (OM), including size, type, and organic pores within OM, is being recognized along with increasing study using SEM images. Especially, the contribution of organic pores to the entire pore system should be better understood to aid in the evaluation of shale reservoirs. This research observed and quantitatively analyzed over 500 SEM images of 19 core samples from Longmaxi-Wufeng Shale in the eastern Sichuan Basin to summarize the features of OM particles and OM-hosted pores and their evolution during burial. The features of organic pores as well as the embedded minerals within OM particles enables to recognize four different type of OM particles. The organic pore features of each type of OM particles were quantitatively described using parameters such as pore size distribution (PSD), pore geometry, and organic porosity. The PSD of weakly or undeformed porous pyrobitumen indicates that the large organic pores (usually 200 nm to 1 µm) is less common than small pores but the major contributor to organic porosity. The organic porosity of OM particles covers a large range of 1–35%, indicating a high heterogeneity among OM particles. Based on analysis of 81 OM particles, the average of organic porosity of the five samples were calculated and ranges from 3% to 12%. In addition, samples from well JY1 have higher organic porosity than JY8. These results helped to reveal how significant the organic pores are for shale gas reservoirs. In addition to presenting many examples of OM particles, this research should significantly improve the understanding of type and evolution of OM particles and contribution of OM-hosted pores to the entire pore system of high to over mature shale.

1. Introduction

Under the high- to over-thermal mature stage, the generation of natural gas by cracking the deposited kerogen and the generated bitumen during immature and early mature stage can form a large number of pores within organic matter (OM) [1,2,3,4,5,6,7], called organic pores or OM-hosted pores. The existing studies using SEM images have made many geologists and engineers believe that these OM-hosted pores have significant contribution to the entire pore system within shale gas reservoirs [2,3,4,7,8,9,10,11,12,13,14,15,16]. Moreover, the OM-hosted pores, with large specific surface area and high adsorption capacity, are the predominant pore space of adsorbed gas [17], as well as the flow pathway for shale gas through the shale matrix [4]. Therefore, to successfully understand the pore system of shale, it is critical to comprehensive investigate the properties of OM-hosted pores. In addition, the features of OM-hosted pores varies a lot among OM particles [6,16], and, consequently, the features of OM particles (e.g., size and geometry, origin, etc.) should also be analyzed at the same time. The detailed characterization of features of OM and OM-hosted pores should be helpful for more accurately evaluating the pore system and shale gas reserve, more effectively identifying the favorable area of shale gas play, and improving the management of shale gas reservoirs.
The term bitumen has been used differently by organic geochemists, organic petrologists, and geologists [18]. To avoid confusion, in this research, we used term bitumen as the intermediate production (liquid or pseudo-liquid) between kerogen and oil [12], that is the pre-oil bitumen used by Curiale [19], and pyrobitumen as the residual solid organics of bitumen and oil after gas generation, that is the post-oil solid bitumen used by Curiale [19] and Cardott et al. [18]. Thus, OM within shale gas reservoirs is either kerogen after hydrocarbon generation or pyrobitumen as the residual organics of bitumen and oil after further cracking to generate gas [4,18]. Along with technological advances over the past ten years, SEM imaging on ion-polished sample surfaces has enabled the direct observation of minerals, OM, and nano-size OM-hosted pores [2,3,4,5,11,20]. Both qualitative and quantitative analysis of SEM images can be utilized to reveal the features of OM and OM-hosted pores within shale gas reservoirs, which has become a significant part of shale reservoir characterization. Moreover, along with the increasing analysis of SEM images of shale, the heterogeneity of OM, and OM-hosted pores has been realized [2,3,4,16,20]. This makes it more important to comprehensively characterize the features of OM and OM-hosted pores of shale gas reservoirs.
This study relied on a large amount of SEM images acquired in 2012 and 2015 to quantitatively analyze the size and geometry of OM and OM-hosted pores of Longmaxi-Wufeng Shale in the Eastern Sichuan Basin. Combining other features of OM (e.g., embedded minerals, biogenic shells, etc.), the type and evolution of OM as well as the controlling factors of OM-hosted pores were investigated. The pore size distribution of OM-hosted pores and organic porosity were also calculated using SEM images to verify the significant contribution of OM-hosted pores to the entire pore system of high- to over-mature shale gas reservoirs similar to Longmaxi-Wufeng Shale.

2. Geological Background and Sampling

Longmaxi-Wufeng Shale in the Eastern Sichuan Basin was deposited in a deep-water shelf sedimentary facies during Late Ordovician and Early Silurian [21,22]. It is a thick (about 60–120 m) organic-rich shale [23,24] which has suffered from complex deformation due to multi-stage tectonic movements [22,25,26]. Currently, Longmaxi-Wufeng Shale is the most productive marine shale in Sichuan Basin [22], with five shale gas fields discovered [27]. Fuling Shale Gas Field and Pingqiao Shale Gas Field are two of the five shale gas fields in Sichuan Basin. The Fuling Shale Gas Field drilled its first horizontal production well JY 1HF in 2012 and then hundreds of horizontal wells have been drilled to produce about 6 billion m3 annually from 2017 [21,22]. Pingqiao Shale Gas Field, developed later than the Fuling Shale Gas Field, and has drilled about 50 production wells [26]. Structurally, both Fuling and Pingqiao Shale Gas Fields are located in an anticline with boundary reverse faults, but the anticline in the Pingqiao area is narrower with more faults (Figure 1a). The thermal maturation of Longmaxi Shale in Fuling and Pingqiao Shale Gas Fields is very high with a Ro of about 2.22–2.89% [23,24,27].
Wufeng Shale and the Long1 member, the lower section of Longmaxi Shale, have higher TOC content than the upper section of Longmaxi Shale (Figure 1b), which is the main production zone of shale gas in the Eastern Sichuan Basin. Our core samples for SEM imaging were mainly collected from the Long1 member of Longmaxi Shale and Wufeng Shale in well JY1 in the north of the Fuling Shale Gas Field and JY8 in the center of the Pingqiao Shale Gas Field (Figure 1a). The straight distance between JY1 and JY8 is about 90 km. The characteristics of TOC content, porosity, lithology, and logging response of Long1 member in wells JY1 and JY8 are very similar (Figure 1b), but JY1 has a slightly high TOC content and porosity than JY8 [27]. In addition, the burial depth of Longmaxi Shale in JY8 is larger than that of JY1, indicating higher overburden stress and temperature. Among all the core samples, 16 core samples in JY1 and three samples in JY8 carried out SEM imaging (Table 1). These core samples were once exposed to drilling muds but naturally dried before SEM imaging.

3. Methodology

The high-resolution SEM images were the fundamental data for this research. To capture high-resolution SEM images, the shale core samples were polished using broad ion beam and then coated with vaporized platinum. The SEM images were then captured using JSM-6700F NT SEM under 10 kV at the Institute of Process Engineering, China Academy of Sciences in 2012, and a Helios Nanolab 600i SEM under 8 kV at the Harbin Institute of Technology in 2015. Both experiments were under high vacuum. In total, we collected 527 images during the two measurements (Table 1).
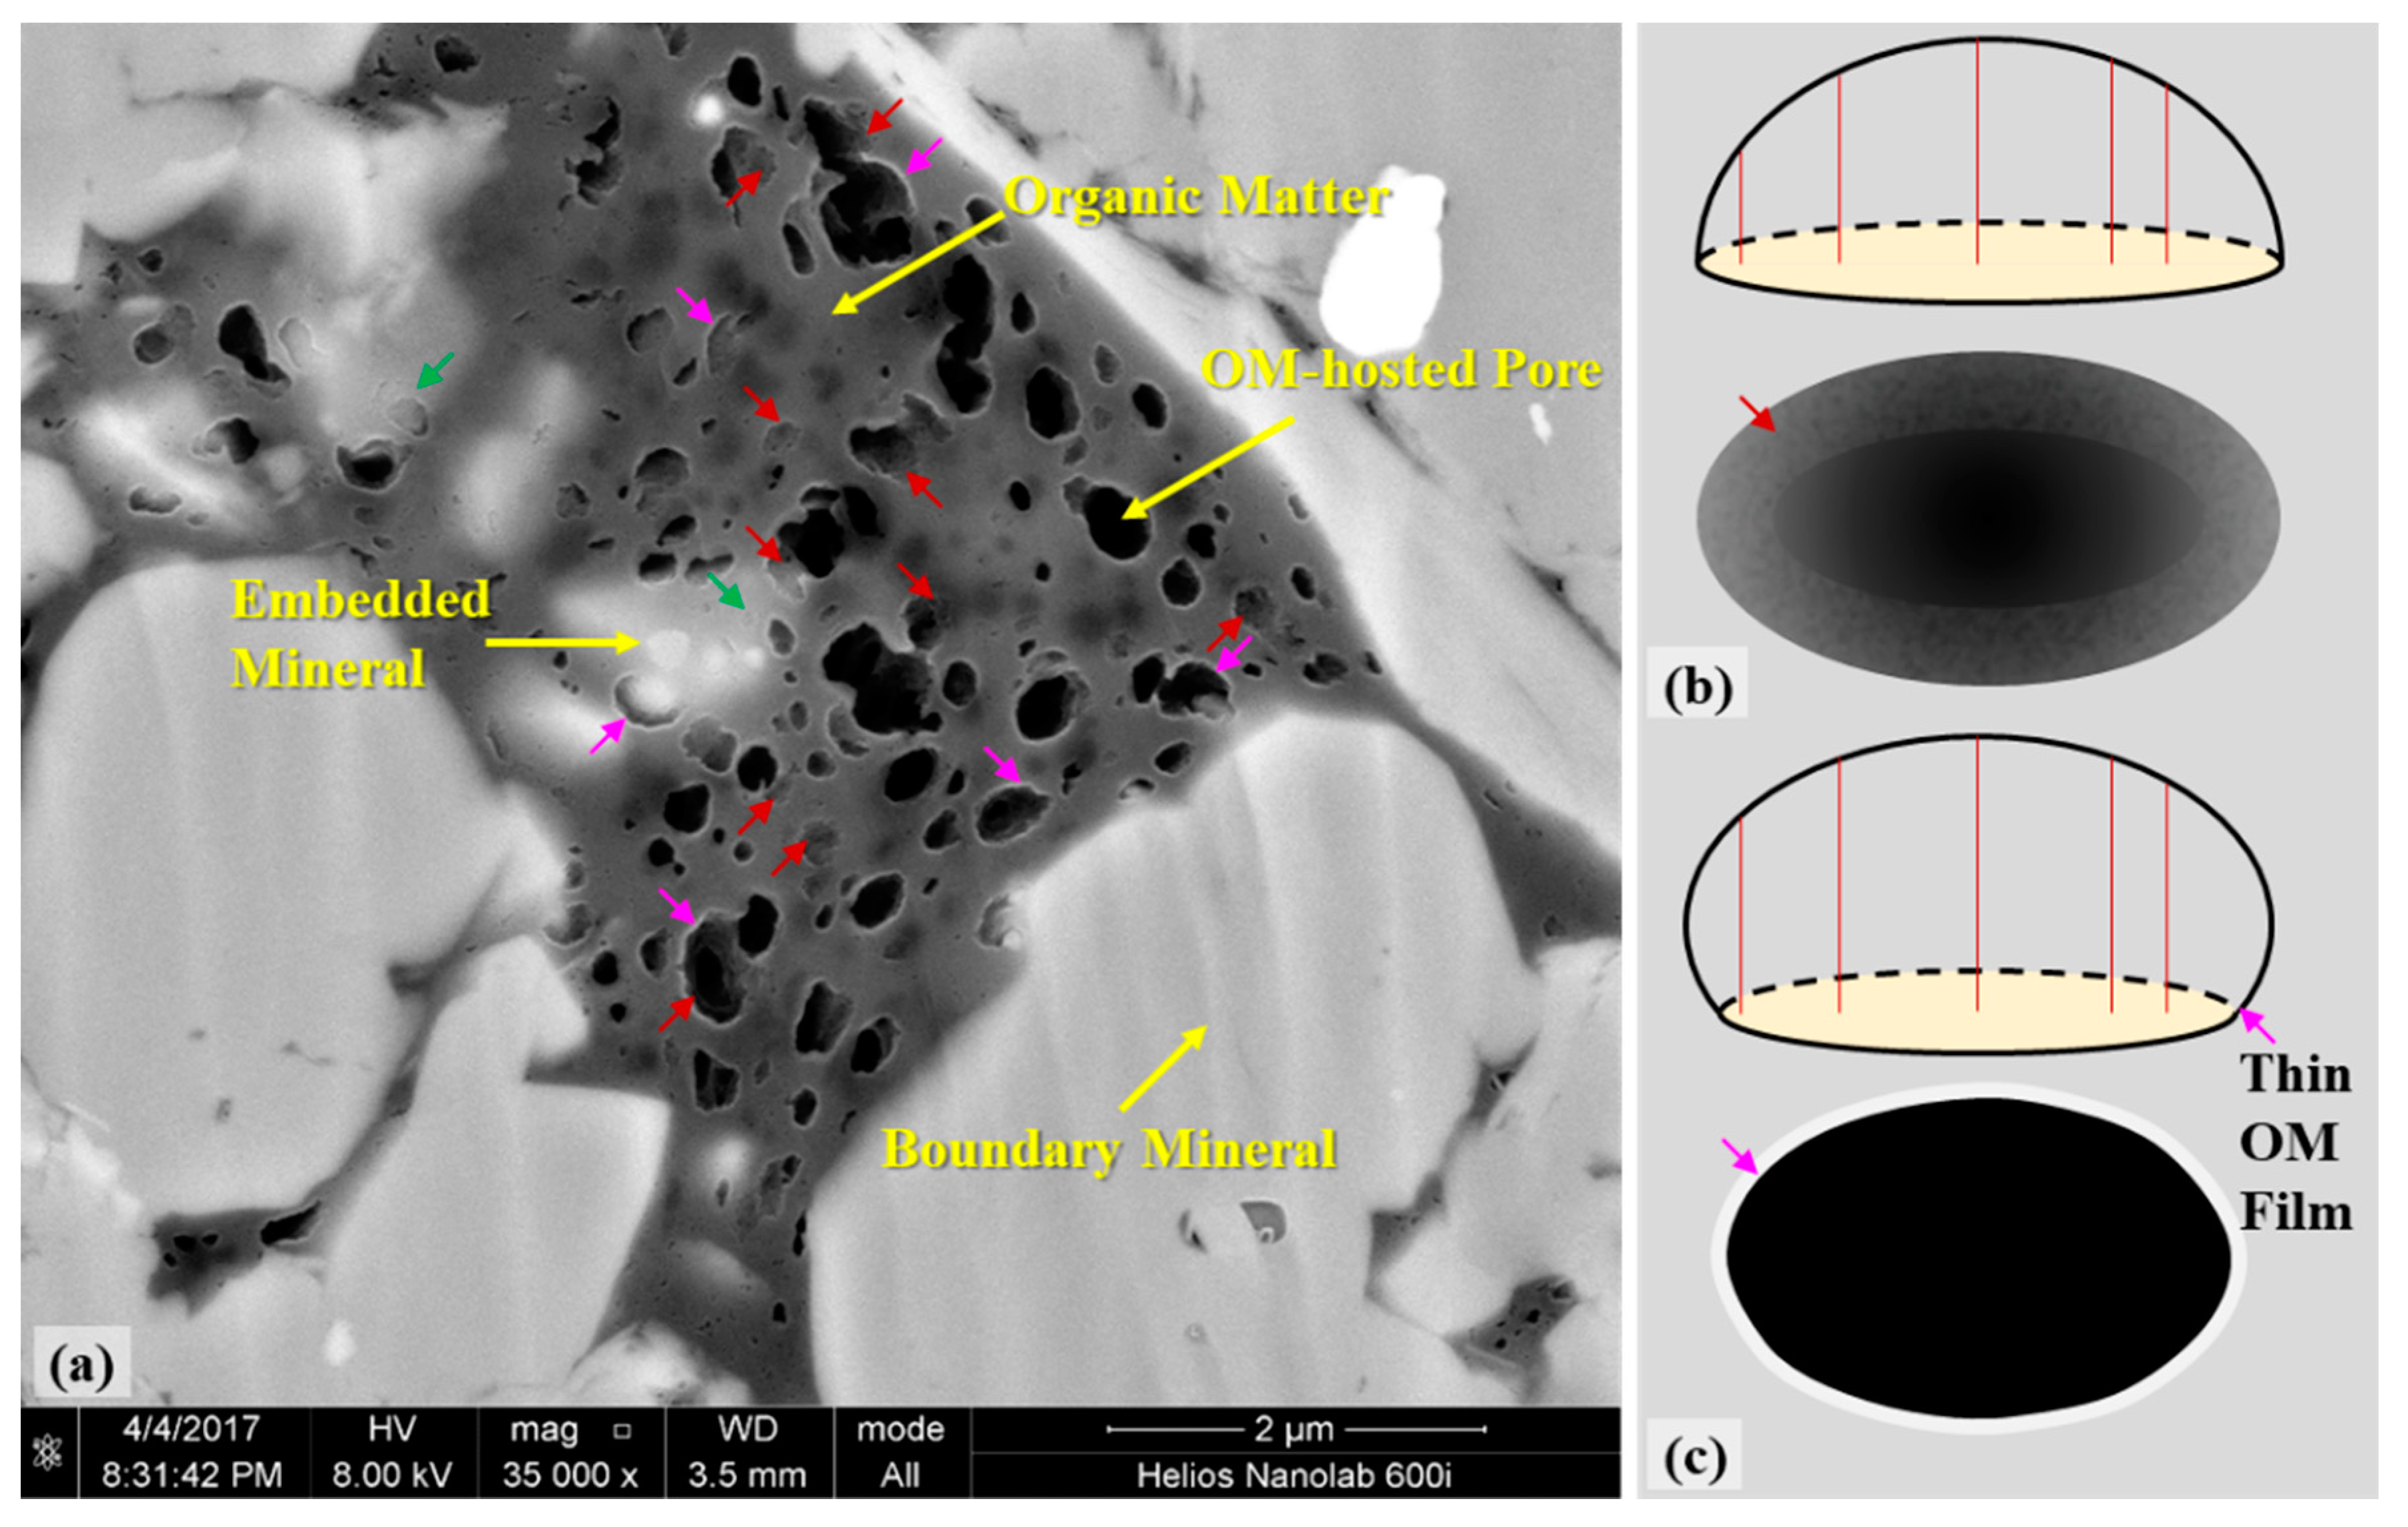
To process the SEM images, we firstly distinguished organic matter (OM) from minerals based on the gray level. In general, OM are darker than minerals (Figure 2a), which is relatively easy to recognize. The more challenging part is to recognize OM-hosted pores from OM. Although the typical OM-hosted pores should have a higher gray level (almost black) than OM, it is very common to find examples of OM-hosted pores with similar or smaller gray level than OM (Figure 2a). One reason of low gray level of OM-hosted pores is the regional gray level change within the SEM images due to the imaging process (uneven distribution of reflected electrons) or the effect of the surrounding bright minerals (green arrows in Figure 2a). Another important reason is related to the spherical structure of the wall of OM-hosted pores. When a sectional surface is generated through a sphere or ellipsoid, the distance from the surface of sphere or ellipsoid to this sectional surface gradually varies from zero to near to the radius (Figure 2b). Given the distance is larger than a certain value, the gray level of the OM-hosted pore is black or very dark. As the distance becomes smaller, not only the gray level becomes lighter, but also the pattern of the gray level varies. In the area that OM is polished by an ion beam, the SEM image looks like very smooth; however, the wall of the OM-hosted pores is away from the sectional surface and is not polished, so its surface keeps the original texture of pore walls and the SEM image in these area looks like rough (red arrows in Figure 2a,b). This rough texture is important for correctly recognizing OM-hosted pores, but difficult to be automatically recognized by any software package. In addition, if a thin film of OM is generated due to the concaveness of pore walls (Figure 2c), a white outline is usually formed at the edge of OM-hosted pores (purple arrows in Figure 2a,c). Consequently, the gray level itself fails to recognize all OM-hosted pores. In this research, the gray level and texture (including the roughness and white edge concaved toward pores) were used to recognize all OM-hosted pores (Figure 2). We first manually painted all the OM-hosted pores to black and then used the open-source software package FIJI imaging to automatically extract the parameters related to the size and geometry of OM-hosted pores as well as the OM, such as the sectional area (area in short), perimeter (the length of boundary on SEM image), the major and minor axes of the area-equivalent ellipse and their ratio, the orientation of the major axis, etc. [16,28].
The features of OM-hosted pores varies significantly among OM particles, which could be a result of the integrated effect of OM type, evolution, and deformation. To make the discussion clearer and easier to understand, OM particles within high to over mature shale are classified into four types based on the features of OM-hosted pores, biogenetic features, and embedded minerals investigated by SEM images. Each type can be further divided into two or three subtypes according to OM size and geometry and/or the embedded minerals. For each subtype OM, the measured parameters of OM-hosted pores of representative OMs were then used to reveal the features of pore structures, including the pore size distribution (PSD) determined by pore amount and area per 100 µm2 of OM, organic porosity (PHIo) defined as the sectional area of OM-hosted pores to the OM on SEM image, and geometry of OM-hosted pores.
In addition, the resolution of SEM images can affect the result of pore structure analysis. With low resolution (15 nm/pixel), the pixels are too big to draw the small pores or make the roughness texture unclear on SEM images. Thus, the uncertainty becomes high when using low resolution images. In this research, the analysis of features of OM-hosted pores dominantly relied on the images with resolution higher than 15 nm/pixel. The effect of image resolution should not be ignored when comparing pore structures calculated from SEM images with different resolution.

4. Results and Discussion

4.1. Classification of Organic Matter (OM) Particles

An effective classification of OM particles should be very helpful for the discussion of features of OM-hosted pores, due to differences of organic pores among OM particles. Its key is to determine the classification criterion. This heterogeneity of pores within OM has been interpreted as a result of interaction of thermal maturity [3,4], OM type plus the original structure of organism [6,16], and deformation [16]. Since this research focused on shale gas reservoirs, the maturation is similar and should not be the major reason of this heterogeneity. Consequently, the OM type and deformation played more important roles on affecting the features of OM-hosted pores. Among the OM types, both chemical composition of and stress applied on pyrobitumen are rather different from kerogen, causing the features of organic pores to be very different in pyrobitumen and kerogen. Chemically, alginite, exinite, and amorphous kerogen usually have higher hydrogen concentration than vitrinite and inertinite, indicating a higher capacity to generate hydrocarbon and pores [12]. Thus, the features of organic pores can be used as an indicator to infer the hydrogen concentration of kerogen. In this research, we used terms amorphous kerogen and nonporous kerogen to represent kerogen with high hydrogen concentration (alginate, exinite, and amorphous kerogen) and low hydrogen concentration (vitrinite and inertinite), respectively. As liquid or pseudo-liquid, bitumen and oil should have higher hydrogen concentration than amorphous kerogen. Therefore, if no deformation occurred, pyrobitumen should be the most porous, followed by amorphous kerogen, and nonporous kerogen is the least porous or nonporous. However, this feature will be modified by deformation.
Stress applied on kerogen and pyrobitumen is rather different and strongly affects the features of OM-hosted pores through compressing OM [16]. The large-size kerogen, predominately as part of the mineral framework of shale, should suffer from compaction due to large overburden stress before, during and after gas generation. The stress applied on kerogen before and during gas generation may inhibit the pore growth, causing the pores smaller in kerogen, while the stress after gas generation could deform pores to be flat, irregular or smaller, even invisible. In contrast, pyrobitumen was usually not part of the framework but supported by mineral framework, so stress applied on pyrobitumen should be close to or slightly larger than pore pressure [16]. This is related to the evolution process of pyrobitumen [16,18]. During immature or early mature stage, bitumen and oil fill into pore spaces among minerals as liquid or pseudo-liquid. Even the mechanical compaction is strong during this period, compression of bitumen and oil could occur but, as a liquid or pseudo-liquid, should have little or no effect on the following generation of gas and pores within pyrobitumen. During and after gas generation, mechanical compaction has become much weaker and, consequently, the solid pyrobitumen is usually only deformed locally unless tectonic movement significantly increases stress or mineral framework is weakened due to mineral solution or crushing. Stress on different particles of pyrobitumen could be different also due to the variety of mineral framework support. Thus, the degree of deformation varies among different particles of kerogen and pyrobitumen, causing different features of OM-hosted pores [16].
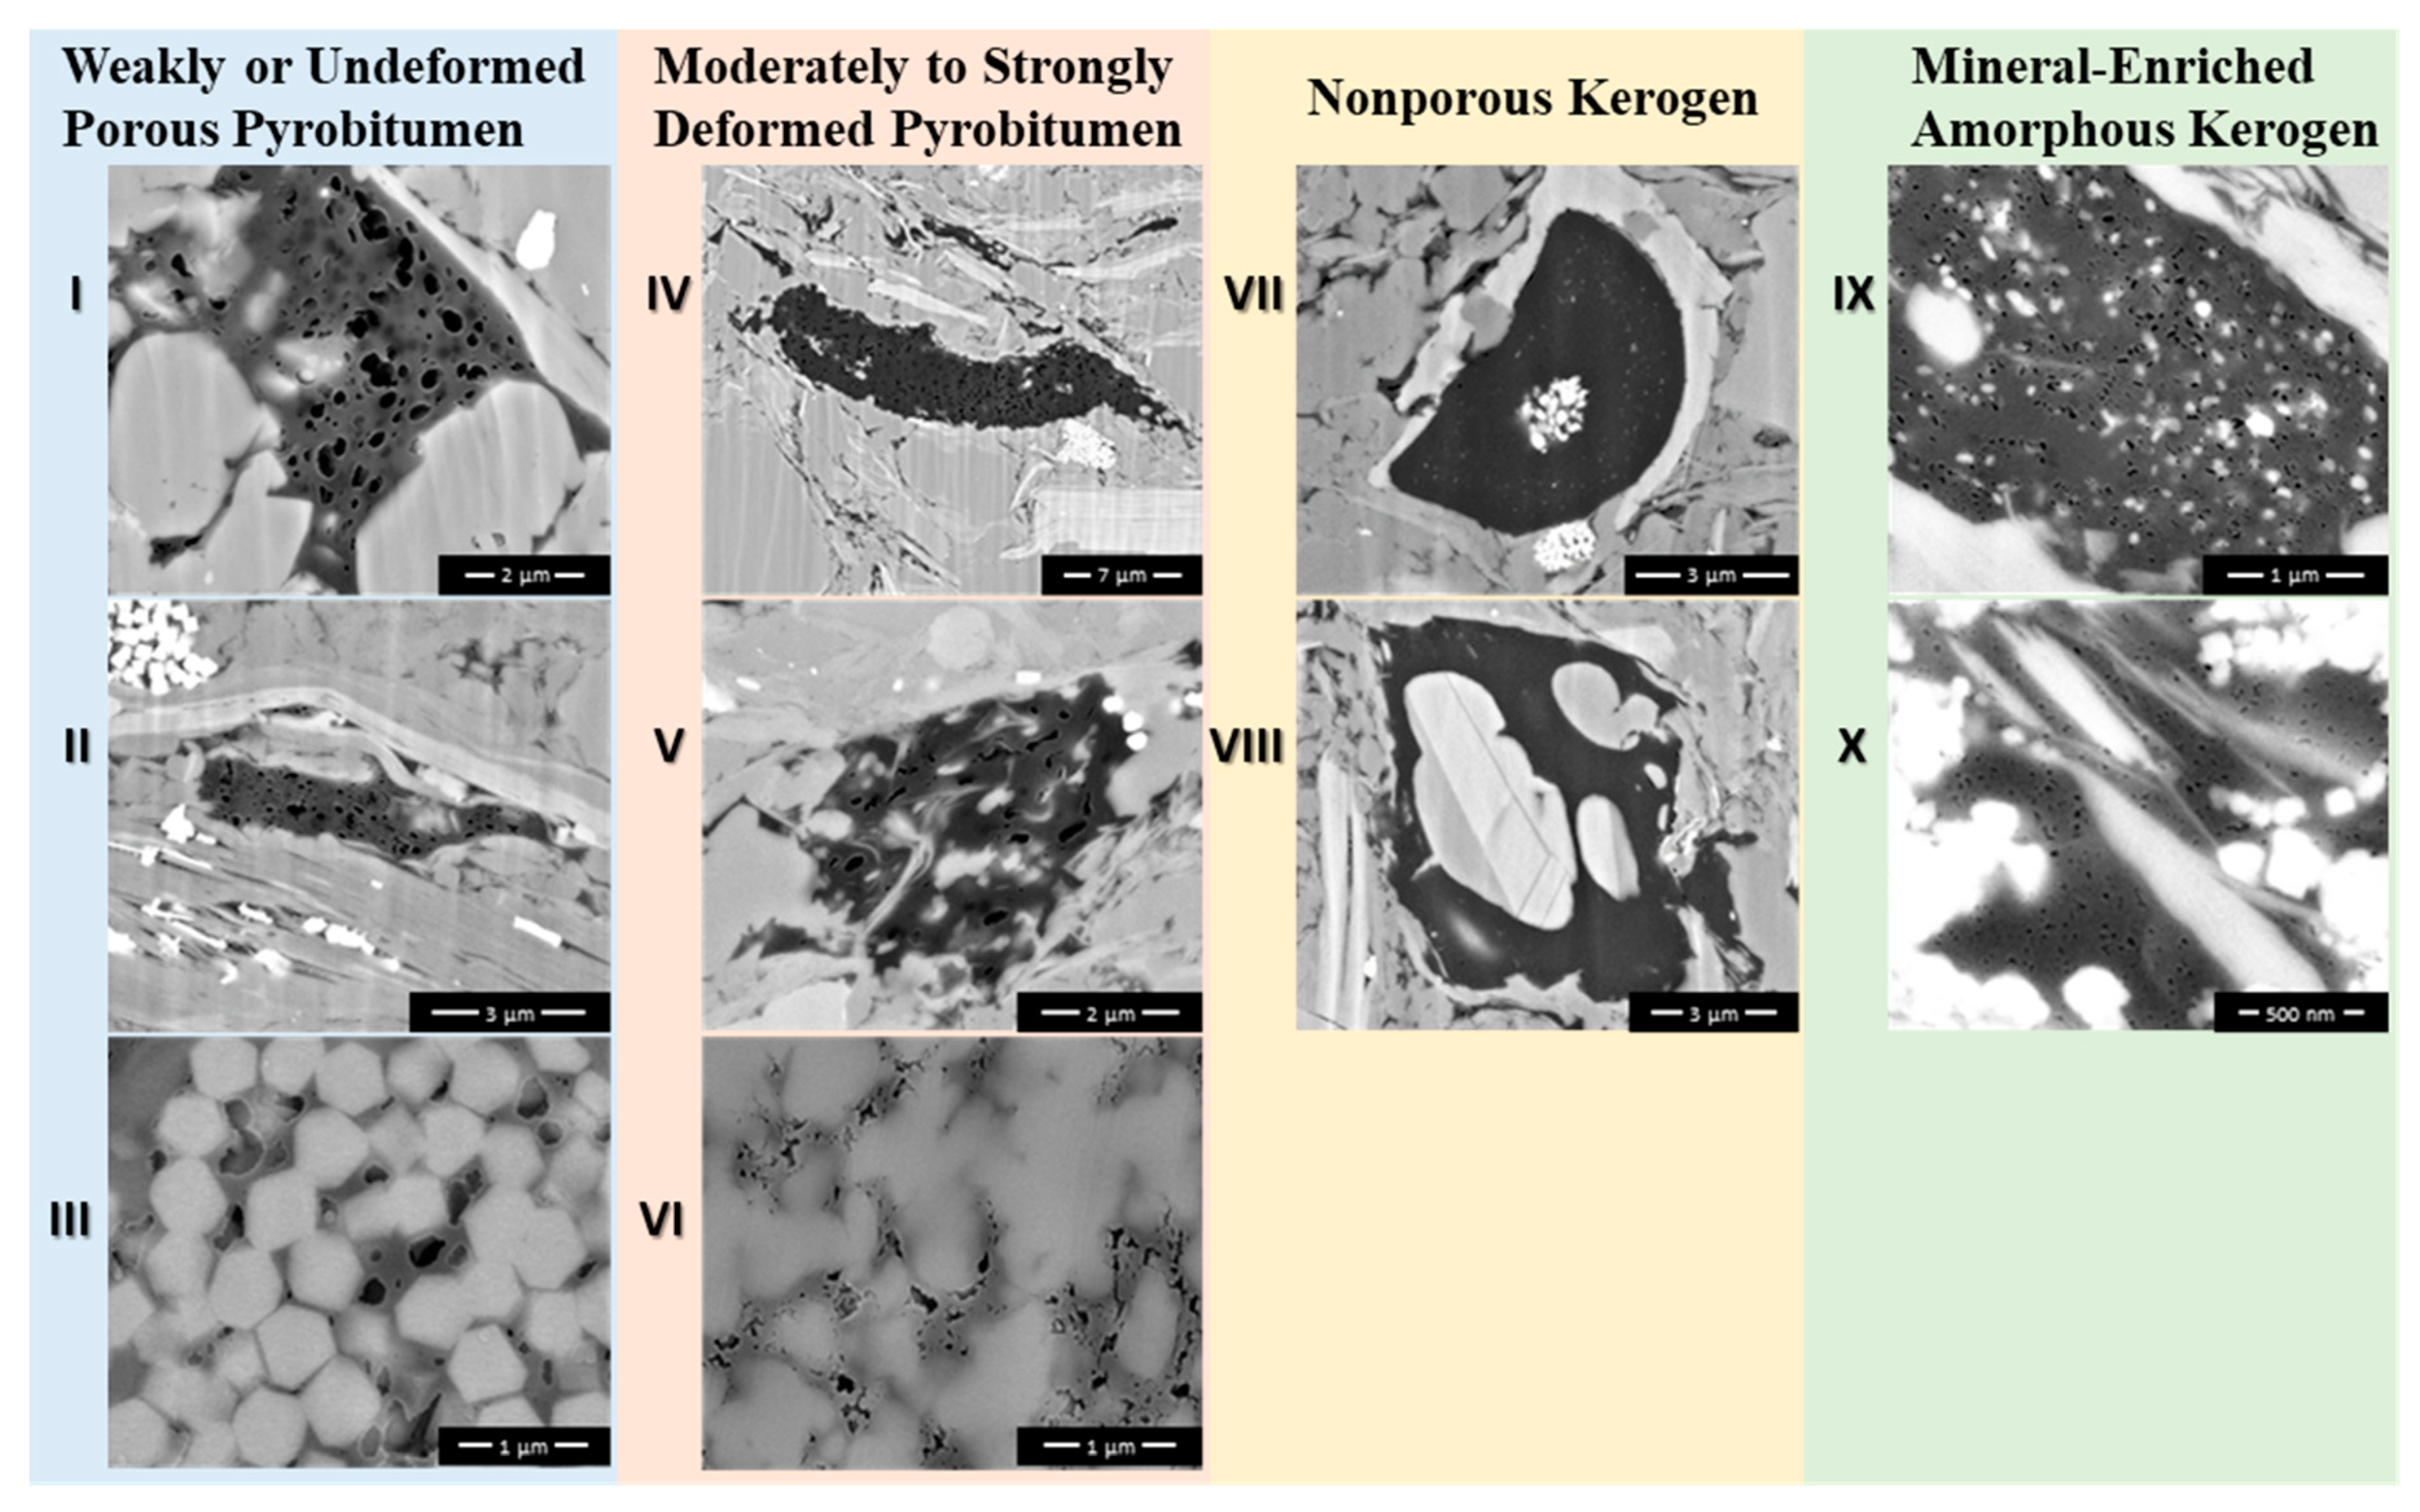
According to the discussion above, OM type and deformation play a significant role on influencing the features of OM and OM-hosted pores. Thus, they are used as the primary criterion to recognize four types of OM particles for Longmaxi-Wufeng Shale (Figure 3), including weakly or undeformed porous pyrobitumen, moderately to strongly deformed pyrobitumen, nonporous kerogen, and mineral-enriched amorphous kerogen. If the OM particles contain abundant large elliptical pores, the OM particles must have high hydrogen concentration and were not deformed seriously [16,18]. Although amorphous kerogen has higher hydrogen concentration than nonporous kerogen (vitrinite or inertinite), its hydrogen concentration is usually less than bitumen and oil. In addition, the overburden stress applied on amorphous kerogen may inhibit the growth of organic pores, so there could be abundant pores in amorphous kerogen but pore size should be small. The relatively lower hydrogen concentration could be another reason of small pores in amorphous kerogen. If the amorphous kerogen did not suffer from strong overburden stress due to support from mineral framework, the amorphous kerogen could be as porous as or slightly less porous than pyrobitumen so that it is hard to differentiate them [18]. This situation could happen, but its probability should be very low. To simplify discussion, the OM particles rich in large elliptical pores were classified as weakly or undeformed porous pyrobitumen (Figure 3). If there are lots of wavy, linear, or irregular pores with small to moderate size, the OM particles must once form many large pores but the later compaction deformed these pores to be away from elliptical shape [16]. Therefore, these OM particles were classified as moderately to strongly deformed pyrobitumen. The nonporous kerogen on SEM images contained no or only limited small pores (about 10–20 nm) due to the low concentration of hydrogen, so it is relatively easy to recognize, especially when they were surrounded by bio-shells (Figure 3). Finally, the OM particles rich with small bright minerals and small pores were interpreted as amorphous kerogen. These small bright minerals may originate from the authigenic uranitite or pyrite in reducing condition and then were rolled within the amorphous kerogen during deposition or diagenetic precipitation of minerals in parts of organic pores. The abundant small pores were formed during hydrocarbon generation but cannot grow as large as these within pyrobitumen due to the inhibition of the large overburden stress applied on them or the relatively lower concentration of hydrogen in amorphous kerogen. Although strong deformation could reduce the large pores to be smaller within pyrobitumen, but it is rarely possible to evenly reduce these pores to be so small with similar size. Thus, it should be amorphous kerogen but not strongly deformed pyrobitumen.

4.2. Features of Weakly or Undeformed Porous Pyrobitumen

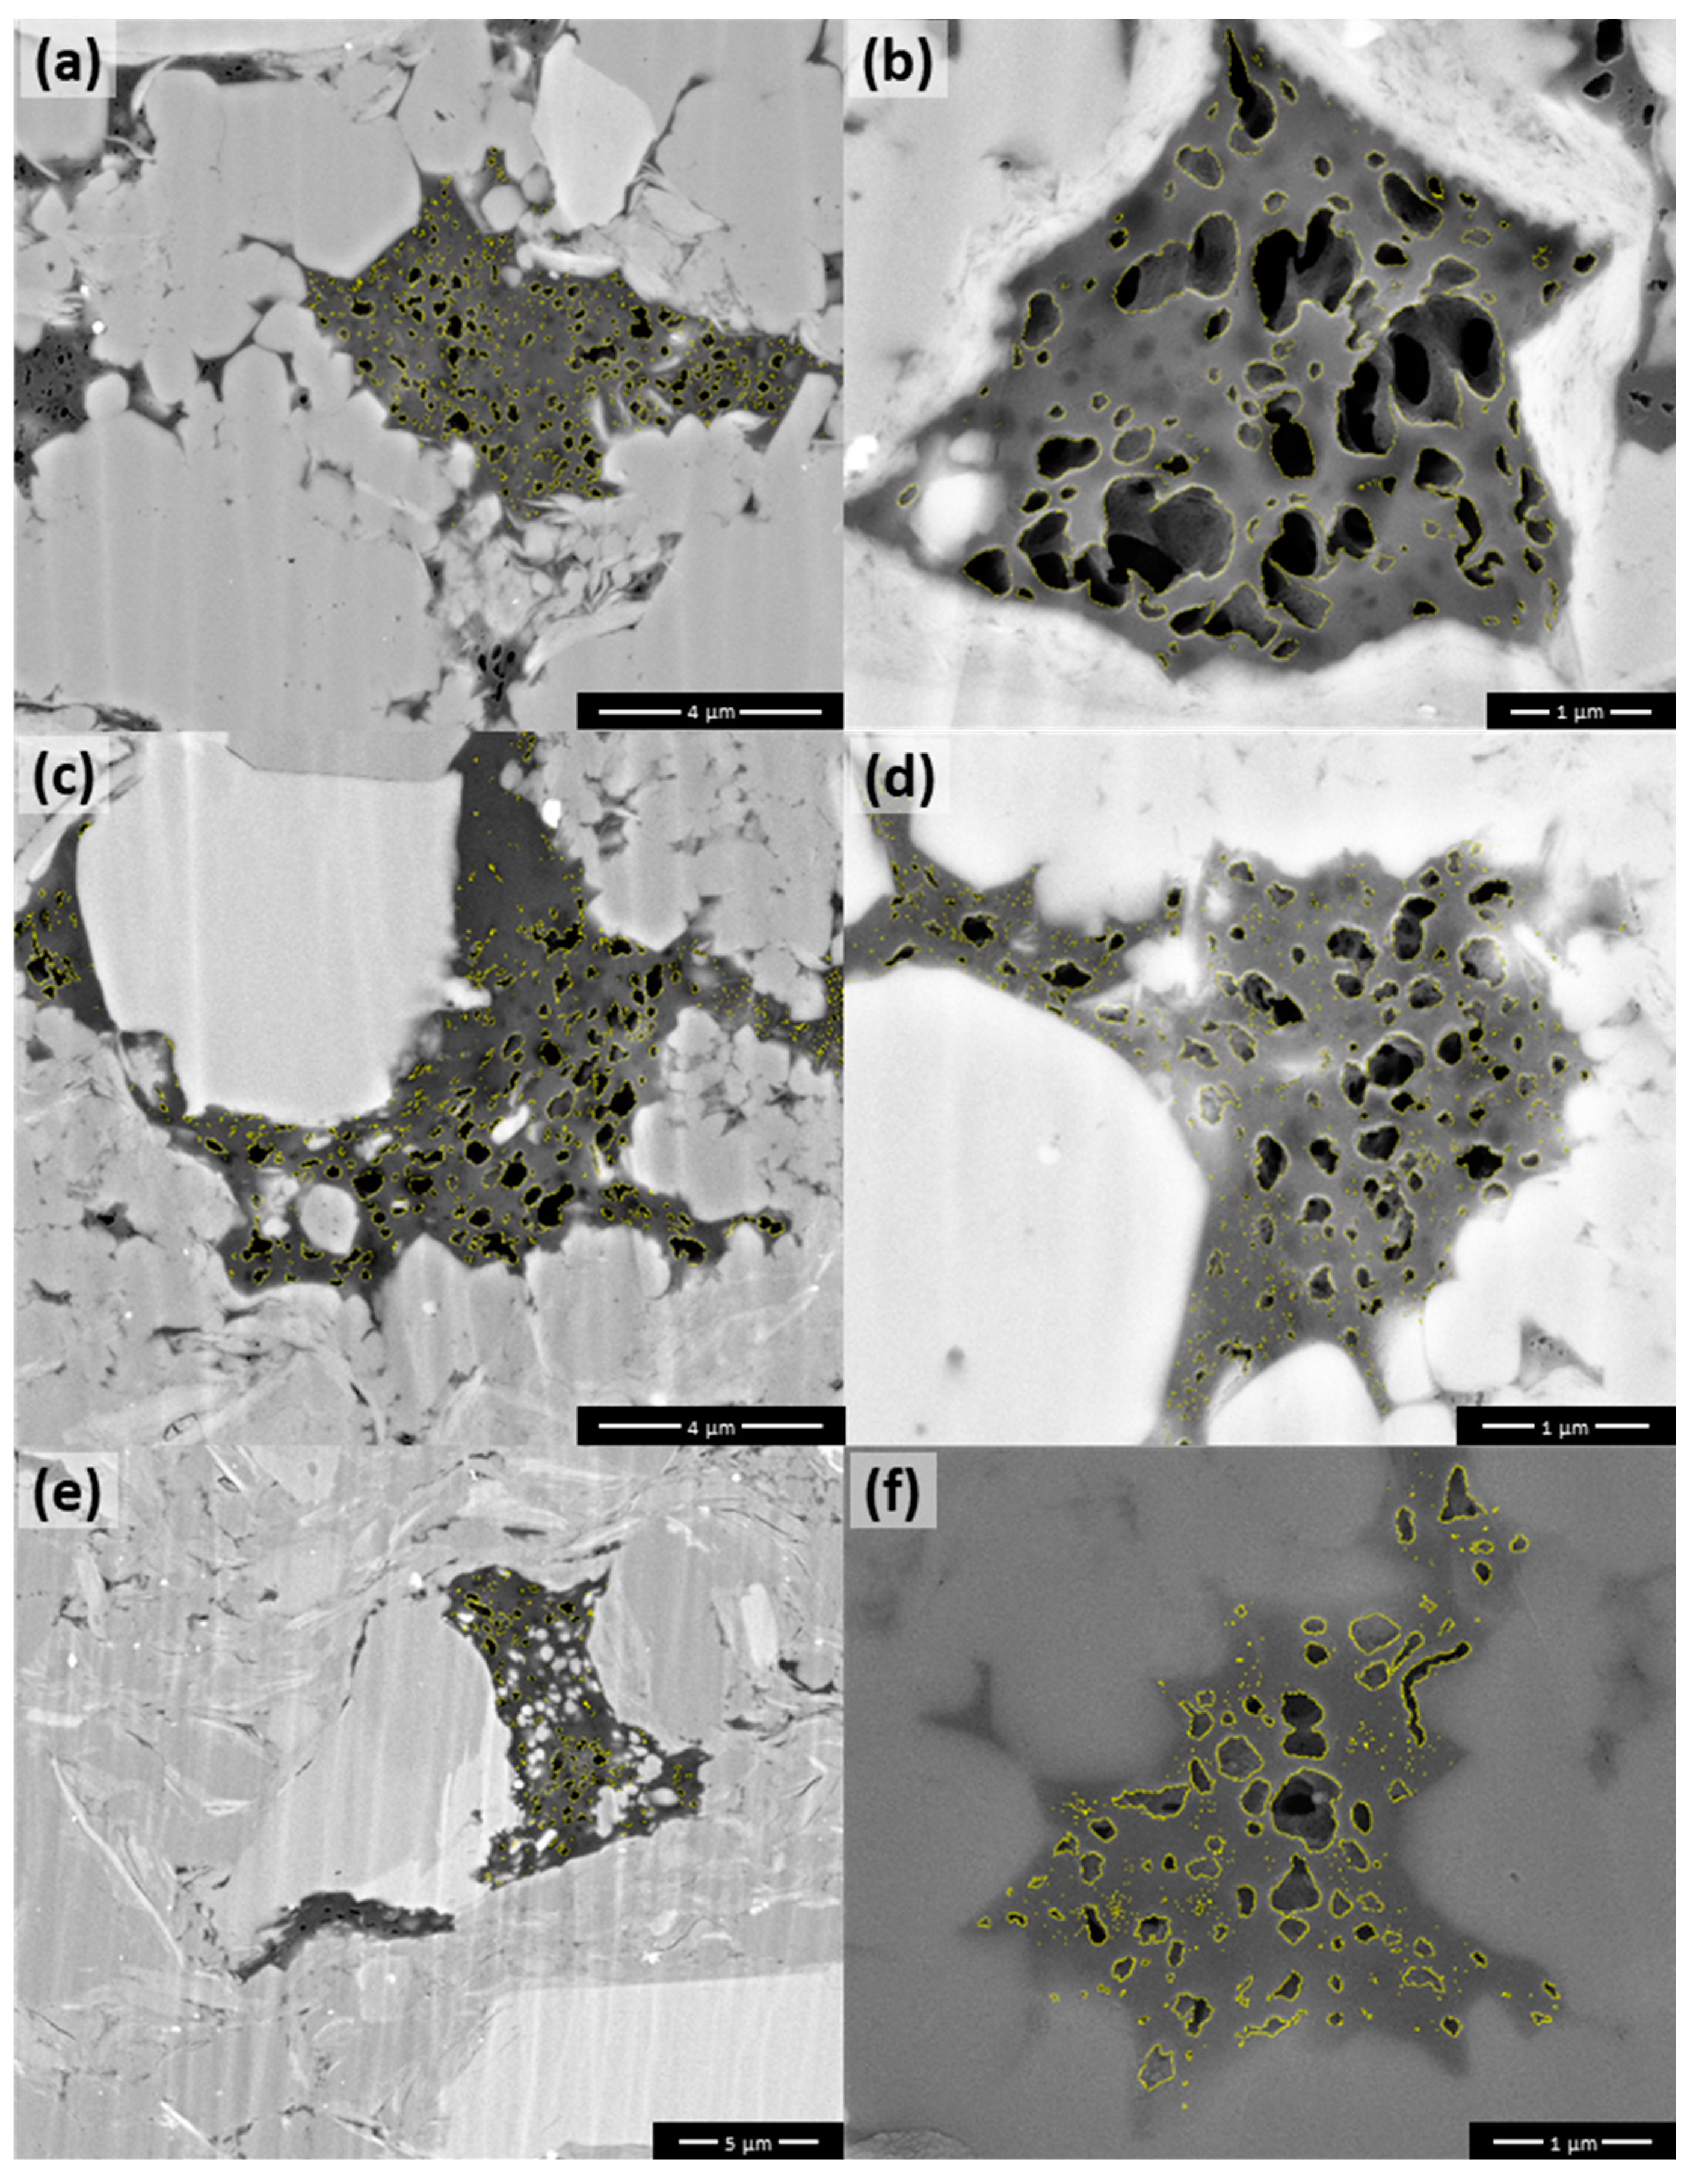
Weakly or undeformed porous pyrobitumen is a type of organic matter (OM) containing abundant elliptical pores with large size up to 1 µm. This is one of its impressive, features which is related to two factors. First, the OM should have a high capacity of generating hydrocarbons so that abundant pores could be formed; second, the generated pores should be preserved well unless these pores will be deformed to small size or even eliminated. Within different size and geometry of pyrobitumen, the feature of OM-hosted pores also varies. Consequently, three subtypes of weakly or undeformed porous pyrobitumen were recognized. The first subtype (index: OM I; Figure 3) is in large size and blocky shape (similar length of major and minor axis). Figure 4 shows more examples of OM I with OM-hosted pores highlighted by yellow curves. The sectional area of OM particles on these SEM images (Figure 4) covers a large range from 8 µm2 to 43 µm2.
With manually identifying all OM-hosted pores aided by FIJI Imaging package, the pore size distribution determined by pore sectional area (an indicator of pore volume) and pore amount were investigated (Figure 5a,b). According to the histogram calculated by pore sectional area, OM-hosted pores of OM I were predominant in size 128 (27) to 724 (29.5) nm (Figure 5a), while the amount of different sizes of OM-hosted pores is more evenly distributed in size range of 4 (22) to 512 (29) nm except the abnormal values at the two ends (Figure 5b). The amount of pores less than 10 nm was under high uncertainty due to the low resolution of SEM images. Although there are numerous small OM-hosted pores, their contribution to total volume of OM-hosted pores is much less than the large OM-hosted pores. In these high- or over-mature shale, additionally, it is common that multiple OM-hosted pores merged together to form very large pores with irregular shape. For example, a few very large pores (>1 µm) were formed in the OM particle in JY1S-9-17 (Figure 4b). The organic porosity (PHIo) of OM I is about 16–18% except the extremely high PHIo 34.2% in JY1S-9-17 (Figure 4b) and relatively low PHIo 9.9% in JY8S-3-35 (Figure 4e). Within JY8S-3-35 (Figure 4e), it appears that the gray minerals remarkably reduced the organic porosity, especially in the central of the OM. Without considering the area rich of gray minerals, its PHIo was re-calculated to about 20%, similar to the other OM particles in Figure 4. Another important feature of these OM-hosted pores is the elliptical or nearly elliptical shape with smooth boundary (Figure 4), except parts of the OM-hosted pores in SEM image JY1S-9-22 (Figure 4c). The ratio of major to minor axis of OM-hosted pores mainly ranges from 1 to 2.2 as indicated by the color-filled rectangle in Figure 5c. However, the pores close to the contact area between minerals and OM were usually flattened to slat or wavy pores with high ratio of major to minor axis (indicated by circles in Figure 5c) and were oriented to the tangential direction of the boundary between mineral and OM in Figure 4. OM deformation has been proposed to interpret this phenomenon [16]. Finally, only limited embedded minerals were observed within OM I except one example in Figure 4e. These embedded minerals are either large rounded gray minerals (maybe quartz, feldspar or calcite), or tabular gray minerals (maybe clay or mica), or bright minerals (maybe uraninite, pyrite or other heavy minerals).
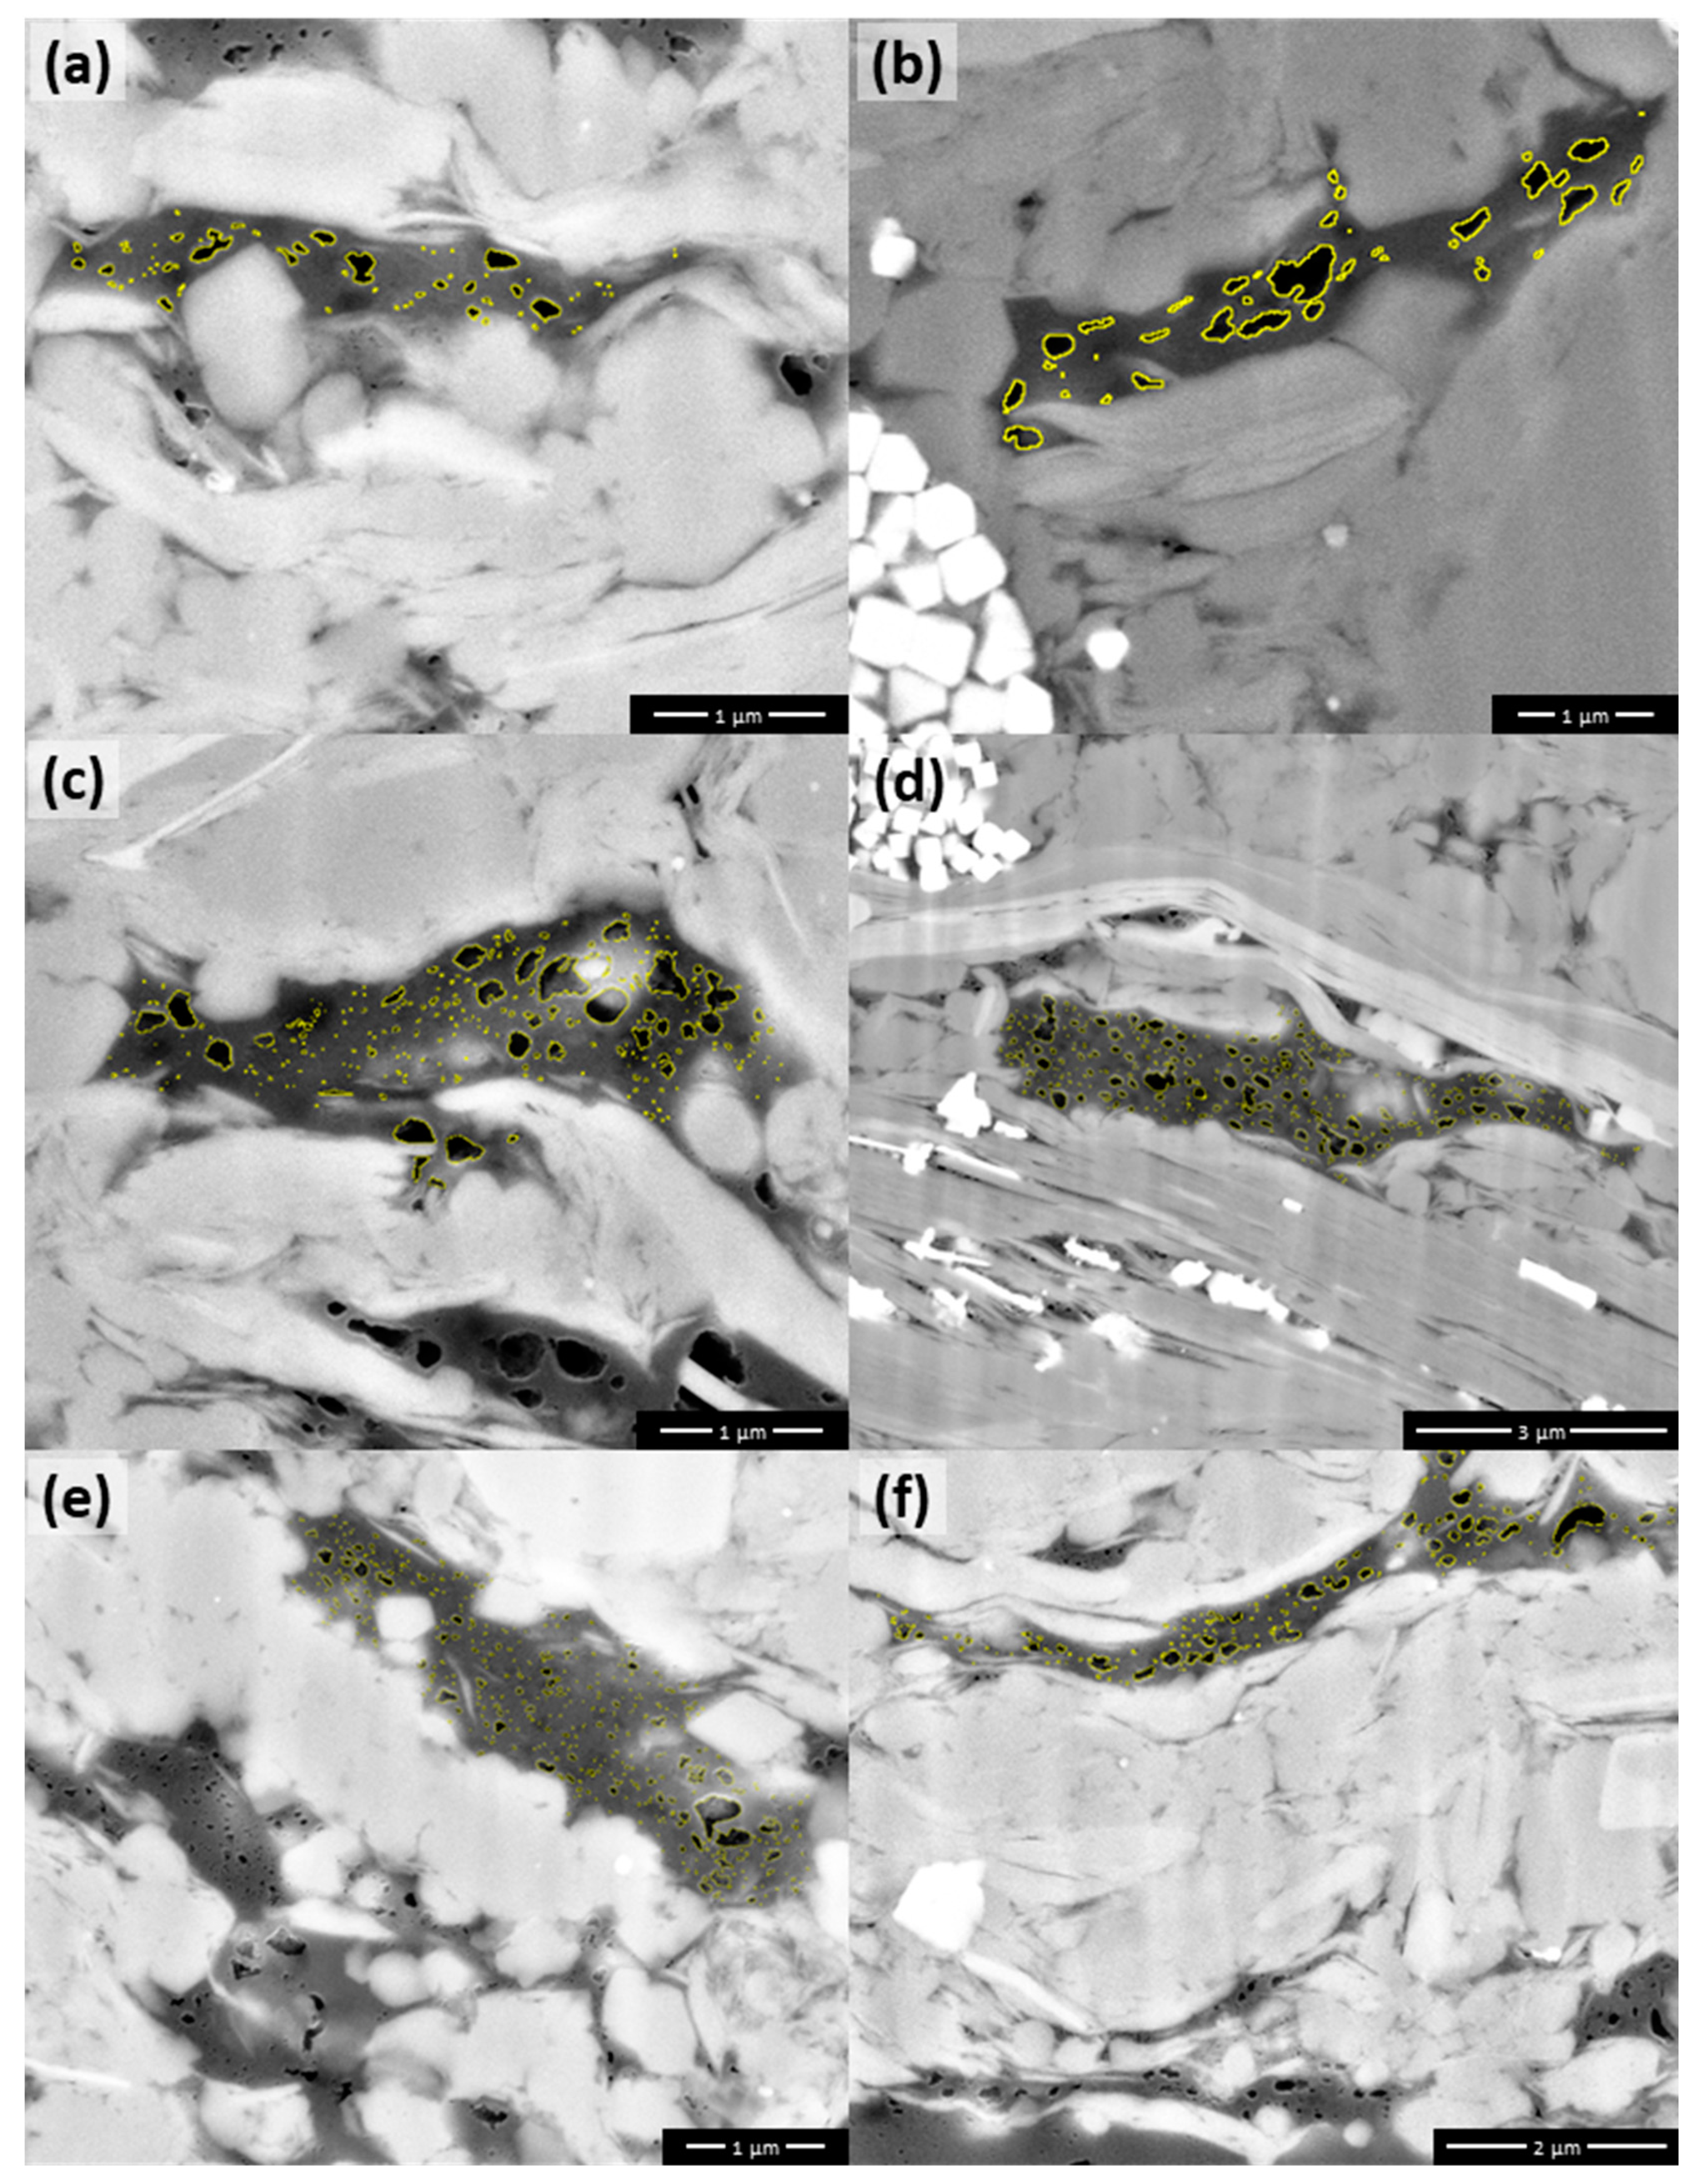
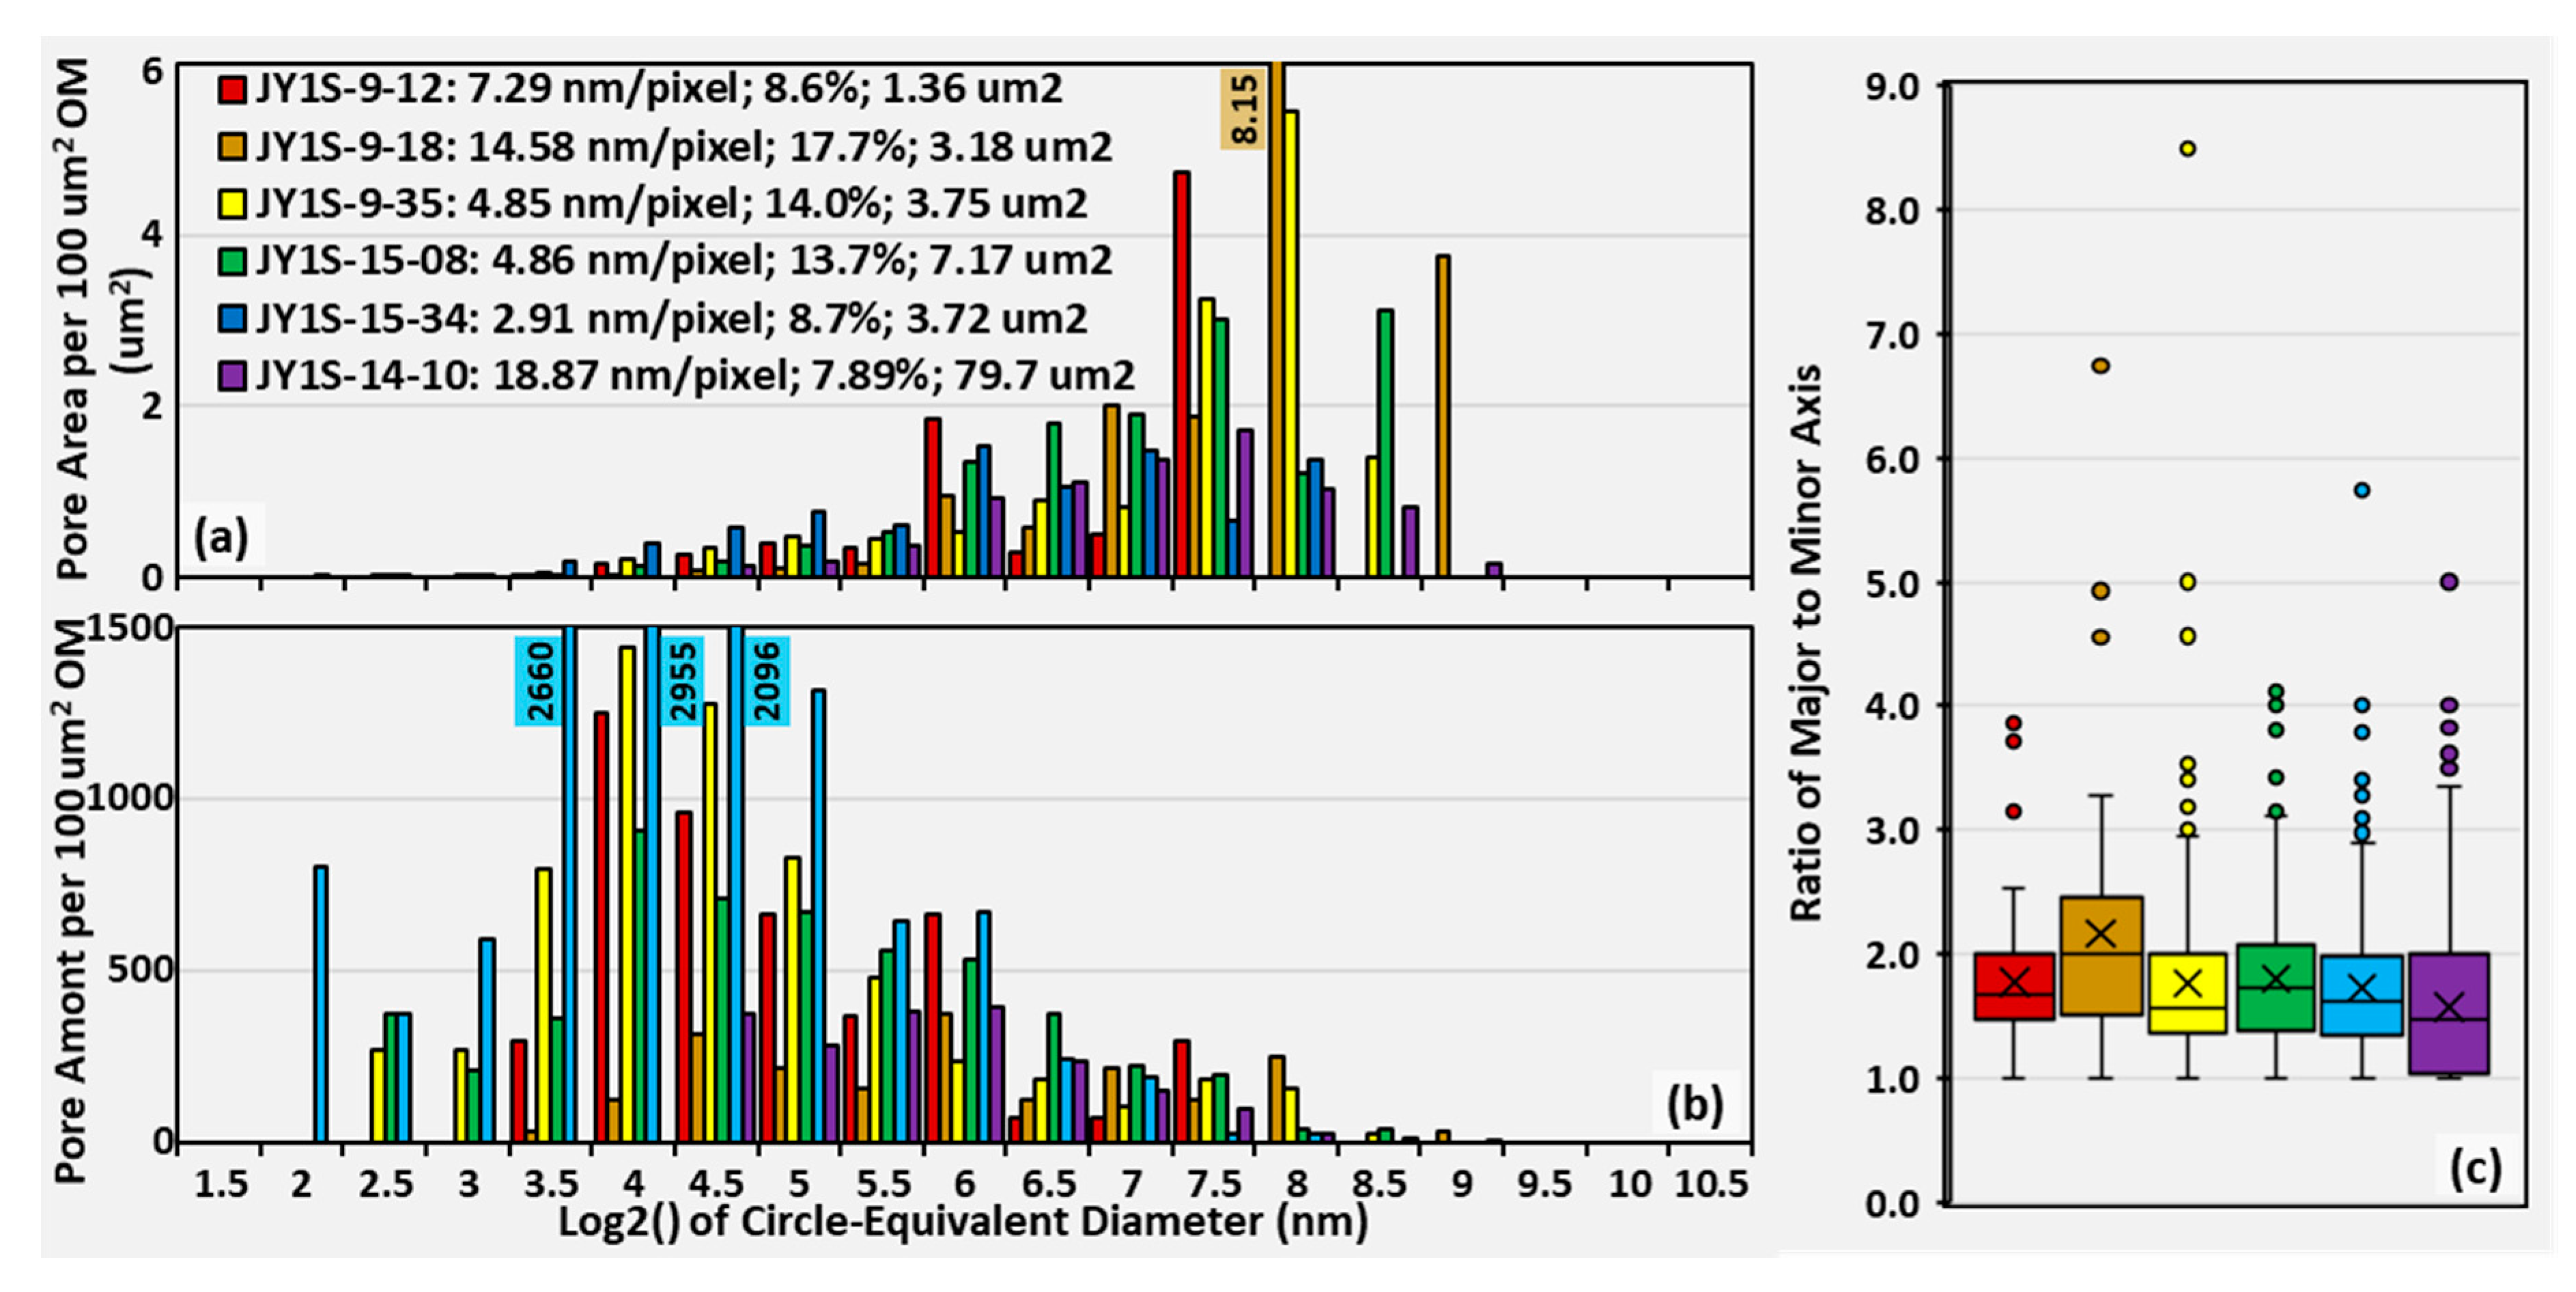
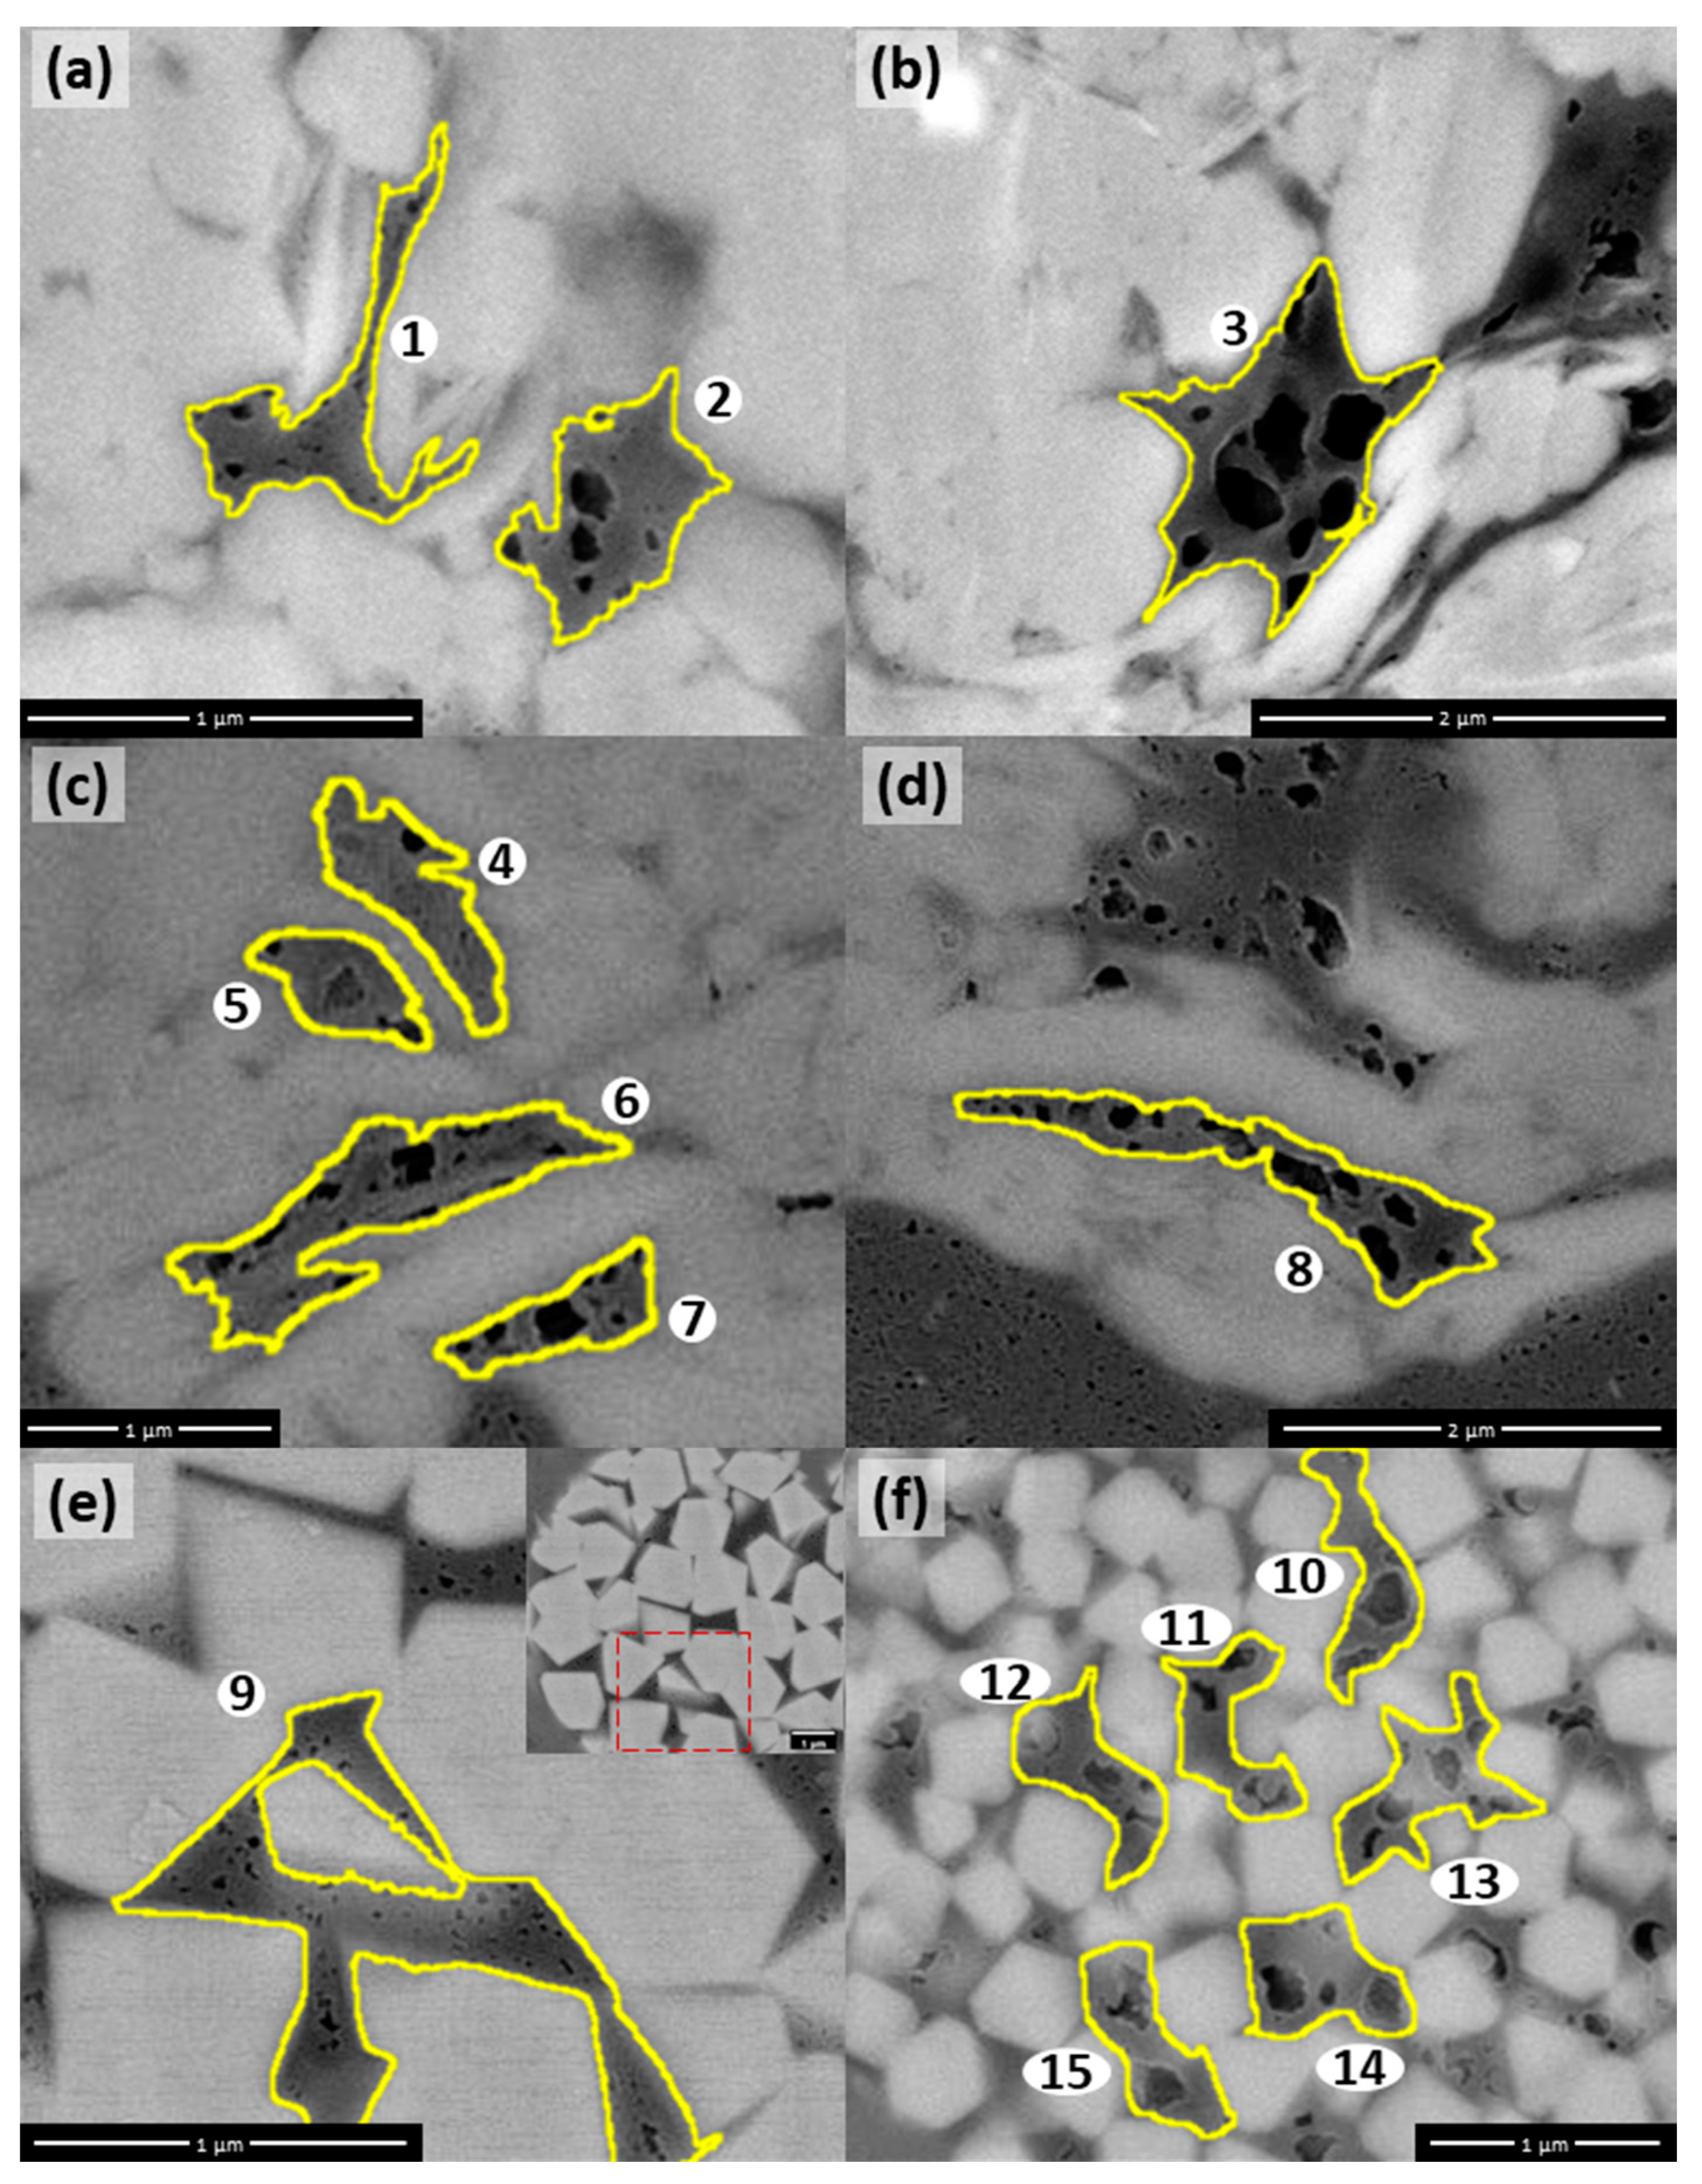
The second subtype of weakly or undeformed porous pyrobitumen (OM II) has a tabular geometry with a little smaller size (about 3–7 µm2) than OM I (Figure 6 and Figure 7). Physically, a large tabular pyrobitumen should rarely have a good framework support to resist the stress, while the smaller tabular pyrobitumen could be [16]. For example, among the 527 SEM images, we only found one large tabular pyrobitumen with abundant large pores in sample JY1S-14 (Figure 6f), while the smaller tabular pyrobitumen with abundant pores was much more commonly observed and six typical examples were shown in Figure 6a–e. The organic porosity in OM II with the major range of 8–17% was lower than that in OM I (Figure 7a). The pore size distribution of OM II according to pore sectional area and pore amount is very similar with OM I (Figure 6a,b and Figure 7a,b), except these differences as following: (1) no pores larger than 512 (29) nm; (2) less pores in large size of 256–512 (28–29) nm; (3) a clear peak of pore amounts in size 8 (23) to 32 (25) nm; and (4) more pores in OM II than OM I. We infer that the small size of pyrobitumen inhibited the merging of OM-hosted pores, so there were less big pores in OM II than OM I. The ratio of major to minor axis of OM-hosted pores in OM II is mainly between 1.5 and 2.1 (Figure 7c), except OM in JY1S-9-18 (Figure 6b). This indicated a little stronger and more uniform deformation in OM II than OM I.
As for small pyrobitumen (<1 µm2), it should be easier to be protected from deformation. Thus, it is very common to observe small porous pyrobitumen with weak or no deformation. This is the third subtype of weakly or un-deformed porous pyrobitumen (OM III). Representative examples are shown in Figure 8. Due to the small size of OM III (Figure 8), statistical analysis of individual OM III is ineffective, thus we combined the 15 OM III shown in Figure 8 together to analyze the range of organic porosity (Figure 9a,b) and pore size distribution (Figure 9c,d). According to the data of the 15 OM III (Figure 8 and Figure 9), the organic porosity varies from 5% to 27% with an average of 15.50% which is a little smaller than the organic porosity of OM I (Figure 5) but larger than OM II (Figure 7). The size of OM-hosted pores is mainly between 8 (23) nm and 256 (28) nm (Figure 9c,d), similar to OM II (Figure 7a,b). No pores larger than 362 (28.5) nm was observed in these small pyrobitumen. The average ratio of the major to the minor axis of OM-hosted pores is about 1.69, which also indicated the weak or no deformation occurred on OM III. In addition, although we interpreted OM III as pyrobitumen but it could also be amorphous kerogen. The small size of amorphous kerogen should have higher probability to be protected by mineral framework and consequently these amorphous kerogens could be porous. Thus, the small size of OM III made it more difficult to judge whether it is pyrobitumen or amorphous kerogen.

4.3. Features of Moderately to Strongly Deformed Pyrobitumen

Indicated from class name, the moderately to strongly deformed pyrobitumen is pyrobitumen which suffered from moderate to strong deformation (Figure 3). Deformation may happen prior to gas generation, but no evidence can be formed within bitumen and oil (not solid) to judge whether it happened and how strong it was. After gas generation, the residual organics, pyrobitumen, became solid and contained abundant pores. Deformation of pyrobitumen also causes deformation of pores within them, making OM-hosted pores a good gauge of OM deformation. Thus, the deformation discussed here occurred after gas generation. If the deformation and gas generation happened simultaneously, parts of the deformation features should be destroyed by the following cracking of carbon chains as well as the relatively stronger rheology of pyrobitumen (very soft solid or high viscous liquid) at that moment. This usually caused the organic pores to be small but still elliptical.
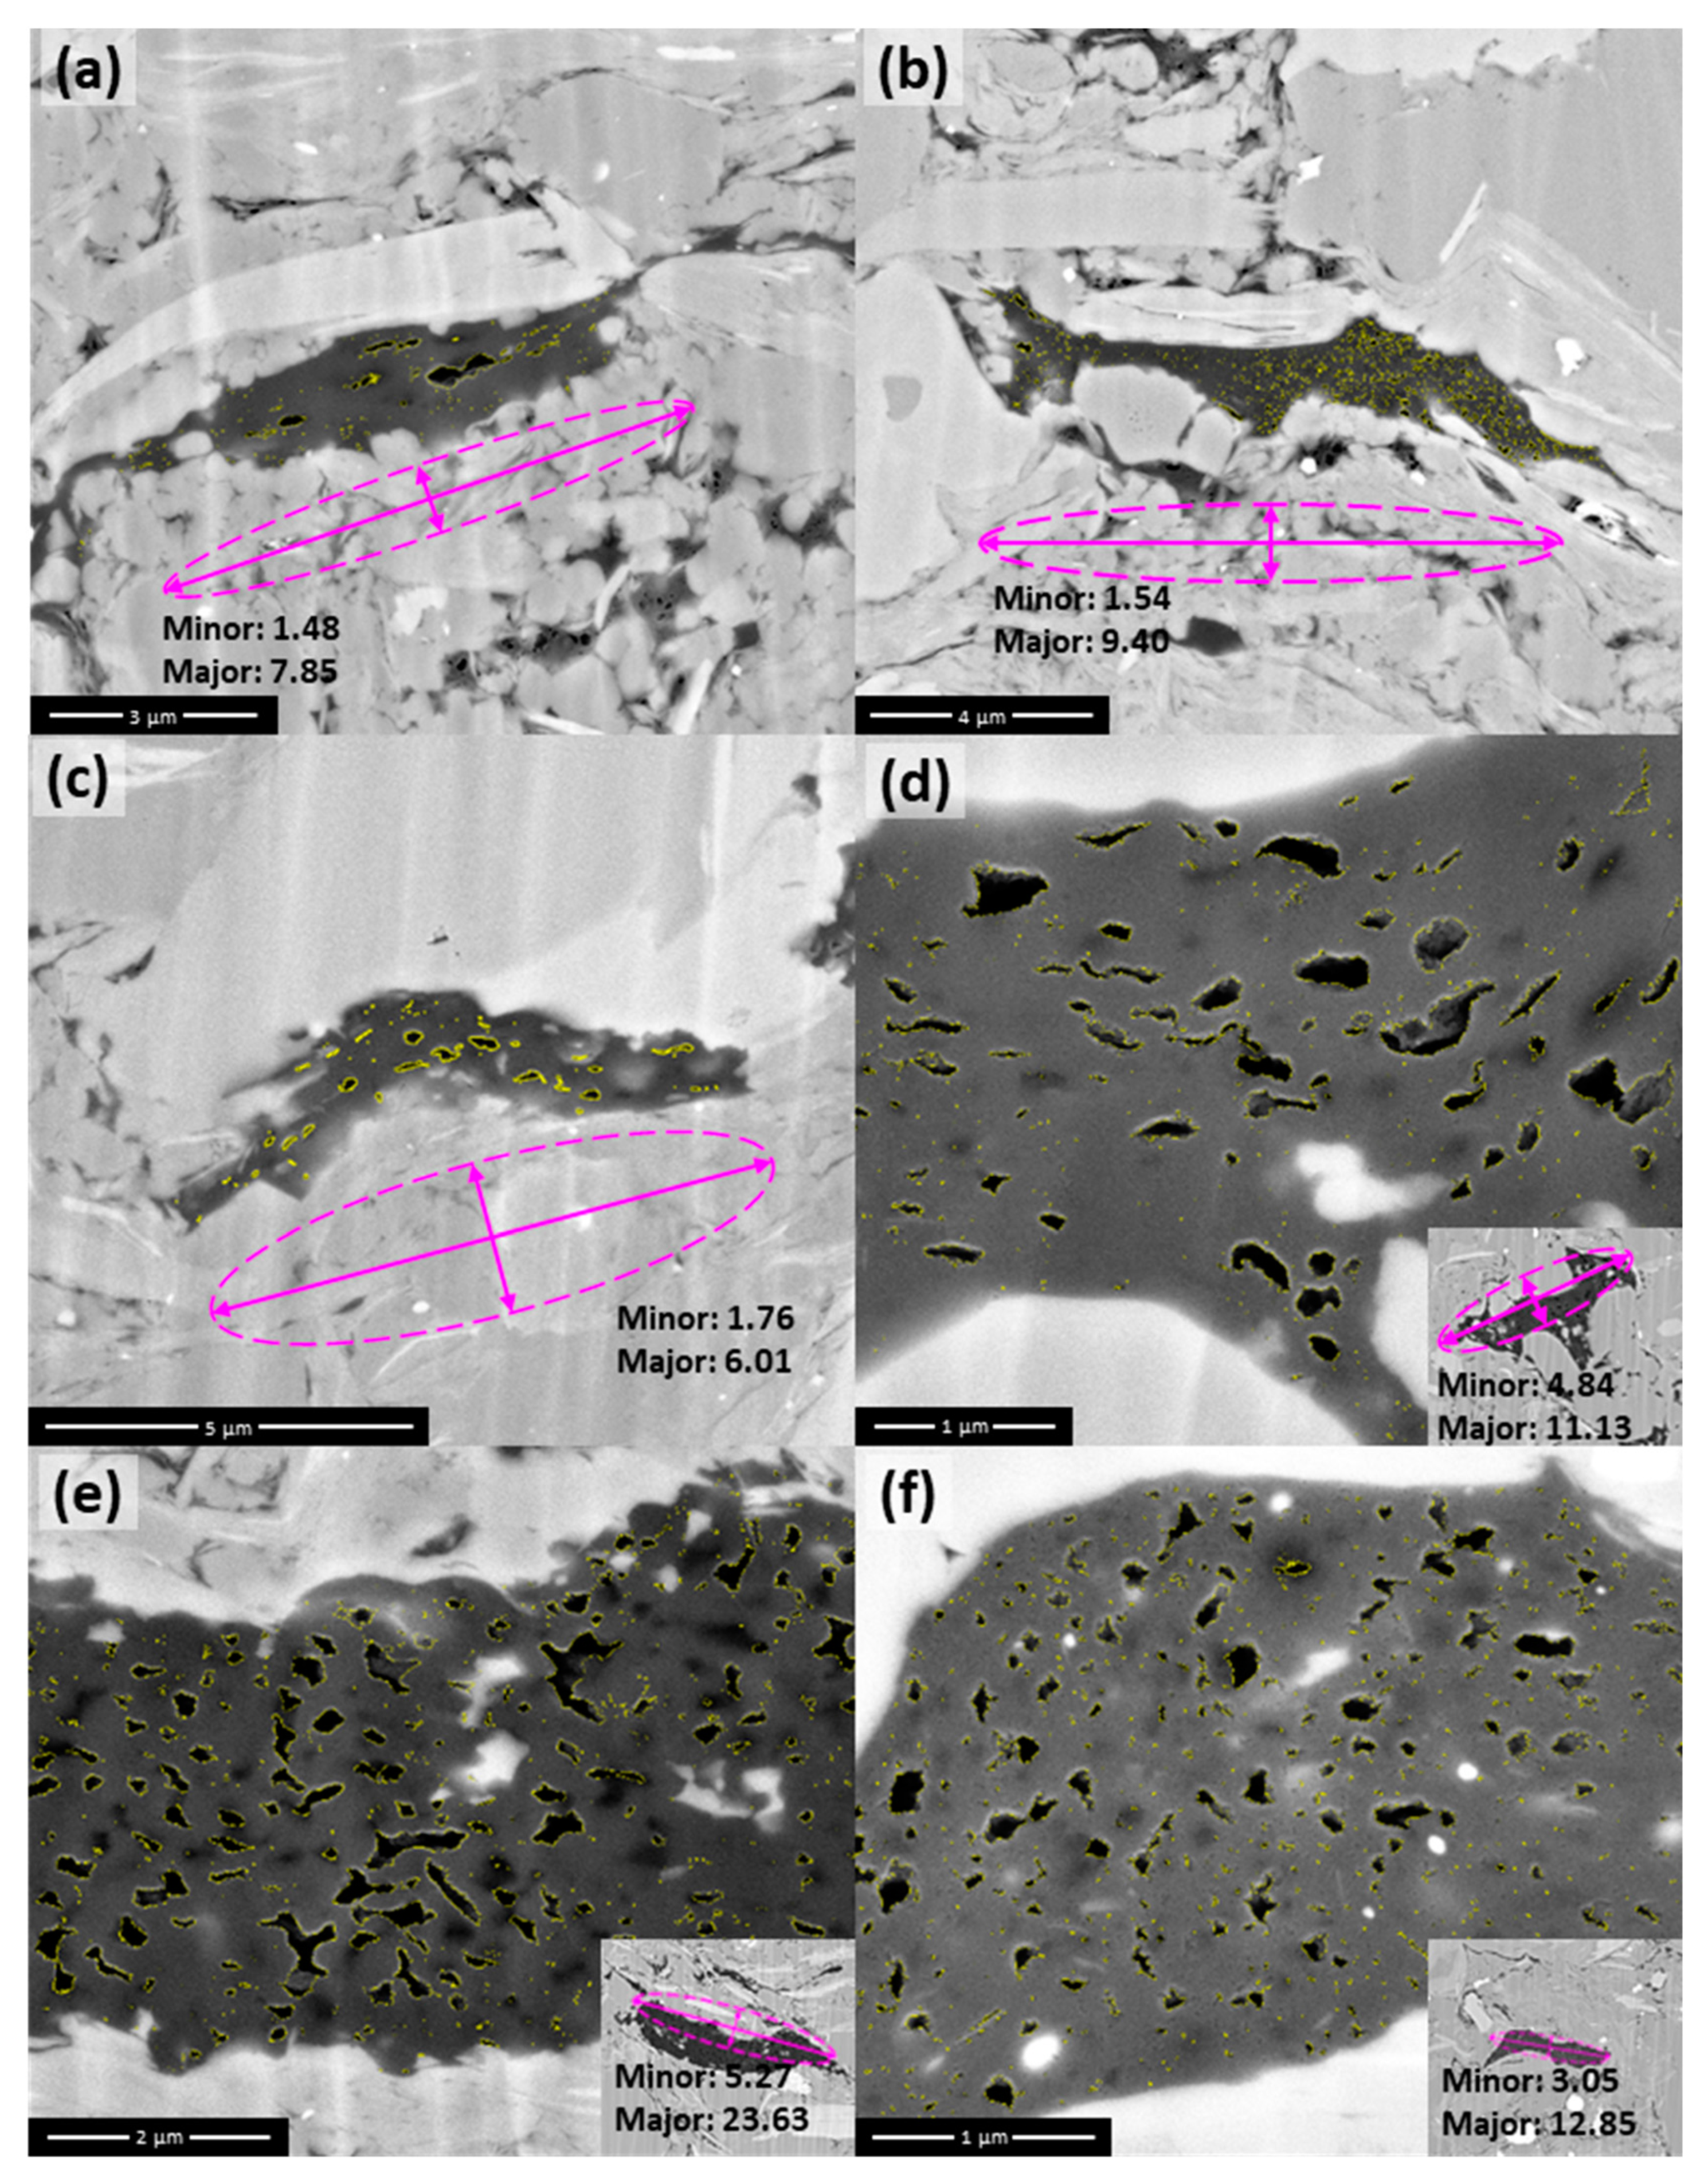
The size and geometry of pyrobitumen again play a significant role on the deformation features of moderately to strongly deformed pyrobitumen, and three subtypes were defined. They are tabular pyrobitumen with moderate to large size (OM IV), blocky pyrobitumen with moderate to large size (OM V), and small pyrobitumen (OM VI) (Figure 3). For OM IV, the tabular geometry was the result of uniaxial compression of large blocky porous pyrobitumen due to either larger burial or tectonic movement. As shown in Figure 10, the major axis and minor axis of the area-equivalent ellipse of OM IV are about 5–23 µm and 1.5–5 µm, respectively, and their ratio varies from 3.7 to 6.1. The large size of OM IV (about 9–90 µm2 as shown in Figure 10 and Figure 11a) causes the deformation relatively easier to occur and to a greater extent, because it should be more difficult to form effective framework to resist stress applied on relatively large OM particles. Consequently, the OM-hosted pores of OM IV became either wavy or linear or irregular or too small to be visible (Figure 10). Compared to OM I, OM IV had lower organic porosity, about 5–11%, less pores >500 nm, and a larger ratio of the major to the minor axis (Figure 5 and Figure 11).
Since the pyrobitumen in Figure 4b are only slightly deformed, their PHIo can be interpreted as representative of the original PHIo of pyrobitumen before deformation. Combining the calculation by Wang [16], ~35% is assumed as the original PHIo of pyrobitumen of Longmaxi-Wufeng Shale. Based on the current PHIo of OM IV (Figure 11), organic porosity of OM IV was reduced for about 3–6 times. With a uniaxial compression model that solid medium is shortened in a single direction without expansion in other directions [29], we inferred that compression caused about 3–6 times shortening in the direction of maximum principle stress of OM IV in Figure 10. Since the ratio of major to minor axis of OM IV is about 3.7–6.1, the original shape of OM IV before deformation should be blocky and similar to the geometry of OM I. This further supports the idea that OM IV evolved from porous pyrobitumen through moderate or strong deformation.
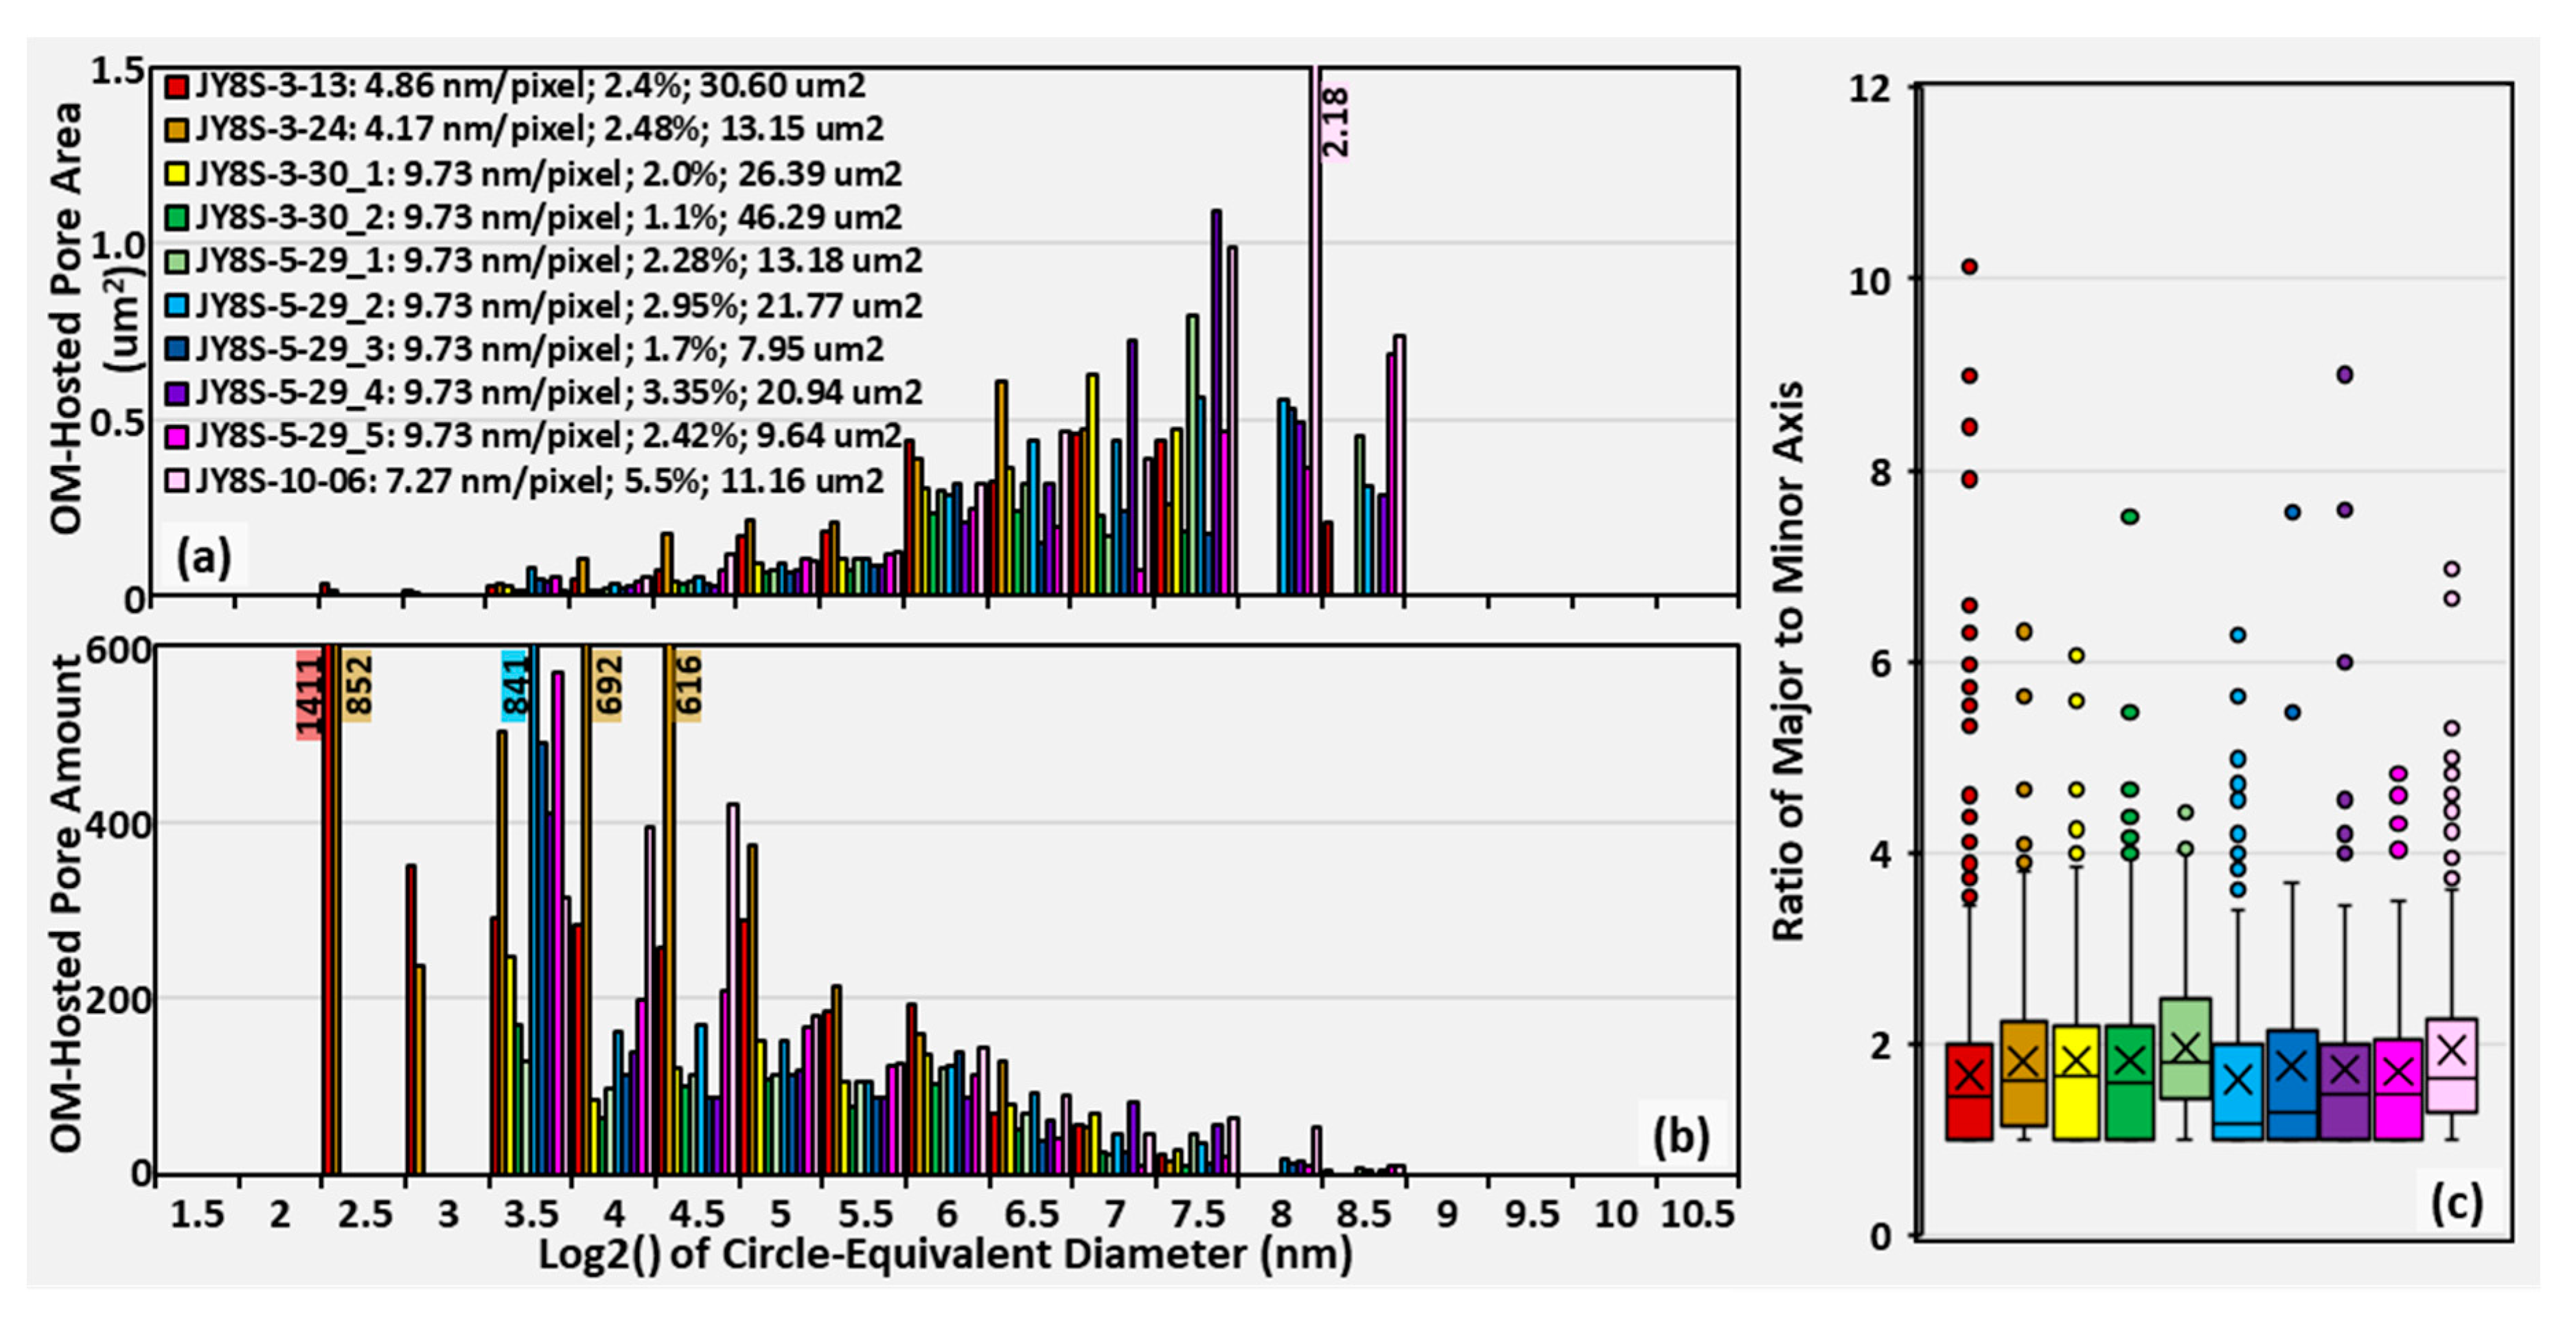
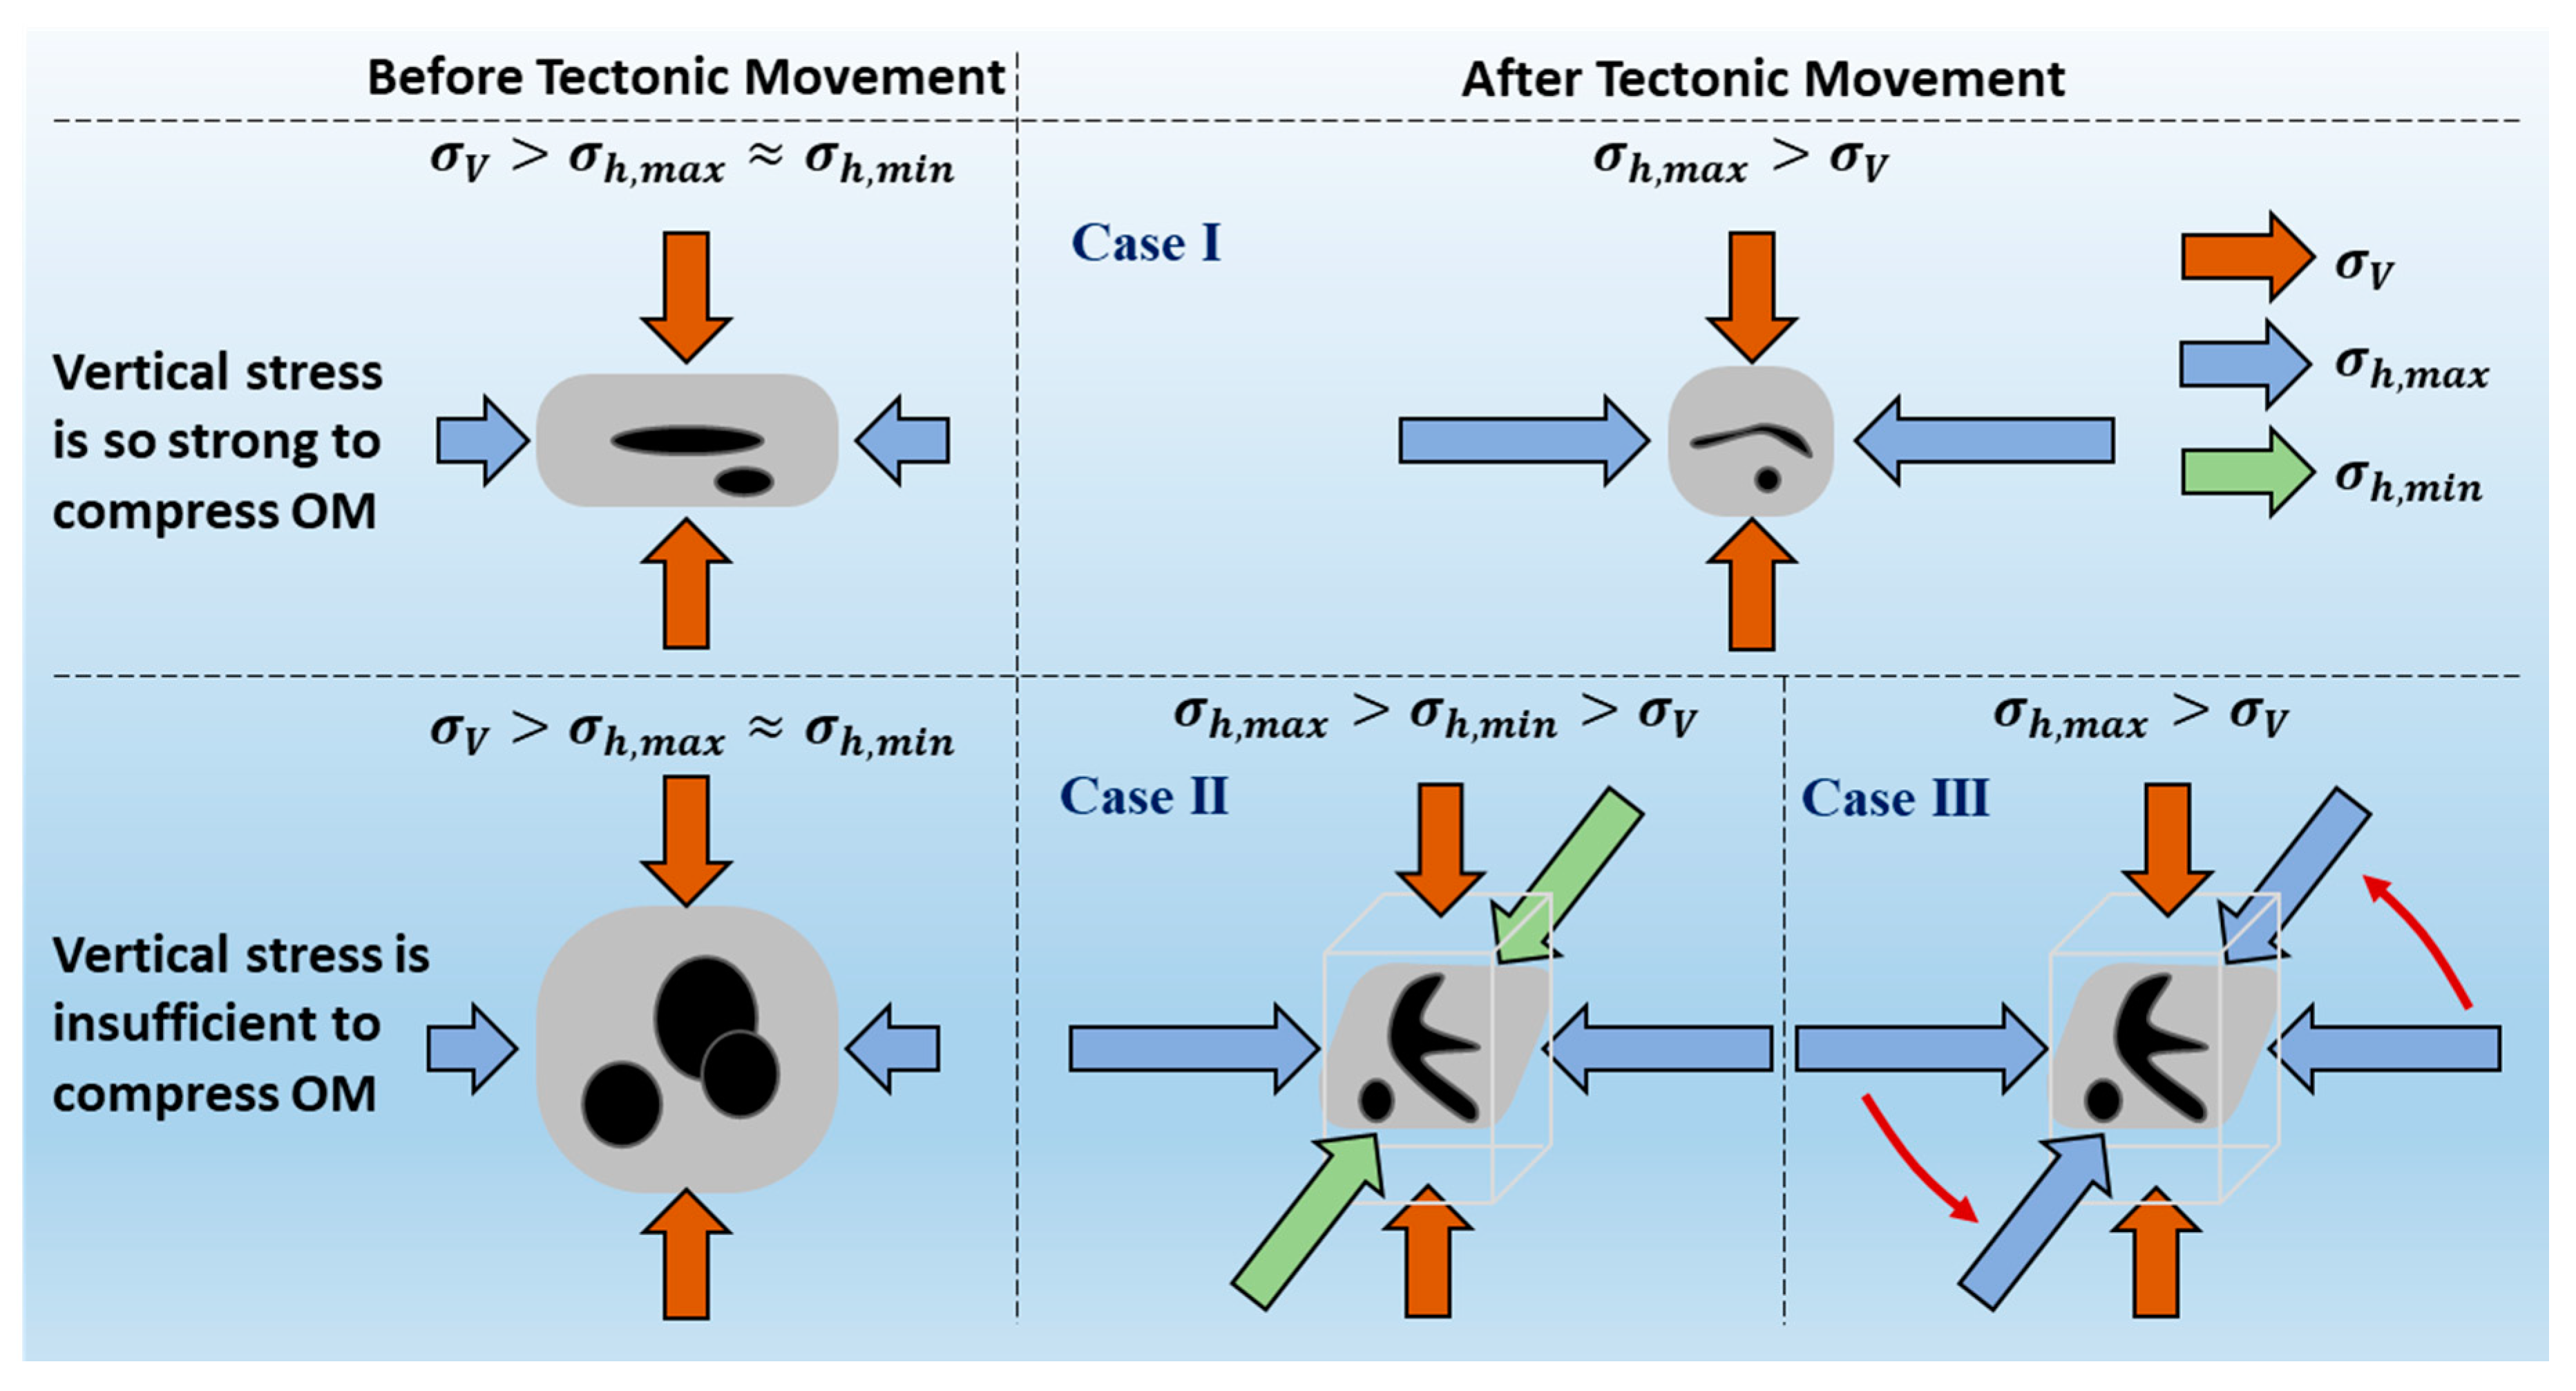
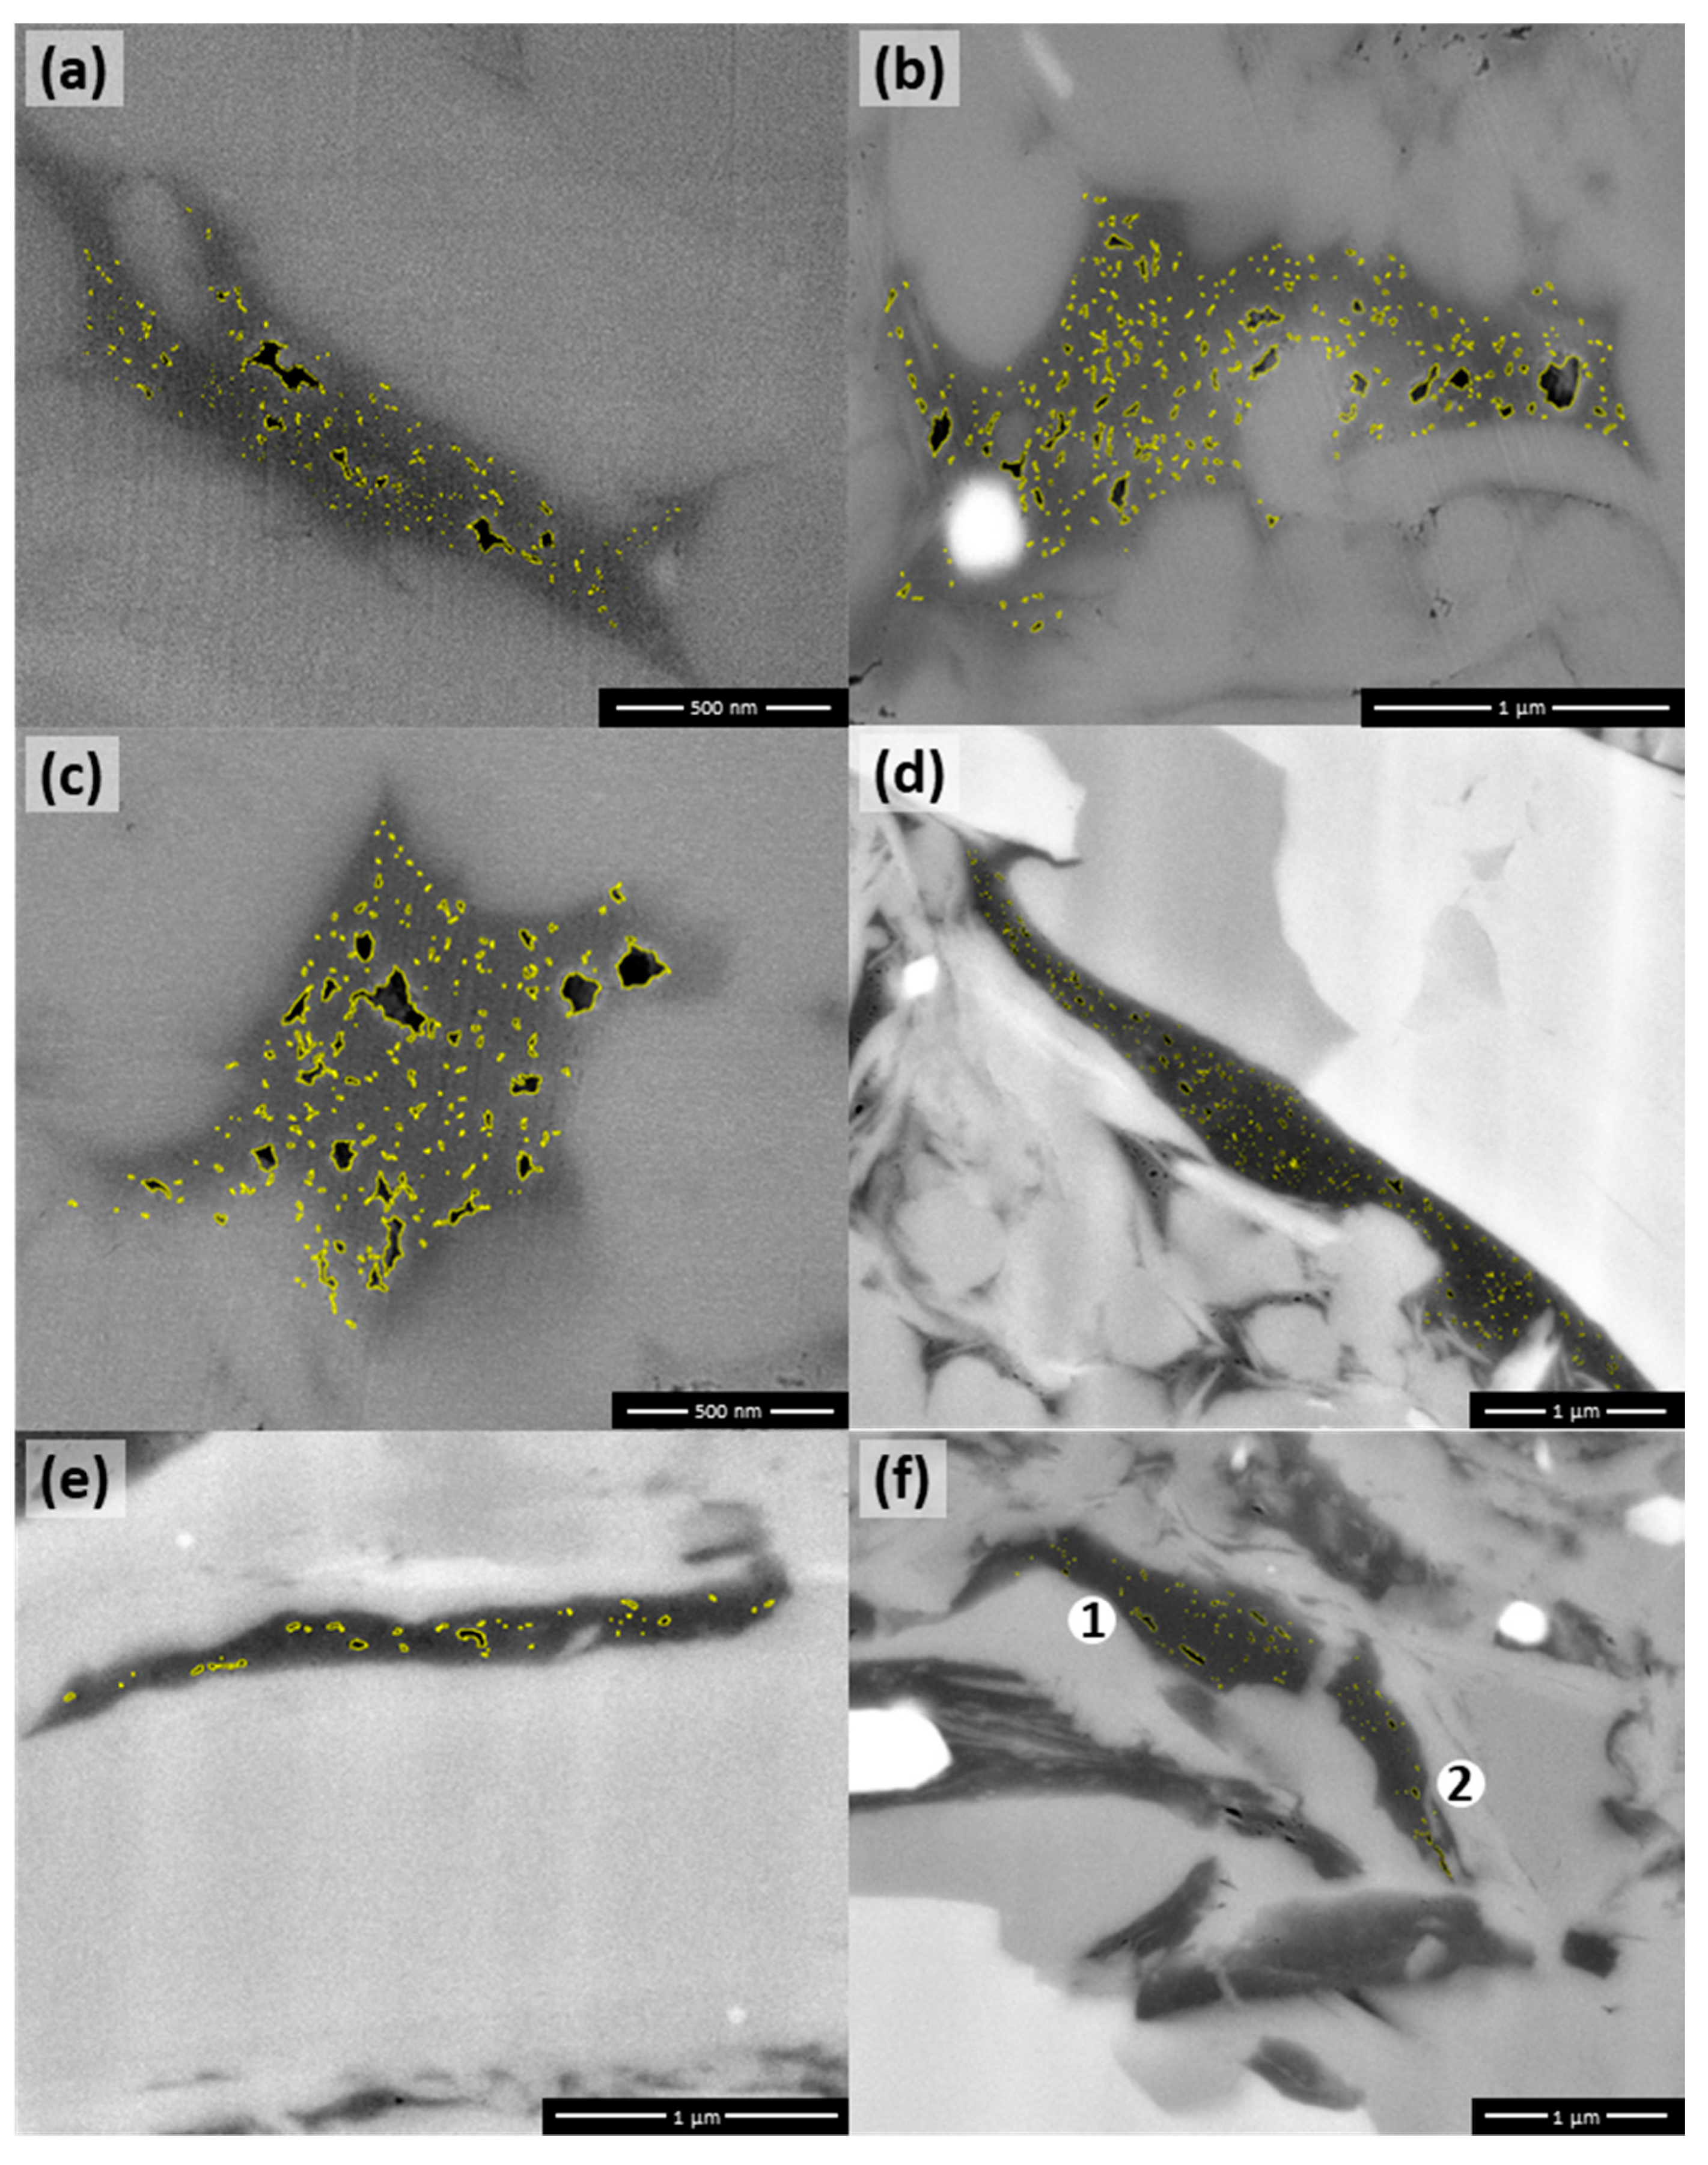
If the deformed pyrobitumen is blocky, this was the second subtype of moderately to strongly deformed pyrobitumen (OM V). Several examples of OM V were presented in Figure 12. Compared to OM I to IV, it is easy to find that OM V is much less porous: the amount of organic pores within OM V is much smaller and the organic porosity of OM V is only about 2–5% (Figure 13). Wavy pores are also common within OM V (Figure 13). This indicated very strong deformation of OM V. Although the blocky geometry of OM V could result from its original geometry and the orientation of sectional area represented by SEM image, deformation in multiple directions could be the major reason due to the less porous and the wavy geometry of the organic pores. For shale gas reservoirs, their burial depth was, at least once reached, about several thousands of meters, and their maximum principle stress was usually the overburden stress that was usually much larger than the other two principle stresses in the horizontal direction [29]. To deform pyrobitumen to a similar degree at two or more directions, there should be at least one horizontal principle stress close or larger than overburden stress due to tectonic movements. As illustrated in Figure 14, there are three different conditions to make strong deformations at two or three directions: (1) the overburden stress had caused compression vertically first and then at least one horizontal principle stress improved by tectonic movements deformed pyrobitumen horizontally; (2) the overburden stress was insufficient to overcome the support of mineral framework to compress pyrobitumen, and the two horizontal principle stresses which were improved by tectonic movement to be larger than the overburden deformed pyrobitumen in two directions; and (3) the overburden stress was insufficient to overcome the support of mineral framework to compress pyrobitumen, and only one horizontal principle stress was improved by tectonic movements to deformed pyrobitumen at this direction first and then orientation of this principle stress altered due to tectonic movement and caused deformation in another horizontal direction. The improved principle stress at horizontal direction as well as the overburden stress could make deformation very strong. Consequently, the pyrobitumen could be blocky but its organic pores were significantly compressed to angular, wavy, smaller, or invisible on SEM images (Figure 12). In addition, since tectonic movement was the key to improve horizontal principle stress(s) to deform pyrobitumen at two or more directions, presence of OM V is an indicator of tectonic movements. Most of the examples in Figure 12 came from well JY8 which located at the area with strong deformation than well JY1 (Figure 1).
Although the strong deformation of porous OM particles can successfully interpret the presence of angular wavy pores within in OM V, there is another potential way inspired by the idea of elliptical OM bodies identified by Löhr et al. [6]. A SEM image of Stuart Ranges Fm L1 at thermal maturity 0.5% Ro [6] showed very similar feature with the OM V in Figure 12a,b, including: (a) the elliptical OM bodies, (b) alignment of large and small round pores serving boundaries of elliptical OM bodies, and (c) presence of angular white minerals (probable apatite). If hydrogen-poor kerogen (e.g., woody debris, oxidized OM) with elliptical shape mixed with amorphous kerogen or bitumen, pores could form within the amorphous kerogen or bitumen among hydrogen-poor kerogen. This can make a similar feature of OM-hosted pores as in Figure 12a,b. We preferred to interpret the features of OM-hosted pores in Figure 12a,b by multi-direction deformation, but our current data was unable to exclude the possibility of mixture of hydrogen-poor kerogen and amorphous kerogen or bitumen.
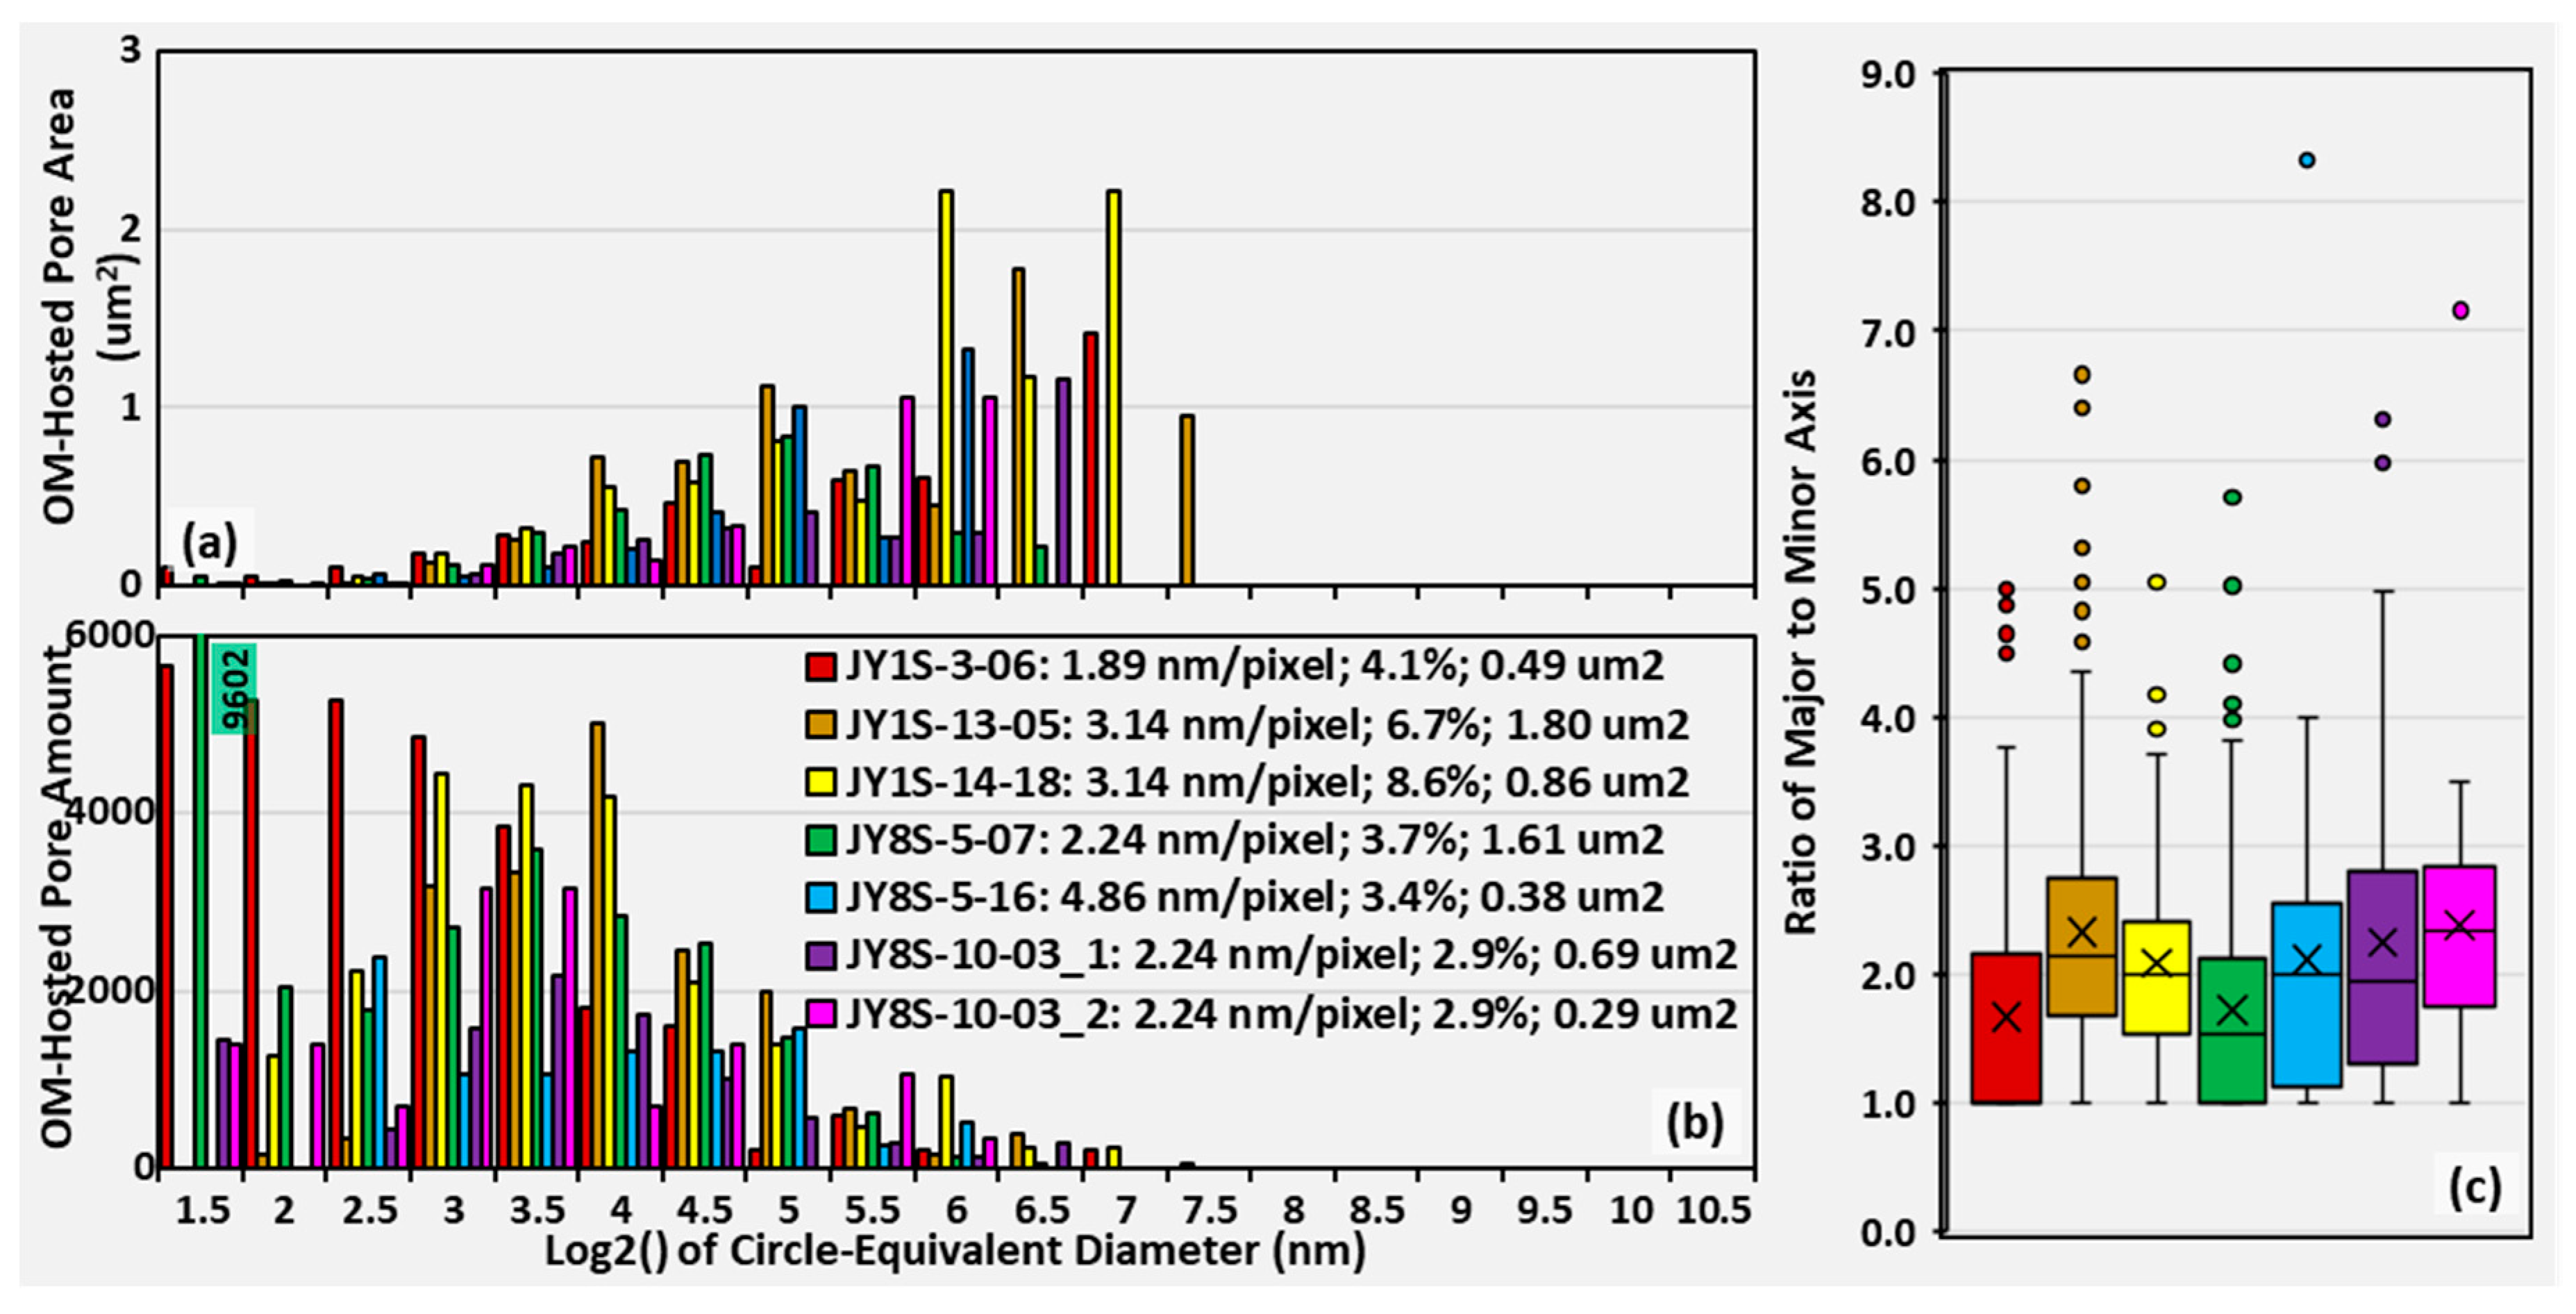
Similar to the weakly or undeformed porous pyrobitumen, the third subtype of moderately to strongly deformed pyrobitumen (OM VI) has small size (usually less than 2 µm2) with irregular shape (blocky or tabular) (Figure 3 and Figure 15). The features of OM-hosted pores of OM VI included (Figure 16): (1) the organic porosity ranged from 3% to 8% with average of 5.15%, which was higher than OM V but less than OM IV; (2) the pore size was smaller than OM IV and OM V, which may be affected by the size of OM (similar to OM III); (3) the pore amount was the largest among all type of pyrobitumen, which may be the result of moderate compression that only reduced the pore size but pores were still visible; and (4) the ratio of the major to the minor axis was relatively larger.

4.4. Features of Nonporous Kerogen

The third type of OM particles is nonporous kerogen, which lack organic pores. Even though strong compaction can compress the pores within pyrobitumen to be small, it usually happened locally only (Figure 4). To completely destroy all the OM-hosted pores of the entire OM particle is very difficult and rarely possible [16]. Therefore, the feature of none or only limited pores within OM is a sign of nonporous kerogen. These nonporous kerogen is rather different from pyrobitumen due to the lack of OM-hosted pores (Figure 3).
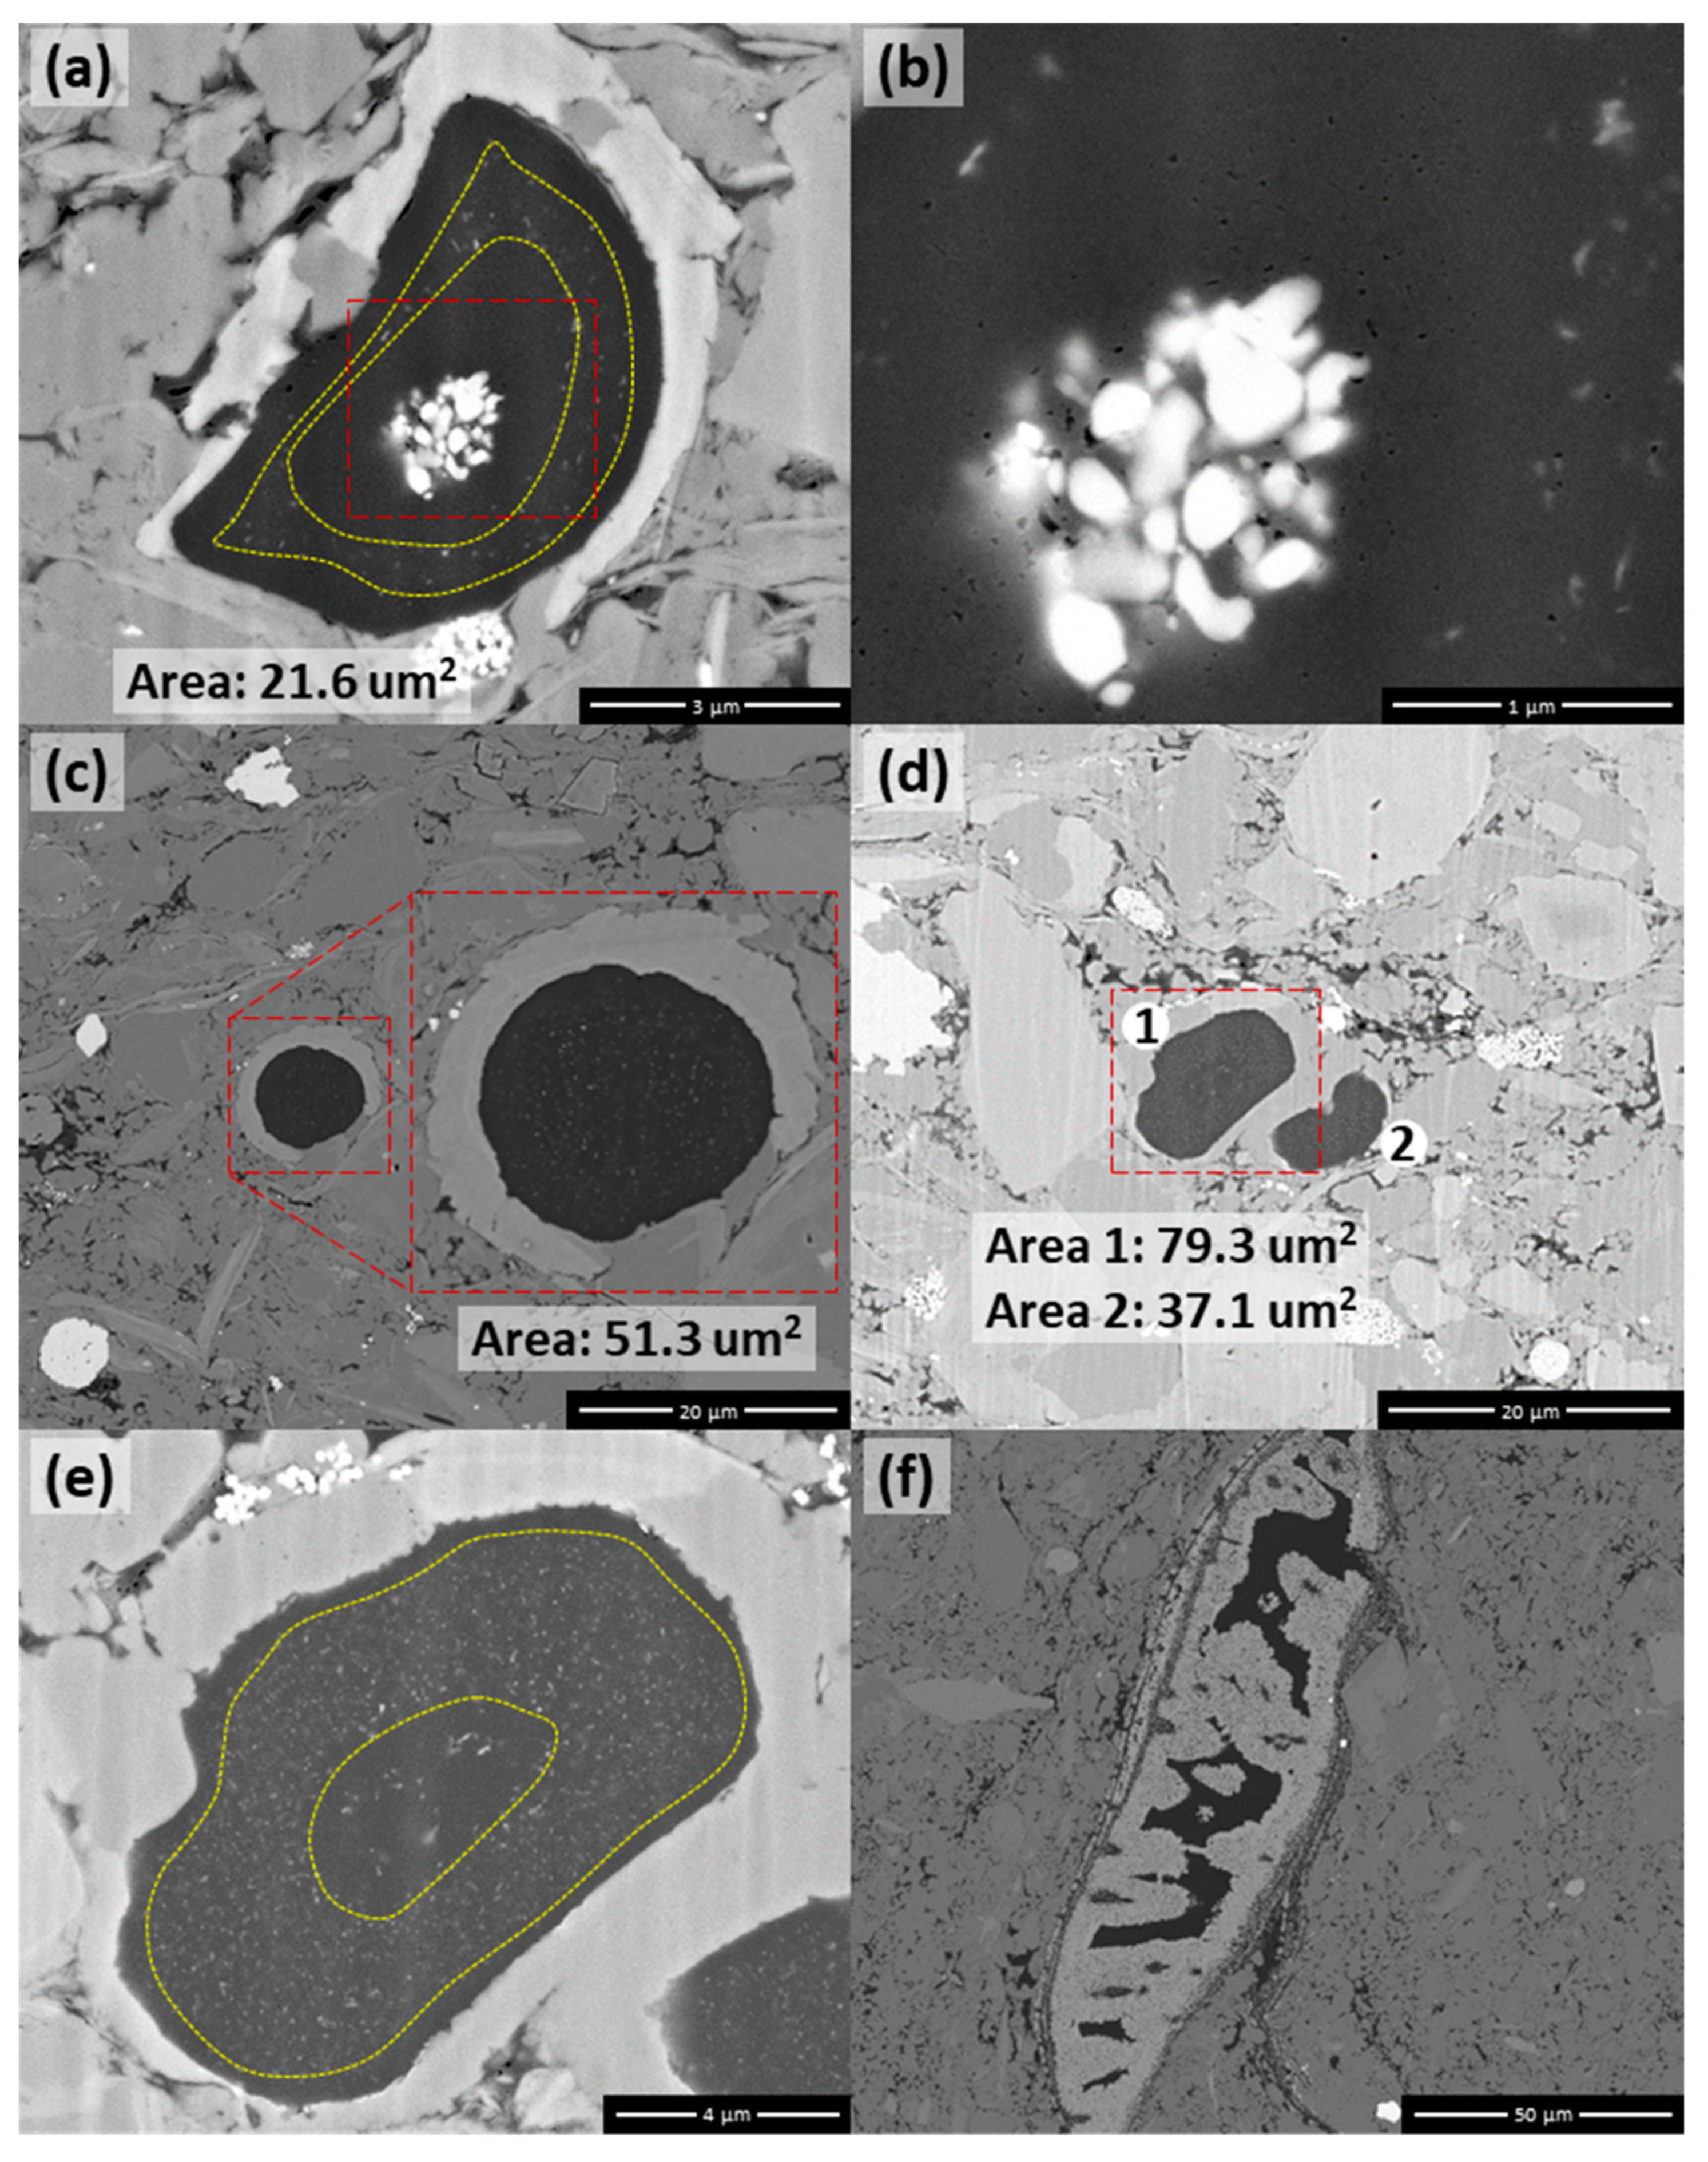
Within organic shale, some nonporous kerogen was bounded by biogenic minerals (OM VII) and others were not (OM VIII). Figure 17 displayed a few examples of the bio-mineral bounded nonporous kerogen. Their section on SEM images was either a half circle (Figure 17a,d) or a full circle (Figure 17c) or irregular within fossil (Figure 17f), and their size ranged from 20 µm2 to 80 µm2. Additionally, these nonporous kerogen was usually rich of tiny gray minerals (Figure 17a,c,e) which may be apatite or bio-quartz, and these apatite or bio-quartz distributed as ring belt as highlighted in Figure 17a,e, which may reflect the original structure of organisms. The nonporous kerogen in Figure 17a contained some bright small minerals (maybe uranitite) which were probably rolled in the kerogen during deposition. The kerogen near these bright minerals contained more pores than the other part of the nonporous kerogen. These bright minerals may serve as catalyst of gas generation, or kerogen with higher hydrogen concentration mixed with bright minerals and nonporous kerogen during deposition, causing more porous near bright minerals. The organic porosity of OM VII is usually less than 0.5% with pore size about 10–20 nm.
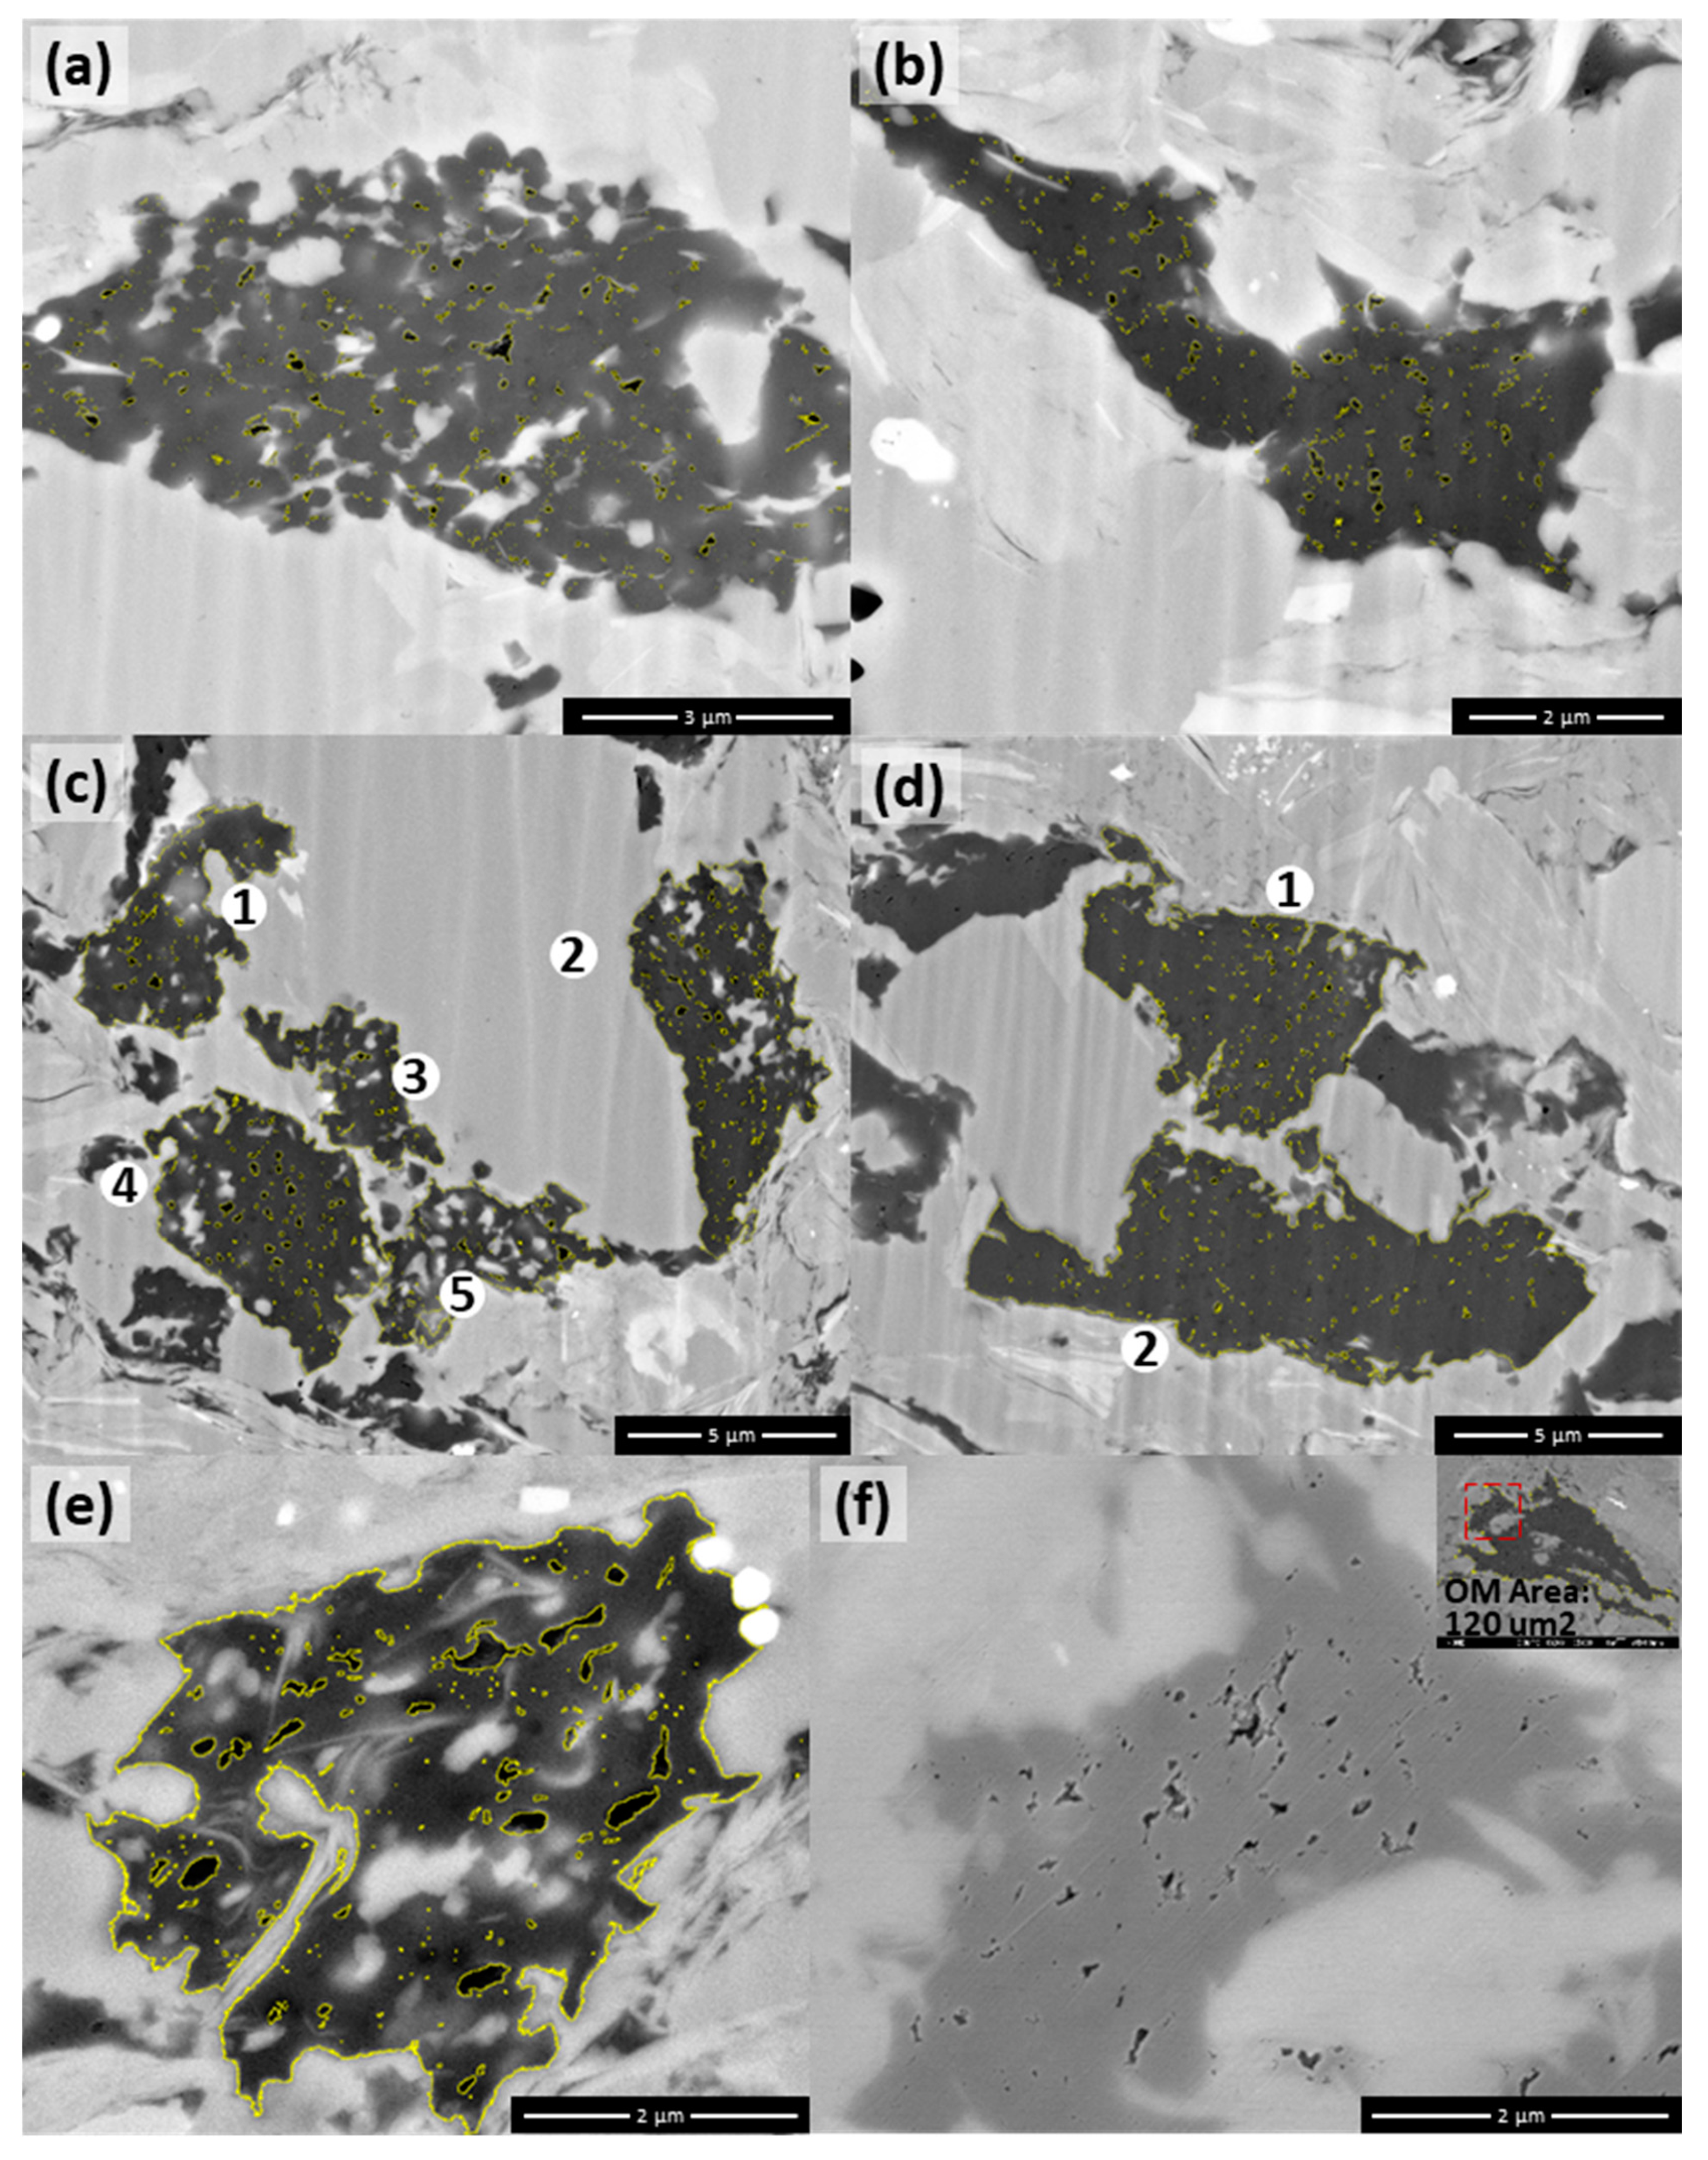
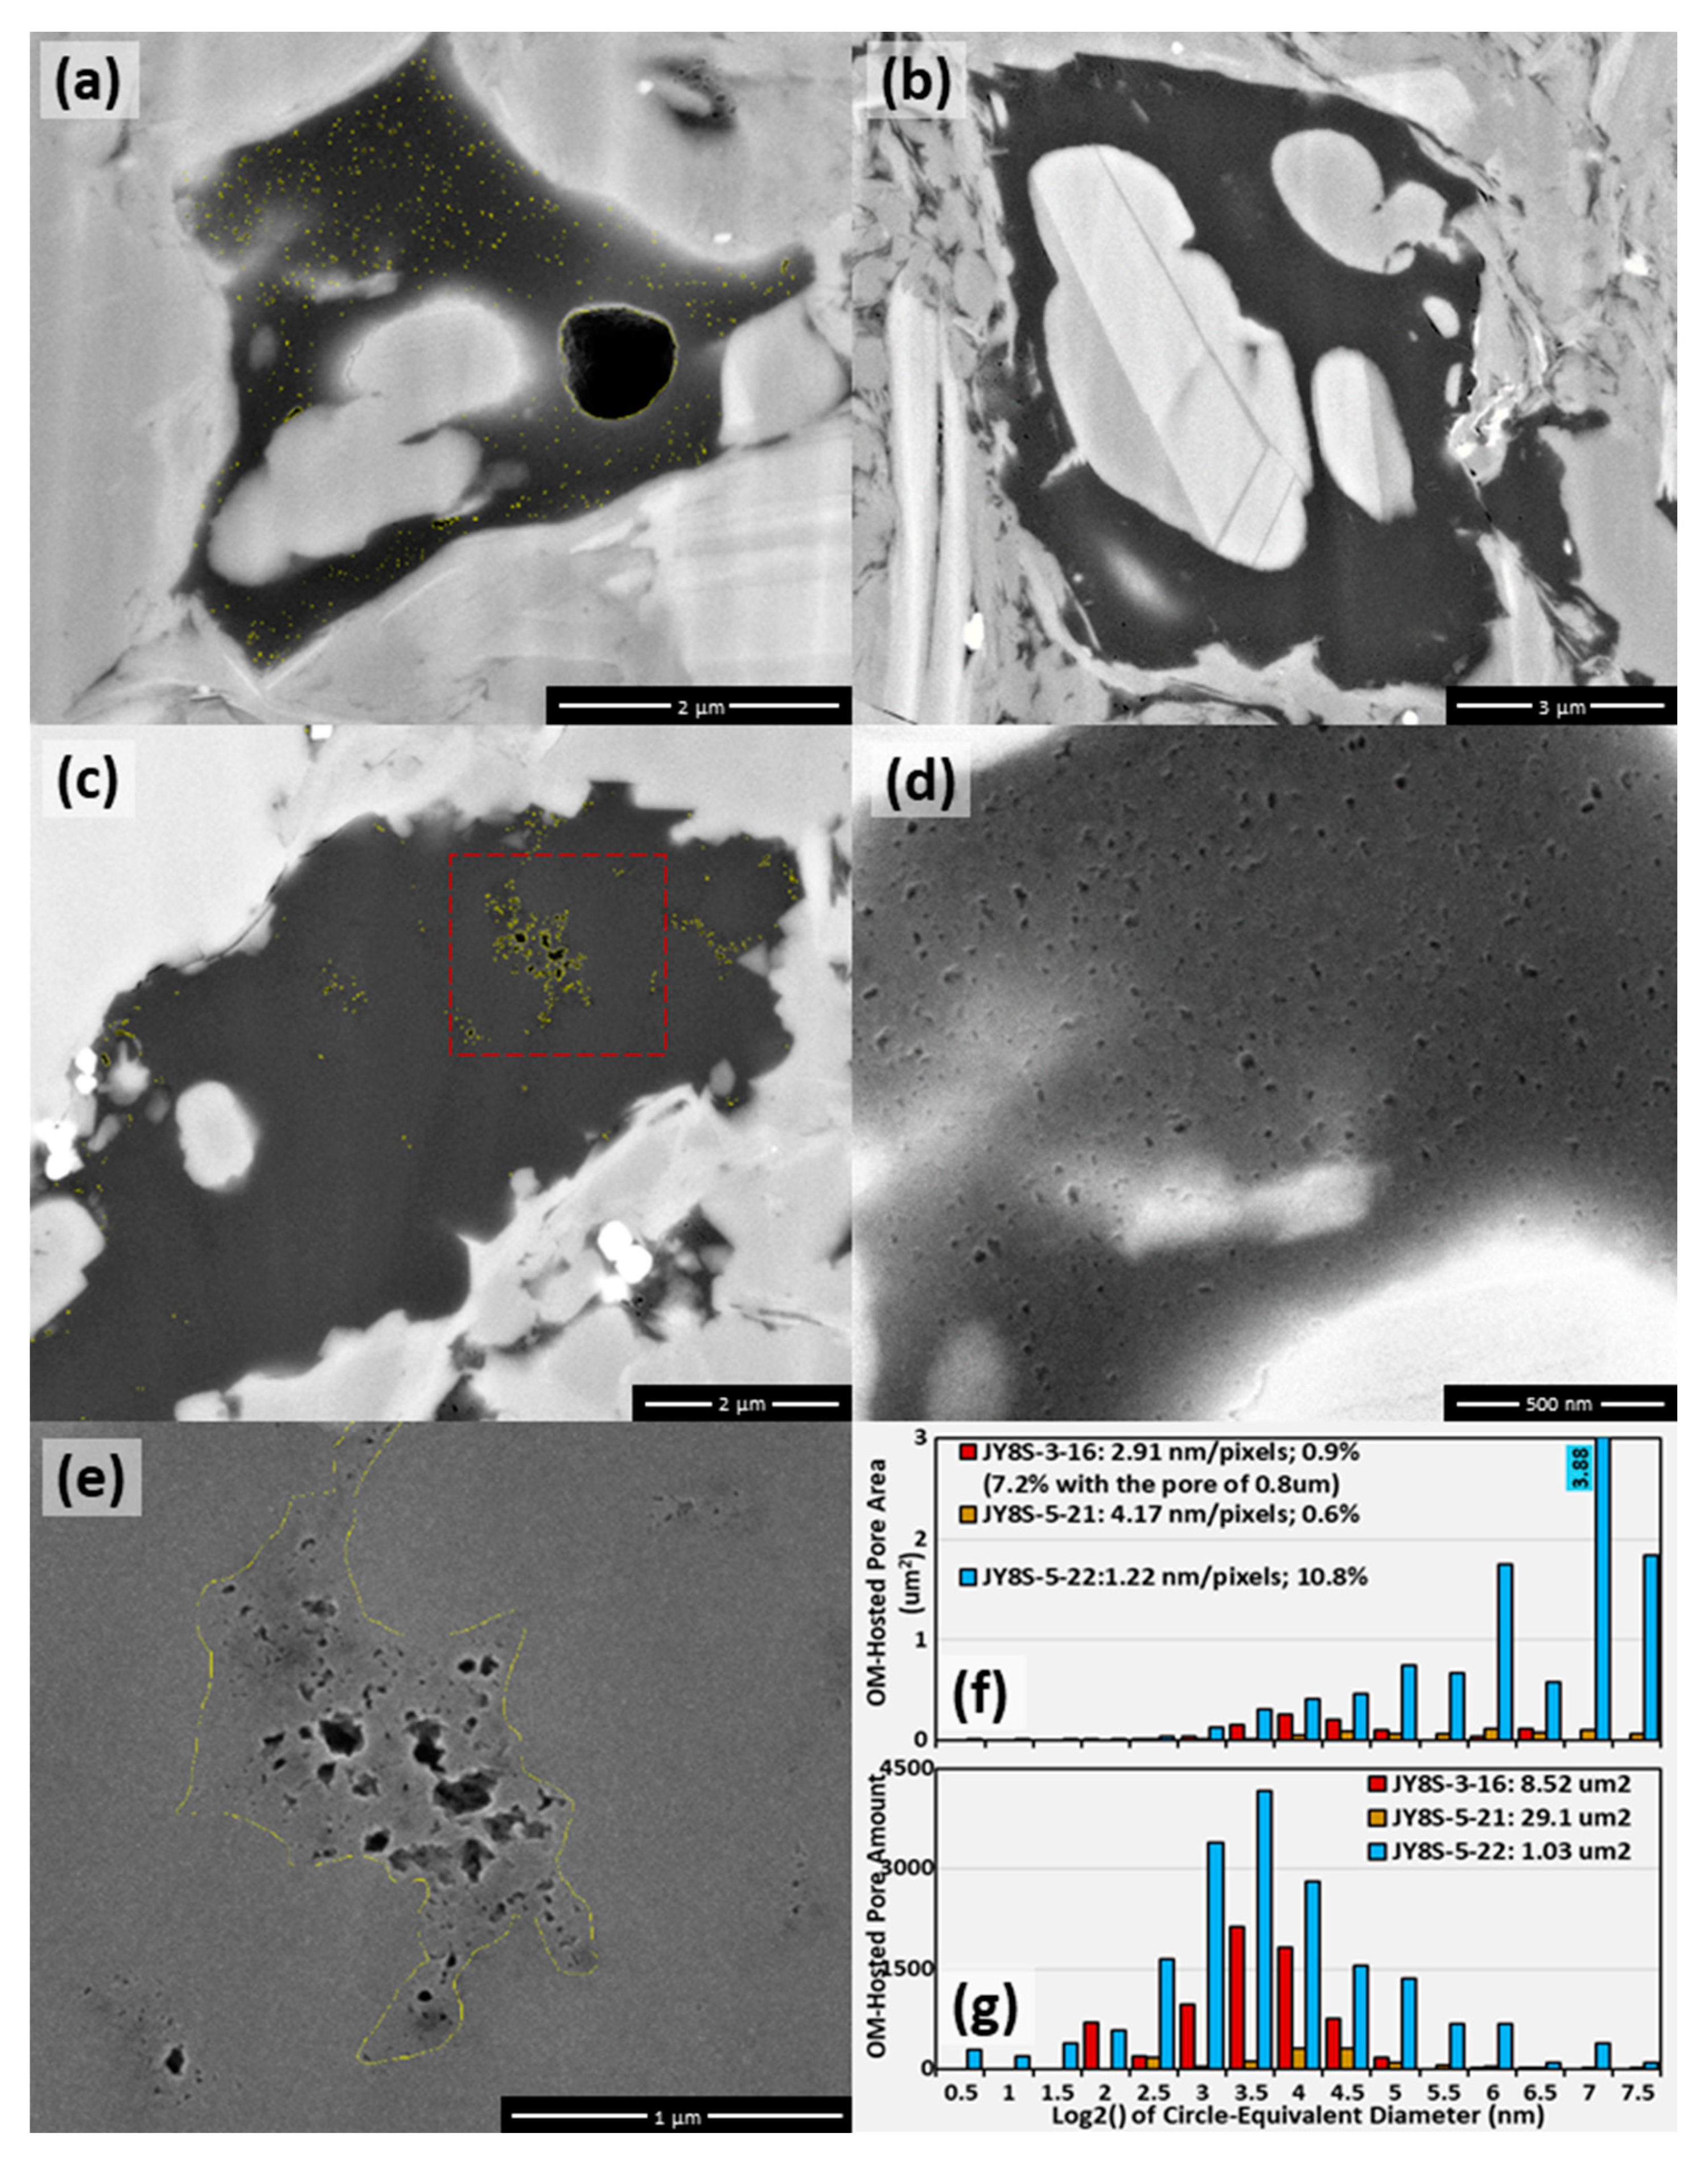
The second subtype of nonporous kerogen was the kerogen without bio-mineral boundaries. As shown in Figure 18, there were very limited pores with similar size as OM VII, but these nonporous kerogens did not contain any tiny small apatite. Instead, it was common to have several large gray minerals. Another feature observed in OM VIII of our samples is the heterogeneity of OM-hosted pores. For example, some areas of the nonporous kerogen in Figure 18c are much more porous than other areas. Pore size distribution and PHIo of the largest area of porous kerogen (Figure 18e) were calculated, showing a very similar feature with Type I OM (Figure 5a,b). This could result from either a mixture of nonporous kerogen and amorphous kerogen or bitumen trapped among the bodies of the nonporous kerogen.

4.5. Features of Mineral-Enriched Amorphous Kerogen

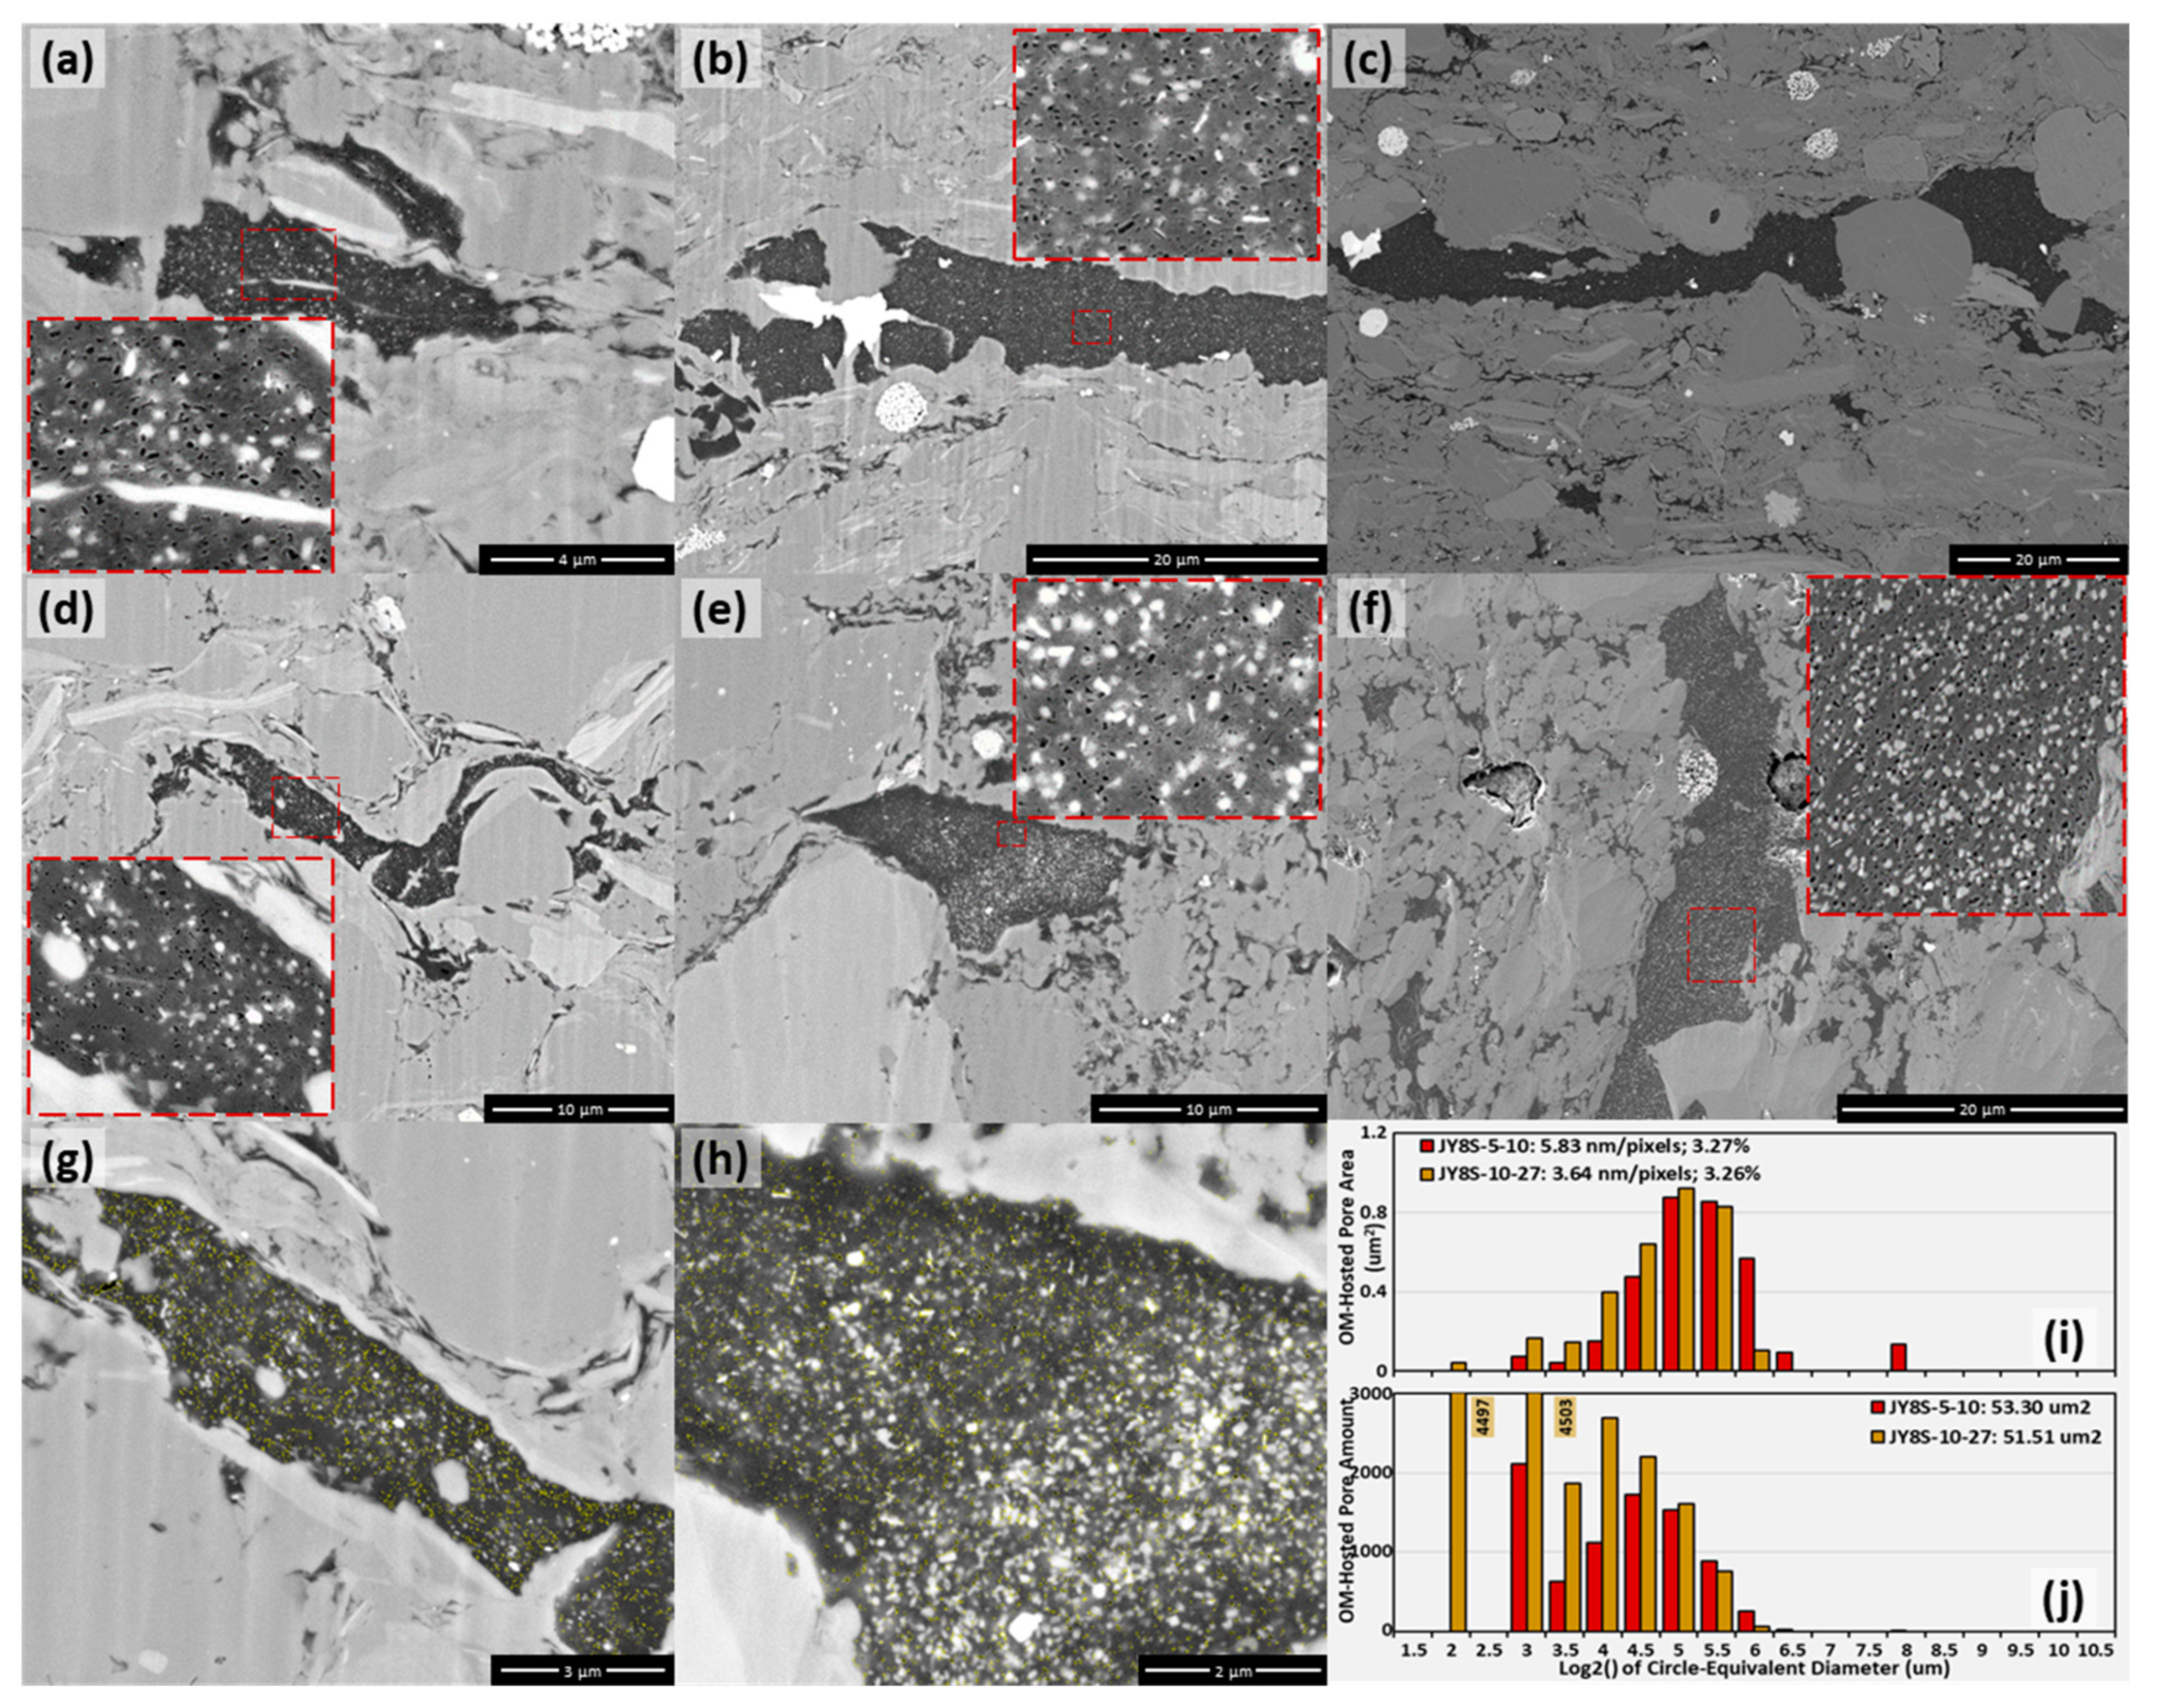
Similar with nonporous kerogen, the mineral-enriched amorphous kerogen was also a deposited OM, but they contained abundant tiny pores and small bright minerals which could be uraninite or pyrite (Figure 19a–h). This is the OM IX with area in a large range of about 10–200 µm2. OM IX must have a higher hydrogen content to form such many organic pores, so the kerogen was either Type I or Type II rich of hydrogen (amorphous kerogen). During their deposition, uraninite and pyrite were formed in the reducing water body and then rolled within the soft amorphous kerogen or diagenetic precipitation of minerals within kerogen. In contrast, the nonporous kerogen has higher a concentration of carbon and is stronger, mechanically, and, consequently, it should be more difficult to roll these small bright minerals within nonporous kerogen, or the lack of pores within nonporous kerogen has no or only few space for mineral precipitation. Thus, these small bright minerals are a good evidence of amorphous kerogen (Figure 19a–h). As shown in Figure 19i,j, the organic pores within OM IX were about 10–40 nm in size with organic porosity about 3%, slightly larger than nonporous kerogen, even much less porous than pyrobitumen (Figure 4, Figure 6, Figure 8, and Figure 9). The presence of abundant small pores and bright minerals makes amorphous kerogen distinct from nonporous kerogen.
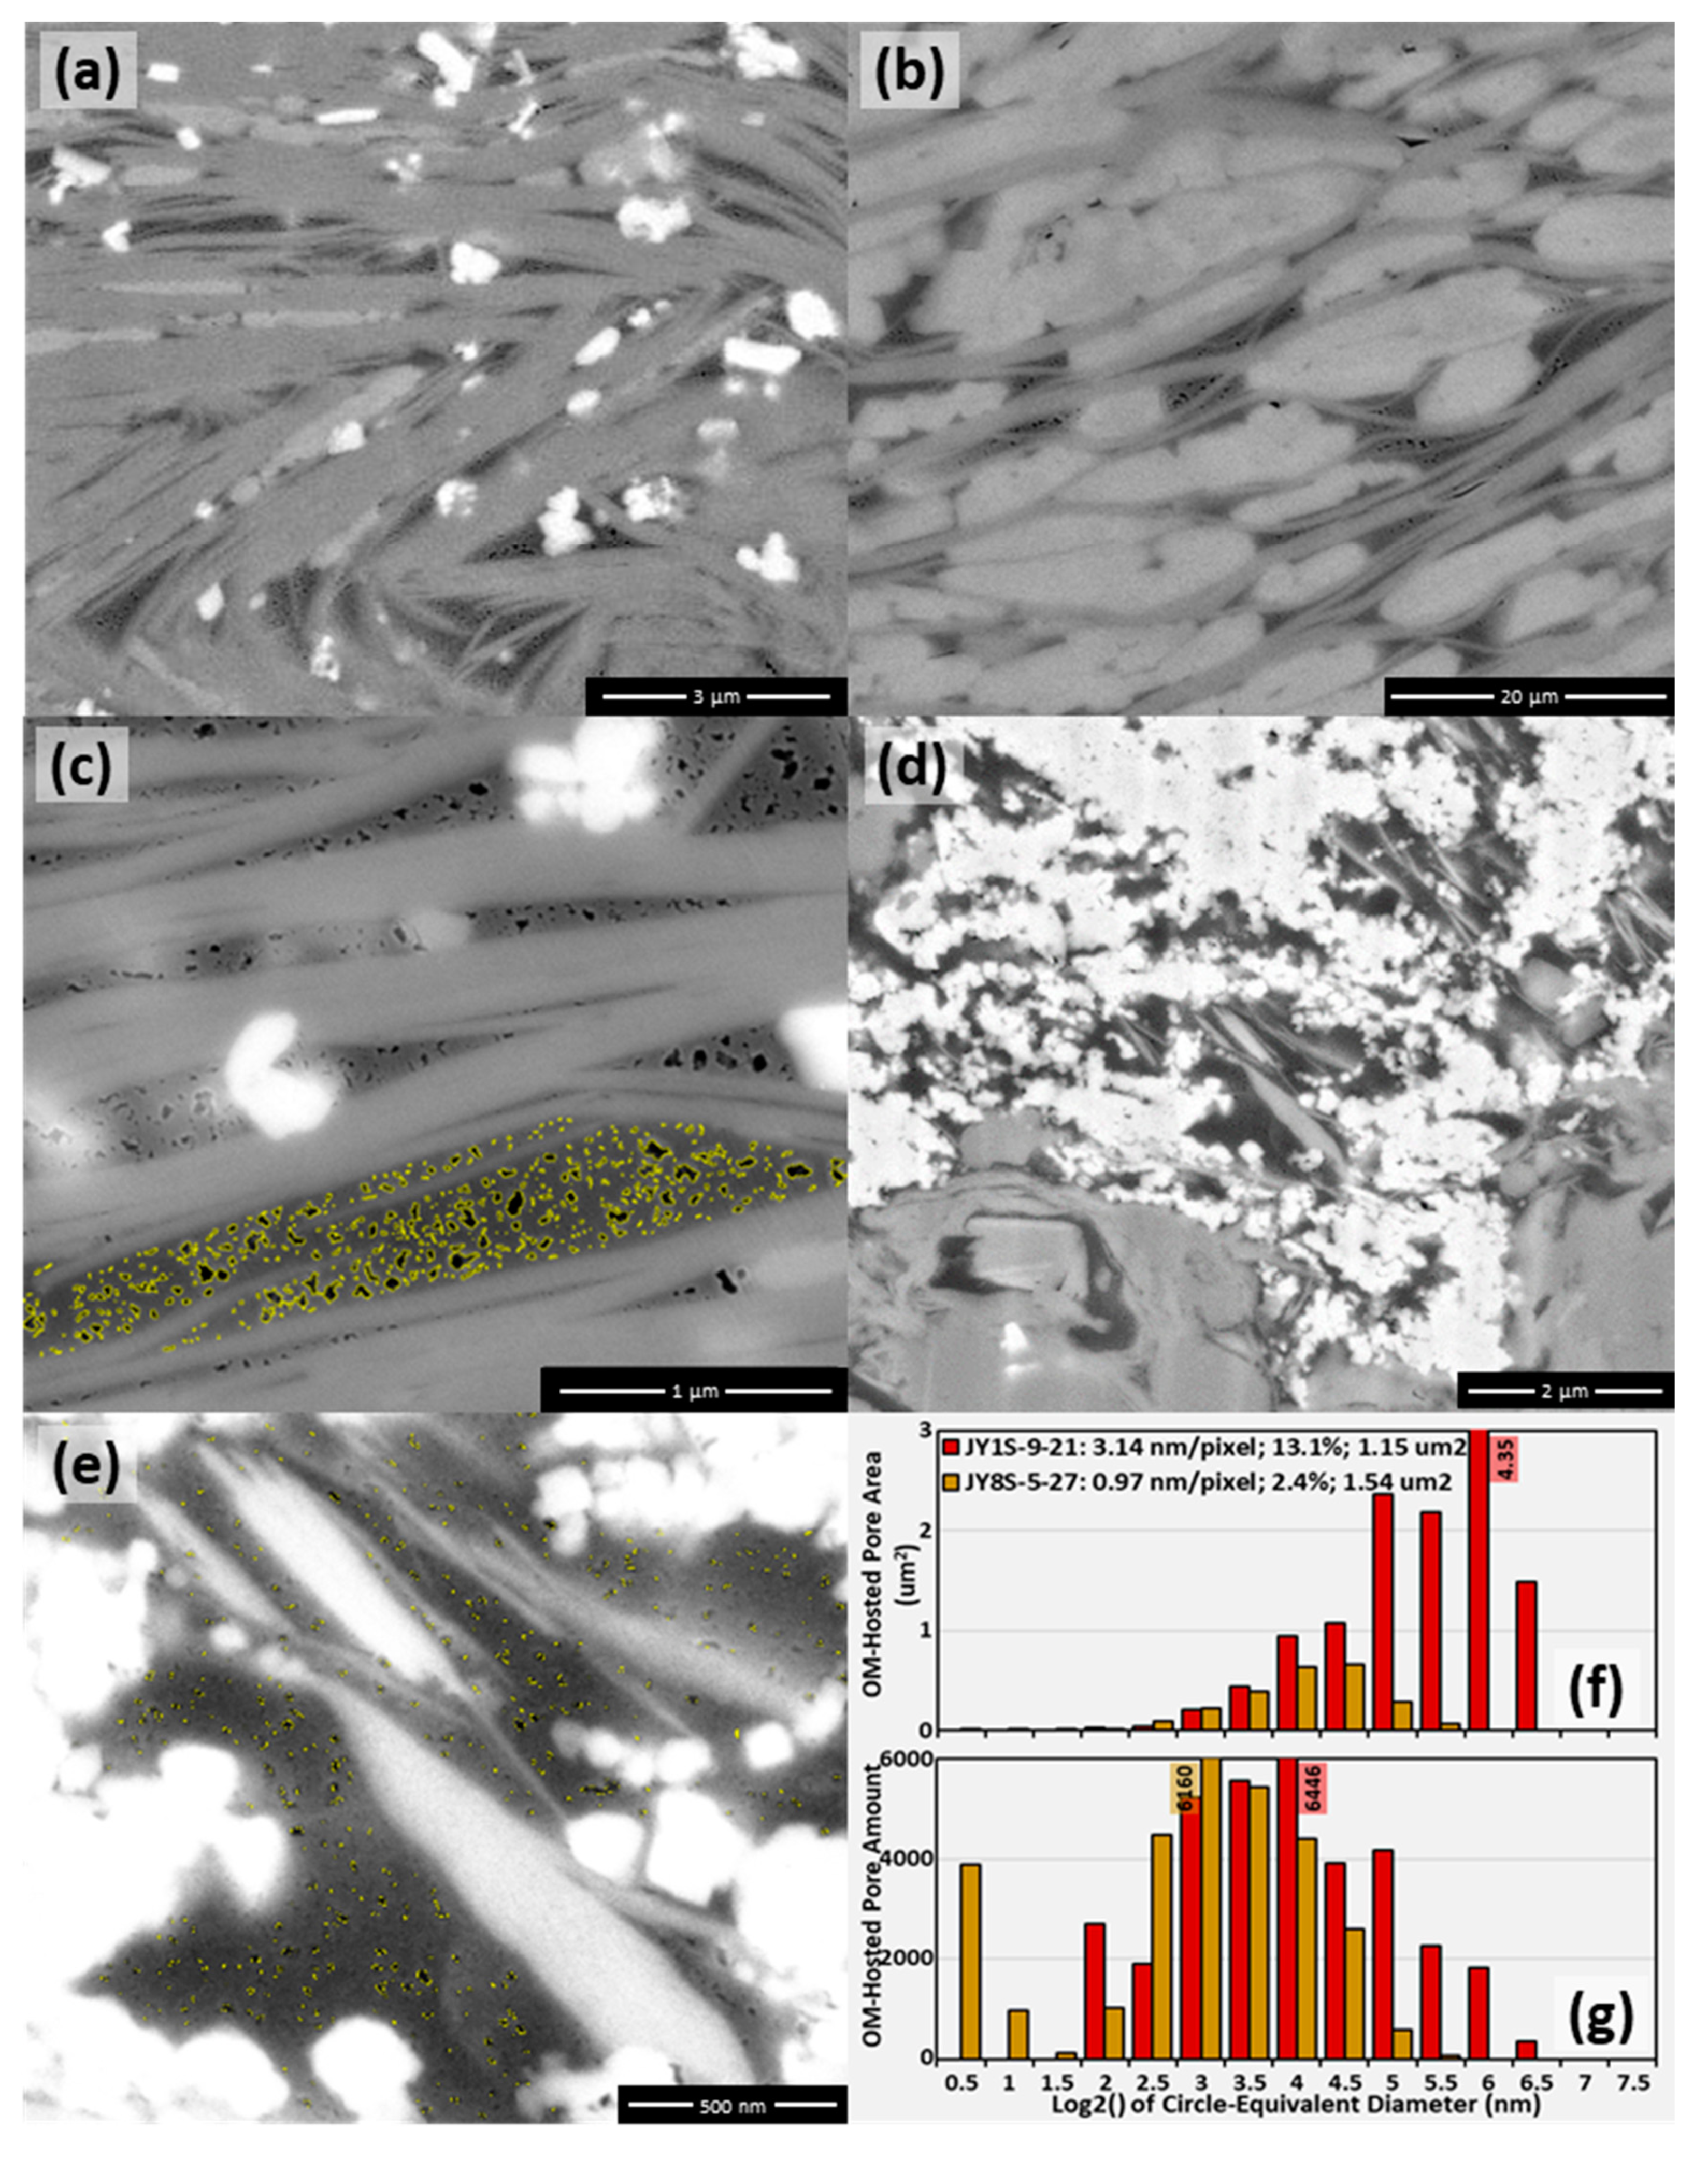
In addition to the small bright minerals, some amorphous kerogen also contains many gray minerals, and their area was only several µm2 (Figure 20a–e). This was the OM X. The embedded gray minerals were predominant mica and/or monocrystal clay minerals (Figure 20a,c–e), as well as pyrite and/or bio-quartz in some examples (Figure 20b). A potential process to form OM X was that, under some special environment, the stirring water mixed amorphous kerogen with clay minerals, bio-quartz, and/or small bright minerals during settling, and then deposited together. Thus, the presence of OM I within organic shale could be an indicator of relatively high water energy (wave or tide) during deposition. With the relatively higher hydrogen concentration of the amorphous kerogen than vitrinite and inertinite, abundant pores formed during hydrocarbon generation (Figure 20a–e). The pore size ranged from a few nanometers to about 60nm with organic porosity 2–13% (Figure 20f,g). The small size of amorphous kerogen and the support of gray minerals (e.g., clay minerals or mica) may be the reason for better-preserved pores within OM X than OM IX.

4.6. Comparison of Organic Porosity among Shale Samples

With analyzing sufficient representative OMs for each shale sample, we can summarize the organic porosity for shale samples in different wells, which increased our analysis from nano-/micro-scale to core samples at several centimeters. This is very helpful for better understanding the pore system within shale gas reservoirs. In this research, we calculated the average organic porosity of five samples from well JY1 and JY8 based on quantitative analysis of totally 81 OM particles (Figure 21). It is worth pointing out that SEM images with low resolution (>15 nm per pixel) were not used to quantitatively analyze the pore size distribution and organic porosity. Within each sample, the organic porosity of OMs varies a lot due to different type and deformation of OM particles. For example, the organic porosity of OM particles in sample JY1S-9 ranges from 3.55% to 34.21%. Among the five samples, the organic porosity of the two samples in well JY1 is obviously larger than that of the three samples in well JY8 (Figure 21). One primary reason was the deformation of OM particles induced by tectonic movement. The regional structure map shows that the anticline in well JY8 area is much narrower than that in JY1 area (Figure 1). This indicated that well JY8 area had experienced stronger compression than the JY1 area. As a result, the possibility that OM particles suffered from deformation should be higher in samples from well JY8. Our observation supports this idea. More pyrobitumen particles suffering from moderate and strong deformation were observed in SEM images from well JY8 than well JY1. Although other reasons are still possible, deformation is a significant reason of lower organic porosity in shale samples from well JY8.

5. Conclusions

More than 500 SEM images acquired from ion-polished core samples of Longmaxi-Wufeng Shale in the Eeastern Sichuan Basin were observed and quantitatively analyzed to understand the characteristics of OM particles and OM-hosted pores in high to over mature shale. Since the chemical composition of and stress applied on OM particles are the critical factors controlling the features of OM-hosted pores, OM type and deformation were used to recognize four types of OM particles, including weakly or undeformed porous pyrobitumen, moderately to strongly deformed pyrobitumen, nonporous kerogen, and mineral-enriched amorphous kerogen. The weakly or undeformed porous pyrobitumen is the most porous OM particles with large pore size and elliptical or near elliptical shape. Their organic porosity could be up to over 38% and contained some organic pores up to 1 µm. The moderately to strongly deformed pyrobitumen was pyrobitumen that suffered from moderate or strong deformation, so that their OM-hosted pores were deformed to be either wavy, linear or irregular with relatively smaller size. Their organic porosity was reduced to about 3–10%. The nonporous kerogen contained very limited pores with small size and their organic porosity is usually less than 1%. The mineral-enriched amorphous kerogen contained abundant small pores and small bright minerals, and their organic porosity is about 2% with pore size 10–40 nm. Finally, a large amount of OM particles observed on high resolution SEM images (<15 nm/pixel) were analyzed to calculate the average organic porosity of five shale samples in wells JY1 and JY8. The average organic porosity ranges from 3% to 12%, and the organic porosity of the two samples in JY1 is about three times of organic porosity of the three samples in well JY8. Indicated by the structure map and the richness of OM V, the deformation of OM particles due to tectonic movement could be the main reason of lower organic porosity of shale samples in well JY 8.

Author Contributions

Conceptualization: G.W., S.L., and Y.P.; methodology: G.W.; software: G.W. and Y.J.; validation: G.W., S.L., Y.P., and Y.J.; formal analysis: G.W. and S.L.; investigation: Y.P. and Y.J.; resources: G.W.; data curation: G.W.; writing—original draft preparation: G.W. and S.L.; writing—review and editing: G.W., S.L., Y.P., and Y.J.; visualization: G.W.; supervision: G.W.; project administration: G.W.; funding acquisition: G.W., S.L., and Y.P. All authors have read and agreed to the published version of the manuscript.

Funding

This research was funded by State Key Laboratory of Shale Oil and Gas Enrichment Mechanisms, grant number GSYKY-B09-33.

Acknowledgments

Authors thanks Sinopec Research Institute of Petroleum Exploration and Production for providing geological data, core samples and funding (GSYKY-B09-33). Part of the SEM images is from our previous research funded by Faculty Development Grant of Saint Francis University.

Conflicts of Interest

The authors declare no conflict of interest.

References

  1. Jarvie, D.M.; Hill, R.J.; Ruble, T.E.; Pollastro, R.M. Unconventional shale-gas systems: The Mississippian Barnett Shale of north-central Texas as one model for thermogenic shale-gas assessment. AAPG Bull. 2007, 91, 475–499. [Google Scholar] [CrossRef]
  2. Loucks, R.G.; Reed, R.M.; Ruppel, S.C.; Jarvie, D.M. Morphology, genesis, and distribution of nanometer-scale pores in mudstones of the Mississippian Barnett Shale. J. Sediment. Res. 2009, 79, 848–861. [Google Scholar] [CrossRef] [Green Version]
  3. Curtis, M.E.; Cardott, B.J.; Sondergeld, C.H.; Rai, C. Development of organic porosity in the Woodford Shale with increasing thermal maturity. Int. J. Coal Geol. 2012, 103, 26–31. [Google Scholar] [CrossRef]
  4. Milliken, K.L.; Rudnicki, M.; Awwiller, D.N.; Zhang, T. Organic matter-hosted pore system, Marcellus Formation (Devonian), Pennsylvania. AAPG Bull. 2013, 97, 177–200. [Google Scholar] [CrossRef]
  5. Schieber, J. SEM observations of on ion-milled samples of Devonian Black Shales from Indiana and New York: The petrographic context multiple pore types. In Electron Microscopy of Shale Hydrocarbon Reservoirs; Camp, W., Diaz, E., Wawak, B., Eds.; AAPG Memoir 102: Tulsa, OK, USA, 2013; pp. 153–171. [Google Scholar]
  6. Löhr, S.C.; Baruch, E.T.; Hall, P.A.; Kennedy, M.J. Is organic pore development in gas shales influenced by the primary porosity and structure of thermal immature organic matter? Org. Geochem. 2015, 87, 119–132. [Google Scholar] [CrossRef] [Green Version]
  7. Ko, L.T.; Loucks, R.G.; Zhang, T.S.; Ruppel, C.; Shao, D. Pore and pore network evolution of Upper Cretaceous Baquillas (Eagle Fold-equivalent) mudrocks: Results from gold-tube pyrolysis experiments. AAPG Bull. 2016, 100, 1693–1722. [Google Scholar] [CrossRef]
  8. Loucks, R.G.; Reed, R.M.; Ruppel, S.C.; Hammes, U. Spectrum of pore types and networks in mudrocks and a descriptive classification for matrix-related mudrock pores. AAPG Bull. 2012, 96, 1071–1098. [Google Scholar] [CrossRef] [Green Version]
  9. Ambrose, R.J.; Hartman, R.C.; Dias-Campos, M.; Akkutlu, Y.; Sondergeld, C.H. New pore-scale considerations for shale gas in place calculations. In Proceedings of the SPE Unconventional Gas Conference, Pittsburgh, PA, USA, 23–25 February 2010; Society of Petroleum Engineers: Richardson, TX, USA, 2010. [Google Scholar]
  10. Sondergeld, C.H.; Ambrose, R.J.; Rai, C.S.; Moncrieff, J. Microstructural studies of gas shales. In Proceedings of the SPE Unconventional Gas Conference, Pittsburgh, PA, USA, 23–25 February 2010; Society of Petroleum Engineers: Richardson, TX, USA, 2010. [Google Scholar]
  11. Curtis, M.E.; Ambrose, R.J.; Sondergeld, C.H.; Rai, C. Transmission and scanning electron microscopy investigation of pore connectivity of gas shales on the nanoscale. In Proceedings of the North American Unconventional Gas Conference and Exhibition, Woodlands, TX, USA, 14–16 June 2011; Society of Petroleum Engineers: Richardson, TX, USA, 2011. [Google Scholar]
  12. Slatt, R.M.; O’Brien, N.R. Pore types in the Barnett and Woodford gas shales: Contribution to understanding gas storage and migration pathways in fine-grained rocks. AAPG Bull. 2011, 95, 2017–2030. [Google Scholar] [CrossRef]
  13. Mastalerz, M.; Schimmelmann, A.; Drobniak, A.; Chen, Y. Torosity of Devonian and Mississippian New Albany Shale across a maturation gradient: Insights from organic petrology, gas adsorption, and mercury intrusion. AAPG Bull. 2013, 97, 1621–1643. [Google Scholar] [CrossRef]
  14. Kuila, U.; McCarty, D.K.; Derkowski, A.; Fischer, T.B.; Topor, T.; Prasad, M. Nano-scale texture and porosity of organic matter and clay minerals in organic-rich mudrocks. Fuel 2014, 135, 359–373. [Google Scholar] [CrossRef] [Green Version]
  15. Lu, J.; Ruppel, S.C.; Rowe, H.D. Organic matter pores and oil generation in the Tuscaloosa marine shale. AAPG Bull. 2015, 99, 333–357. [Google Scholar] [CrossRef]
  16. Wang, G.C. Deformation of organic matter (OM) and its effect on OM-hosted pores in mudrocks. AAPG Bull. in press.
  17. Wang, G.C. A new petrophysical model of shale gas reservoir evaluation. In Proceedings of the 48th Annual Eastern Section AAPG Conference, Columbus, OH, USA, 12–16 October 2019. [Google Scholar]
  18. Cardott, B.J.; Landis, C.R.; Curtis, M.E. Post-oil solid bitumen network in the Woodford Shale, USA—A potential primary migration pathway. Int. J. Coal Geol. 2015, 139, 106–113. [Google Scholar] [CrossRef]
  19. Curiale, J.A. Origin of solid bitumens, with emphasis on biological marker results. Org. Geochem. 1986, 10, 559–580. [Google Scholar] [CrossRef]
  20. Curtis, M.E.; Ambrose, R.J.; Sondergeld, C.H.; Rai, C. Investigation of the relationship between organic porosity and thermal maturity in the Marcellus Shale. In Proceedings of the North American Unconventional Gas Conference and Exhibition, Woodlands, TX, USA, 14–16 June 2011; Society of Petroleum Engineers: Richardson, TX, USA, 2011. [Google Scholar]
  21. Guo, T.; Liu, R. Implications from marine shale gas exploration breakthrough in complicated structural area at high thermal stage: Taking Longmaxi Formation in well JY1 as an example. Nat. Gas Geosci. 2013, 24, 643–651. [Google Scholar]
  22. Ma, Y.S.; Cai, X.Y.; Zhao, P.R. China’s shale gas exploration and development: Understanding and practice. Pet. Explor. Dev. 2018, 45, 561–574. [Google Scholar] [CrossRef]
  23. Wang, G.C.; Ju, Y.W.; Huang, C.; Long, S.X.; Peng, Y.M. Longmaxi-Wufeng shale lithofacies identification and 3-D modeling in the northern fuling gas field, Sichuan Basin. J. Nat. Gas Sci. Eng. 2017, 47, 59–72. [Google Scholar] [CrossRef]
  24. Wang, G.C.; Long, S.X.; Ju, Y.W.; Huang, C.; Peng, Y.M. Application of horizontal wells in 3-D shale reservoir modeling: A case study of Longmaxi-Wufeng shale in fuling gas field, Sichuan Basin. AAPG Bull. 2018, 102, 2333–2354. [Google Scholar] [CrossRef]
  25. Wang, Z.G. Breakthrough of Fuling shale gas exploration and development and its inspiration. Oil Gas Geol. 2015, 36, 1–6. [Google Scholar]
  26. Wang, Z.G. Reservoir forming conditions and key exploration and development technologies for marine shale gas fields in Fuling area, South China. Pet. Res. 2018, 3, 197–209. [Google Scholar] [CrossRef]
  27. Guo, X.S. Major factors controlling the shale gas accumulations in Wufeng-Longmaxi formation of the Pingqiao shale gas FIELD in fuling area, Sichuan Basin, China. J. Nat. Gas Geosci. 2019, 4, 129–138. [Google Scholar] [CrossRef]
  28. Schindelin, J.; Arganda-Carreras, I.; Frise, E.; Kaynig, V.; Longair, M.; Pietzsch, T.; Preibisch, S.; Rueden, C.; Saalfeld, S.; Schmid, B.; et al. Fiji: An open-source platform for biological-image analysis. Nat. Methods 2012, 9, 676–682. [Google Scholar] [CrossRef] [PubMed] [Green Version]
  29. Fossen, H. Structural Geology; Cambridge University Press: Cambridge, UK, 2010; p. 463. [Google Scholar]
Figure 1. The structural features of the eastern Sichuan Basin (a) and the stratigraphy of wells JY1 and JY8 with organic matter richness and porosity (b). The structural feature was modified by Zhigang Wang [26] and the stratigraphic column was modified from [27].
Minerals 10 00137 g001
Figure 2. Example of organic matter, OM-hosted pores, minerals of Longamxi Shale, Sichuan Basin (a) and an illustration of intersection of OM-hosted pores and SEM section for roughness texture (b) and white edge (c). The SEM image is from core sample JY1S-4, the red arrow points to the roughness texture, the purple arrow points to the white edge, and the green arrow points to the region with the lower gray level of OM and OM-hosted pores.
Minerals 10 00137 g002
Figure 3. Classification of organic matter particles with high to over mature Longmaxi-Wufeng Shale, Eastern Sichuan Basin. Sample ID of images of I to X is JY1S-9, JY1S-15, JY1S-13, JY8S-5, JY8S-10, JY1S-15, JY1S-9, JY8S-5, JY8S-5, and JY8S-5.
Minerals 10 00137 g003
Figure 4. The typical examples of the first subtype of weakly or undeformed porous pyrobitumen (OM I) from Longmaxi-Wufeng Shale, Sichuan Basin. (a) SEM image JY1S-9-02 (well ID-sample no.-image no.); (b) SEM image JY1S-9-17; (c) SEM image JY1S-9-22; (d) SEM image JY1S-15-23; (e) SEM image JY8S-3-35; and (f) SEM image JY1S-12-12. The boundary of OM-hosted pores is outlined in yellow.
Minerals 10 00137 g004
Figure 5. The pore size distribution (PSD) and geometry of OM-hosted pores within the first subtype of weakly or undeformed porous pyrobitumen (OM I) of Longmaxi-Wufeng Shale, eastern Sichuan Basin. (a) PSD determined by pore sectional area; (b) PSD determined by pore amount; and (c) ratio of major to minor axis. The three values after image ID in the legend are image resolution (nm/pixel), organic porosity (%), and OM sectional area (µm2). The number labels show the values that are beyond the range of the vertical axis.
Minerals 10 00137 g005
Figure 6. The typical examples of the second subtype of weakly or undeformed porous pyrobitumen (OM II) from Longmaxi-Wufeng Shale, Sichuan Basin. (a) SEM image JY1S-9-12 (well ID-sample no.-image no.); (b) SEM image JY1S-9-18; (c) SEM image JY1S-9-35; (d) SEM image JY1S-15-08; (e) SEM image JY8S-3-34; and (f) SEM image JY1S-14-10. The boundary of OM-hosted pores is outlined in yellow.
Minerals 10 00137 g006
Figure 7. The pore size distribution (PSD) and geometry of OM-hosted pores within the second subtype of weakly or undeformed porous pyrobitumen (OM II) of Longmaxi-Wufeng Shale, Eastern Sichuan Basin. (a) PSD determined by pore sectional area; (b) PSD determined by pore amount; and (c) ratio of the major to minor axis. The three values after image ID in the legend are image resolution (nm/pixel), organic porosity (%), and OM sectional area (µm2). The number labels show the values that are beyond the range of the vertical axis.
Minerals 10 00137 g007
Figure 8. Typical examples of the third subtype of weakly or un-deformed porous pyrobitumen (OM III) and the statistical analysis of OM-hosted pores of Longmaxi-Wufeng Shale, Sichuan Basin. (a) SEM image JY1S-9-25 (well ID-sample no.-image no.); (b) SEM image JY1S-9-39; (c) SEM image JY1S-9-10; (d) SEM image JY1S-9-10; (e) SEM image JY1S-4-13; (f) SEM image JY1S-10-1. The yellow lines indicate the boundary of organic matter particles.
Minerals 10 00137 g008
Figure 9. Statistical analysis of the 15 particles of OM III shown in Figure 8. (a) histogram of sectional area of the 15 particles of OM III; (b) histogram of organic porosity of the 15 particles of OM III; (c) pore size distribution determined by pore sectional area of all OM-hosted pores within the 15 OM III together; and (d) pore size distribution determined by pore amount of all OM-hosted pores within the 15 OM III together.
Minerals 10 00137 g009
Figure 10. The typical examples of the first subtype of moderately to strongly deformed pyrobitumen (OM IV) from Longmaxi-Wufeng Shale, Sichuan Basin. (a) SEM image JY1S-9-25 (well ID-sample no.-image no.); (b) SEM image JY1S-15-31; (c) SEM image JY8S-3-35; (d) SEM image JY8S-5-20; (e) SEM image JY8S-5-39; (f) SEM image JY8S-5-17. The boundary of OM-hosted pores was outlined by yellow lines; the purple ellipse is the area-equivalent ellipse of OM; the unit of major and minor axis is µm.
Minerals 10 00137 g010
Figure 11. The pore size distribution (PSD) and geometry of OM-hosted pores within the second subtype of weakly or undeformed porous pyrobitumen (OM IV) of Longmaxi-Wufeng Shale, Eastern Sichuan Basin. (a) PSD determined by pore sectional area; (b) PSD determined by pore amount; and (c) the ratio of the major to the minor axis. The three values after image ID in the legend are the image resolution (nm/pixel), organic porosity (%), and OM sectional area (µm2). The number labels show the values that are beyond the range of the vertical axis.
Minerals 10 00137 g011
Figure 12. The typical examples of the second subtype of moderately to strongly deformed pyrobitumen (OM V) from Longmaxi-Wufeng Shale, Sichuan Basin. (a) SEM image JY8S-3-13 (well ID-sample no.-image no.); (b) SEM image JY8S-3-24; (c) SEM image JY8S-3-30; (d) SEM image JY8S-5-29; (e) SEM image JY8S-10-06; and (f) SEM image JY1S-4-08. The boundary of OM-hosted pores was outlined by yellow color.
Minerals 10 00137 g012
Figure 13. The pore size distribution (PSD) and geometry of OM-hosted pores within the second subtype of weakly or undeformed porous pyrobitumen (OM V) of Longmaxi-Wufeng Shale, Eastern Sichuan Basin. (a) PSD determined by pore sectional area; (b) PSD determined by pore amount; and (c) ratio of major to minor axis. The three values after image ID in the legend are image resolution (nm/pixel), organic porosity (%), and OM sectional area (µm2). The number labels show the values that are beyond the range of the vertical axis.
Minerals 10 00137 g013
Figure 14. The generalized deformation process and the associated stress condition of OM V during tectonic movement. The orange arrow indicates rotation of the improved horizontal principle stress due to tectonic movements.
Minerals 10 00137 g014
Figure 15. Examples of the third subtype of moderately to strongly deformed pyrobitumen (OM VI) from Longmaxi-Wufeng Shale, Sichuan Basin. (a) SEM image JY1S-3-6 (well ID-sample no.-image no.); (b) SEM image JY1S-13-05; (c) SEM image JY1S-14-18; (d) SEM image JY8S-5-07; (e) SEM image JY8S-5-16; and (f) SEM image JY8S-10-03. The boundary of OM-hosted pores was outlined by yellow color.
Minerals 10 00137 g015
Figure 16. The pore size distribution (PSD) and geometry of OM-hosted pores within the third subtype of weakly or undeformed porous pyrobitumen (OM VI) of Longmaxi-Wufeng Shale, Eastern Sichuan Basin. (a) PSD determined by pore sectional area; and (b) PSD determined by pore amount; and (c) ratio of major to minor axis. The three values after image ID in the legend are image resolution (nm/pixel), organic porosity (%), and OM sectional area (µm2). The number labels show the values that are beyond the range of the vertical axis.
Minerals 10 00137 g016
Figure 17. Examples of the nonporous kerogen bounded by biogenic minerals (OM VII) from Longmaxi-Wufeng Shale, Sichuan Basin. (a) SEM image JY1S-9-06 (well ID-sample no.-image no.); (b) SEM image JY1S-9-07, a near view of SEM image JY1S-0-06; (c) SEM image JY1S-9-51; (d) SEM image JY1S-15-10; (e) SEM image JY1S-15-11, a near view of SEM image JY1S-15-10; (f) SEM image JY1S-27-06. The red rectangle indicates the location of the near view of SEM images; the yellow dashed curve indicates the ring belt rich of tiny small apatite.
Minerals 10 00137 g017
Figure 18. Examples of the nonporous kerogen without bio-mineral boundaries (OM VIII) from Longmaxi-Wufeng Shale, Sichuan Basin. (a) SEM image JY8S-3-16 (well ID-sample no.-image no.); (b) SEM image JY8S-5-35; (c) SEM image JY8S-10-21; (d) SEM image JY8S-3-17, a near view of OM in SEM image JY8S-5-35; (e) SEM image JY8S-10-22, a near view of OM on SEM image JY8S-10-21; (f) pore size distribution of OM-hosted pores determined by OM-hosted pore area; (g) pore size distribution of OM-hosted pores determined by pore amount. The red rectangle indicates the location of the near view of SEM images; the yellow curve indicates the boundary of OM-hosted pores.
Minerals 10 00137 g018
Figure 19. Examples of the amorphous kerogen rich of small bright minerals (OM IX) from Longmaxi-Wufeng Shale, Sichuan Basin. (a) SEM image JY8S-3-02 (well ID-sample no.-image no.); (b) SEM image JY8S-3-39; (c) SEM image JY8S-10-21; (d) SEM image JY8S-5-09; (e) SEM image JY8S-10-26; (f) SEM image JY1S-27-1; (g) SEM image JY8S-5-10, a near view of JY8S-5-09 with pores highlighted by yellow; (h) JY8S-10-27, a near view of JY8S-10-26 with pores highlighted by yellow; (i) pore size distribution of OM-hosted pores determined by pore area; (j) pore size distribution of OM-hosted pores determined by pore amount. The red rectangle indicates the location of the near view of SEM images. Organic pores in (g) and (h) were highlighted using yellow lines.
Minerals 10 00137 g019
Figure 20. Examples of the amorphous kerogen enriched with mica and/or monocyrstal clay mineral as well as bio-quartz and bright minerals (OM X) from Longmaxi-Wufeng Shale, Sichuan Basin. (a) SEM image JY1S-9-20 (well ID-sample no.-image no.); (b) SEM image JY1S-9-23; (c) SEM image JY1S-9-21 with pores highlighted by yellow; (d) SEM image JY8S-5-26; (e) SEM image JY8S-5-27 with pores highlighted by yellow; (f) pore size distribution of OM-hosted pores determined by pore area; and (g) pore size distribution of OM-hosted pores determined by pore amount.
Minerals 10 00137 g020
Figure 21. The organic porosity determined using SEM images of OMs and their average of five shale samples from Longmaxi-Wufeng Shale, Eastern Sichuan Basin. The black line indicates the average of organic porosity of the five shale samples; the histogram for an individual well has the same color.
Minerals 10 00137 g021
Table 1. SEM Images of Longmaxi-Wufeng Shale of Core Samples from Wells JY1 and JY8.
Sample IDFormationBurial Depth (m)Test #1Test #2
Image AmountImaging MethodImage AmountImaging Method
JY1S-1Longmaxi Shale2330.4619SEM imaging by JSM-6700F NT SEM using backscatter electron;

Tested in 2012 by Institute of Process Engineering, China Academy of Sciences
-SEM imaging by Helios Nanolab 600i SEM using backscatter electron;

Tested in 2015 by Harbin Institute of Technology
JY1S-2Longmaxi Shale2335.3019-
JY1S-3Longmaxi Shale2340.8221-
JY1S-4Longmaxi Shale2346.5020-
JY1S-5Longmaxi Shale2352.8917-
JY1S-6Longmaxi Shale2359.9821-
JY1S-7Longmaxi Shale2366.7416-
JY1S-8Longmaxi Shale2376.0525-
JY1S-9Longmaxi Shale2381.912740
JY1S-10Longmaxi Shale2385.4221-
JY1S-11Longmaxi Shale2391.9519-
JY1S-12Longmaxi Shale2397.1320-
JY1S-13Longmaxi Shale2402.5519-
JY1S-14Longmaxi Shale2406.1619-
JY1S-15Wufeng Shale2411.051940
JY1S-16Wufeng Shale2414.8824-
JY8S-3Longmaxi Shale2600–2800-41
JY8S-5Longmaxi Shale2600–2800-40
JY8S-10Longmaxi Shale2600–2800-40