The Influence of Hydrothermal Fluids on the REY-Rich Deep-Sea Sediments in the Yupanqui Basin, Eastern South Pacific Ocean: Constraints from Bulk Sediment Geochemistry and Mineralogical Characteristics

 , ,
, , 
Abstract
1. Introduction
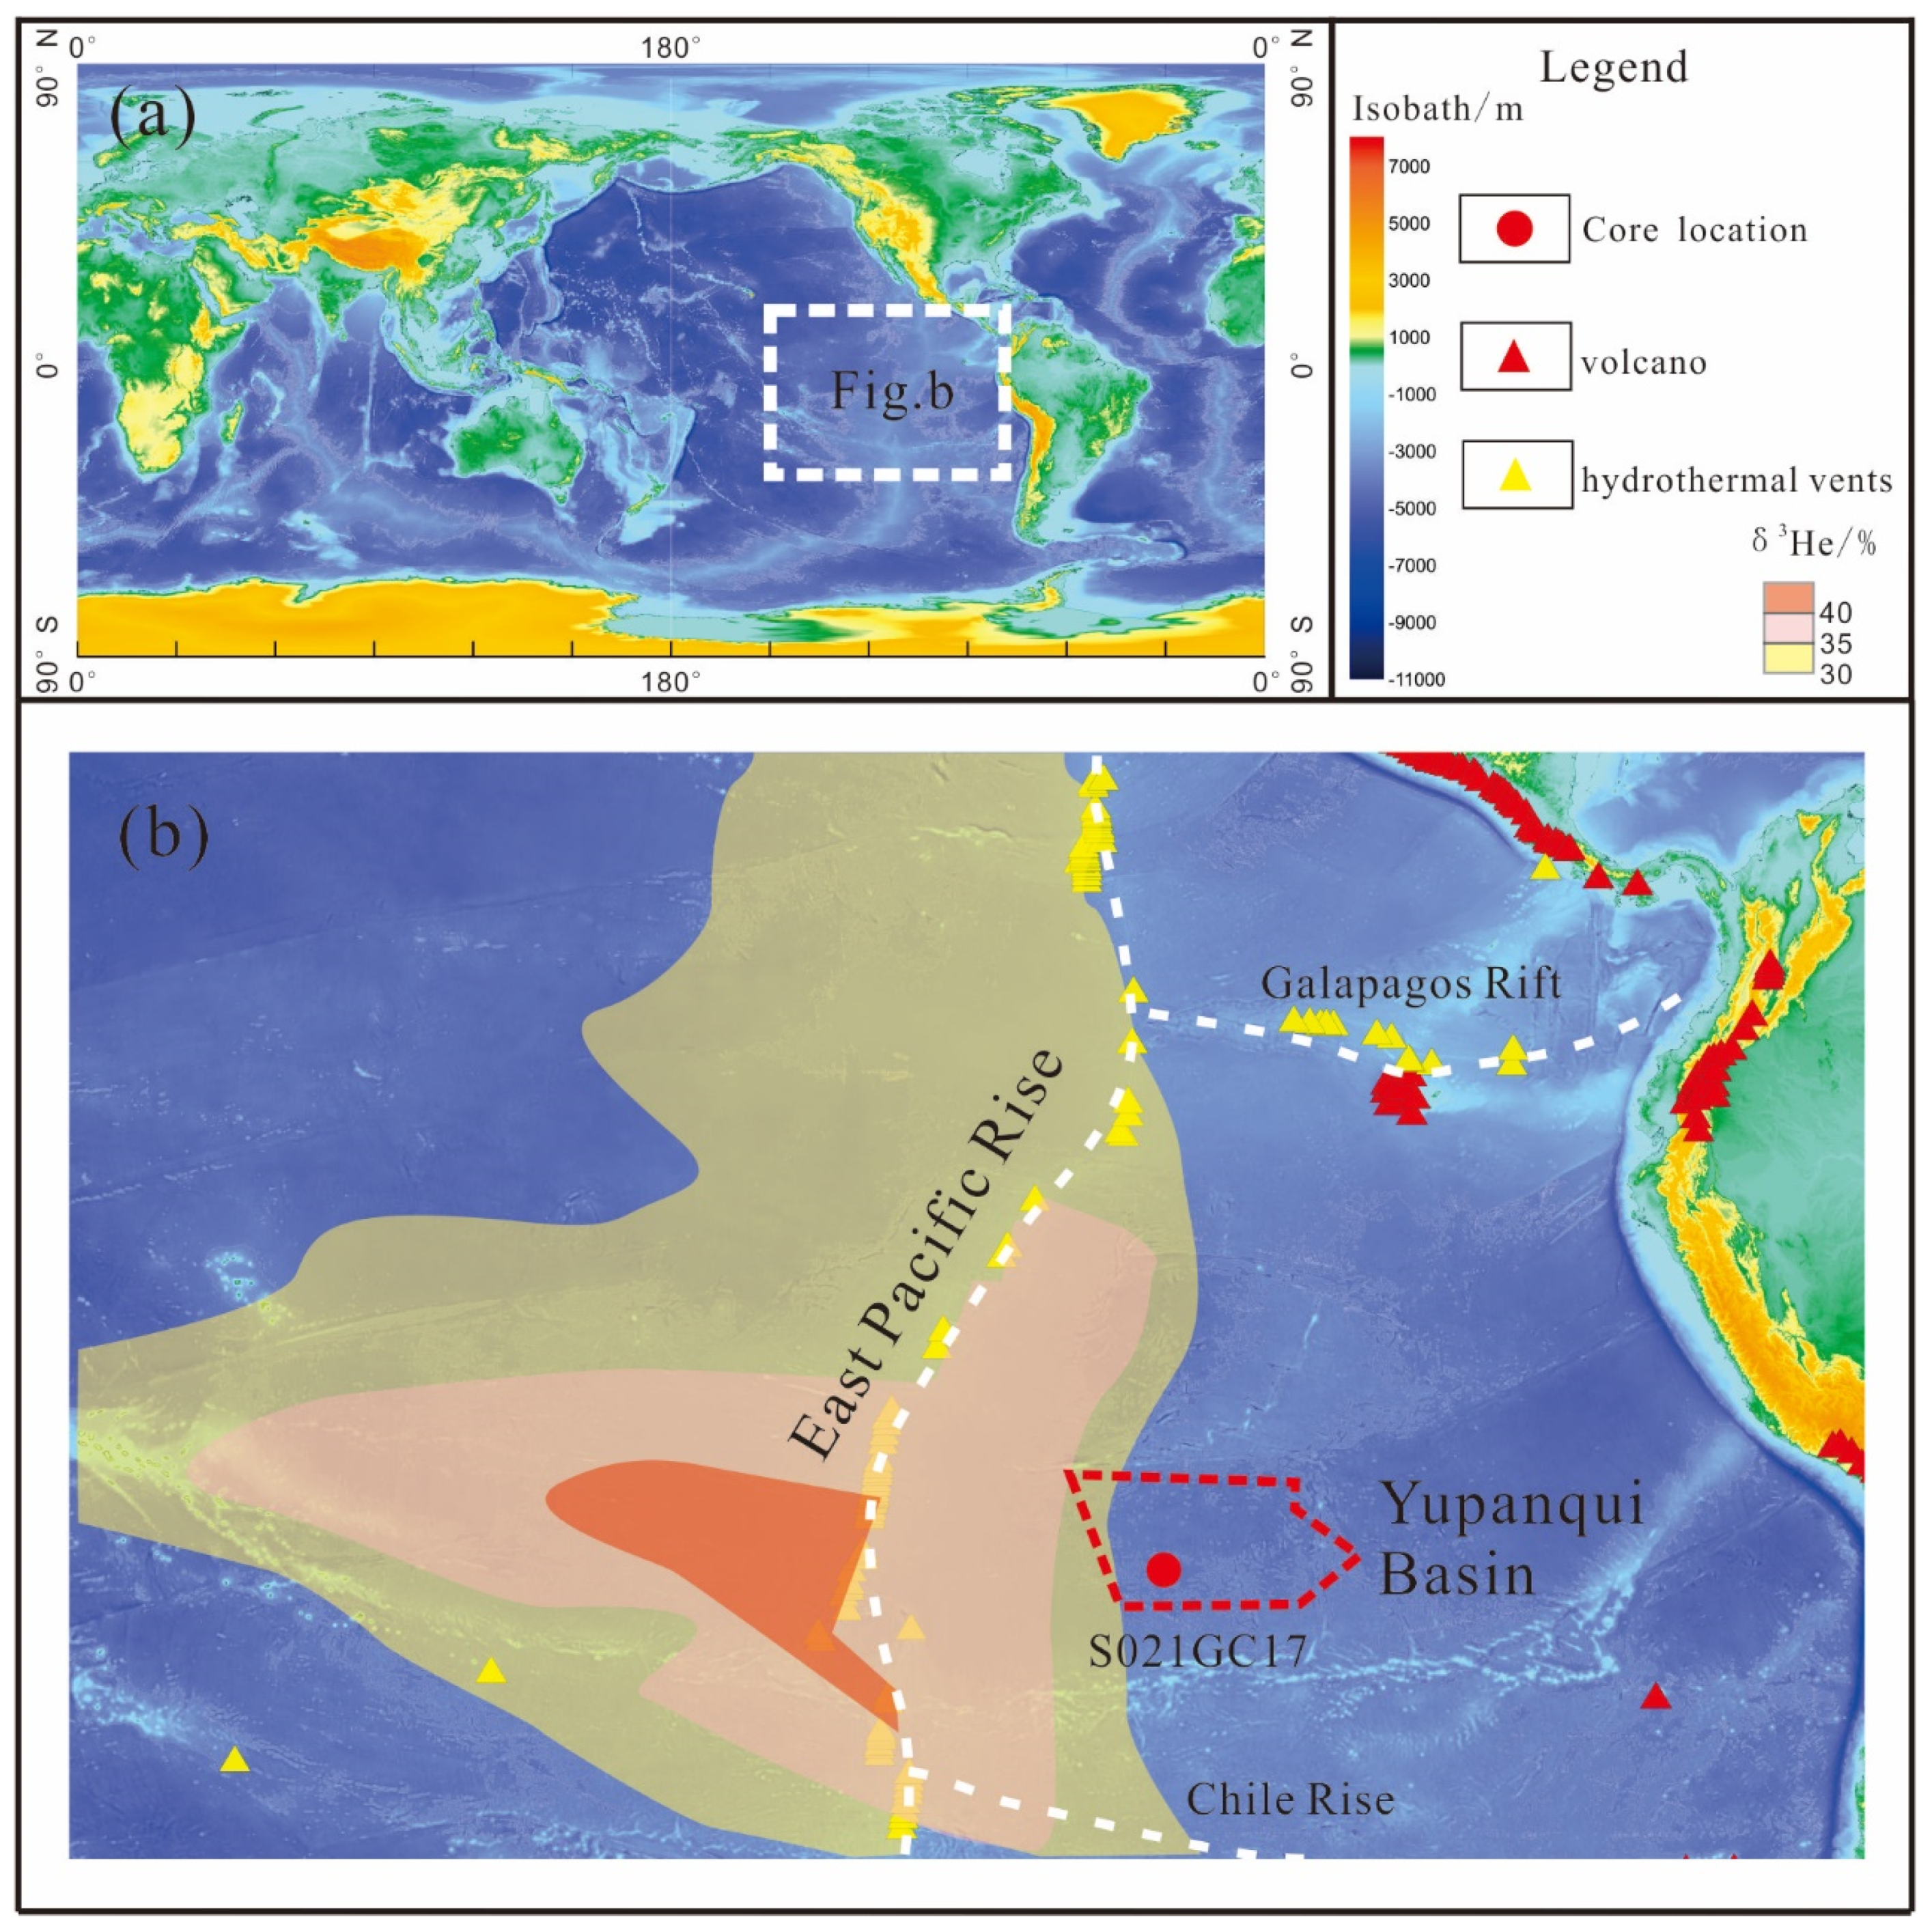
2. Regional Geology
3. Samples and Analytical Methods
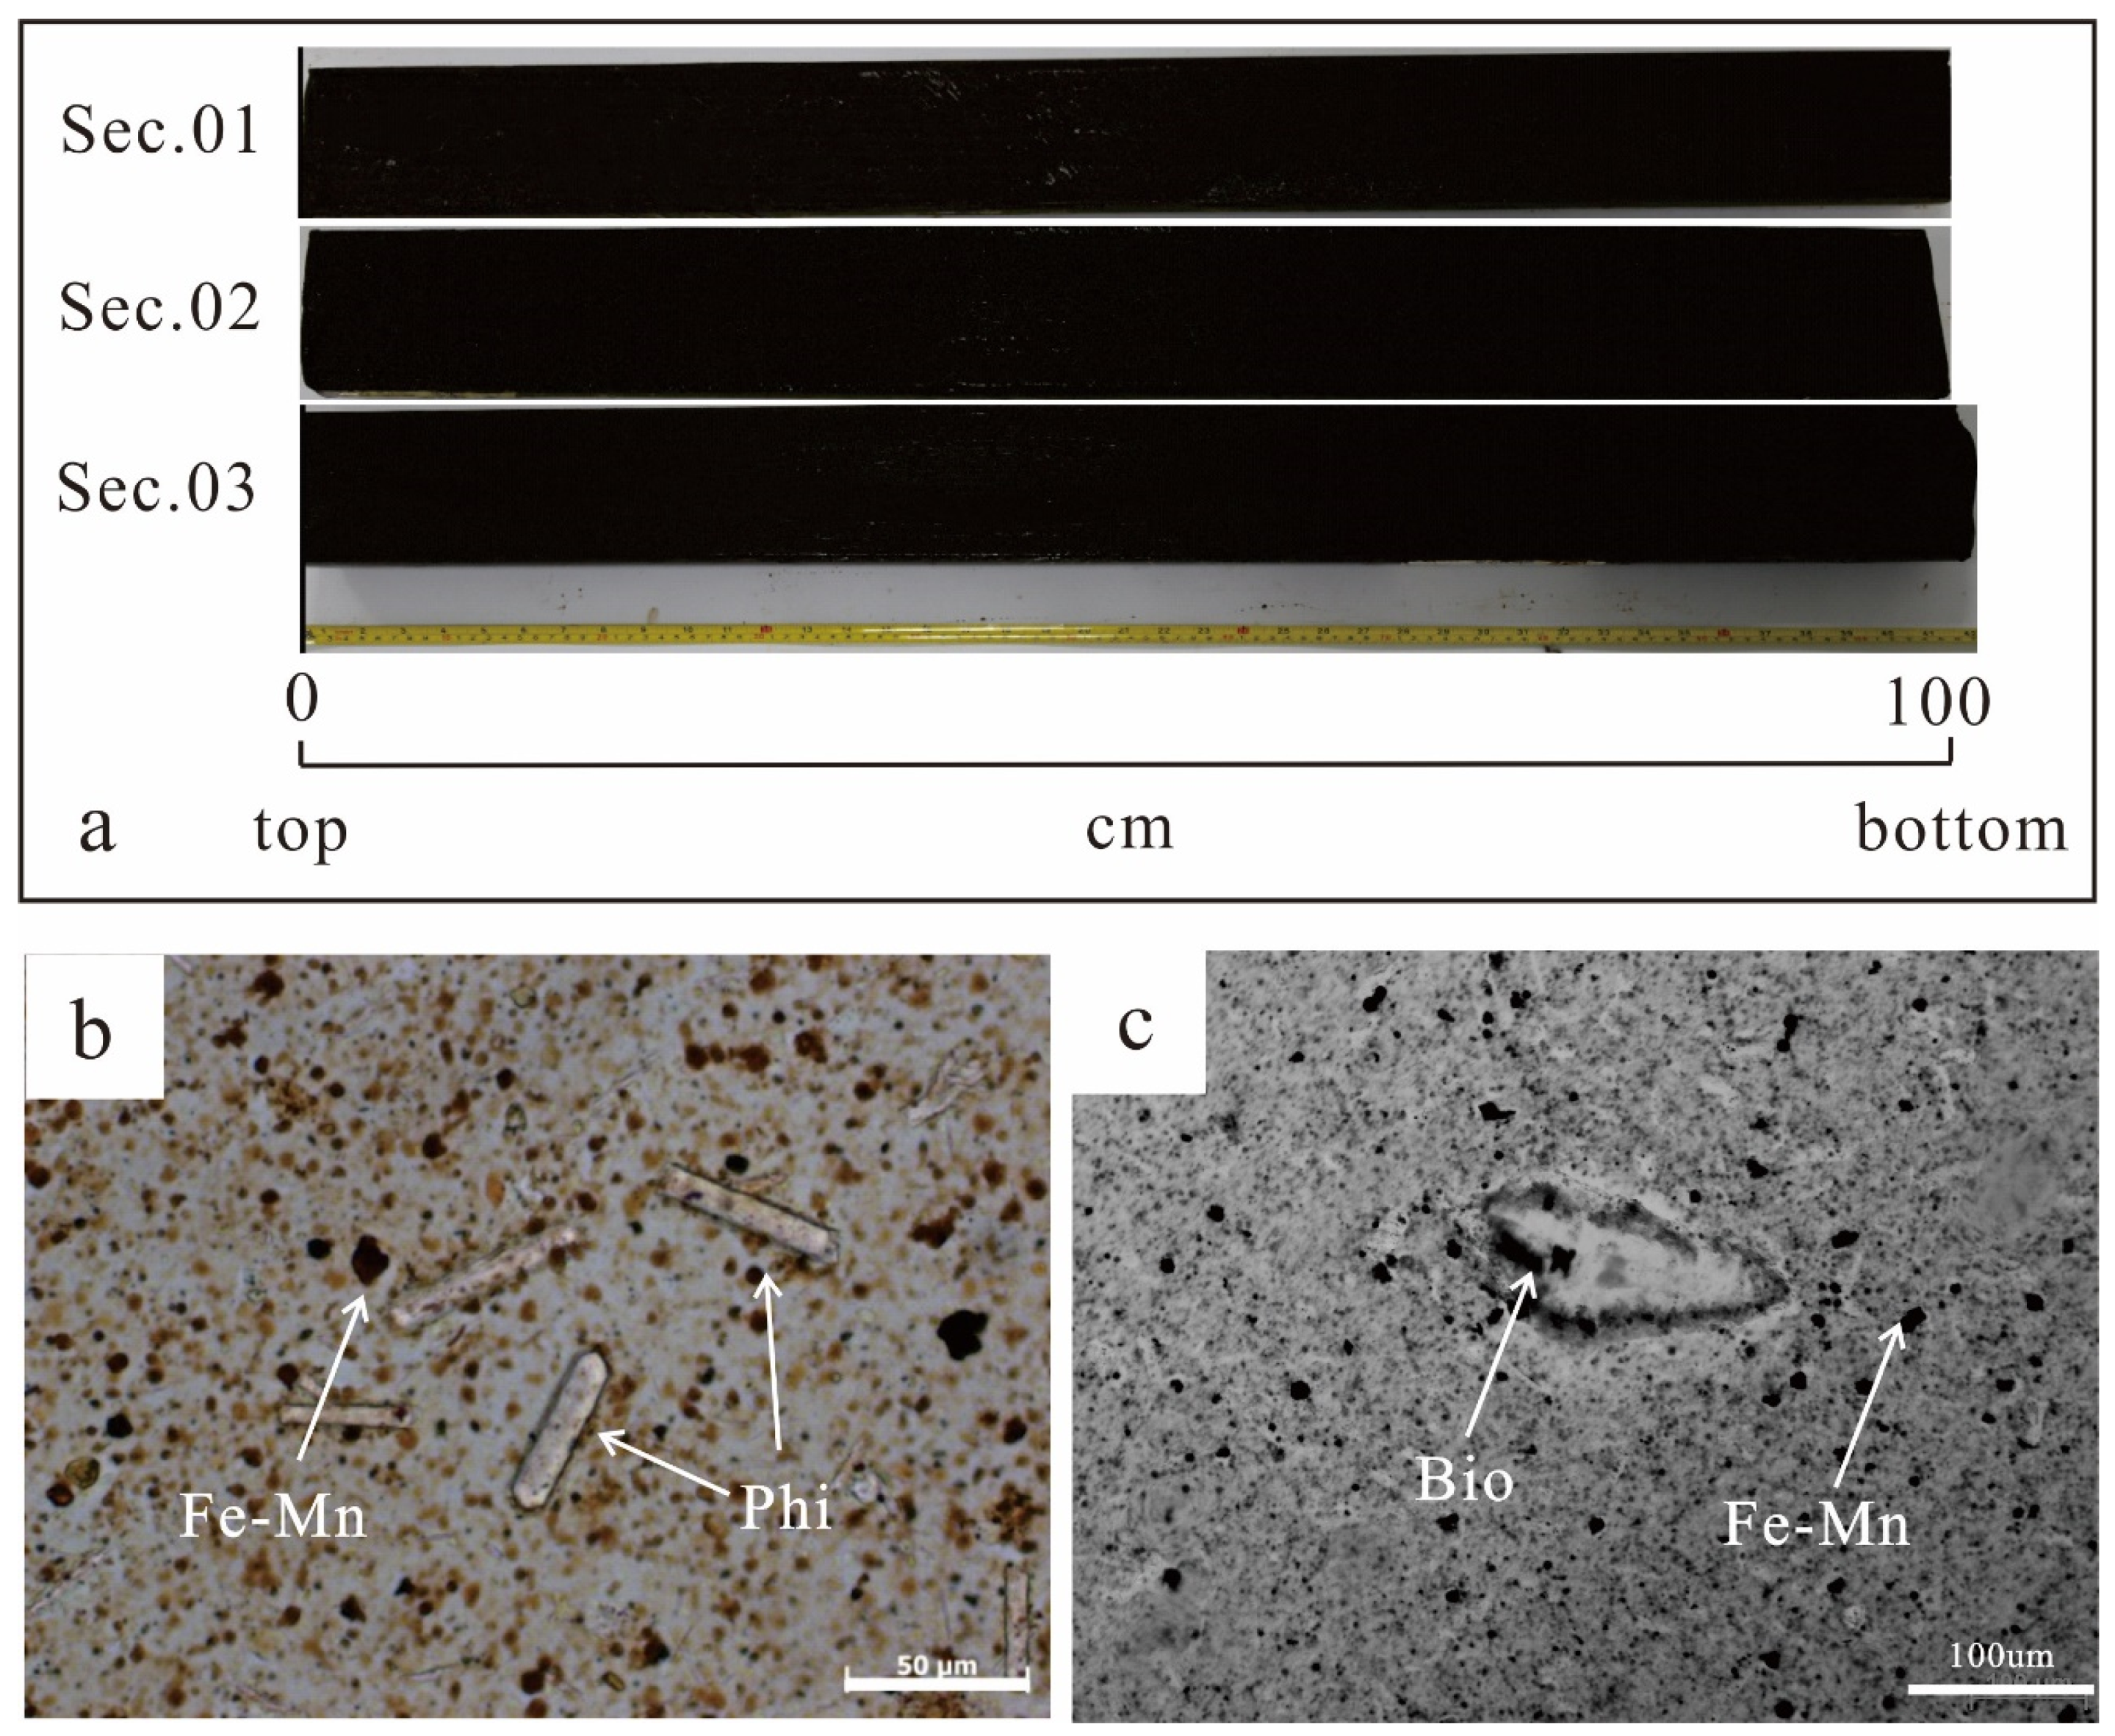
3.1. Lithological Characteristics
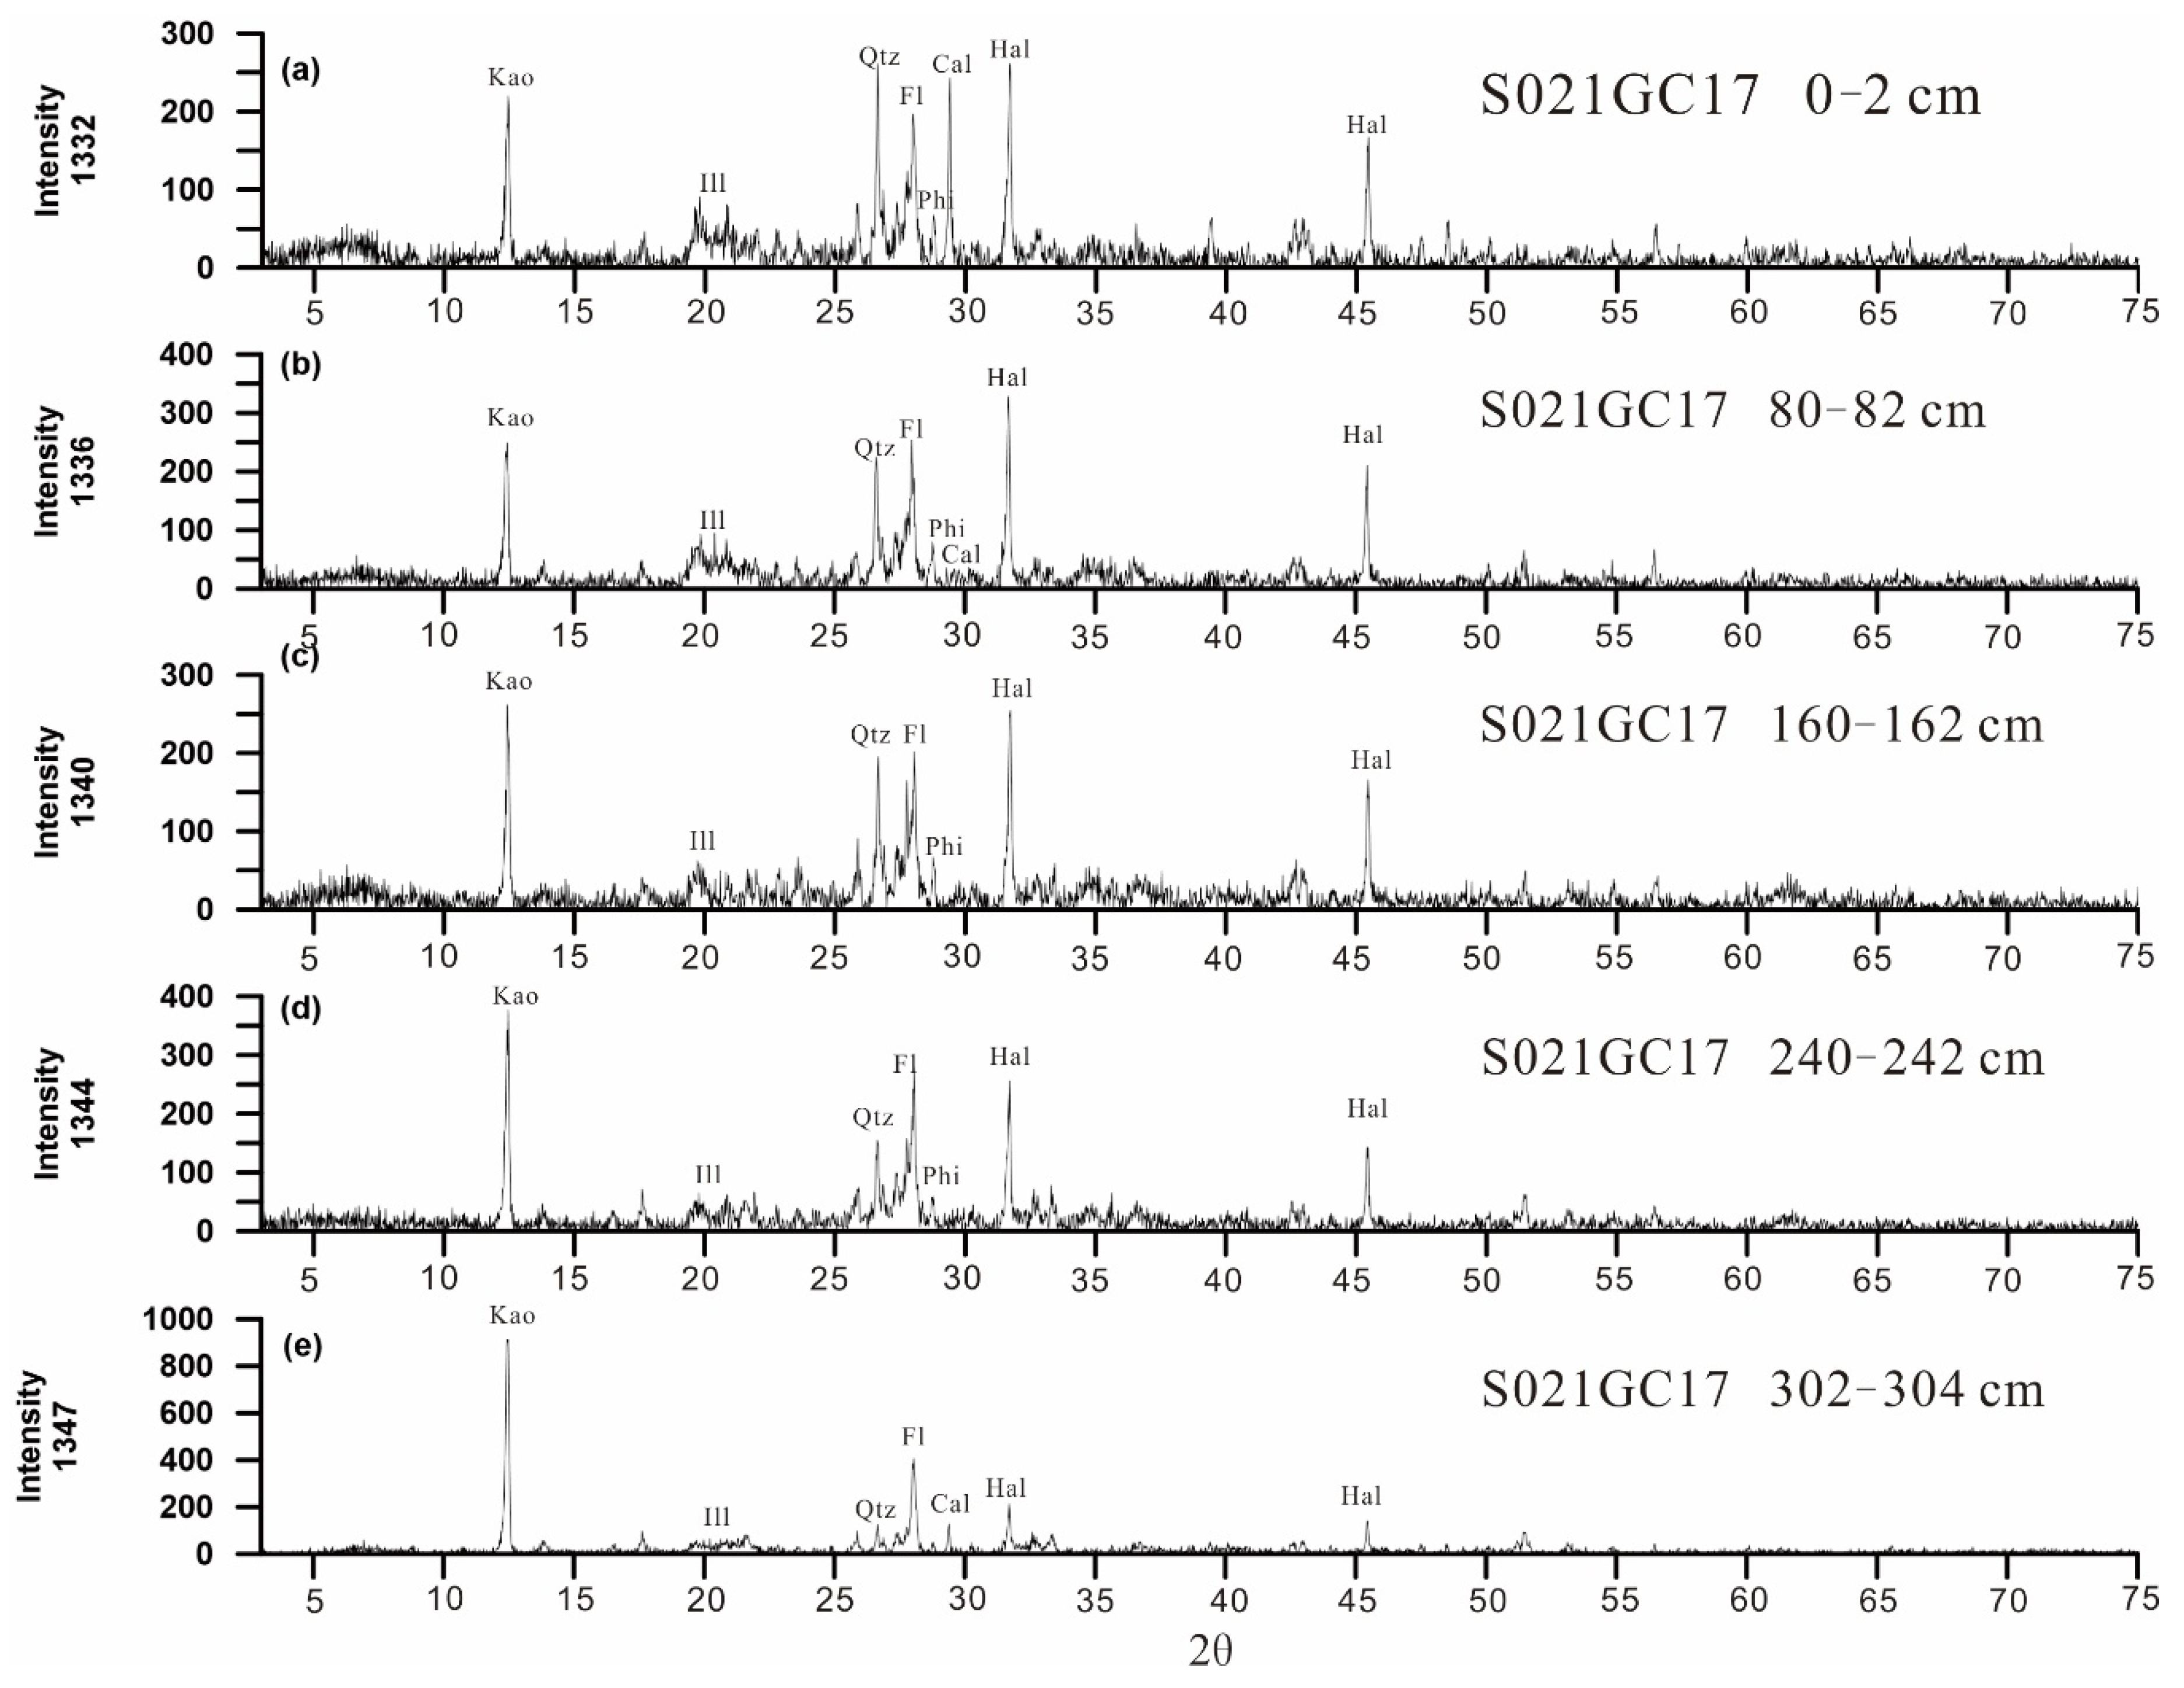
3.2. Bulk Sediment X-ray Diffraction (XRD)
3.3. Bulk Sediment Major-Trace Element Analyses
3.4. Bulk Sediment Sr-Nd Isotopes
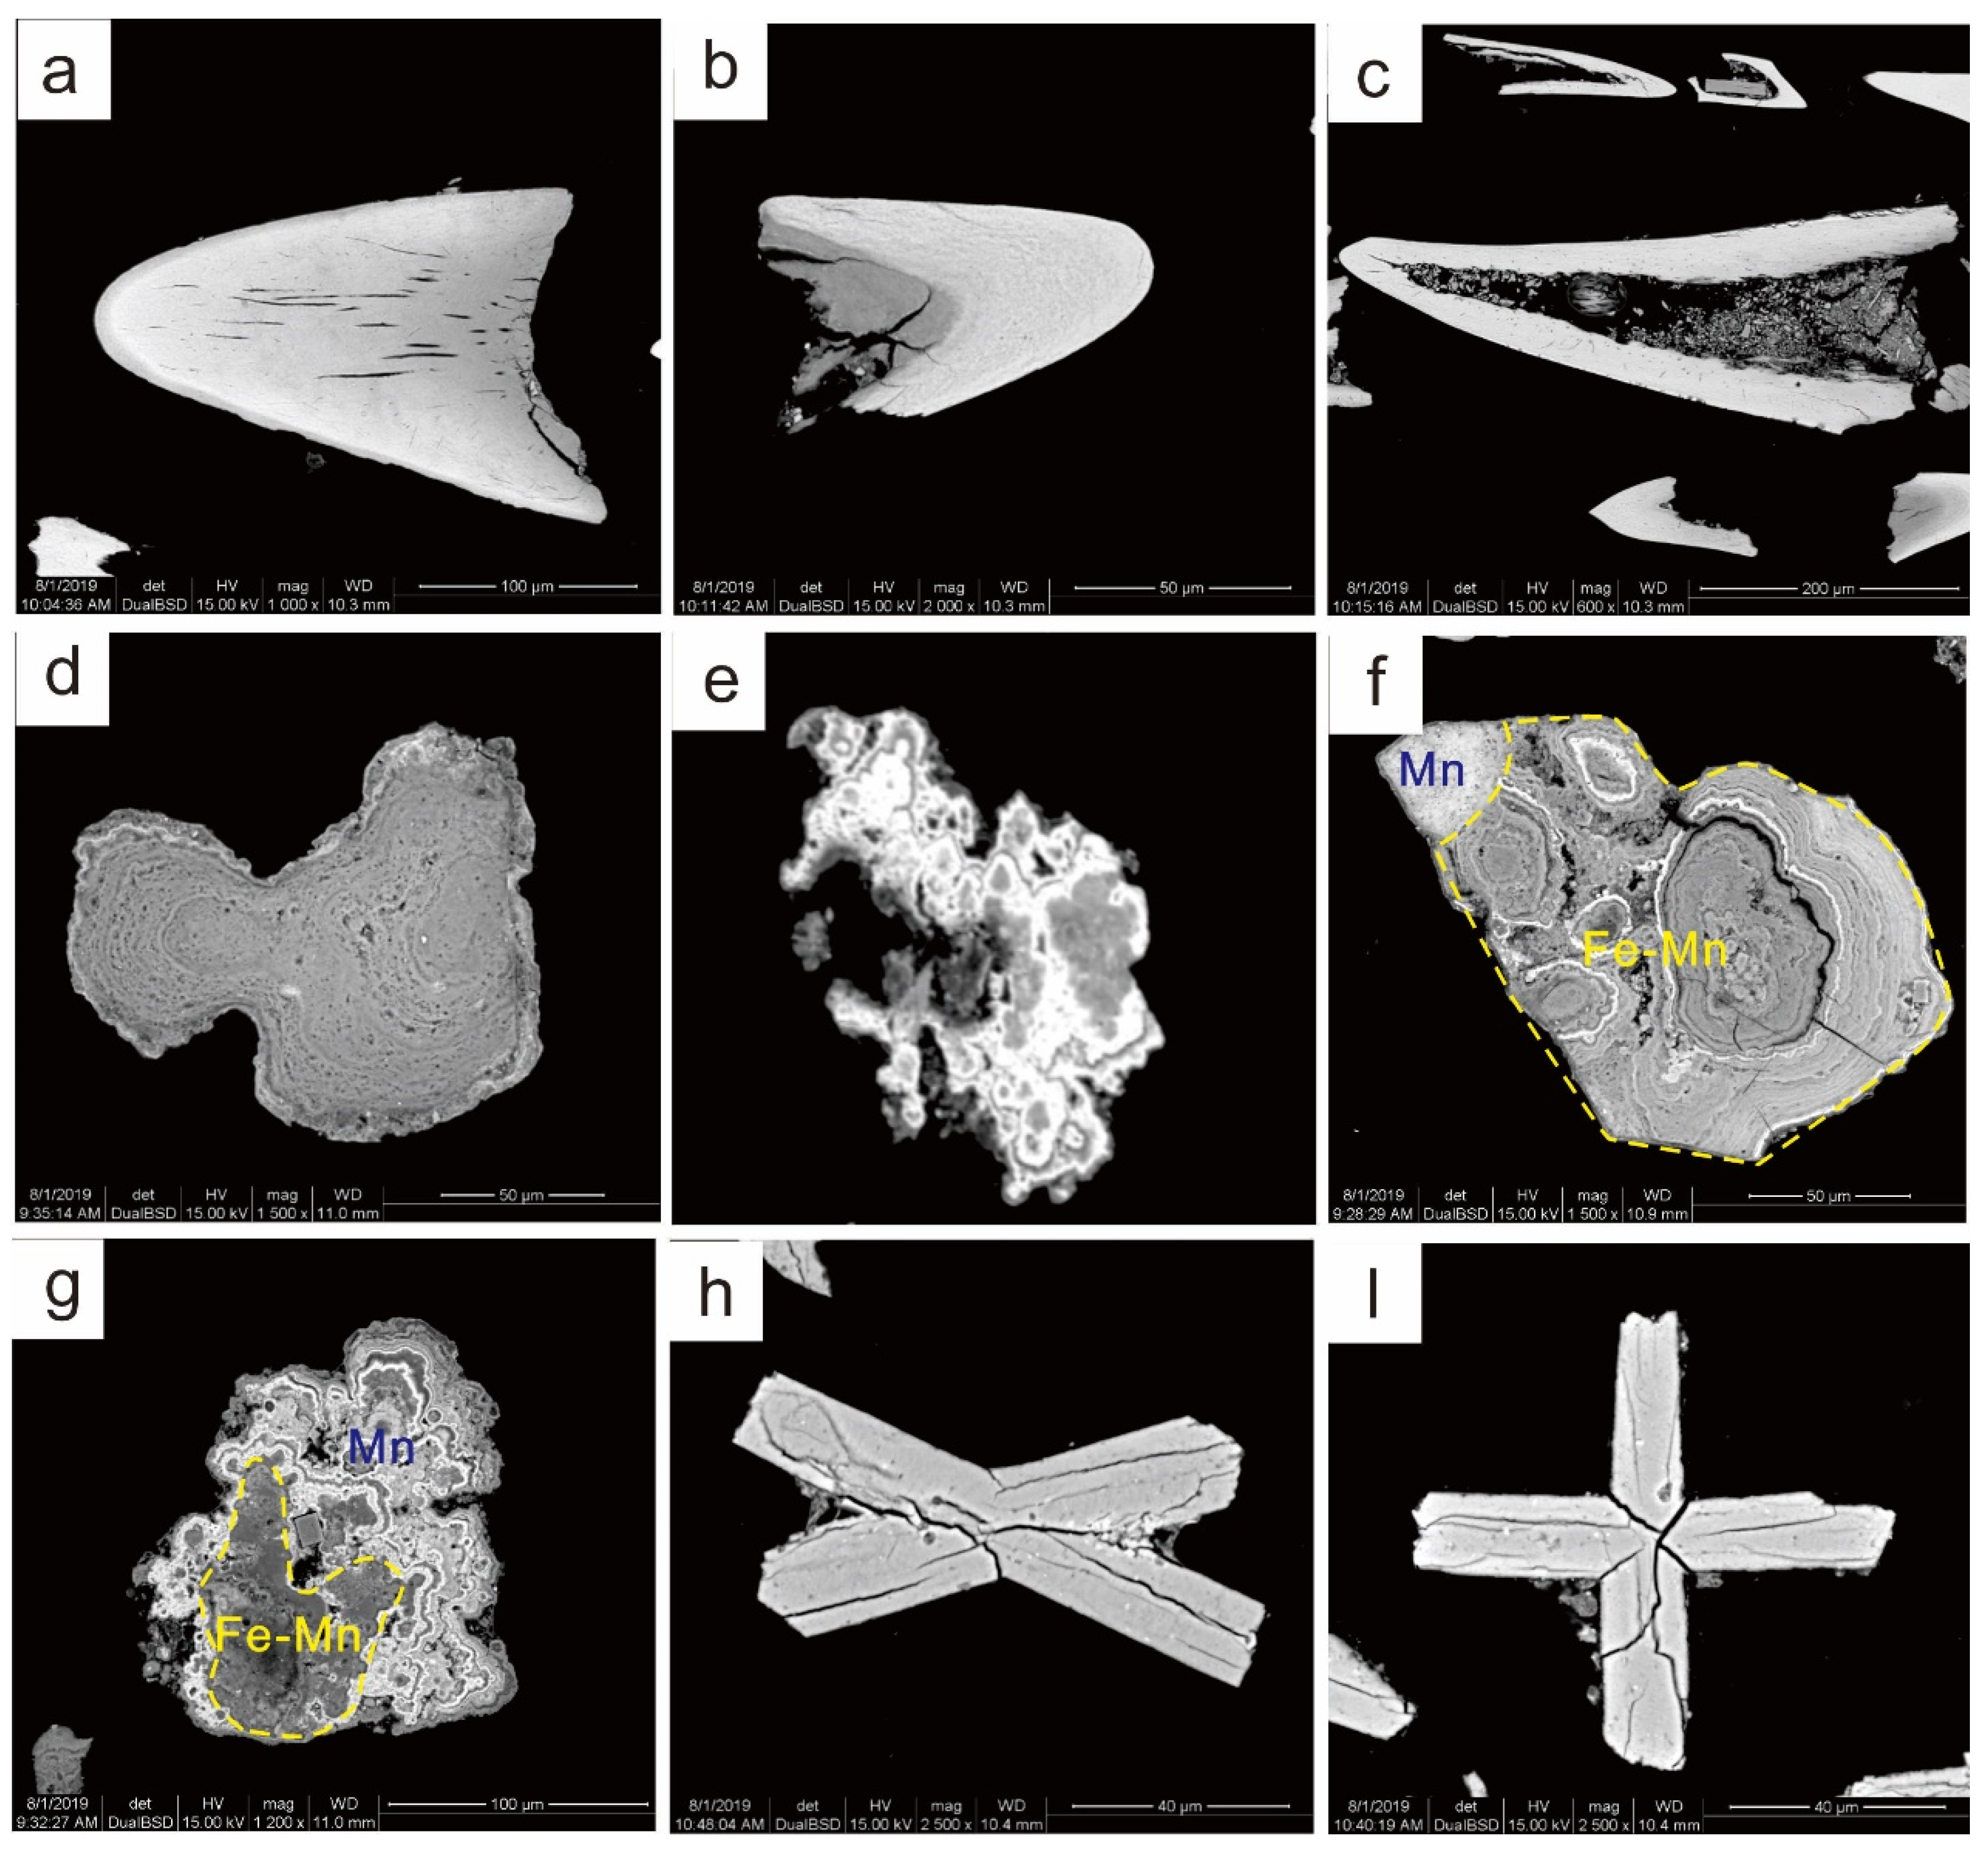
3.5. EMPA Major-Element Analyses
3.6. LA-ICP-MS REY and Trace Element Analyses
3.7. LA-MC-ICP-MS Sr-Nd Isotope Analyses
4. Results
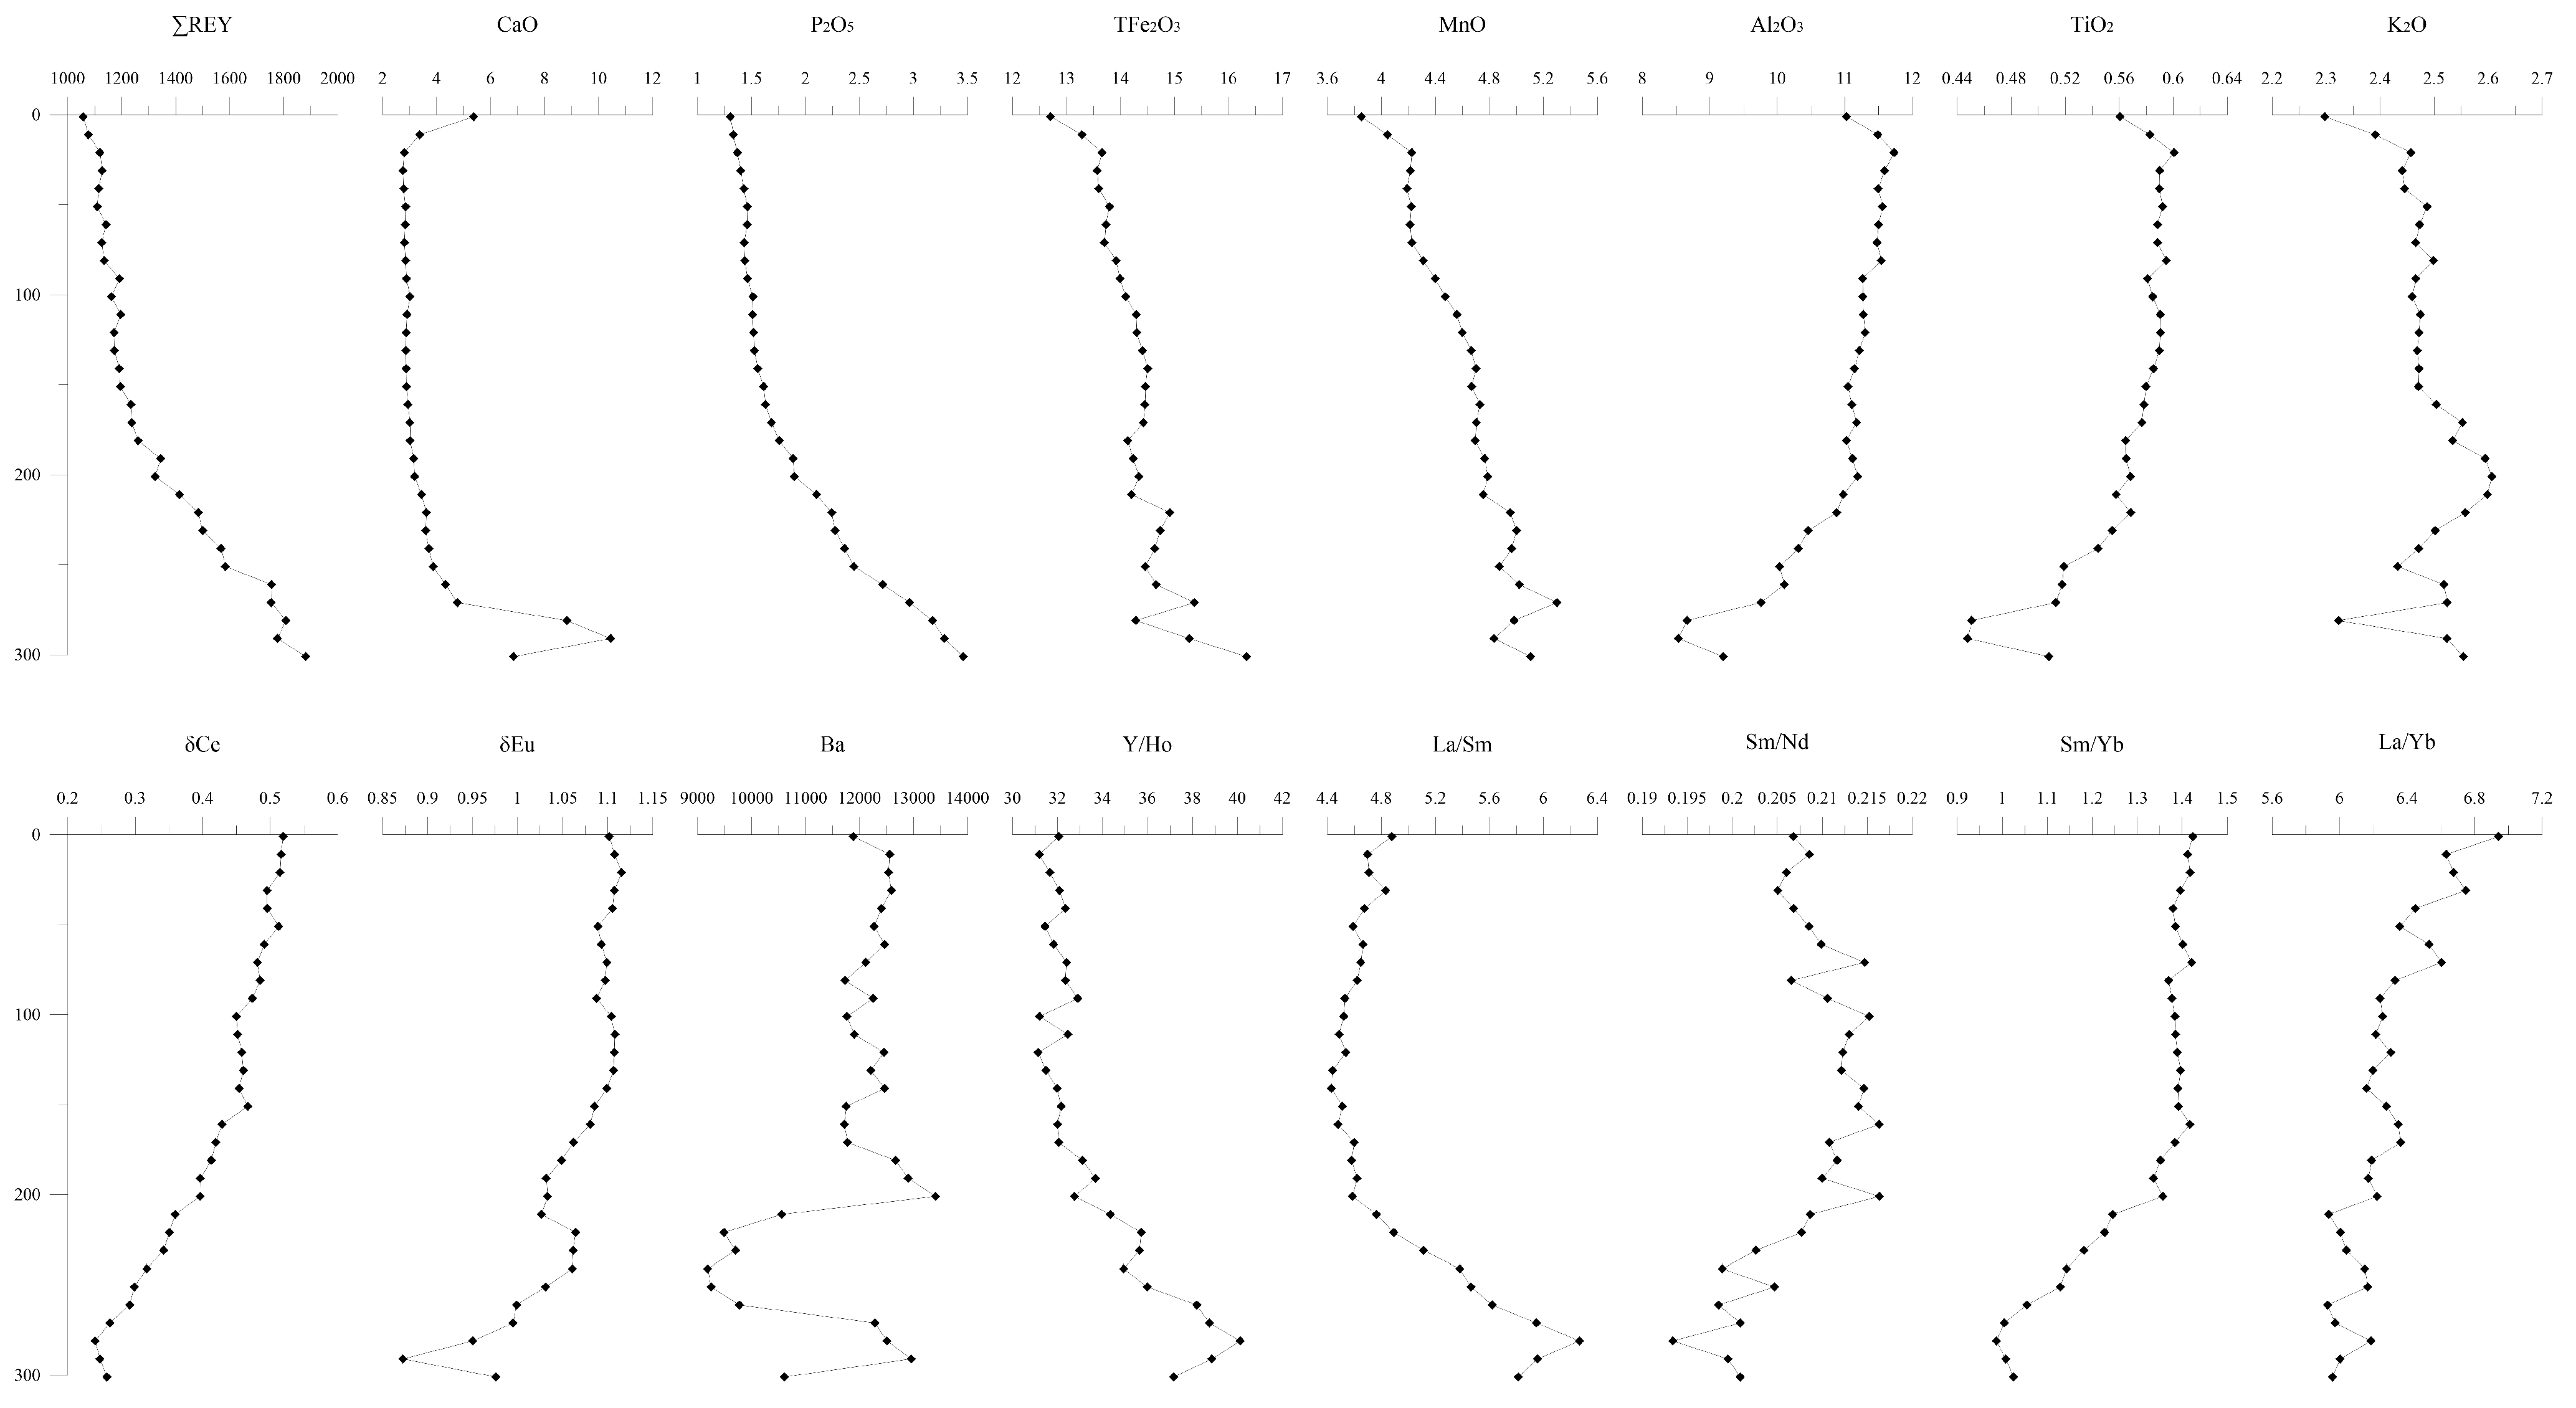
4.1. Bulk Sediment Major and Trace Element Analyses
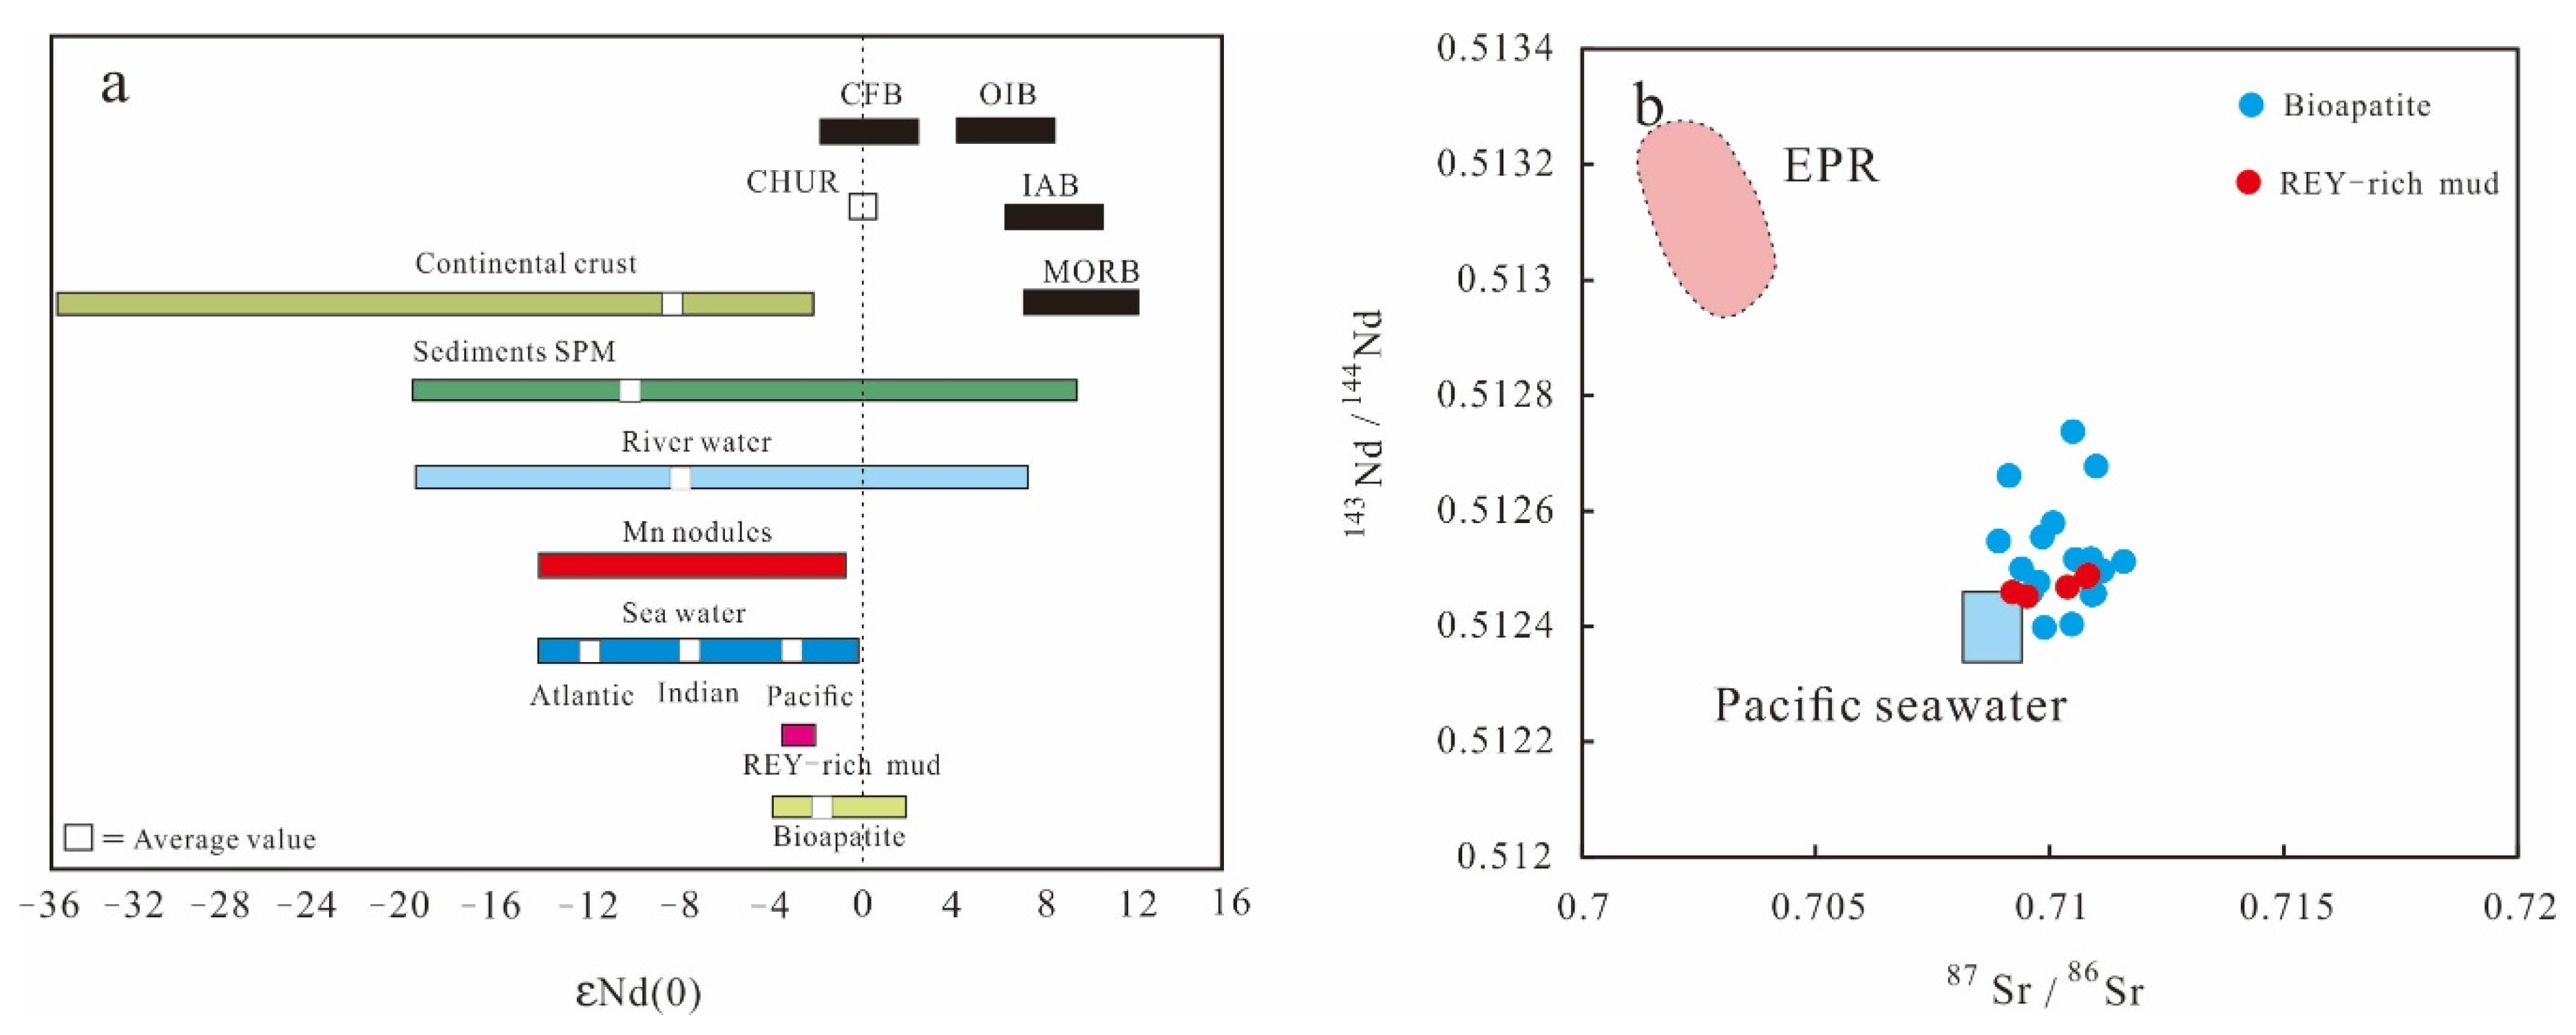
4.2. Bulk Sediment Sr-Nd Isotope Compositions
4.3. EMPA and LA-ICP-MS Major and Trace Element Analyses
4.4. Bioapatite LA-MC-ICP-MS Sr-Nd Isotope Compositions
5. Discussion
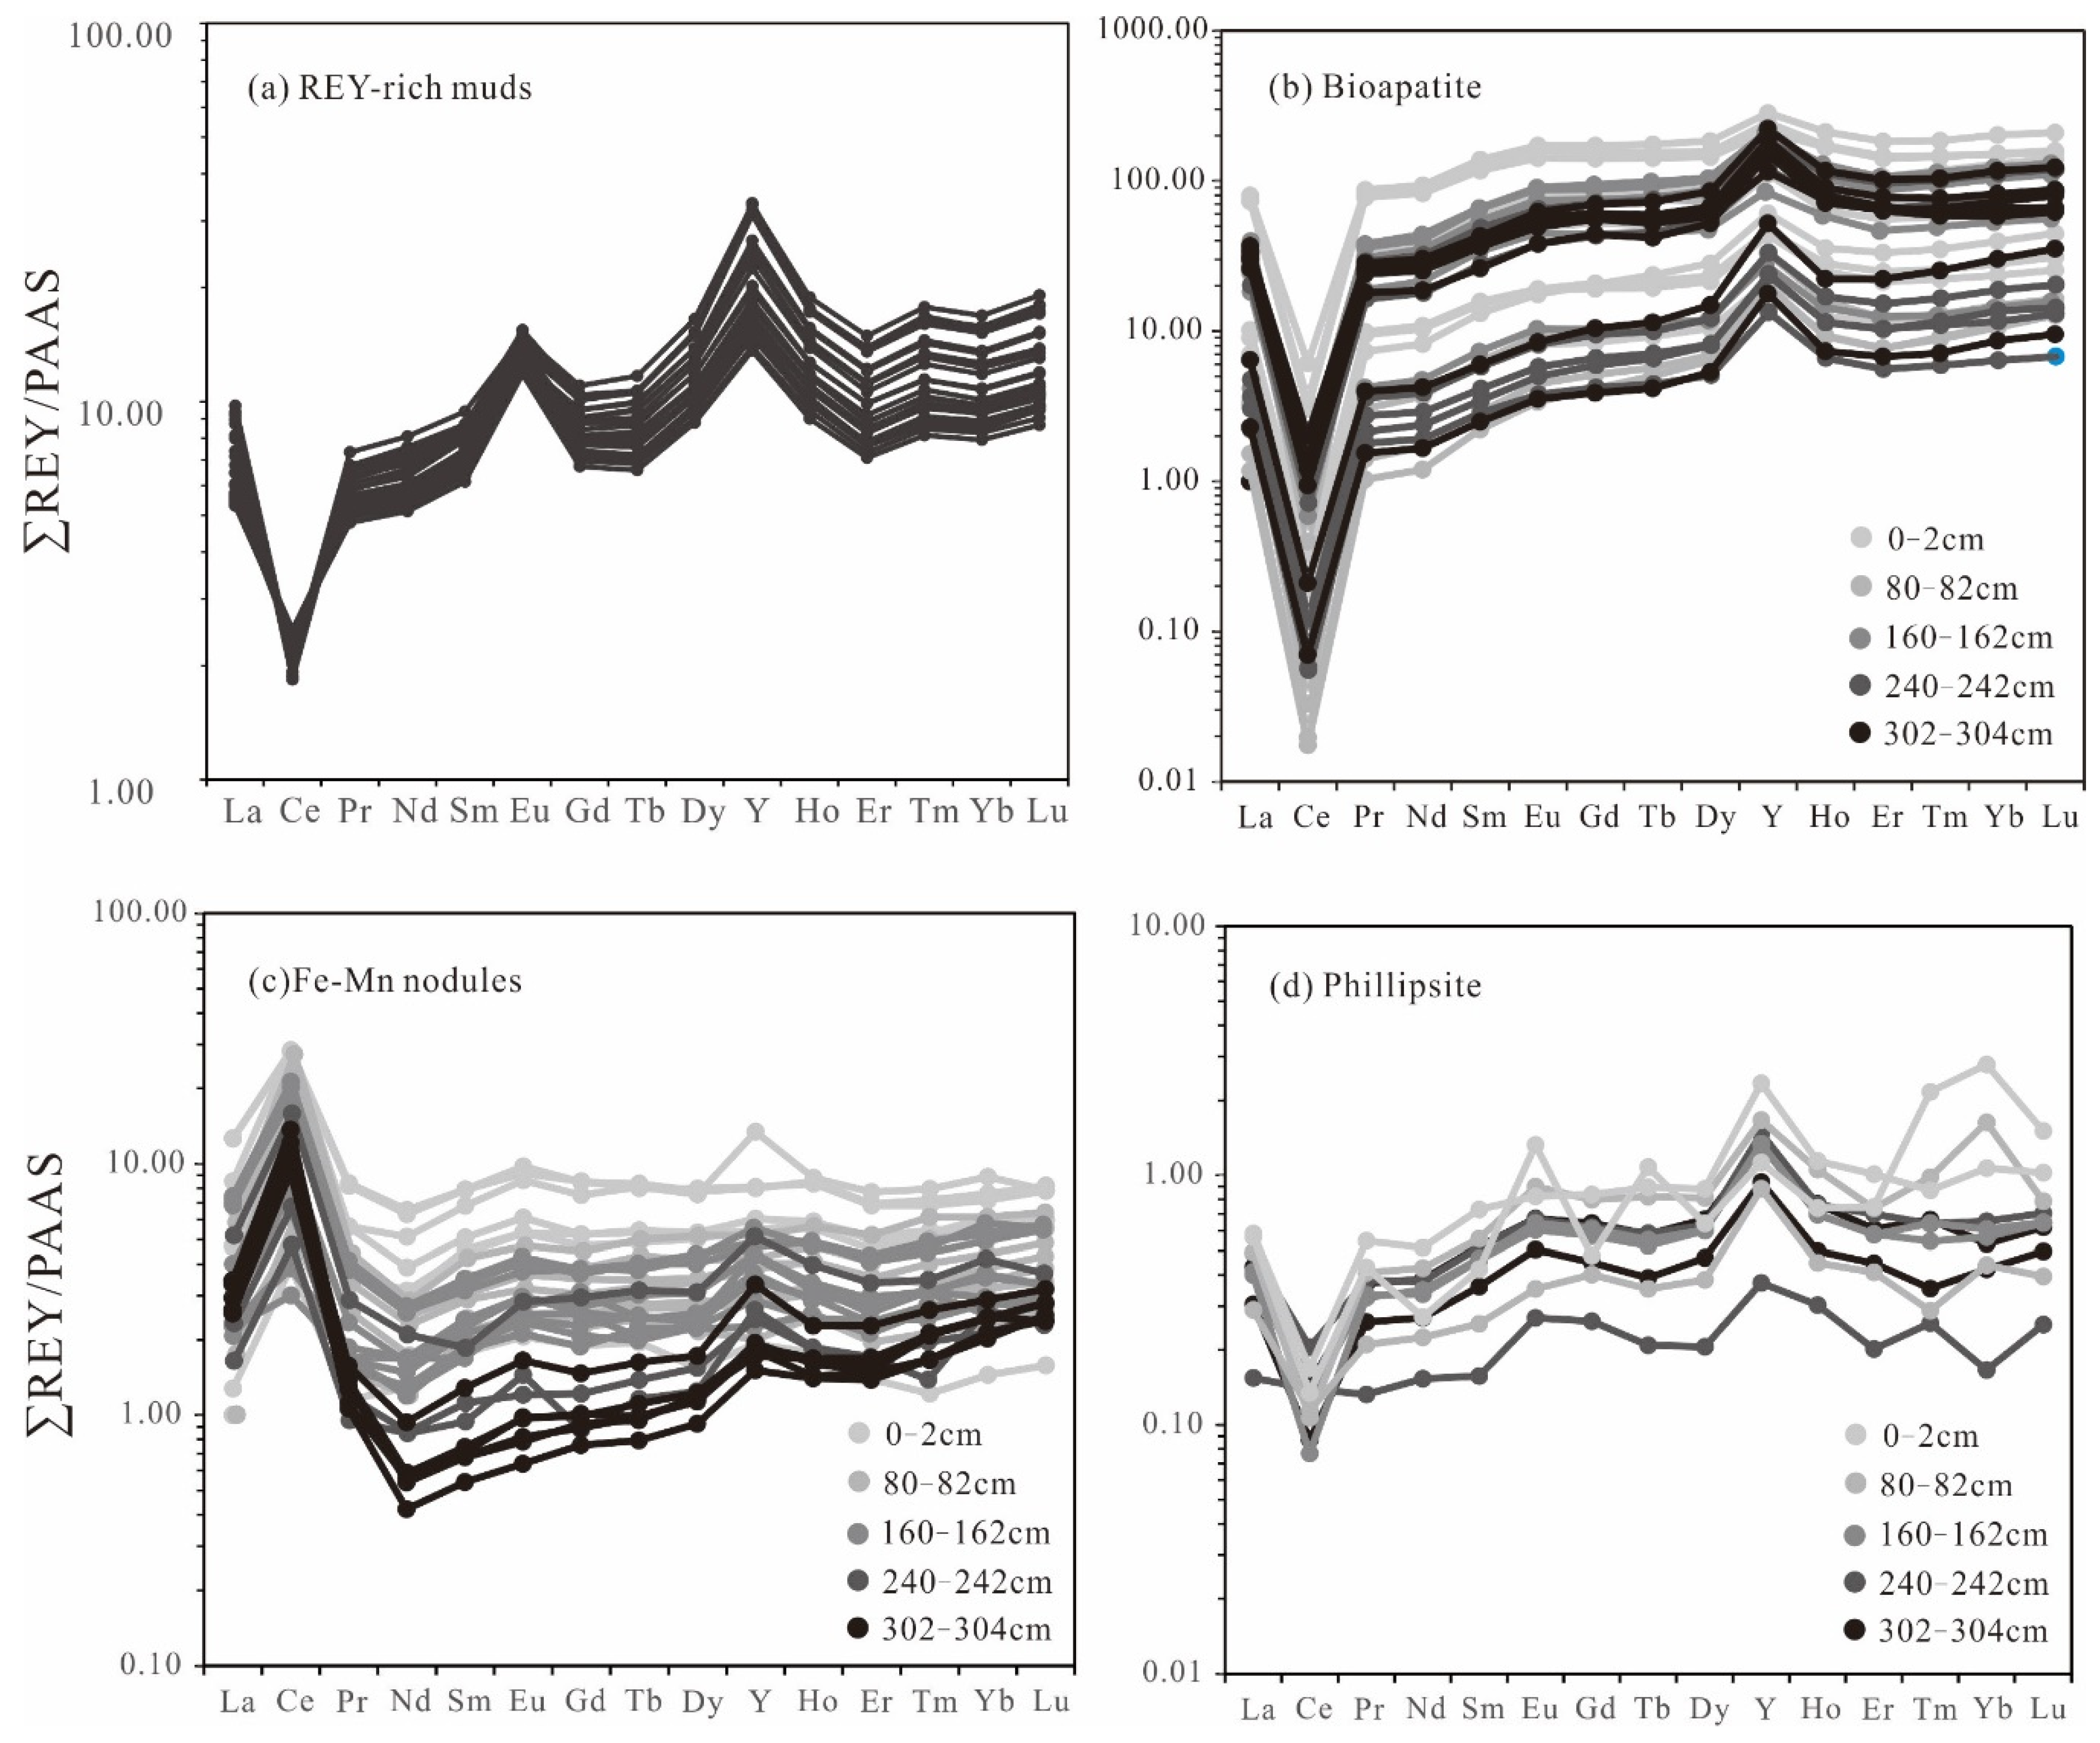
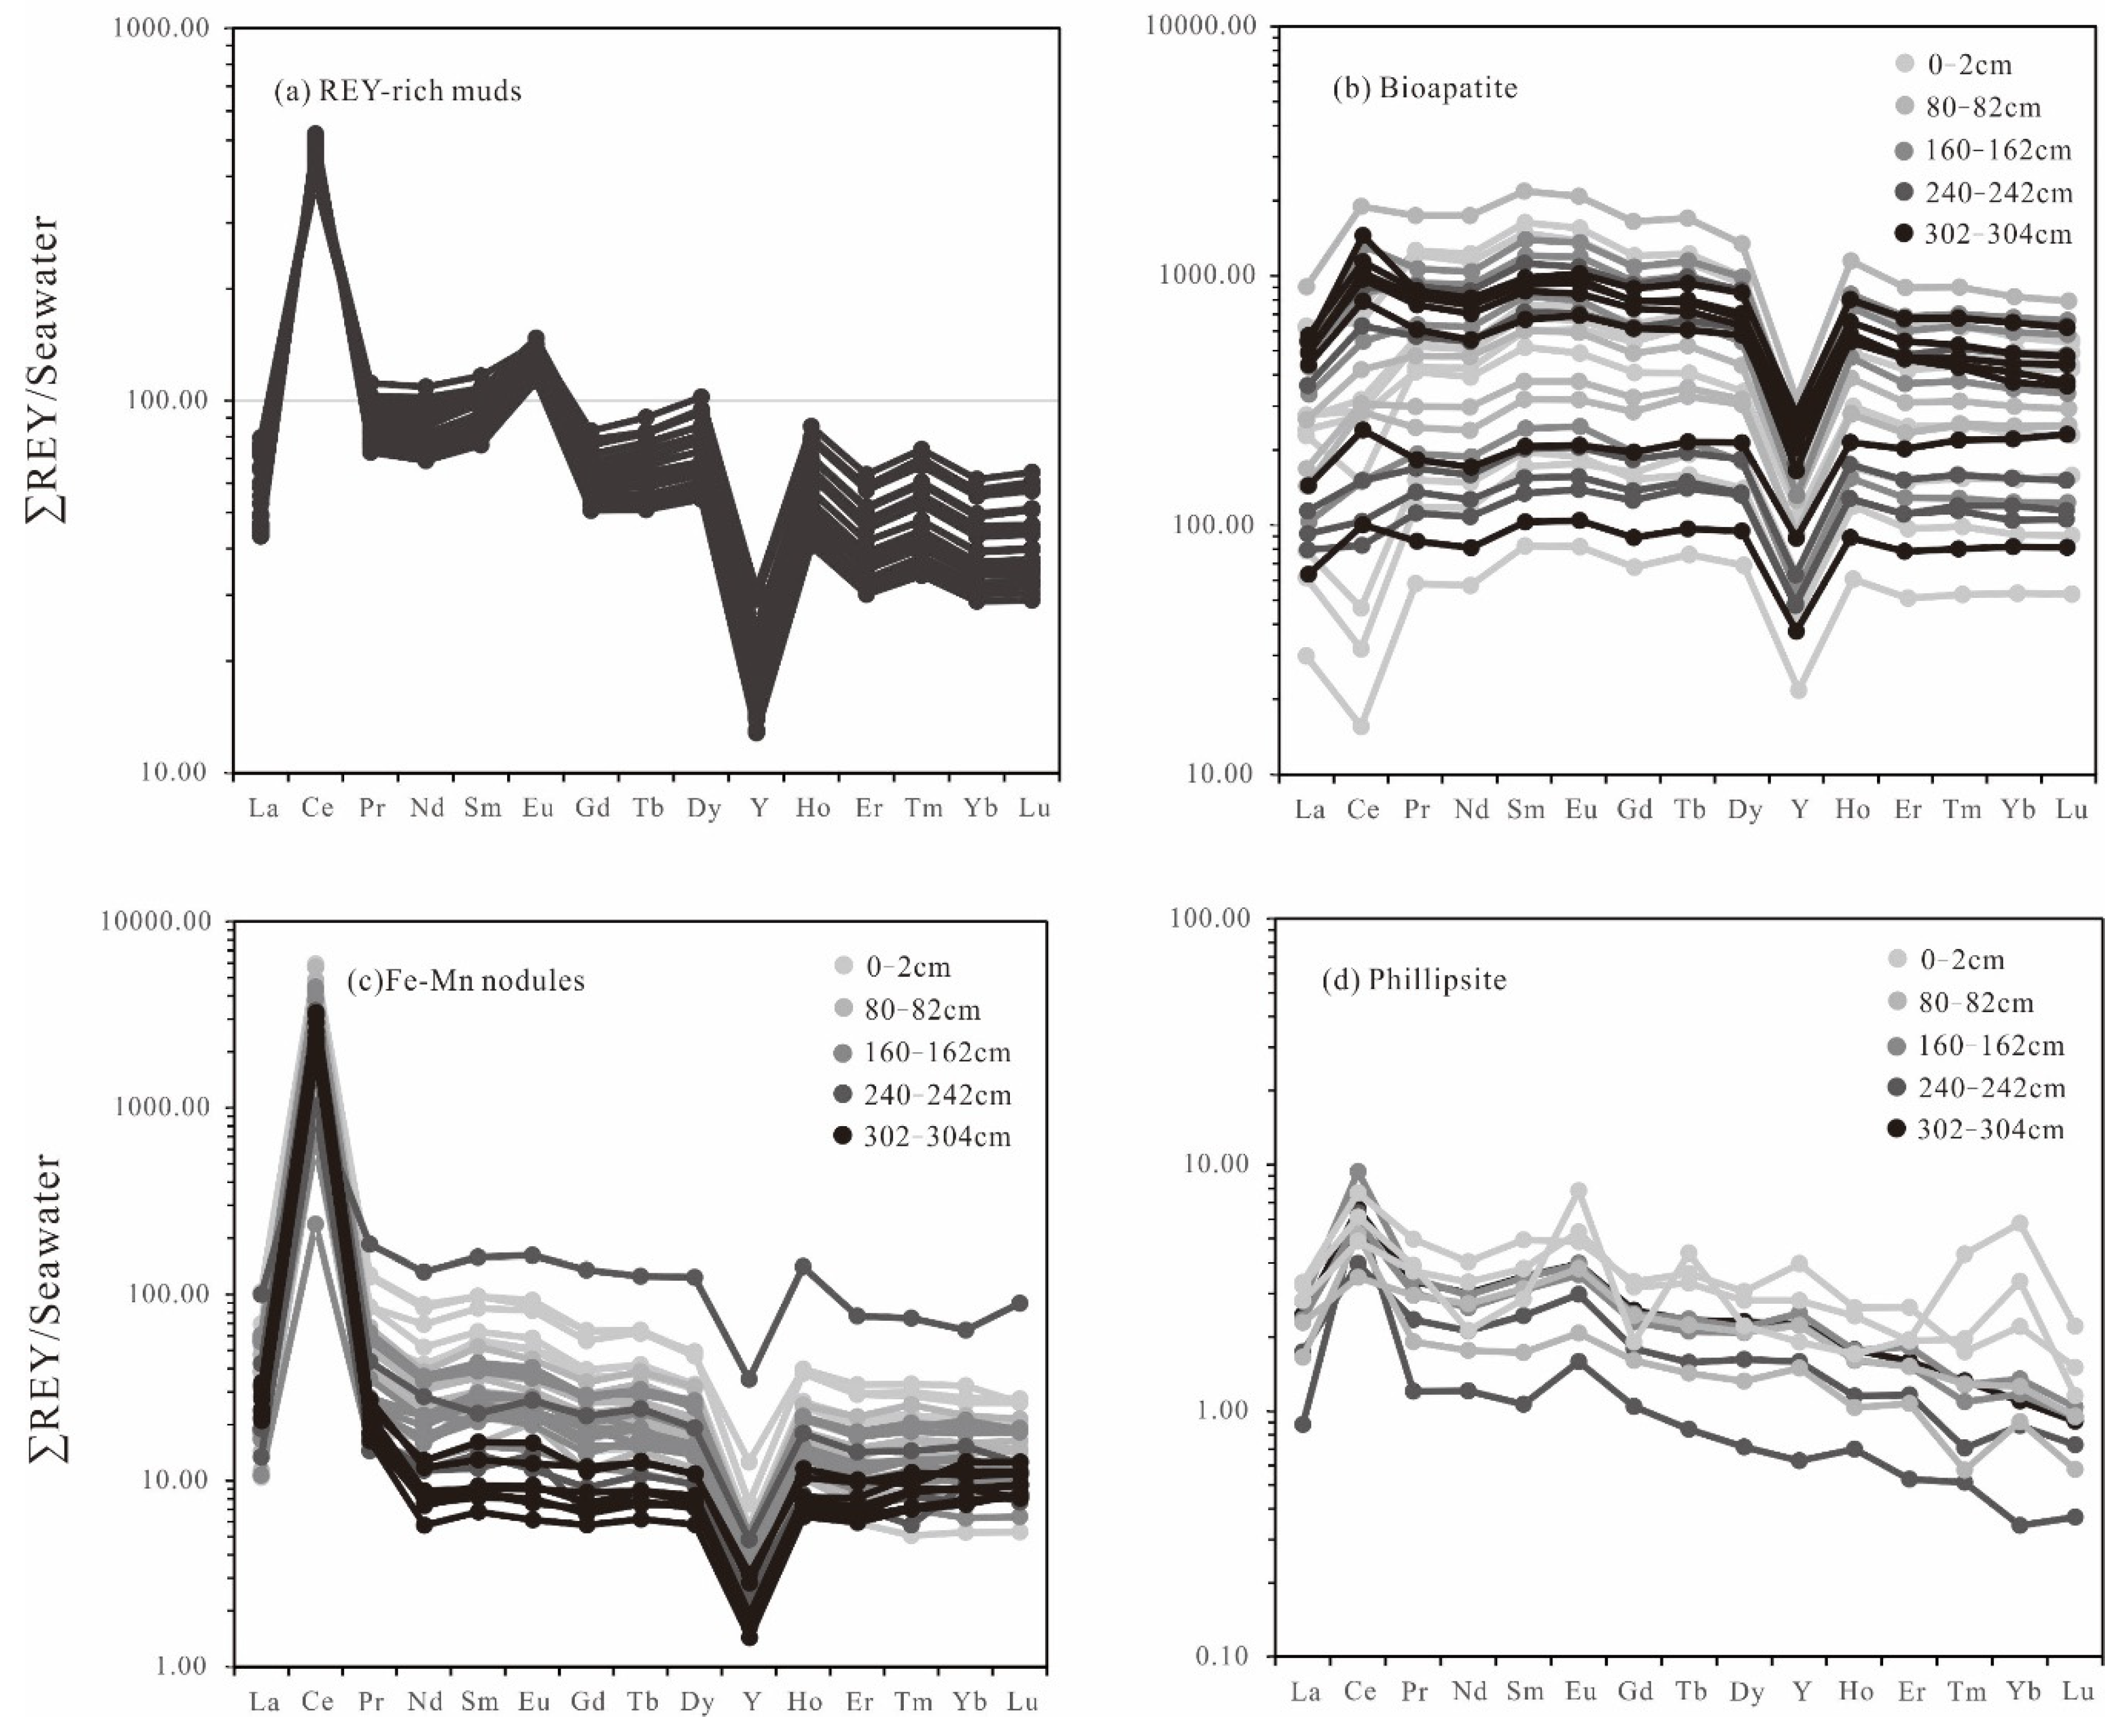
5.1. Main Carriers of REY
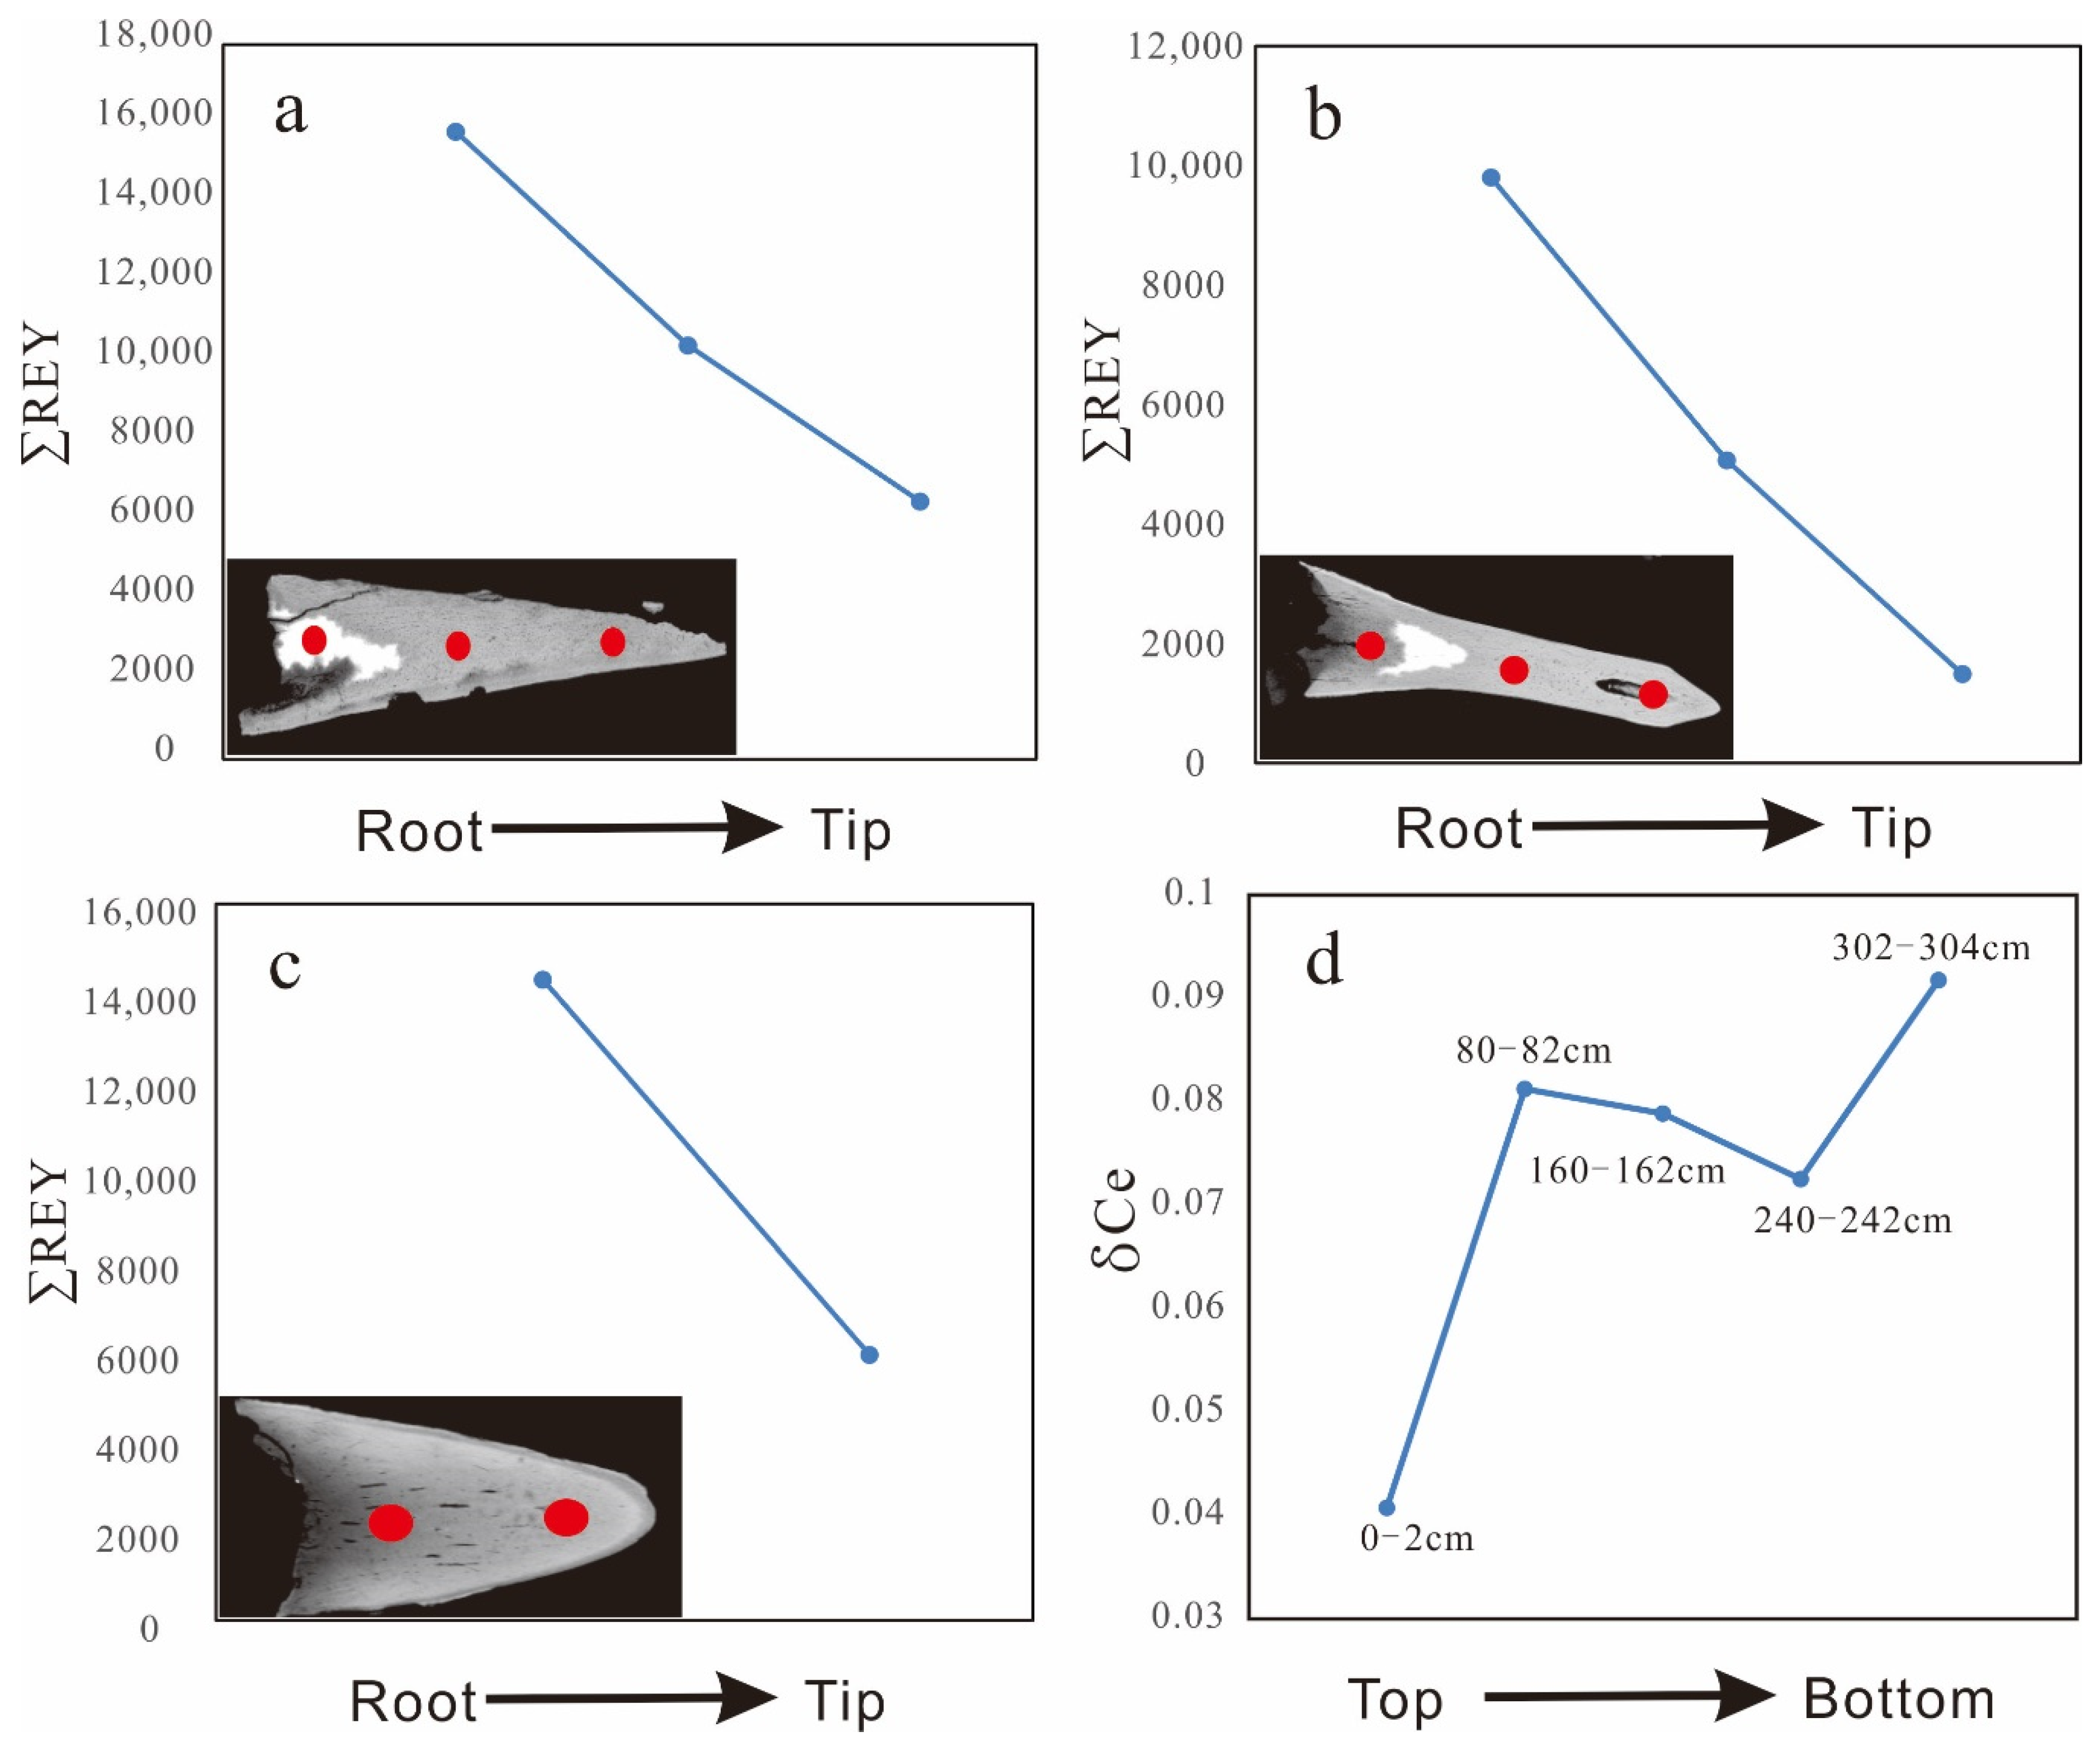
5.1.1. Bioapatites
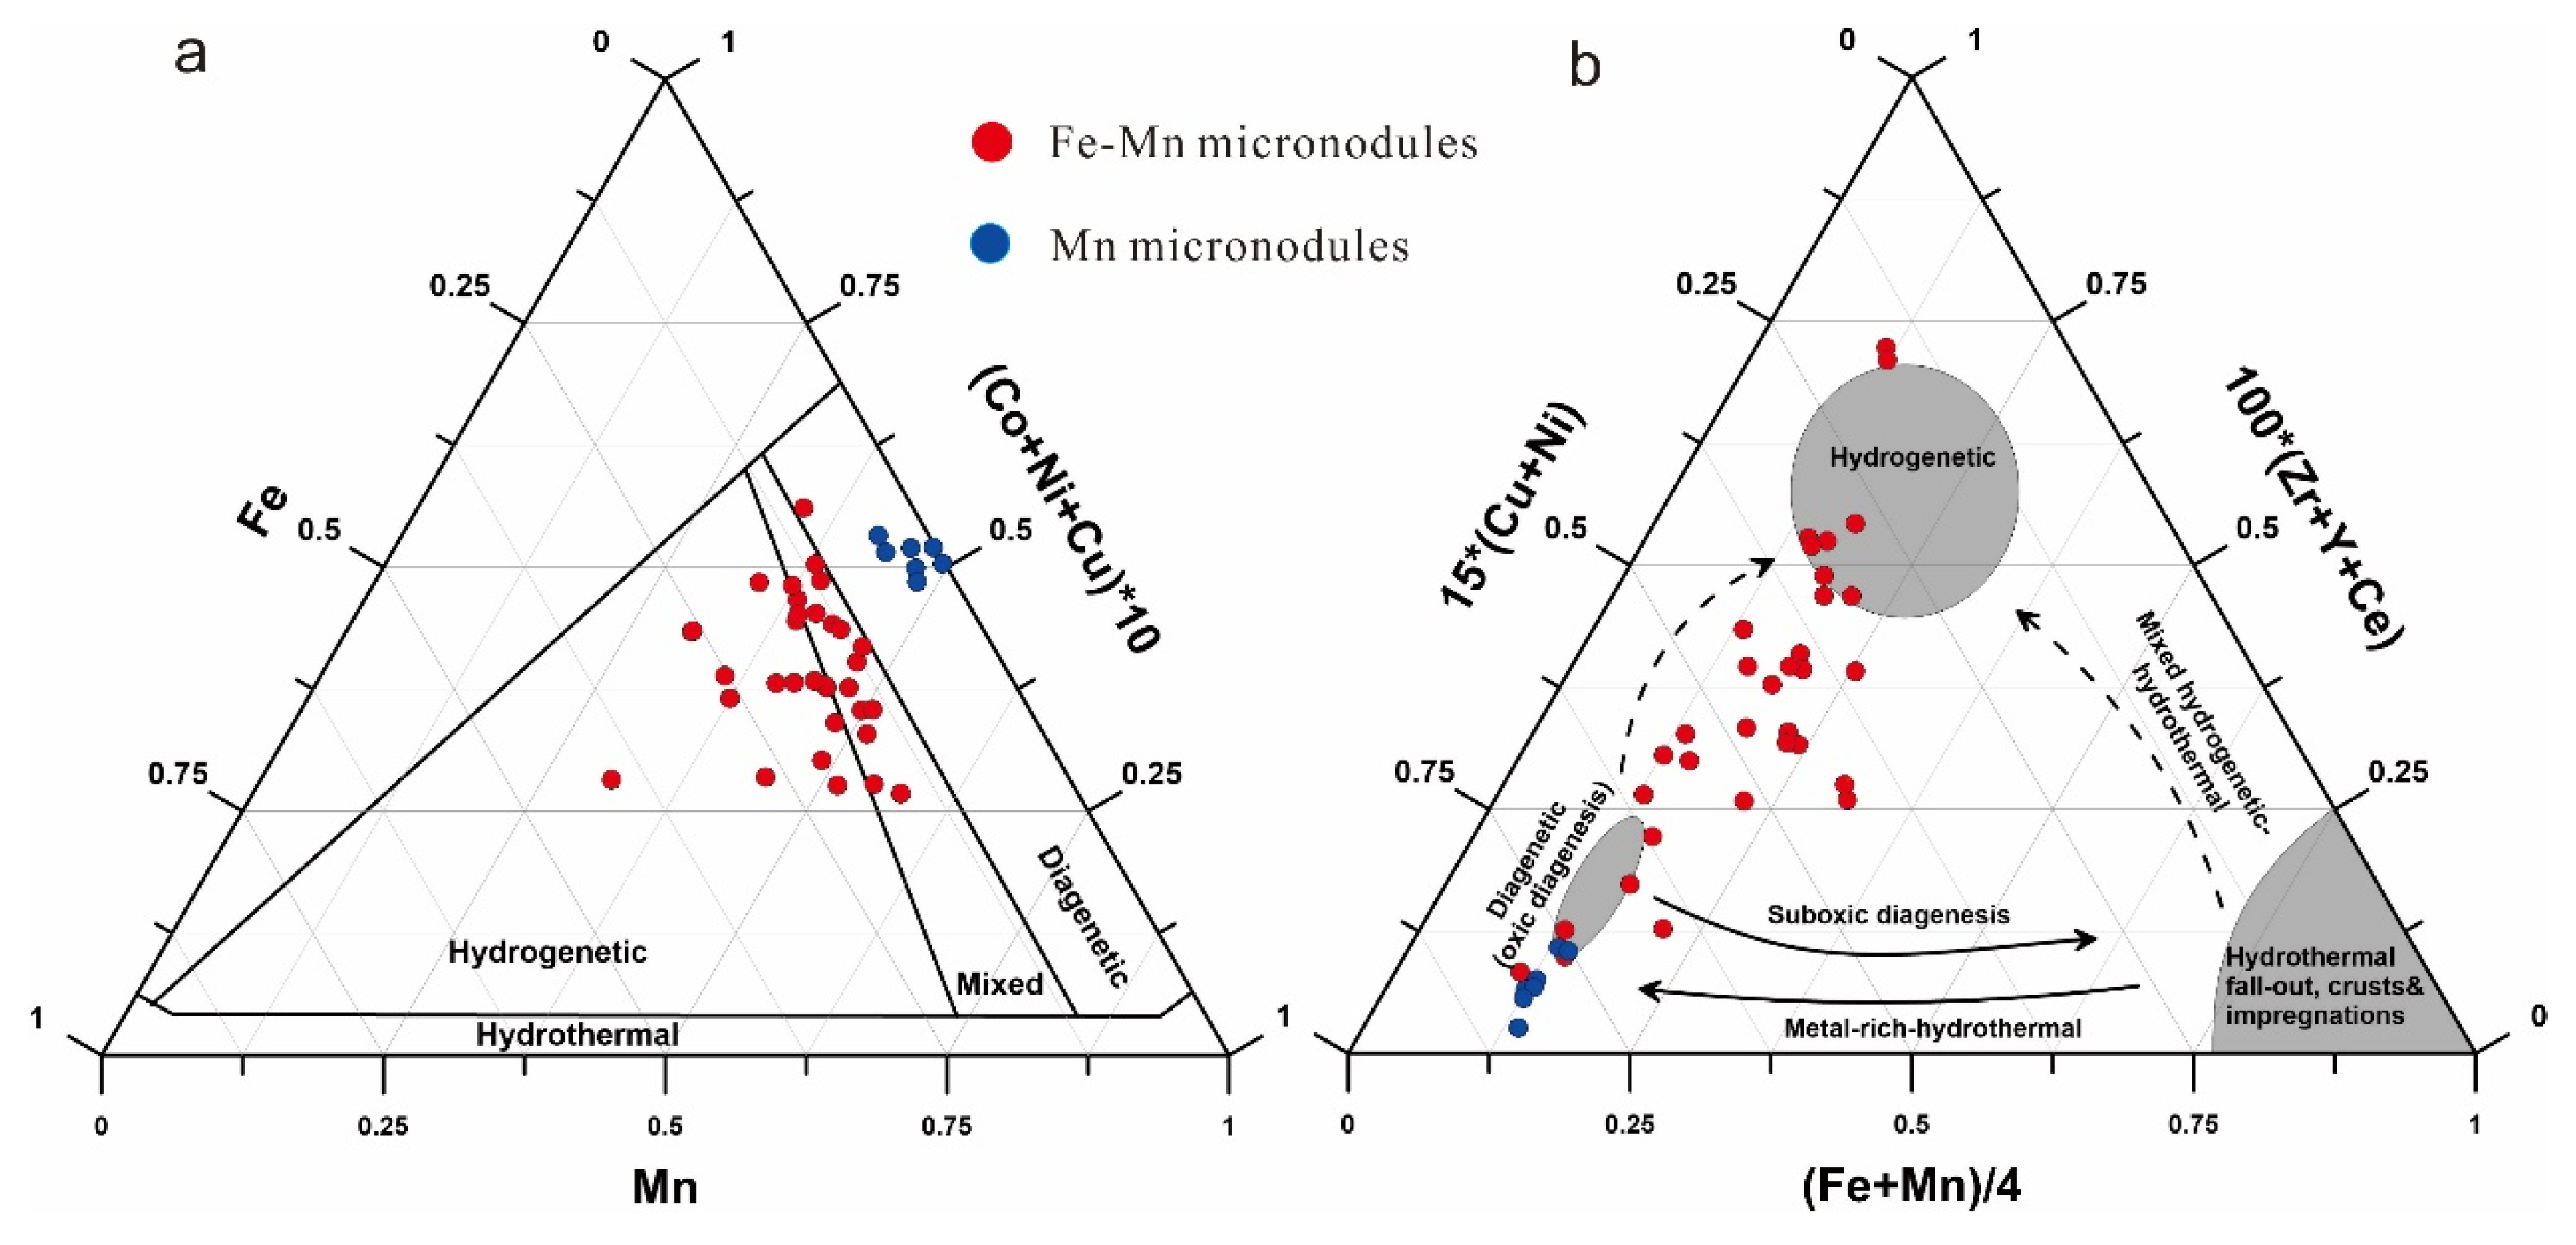
5.1.2. Fe-Mn Micronodules
5.1.3. Phillipsite
5.2. The Influence of Hydrothermal Fluids
6. Conclusions
Supplementary Materials
Author Contributions
Funding
Conflicts of Interest
References
- Kato, Y.; Fujinaga, K.; Nakamura, K.; Takaya, Y.; Kitamura, K.; Ohta, J.; Toda, R.; Nakashima, T.; Iwamori, H. Deep-sea mud in the Pacific Ocean as a potential resource for rare-earth elements. Nat. Geosci. 2011, 4, 535–539. [Google Scholar] [CrossRef]
- Balaram, V.; Banakar, V.K.; Subramanyam, K.S.V.; Roy, P.; Satyanarayanan, M.; Mohan, M.R.; Sawant, S.S. Yttrium and rare earth element contents in seamount cobalt crusts in the Indian Ocean. Curr. Sci. 2012, 103, 1334–1338. [Google Scholar]
- Szamałek, K.; Konopka, G.; Zglinicki, K.; Marciniak-Maliszewska, B. New potential source of rare earth elements. Gospod. Surowcami Miner. Miner. Resour. Manag. 2013, 29, 59–76. [Google Scholar] [CrossRef]
- Shi, X.F.; Huang, M.; Yu, M. How Much Is Known About Deep-Sea Rare Earths. 10000 Scientific Puzzle; Beijing Science Press: Beijing, China, 2018; pp. 604–605. [Google Scholar]
- Wu, C.; Yuan, Z.; Bai, G. Rare earth deposits in China. In Rare Earth Minerals: Chemistry, Origin and Ore Deposits. (The Mineralogical Society Series); Jones, A.P., Wall, F., Williams, C.T., Eds.; Chapman & Hall: London, UK, 1996; Volume 7, pp. 281–310. [Google Scholar]
- Bao, Z.; Zhao, Z. Geochemistry of mineralization with exchangeable REY in the weathering crusts of granitic rocks in South China. Ore Geol. Rev. 2008, 33, 519–535. [Google Scholar] [CrossRef]
- Yasukawa, K.; Liu, H.; Fujinaga, K.; Machida, S.; Haraguchi, S.; Ishii, T.; Nakamura, K.; Kato, Y. Geochemistry and mineralogy of REY-rich mud in the eastern Indian Ocean. J. Asian Earth Sci. 2014, 93, 25–36. [Google Scholar] [CrossRef]
- Yasukawa, K.; Nakamura, K.; Fujinaga, K.; Machida, S.; Ohta, J.; Takaya, Y.; Kato, Y. Rare-earth, major, and trace element geochemistry of deep-sea sediments in the Indian Ocean: Implications for the potential distribution of REY-rich mud in the Indian Ocean. Geochem. J. 2015, 49, 621–635. [Google Scholar] [CrossRef]
- Fujinaga, K.; Yasukawa, K.; Nakamura, K.; Machida, S.; Takaya, Y.; Ohta, J.; Araki, S.; Liu, H.; Usami, R.; Maki, R.; et al. Geochemistry of REY-rich mud in the Japanese exclusive economic zone around Minamitorishima Island. Geochem. J. 2016, 50, 575–590. [Google Scholar] [CrossRef]
- Nakamura, K.; Machida, S.; Okino, K.; Masaki, Y.; Iijima, K.M.; Suzuki, K.; Kato, Y. Acoustic characterization of pelagic sediments using sub-bottom profiler data: Implications for the distribution of REY-rich mud in the Minamitorishima EEZ, western Pacific. Geochem. J. 2016, 50, 605–619. [Google Scholar] [CrossRef]
- Lupton, J.E. Hydrothermal plumes: Near and far field. In Seafloor Hydrothermal Systems: Physical, Chemical, Biological, and Geological Interactions; Humphris, S.E., Zierenberg, R.A., Mullineaux, L.S., Thomson, R.E., Eds.; American Geophysical Union: Washington, DC, USA, 1995; Volume 91, pp. 317–346. [Google Scholar]
- German, C.; Hergt, J.; Palmer, M.; Edmond, J. Geochemistry of a hydrothermal sediment core from the OBS vent-field, 21°N East Pacific Rise. Chem. Geol. 1999, 155, 65–75. [Google Scholar] [CrossRef]
- Wu, J.; Wells, M.L.; Rember, R. Dissolved iron anomaly in the deep tropical–subtropical Pacific: Evidence for long-range transport of hydrothermal iron. Geochim. Cosmochim. Acta 2011, 75, 460–468. [Google Scholar] [CrossRef]
- Kon, Y.; Hoshino, M.; Sanematsu, K.; Morita, S.; Tsunematsu, M.; Okamoto, N.; Yano, N.; Tanaka, M.; Takagi, T. Geochemical characteristics of apatite in heavy REE-rich deep-sea mud from Minami-Torishima area, southeastern Japan. Resour. Geol. 2014, 64, 47–57. [Google Scholar] [CrossRef]
- Ohta, J.; Yasukawa, K.; Machida, S.; Fujinaga, K.; Nakamura, K.; Takaya, Y.; Iijima, K.M.; Suzuki, K.; Kato, Y. Geological factors responsible for REY-rich mud in the western North Pacific Ocean: Implications from mineralogy and grain size distributions. Geochem. J. 2016, 50, 591–603. [Google Scholar] [CrossRef]
- Liao, J.; Sun, X.; Li, D.; Sa, R.; Lu, Y.; Lin, Z.; Xu, L.; Zhan, R.; Pan, Y.; Xu, H. New insights into nanostructure and geochemistry of bioapatite in REE-rich deep-sea sediments: LA-ICP-MS, TEM, and Z-contrast imaging studies. Chem. Geol. 2019, 512, 58–68. [Google Scholar] [CrossRef]
- Kashiwabara, T.; Toda, R.; Fujinaga, K.; Honma, T.; Takahashi, Y.; Kato, Y. Determination of host phase of lanthanum in deepsea REY-rich mud by XAFS and μ-XRF using high-energy synchrotron radiation. Chem. Lett. 2014, 43, 199–200. [Google Scholar] [CrossRef]
- Holler, G.; Marchig, V. Hydrothermal activity on the East Pacific Rise: Stages of development. In Geologisches Jahrbuch; U.S. Department of Energy, Office of Scientific and Technical Information: Oak Ridge, TN, USA, 1990; Volume 75, pp. 3–22. [Google Scholar]
- Dick, H.J.; Lin, J.; Schouten, H. An ultraslow-spreading class of ocean ridge. Nature 2003, 426, 405–412. [Google Scholar] [CrossRef]
- Faure, V.; Speer, K. Deep circulation in the eastern South Pacific Ocean. J. Mar. Res. 2012, 70, 748–778. [Google Scholar] [CrossRef]
- Lupton, J.E.; Craig, H. Excess 3He in oceanic basalts: Evidence for terrestrial primordial helium. Earth Planet. Sci. Lett. 1975, 26, 133–139. [Google Scholar] [CrossRef]
- Resing, J.A.; Sedwick, P.N.; German, C.R.; Jenkins, W.J.; Moffett, J.W.; Sohst, B.M.; Tagliabue, A. Basin-scale transport of hydrothermal dissolvedmetals across the South Pacific Ocean. Nature 2015, 523, 200–203. [Google Scholar] [CrossRef]
- Fitzsimmons, J.N.; John, S.G.; Marsay, C.M.; Hoffman, C.L.; Nicholas, S.L.; Toner, B.M.; German, C.R.; Sherrell, R.M. Iron persistence in a distal hydrothermal plume supported by dissolved–particulate exchange. Nat. Geosci. 2017, 10, 195–201. [Google Scholar] [CrossRef]
- Palma, S.; Silva, N. Epipelagic siphonophore assemblages associated with water masses along a transect between Chile and Easter Island (eastern South Pacific Ocean). J. Plankton Res. 2006, 28, 1143–1151. [Google Scholar] [CrossRef]
- Cahill, T.; Isacks, B.L. Seismicity and shape of the subducted Nazca Plate. J. Geophys. Res. Space Phys. 1992, 97, 17503–17529. [Google Scholar] [CrossRef]
- Strub, P.T.; Mesias, J.M.; Montecino, V.; Rutllant, J.; Salinas, S. Coastal Ocean Circulation off Western South America. Coast. Segm. (6,E) 1998, 11, 273–313. [Google Scholar]
- Emery, W.J.; Meincke, J. Global water masses: Summary and review. Oceanol. Acta 1986, 9, 383–391. [Google Scholar]
- Reid, J.L. The shallow salinity minima of the Pacific Ocean. Deep Sea Res. Oceanogr. Abst. 1973, 20, 51–68. [Google Scholar] [CrossRef]
- Tanaka, T.; Togashi, S.; Kamioka, H.; Amakawa, H.; Kagami, H.; Hamamoto, T.; Yuhara, M.; Orihasi, Y.; Yoneda, S.; Shimizu, H.; et al. JNdi-1: A neodymium isotopic reference in consistency with LaJolla neodymium. Chem. Geol. 2000, 168, 279–281. [Google Scholar] [CrossRef]
- Foster, G.L.; Vance, D. In situ Nd isotopic analysis of geological materials by laser ablation MC-ICP-MS. J. Anal. At. Spectrom. 2006, 21, 288–296. [Google Scholar] [CrossRef]
- Taylor, S.R.; McLennan, S.M. The Continental Crust: Its Composition and Evolution; Blackwell Science: Oxford, UK, 1985. [Google Scholar]
- Alibo, D.S.; Nozaki, Y. Rare earth elements in seawater: Particle association, shale-normalization, and Ce oxidation. Geochim. Cosmochim. Acta 1999, 63, 363–372. [Google Scholar] [CrossRef]
- Bernat, M. Les isotopes de l’uranium et du thorium et les terres rares dans l’environnement marin. Cah. Ostom. Ser. Geol. 1975, 7, 65–83. (In French) [Google Scholar]
- Toyoda, K.; Tokonami, M. Diffusion of rare-earth elements in fish teeth from deep-sea sediments. Nature 1990, 345, 607–609. [Google Scholar] [CrossRef]
- German, C.R.; Klinkhammer, G.P.; Edmond, J.M.; Mura, A.; Elderfield, H. Hydrothermal scavenging of rare-earth elements in the ocean. Nature 1990, 345, 516–518. [Google Scholar] [CrossRef]
- Ren, J.B.; Yao, H.Q.; Zhu, K.C.; He, G.W.; Deng, X.G.; Wang, H.F.; Liu, J.Y.; Fu, P.E.; Yang, S.X. Enrichment mechanism of rare earth elements and yttrium in deep-sea mud of Clarion-Clipperton region. Earth Sci. Front. 2015, 22, 200–211. [Google Scholar]
- Bau, M.; Dulski, P. Comparing yttrium and rare earths in hydrothermal fluids from the Mid-Atlantic Ridge: Implications for Y and REE behavior during near-vent mixing and for the Y/Ho ratio of Proteozoic seawater. Chem. Geol. 1999, 155, 77–90. [Google Scholar]
- Ohta, A.; Ishii, S.; Sakakibara, M.; Mizuno, A.; Kawabe, I. Systematic correlation of the Ce anomaly with the Co/(Ni+Cu) ratio and Y fractionation from Ho in distinct types of Pacific deep-sea nodules. Geochem. J. 1999, 33, 399–417. [Google Scholar] [CrossRef]
- Kanazawa, T.; Sager, W.W.; Escutia, D. Carbonates and bulk sediment geochemistry of ODP Hole 191-1179C. Pangaea 2005. [Google Scholar] [CrossRef]
- Shen, H. Rare earth elements in deep-sea sediments. Geochimica 1990, 19, 340–348, (in Chinese with English abstract). [Google Scholar]
- Bonatti, E.; Kraemer, T.; Rydell, H. Classification and genesis of submarine iron-manganese deposits. Papers from a conference on Ferromanganese Deposits on the Ocean Floor. Natl. Sci. Found. 1972, 149–166. [Google Scholar]
- Josso, P.; Pelleter, E.; Pourret, O.; Fouquet, Y.; Etoubleau, J.; Cheron, S.; Bollinger, C. A new discrimination scheme for oceanic ferromanganese deposits using high field strength and rare earth elements. Ore Geol. Rev. 2017, 87, 3–15. [Google Scholar] [CrossRef]
- Slomp, C.P.; Epping, E.H.G.; Helder, W.; Van Raaphorst, W. A key role for iron-bound phosphorus in authigenic apatite formation in North Atlantic continental platform sediments. J. Mar. Res. 1996, 54, 1179–1205. [Google Scholar] [CrossRef]
- Tsandev, I.; Reed, D.C.; Slomp, C.P. Phosphorus diagenesis in deep-sea sediments: Sensitivity to water column conditions and global scale implications. Chem. Geol. 2012, 330, 127–139. [Google Scholar] [CrossRef]
- Takahashi, Y.; Hayasaka, Y.; Morita, K.; Kashiwabara, T.; Nakada, R.; Marcus, M.A.; Kato, K.; Tanaka, K.; Shimizu, H. Transfer of rare earth elements (REE) from manganese oxides to phosphates during early diagenesis in pelagic sediments inferred from REE patterns, X-ray absorption spectroscopy, and chemical leaching method. Geochem. J. 2015, 49, 653–674. [Google Scholar] [CrossRef]
- Dubinin, A.V. Geochemistry of rare earth elements in oceanic phillipsites. Lithol. Miner. Resour. 2000, 35, 101–108. [Google Scholar] [CrossRef]
- Piper, D.Z. Rare earth elements in ferromanganese nodules and other marine phases. Geochim. Cosmochim. Acta 1974, 38, 1007–1022. [Google Scholar] [CrossRef]
- Bernat, M.; Church, T.M. Deep-sea phillipsites: Trace geochemistry and modes of formation. ACM Lisp Bulletin 1978, 259–267. [Google Scholar]
- Zhang, X.Y.; Deng, H.; Zhang, F.Y.; Zhang, W.Y.; Du, Y.; Jiang, B.B. Enrichment and geochemical characteristics of rare earth elements in deep-sea mud from seamount area of Western Pacific. J. Chin. Soc. Rare Earths 2013, 31, 729–737, (in Chinese with English abstract). [Google Scholar]
- Müller, R.D.; Sdrolias, M.; Gaina, C.; Roest, W.R. Age, spreading rates, and spreading asymmetry of the world’s ocean crust. Geochem. Geophys. Geosystems 2008, 9. [Google Scholar] [CrossRef]
- German, C.R.; Lin, J.; Parson, L.M. Mid-ocean ridges: Hydrothermal interactions between the lithosphere and oceans. Geophys. Monogr. Ser. 2004, 148, 318. [Google Scholar]
- Kashiwabara, T.; Toda, R.; Nakamura, K.; Yasukawa, K.; Fujinaga, K.; Kubo, S.; Nozaki, T.; Takahashi, Y.; Suzuki, K.; Kato, Y. Synchrotron X-ray spectroscopic perspective on the formation mechanism of REY-rich muds in the Pacific Ocean. Geochim. Cosmochim. Acta 2018, 240, 274–292. [Google Scholar] [CrossRef]
- Bennett, S.A.; Achterberg, E.P.; Connelly, D.P.; Statham, P.J.; Fones, G.R.; German, C.R. The distribution and stabilization of dissolved Fe in deep-sea hydrothermal plumes. Earth Planet. Sci. Lett. 2008, 270, 157–167. [Google Scholar] [CrossRef]
- Hawkes, J.A.; Connelly, D.P.; Gledhill, M.; Achterberg, E.P. The stabilisation and transportation of dissolved iron from high temperature hydrothermal vent systems. Earth Planet. Sci. Lett. 2013, 375, 280–290. [Google Scholar] [CrossRef]
- Ruhlin, D.E.; Owen, R.M. The rare earth element geochemistry of hydrothermal sediments from the East Pacific Rise: Examination of a seawater scavenging mechanism. Geochim. Cosmochim. Acta 1986, 50, 393–400. [Google Scholar] [CrossRef]
- Olivarez, A.M.; Owen, R.M. REE/Fe variations in hydrothermal sediments: Implications for the REE content of seawater. Geochim. Cosmochim. Acta 1989, 53, 757–762. [Google Scholar] [CrossRef]
- Sa, R.; Sun, X.; He, G.; Xu, L.; Pan, Q.; Liao, J.; Zhu, K.; Deng, X. Enrichment of rare earth elements in siliceous sediments under slow deposition: A case study of the central North Pacific. Ore Geol. Rev. 2018, 94, 12–23. [Google Scholar] [CrossRef]
- Boström, K. Genesis of ferromanganese deposits. In Hydrothermal Processes at Seafloor Spreading Centers; Rona, P.A., Boström, K., Laubier, L., Smith, K.L., Eds.; NATO Conference Series (IV Marine Sciences); Springer: Boston, MA, USA, 1983; Volume 12, pp. 473–489. [Google Scholar]
- Piepgras, D.J.; Wasserburg, G.J. Isotopic composition of neodymiuminwaters of the Drake Passage. Science 1982, 217, 207–214. [Google Scholar] [CrossRef] [PubMed]
- Goldstein, S.; Hemming, S.R. Long lived isotopic tracers in oceanography. Paleoceanography and ice-sheet dynamics. In Treatise on Geochemistry; Elderfield, H., Turekian, K.K., Eds.; Elsevier: Amsterdam, The Netherlands, 2003; Volume 6, pp. 453–489. [Google Scholar]
- Goldstein, S.J.; Jacobsen, S.B. The Nd and Sr isotopic systematics of river-water dissolved material: Implications for the sources of Nd and Sr in seawater. Chem. Geol. Isot. Geosci. Sect. 1987, 66, 245–272. [Google Scholar] [CrossRef]
- Goldstein, S.J.; Jacobsen, S.B. Nd and Sr isotopic systematics of river water suspended material: Implications for crustal evolution. Earth Planet. Sci. Lett. 1988, 87, 249–265. [Google Scholar] [CrossRef]
- Piepgras, D.J.; Wasserburg, G.J.; Dasch, E.J. The isotopic composition of Nd in different ocean water masses. Earth Planet. Sci. Lett. 1979, 45, 223–226. [Google Scholar] [CrossRef]
- Piepgras, D.J.; Wasserburg, G. Neodymium isotopic variations in seawater. Earth Planet. Sci. Lett. 1980, 50, 128–138. [Google Scholar] [CrossRef]
- Bach, W.; Erzinger, J.; Dosso, L.; Bollinger, C.; Bougault, H.; Etoubleau, J.; Sauerwein, J. Unusually large Nb–Ta depletions in North Chile ridge basalts at 36°50′ to 38°56′ S: Major element, trace element, and isotopic data. Earth Planet. Sci. Lett. 1996, 142, 223–240. [Google Scholar] [CrossRef]


| Samples | S021GC17-0-2 | S021GC17-10-12 | S021GC17-20-22 | S021GC17-30-32 | S021GC17-40-42 | S021GC17-50-52 | S021GC17-60-62 | S021GC17-70-72 | S021GC17-80-82 | S021GC17-90-92 | S021GC17-100-102 | S021GC17-110-112 | S021GC17-120-122 | S021GC17-130-132 | S021GC17-140-142 | S021GC17-150-152 |
|---|---|---|---|---|---|---|---|---|---|---|---|---|---|---|---|---|
| Al2O3 | 11.03 | 11.49 | 11.73 | 11.59 | 11.50 | 11.56 | 11.50 | 11.48 | 11.54 | 11.26 | 11.27 | 11.27 | 11.30 | 11.21 | 11.15 | 11.05 |
| CaO | 5.37 | 3.37 | 2.80 | 2.75 | 2.78 | 2.84 | 2.84 | 2.80 | 2.85 | 2.89 | 3.01 | 2.90 | 2.87 | 2.86 | 2.87 | 2.88 |
| TFe2O3 | 12.70 | 13.29 | 13.66 | 13.57 | 13.60 | 13.79 | 13.73 | 13.70 | 13.92 | 13.99 | 14.10 | 14.29 | 14.30 | 14.41 | 14.50 | 14.46 |
| MnO | 3.85 | 4.04 | 4.23 | 4.21 | 4.19 | 4.22 | 4.21 | 4.22 | 4.31 | 4.40 | 4.47 | 4.56 | 4.60 | 4.67 | 4.70 | 4.67 |
| K2O | 2.30 | 2.39 | 2.46 | 2.44 | 2.45 | 2.49 | 2.47 | 2.47 | 2.50 | 2.47 | 2.46 | 2.47 | 2.47 | 2.47 | 2.47 | 2.47 |
| MgO | 2.99 | 3.08 | 3.18 | 3.12 | 3.16 | 3.18 | 3.16 | 3.13 | 3.19 | 3.15 | 3.14 | 3.16 | 3.15 | 3.17 | 3.18 | 3.18 |
| Na2O | 6.04 | 6.04 | 6.37 | 6.20 | 6.35 | 6.38 | 6.38 | 6.25 | 6.46 | 6.32 | 6.13 | 6.16 | 6.12 | 6.08 | 6.08 | 6.13 |
| P2O5 | 1.30 | 1.33 | 1.37 | 1.40 | 1.43 | 1.46 | 1.46 | 1.43 | 1.44 | 1.46 | 1.51 | 1.51 | 1.52 | 1.53 | 1.56 | 1.61 |
| TiO2 | 0.56 | 0.58 | 0.60 | 0.59 | 0.59 | 0.59 | 0.59 | 0.59 | 0.59 | 0.58 | 0.58 | 0.59 | 0.59 | 0.59 | 0.59 | 0.58 |
| Ba | 11888 | 12560 | 12537 | 12589 | 12402 | 12270 | 12464 | 12114 | 11732 | 12252 | 11766 | 11903 | 12453 | 12209 | 12466 | 11754 |
| Co | 345.7 | 359.7 | 372.1 | 375.1 | 374.6 | 371.0 | 373.4 | 378.2 | 379.9 | 408.1 | 392.8 | 413.3 | 408.3 | 418.2 | 429.4 | 425.8 |
| Mo | 48.91 | 58.42 | 65.44 | 72.63 | 74.60 | 76.11 | 79.91 | 80.20 | 81.19 | 85.50 | 83.90 | 86.35 | 88.93 | 90.46 | 93.96 | 95.54 |
| La | 170.51 | 169.98 | 175.01 | 178.66 | 172.71 | 169.55 | 179.99 | 177.03 | 174.40 | 180.98 | 179.91 | 183.35 | 181.84 | 179.07 | 181.63 | 182.72 |
| Ce | 177.62 | 178.07 | 182.42 | 179.26 | 174.55 | 177.91 | 179.71 | 171.65 | 171.94 | 176.04 | 165.81 | 170.02 | 170.22 | 169.39 | 169.32 | 174.09 |
| Pr | 37.80 | 39.01 | 39.92 | 40.71 | 40.12 | 39.74 | 41.45 | 39.83 | 40.09 | 42.88 | 42.29 | 43.34 | 42.52 | 42.45 | 42.99 | 42.58 |
| Nd | 169.07 | 173.56 | 180.48 | 180.28 | 178.66 | 177.16 | 183.94 | 177.41 | 182.73 | 189.69 | 184.93 | 191.85 | 188.83 | 190.23 | 191.04 | 189.31 |
| Sm | 34.96 | 36.19 | 37.18 | 36.97 | 36.95 | 36.94 | 38.61 | 38.09 | 37.74 | 39.95 | 39.80 | 40.86 | 40.08 | 40.35 | 41.00 | 40.52 |
| Eu | 14.63 | 15.49 | 15.72 | 15.12 | 15.21 | 15.07 | 15.77 | 15.31 | 14.81 | 16.05 | 15.82 | 16.00 | 15.85 | 15.51 | 15.69 | 15.30 |
| Gd | 35.00 | 36.17 | 37.98 | 37.76 | 37.80 | 37.28 | 38.59 | 38.24 | 37.81 | 40.85 | 39.92 | 41.64 | 41.13 | 41.16 | 40.68 | 40.09 |
| Tb | 5.60 | 5.82 | 5.96 | 6.01 | 5.97 | 5.94 | 6.14 | 6.06 | 6.11 | 6.50 | 6.44 | 6.58 | 6.57 | 6.69 | 6.60 | 6.67 |
| Dy | 45.70 | 47.00 | 49.20 | 49.13 | 49.19 | 49.19 | 50.67 | 50.08 | 50.88 | 53.95 | 53.11 | 54.47 | 53.57 | 53.86 | 54.44 | 54.01 |
| Ho | 9.36 | 9.82 | 10.25 | 10.34 | 10.25 | 10.44 | 10.47 | 10.48 | 10.64 | 11.14 | 11.41 | 11.37 | 11.32 | 11.29 | 11.49 | 11.50 |
| Er | 24.12 | 24.93 | 25.91 | 26.02 | 26.07 | 25.90 | 26.60 | 26.20 | 26.39 | 28.08 | 28.09 | 28.28 | 28.19 | 28.64 | 28.91 | 28.63 |
| Tm | 4.07 | 4.23 | 4.34 | 4.46 | 4.46 | 4.38 | 4.57 | 4.43 | 4.50 | 4.84 | 4.81 | 4.90 | 4.80 | 4.90 | 4.92 | 4.97 |
| Yb | 24.56 | 25.63 | 26.22 | 26.48 | 26.78 | 26.67 | 27.56 | 26.81 | 27.56 | 29.01 | 28.77 | 29.51 | 28.85 | 28.90 | 29.49 | 29.11 |
| Lu | 4.07 | 4.25 | 4.46 | 4.47 | 4.53 | 4.56 | 4.55 | 4.61 | 4.60 | 4.96 | 4.92 | 5.02 | 4.77 | 4.91 | 4.87 | 4.83 |
| Y | 299.97 | 306.37 | 324.59 | 331.60 | 331.57 | 328.29 | 333.46 | 339.43 | 344.18 | 366.40 | 355.96 | 368.94 | 352.49 | 355.52 | 367.59 | 370.01 |
| ∑REY | 1057 | 1077 | 1120 | 1127 | 1115 | 1109 | 1142 | 1126 | 1134 | 1191 | 1162 | 1196 | 1171 | 1173 | 1191 | 1194 |
| δCe | 0.52 | 0.52 | 0.51 | 0.50 | 0.50 | 0.51 | 0.49 | 0.48 | 0.49 | 0.47 | 0.45 | 0.45 | 0.46 | 0.46 | 0.45 | 0.47 |
| δEu | 1.27 | 1.29 | 1.27 | 1.23 | 1.23 | 1.23 | 1.24 | 1.21 | 1.19 | 1.20 | 1.20 | 1.17 | 1.18 | 1.15 | 1.16 | 1.15 |
| Y/Ho | 32.05 | 31.19 | 31.66 | 32.08 | 32.36 | 31.44 | 31.84 | 32.40 | 32.35 | 32.89 | 31.20 | 32.45 | 31.14 | 31.49 | 31.98 | 32.16 |
| La/Sm | 4.88 | 4.70 | 4.71 | 4.83 | 4.67 | 4.59 | 4.66 | 4.65 | 4.62 | 4.53 | 4.52 | 4.49 | 4.54 | 4.44 | 4.43 | 4.51 |
| Sm/Nd | 0.21 | 0.21 | 0.21 | 0.21 | 0.21 | 0.21 | 0.21 | 0.21 | 0.21 | 0.21 | 0.22 | 0.21 | 0.21 | 0.21 | 0.21 | 0.21 |
| Sm/Yb | 1.42 | 1.41 | 1.42 | 1.40 | 1.38 | 1.38 | 1.40 | 1.42 | 1.37 | 1.38 | 1.38 | 1.38 | 1.39 | 1.40 | 1.39 | 1.39 |
| La/Yb | 6.94 | 6.63 | 6.67 | 6.75 | 6.45 | 6.36 | 6.53 | 6.60 | 6.33 | 6.24 | 6.25 | 6.21 | 6.30 | 6.20 | 6.16 | 6.28 |
| Samples | S021GC17-160-162 | S021GC17-170-172 | S021GC17-180-182 | S021GC17-190-192 | S021GC17-200-202 | S021GC17-210-212 | S021GC17-220-222 | S021GC17-230-232 | S021GC17-240-242 | S021GC17-250-252 | S021GC17-260-262 | S021GC17-270-272 | S021GC17-280-282 | S021GC17-290-292 | S021GC17-302-304 |
|---|---|---|---|---|---|---|---|---|---|---|---|---|---|---|---|
| Al2O3 | 11.11 | 11.17 | 11.02 | 11.11 | 11.19 | 10.98 | 10.88 | 10.46 | 10.31 | 10.03 | 10.10 | 9.76 | 8.66 | 8.53 | 9.20 |
| CaO | 2.94 | 3.01 | 3.02 | 3.15 | 3.19 | 3.44 | 3.62 | 3.59 | 3.71 | 3.87 | 4.33 | 4.77 | 8.82 | 10.45 | 6.85 |
| TFe2O3 | 14.45 | 14.42 | 14.14 | 14.23 | 14.34 | 14.20 | 14.91 | 14.73 | 14.64 | 14.46 | 14.66 | 15.37 | 14.29 | 15.27 | 16.33 |
| MnO | 4.73 | 4.70 | 4.69 | 4.76 | 4.79 | 4.75 | 4.95 | 5.00 | 4.97 | 4.88 | 5.02 | 5.30 | 4.98 | 4.83 | 5.11 |
| K2O | 2.50 | 2.55 | 2.53 | 2.59 | 2.61 | 2.60 | 2.56 | 2.50 | 2.47 | 2.43 | 2.52 | 2.52 | 2.32 | 2.52 | 2.55 |
| MgO | 3.22 | 3.24 | 3.19 | 3.21 | 3.23 | 3.20 | 3.27 | 3.22 | 3.14 | 3.04 | 3.00 | 2.99 | 2.65 | 2.48 | 2.48 |
| Na2O | 6.28 | 6.34 | 6.09 | 6.06 | 6.08 | 6.11 | 6.08 | 5.90 | 5.90 | 5.88 | 6.02 | 6.00 | 5.43 | 5.27 | 5.43 |
| P2O5 | 1.63 | 1.68 | 1.76 | 1.88 | 1.90 | 2.10 | 2.24 | 2.27 | 2.36 | 2.45 | 2.71 | 2.96 | 3.17 | 3.28 | 3.46 |
| TiO2 | 0.58 | 0.58 | 0.56 | 0.57 | 0.57 | 0.56 | 0.57 | 0.55 | 0.54 | 0.52 | 0.52 | 0.51 | 0.45 | 0.45 | 0.51 |
| Ba | 11716 | 11777 | 12667 | 12903 | 13410 | 10556 | 9491 | 9700 | 9187 | 9250 | 9774 | 12284 | 12509 | 12958 | 10607 |
| Co | 427.7 | 419.4 | 418.1 | 433.8 | 418.1 | 437.0 | 464.2 | 479.1 | 450.0 | 447.8 | 465.1 | 457.0 | 428.0 | 392.5 | 413.5 |
| Mo | 94.34 | 88.96 | 92.05 | 97.76 | 96.80 | 93.03 | 96.94 | 104.10 | 96.51 | 90.22 | 83.71 | 81.92 | 82.92 | 85.92 | 92.73 |
| La | 191.13 | 192.78 | 194.05 | 207.26 | 207.10 | 217.25 | 228.83 | 236.51 | 254.99 | 260.20 | 278.97 | 286.29 | 300.11 | 294.06 | 311.45 |
| Ce | 166.55 | 163.58 | 162.66 | 164.63 | 164.93 | 155.86 | 159.95 | 158.44 | 156.99 | 148.39 | 155.09 | 140.62 | 134.17 | 136.86 | 151.96 |
| Pr | 44.08 | 43.79 | 44.61 | 45.88 | 46.30 | 47.58 | 50.06 | 49.00 | 51.57 | 49.95 | 53.34 | 51.73 | 52.74 | 53.50 | 57.97 |
| Nd | 197.25 | 198.93 | 200.21 | 213.74 | 208.73 | 218.59 | 225.26 | 228.34 | 238.30 | 232.70 | 250.10 | 239.60 | 247.63 | 247.42 | 266.70 |
| Sm | 42.67 | 41.93 | 42.37 | 44.88 | 45.16 | 45.61 | 46.78 | 46.26 | 47.39 | 47.63 | 49.64 | 48.13 | 47.88 | 49.36 | 53.57 |
| Eu | 16.35 | 15.87 | 16.49 | 17.22 | 17.29 | 16.39 | 15.48 | 15.64 | 15.90 | 15.72 | 16.99 | 17.80 | 18.40 | 19.14 | 18.47 |
| Gd | 42.22 | 42.28 | 42.31 | 45.55 | 43.86 | 46.34 | 47.17 | 47.14 | 49.35 | 49.55 | 52.27 | 52.59 | 52.74 | 54.20 | 57.26 |
| Tb | 6.92 | 6.90 | 7.07 | 7.49 | 7.34 | 7.69 | 8.03 | 8.11 | 8.43 | 8.48 | 9.05 | 8.95 | 9.00 | 9.07 | 9.93 |
| Dy | 56.76 | 56.76 | 57.63 | 61.36 | 61.63 | 65.19 | 67.98 | 67.82 | 71.76 | 71.86 | 77.72 | 77.91 | 78.92 | 79.59 | 85.97 |
| Ho | 12.10 | 12.21 | 12.31 | 13.18 | 13.13 | 14.39 | 14.85 | 15.07 | 16.06 | 16.26 | 17.93 | 18.11 | 18.32 | 18.10 | 19.60 |
| Er | 29.99 | 30.04 | 31.29 | 33.59 | 33.59 | 36.05 | 37.77 | 38.14 | 40.95 | 41.44 | 46.01 | 46.50 | 47.23 | 46.75 | 50.65 |
| Tm | 5.13 | 5.15 | 5.37 | 5.70 | 5.72 | 6.27 | 6.56 | 6.70 | 7.13 | 7.25 | 8.01 | 8.12 | 8.41 | 8.28 | 8.88 |
| Yb | 30.11 | 30.30 | 31.35 | 33.59 | 33.29 | 36.61 | 38.12 | 39.16 | 41.47 | 42.20 | 47.07 | 47.94 | 48.52 | 48.98 | 52.28 |
| Lu | 5.14 | 5.12 | 5.24 | 5.62 | 5.57 | 6.12 | 6.31 | 6.49 | 7.11 | 7.17 | 8.02 | 8.13 | 8.42 | 8.45 | 8.98 |
| Y | 387.15 | 391.30 | 407.42 | 444.14 | 430.11 | 494.34 | 530.46 | 537.16 | 561.31 | 585.36 | 684.69 | 701.84 | 735.22 | 703.36 | 728.37 |
| ∑REY | 1234 | 1237 | 1260 | 1344 | 1324 | 1414 | 1484 | 1500 | 1569 | 1584 | 1755 | 1754 | 1808 | 1777 | 1882 |
| δCe | 0.43 | 0.42 | 0.41 | 0.40 | 0.40 | 0.36 | 0.35 | 0.34 | 0.32 | 0.30 | 0.29 | 0.26 | 0.24 | 0.25 | 0.26 |
| δEu | 1.16 | 1.14 | 1.18 | 1.15 | 1.17 | 1.08 | 1.00 | 1.01 | 1.00 | 0.98 | 1.01 | 1.08 | 1.11 | 1.13 | 1.01 |
| Y/Ho | 32.00 | 32.06 | 33.11 | 33.69 | 32.75 | 34.35 | 35.72 | 35.64 | 34.94 | 35.99 | 38.19 | 38.75 | 40.12 | 38.86 | 37.16 |
| La/Sm | 4.48 | 4.60 | 4.58 | 4.62 | 4.59 | 4.76 | 4.89 | 5.11 | 5.38 | 5.46 | 5.62 | 5.95 | 6.27 | 5.96 | 5.81 |
| Sm/Nd | 0.22 | 0.21 | 0.21 | 0.21 | 0.22 | 0.21 | 0.21 | 0.20 | 0.20 | 0.20 | 0.20 | 0.20 | 0.19 | 0.20 | 0.20 |
| Sm/Yb | 1.42 | 1.38 | 1.35 | 1.34 | 1.36 | 1.25 | 1.23 | 1.18 | 1.14 | 1.13 | 1.05 | 1.00 | 0.99 | 1.01 | 1.02 |
| La/Yb | 6.35 | 6.36 | 6.19 | 6.17 | 6.22 | 5.93 | 6.00 | 6.04 | 6.15 | 6.17 | 5.93 | 5.97 | 6.19 | 6.00 | 5.96 |
| Samples | Samples No. | Depths (cm) | 87Sr/86Sr | Error (2 s) | 143Nd/144Nd | Error (2 s) | εNd (0) |
|---|---|---|---|---|---|---|---|
| Whole rock | S021GC17-1 | 0–2 | 0.70951 | 0.00000644 | 0.51245 | 0.00000209 | −3.667305 |
| S021GC17-2 | 80–82 | 0.70919 | 0.00000526 | 0.51246 | 0.00000237 | −3.530757 | |
| S021GC17-3 | 160–162 | 0.71039 | 0.00000681 | 0.51247 | 0.00000199 | −3.355194 | |
| S021GC17-4 | 240–242 | 0.71081 | 0.00000661 | 0.51248 | 0.00000164 | −3.004069 | |
| S021GC17-5 | 302–304 | 0.71084 | 0.00000796 | 0.51249 | 0.00000225 | −2.945548 | |
| Bioapatite | 18777-1-1 | 0–2 | 0.71050 | 0.000134288 | 0.51274 | 0.000032 | 1.945343344 |
| 18777-1-2 | 0–2 | 0.70975 | 0.000231394 | 0.51248 | 0.000032 | −3.14039429 | |
| 18777-1-3 | 0–2 | 0.71048 | 0.000686548 | 0.51240 | 0.000066 | −4.57182653 | |
| 18777-1-4 | 0–2 | 0.70989 | 0.000292885 | 0.51240 | 0.000041 | −4.676482 | |
| 18777-2-1 | 80–82 | 0.71113 | 0.000226153 | 0.51250 | 0.000033 | −2.76070548 | |
| 18777-2-2 | 80–82 | 0.71097 | 0.000298258 | 0.51246 | 0.000041 | −3.53428332 | |
| 18777-3-1 | 160–162 | 0.71089 | 0.000282621 | 0.51252 | 0.000048 | −2.35227029 | |
| 18777-3-3 | 160–162 | 0.71056 | 0.000346566 | 0.51252 | 0.000044 | −2.3695646 | |
| 18777-3-4 | 160–162 | 0.71091 | 0.000213473 | 0.51246 | 0.000036 | −3.5659117 | |
| 18777-4-1 | 240–242 | 0.71158 | 0.000316567 | 0.51251 | 0.000064 | −2.43800703 | |
| 18777-4-2 | 240–242 | 0.70914 | 0.000312533 | 0.51266 | 0.000063 | 0.458839981 | |
| 18777-5-1 | 302–304 | 0.70985 | 0.000162341 | 0.51255 | 0.000046 | −1.62802313 | |
| 18777-5-2 | 302–304 | 0.71008 | 0.000293541 | 0.51258 | 0.000065 | −1.15135076 | |
| 18777-5-3 | 302–304 | 0.70961 | 0.000106755 | 0.51246 | 0.000036 | −3.47546196 | |
| 18777-5-4 | 302–304 | 0.70891 | 0.00020346 | 0.51255 | 0.000059 | −1.76812022 | |
| 18777-5-5 | 302–304 | 0.71100 | 0.000557245 | 0.51268 | 0.000076 | 0.770968358 | |
| 18777-5-6 | 302–304 | 0.70941 | 0.000176067 | 0.51250 | 0.000050 | −2.68444508 |
Publisher’s Note: MDPI stays neutral with regard to jurisdictional claims in published maps and institutional affiliations. |
© 2020 by the authors. Licensee MDPI, Basel, Switzerland. This article is an open access article distributed under the terms and conditions of the Creative Commons Attribution (CC BY) license (http://creativecommons.org/licenses/by/4.0/).
Share and Cite
Zhou, T.; Shi, X.; Huang, M.; Yu, M.; Bi, D.; Ren, X.; Yang, G.; Zhu, A. The Influence of Hydrothermal Fluids on the REY-Rich Deep-Sea Sediments in the Yupanqui Basin, Eastern South Pacific Ocean: Constraints from Bulk Sediment Geochemistry and Mineralogical Characteristics. Minerals 2020, 10, 1141. https://doi.org/10.3390/min10121141
Zhou T, Shi X, Huang M, Yu M, Bi D, Ren X, Yang G, Zhu A. The Influence of Hydrothermal Fluids on the REY-Rich Deep-Sea Sediments in the Yupanqui Basin, Eastern South Pacific Ocean: Constraints from Bulk Sediment Geochemistry and Mineralogical Characteristics. Minerals. 2020; 10(12):1141. https://doi.org/10.3390/min10121141
Chicago/Turabian StyleZhou, Tiancheng, Xuefa Shi, Mu Huang, Miao Yu, Dongjie Bi, Xiangwen Ren, Gang Yang, and Aimei Zhu. 2020. "The Influence of Hydrothermal Fluids on the REY-Rich Deep-Sea Sediments in the Yupanqui Basin, Eastern South Pacific Ocean: Constraints from Bulk Sediment Geochemistry and Mineralogical Characteristics" Minerals 10, no. 12: 1141. https://doi.org/10.3390/min10121141
APA StyleZhou, T., Shi, X., Huang, M., Yu, M., Bi, D., Ren, X., Yang, G., & Zhu, A. (2020). The Influence of Hydrothermal Fluids on the REY-Rich Deep-Sea Sediments in the Yupanqui Basin, Eastern South Pacific Ocean: Constraints from Bulk Sediment Geochemistry and Mineralogical Characteristics. Minerals, 10(12), 1141. https://doi.org/10.3390/min10121141