Article

Effect of Stress Path on the Failure Envelope of Intact Crystalline Rock at Low Confining Stress

1
Department of Mining Engineering, Indian Institute of Technology Kharagpur, Kharagpur WB 721302, India
2
Department of Civil and Environmental Engineering, University of Alberta, Edmonton, AB T6G 2R3, Canada
*
Author to whom correspondence should be addressed.
Minerals 2020, 10(12), 1119; https://doi.org/10.3390/min10121119
Submission received: 31 October 2020 / Revised: 29 November 2020 / Accepted: 4 December 2020 / Published: 13 December 2020
(This article belongs to the Special Issue The Hydro-Mechanics of Crystalline Rocks)

Abstract

:
Numerical modelling is playing an increasing role in the interpretation of geological observations. A similar phenomenon is occurring with respect to the interpretation of the stress–strain response of intact rock measured in laboratory tests. In this research, the three-dimensional (3D) bonded particle model (BPM) with flat-jointed (FJ) contact was used to investigate the impact of stress paths on rock failure. The modified FJ contact model used for these studies numerically captured most of the intact rock behavior of Lac du Bonnet granite observed in the laboratory. A numerical simulation was used to track the behavior of this rock for different stress paths, starting with uniaxial tension and compression loading conditions. The migration from uniaxial tension to triaxial compression is challenging to simulate in physical laboratory tests but commonly observed around underground excavations. The numerical modelling methodology developed for this research tracks this stress path and the impact of the intermediate stress on peak strength at low confinements, commonly found around underground excavations.

1. Introduction

Design parameters of rock typically start with the results from laboratory testing carried out for the stress conditions and the stress path expected in the field; however, as noted by Brady and Brown [1], this can rarely be achieved. Near the boundary of an underground opening, the rock can be subjected to a variety of stress conditions ranging from confined extension to confined compression [2,3]. Kaiser et al. [4] used in situ strain cells to track the stress path followed by the excavation boundary. While the rock near the boundary was initially subjected to all-around compressive stresses, by the end of the excavation those stresses had converted to confined extension. The microscale stress path followed and its damage on an intact rock during coring was investigated numerically by Bahrani et al. [5]. Developing a laboratory test methodology that can track the stress path reported by Kaiser et al. [4] is not yet possible. Consequently, the failure of rock is typically tested using simplified stress paths, such as direct tension, uniaxial compression, and triaxial compression. A consequence of this simplification is the limited ability to track the progressive fracture of rock from confined compression to confined extension.
Analyses of stress-induced failures observed around underground excavations show that the mobilized strength of sparsely fractured and massive rock masses is typically one-third to one-half the strength measured in laboratory compression tests [6,7,8]. The difference between the monotonic stress path used in laboratory strength tests vs. the load–unload complex stress path followed by the rock mass around the tunnel is often suggested as the primary reason for this difference [4,9,10,11,12,13]. Advances in numerical modelling provide an opportunity to revisit this assumption.
In this research, the three-dimensional (3D) BPM with FJ contact [14] was used to investigate the impact of stress paths on rock failure. Using the FJ contact model, Refs [15,16] show that most of the intact rock behavior of Lac du Bonnet granite observed in the laboratory can be captured numerically. A numerical simulation that followed the laboratory behavior of Lac du Bonnet granite was used to track the behavior of this rock under confined extension and triaxial loading conditions for different stress paths. The impact of the intermediate stress on peak strength at low confinements, commonly found around underground excavations, was also investigated.

2. Background

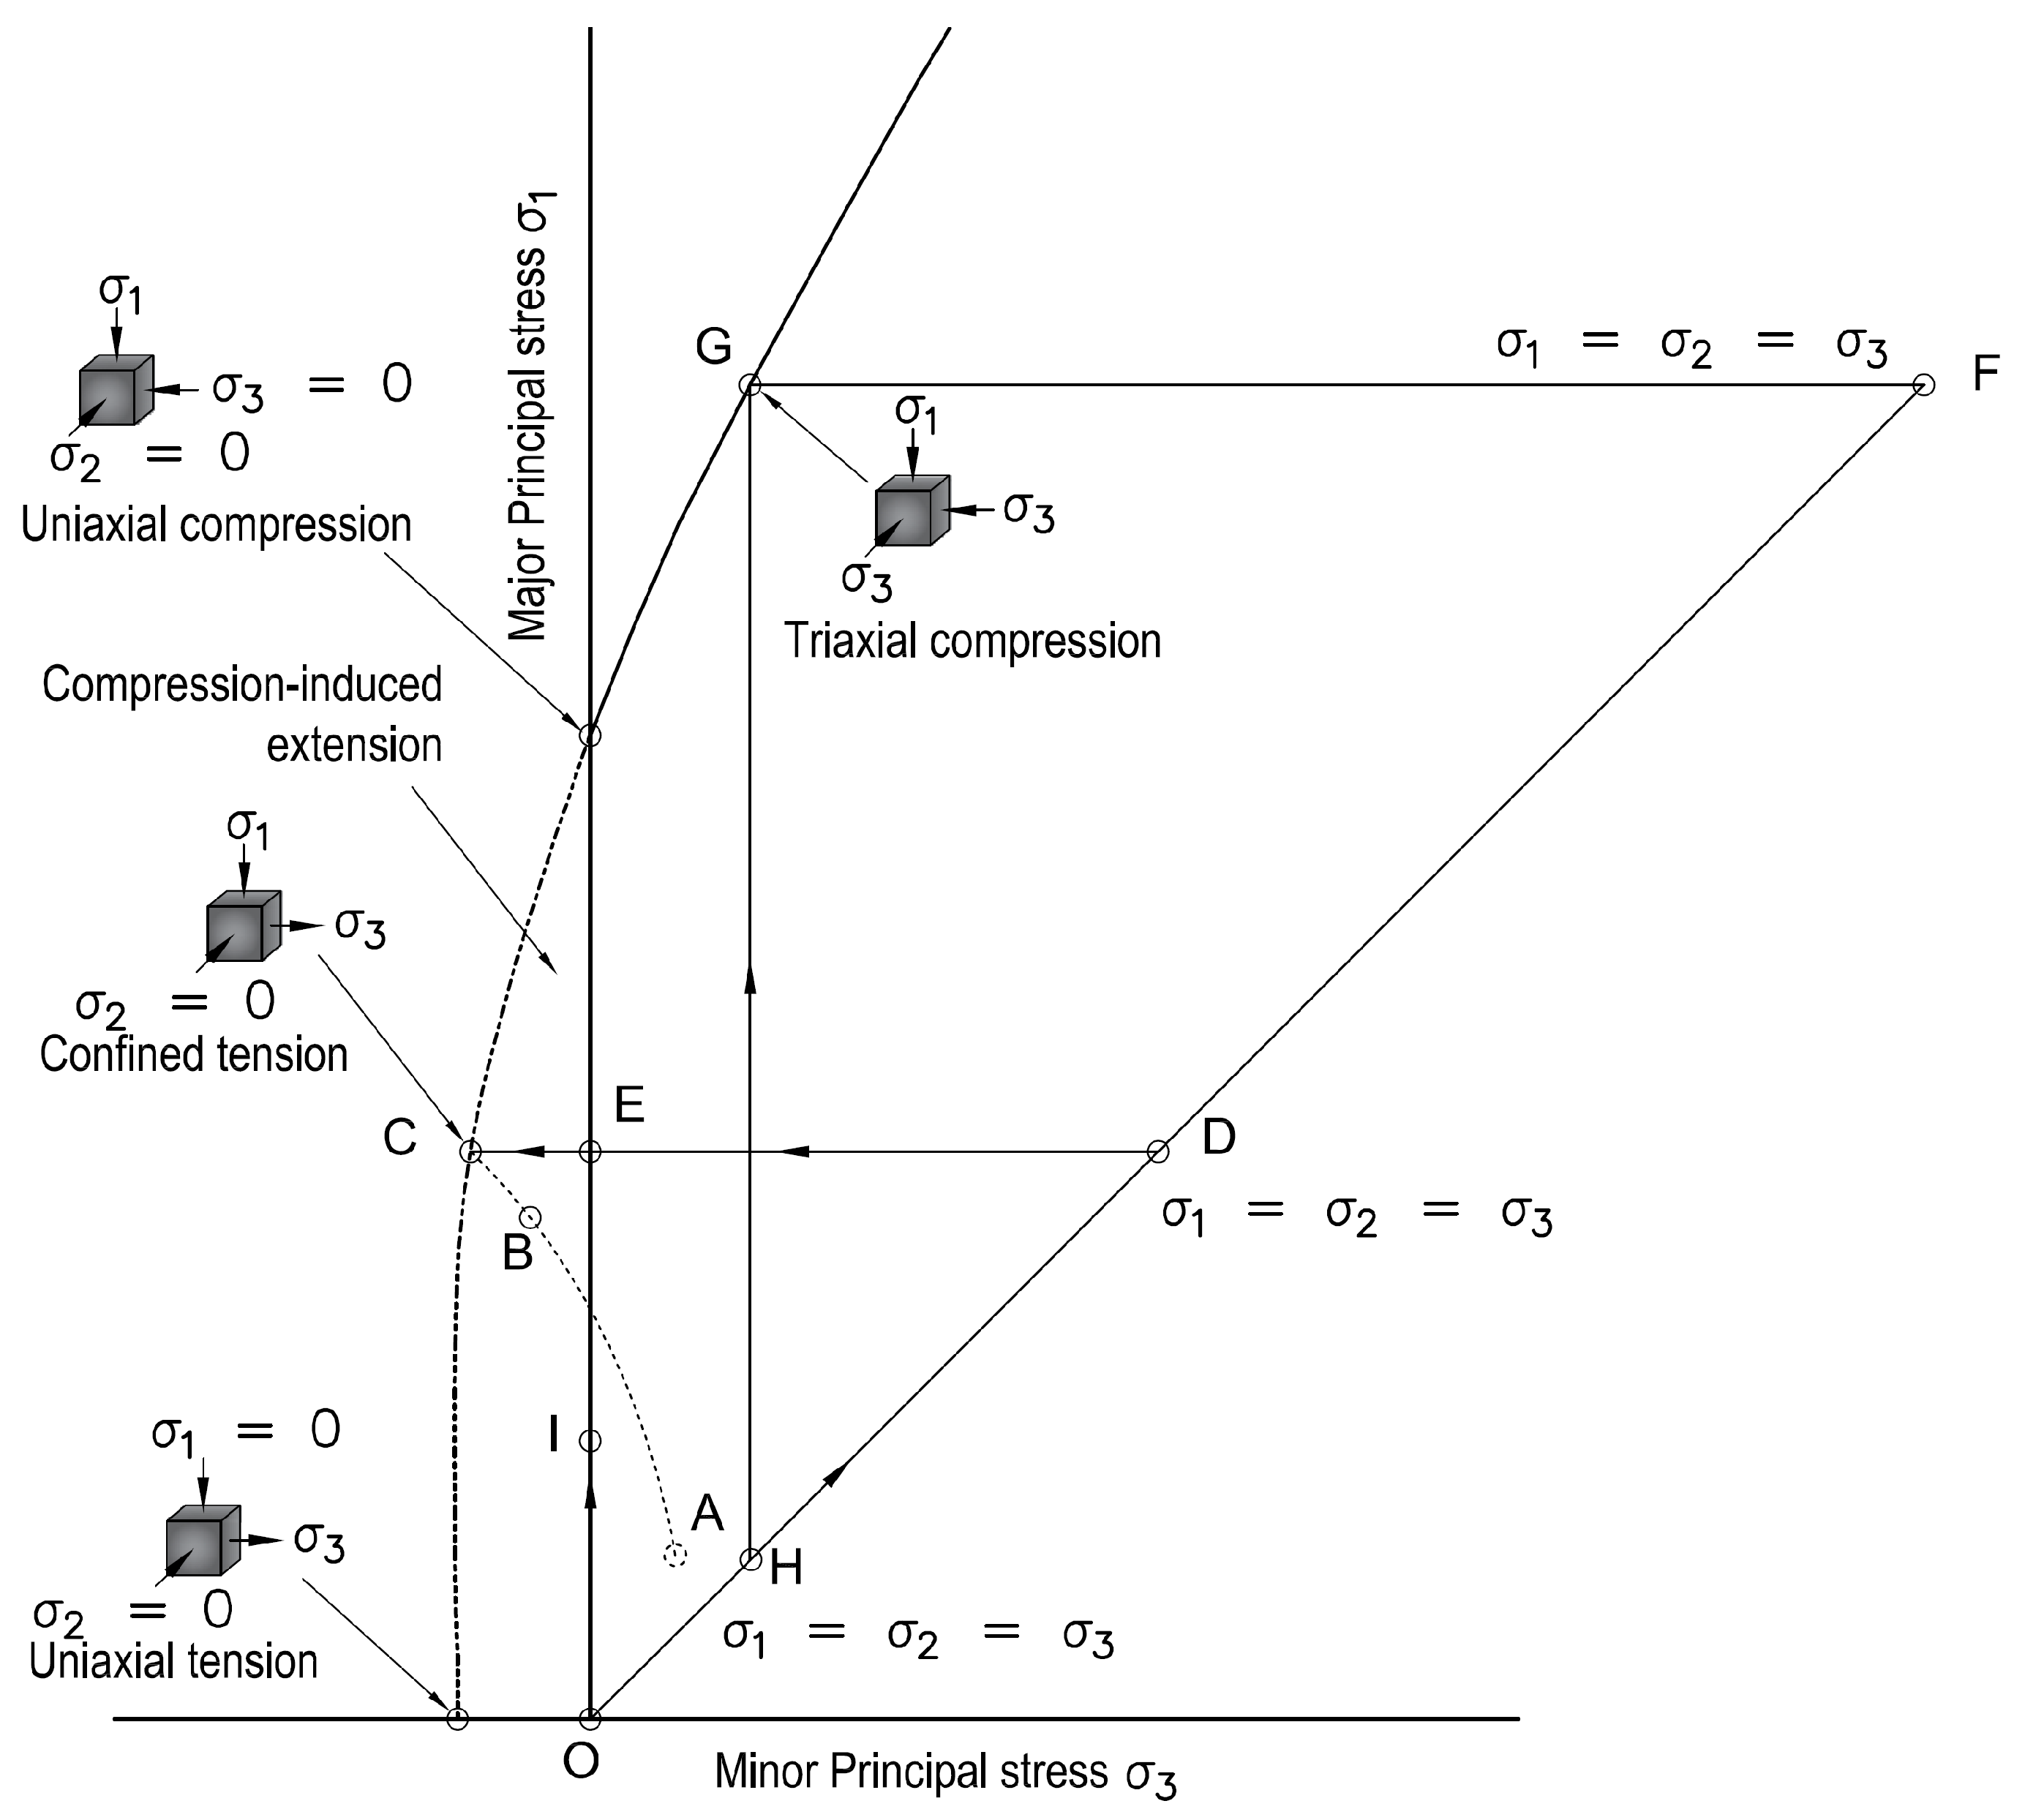
2.1. Stress Paths Observed in the Field and in Typical Low Confinement Laboratory Tests

The stress paths taken by laboratory sample tests in direct tension [17], uniaxial compressive strength (UCS) [18], and triaxial tests are shown in the σ1–σ3 plot in Figure 1. In the direct tension and UCS tests, the principal stress monotonically increases from an initial state with zero stress until the sample fails. Similarly, in the triaxial test, a sample is initially taken to a hydrostatic condition and then σ1 is monotonically increased until failure occurs.
The stress path for the rock surrounding an opening can be obtained from direct field measurements during construction (Figure 2) or using 3D numerical modelling of the opening considering the geometry of the opening and the excavation sequence (Figure 1). As shown in Figure 1, the stress path for rock that is 50 mm above the crown is complex. Figure 1 shows the results of numerical modelling of a mine-by tunnel [9] excavated in Lac du Bonnet granite and the Hoek–Brown (H–B) failure envelope obtained from laboratory triaxial testing of the rock. Point A in the σ1–σ3 plot in Figure 1 represents the in situ stress condition. Path ABCDE shows the change in σ1 and σ3 values as construction progresses towards point A and passes through it. The dashed line near point B, σ1 − σ2 = (1/3)UCS, represents the stress level around which crack initiates in the rock. When the stress path approaches point B, microcracks start forming in the rock and, thereafter, the damage process leading to failure depends upon the stress path it takes.
Kaiser et al. [4] used CSIRO HI stress cells for stress measurements to obtain the stress path directly from field measurements in the hanging wall of the a mine stope. Figure 2 shows the stress path taken by σ1 and σ2 versus σ3. Comparing the initial and final stress states shows the presence of a stress rotation in addition to changes in the magnitudes of the principal stresses. Figure 1 and Figure 2 show that, during the stress path, rock can come across a condition where one of the principal stresses can be compressive and the other tensile. This is called a confined extension condition and is explored in the next section.

2.2. Laboratory-Confined Extension Test on Rock

Confined tensile fracturing occurs in rock under mixed tensile and compressive stress conditions, and a test for this situation was proposed by Brace [19]. As shown in Figure 3, all-around compressive stress (P) and vertical compressive force (F) are initially applied to the model. The load (F) on the top and bottom platens is then gradually reduced until the specimen fractures. The confining stress in the curved part of the sample generates the tensile stress in the central part. The compressive and tensile stresses at failure are then calculated from Equations (1) and (2):
σ 1 = σ 2 = P ,
  C = σ 3 = P ( A h A t ) A t + F A t ,
where C is the axial stress (positive in tension), F is the axial force (negative F acts towards sample), P is the confining pressure (positive), Ah is the head area, and At is the throat area. The confined extension test conducted is called the triaxial confined extension test when σ2 = σ1. Rock tested in triaxial confined extension and triaxial tests in the same range of confinement shows that samples tested in triaxial confined extension fail at a considerably higher peak stress. The data available in the literature for confined extension are very limited. Two rocks subjected to extensive triaxial confined extension tests are Carrara marble [20] and Berea sandstone [21], shown in Figure 4a,b. Patel and Martin [22] compared the biaxial strength (σ1 = σ2 = compressive, σ3 = 0) obtained from laboratory UCS testing of these two rocks and observed a clear impact of σ2 on peak strength. If the confined extension test results (σ1 = σ2 > σ3) are compared with triaxial test results (σ1 > σ2 = σ3), there is a clear mismatch for both rock types (Figure 4). In the UCS tests, the difference is 41% and 22% for Carrara marble and Berea sandstone, respectively. The reason for this is yet unknown and could be due to the different stress path taken or the impact of σ2. This is explored in the next sections.
Patel and Martin [22] used the flattened Brazilian test to test the sample in confined extension with σ2 = 0, where increased confinement was tested based on samples with an increased depth of flattening. However, the maximum confinement achieved using the flattened Brazilian test was 37% of the UCS. The FJ BPM was therefore used to investigate confined extension.

2.3. Flat-Jointed Bonded Particle Model

In the BPM, the mineral grains in a rock sample are represented by rigid spheres bonded at their contacts. This model has many applications from fundamental research on rock mechanics [24] to large-scale applications [25]. Potyondy and Cundall [26] first introduced the parallel BPM, which had a few shortcomings. For example, it cannot capture the high value of the UCS/σt ratio of low porosity rocks [7] and requires cluster logic to increase the friction angles to more realistic values and increase the triaxial strength after calibrating the UCS [26]. Therefore, Potyondy [14] suggests the FJ BPM to address these limitations.
Figure 5a shows the 3D FJ model used in this investigation. The mineral grains are represented by grey spheres and the contacts by disk-shaped blue FJs. The FJ contacts are further discretized along the radial and tangential directions as shown in Figure 5b. Each element in the FJ contact can fail separately when an external load is applied. Potyondy [14] shows that the moment-carrying capacity of partially failed FJ is essential to produce the high UCS/σt ratio. Patel and Martin [16] further investigated the role of initial microcracks present in a rock sample. They showed that an FJ sample with initial microcracks is essential to capture the initial nonlinearity, crack initiation stress, and tensile and compressive Young’s moduli in addition to the UCS/σt ratio of intact rock.

3. Calibration of Microparameters for Lac du Bonnet Granite for the BPM

The first step in the FJ BPM is to obtain the microparameters for the grains and FJ contacts. These microparameters cannot be obtained experimentally and an iterative method is needed. Table 1 shows that an FJ contact requires 18 parameters for calibration, along with the parameters associated with grain-size distribution and linear material group. These parameters are described in the material modelling support manual [27]. Patel [28] describes how a set of microparameters can be efficiently obtained for a numerical rock sample to consistently reproduce the results of a real rock sample. The FJ model was used in this study to capture the rock behavior observed in the laboratory during UCS, triaxial, and direct tension tests. Using a single mineral grain type and an average of 15 particles along the width of the sample, it was possible to produce reasonable (a) bi-modularity of the rock, (b) initial nonlinearity in the axial stress–strain curve during UCS and triaxial tests, (c) crack initiation stress and crack damage stress in an UCS test, (d) ratio between the UCS and direct tension test, and (e) other responses of the laboratory sample during triaxial tests. The final set of parameters used in this investigation, which mimic the behavior of Lac du Bonnet granite, is presented in Table 1.

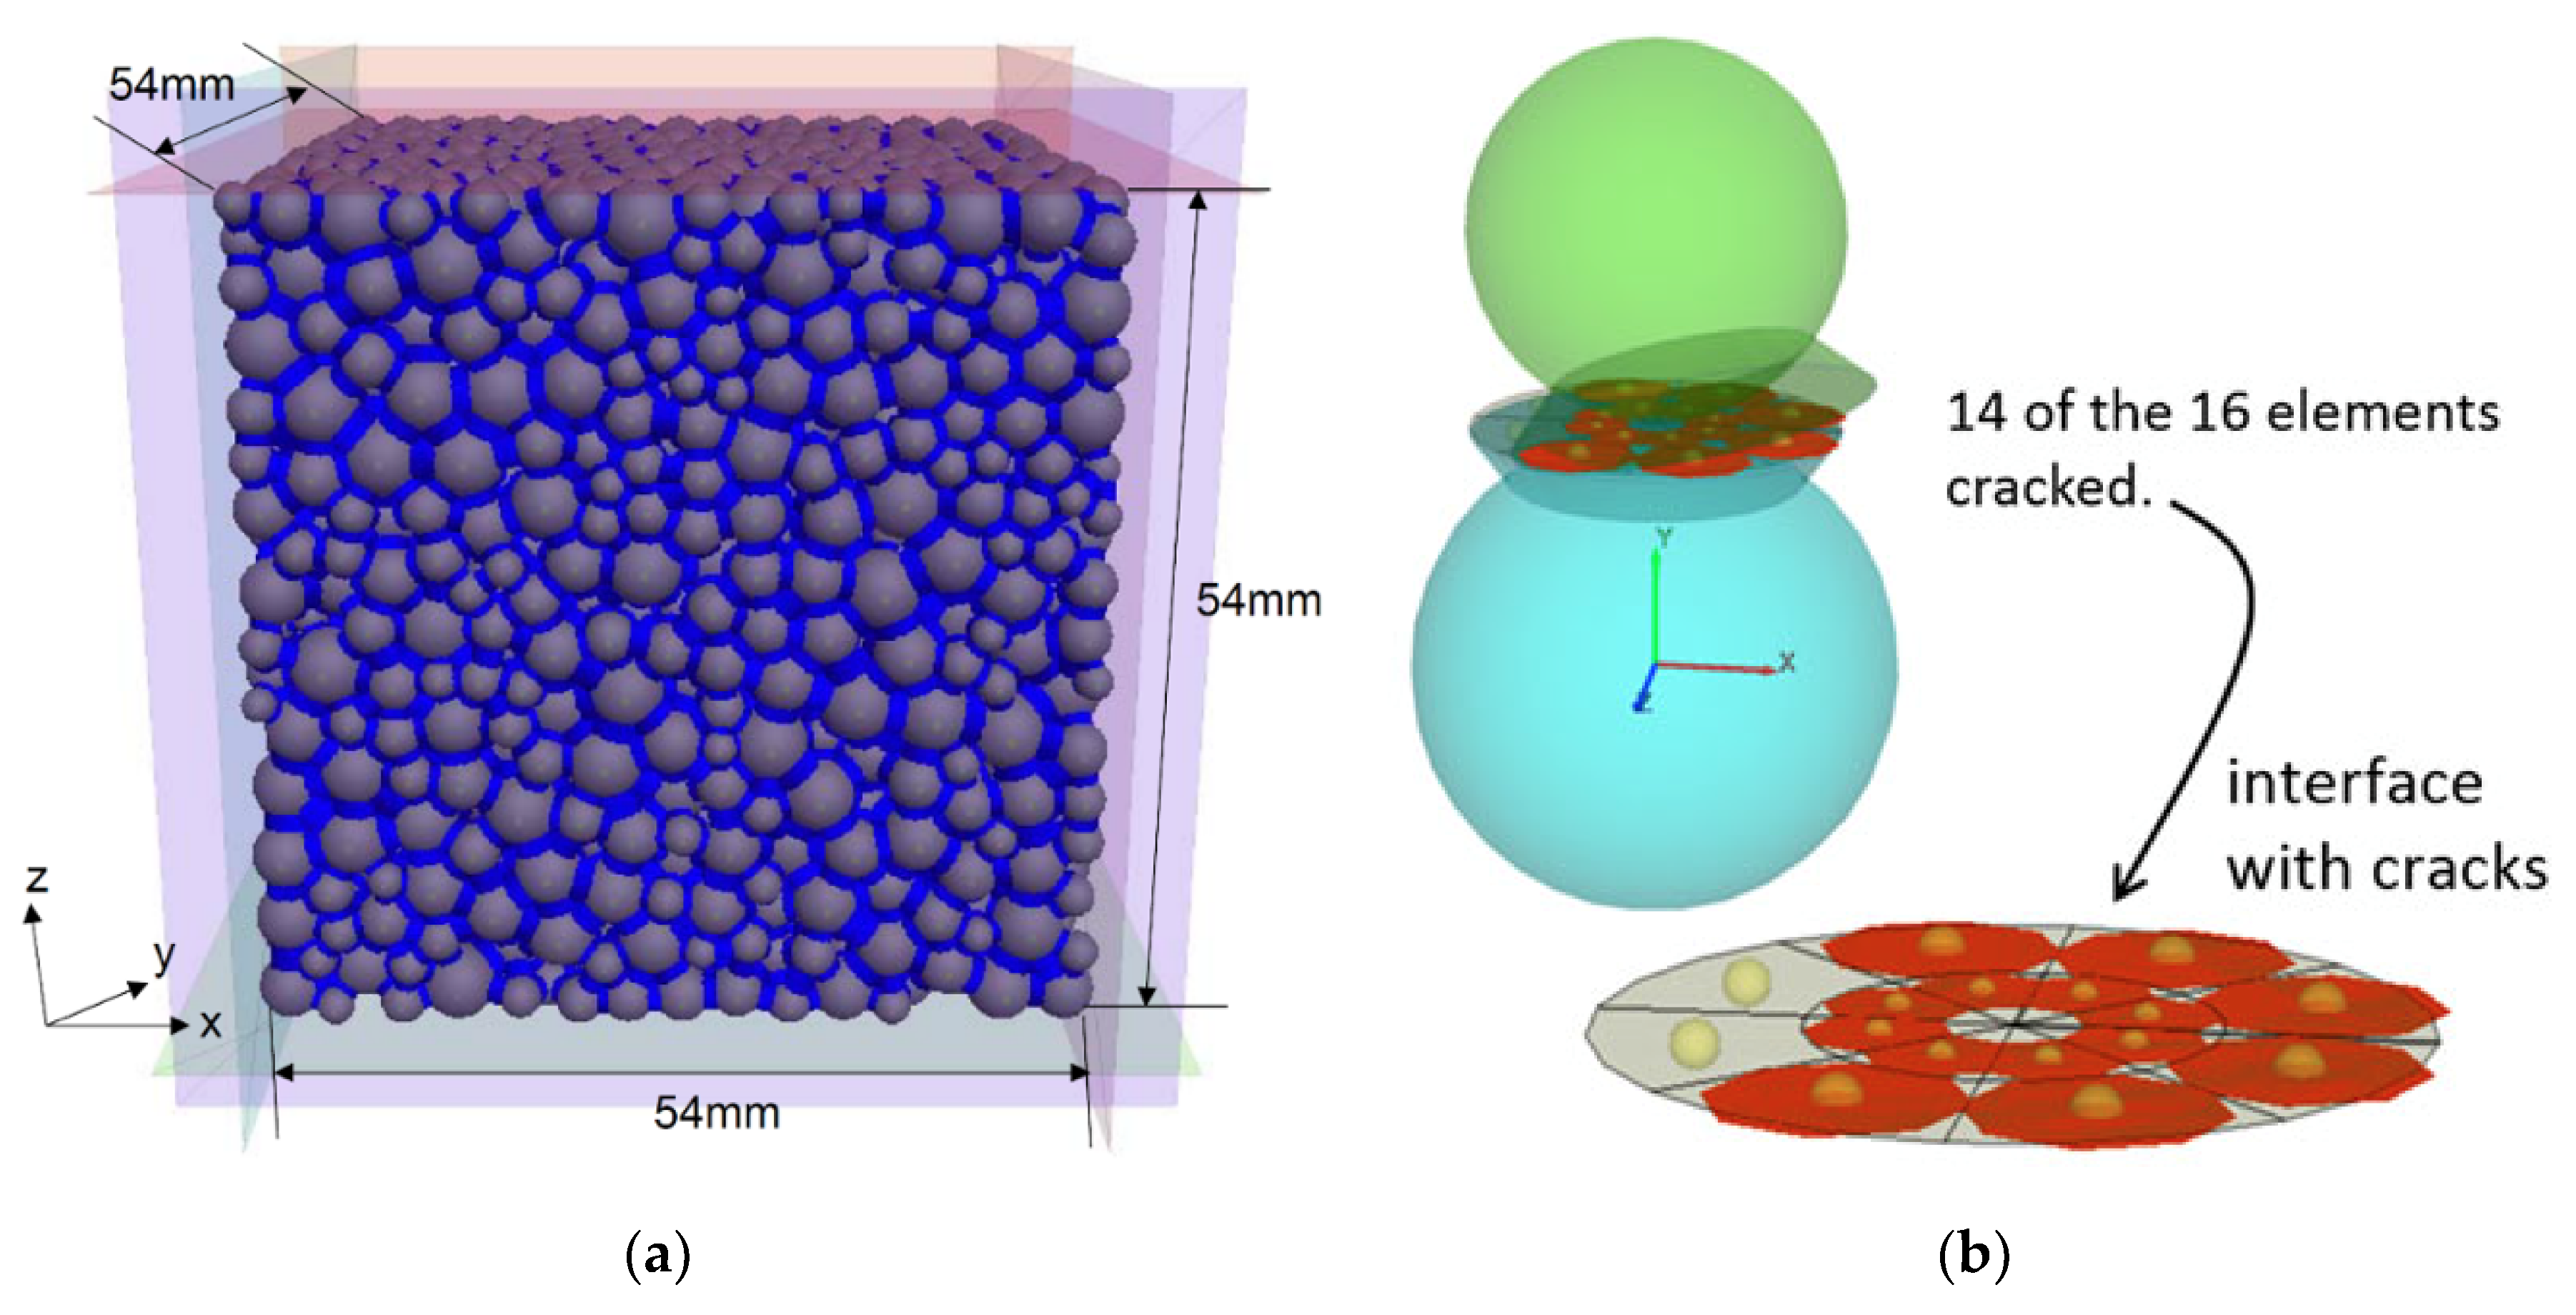
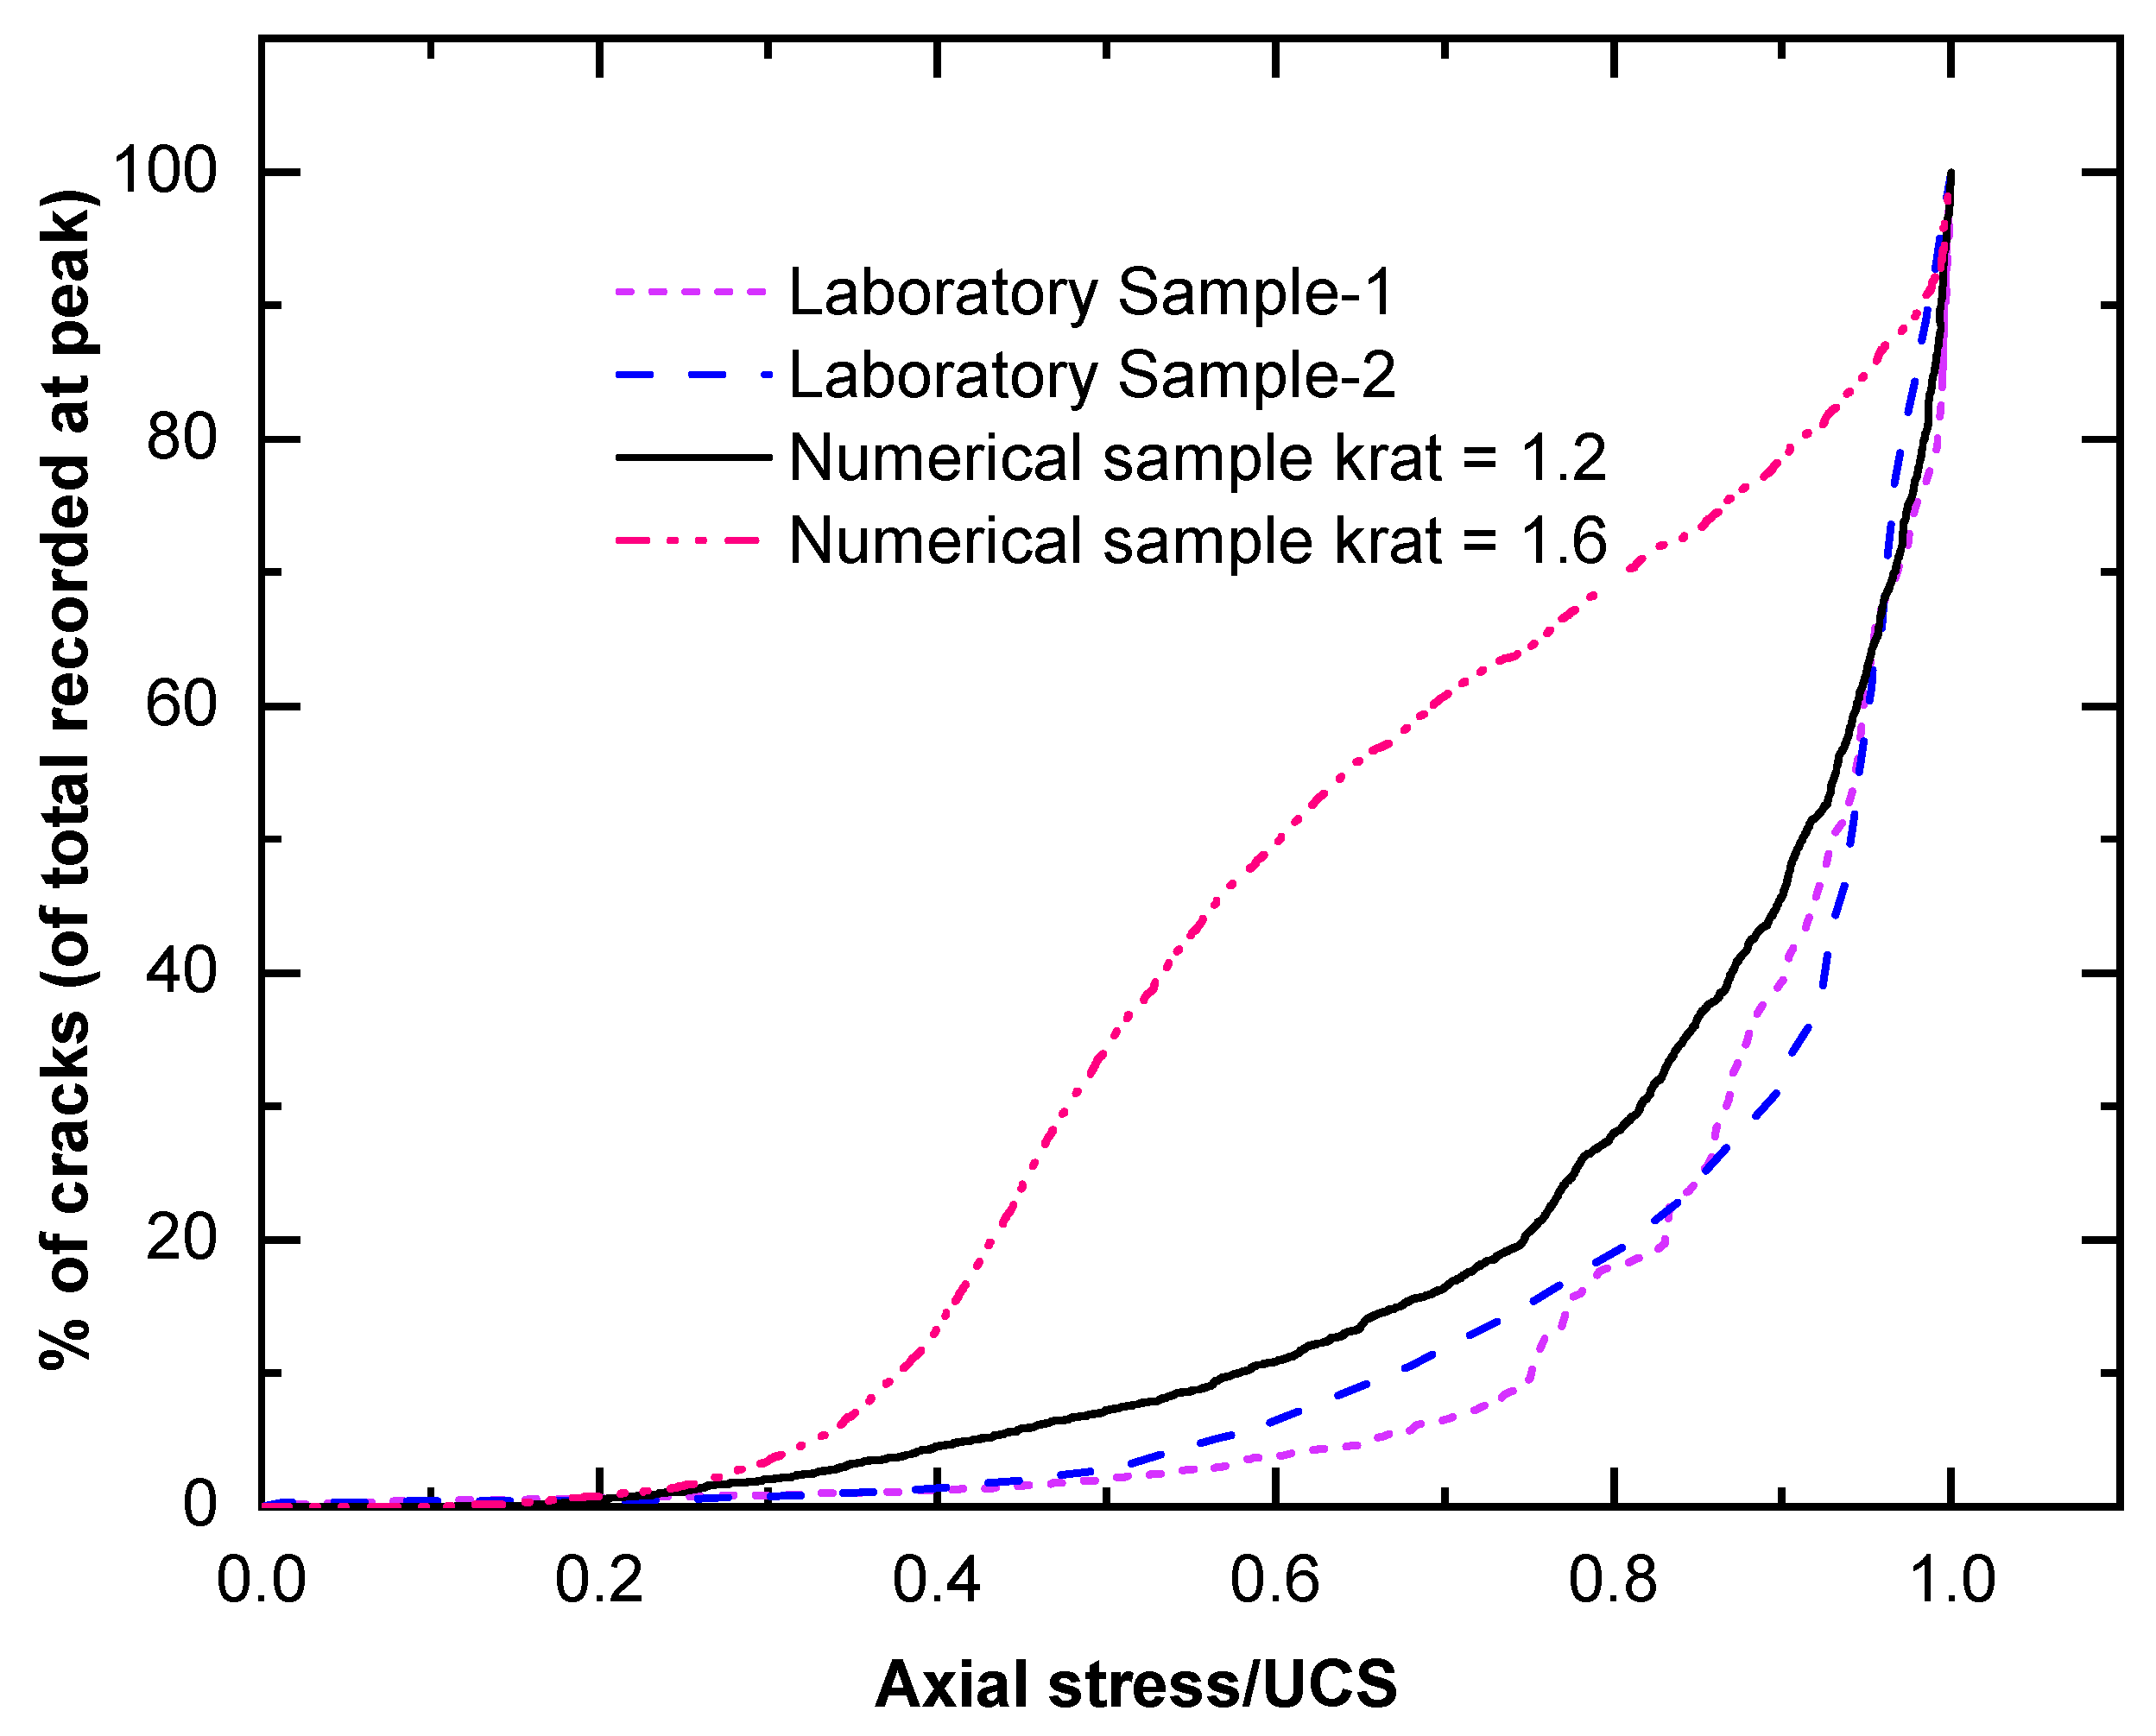
3.1. Intergranular Stiffness Ratio and the Formation of Microcracks in the Sample

The ratio between the normal and shear stiffness (krat) between the mineral grains plays an important role in microcrack formation in the sample during UCS testing. Keeping the normal stiffness constant but increasing the ratio allows the intergranular slide to happen more easily, forming an early generation of crack and a higher Poisson’s ratio for the numerical sample. To match the Poisson’s ratio of the material, a common practice is to assume a ratio value of around 1.5 (e.g., [15]. However, we found out that, in the FJ sample during the UCS test, tensile cracks start forming at an early stage of loading (around 10% of peak) and the curve between the total number of the cracks in the numerical sample versus the axial load does not support laboratory observations. This is shown in Figure 6, where the crack generated for the numerical sample with krat = 1.6 calibrated by the laboratory macroparameters is compared with the laboratory Lac du Bonnet granite samples.
When numerical models were studied in both compression and tension, the early generation of cracks had a minor impact on the UCS test but a major impact on the confined extension tests because of the stress path. When a sample subjected to compression was tested in tension, the early microcracks considerably reduced the strength of the rock. To reduce the formation of early cracks and match the laboratory crack formation for Lac du Bonnet granite, the krat was reduced to 1.2 keeping all other microparameters constant. This changed most of the macroparameters obtained for the numerical sample. The model was then recalibrated to the direct tensile strength, Young’s moduli, crack initiation stress, and peak strength from the UCS test. The corresponding set of microparameters is given in Table 1. Figure 6 shows the crack formation in the calibrated numerical sample vs. the laboratory observations. A krat of 1.2 considerably reduces the crack number and more closely matches the crack formation noted in the laboratory. Table 2 also shows that the data match most of the microparameters observed in the laboratory.

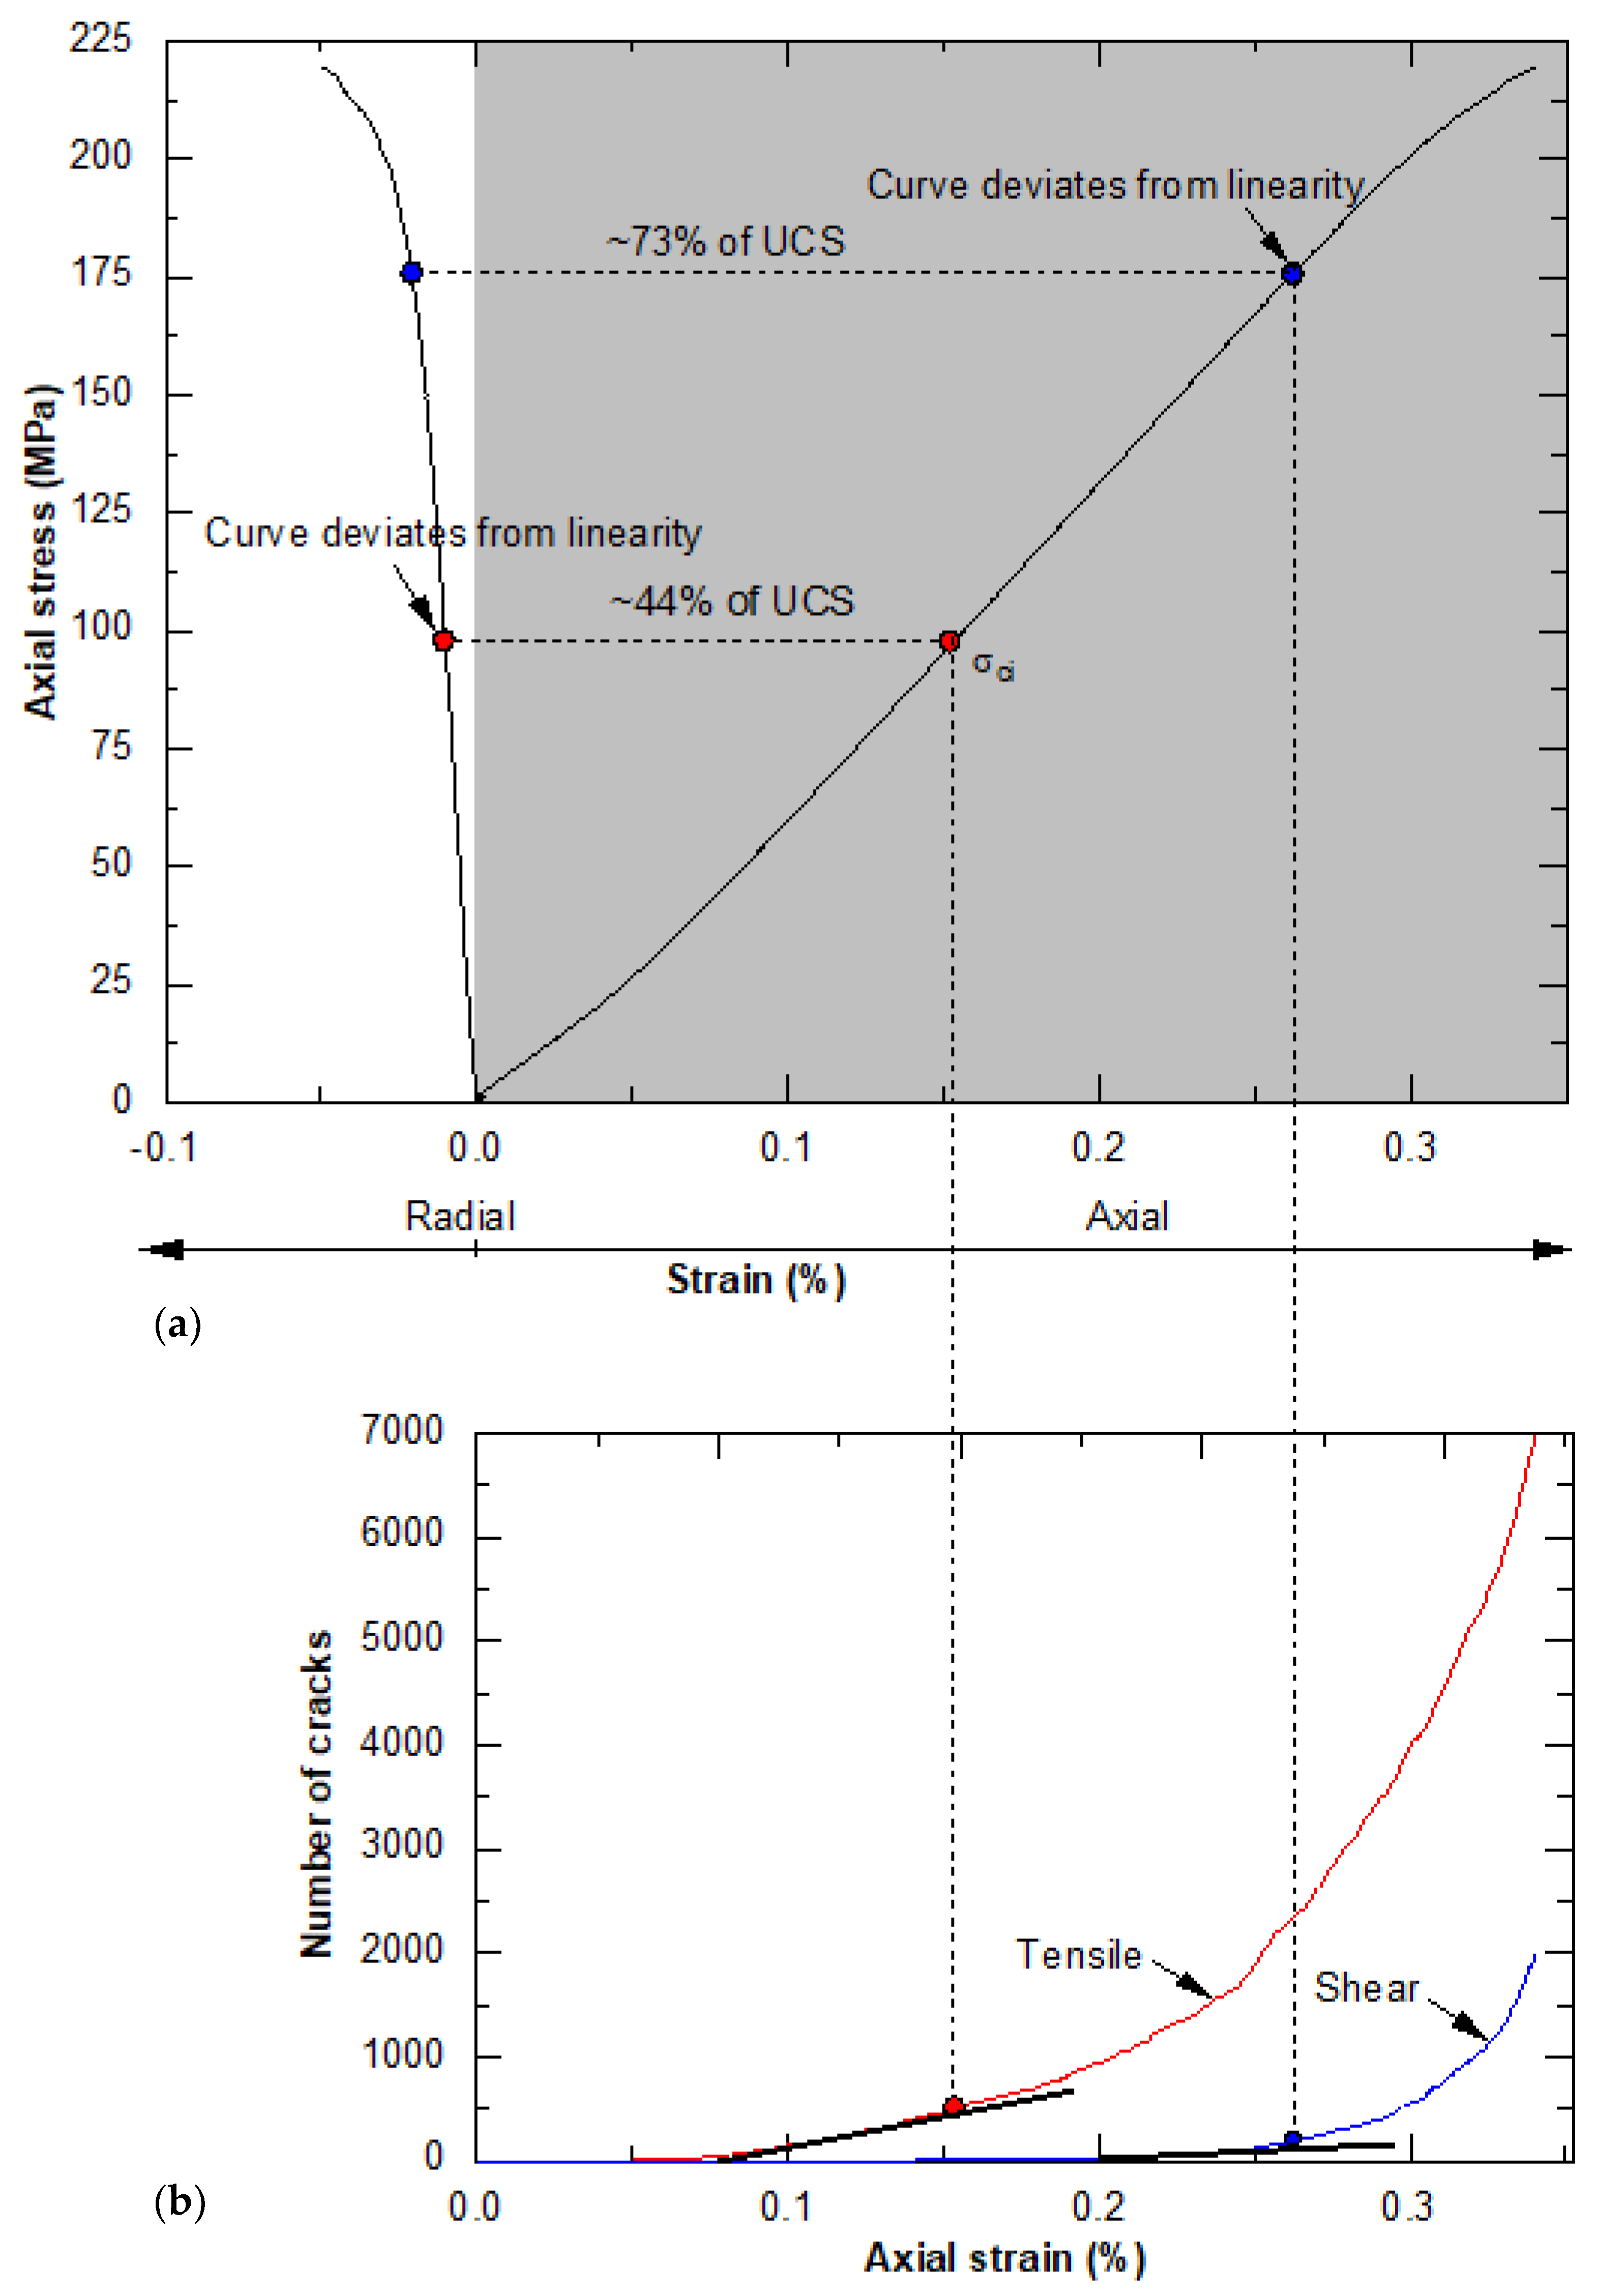
3.2. Comparison of Laboratory Response of the Lac du Bonnet Granite Sample with the FJ Numerical Sample for the UCS Test

The stress–strain curve obtained for a numerical sample with tensile and shear cracks generated due to an increase in axial strain is shown in Figure 7. The initial nonlinearity in the stress–strain curve, which is typical of UCS and triaxial rock testing, was captured by considering microgaps between the mineral grains present in the laboratory sample. The numerical sample exhibited bi-modularity (different Et and Ec) when stress-released microfractures were included in the model. The ratio between the simulated Et and Ec was 0.69, which is within 5% of that obtained from laboratory testing. The crack initiation stress (σci) is the point in the axial stress vs. radial strain curve where the curve deviates from linearity after the initial elastic region; this value was 97.7 MPa for the numerical sample vs. 88.6 MPa in the laboratory. When the σci point was projected down in Figure 7, it matched the point where tensile microcracks started forming rapidly in the sample. Because only tensile cracks formed before σcd, these cracks cannot be reflected in the axial stress versus axial strain curve. As shown in Figure 7, the axial stress versus axial strain curve deviates from linearity when the shear cracks start in the sample. These observations are in line with the laboratory findings of many researchers, such as Brace et al. [31] and Bieniawski [32]. The macroparameters for the numerical sample are compared with the Lac du Bonnet granite sample in Table 2.

4. Confined Extension Test Using the FJ BPM

As shown in Figure 1 and Figure 2, rock around an opening may encounter confined extension conditions when σ1 is compressive and σ3 is tensile. Schöpfer et al. [33] and Huang and Ma [34] use the parallel BPM to investigate rock under confined extension. The present study used the FJ code to investigate the intact rock behavior in confined extensions after obtaining acceptable results for the numerical sample compared to the typical laboratory test samples.
The central part of the sample, Figure 3, used in the laboratory testing of rock in confined extension passes through the stress path ODEC, as shown in Figure 8. The sample at zero confinement (point O) is subjected to hydrostatic stress (point D). The σ3 is then gradually reduced, keeping σ1 and σ2 constant until the sample fractures at point C. Samples that fail along such a stress path are influenced by σ2 [35]. For the investigation of the confined extension on the numerical sample (Figure 3) with no σ2, the following steps were taken: (A) the cubical sample shown in Figure 5 was hydrostatically confined to a particular magnitude of σ1 (point D, Figure 8); (B) keeping σ1 constant, σ2 and σ3 were simultaneously reduced (point E, Figure 8); (C) the top and bottom 5 mm of the sample were then held and pulled in opposite directions keeping σ1 constant and σ2 at zero until the sample failed at point C (Figure 8). The x-coordinate gives the magnitude of σ3 for the corresponding σ1; and (D) steps A–C were then repeated for different magnitudes of σ1 to obtain different failure points in confined extension.

5. Results of FJ Modelling

5.1. Influence of Stress Path on a Confined Extension Test

As shown in Figure 8, point A represents an in situ stress condition with σ1 ≥ σ2 ≥ σ3. Due to the excavation, i.e., change in the boundary condition, the rock at this point may fail in confined extension following path ABC. However, this stress path is case dependent and can be complex. The path followed by the conventional confined extension test using the dog-bone-shaped geometry is ADEC (Figure 8). The microfracture formation in rock and its peak strength are path dependent. To compare the impact of the stress path followed, paths ODEC and OEC were compared for the numerical FJ sample. As shown in Figure 9, more cracks form (533 vs. 470) in the sample when it follows stress path OEC (a low confinement stress path compared to ODEC), although the final stress conditions are similar (90 MPa at E). This influences the peak strength obtained from the samples due to the application of tensile load. As shown in Figure 10, stress paths ODEC and OEC have a 3.6% difference in peak strength.
Figure 11a,b compares the tensile and shear cracks generated in the sample when it moves from point E to point C. The number of shear cracks formed in the numerical sample is greater when the stress path followed in the laboratory is considered, which supports the results of Ramsey and Chester [20]. Stress path ODEC was considered to compare the numerical results with the laboratory results.

5.2. Results of the Confined Extension Test with σ2 = 0

Using the steps described in Section 4, confined extension tests were carried out at different magnitudes of σ1. The stress–strain results for the tests between points E and C (Figure 8) at three stress levels—low (10 MPa), medium (90 MPa), and high (150 MPa)—are shown in Figure 12. At low confinement, the sample fails similar to a direct tension test sample. However, because of the confinement, the sample fails at a higher tensile stress (i.e., similar to the Brazilian tensile strength being greater than the direct tensile strength for Lac du Bonnet granite). With an increase in confinement, the peak strength of the sample increases (up to around 50% of the UCS value). As shown in Figure 13 and Figure 14, tensile cracking dominates at low confinement, while the percentage of shear cracks increases with increasing confinement. This finding is in agreement with observations by Brace [19] and Ramsey and Chester [20] using confined extension tests on dog-bone-shaped samples.
The confinement in the numerical sample was then increased from 10 MPa to around 80% of the UCS, which is around the σcd of Lac du Bonnet granite. When a sample with confinement more than the crack damage stress is relaxed from point D to point E (Figure 8), equilibrium is not reached and the sample fails. This observation indicates the peak strength obtained after the crack damage stress depends upon the applied boundary condition.
The sample was then further confined beyond the UCS (point F, Figure 8) and σ2 and σ3 gradually relaxed until the sample failed at point G (Figure 8). The results are plotted and a discussion is presented in Section 6. These results are also compared with the conventional triaxial stress (stress path OFG vs. OHG) in Section 6.

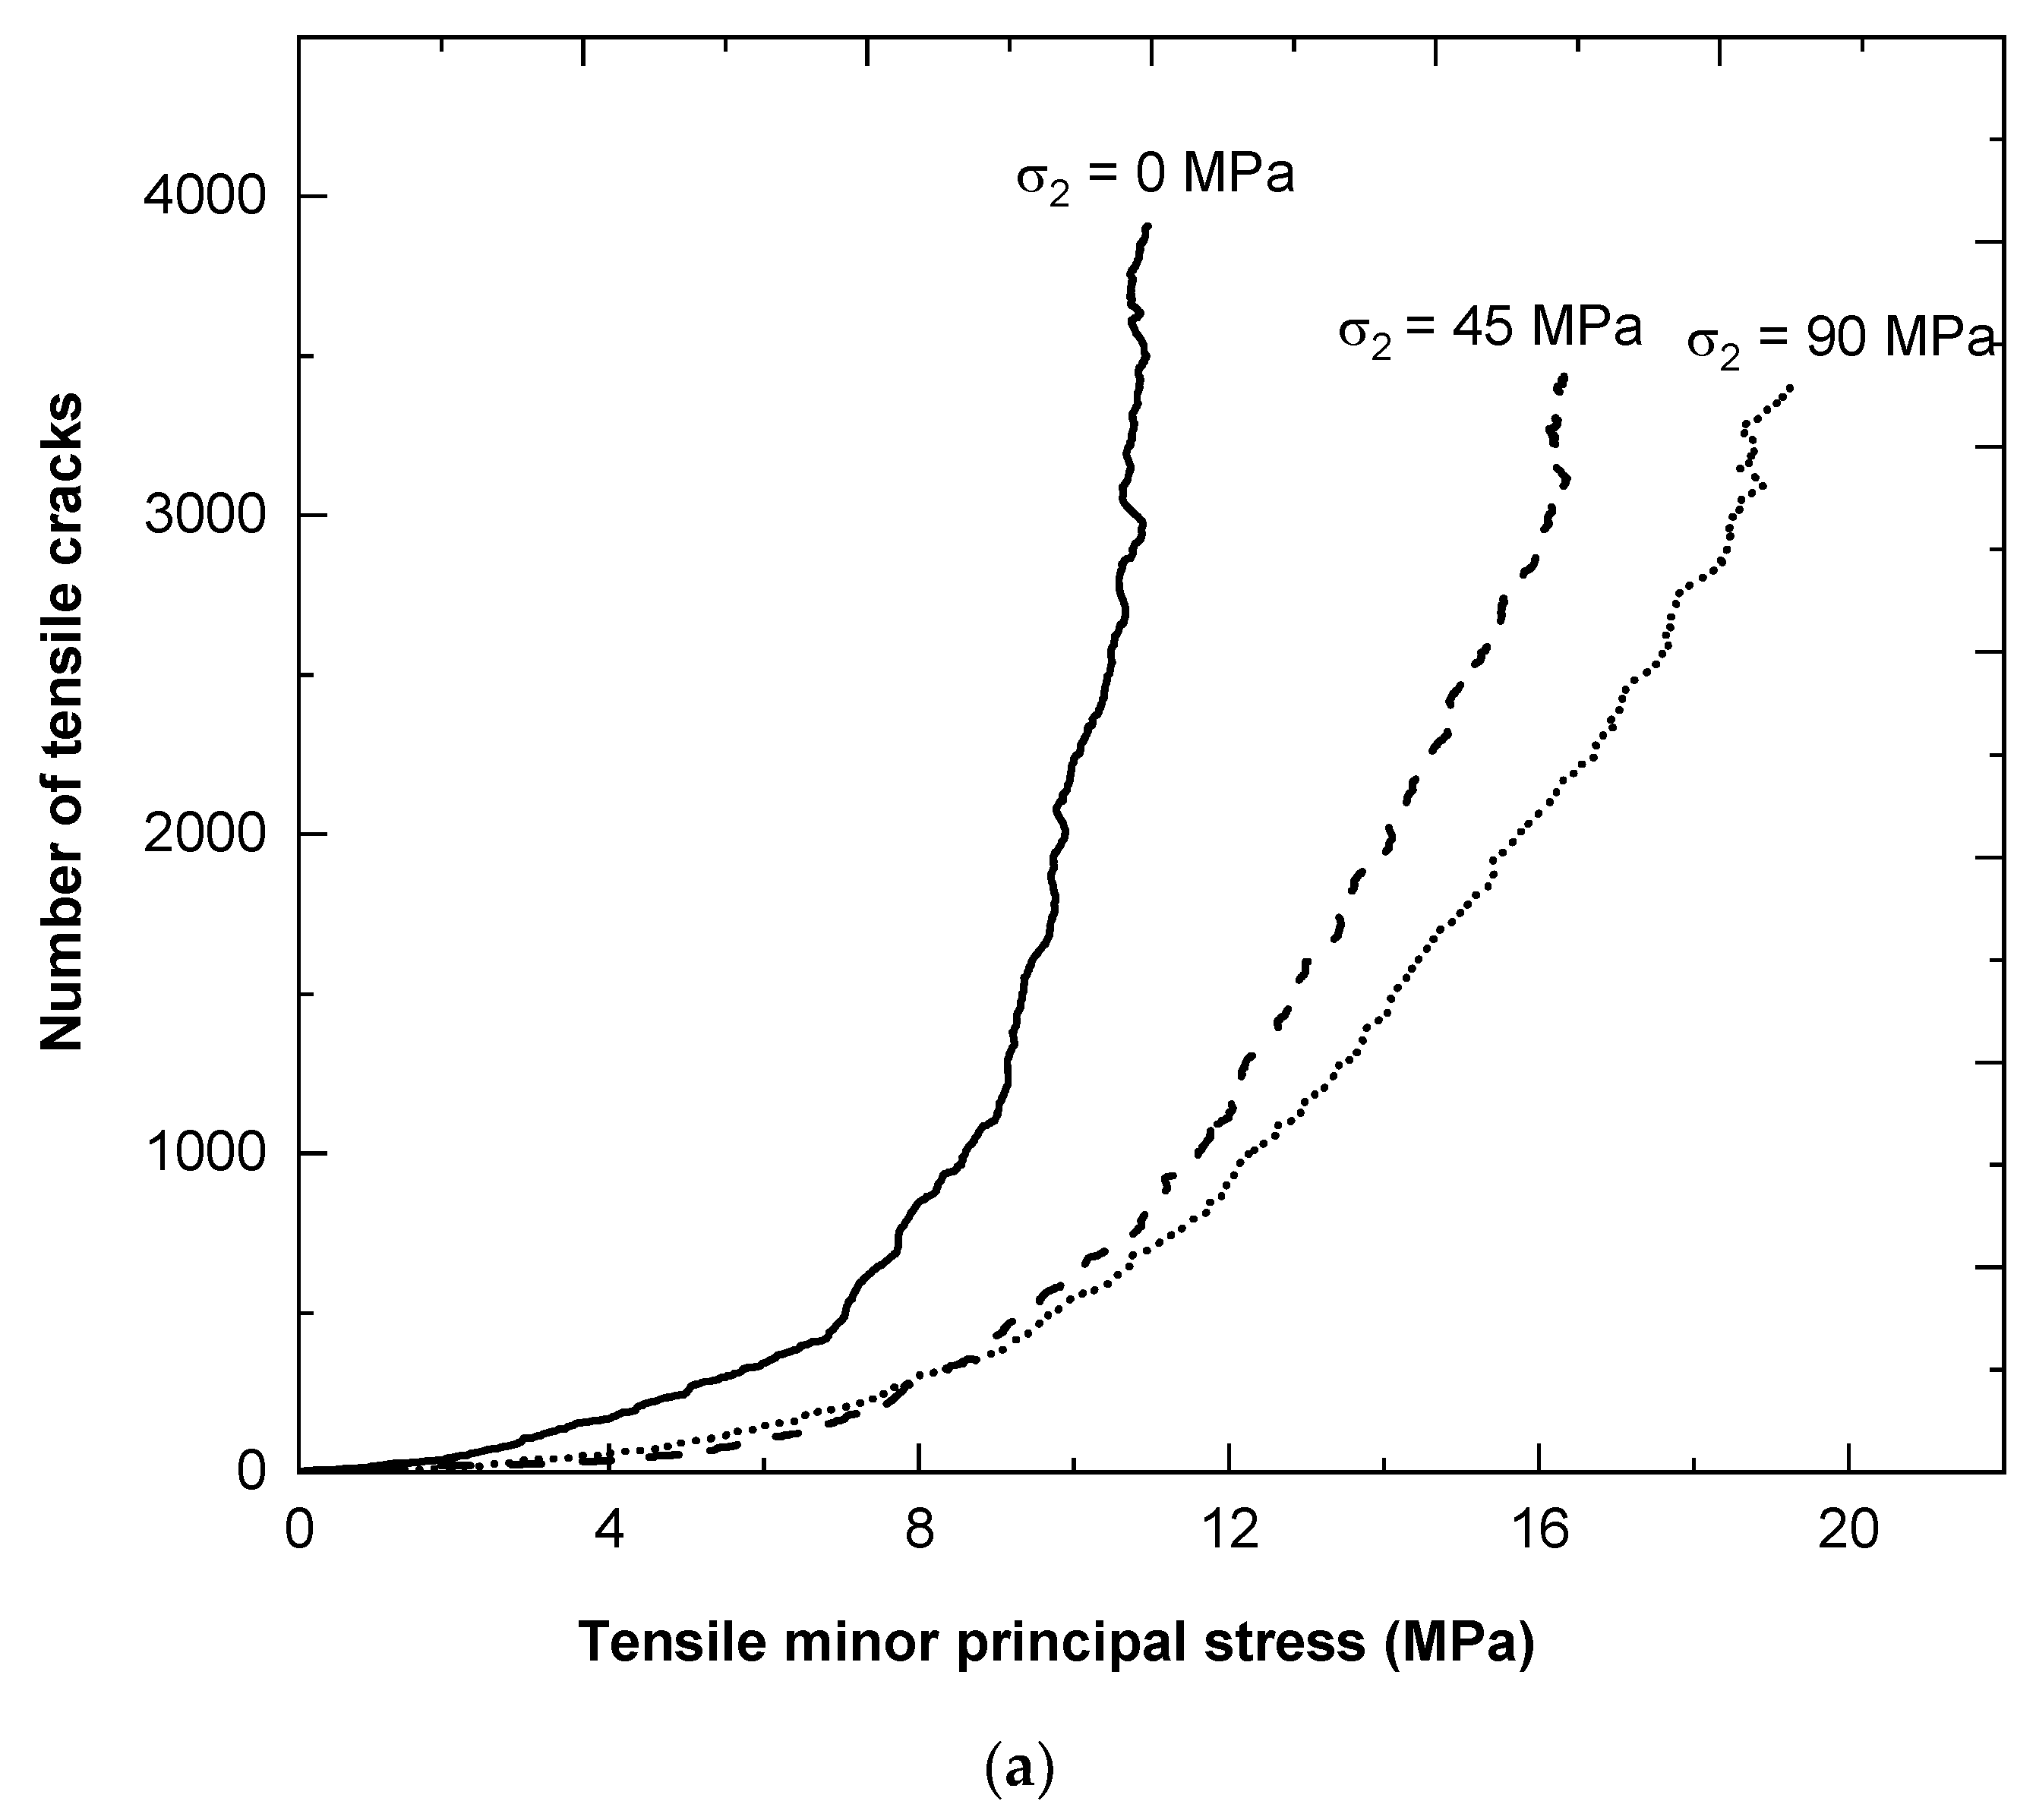
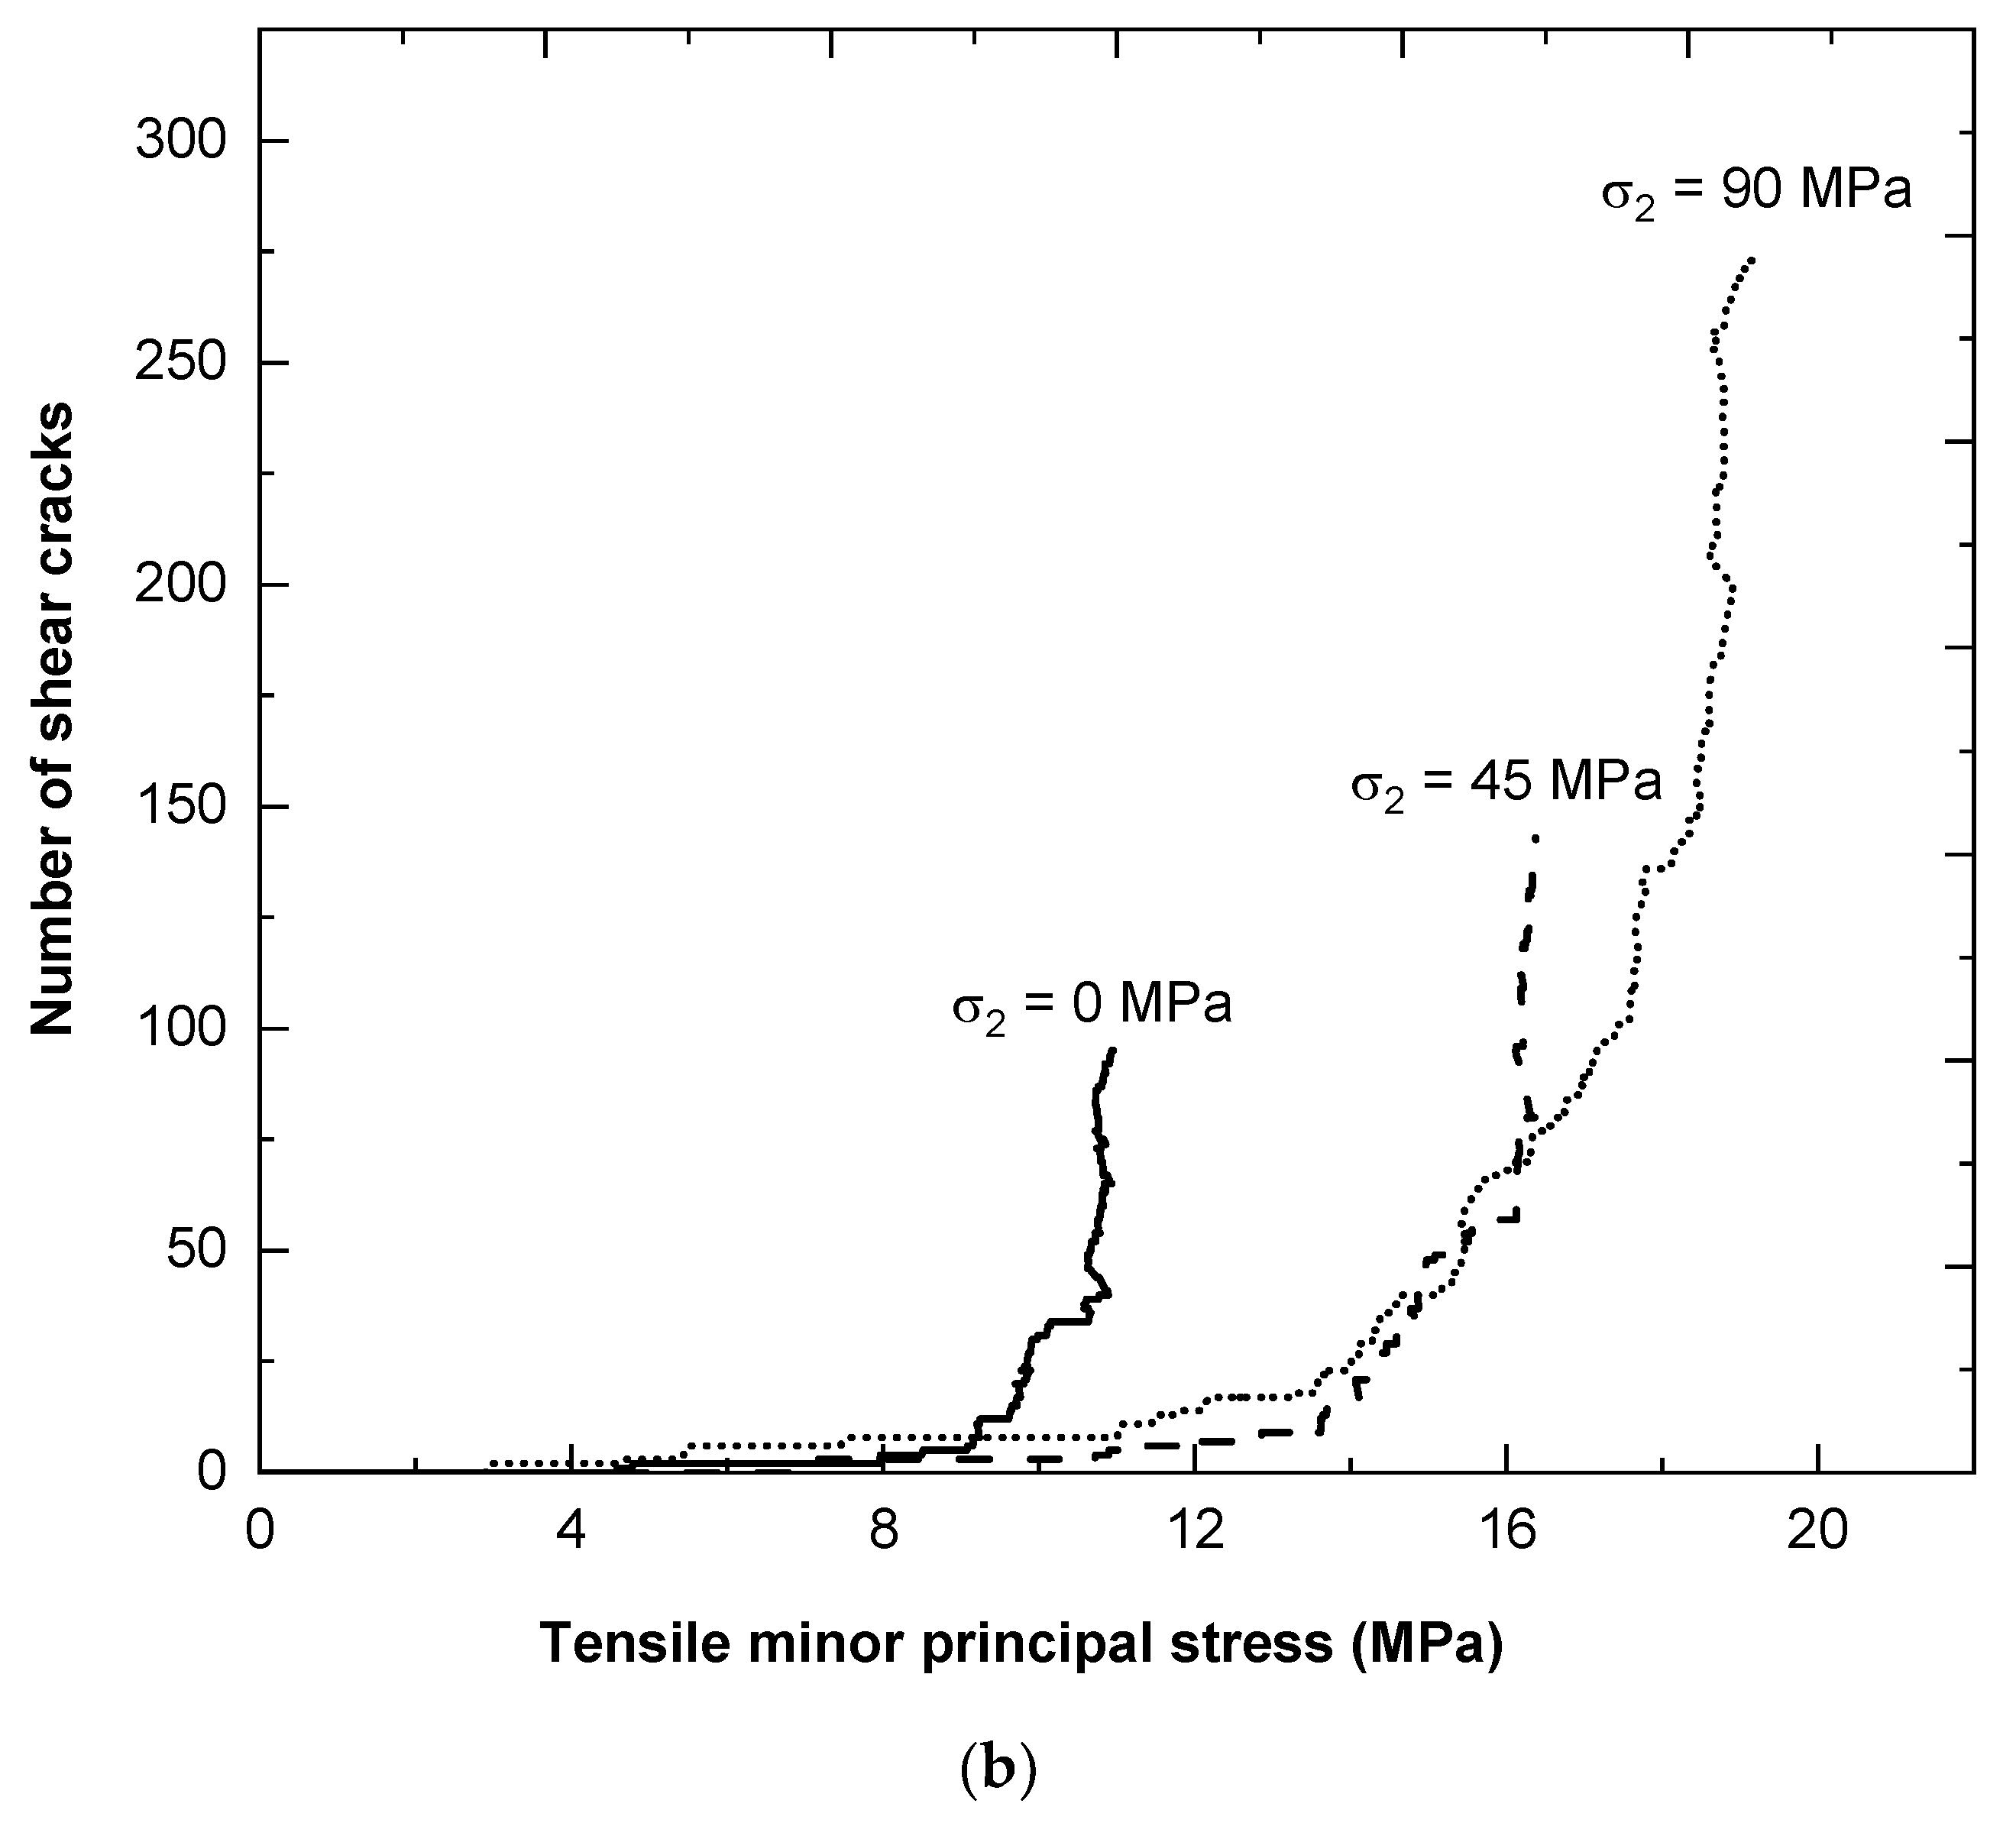
5.3. Impact of σ2 on the Confined Extension Test

One of the main objectives of this study was to examine the influence of σ2 on the confined extension test of rock. A confined extension test on a numerical sample was conducted by loading the sample hydrostatically to point D (Figure 8). After point D, σ3 was gradually reduced while keeping σ1 and σ2 constant. The sample was then extended in the axial direction to fail the sample in confined extension. Figure 15 compares the formation of cracks in the sample after σ3 is unloaded (point E; Figure 8) and the sample fails in extension (point C; Figure 8) at a σ1 of 90 MPa and three intermediate stress levels (90, 45, and 0 MPa). The cracks formed at point E (Figure 8) in the samples are random. The number of cracks formed is less when additional confinement is provided by σ2. σ2 also prevents the formation of tensile cracks in the model. The shear crack percentage in the case where σ2 is equal to σ1 is greater than when σ2 = 0. As shown in Figure 16, the peak strength increases from 11.0 MPa at σ2 = 0 to 19.2 MPa when σ2 is kept the same as σ1. Figure 17 compares the crack formation from points E to F (with an increase in extensile stress in the numerical sample). The number of shear cracks formed in the sample is greater when σ2 is applied to the sample. This is in agreement with confined extension results on dog-bone-shaped Carrara marble [20].

6. Failure Envelope for Lac du Bonnet Granite

The data points obtained from the direct tension (DT), Brazilian (BR), flattened Brazilian (FB), triaxial, and confined extension tests on numerical samples along with the best fit Hoek–Brown failure envelope obtained from the triaxial tests on Lac du Bonnet granite are plotted in Figure 18. The data points obtained from the confined extension test on the numerical sample pass through the laboratory testing with respect to direct tension, Brazilian and flattened Brazilian, UCS, and triaxial data. The numerical confined extension tests show a tension cutoff up to ~50% of the UCS, after which σ3 decreases sharply with the increase in σ1. However, as shown in Figure 18, the confinement in the laboratory sample could not be applied beyond 80% of the UCS, which is around σcd for Lac du Bonnet granite. The numerical confined extension test was continued on the compression side (σ1 compressive, σ3 = σ2 compressive, stress path OFG; Figure 8). Comparing these results to the conventional triaxial test on the numerical sample (stress path OAG; Figure 8) results in a good match and indicates that the influence of the stress path is negligible. When the Hoek–Brown failure envelope was extended into the confined extension region, it was found out that it underestimates actual strength compared to the laboratory direct tension, Brazilian, flattened Brazilian, and confined extension test results on numerical samples. The laboratory direct tension strength was 10.6 MPa, whereas the Hoek–Brown gave a value of 6.8 MPa.

7. Conclusions

The FJ BPM was used in this study to capture the rock behavior observed in the laboratory during UCS, triaxial, and direct tension tests. A methodology was developed to select representative values of the microparameters for the particles and FJs in the numerical sample. With a single mineral grain type with an average of 15 particles along the width of the sample, the model could produce reasonable responses observed for Lac du Bonnet granite in the laboratory during UCS, triaxial, and direct tension tests. The code was modified to study the rock behavior in a confined extension test. The findings can be summarized as follows:
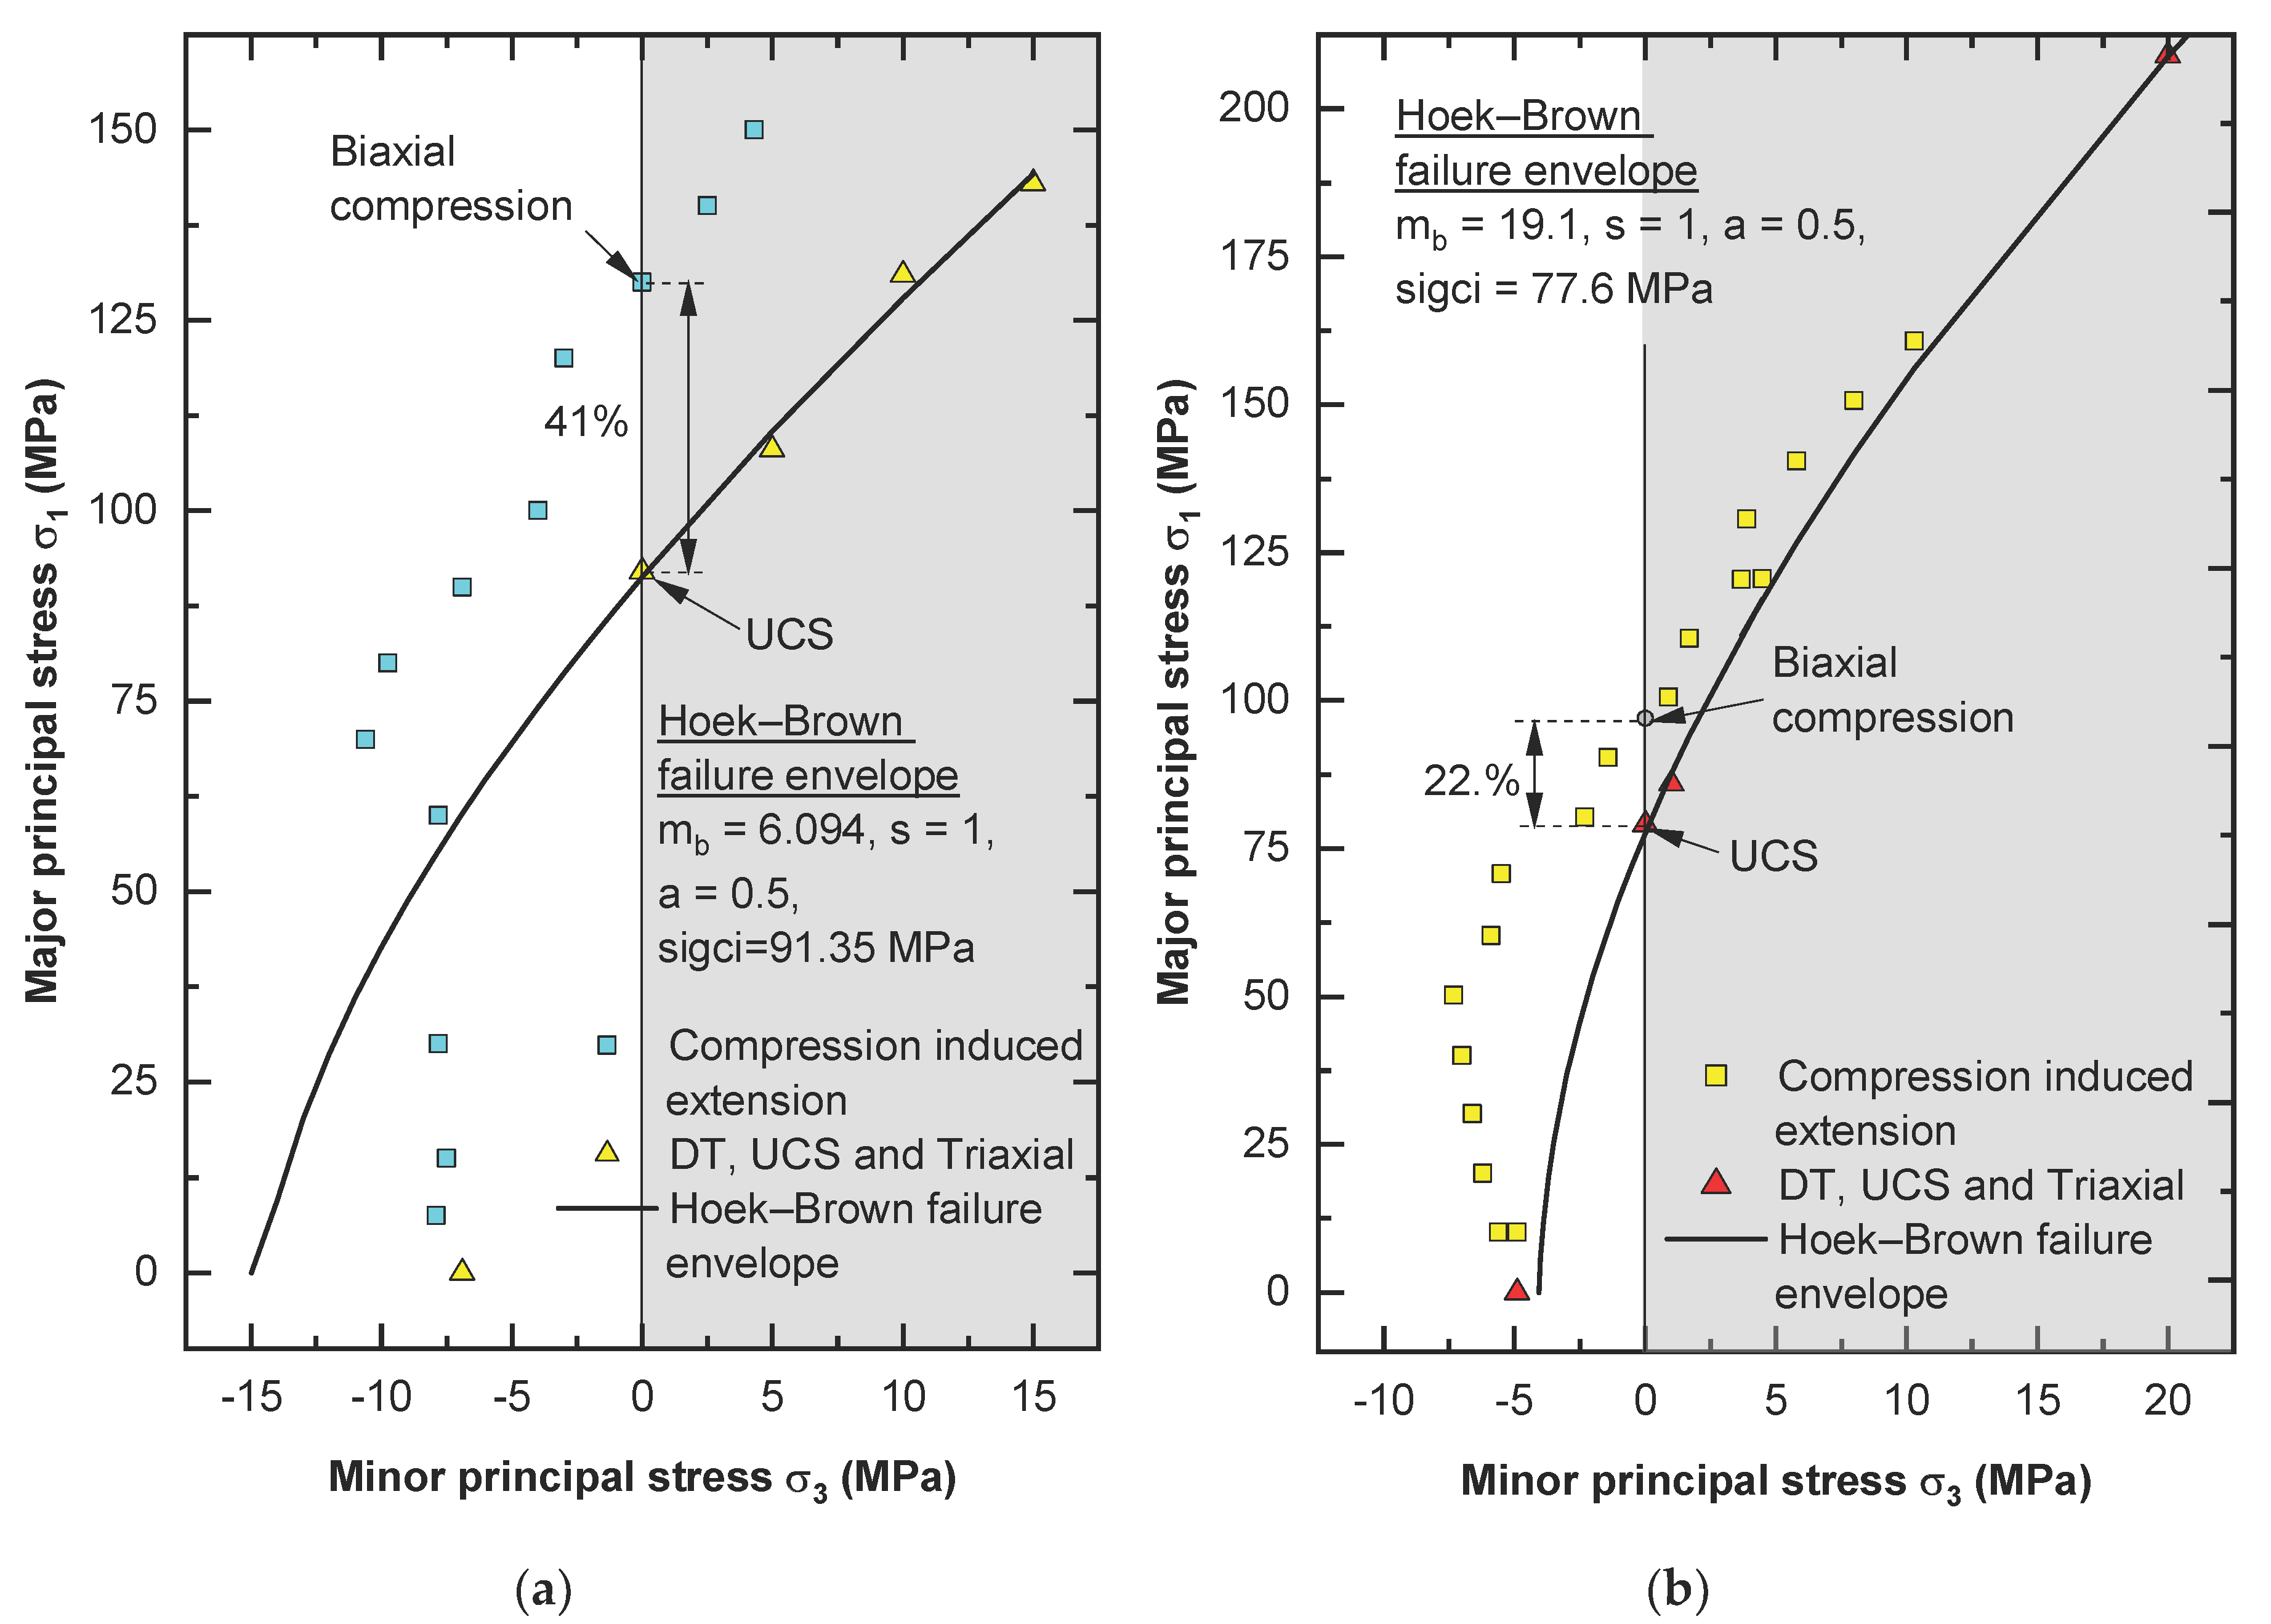
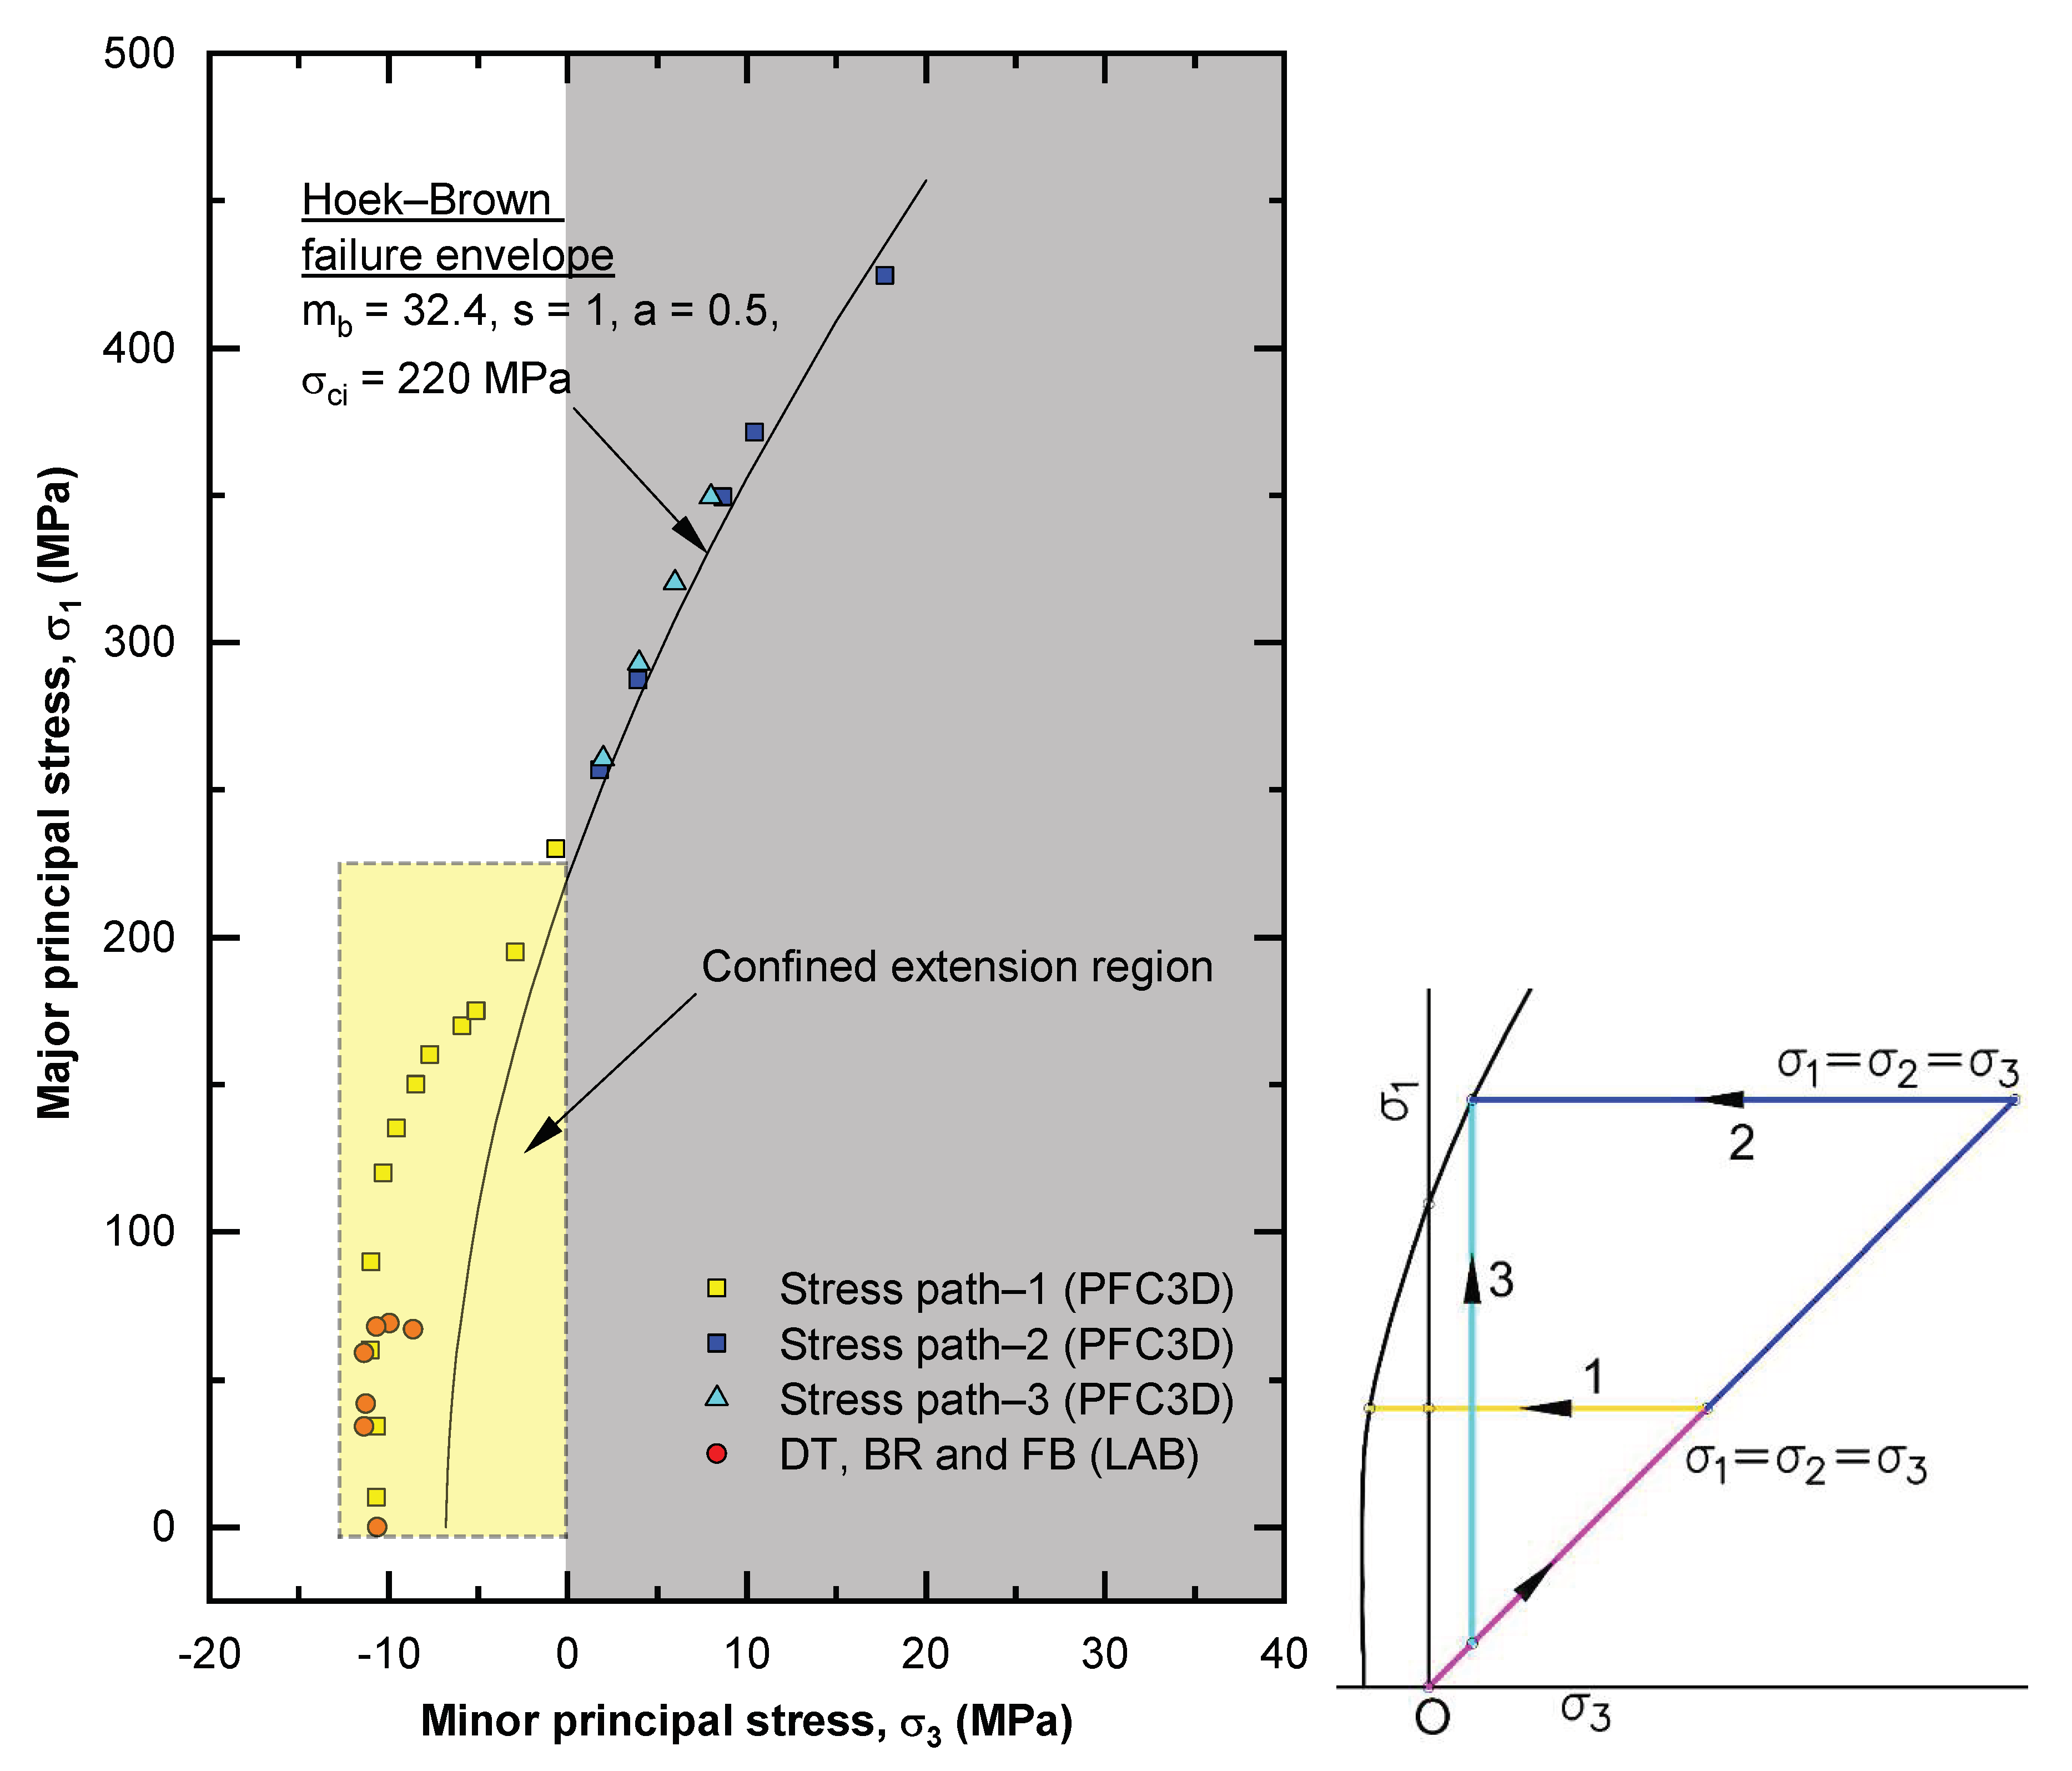
  • By changing the code, it was possible to study the behavior of the rock in confined extension at σ2 = 0. When compared with the Hoek–Brown failure criterion, the actual strength values obtained from the numerical samples in confined extension were higher than data points from the Hoek–Brown criterion; however, the Hoek–Brown failure envelope overestimated the peak strength obtained from the laboratory tests in confined extension, e.g., as in the case of Carrara marble (Figure 4a).
  • The data points obtained from the Brazilian and flattened Brazilian tests were close to the values from the numerical analysis.
  • Limited data available from laboratory testing (Brazilian and flattened Brazilian tests) and data from the numerical analysis indicate a tensile cutoff for Lac du Bonnet granite, as suggested by Hoek and Martin [2].
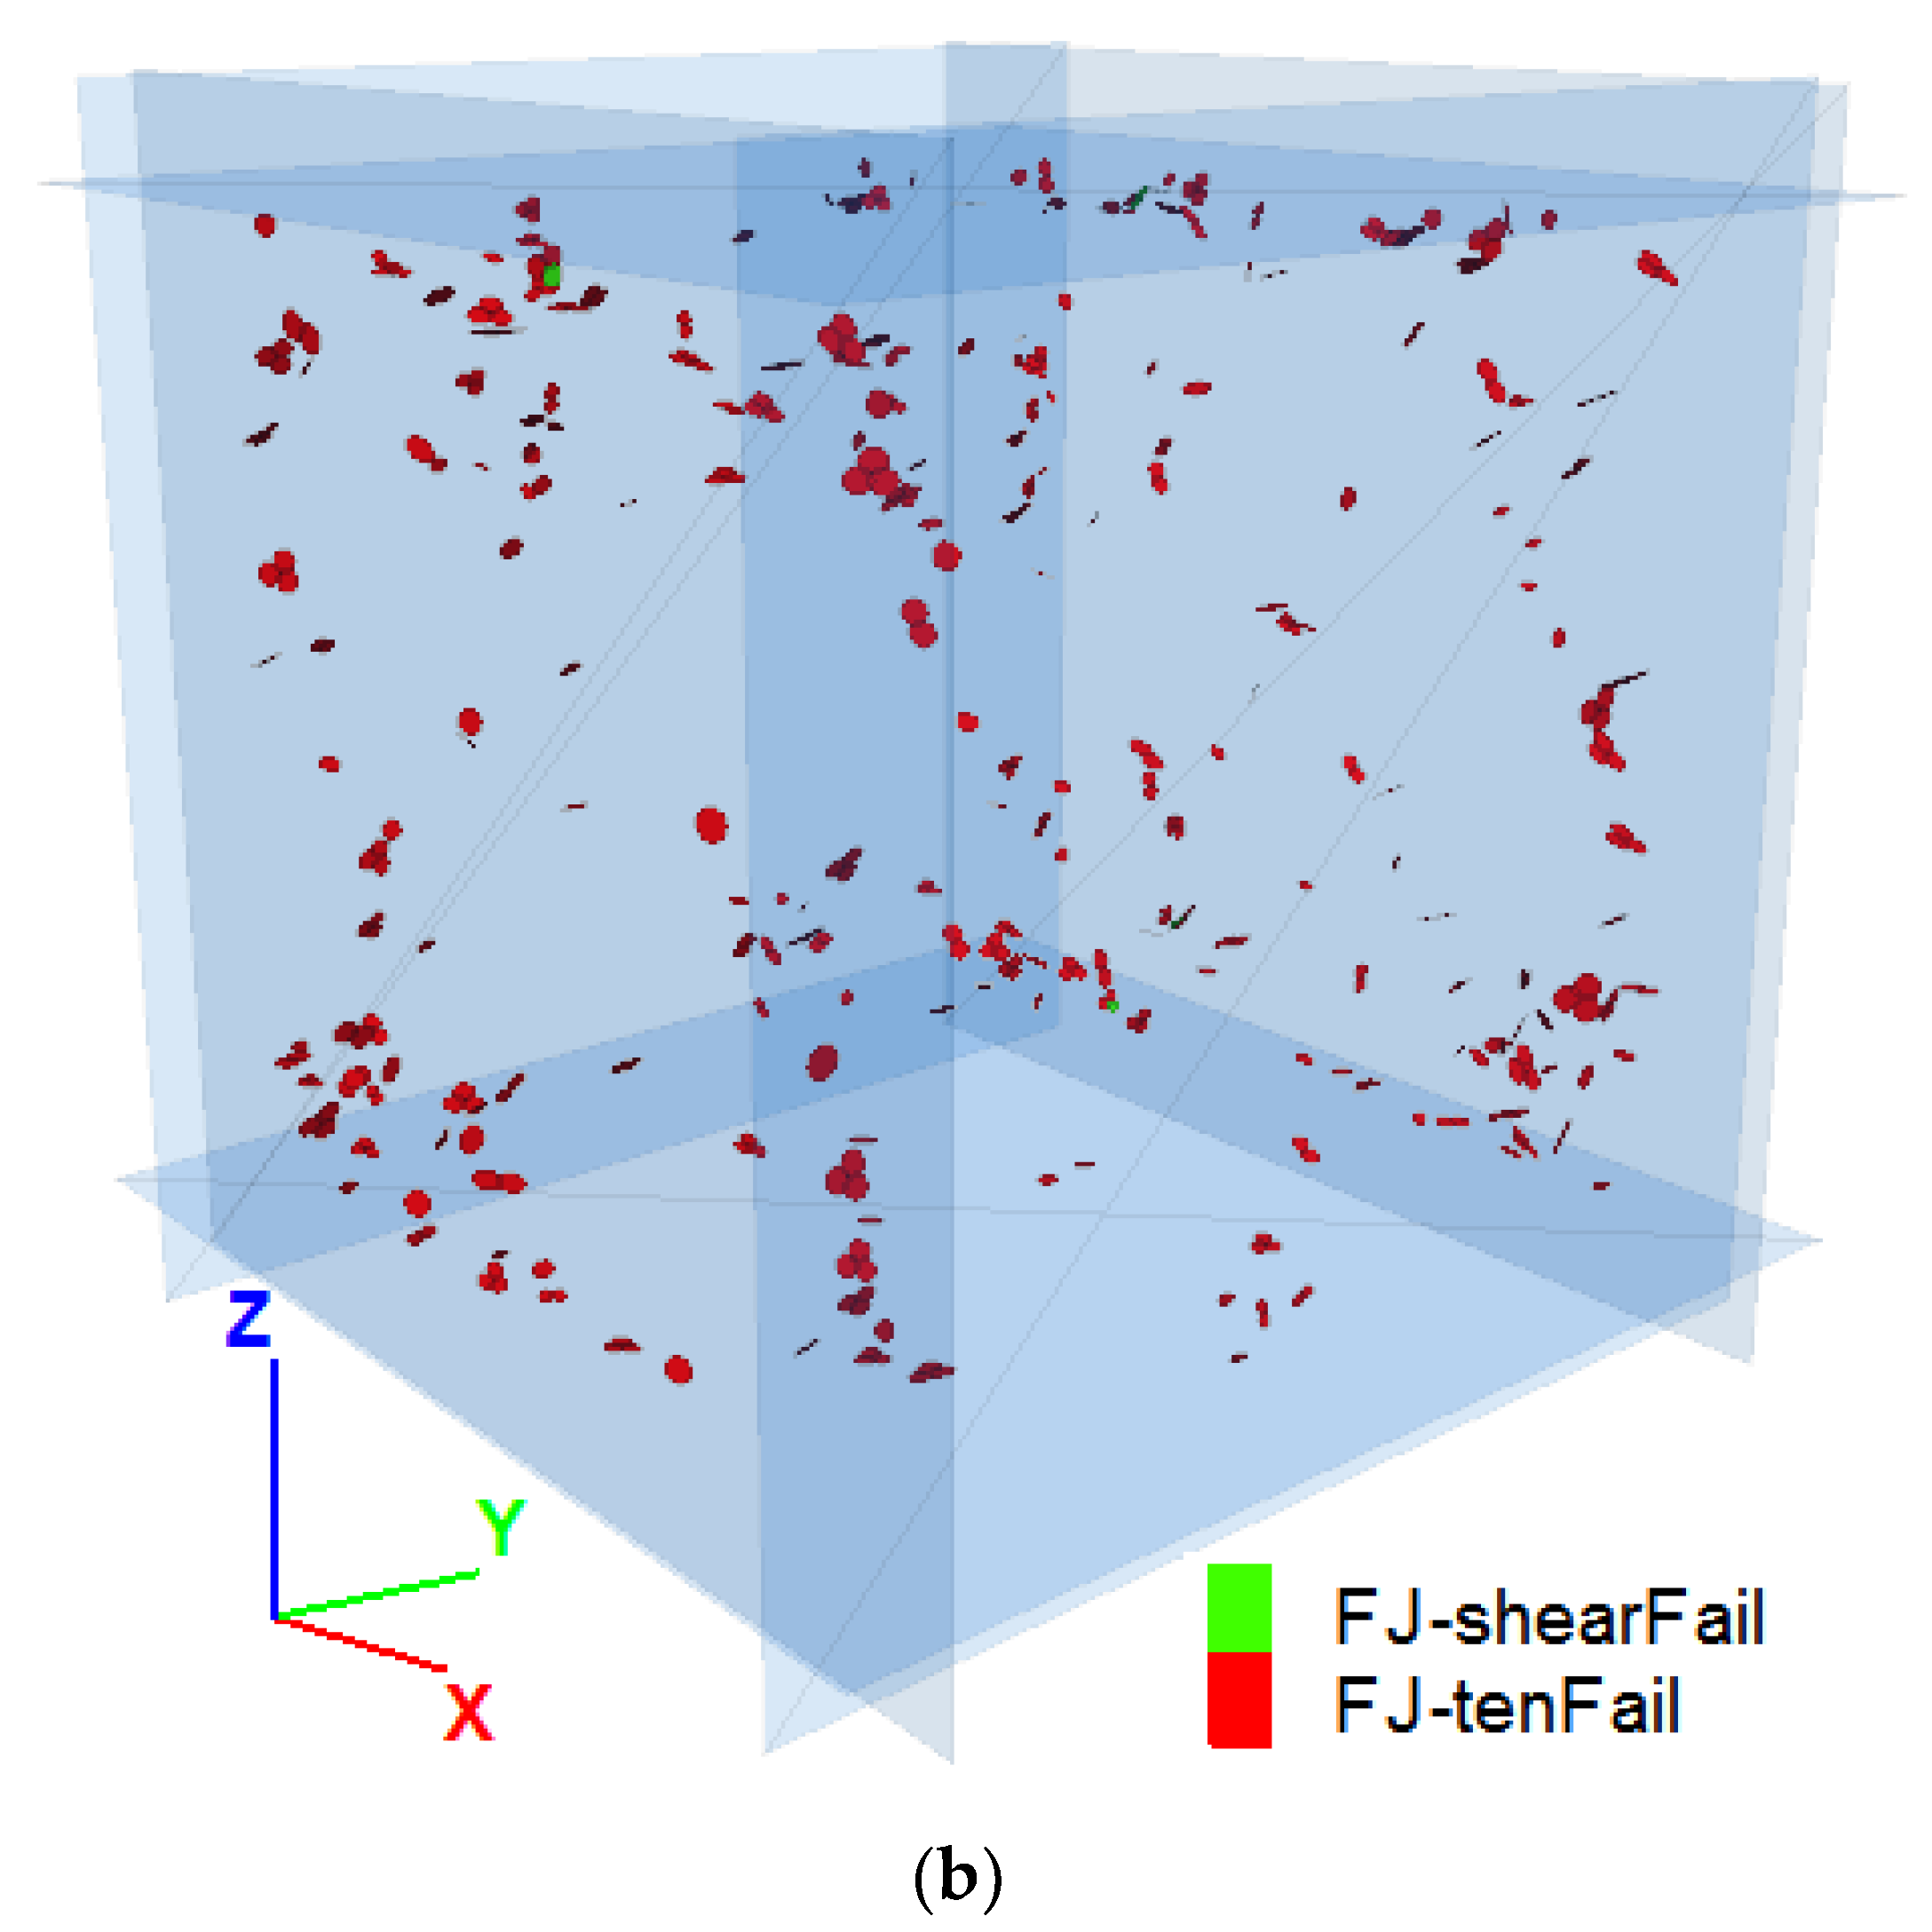
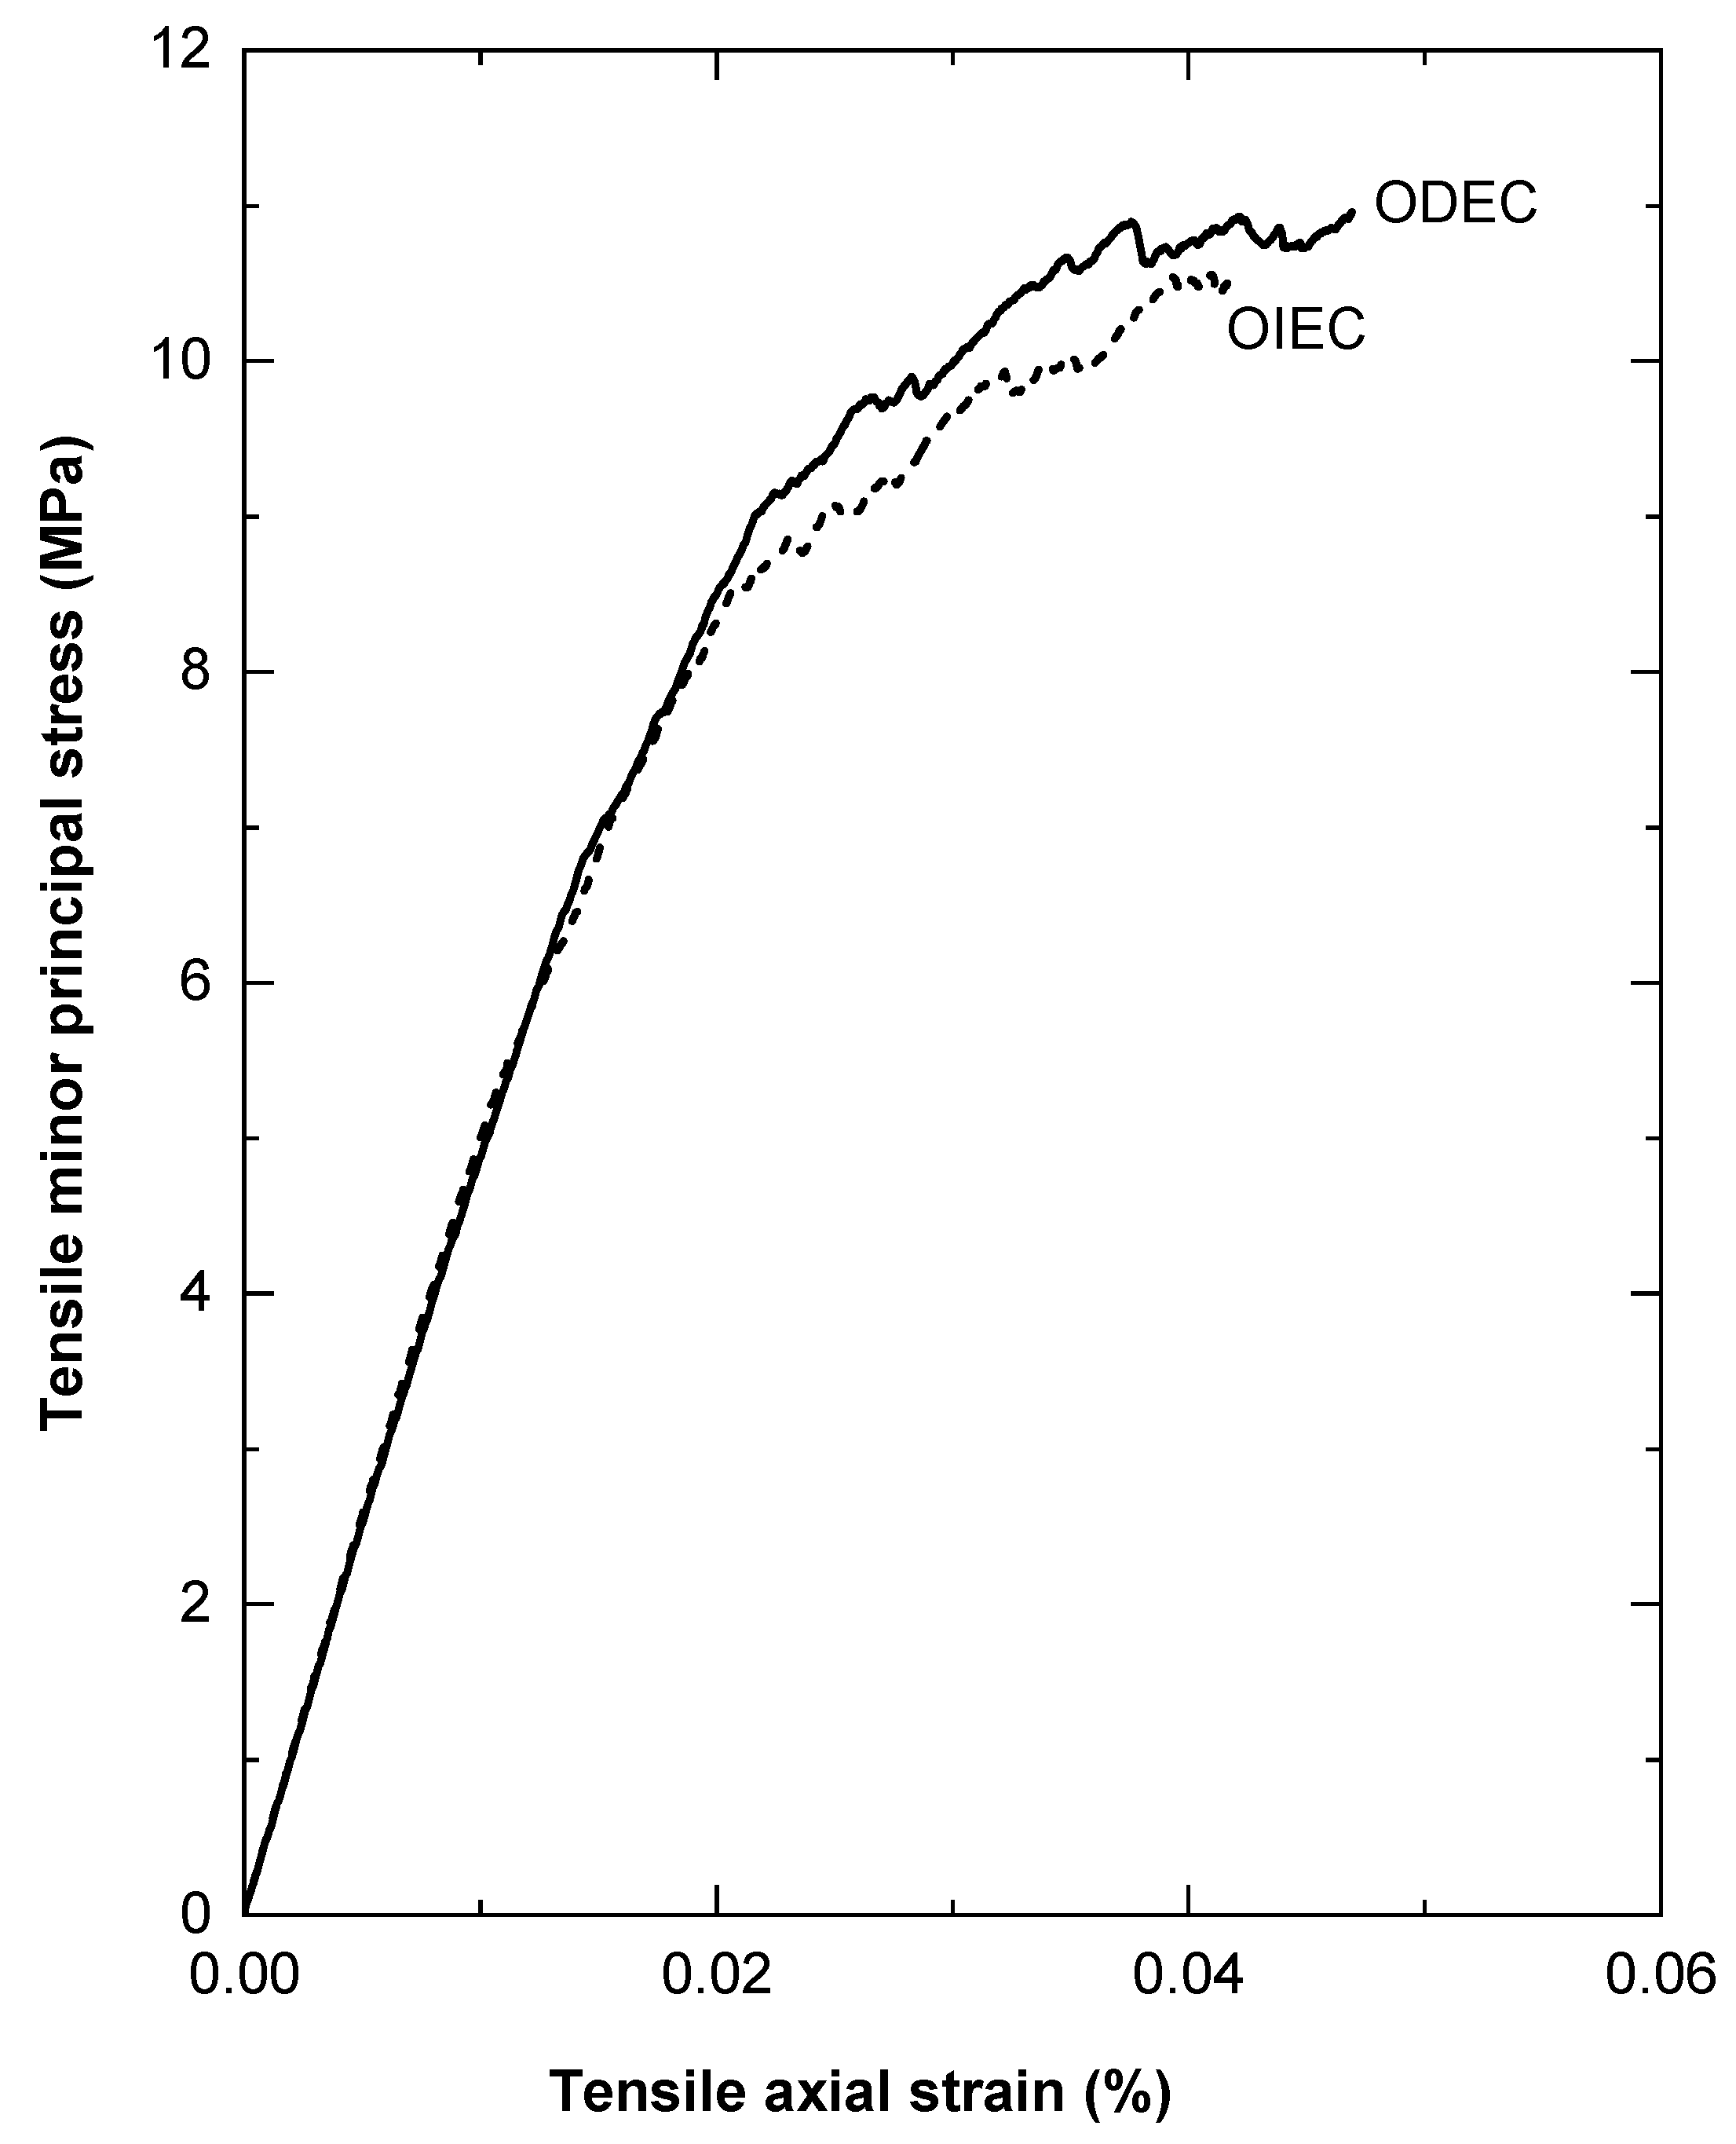
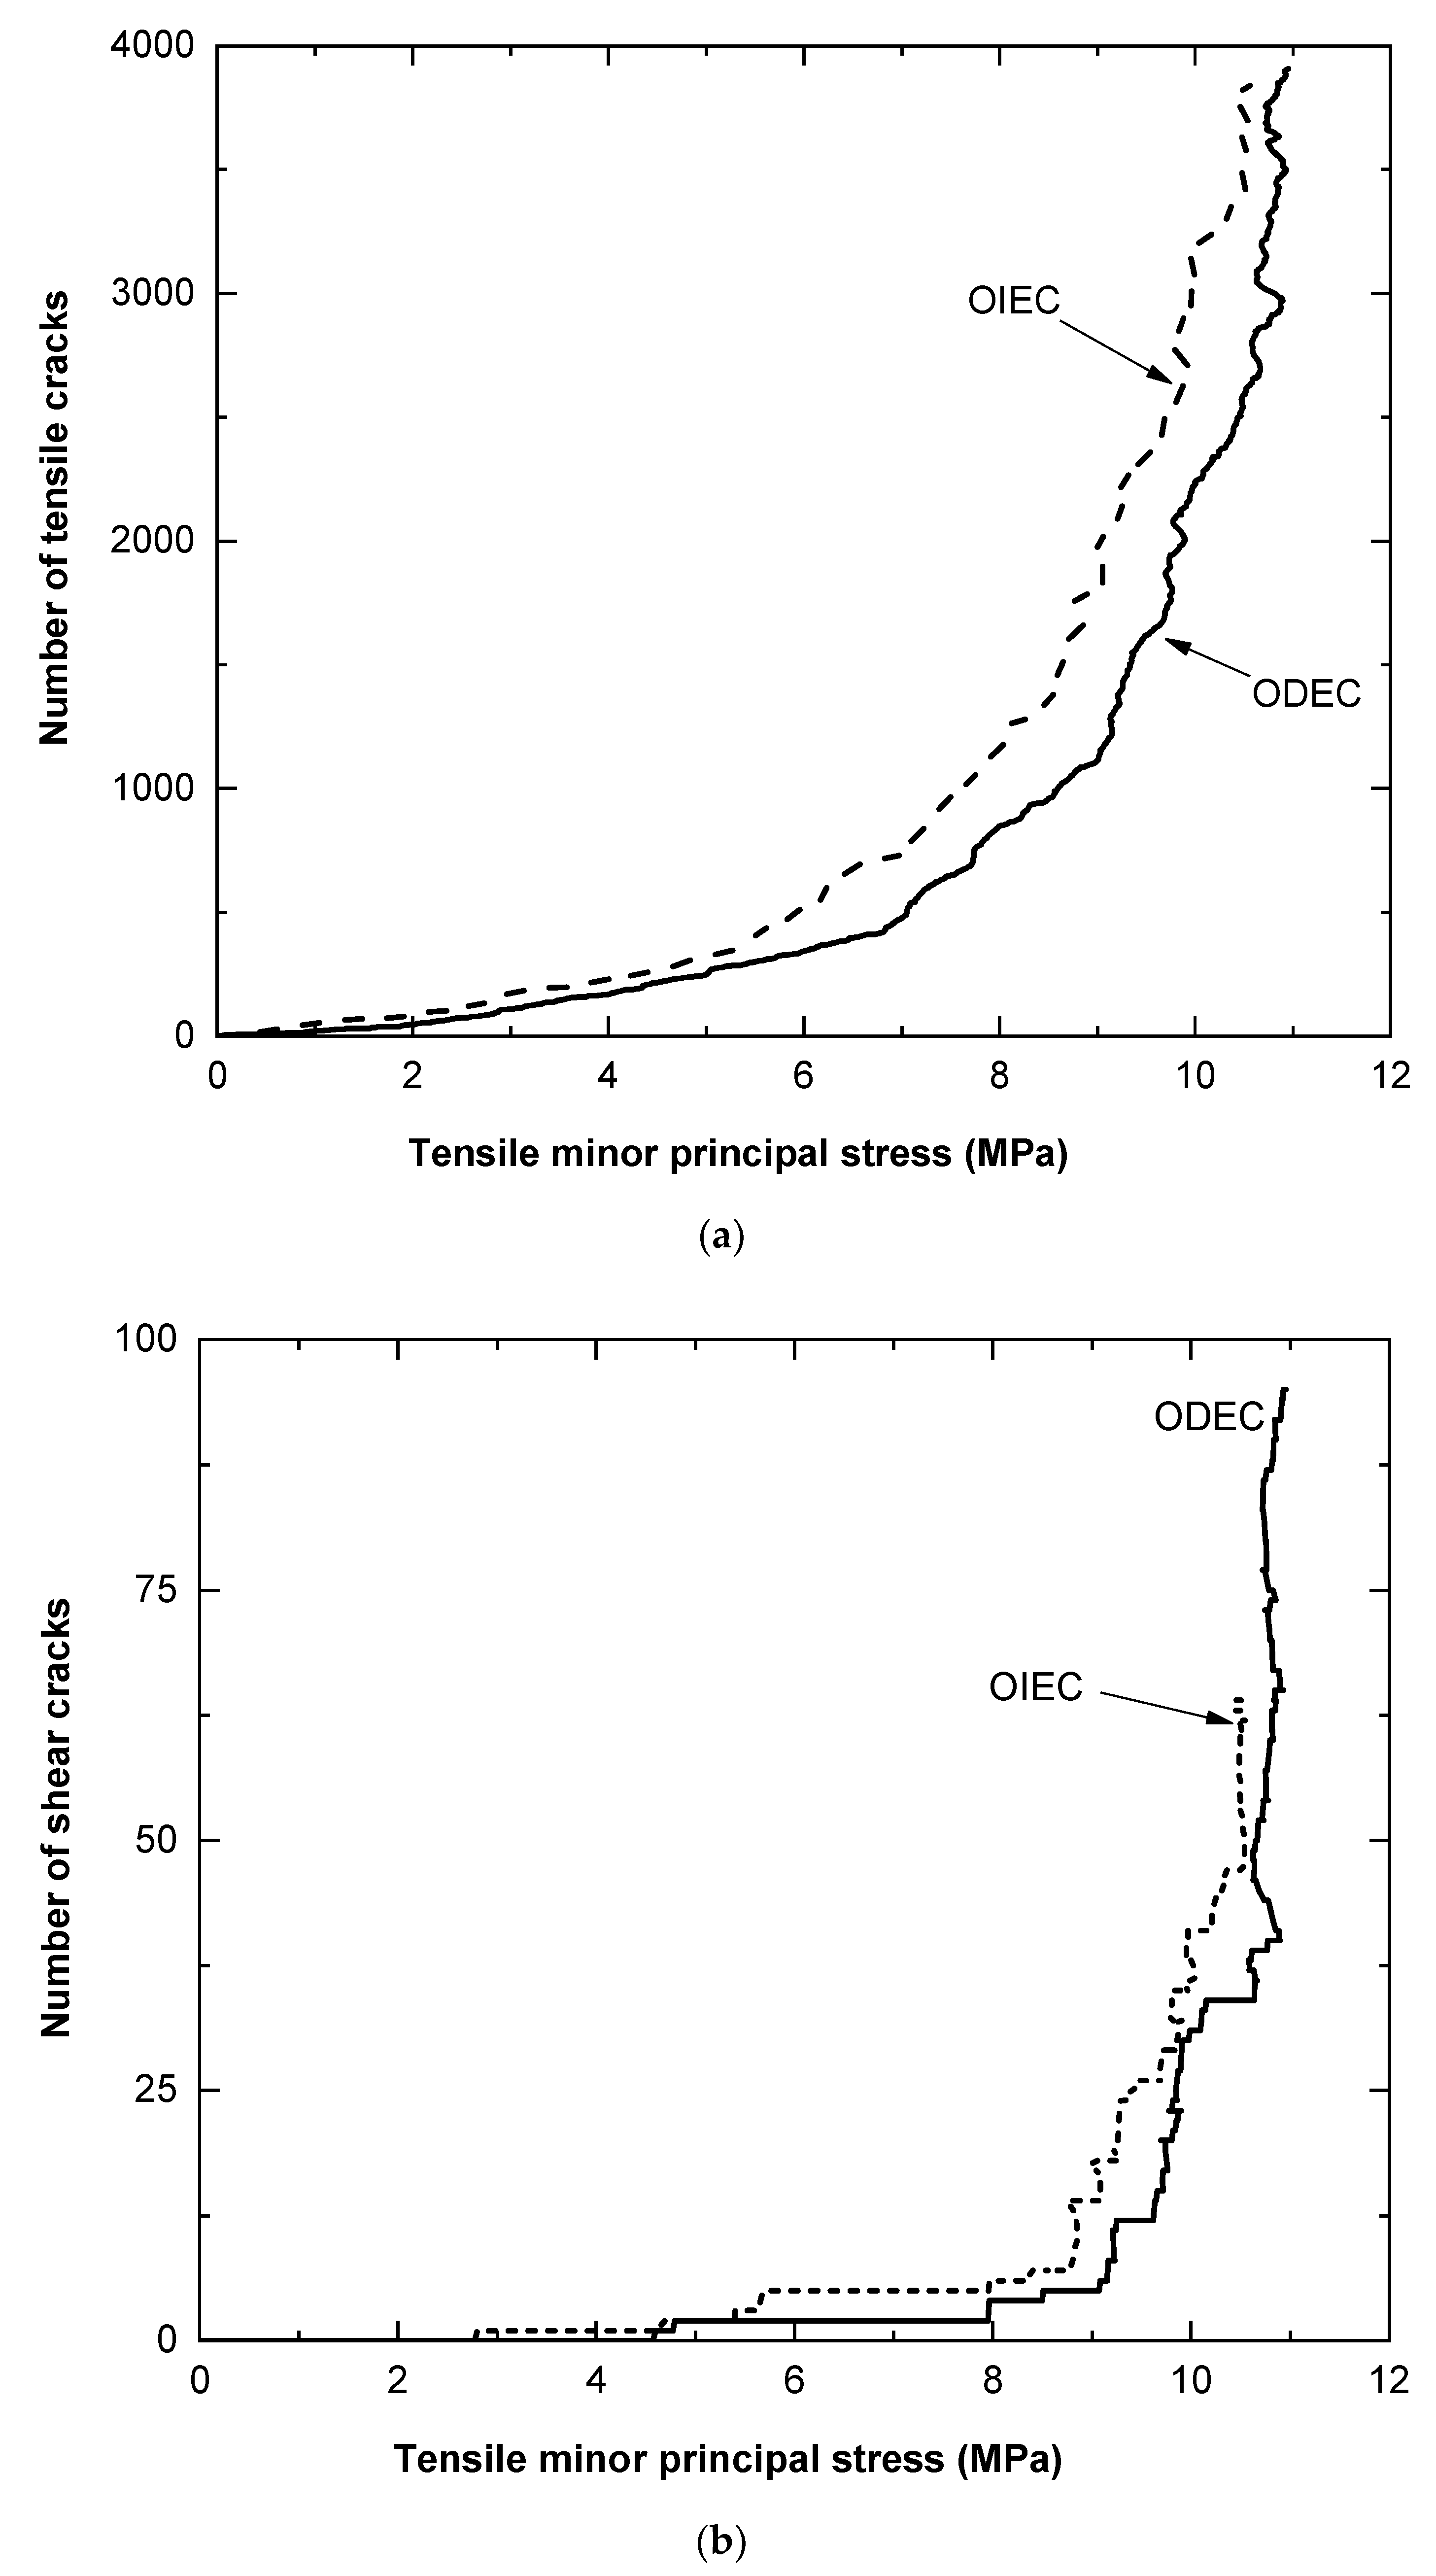
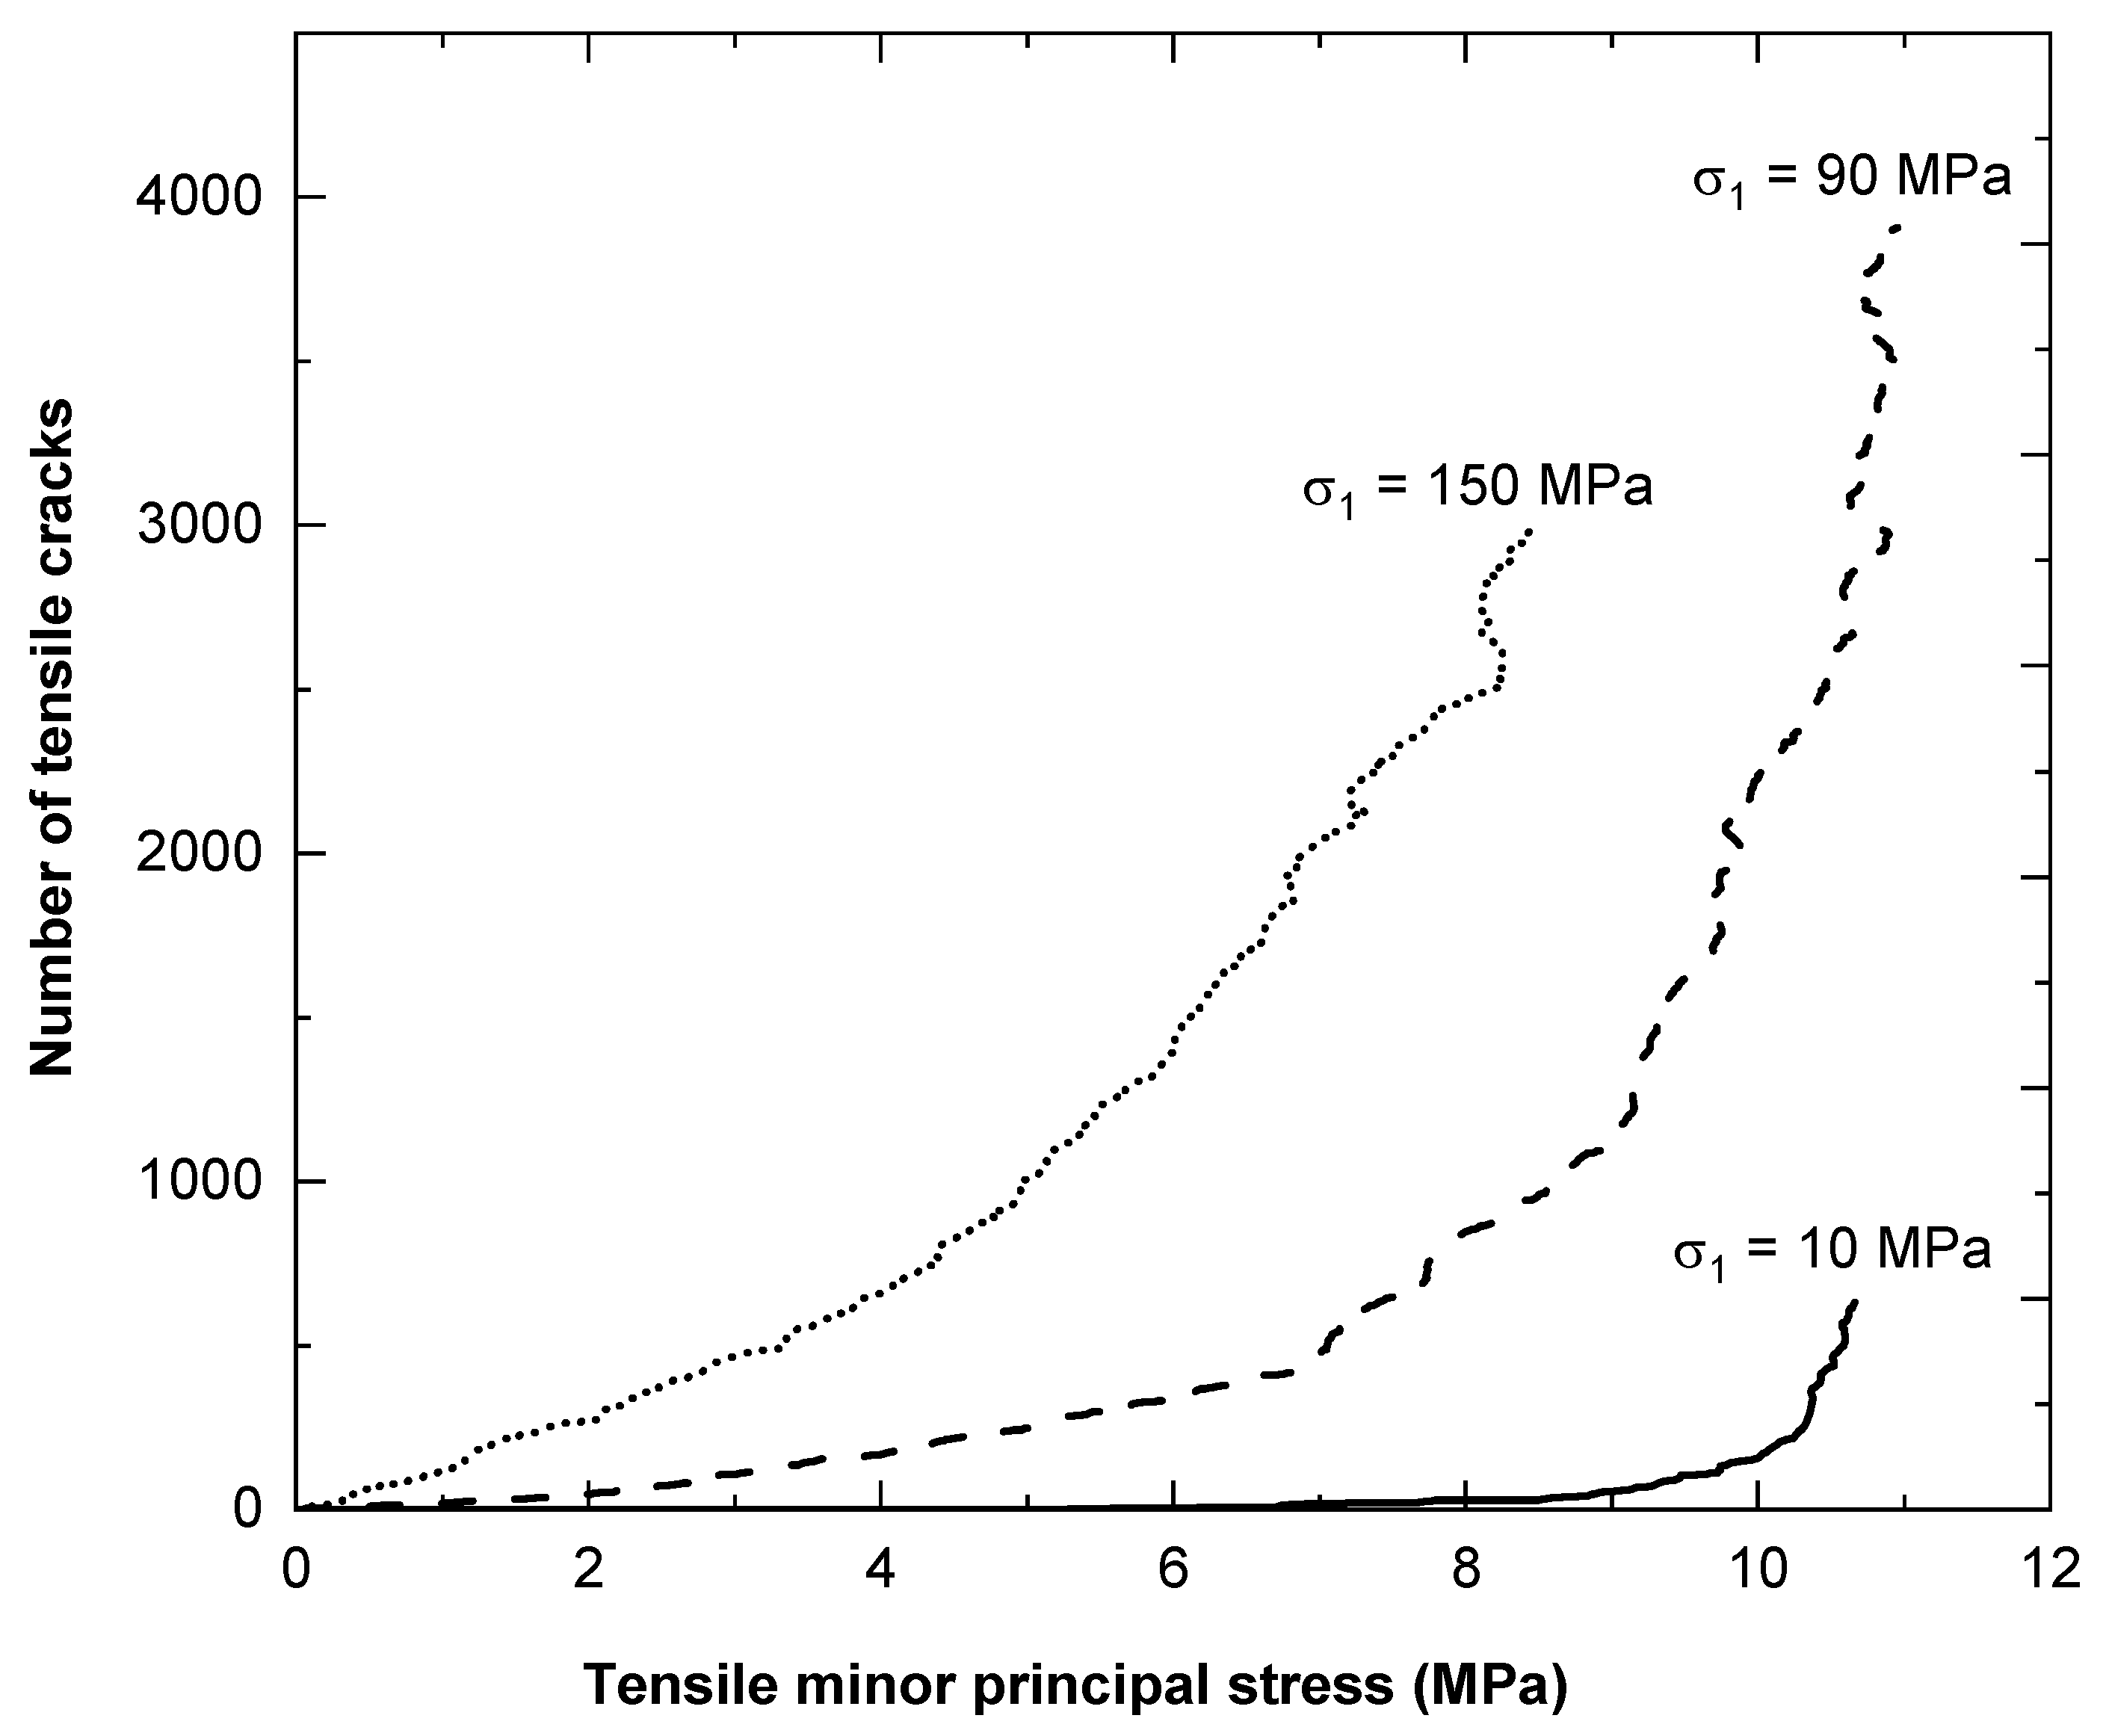
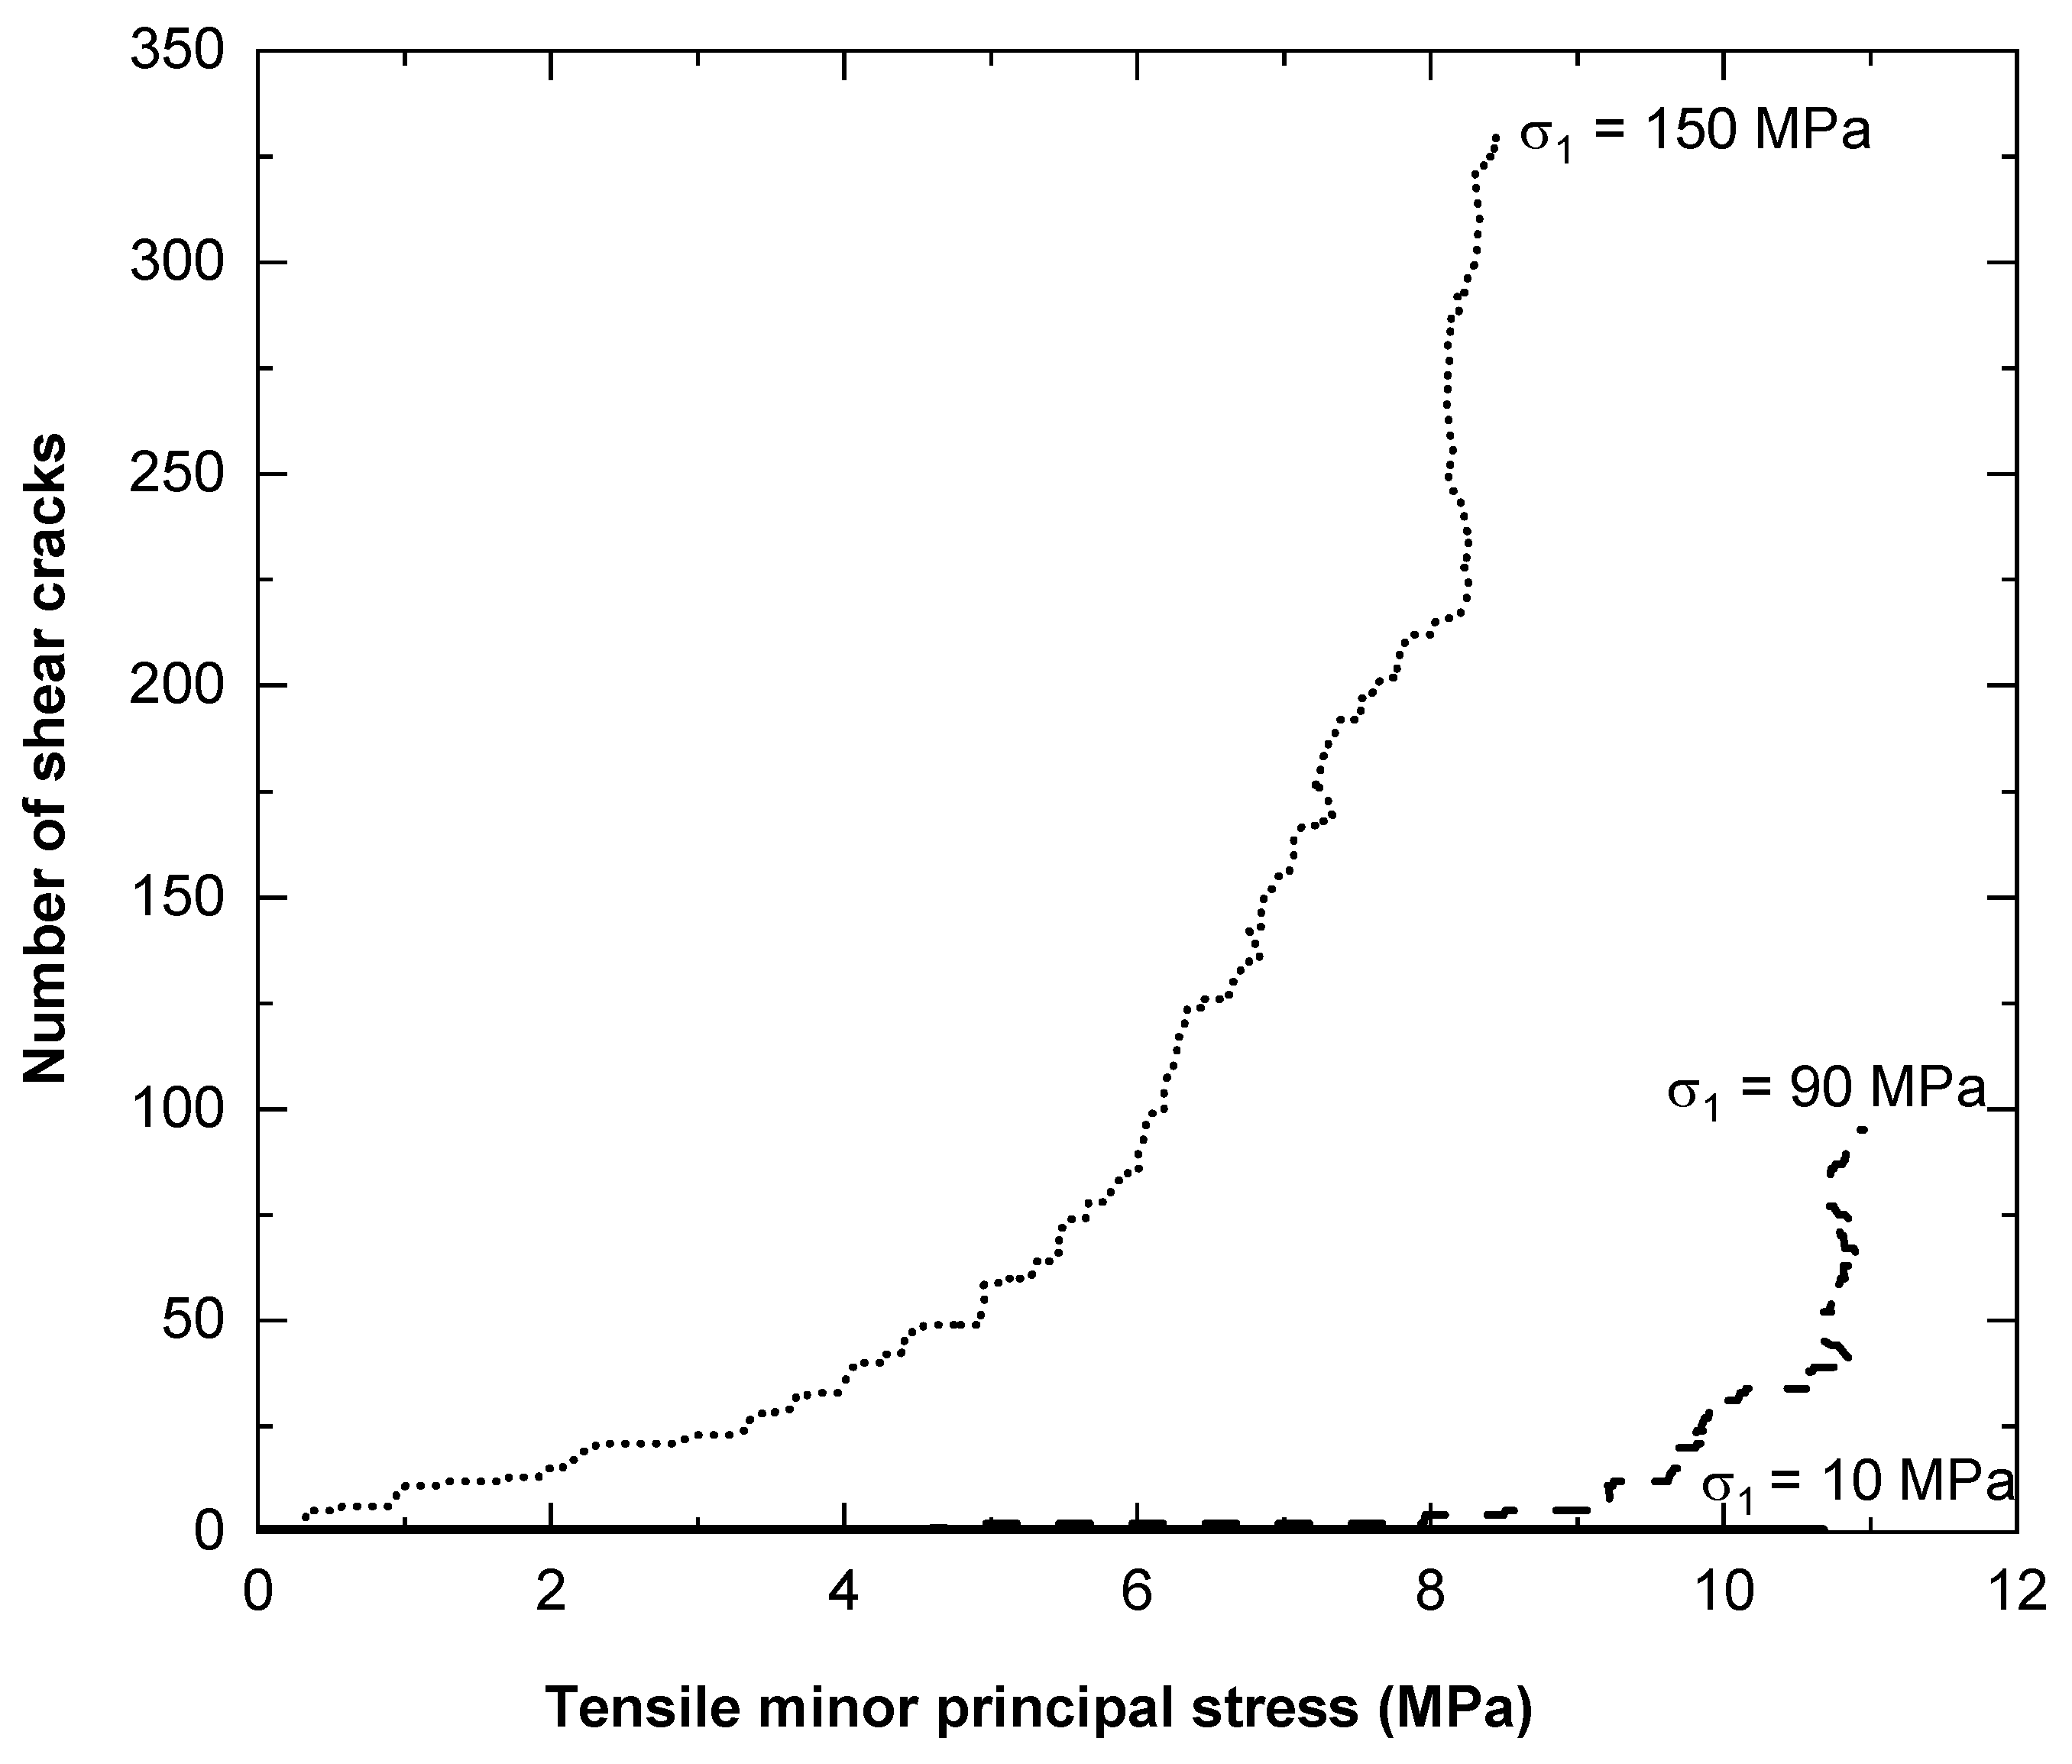
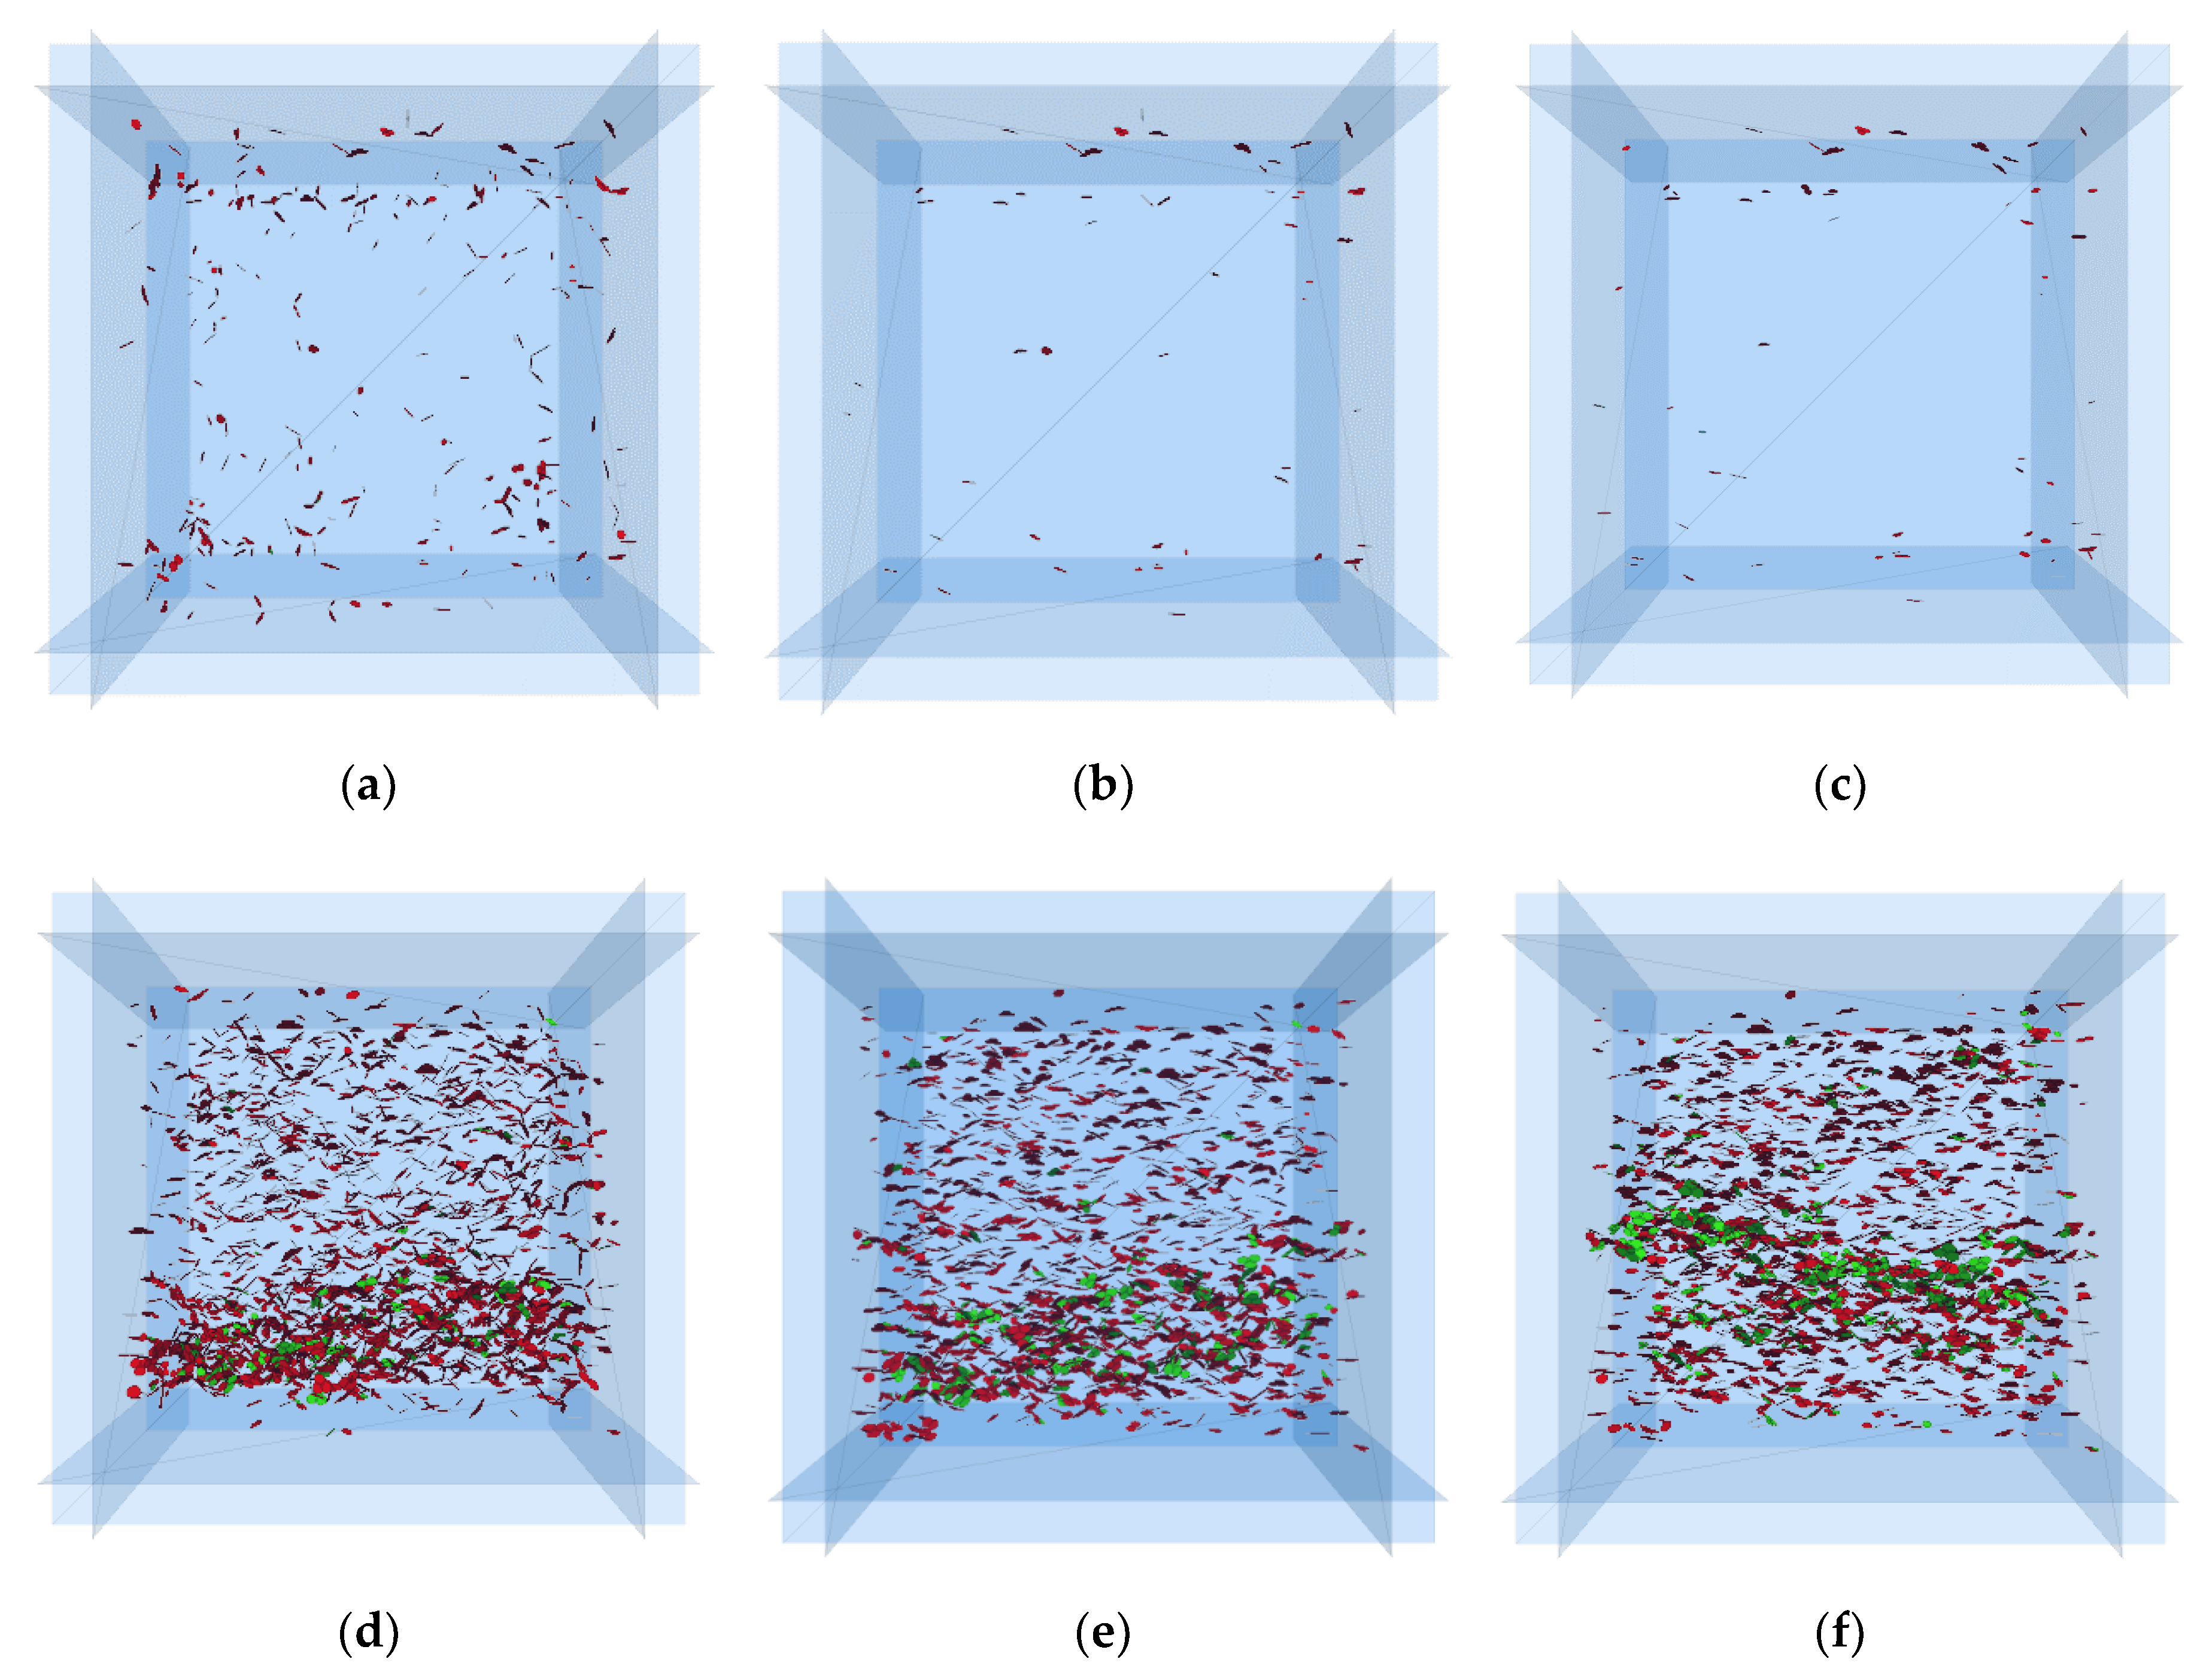
  • For the numerical investigation on confined extension, the stress paths investigated have a minor impact on peak strength. However, microfracture formation was found to be path dependent.
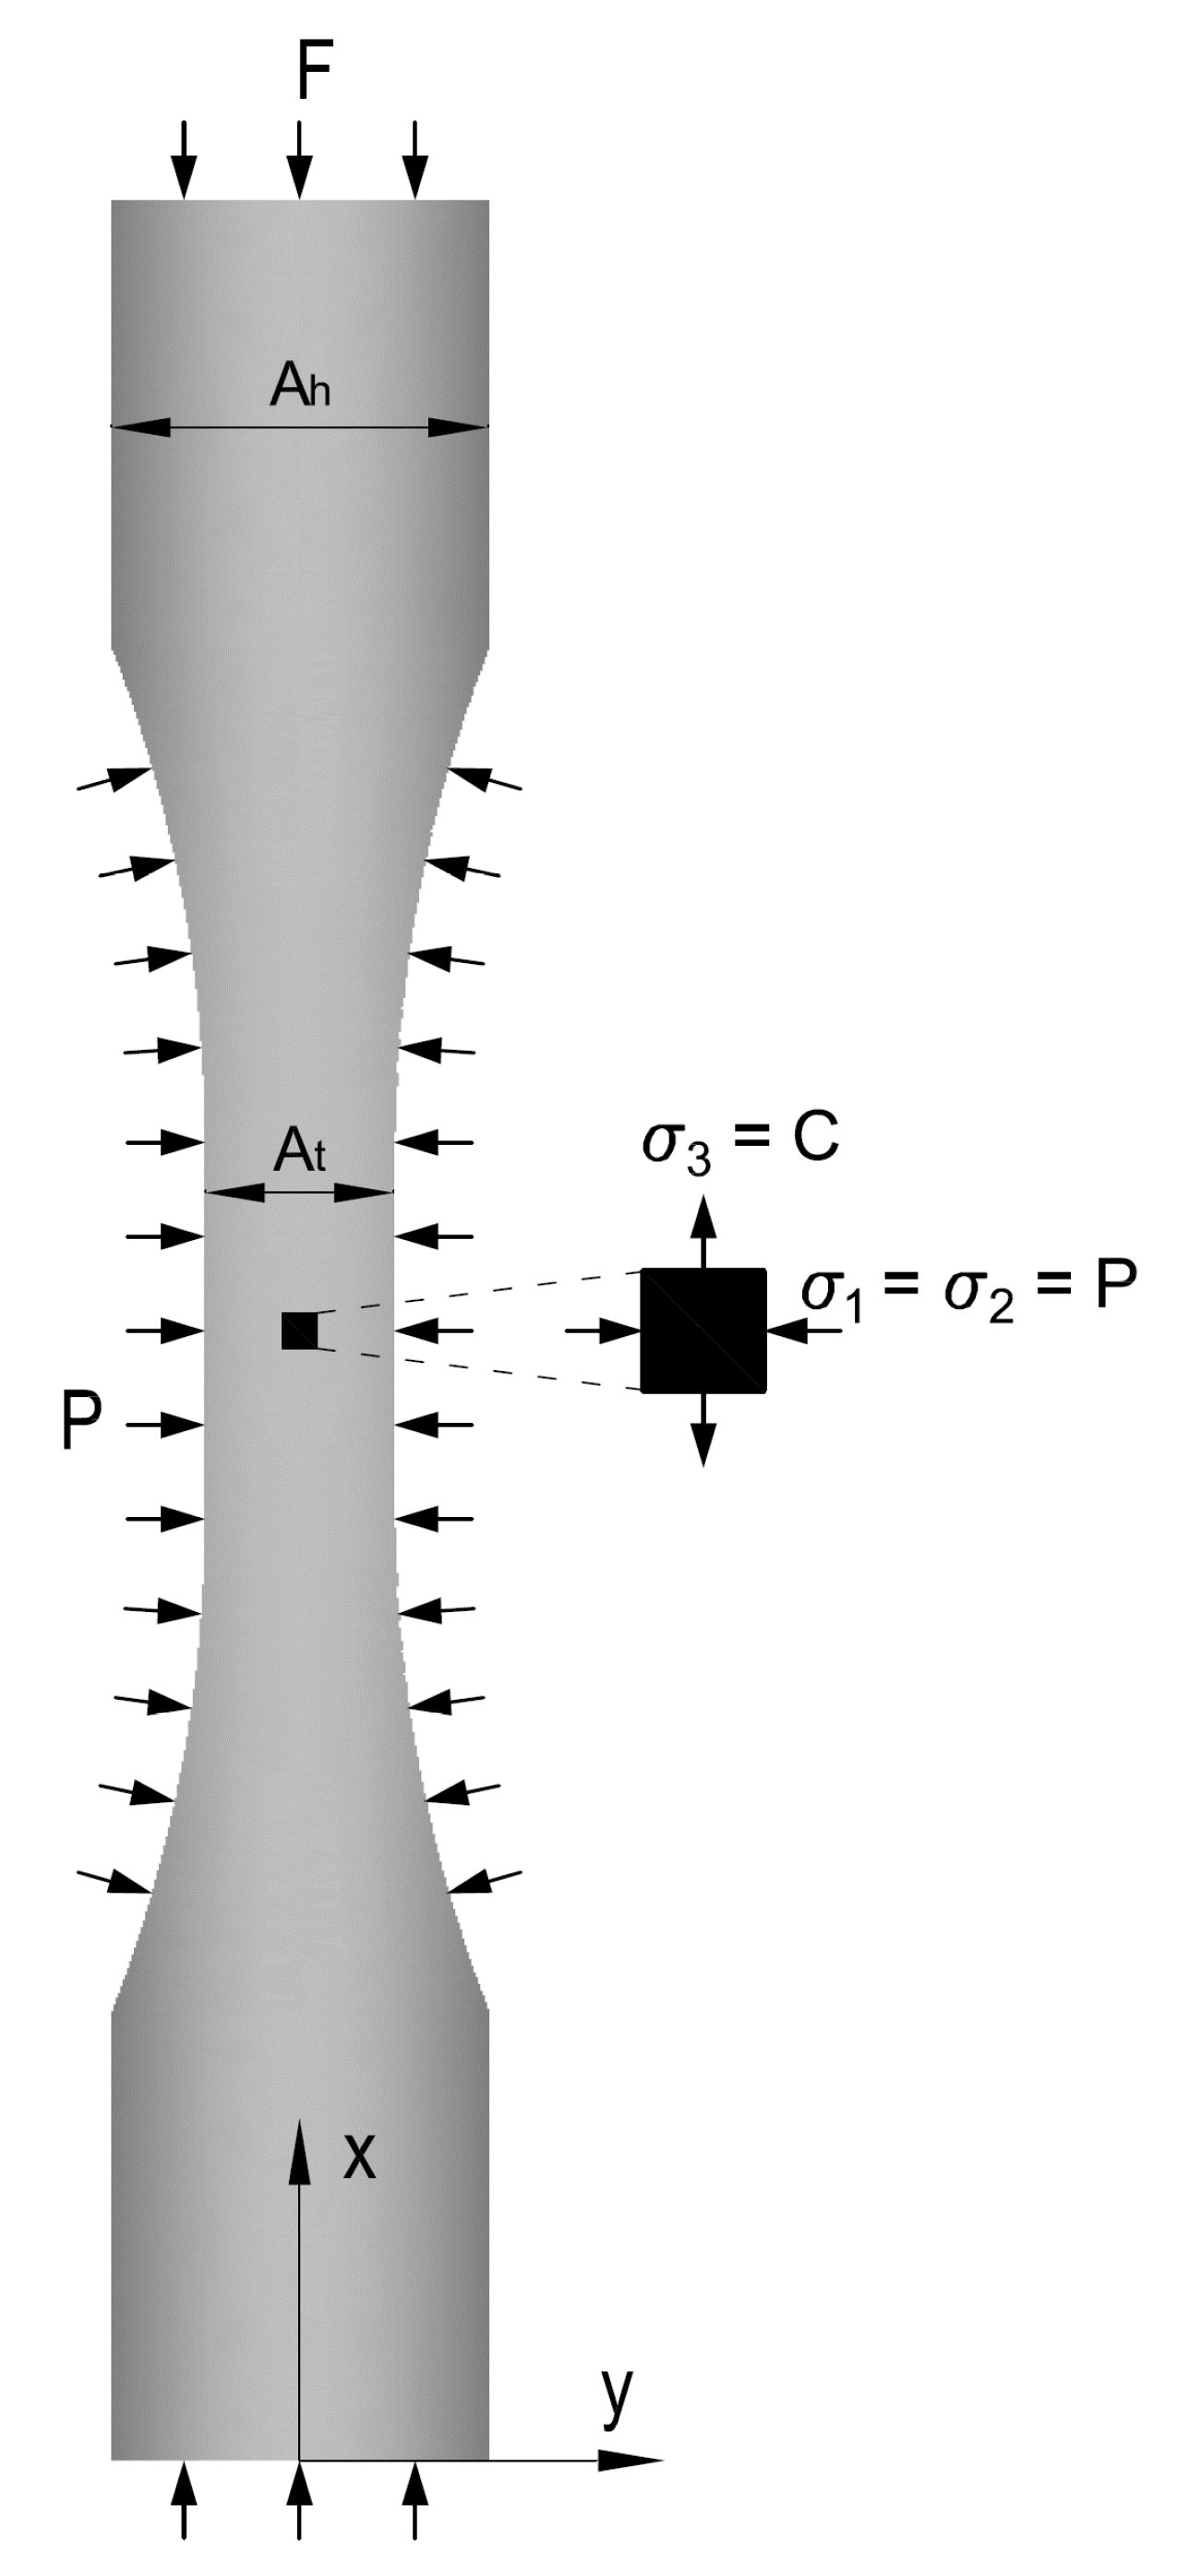
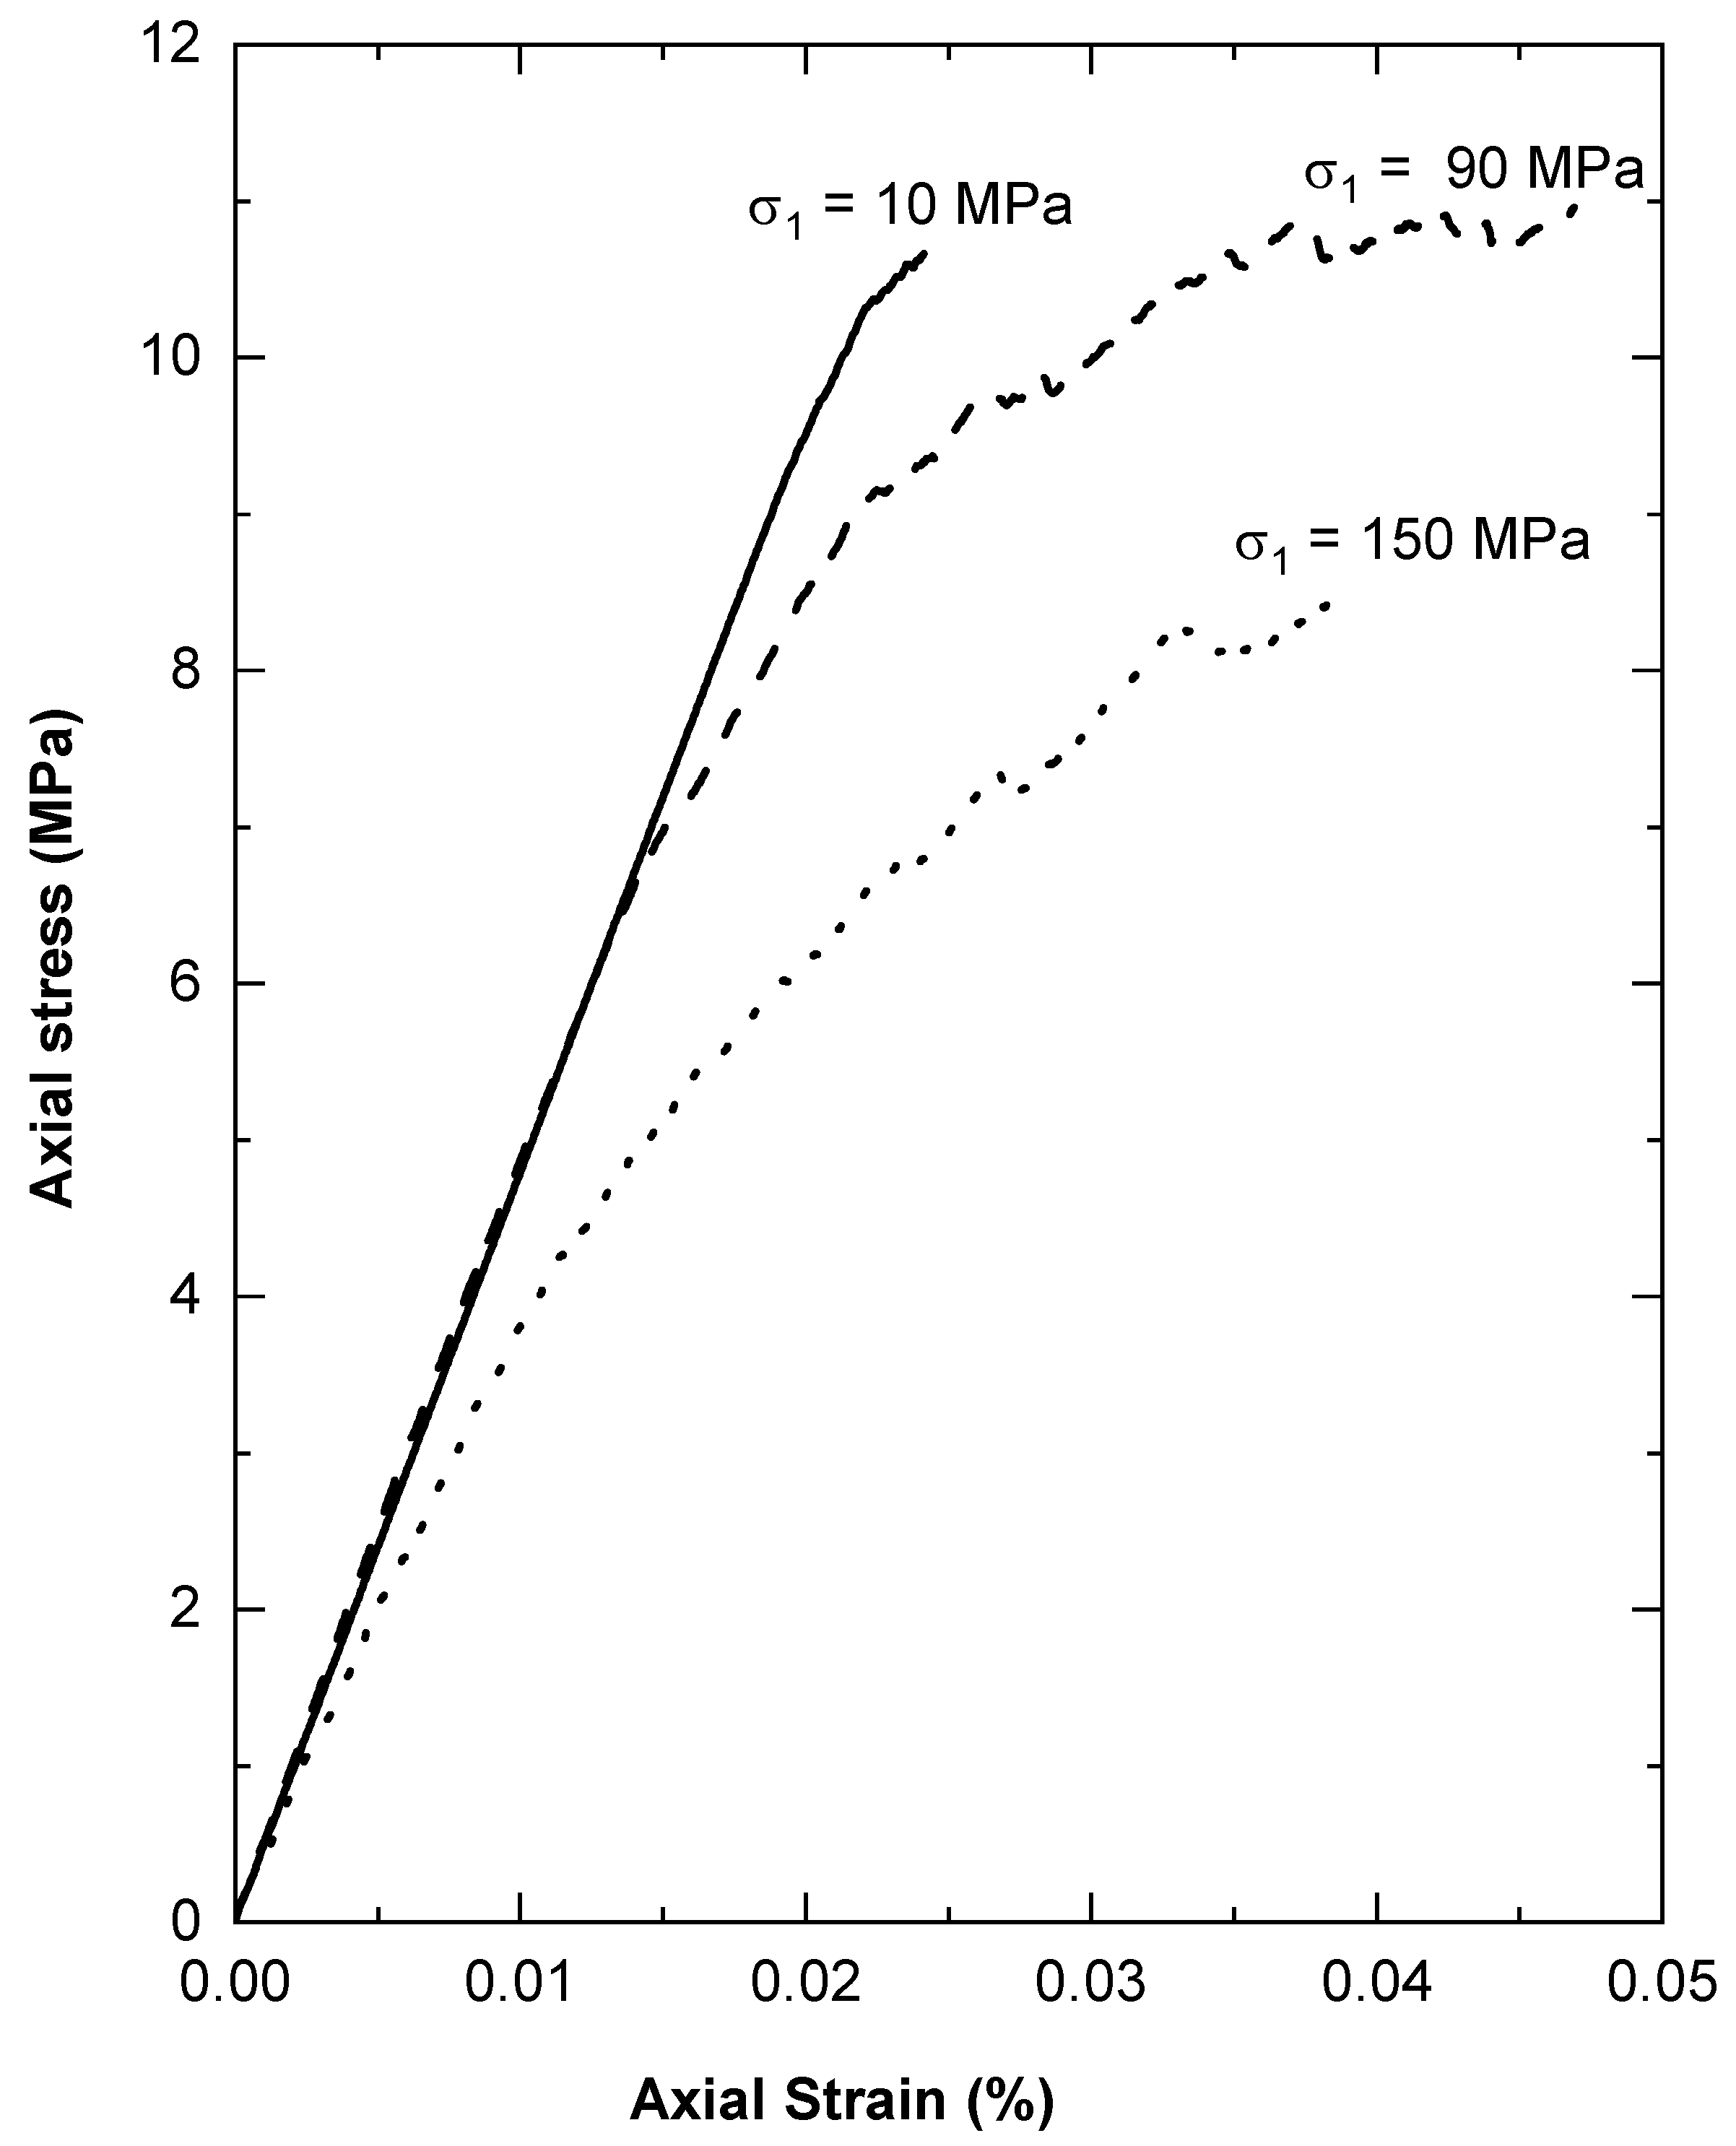
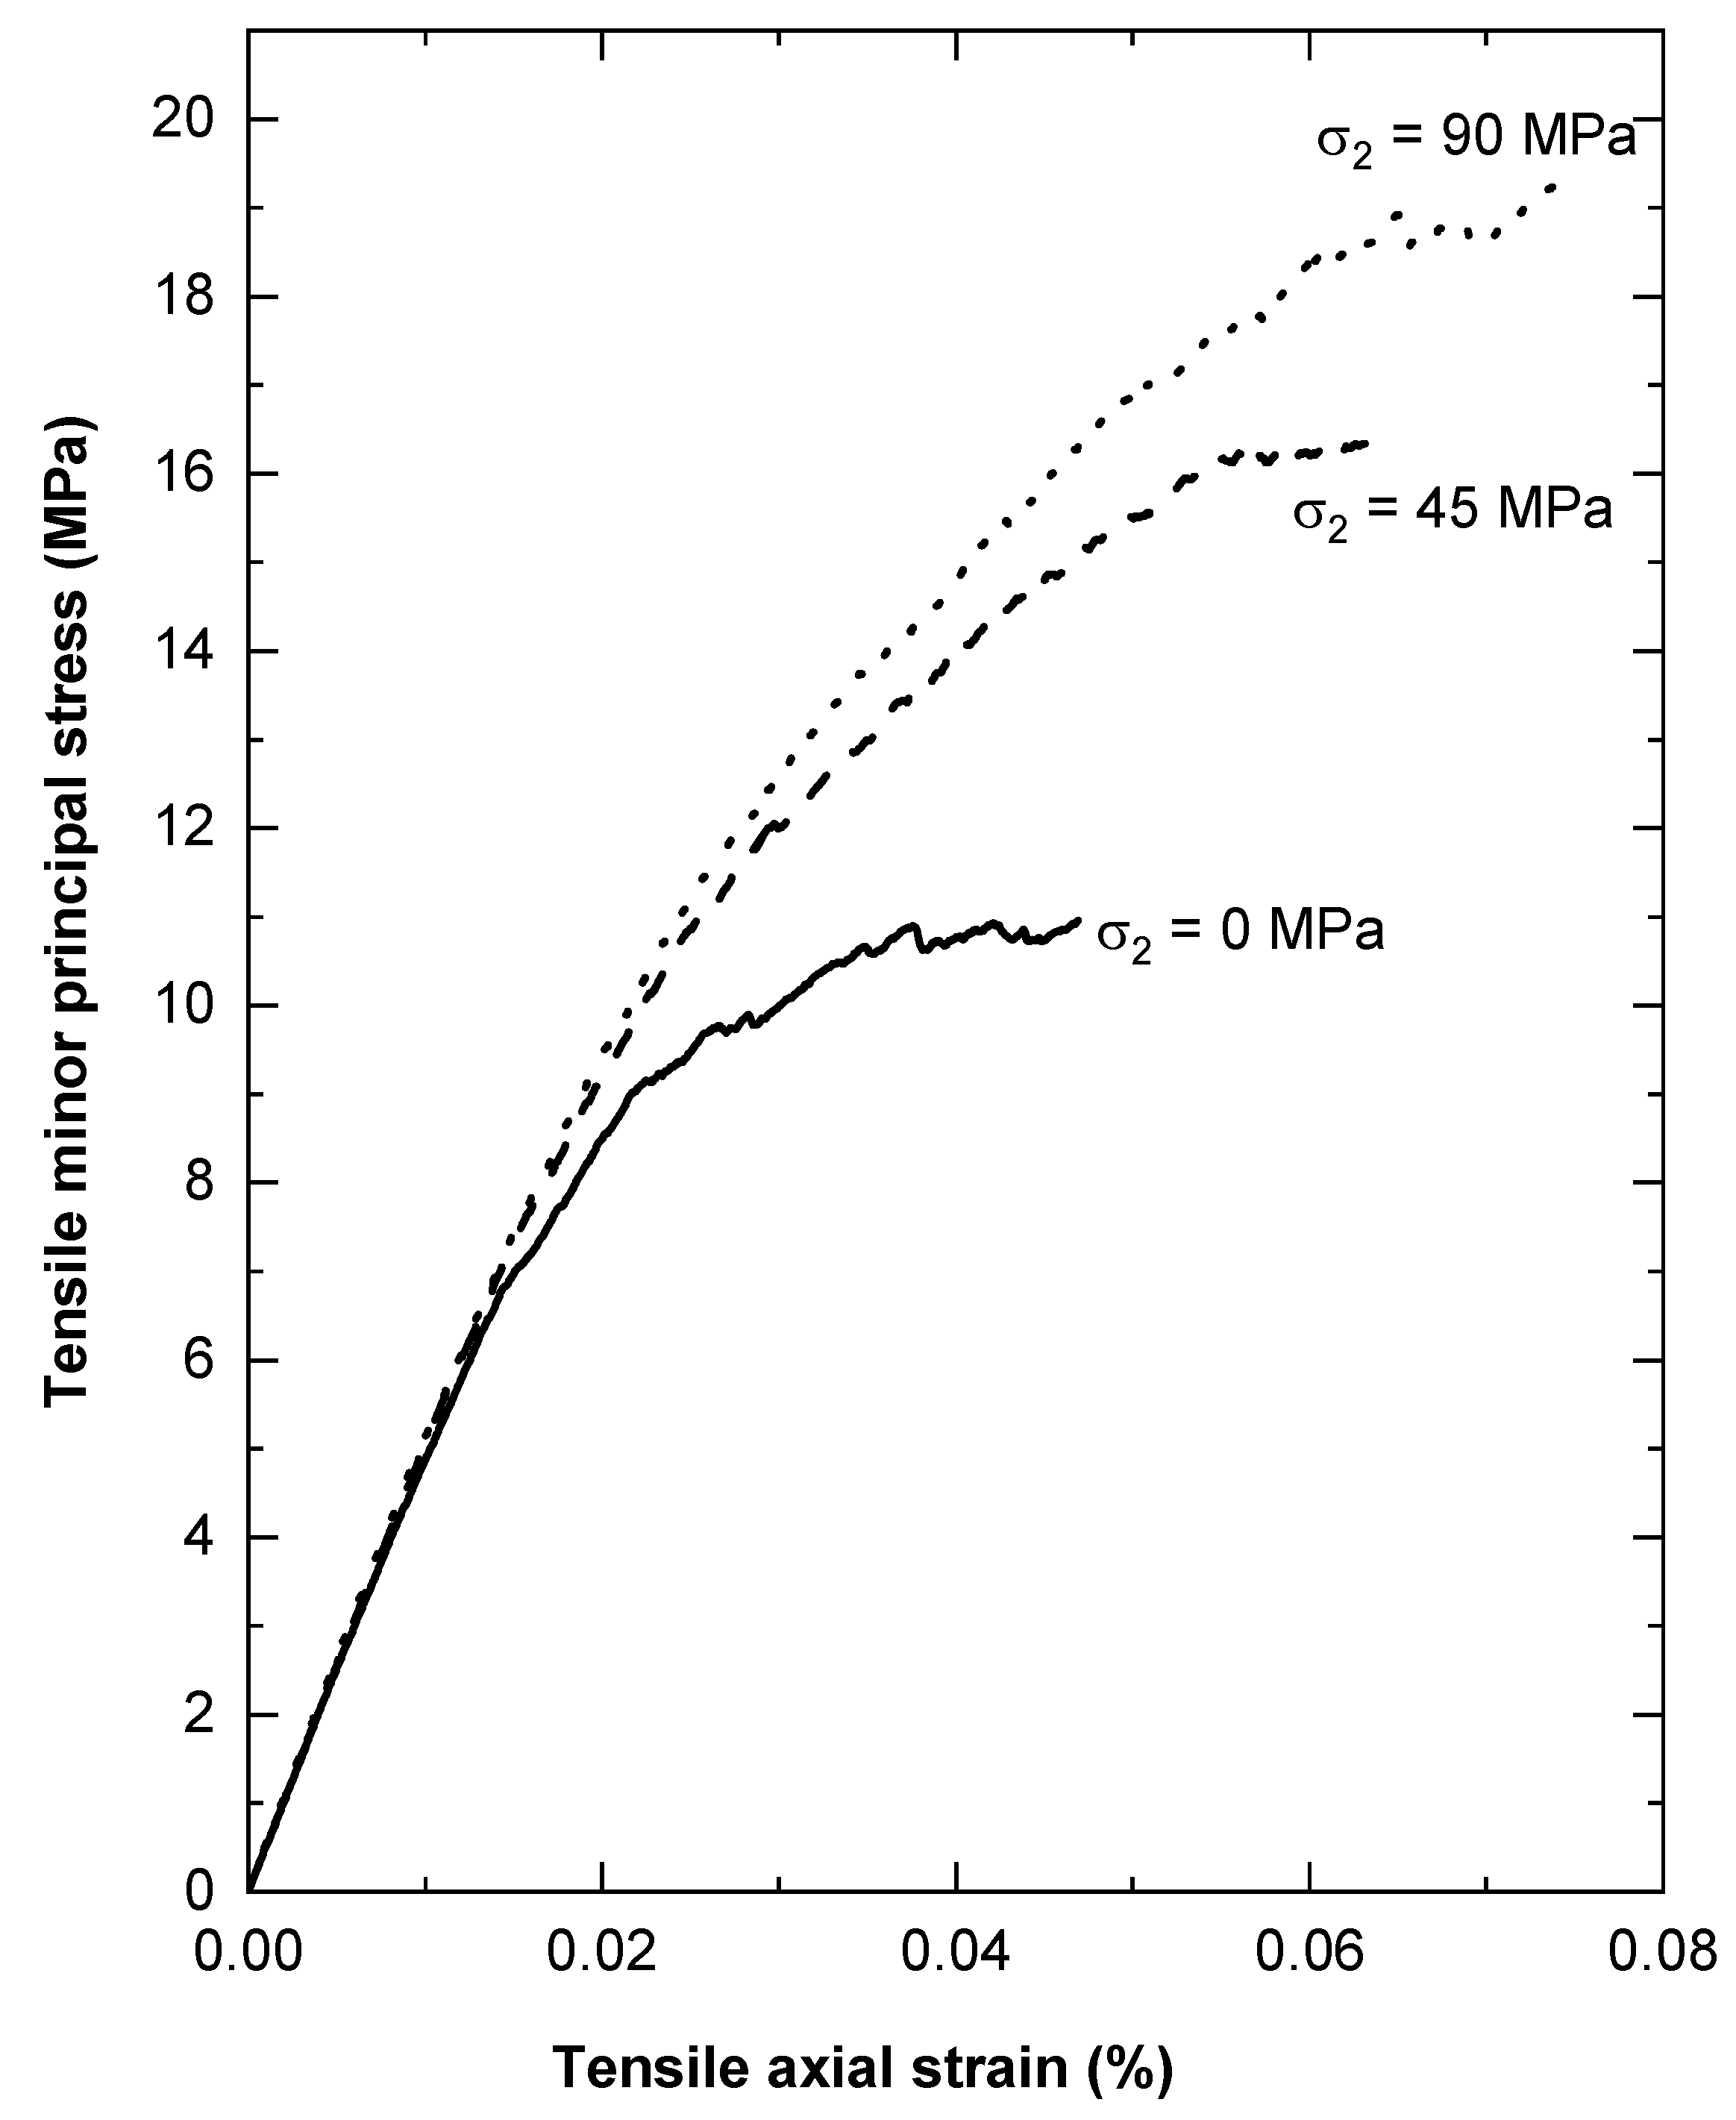
  • The numerical sample shows a clear impact of σ2 in the confined extension test. Rock with 90 MPa confinement for both σ1 and σ2 produced ~76% higher strength compared to the sample with σ2 = 0. This requires a review of the present methodology to test dog-bone-shaped specimens in confined extension.
  • Further investigations should consider simultaneous stress rotation along with the stress path to better understand its impact on strength reduction in field conditions compared to the laboratory.

Author Contributions

Conceptualization, S.P. and C.D.M.; funding acquisition, C.D.M.; investigation, S.P.; supervision, C.D.M.; writing—original draft, S.P.; writing—review and editing, C.D.M. All authors have read and agreed to the published version of the manuscript.

Funding

This research was funded by the Swedish Nuclear Fuel and Waste Management Co. (SKB) Sweden, the Canadian Nuclear Waste Management Organization (NWMO), and the Natural Sciences and Engineering Research Council of Canada.

Conflicts of Interest

The authors declare no conflict of interest. The funders had no role in the design of the study; in the collection, analyses, or interpretation of data; in the writing of the manuscript, or in the decision to publish the results.

Abbreviations

σciCrack initiation stress
σcdCrack damage stress
σ1, σ2, σ3Major, intermediate, and minor principal stress
DTDirect tension test
BTBrazilian tensile test
FBFlattened Brazilian test
UCSUniaxial compressive strength

References

  1. Brady, B.H.G.; Brown, E.T. Rock Mechanics for Underground Mining; Kluwer Academic Publishers: New York, NY, USA, 2005. [Google Scholar]
  2. Hoek, E.; Martin, C.D. Fracture initiation and propagation in intact rock—A review. J. Rock Mech. Geotech. Eng. 2014, 6, 287–300. [Google Scholar] [CrossRef] [Green Version]
  3. Hamdi, P.; Stead, D.; Elmo, D. Characterizing the influence of stress-induced microcracks on the laboratory strength and fracture development in brittle rocks using a finite-discrete element method-micro discrete fracture network FDEM-μDFN approach. J. Rock Mech. Geotech. Eng. 2015, 7, 609–625. [Google Scholar] [CrossRef] [Green Version]
  4. Kaiser, P.K.; Yazici, S.; Maloney, S. Mining-induced stress change and consequences of stress path on excavation stability—A case study. Int. J. Rock Mech. Min. Sci. 2001, 38, 167–180. [Google Scholar] [CrossRef]
  5. Bahrani, N.; Valley, B.; Kaiser, P.K. Numerical simulation of drilling-induced core damage and its influence on mechanical properties of rocks under unconfined condition. J. Rock Mech. Min. Sci. 2015, 80, 40–50. [Google Scholar] [CrossRef]
  6. Martin, C.D.; Tannant, D.D.; Kaiser, P.K. Stress path and instability around mine openings Cheminement de contraintes et instabilité d’effort autour des ouvertures de mine Spannungsweg und-instabilität um Grube Hohlräume. In Proceedings of the 9th ISRM Congress, Paris, France, 25–28 August 1999. [Google Scholar]
  7. Diederichs, M.S. Instability of Hard Rockmasses, the Role of Tensile Damage and Relaxation. PhD Thesis, University of Waterloo, Waterloo, ON, Canada, 2000. [Google Scholar]
  8. Andersson, J.C.; Martin, C.D.; Stille, H. The Äspö Pillar Stability Experiment: Part II-Rock mass response to coupled excavation-induced and thermal-induced stresses. Int. J. Rock Mech. Min. Sci. 2009, 46, 879–895. [Google Scholar] [CrossRef]
  9. Martin, C.D. Seventeenth Canadian Geotechnical Colloquium: The effect of cohesion loss and stress path on brittle rock strength. Can. Geotech. J. 1997, 34, 698–725. [Google Scholar] [CrossRef]
  10. Read, R.S.; Chandler, N.A.; Dzik, E.J. In situ strength criteria for tunnel design in highly-stressed rock masses. J. Rock Mech. Min. Sci. 1998, 35, 261–278. [Google Scholar] [CrossRef]
  11. Harrison, J.P.; Hudson, J.A. Visualising and understanding the stress path for rock mechanics modelling and testing, and rock engineering design. In Proceedings of the 10th ISRM Congress, Sandton, South Africa, 8–12 September 2003; pp. 487–492. [Google Scholar]
  12. Diederichs, M.S.; Kaiser, P.K.; Eberhardt, E. Damage initiation and propagation in hard rock during tunnelling and the influence of near-face stress rotation. J. Rock Mech. Min. Sci. 2004, 41, 785–812. [Google Scholar] [CrossRef]
  13. Cantieni, L.; Anagnostou, G. The Effect of the Stress Path on Squeezing Behavior in Tunneling. Rock Mech. Rock Eng. 2009, 42, 289–318. [Google Scholar] [CrossRef]
  14. Potyondy, D.O. A Flat-Jointed Bonded-Particle Material for Hard Rock. In 46th U.S. Rock Mechanics/Geomechanics Symposium; Available online: https://www.onepetro.org/conference-paper/ARMA-2012-501 (accessed on 1 January 2012).
  15. Potyondy, D.O. A Flat-Jointed Bonded-Particle Model for Rock. In 52nd U.S. Rock Mechanics/Geomechanics Symposium; American Rock Mechanics Association: Seattle, WA, USA, 2018. [Google Scholar]
  16. Patel, S.; Martin, C.D. Impact of the initial crack volume on the intact behavior of a bonded particle model. Comput. Geotech. 2020, 127, 103764. [Google Scholar] [CrossRef]
  17. ISRM. Suggested methods for determining tensile strength of rock materials. Int. J. Rock Mech. Min. Sci. Geomech. Abstr. 1978, 15, 99–103. Available online: https://www.isrm.net (accessed on 25 November 2020). [CrossRef]
  18. Bieniawski, Z.T.; Bernede, M.J. Suggested methods for determining the uniaxial compressive strength and deformability of rock materials. Int. J. Rock Mech. Min. Sci. Geomech. Abstr. 1979, 16, 137–140. [Google Scholar] [CrossRef]
  19. Brace, W.F. Brittle failure of rock: State of stress in the earth’s crust. In Brittle Failure of Rock: State of Stress in the Earth’s Crust; Judd, W.R., Ed.; American Elsevier: New York, NY, USA, 1964; pp. 111–180. [Google Scholar]
  20. Ramsey, J.M.; Chester, M.F. Hybrid fracture and the transition from extension fracture to shear fracture. Nature 2004, 428, 63–66. [Google Scholar] [CrossRef] [PubMed]
  21. Bobich, J.K. Experimental Analysis of the Extension to Shear Fracture Transition in Berea Sandstone. Master’s Thesis, Texas A&M University, College Station, TX, USA, 2005. [Google Scholar]
  22. Patel, S.; Martin, C.D. Application of Flattened Brazilian Test to Investigate Rocks under Confined Extension. Rock Mech. Rock Eng. 2018, 51, 3719–3736. [Google Scholar] [CrossRef]
  23. Ramsey, J.M. Experimental study of the transition from brittle shear fractures to joints. Master’s Thesis, Texas A&M University, College Station, TX, USA, 2003. [Google Scholar]
  24. Potyondy, D.O. The bonded-particle model as a tool for rock mechanics research and application: Current trends and future directions. Geosystem Eng. 2015, 18, 1–28. [Google Scholar] [CrossRef]
  25. Davoodi, A.; Asbjörnsson, G.; Hulthén, E.; Evertsson, M. Application of the Discrete Element Method to Study the Effects of Stream Characteristics on Screening Performance. Minerals 2019, 9, 788. [Google Scholar] [CrossRef] [Green Version]
  26. Potyondy, D.O.; Cundall, P.A. A bonded-particle model for rock. Int. J. Rock Mech. and Min. Sci. 2004, 41, 1329–1364. [Google Scholar] [CrossRef]
  27. Potyondy, D. Material-Modeling Support in PFC [fistPkg25]. 2017. Available online: https://www.itascacg.com/software/pfc (accessed on 22 November 2020).
  28. Patel, S. Impact of Confined Extension on the Failure Envelope of Intact Low-Porosity Rock. Ph.D. Thesis, University of Alberta, Edmonton, AB, Canada, 2018. [Google Scholar]
  29. Martin, C. The Strength of Massive Lac du Bonnet Granite around Underground Openings. Ph.D. Thesis, University of Manitoba, Winnipeg, MB, Canada, 1993. [Google Scholar]
  30. Eberhardt, E.; Stead, D.; Stimpson, B. Quantifying progressive pre-peak brittle fracture damage in rock during uniaxial compression. Int. J. Rock Mech. Min. Sci. 1999, 36, 361–380. [Google Scholar] [CrossRef]
  31. Brace, W.F.; Paulding, B.W.; Scholz, C. Dilatancy in the fracture of crystalline rocks. J. Geophys. Res. 1966, 71, 3939. [Google Scholar] [CrossRef]
  32. Bieniawski, Z.T. Mechanism of brittle fracture of rock: Part II—Experimental studies. Mech. Eng. 1967, 4, 407–423. [Google Scholar]
  33. Schöpfer, M.P.J.; Abe, S.; Childs, C.; Walsh, J.J. The impact of porosity and crack density on the elasticity, strength and friction of cohesive granular materials: Insights from DEM modelling. Int. J. Rock Mech. Min. Sci. 2009, 46, 250–261. [Google Scholar] [CrossRef] [Green Version]
  34. Huang, H.; Ma, Y. DEM Analysis of Intact Rock Strength under Confined Tension. Available online: http://itasca-downloads.s3.amazonaws.com/documents/Itasca%20symposia/2020/ExtendedAbstracts/02-02.pdf (accessed on 1 January 2012).
  35. Mogi, K. Effect of the intermediate principal stress on rock failure. J. Geophys. Res. 1967, 72, 5117–5131. [Google Scholar] [CrossRef]
Figure 1. Stress path obtained for a point 50 mm above the crown of a mine-by tunnel using 3D numerical modelling [9]. The Hoek–Brown (H–B) failure envelope and the stress path for direct tension, UCS, and triaxial tests are also shown. The thick dashed line represents the stress level above which crack initiates in rock.
Minerals 10 01119 g001
Figure 2. Stress path obtained from field measurements using CSIRO HI stress cells for σ1 and σ2 versus σ3 in the hanging wall of 565#6 stope, Winston Lake Mine [4]. Note: the rock in situ stress changes from initially confined compression to confined extension.
Minerals 10 01119 g002
Figure 3. Confined extension test on a dog-bone-shaped rock sample (after Brace, 1964).
Minerals 10 01119 g003
Figure 4. Results of confined extension test for (a) Carrara marble [23] and (b) Berea sandstone [21]. Direct tension (DT), UCS, triaxial compression, and confined extension test results as well as the Hoek–Brown failure envelopes are shown. The biaxial strength of the Berea sandstone was calculated using interpolation.
Minerals 10 01119 g004
Figure 5. (a) The cubical FJ BPM made up of 3618 grains and 17,110 FJ contacts used in the investigation and (b) representation of a partially fractured FJ [24]. In the fractured FJ, 14 of the 16 elements are cracked due to bending.
Minerals 10 01119 g005
Figure 6. Comparison of microcrack formation in the numerical sample with krat = 1.6 or 1.2 and the laboratory Lac du Bonnet granite sample. The sample-1 result is from Martin [29] and the sample-2 result is from Eberhardt et al. [30]. Note the numerical samples with krat = 1.6 or 1.2 are calibrated by the same macroparameters as those for Lac du Bonnet granite.
Minerals 10 01119 g006
Figure 7. Results of the UCS test for the numerical sample. (a) shows the axial stress versus the axial and radial strain and (b) shows the generation of tensile and shear cracks with axial strain.
Minerals 10 01119 g007
Figure 8. A typical failure envelope for rock showing the stress path during probable field-confined extension (ABC, unloading), confined extension (ODEC and OFG), and triaxial (OHG) tests. Note: the location of point A depends upon the boundary condition to which the rock is subjected in the field.
Minerals 10 01119 g008
Figure 9. Cracks formed in the sample at point E when the sample follows stress path (a) OEC, σ1 = 90 MPa, σ2 = 0 and (b) ODEC, σ1 = σ2 = 90 MPa. (a) 533 tensile and 3 shear, (b) 470 tensile and 5 shear.
Minerals 10 01119 g009aMinerals 10 01119 g009b
Figure 10. Tensile axial stress–strain curve obtained due to the application of tensile stress for stress paths ODEC and OEC (from point E to point C, Figure 8) at σ1 = 90 MPa.
Minerals 10 01119 g010
Figure 11. Comparison of crack development in the sample with an increase in the tensile strain from point E to point C for stress paths ODEC and OEC: (a) tensile cracks and (b) shear cracks.
Minerals 10 01119 g011
Figure 12. Stress–strain curves obtained for numerical confined extension tests at low (10 MPa), medium (90 MPa), and high (150 MPa) confinements (from point E to point C; Figure 8). In all cases, σ2 = 0.
Minerals 10 01119 g012
Figure 13. Number of tensile cracks formed with an increase in σ3 for numerical confined extension tests at low (10 MPa), medium (90 MPa), and high (150 MPa) confinements (from point E to point C; Figure 8).
Minerals 10 01119 g013
Figure 14. Number of shear cracks formed with an increase in σ3 for numerical confined extension tests at low (10 MPa), medium (90 MPa), and high (150 MPa) confinements (from point E to point C; Figure 8).
Minerals 10 01119 g014
Figure 15. Comparison of crack formation in the numerical sample for stress path ODEC (Figure 8): (ac) after the relaxation of σ3 (point E, Figure 8) and (df) at peak strength (point C, Figure 8) for σ2 = 0, σ2 = σ1/2 = 45 MPa, and σ2 = σ1 = 90MPa. Red = tensile crack, green = shear crack. (a) σ1 = 90 MPa; σ2 = 0 (964 cracks); (b) σ1 = 90 MPa; σ2 = 45 MPa (323 cracks); (c) σ1 = σ2 = 90 MPa (204 cracks); (d) σ1 = 90 MPa; σ2 = 0; (e) σ1 = 90 MPa; σ2 = 45 MPa; (f) σ1 = σ2 = 90 MPa.
Minerals 10 01119 g015
Figure 16. Confined extension test at σ2 = σ1 = 90 MPa, σ2 = σ1/2 = 45 MPa, and σ2 = 0 (stress–strain curve showing the impact of σ2 in the numerical sample).
Minerals 10 01119 g016
Figure 17. Comparison of crack formation in the numerical sample with an increase in σ2: (a) tensile cracks and (b) shear cracks. In all cases, σ1 was kept constant at 90 MPa.
Minerals 10 01119 g017aMinerals 10 01119 g017b
Figure 18. Results of laboratory and numerical samples on Lac du Bonnet granite. DT = direct tension, BR = Brazilian, FB = flattened Brazilian.
Minerals 10 01119 g018
Table 1. List of microparameters obtained after calibration for the numerical rock sample. Parameters required for grain and material genesis are also listed [27].
ParameterValue
Associated with grain size distribution:
Minimum grain diameter2.2 mm
Grain-size ratio2.3
Associated with material genesis:
Width of sample54 mm
Height–width ratio1
Associated with FJ material group:
Installation gap1.31 mm
Bonded fraction0.65
Gapped fraction0.35
Slit fraction, derived0
Initial surface-gap distribution, mean0.002 mm
Initial surface-gap distribution, standard deviation0
Elements in radial direction1
Elements in circumferential direction3
Radius-multiplier code0
Radius-multiplier value0.577
Effective modulus135.8 GPa
Stiffness ratio1.2
Friction coefficient1.4
Tensile-strength distribution, mean41.6 MPa
Tensile-strength distribution, standard deviation0
Cohesion distribution, mean203 MPa
Cohesion distribution, standard deviation0
Friction angle43.2°
Associated with the linear material group:
Effective modulus135.8 GPa
Stiffness ratio1.2
Friction coefficient2.2 mm
Table 2. Comparison of macroresponses observed in the laboratory Lac du Bonnet granite and numerical samples.
CaseEc (GPa)νcσci (MPa)σcd (MPa)UCS (MPa)Et (GPa)σt (MPa)Et/Ec
Lab70.50.2688.6163.3221.745.810.60.65
Numerical69.30.197.7208.1219.647.710.80.69
Publisher’s Note: MDPI stays neutral with regard to jurisdictional claims in published maps and institutional affiliations.

