1. Introduction
The mining industry relies on access to accurate data on the key geological attributes, as reliable information is a central enabler for effective process control and decision-making in commercial mines. Sensor technologies allow obtaining relevant and accurate information on the geological attributes that are crucial in mining (e.g., mineralogy, geochemistry and ore–waste ratio). Such information can be generated along the mining value chain (e.g., during material extraction, transport and processing). Thus, accurate information potentially leads to increased productivity, efficient data management, and enables one to ensure the compliance of the mining process with environmental safety standards. It may thereby greatly enhance the economic, safety, and environmental performance of a mining operation.
The dynamic development of sensors resulted in high-end technologies that are rapid and efficient for the accurate characterisation of various types of materials. These technologies produce different types of data that are applicable to the analysis of materials in several disciplines. The two primary data types output from sensors are images (e.g., RGB images and hyperspectral images) and point data (e.g., infrared spectrum and Raman spectrum). The image and point data each have their benefits. The point spectrometers offer a high spectral resolution, high signal-to-noise ratio, high dynamic range and lightweight instruments. In contrast, imaging technologies are advantageous in providing information over a wider field of view (FOV), allow remote operation, offer a high spatial resolution, permit textural analysis and can provide insight into the spatial distribution of minerals. The two data types can provide valuable information on key geological attributes. For example, the image data can be used for mineralogical, geochemical and textural analysis. Likewise, the point data can offer mineralogical and geochemical data. Therefore, the integration of image and point data can significantly benefit mining by maximising the accuracy of material characterisation via the combined benefits from both data types.
State-of-the-art hyperspectral sensors provide hyperspectral images with high spatial and spectral resolutions. The use of these technologies along the mining value chain can likely maximise the efficiency in exploration, extraction, material transport and mineral processing activities. For example, drill core scanning using hyperspectral imagers is one of the most widely used applications of sensors in mining operations. It is advantageous in providing the means for objective, rapid and detailed analysis of a large number of drill cores compared to the traditional core logging approach. Besides this, it allows a semi-quantitative analysis of minerals and provides reproducible results. Hyperspectral images can allow the simultaneous characterisation of minerals, geological structures and textural information. Moreover, portable point spectrometers also play a significant role in the rapid determination of materials in mining. For example, a portable X-ray fluorescence (XRF) system and a short-wave infrared (SWIR) sensor are in use for the rapid in-situ analysis of materials [
1,
2]. In general, the use of sensors along the mining value chain is beneficial for automation, remote operation, ore-grade control and process optimisation [
3,
4].
The infrared region of the electromagnetic spectrum covers from λ = 0.7 to 1000 µm and is subdivided into different regions [
5,
6]. For example, it can be divided into the visible-near infrared (VNIR: 0.4–1.0 μm), SWIR (1.0–2.5 μm), mid-wave infrared (MWIR: 2.5–7.0 μm) and long-wave infrared (LWIR: 7.0–15.0 μm) regions. Infrared technologies are well-established technologies that can be used for the characterisation of organic and inorganic materials in a wide range of applications. Numerous investigations have been carried out on the application of these technologies for mineralogical analysis in remote sensing, field-based and laboratory-based studies. VNIR technology permits the identification of iron oxides; it can also indicate the presence of sulphide minerals [
7,
8,
9,
10,
11,
12]. Studies showed that VNIR could be used for qualitative and quantitative analysis of the iron oxides [
12,
13,
14]. SWIR is a well-established technology for the analysis of alteration mineralogy [
8,
15]. Numerous researchers have used SWIR for the mapping of minerals and ore–waste discrimination [
15,
16]. LWIR can be used for the identification of rock-forming minerals [
13,
17]. On the other hand, the MWIR is the least-explored region of the infrared. However, recent studies have showed the great potential of the technique for material characterisation [
18,
19,
20,
21].
Numerous researchers demonstrated the use of hyperspectral imaging in mining and geological applications. In remote sensing, infrared hyperspectral imaging techniques are widely used for the mapping of minerals, the delineation of ore zone and in the identification of geological structures. For example, Rowan et al. [
22] used VNIR to discriminate the major rock units (the altered and unaltered areas) in south-central Nevada. Kruse [
23] used SWIR data for the mapping of minerals that are associated with hydrothermally altered rocks. Similarly, Crósta et al. [
24] utilized the VNIR and SWIR range hyperspectral images for the mapping of hydrothermal alteration minerals. In another study, Watson et al. [
25] demonstrated the use of thermal infrared for the mapping of lithological units based on their emissivity. Several studies were conducted using remotely sensed hyperspectral images for the mapping of minerals, lithological units and the identification of geological structures [
14,
15,
17,
26,
27,
28,
29,
30,
31,
32,
33]. Moreover, different researchers demonstrated the use of hyperspectral images for the identification and mapping of minerals in drill core and rock chip samples [
16,
34,
35,
36,
37,
38,
39].
Data fusion is the process of integrating multiple data blocks from different data sources, which can interact and inform each other [
40,
41]. The fusion of various data sources enhances the performances of the classification or prediction models owing to the synergy among the incorporated datasets. Data fusion can be implemented at multiple levels using the various multivariate data analysis techniques. For example, in chemometrics, data fusion can be realised at low, mid, and high levels. The low-level data fusion involves the simple concatenation of pre-processed data blocks from multiple data sources [
42,
43,
44]. Mid-level data fusion is a feature-level fusion that involves variable selection or feature extraction prior to multivariate analysis [
44,
45]. The low- and mid-level data fusion methods combine the data sources at the data level. High-level data fusion, also known as decision fusion, combines model outputs to produce a more accurate decision. In high-level fusion, separate models are first developed for each available data block, and then their responses are fused to produce a final response [
46]. When the three levels of data fusion approaches are used in combination with each other (i.e., when a low-level is combined with a mid-level to obtain a decision), the approach is called multiple-level fusion [
42].
Previous studies indicate that the fusion of hyperspectral images using different image fusion techniques resulted in improved performance in various geological and environmental studies. For example, the integration of the VNIR, SWIR and LWIR hyperspectral images using extracted spatio-spectral features resulted in greatly improved drill core mapping [
47]. Similarly, Feng et al. [
48] combined SWIR and LWIR hyperspectral image data for a better lithological mapping than with the individual techniques. More recently, Sun et al. [
49] showed that the fusion of hyperspectral images using the extracted spatio-spectral features resulted in the enhanced classification of land-use/land cover maps. In another study, Kruse [
50] demonstrated an integrated analysis of the VNIR, SWIR and LWIR hyperspectral images for the improved mapping of geological units. In raw material characterisation, the VNIR, SWIR and LWIR are commonly utilised separately, and the integrated analysis of these technologies is very limited. Although few studies indicated the advantages of data fusion, such applications usually combine imageries to achieve enhanced classification maps or better resolution images. The integrated analysis of hyperspectral images is commonly performed by the concurrent analysis of data blocks after wavelength range-specific absorption features are extracted, or by combining the mapping results of the individual data blocks using geologically directed logical operators [
50,
51]. The other common fusion approach is a continuous wavelet analysis that combines wavelet scales spectral profiles of the data blocks [
48]. In a recent study, Lorenz et al. [
47] integrated VNIR, SWIR and LWIR data via images co-registration and spectral–spatial information fusion for enhanced drill core mineral mapping. However, the integration of multi-source and multi-scale data is still limited and requires novel fusion approaches for the integration of image-to-image, image-to-point or point-to-point spectral data.
In several studies, techniques have been developed to extract information using the diagnostic spectral features of minerals in the different wavelength regions of the infrared using both hyperspectral images and point measurements. However, such approaches become ineffective if, as in the case of sulphides, the minerals under study do not exhibit diagnostic features. Thus, in such cases, data-driven strategies that exploit the differences in the spectral responses of the minerals are required to extract knowledge from the infrared spectral data. Each sensor technology operates over a specific range of the electromagnetic spectrum and provides information on certain aspects of material properties. However, a single sensor might not offer a sufficiently comprehensive description of material composition. This study proposes a method of combining the hyperspectral images (VNIR and SWIR) with point spectrometer (MWIR and LWIR) data using machine learning techniques and data fusion approaches for the separation of sulphide ore from waste materials with no diagnostic absorption features of the sulphide minerals. To date, imaging and point infrared techniques have not been fused for the characterisation of material in polymetallic sulphide deposits. This gap in the current analytical methodology and the promising findings [
18,
20] reported recently have motivated this study. Thus, the main aims of this study were (1) to assess the possibility of a fusion of hyperspectral images (VNIR and SWIR) and point (MWIR and LWIR) data for the discrimination of ore and waste materials at different cut-off grades using multivariate data analysis techniques and an endmembers weight-based data fusion approach, (2) to investigate the use of the generalised point spectra computed from hyperspectral image data (VNIR and SWIR) for the separation of ore and waste materials in a polymetallic sulphide deposit, and (3) to assess the improvements in the classification models after data fusion.
One of the main advantages of the developed methodological approach is that it dramatically minimises the data volume while maintaining most of the relevant information so as to enable ore and waste separation at different cut-off grades. This minimises the need for big data storage and high-performance computing systems for data processing. Thus, the approach is beneficial for the analysis of high-spatial and spectral resolutions data, as well as for high throughput data. The other advantage of the method is that it allows the establishing of a relationship between the spectral data of the different data blocks and the elemental concentration of the samples, thus permitting the classification of the materials at different cut-off grades. Besides this, the developed method relies on a data-driven approach, therefore does not require a prior specification or identification of minerals and elements.
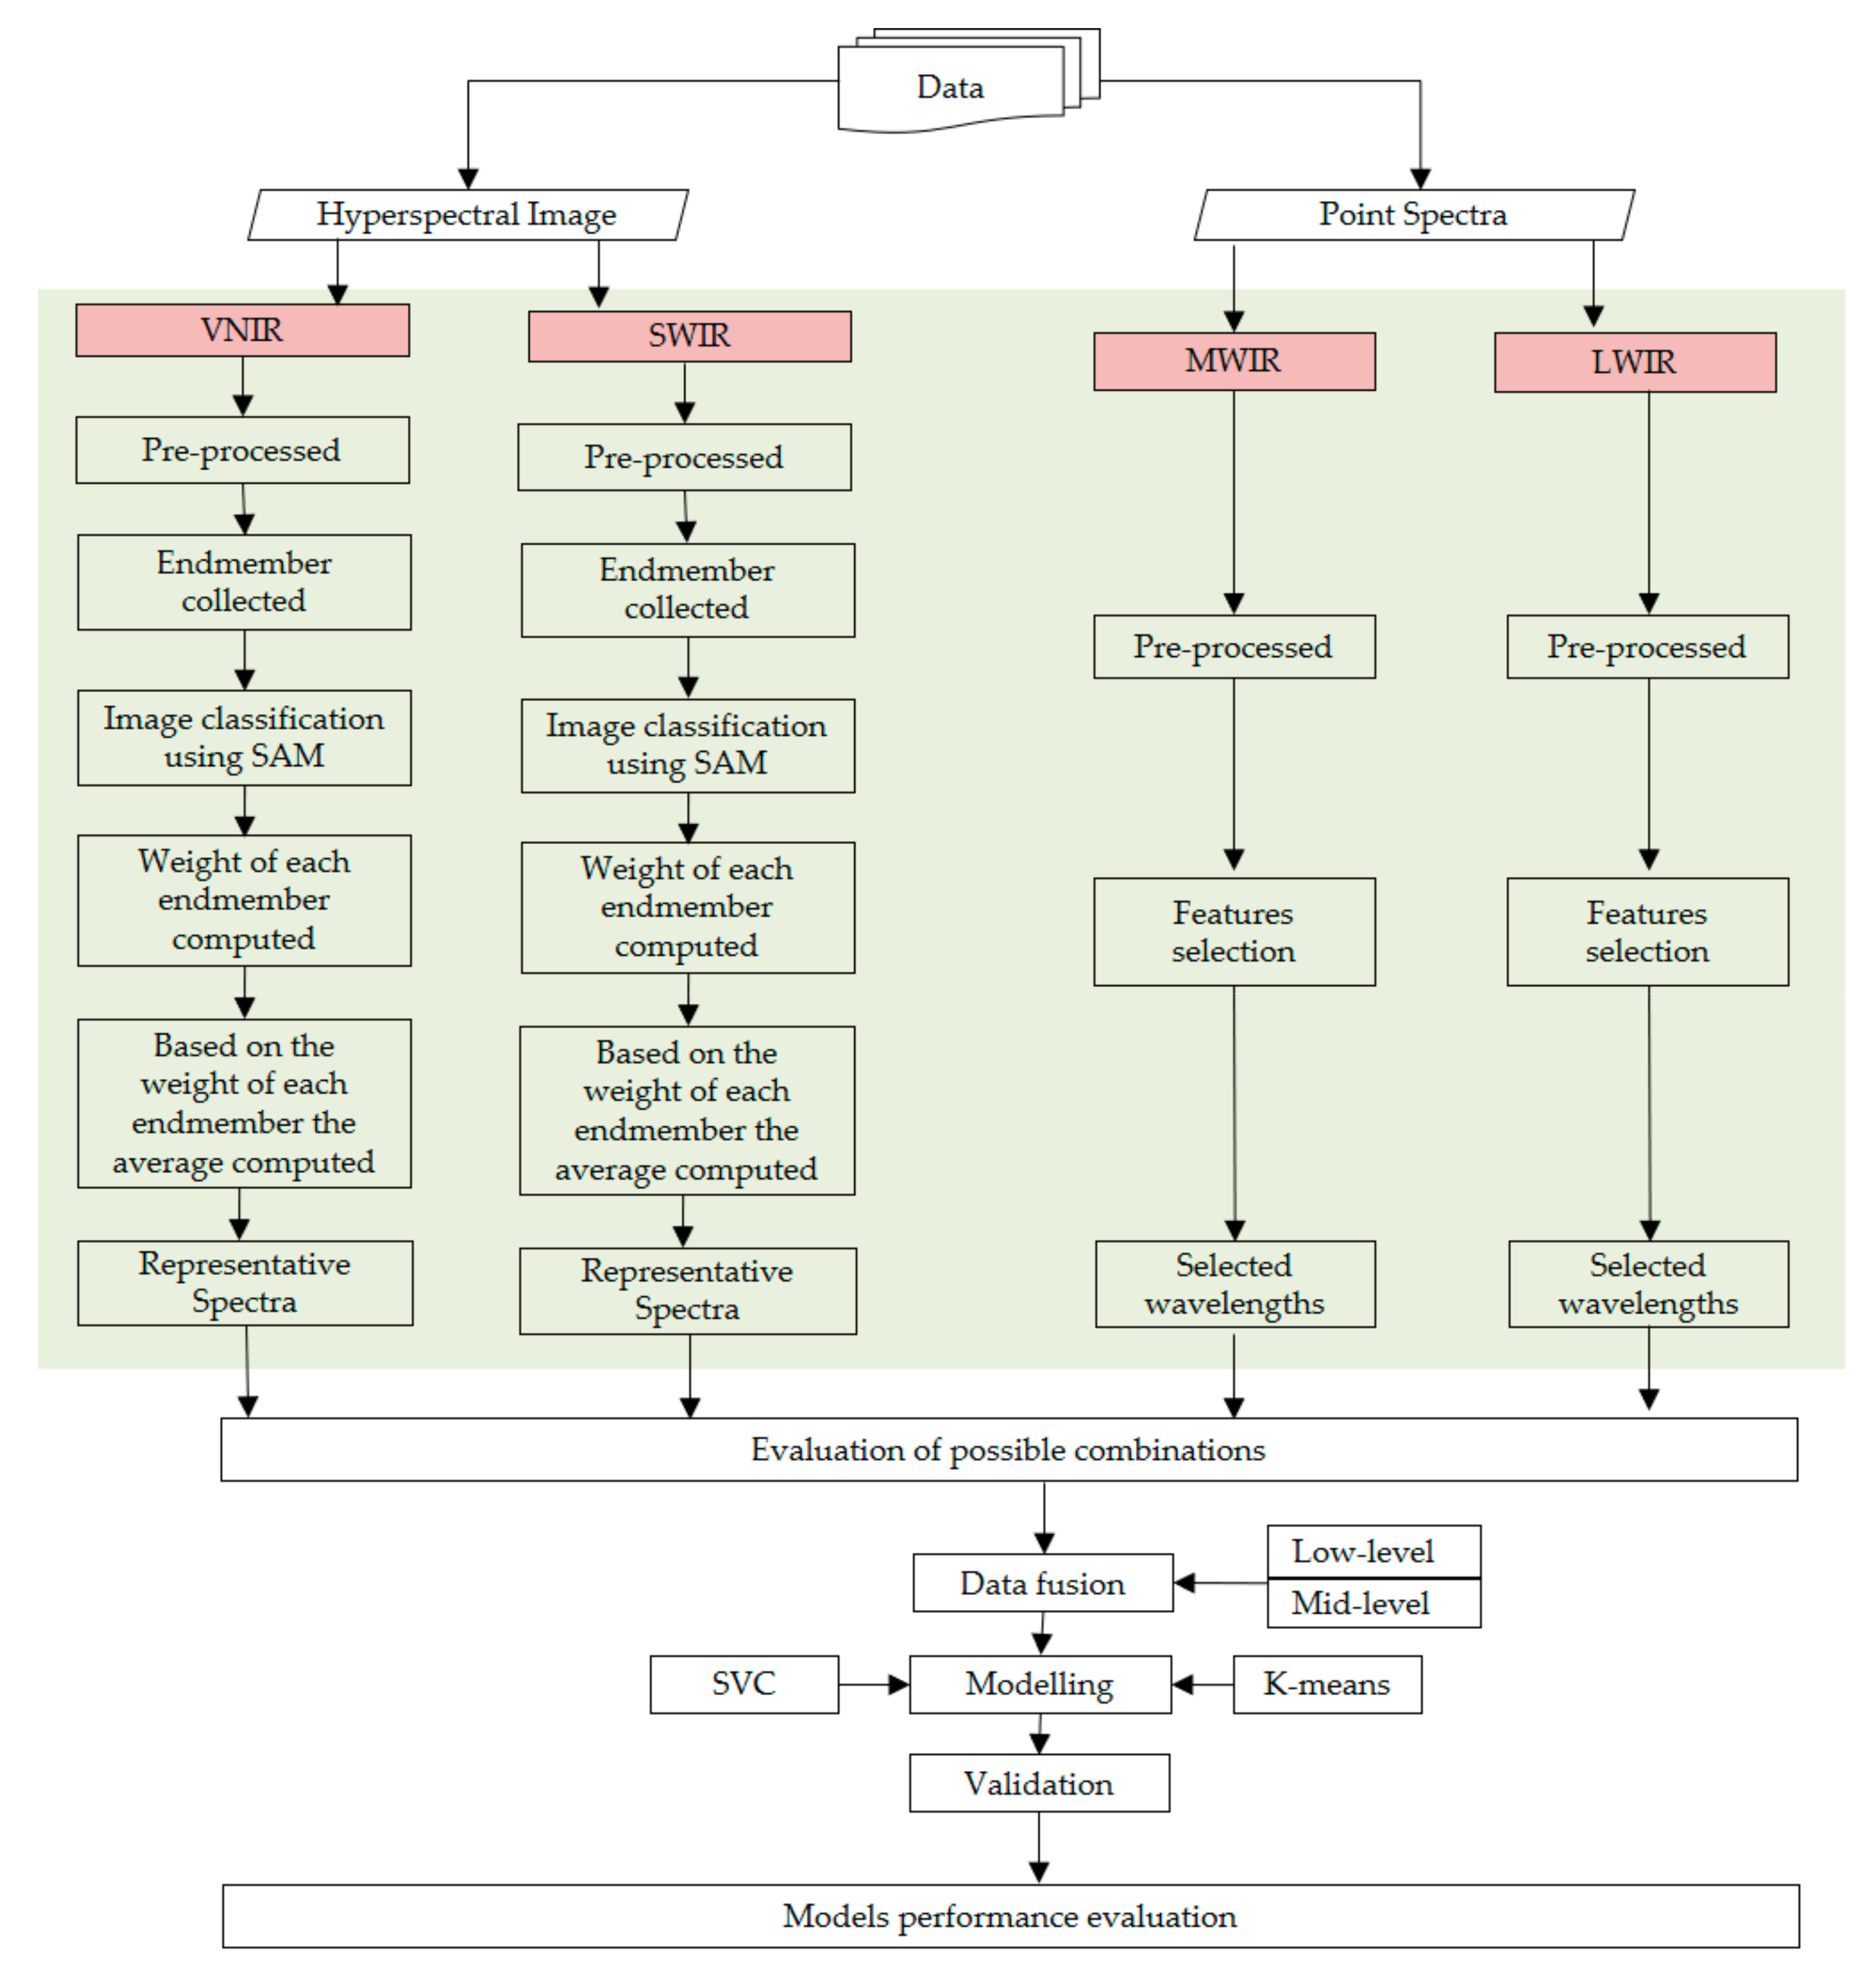
3. Methods
As illustrated in
Figure 2, the material discrimination approach developed as a part of the present study is a multi-step process that incorporates data conversion, data pre-processing, evaluation of possible combinations, modelling and model validation. The data conversion and pre-processing tasks (denoted as a green box in
Figure 2) include the conversion of the pre-processed VNIR and SWIR hyperspectral image data into representative point spectra. The MWIR and LWIR data blocks were also pre-processed. Using the computed VNIR and SWIR representative spectra and the pre-processed MWIR and LWIR data, classification models were developed using the unsupervised and supervised classification techniques. The models were applied to the individual data blocks as well as to the multiple possible combinations of the four data blocks (
Figure 2). The classification models were validated using the geochemical data. The details of each step are described below.
3.1. Theoretical Concept for Possible Image to Point Data Fusion
3.1.1. The Proposed Possible Options and the Preferred Approach
Depending on the sensor data type and application, data fusion can be implemented using various approaches. For example, the integration of image and point data can be image-to-image, image-to-point or point-to-point. This study focuses on the integration of image and point data, but the integration of image-to-image was also assessed. Image and point data are multiscale and multiformat data that require data transformation (or other possible strategies) for use in the same data models. This should be done in such a way that the relevant information is retained while the data are converted to different data forms. In this study, three possible image and point spectroscopic data integration options were evaluated, and the preferred approach was implemented. The first approach transforms the image data into point data by extracting the endmembers (i.e., spectrally unique pixels) of the image and computing the average without considering the weight of the endmembers. The results are spectra (point data), and so the representative spectra computed from the images and the collected point data can be fused. The second approach takes image and point measurements at the same locality, and fuses the two data types based on location (i.e., location-based fusion). This can be achieved by selecting target locations on the image and taking point measurements at those points. The third option converts the image data into point data by extracting the endmembers of the image and computes the average based on the weight of each endmember. This approach relies on the prominence of the endmembers and enables weight-based fusion. The benefits and limitations of the three possible approaches are presented in
Table 1. In this study, the third option was preferred because it ensures representation based on the weight proportion of each endmember. The effect of weight-based averaging is comparable with point measurements since the latter relies on taking multiple measurements at different locations of the sample surface and averaging.
3.1.2. Comparative Advantages of Image and Point Data
Unlike hyperspectral imagers, point spectrometers capture spectral information at specific points on the material surface. Depending on the measuring surface of the sensors, the size of the point of observation (spot) varies. For example, an FTIR 4300 sensor offers different FOVs corresponding to the three interfaces: the diffuse reflectance sample interface has a 2 mm diameter, the attenuated total reflection (ATR) interface has a 1 mm diameter and the external reflectance has a 6 mm diameter [
56]. Despite the variation in the measuring surface diameter (FOVs) of the sensors, point spectrometers provide a single spectrum. Therefore, multiple measurements are taken at the surface of the sample to ensure the measurements are representative. Thus, sample heterogeneity can determine the required number of point measurements per sample. More homogenous material requires fewer measurements, while the higher the heterogeneity, the more measurements are required. The point measurements do not necessarily provide spatially resolved data; instead, the spectral data can include spectral information from the co-existing mineral mixtures in the vicinity or within the FOV of the sensor. Therefore, the spectra from point spectrometers are mixed in most cases. In contrast, the image data, such as the hyperspectral imaging of rock chips or drill cores, covers all parts of the samples under the imaged scene. Therefore, the spectral information at each point of the sample surface is available. Some of the benefits and shortcomings of the image and point data types are summarised in
Table 2.
3.2. Image Data Conversion
3.2.1. Pre-Processing
The raw VNIR and SWIR hyperspectral images were pre-processed prior to data analysis and information extraction. The pre-processing techniques applied were normalisation to reflectance, spectral subsetting, masking (spatial subsetting), and spike correction. The normalisation technique converts the irradiance data to reflectance using the white and dark references for the calibration. The white reference is the measurement with almost 100% reflection over the entire wavelength range, whereas the dark reference was captured with no light entering the sensor. Thus, the relative reflectance of the images is calculated by dividing the measured image by the white reference image after subtracting the dark reference image from both measurements. The raw hyperspectral images were acquired with more bands than the indicated range (e.g., the SWIR data were acquired from 0.98 µm to 2.53 µm; however, for the test case materials, the spectral ranges from 0.98 to 1.0 µm and 2.5 to 2.53 µm yielded noisy results). Thus, spectral subsetting was performed to eliminate the noisy bands. Likewise, spatial subsetting was performed to remove unnecessary (e.g., pixels that do not represent a sample) parts of the acquired images. This was performed by a manual spatial subsetting. Spikes are intensity values that differ significantly from their neighbouring pixels. The spikes were identified by finding the local maxima and minima and setting a threshold. Consequently, the intensity values of spikes were removed and replaced using a linear interpolation of the surrounding wavelength bands. Missing data (non-numeric values; NaN) might appear because of sensor (detector) artefacts (e.g., damaged pixels and striping). Thus, the NaN values were assessed and masked out using the build mask function in ENVI.
3.2.2. Feature Extraction
The minimum (or maximum) noise fraction (MNF) transformation was applied for each processed image in order to isolate noise from the signal. The MNF transform is implemented in two cascaded principal component transformations. The first transformation estimates the noise from the data and, based on estimated noise covariance matrix, the transformation decorrelates (no band-to-band correlations) and rescales (unit variance) the noise in the data. The data dimensionality was determined using the eigenvalues and the MNF images (eigenimages). The informative MNF components (with larger eigenvalues and coherent eignimages) were used to inversely transform the MNF data to relatively noise-free spectral images that have the same number of bands as the original dataset [
57]. The inverse transformed MNF images were used to generate 2D scatter plots using the most informative MNF components (usually the first two components). These scatter plots were used to identify spectrally unique pixels (endmembers). The extracted features (selected endmembers) checked for their uniqueness and similar endmembers that show the same spectral information were merged (or combined) by computing the average. Moreover, the endmembers of the spectra were also assessed by computing the Pixel Purity Index (PPI). PPI is the most popular endmember extraction algorithm (spectral unmixing method) that is usually performed on MNF data that have been reduced to coherent images [
58,
59]. Consequently, the pure endmembers of the VNIR and SWIR hyperspectral images were extracted separately.
The collected unique spectra were interpreted to identify minerals using spectral databases such as the USGS digital spectral library [
8], the spectral interpretation field manual [
7] and ECOSTRESS spectral library [
60]. The identification of minerals was based on the wavelength location of distinctive features, the shape of the main absorption features of each spectrum, reflectance intensity and depth of diagnostic absorption bands, in comparison to reference spectra. Consequently, some of the unique spectra were identified using the available spectral libraries. However, there are also unidentified unique spectra, possibly due to factors such as mineral mixtures, physical matrix effects or weak spectral responses.
The extracted endmembers (both the identified and unidentified unique spectra) were used to generate training sets (Regions of Interest; ROI). The ROI’s were used to produce mineral maps that show mineral distribution and pixel abundances using a spectral angle mapper (SAM). SAM is a supervised classification method that calculates the spectral angle between the reference spectra (endmembers) and the unknown pixels to identify the different classes in the image [
61,
62]. It is a rapid mapping tool, which is relatively insensitive to illumination effects and other spectral artefacts [
61]. The mineral maps produced show the locations and pixel abundances of each endmember. A pixel count was performed using the classified VNIR and SWIR images of each sample separately. The number of pixels of each endmember was used to compute the relative abundance of the identified and unidentified minerals. Following this, the weight of each endmember was used to calculate the final average spectrum of each sample. The mathematical equations for the conversion (representation) of the image data to a spectrum are shown below:
where
y denotes the proportion of an endmember in the sample,
w is the total number of pixels of the image,
x represents the endmembers (the identified and unidentified minerals),
i is the number of endmembers,
k is the total number of the endmembers,
n represents the last endmember, and
T is the average representative spectra of a sample.
As indicated in
Table 2, both the image and point data have their advantages and limitations. Thus, the conversion of the image to point data is not because the point data is superior to the image data. Instead, for the combined analysis of the image and point data, one possible approach can be the converting of the two data types into the same data scale while maintaining the relevant spectral information from both data types. Consequently, data conversion was performed to transfer the hyperspectral image data of each sample into a representative spectrum. The representative spectrum represents the average of pure endmembers multiplied by their weight. The same procedure was followed to generate the VNIR and SWIR representative spectra separately.
The VNIR and SWIR sensors used in this study offer the same FOVs, such that a straightforward pixel-by-pixel co-registration of the two images is possible. However, this approach was not considered since the focus was the integration of the image and point data. Thus, the image data were converted to point representative spectra, and the usability of the transformed (generalised) data for the discrimination of ore and waste materials was assessed. In the proposed approach, two scenarios can be verified: (1) the usability of the images that were generalised into point data to still provide useful information, and (2) whether this approach permits the fusion of image (VNIR and SWIR) and point data (MWIR and LWIR) for the enhanced characterisation of materials.
3.3. Point Spectral Data Pre-Processing and Feature Extraction
The principal component analysis (PCA) model was applied to the datasets. The PCA models transformed the spectral data into principal components (PCs) [
63]. The scores plots of the PCA models were used to investigate the grouping structure (intra-sample relationships). The loading plot of the PCs was interpreted to reveal the wavelength regions with a large loading coefficient or the most variations. These wavelength regions are important variables that contain more information. Consequently, the features, those containing information pertinent for the separation of ore and waste material, were independently extracted from the MWIR and LWIR data blocks. The extracted informative variables from the MWIR data are the wavelength ranges from 2.5 to 3.0 µm, 3.5 to 4.2 µm and 5.6 to 6.3 µm. Likewise, the ranges 7.3 to 7.8 µm, 10.8 to 11.5 µm, 13.6 to 14.0 µm and 14.5 to 15.0 µm were extracted from the LWIR data. Thus, the MWIR and LWIR data blocks consist of the extracted informative features from the two spectral regions. The MWIR and LWIR data used in this study are point measurements. As described in
Section 2.2.2, sample heterogeneity was accounted for by collecting multiple spectra from each sample and computing the average. Therefore, the datasets (VNIR, SWIR, MWIR and LWIR) used in this work are based on average spectra that were calculated based on material variability.
The pre-processing techniques applied to the data blocks were smoothing (Gaussian filter smoothing), baseline correction and normalisation. Smoothing is based on averaging the neighbouring variables, and it is used to minimise random noise [
64]. On the other hand, when baseline correction is performed, the unwanted “background signal” is subtracted from the main signal information. Normalisation aims to divide each spectrum based on the estimation of its spectral intensity and remove undesired intensity variation due to the multiplicative effects [
64].
3.4. Data Modelling
3.4.1. K-Means
The multivariate analysis techniques used to develop the classification models are the K-means and support vector classification (SVC) methods. The K-means is one of the simplest and most highly efficient unsupervised machine learning algorithms that cluster unlabelled data into the specified number of groups [
65,
66]. The algorithm aggregates data points based on feature similarity and reveals underlying patterns. It involves defining a target number of clusters (i.e., the number of centroids) required in the analysis. K-means is an iterative algorithm that allocates every data point to the nearest group by minimising the in-cluster sum of squares. The technique identifies non-overlapping subgroups (clusters) in the data using similarity measures, such as Euclidean-based distance. In this work, the K-means with Euclidian distance was applied to classify the spectral data into two clusters. This was performed for the individual and fused data blocks, separately. The classification results of the models and the reference values were used to compute the correct classification rate of the individual and fused data block models separately.
3.4.2. Support Vector Classification (SVC)
SVC is a supervised classification method, used to optimise separation between different classes or groups [
67,
68,
69]. The algorithm finds an optimal hyperplane (decision boundary) in a higher-dimensional feature space that distinctly classifies the data points using kernel functions. The kernel functions can take many forms, such as linear, radial basis function (RBF), polynomial, sigmoid, etc. Consequently, SVC is a powerful model that can be applied to both linear and non-linear systems [
69]. Data points that are closer to the hyperplane influence the position and orientations of the decision surface. Such data points are referred to as support vectors (SVs). Thus, SVs are a subset of the analysed samples that are closest to the hyperplane. The SVC models with the lower number of SVs are more able to minimise the misclassification of data points. The SVC classification type used in this work is C-SVR with a polynomial kernel function, as this kernel type can be utilised to model non-linear systems of varying complexity. The key model parameters for the specification of C-SVC models are C value and gamma. The C value is a capacity (penalty) factor for the measure of models’ robustness. It trades off the misclassification of data points against the simplicity of the hyperplane. The gamma parameter determines how far the influence of a single training example (single data sample) reaches, and controls what is ‘close’ and what is ‘far’. Thus, it adjusts the curvature of the hyperplane of the model. The SVC is a supervised classification technique, thus prior to modelling, the samples were designated as ore or waste based on the concentration of the elements at the required cut-off grade. The data blocks with the material class information were used to develop the SVC models.
The SVC model was validated using a leave-one-out cross-validation (LOOCV). LOOCV is one of the resampling (subsampling) procedures for the validation of models with a small dataset [
70]. It ensures that every observation from the original dataset has the chance of appearing in the training and test set. At each iteration of the algorithm, one sample was left out at a time from the calibration data, and the models were built using the remaining data in the training set. The performances of each of these resulting models were validated using the left-out sample. The algorithm repeatedly runs until each sample in the calibration dataset serves as the test. Thus, LOOCV provides an estimate of model performance as each sample measurement is allowed to represent in the validation dataset. In this work, the optimal model parameters (C and gamma) were optimised using a grid search approach. The correct classification rate of each left-out spectrum was calculated after selecting the optimal parameters. Finally, the average of the correct classification rate values of each iteration is reported as the performance of the classification model.
The performances of the K-means and SVC classification models were evaluated for the separation of ore and waste materials at the 3%, 5% and 7% cut-off grades using the individual as well as the fused datasets. Samples with a concentration below the cut-off grade are designated as waste, whereas those with a concentration above the cut-off grade are considered ore. This approach is beneficial in evaluating the usability of each technology for the separation of ore‒waste at different thresholds. Thus, the applicability to both low- and high-grade deposits can be determined.
3.5. Data Fusion
Data fusion enables the multiplatform characterisation of the analysed samples by processing all the spectral signals from each sensor. It is therefore likely to improve classification results. The data fusion approaches adopted in this study are low-level, mid-level and multiple-level. Low-level data fusion involves the integration of multiple data sources by concatenating data blocks of different natures [
40,
42,
71]. It is a data-level fusion. Mid-level is a feature-level fusion that involves the screening of variables [
40,
45,
71]. Prior to the fusion process, important variables are extracted separately from each data source using variable selection techniques [
44]. These extracted features can subsequently be used in classification or prediction models. In multiple-level fusion, a combination of low- and mid-level fusions is used to obtain a final output [
42].
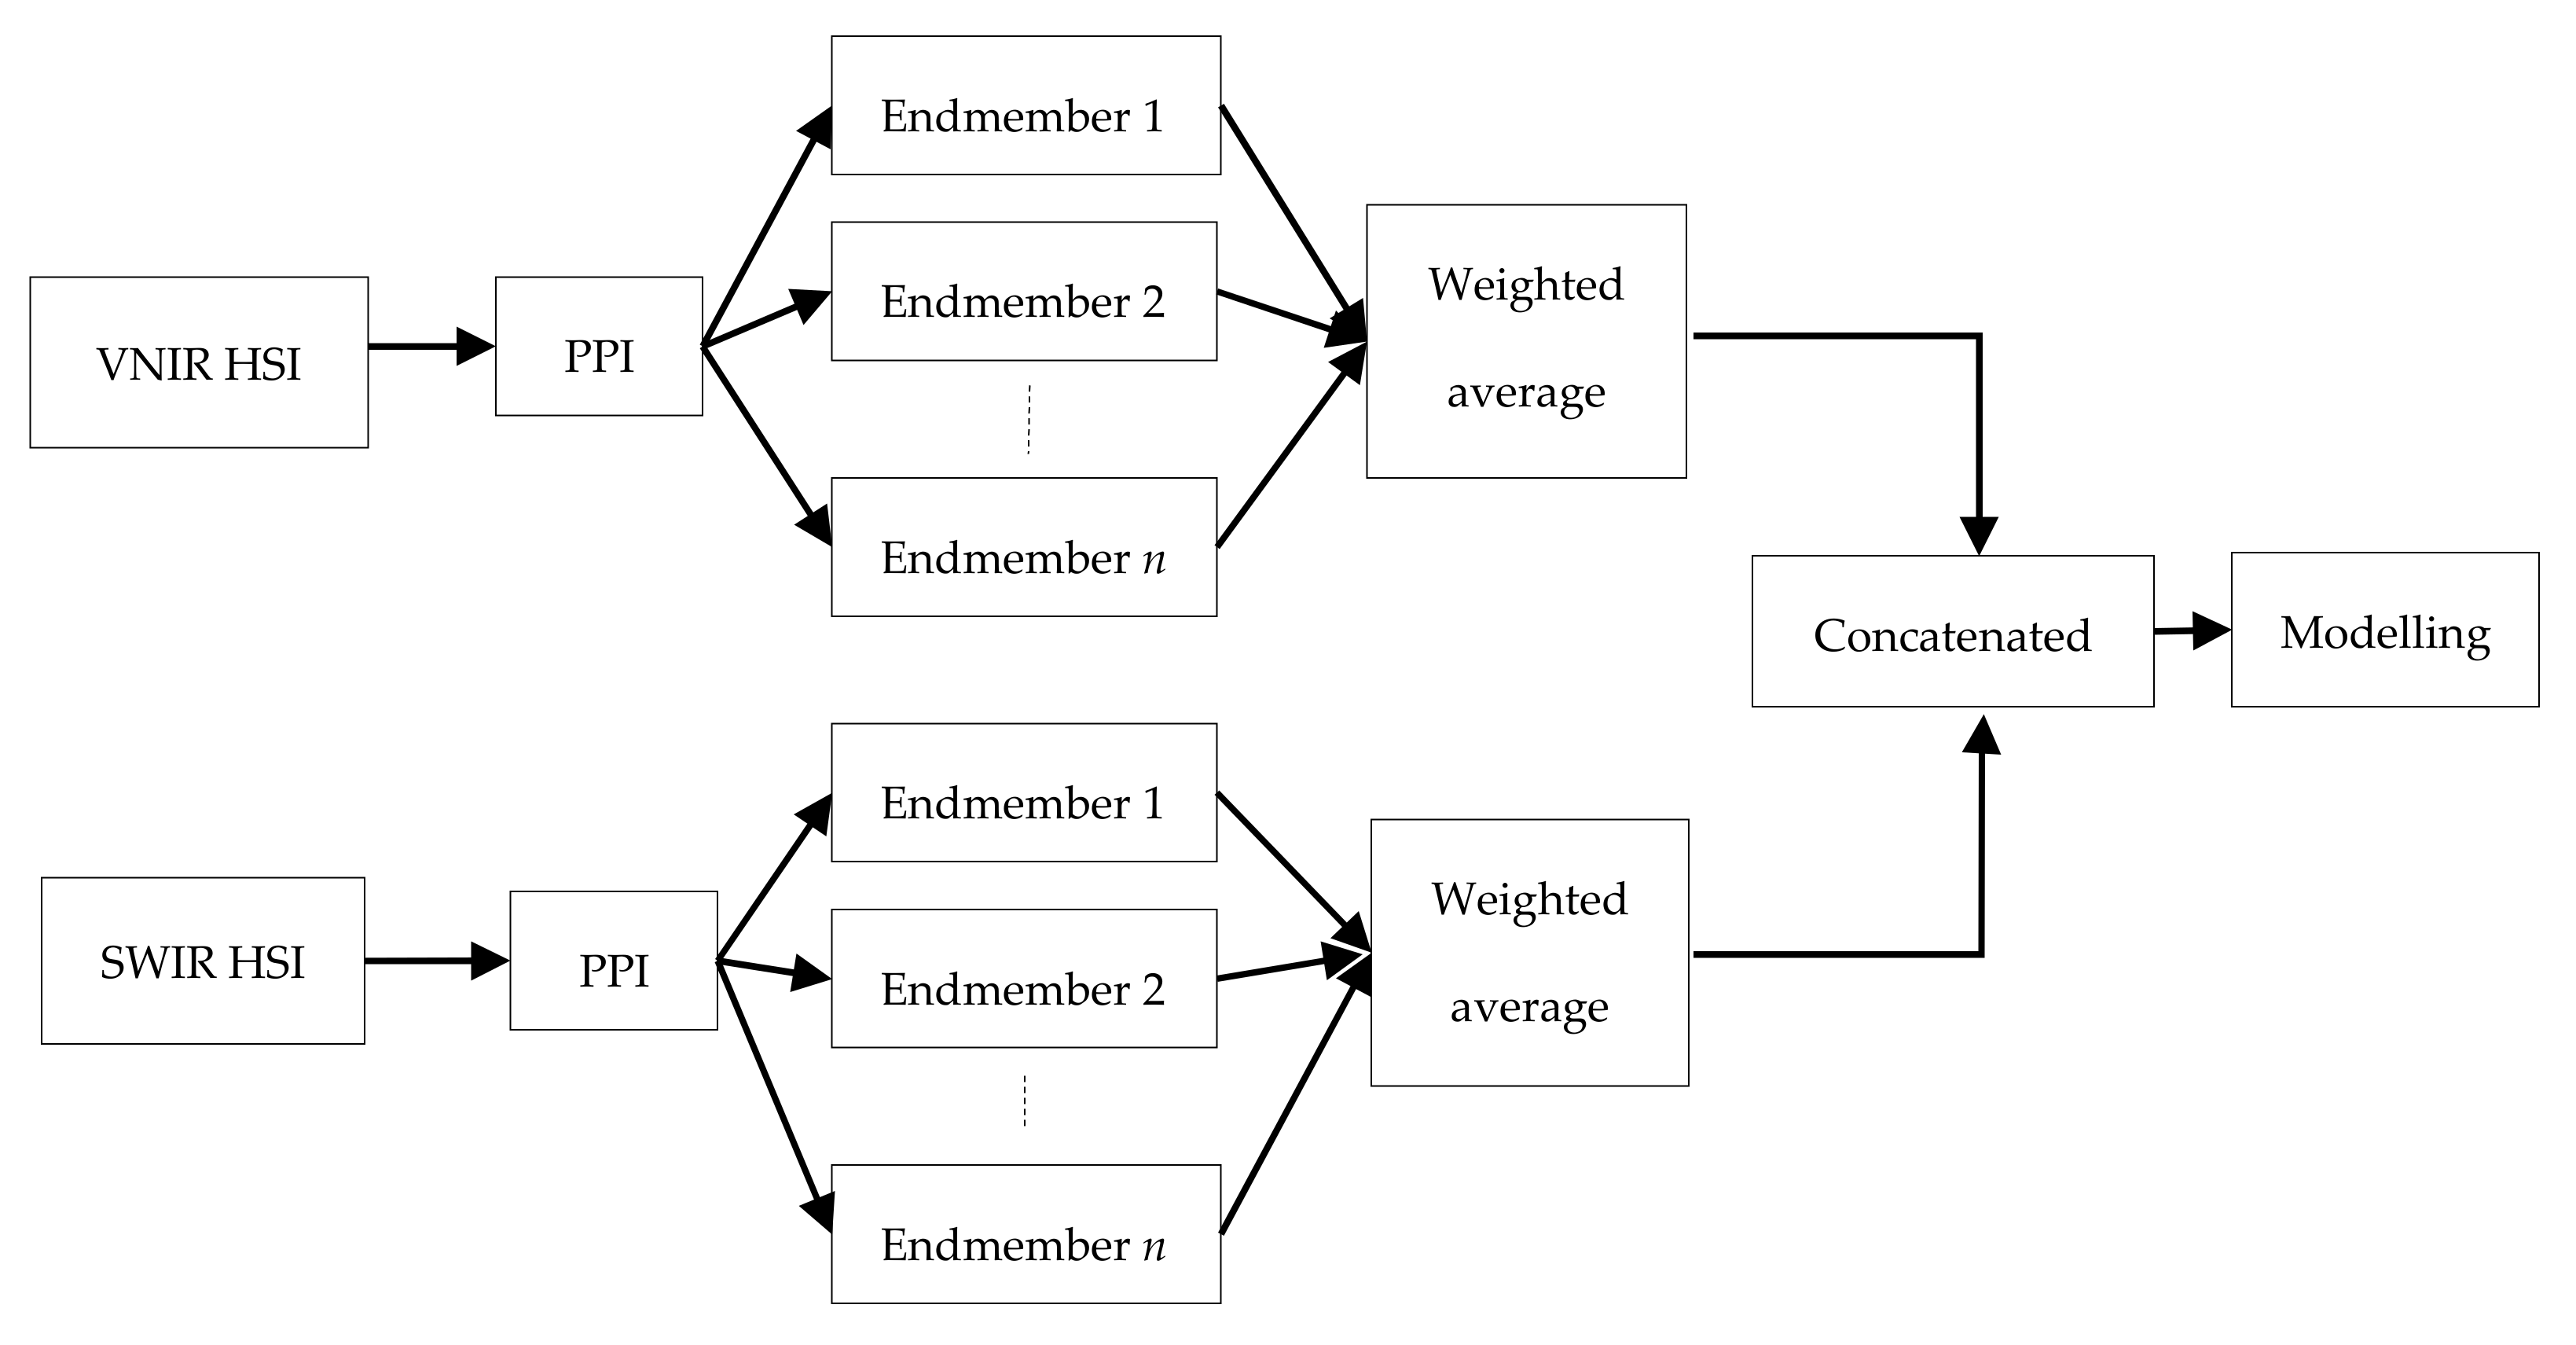
Multiple possible combinations of data blocks were explored to identify the optimal sensor combinations for the classification of the ore and waste materials at the indicated cut-off grades. These possible combinations include VNIR–SWIR, SWIR–MWIR, SWIR–LWIR, and VNIR–SWIR–MWIR–LWIR. First, separate models were developed using individual data blocks. Later, data fusion strategies were applied to the possible combinations of the data blocks. Therefore, the performances of the individual data blocks have also guided the choice of the possible combinations (i.e., data blocks with better classification results were mainly considered in the possible combinations options). The level of data fusion applied for the combination of the VNIR and SWIR data is mid-level since the integration is based on the extracted features (
Figure 3). In this case, the important variables, the endmembers, were extracted using the approach mentioned above and the features from the two blocks were concatenated to form the final fused data block. On the other hand, a low-level fusion with feature selection was applied to integrate the MWIR and LWIR data blocks. In this approach, the pre-processed extracted informative variables of the MWIR and LWIR data were concatenated to form a fused data block. The two classifiers (K-means and SVC) were applied to the fused data.
The fusion of image and point data requires integrating sensor data that have different scales and spatial resolutions. An optimal data fusion strategy is required to ensure data integrity while maximising the amount of relevant information that can be linked to material properties. In this study, the integration of the image and point data blocks was conducted using a multiple-level fusion that incorporates both low-level and mid-level fusions. The extracted features of the VNIR and SWIR data, as well as the selected informative variables from the MWIR and LWIR data, were aligned and concatenated into a single matrix. Thus, the most relevant variables that explain most of the variations in the spectra were fused. Classification models were developed using the fused data blocks and the two classifiers (K-means and SVC). This approach offers the opportunity to explore the region from 0.4 to 15 µm of the electromagnetic spectrum. In most cases, the wider the wavelength range, the greater the amount of pertinent information.
The performances of the K-means and SVC models were assessed based on the correct classification rates calculated using confusion matrices. The true (reference) values in the computation are the geochemical data from the ICP-MS measurements. The correct classification rates were calculated for each individual and fused data block model at the indicated cut-off grades, separately. Subsequently, the classification accuracies of the individual data blocks and possible combinations were compared. The performances of the K-means and SVC models were optimised using the different pre-processing techniques (smoothing, baseline correction and normalisation) applied to the datasets. Thus, the results reported in this study are based on the preferred pre-processing techniques. Consequently, smoothing was applied to each data block, and the pre-processed data blocks were concatenated to form the fused data blocks used by the K-means model. The SVC models were developed after baseline correction was applied to each data block; the pre-processed data blocks were concatenated and normalised. The software and programs used in this study are MATLAB R2018a (developed by The Mathworks, Natick, MA, USA), ENVI 4.5 (created by Harris Geospatial, Broomfield, CO, USA), and The Unscrambler 10.5.1 (developed by CAMO Software, Oslo, Norway). The pre-processing of the hyperspectral images was done in MATLAB R2018a, ENVI 4.5 was used for features extraction and classification, and data analysis and modelling were performed using The Unscrambler 10.5.1.
4. Results and Discussion
This section consists of four parts. In the first part, the classification model results of the individual techniques for the separation of ore and waste materials using the unsupervised and supervised techniques are presented. In the second part, the results of the fused VNIR and SWIR data (i.e., image-to-image data fusion after data conversion) are presented. This section also compares the classification performances of the fused models with the individual data block models. In the third part, the ore and waste separation results after image and point data fusion are described in detail. In the last part, the potential benefits and possible limitations of the approach are discussed.
4.1. Exploratory Analysis
The concentrations of the combined Pb–Zn elements varied greatly among the analysed samples. The values ranged from 0.16 to 19.6 wt.% with a mean of 6.17 wt.%. The numbers of samples in the ore and waste classes at the three cut-off grades are indicated in
Table 3.
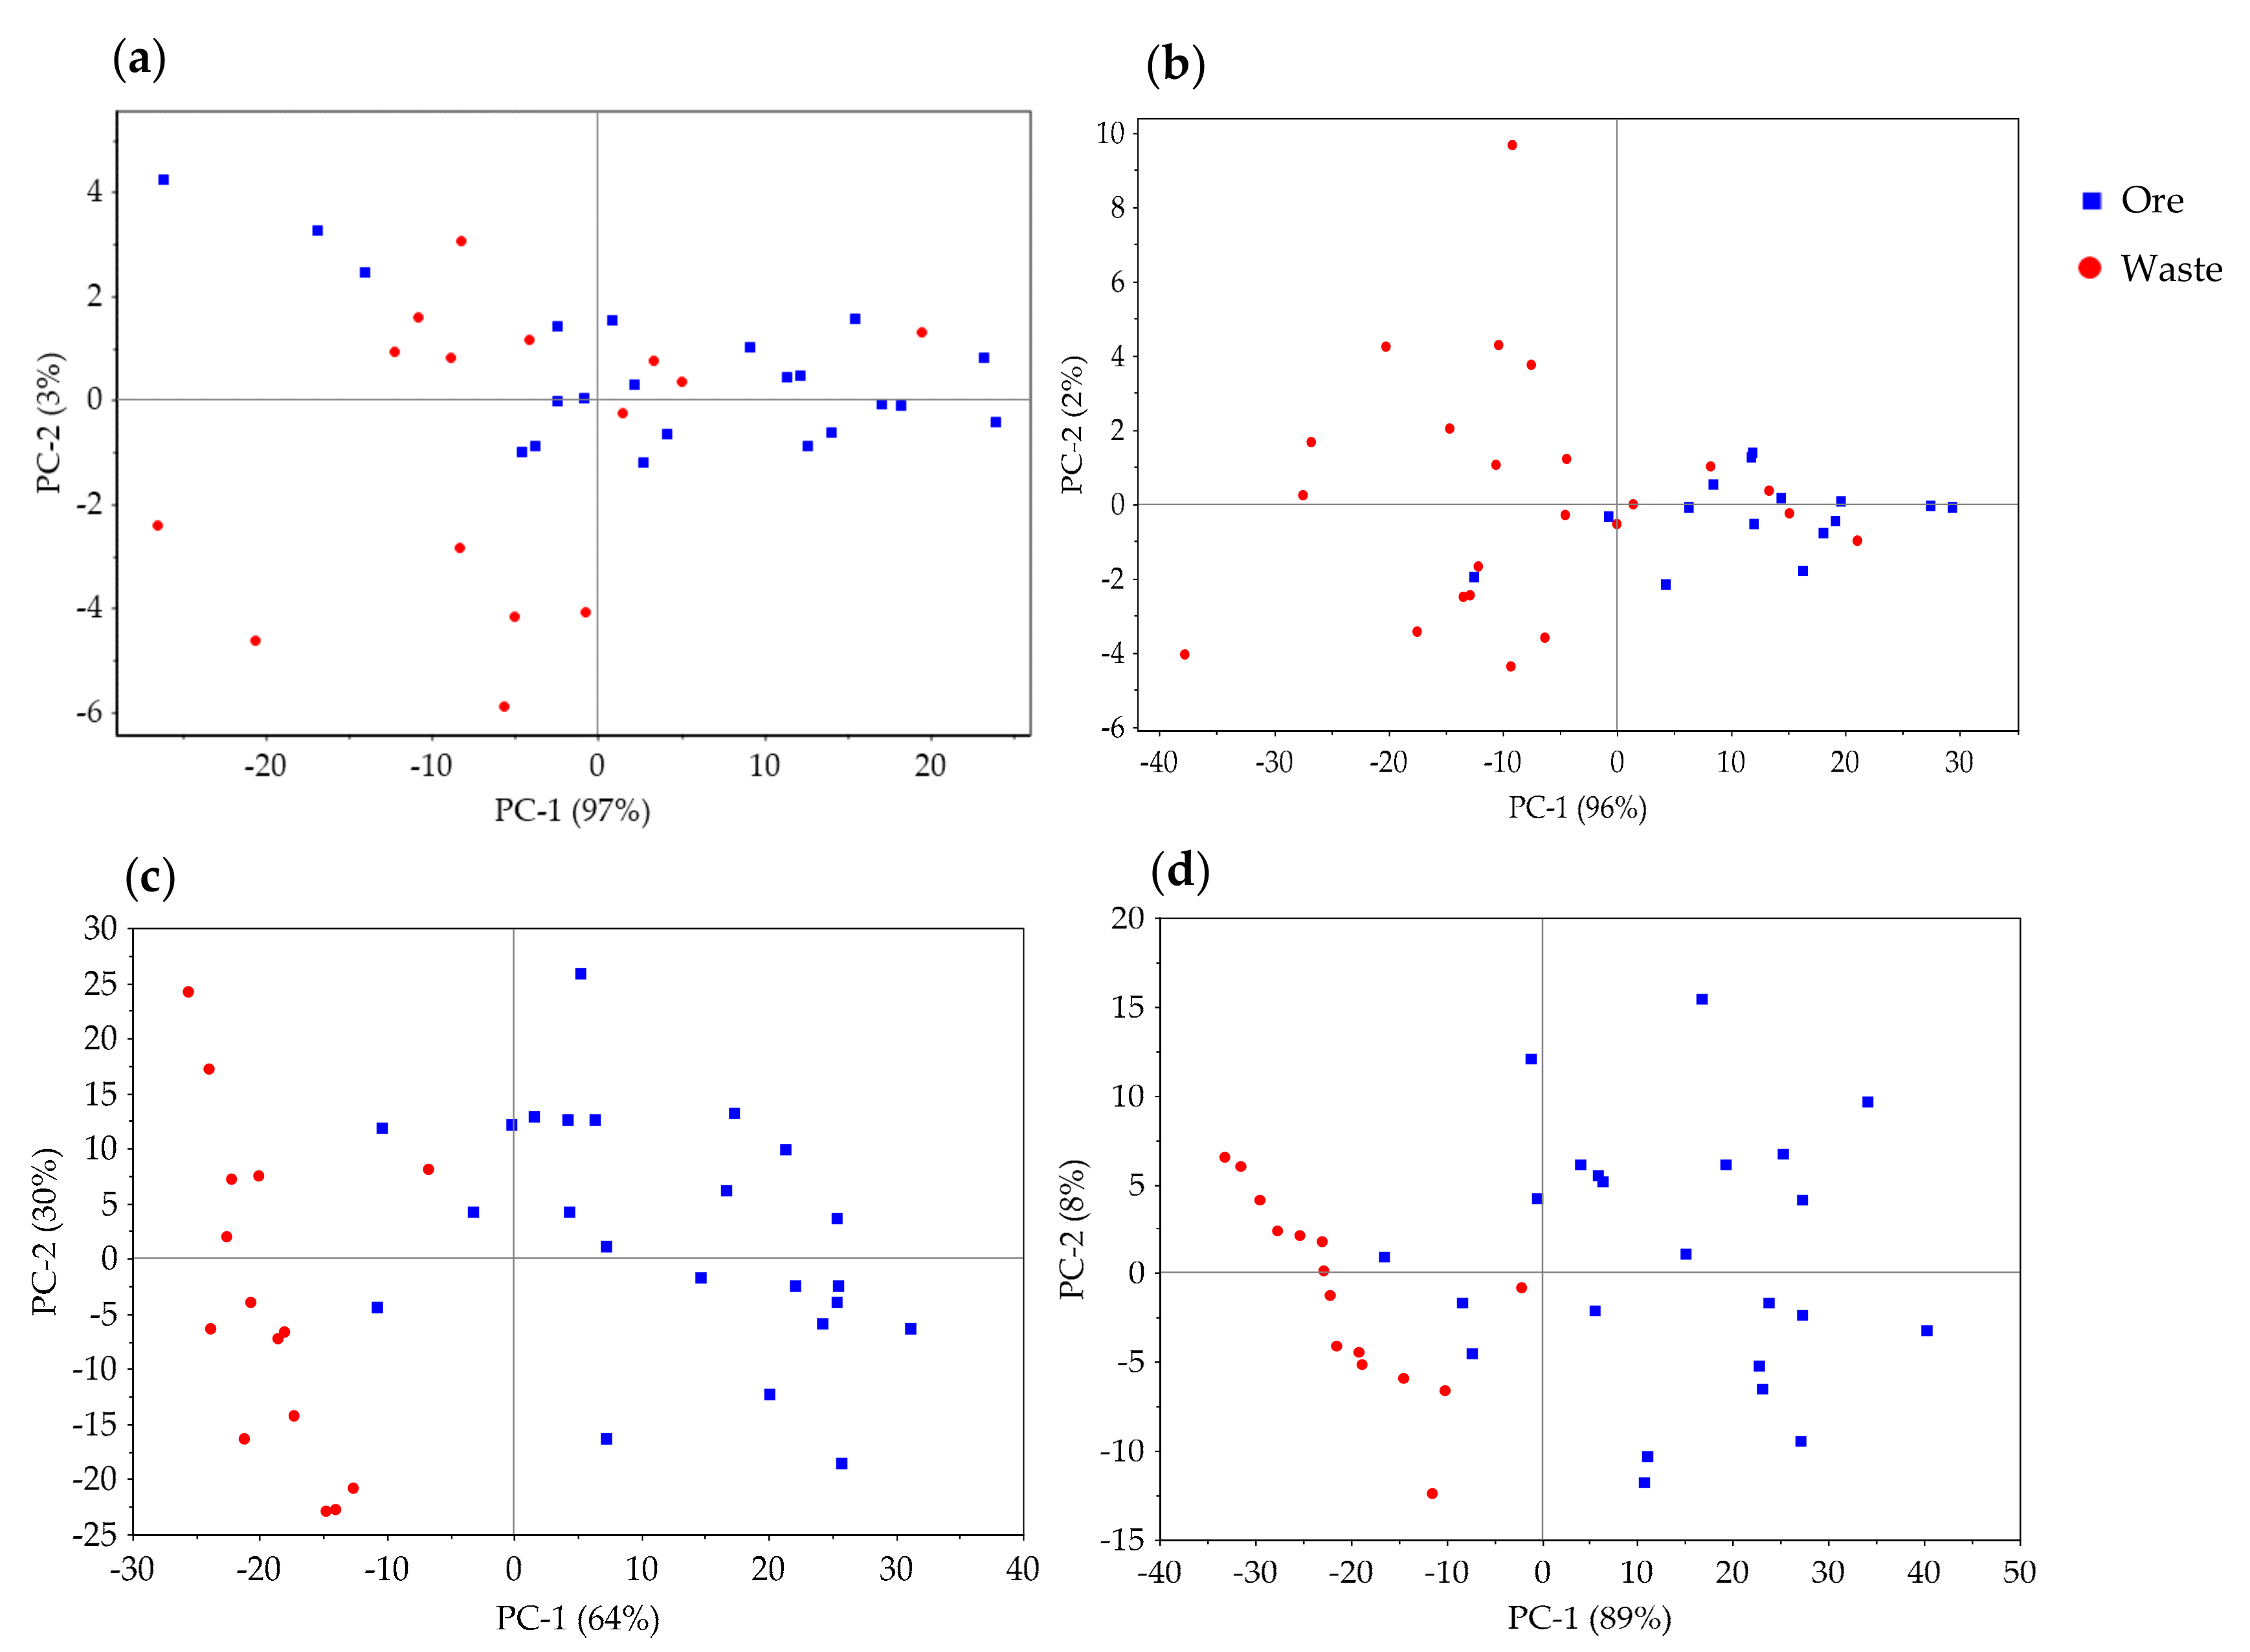
Figure 4 shows the PCA model score plots of the VNIR, SWIR, MWIR, and LWIR datasets patterns related to the ore and waste materials at the 3% cut-off grade. These plots show informative patterns (groupings) that are related to the combined Pb–Zn concentration. This indicates the possibilities for the use of the techniques in the separation of ore and waste materials in the analysed samples.
4.2. The Individual Data Blocks Models
In
Table 4 and
Table 5, the correct classification rates of the individual data blocks and the fused data models for the separation of ore and waste materials at the indicated cut-off grades are summarised. As shown in the tables, the performances of the classification models vary from technique to technique. For example, the achieved correct classification rate of the VNIR data K-means model for the separation of the materials at the 3% and 5% cut-off grades are 66% and 73.7%, respectively. The VNIR data have a narrower wavelength range than the other techniques, and the amount of relevant spectral information is limited. However, the technique yielded promising results. At the 3% cut-off grade, the classification rates acquired using the SWIR, MWIR and LWIR data K-means models are 76%, 94.7%, and 92%, respectively. As can be seen from
Table 5, the SVC classifier resulted in a very good classification performance for the segmentation of ore and waste using the SWIR, MWIR and LWIR data. Similar to the K-means classifier, the rates for the VNIR model are lower than the other models. Comparing the performances of the individual data block models for the separation of ore and waste in a polymetallic sulphide deposit, generally, the results acquired from the MWIR data model are superior to the results from the data models of other techniques (
Table 4 and
Table 5). This is intriguing because the MWIR is an understudied region of the electromagnetic spectrum in raw material characterisation.
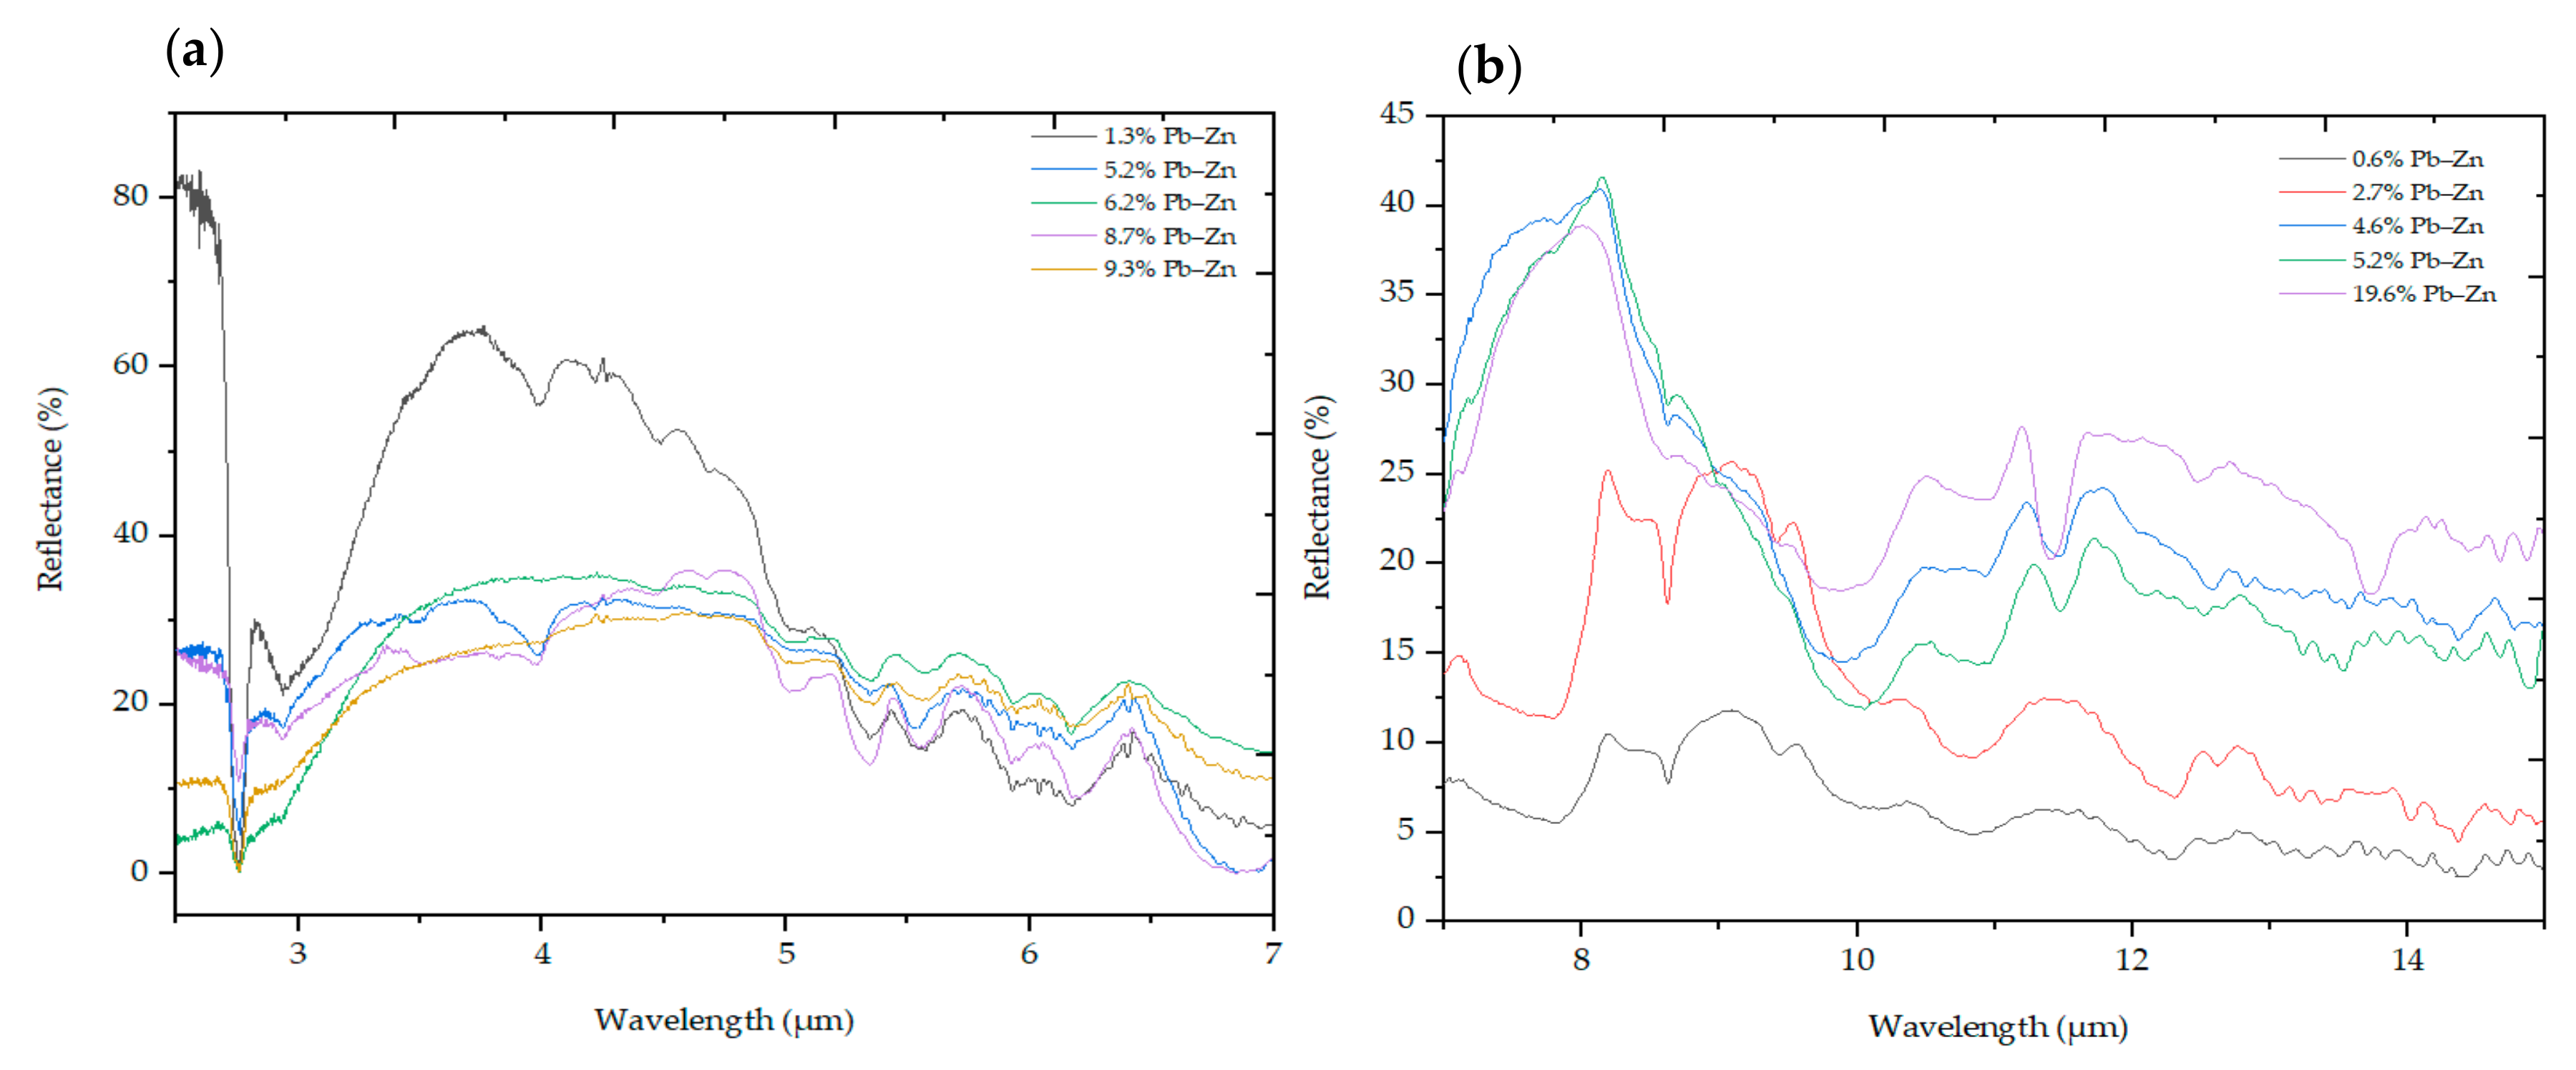
The MWIR and LWIR data models resulted in better performances at the lower cut-off grade than the higher cut-off grades. For example, the LWIR data K-means model yielded a 92% correct classification rate for the separation of the materials at the 3% cut-off grade; however, the classification performance of the model lowered to 87% for the separation of the materials at the 7% cut-off grade. The sulphide minerals exhibited strong spectral signals in the MWIR and LWIR; thus, even when they occur at a lower concentration, they can be detected and allow the classification of ore and waste materials at lower cut-off grades. The discrimination of the materials at lower cut-off grades addresses whether the sulphide minerals are in the samples or not. On the other hand, the separation of the ore and waste materials at mid-to-high cut-off grades requires detection of the sulphide minerals’ presence, as well as sufficient spectral difference among those samples having mid-to-high concentrations of the ore minerals. Therefore, when there is a limited spectral difference among the samples with the mid-to-high concentrations, the performances of the classification models at the higher cut-off grades can minimise. This is the likely reason for the observed relatively lower classification performances of the MWIR and LWIR data models at higher cut-off grades compared to lower cut-off grades.
The lower spectral difference among those samples having mid-to-high concentrations of the ore minerals is also evident from the descriptive analysis and the confusion matrices results (
Figure S1 and Tables S1–S4). The PCA plots of the LWIR data indicate better class separation at the 3% cut-off than the 7% cut-off grade (
Figure S1). The confusion matrix presented in
Table S1 also supports this; a higher cut-off grade means the majority of the misclassification is in signifying waste as ore. For example, at the 7% cut-off, all ore samples were correctly classified; however, some of the waste materials were misclassified as ore. The spectral difference between waste (lower concentrations) and ore (higher concentrations) materials is apparent (
Figure 5 and
Figure S2). However, the signals from those samples with mid to high concentrations of the ore minerals show limited spectral variations. Extended datasets in the training model to better accommodate the spectral variation among the samples with mid to high concentrations could improve the performances of the classification models at higher cut-off grades. The excellent performance of the classification models at the lower cut-off grades suggests the usability of the techniques in economically suboptimal mining operations. A future work is recommended to find the optimal cut-off grade for the separation of the materials into ore and waste using the MWIR and LWIR technologies. It is also worth noting that the cut-off grade of a commodity varies due to fluctuations in the mined product prices and mining costs.
The VNIR and SWIR data models yielded better classification outcomes at a higher cut-off grade than the lower cut-off grade. The sulphide minerals exhibit very weak signals (low reflectance) in the VNIR and SWIR regions. When the minerals occur in lower concentrations, the signals even get weaker. This is likely the reason why the performances of the VNIR and SWIR data models lowered at the lower cut-off grade and yielded better classification results at higher cut-off grades. The data blocks of the VNIR and SWIR consist of extracted features, which tremendously minimised the data volume. Similarly, the MWIR and LWIR data blocks comprise the selected informative wavelengths. However, the extracted features from the four data blocks allowed the successful classification of ore and waste materials in the analysed samples. Overall, the individual techniques show good potential for the separation of ore and waste material at different cut-off grades, suggesting the presence of informative variables in each data block that can be linked to the ore and waste material properties. This could allow the use of these techniques for the separation of materials in different low-grade and high-grade deposits.
4.3. Fusion of the VNIR and SWIR Data
As described in
Section 3.2, prior to modelling, the spectral features of the VNIR and SWIR image data were extracted using spectral unmixing algorithms (PPI). The fusion of the VNIR and SWIR data involves variable screening using a feature extraction technique. Thus, it is considered a mid-level data fusion. This approach allowed the removal of non-informative variables while maintaining the relevant information in the spectra.
As discussed in the previous section, both data blocks consist of the relevant information that can be linked to material properties (ore and waste materials in this case). Spectral plots of the ore and waste materials in the VNIR and SWIR regions can also support this (
Figure 6). Thus, the fusion of the two data blocks benefited from the synergy between the individual datasets and resulted in a better separation of ore and waste material. For example, the fusion of the VNIR and SWIR data resulted in a remarkable improvement in the classification performance of the SVC models, suggesting the advantage of data fusion for the enhanced characterisation of materials (
Table 5 and
Table S5). When the K-means was applied to the fused VNIR and SWIR data block, the results were not necessarily improved compared to the individual techniques’ data models (
Table 4). However, the K-means clustering results of the two data block models resulted in better performances than the use of other algorithms, and could likely improve the results (this was also evident from the classification result of the SVC classifier). The fact that the image VNIR and SWIR data were converted to point data, integrated at the data level, and resulted in a better performance suggests the benefits and usability of the approach in material characterisation.
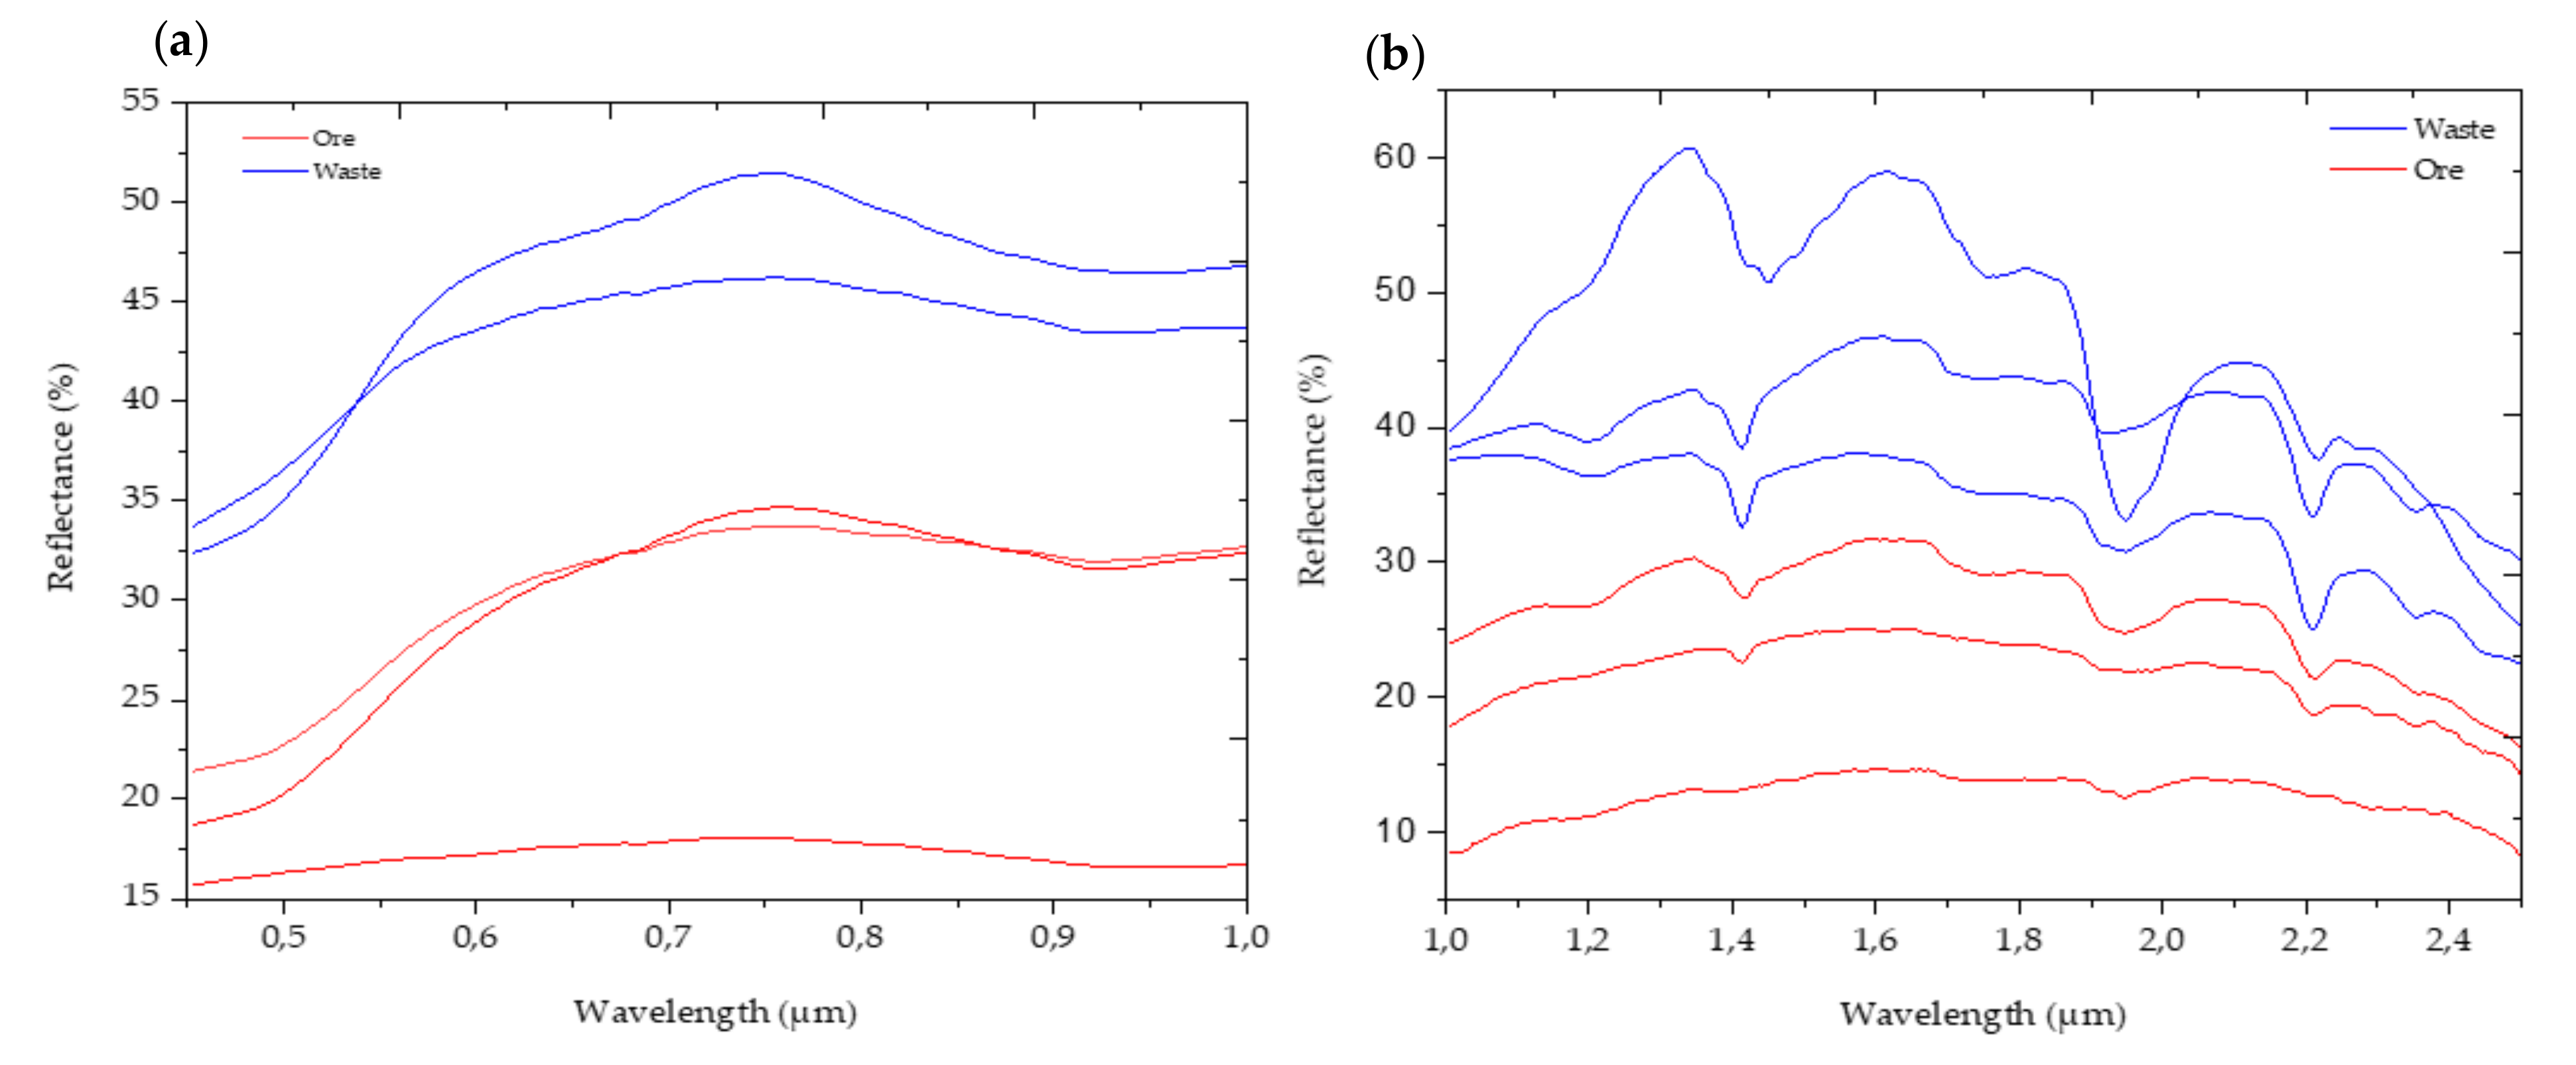
The interpretation of the sulphide minerals using the VNIR and SWIR is challenging since the minerals do not exhibit particular absorption features in the regions. The VNIR allowed the identification of the ferric iron minerals (hematite and goethite), carbonates (siderites), and some of the sulphide minerals (such as pyrite and galena). However, the identification of the sulphides was not comprehensive since the minerals do not exhibit any absorption features. The minerals identified using the SWIR data include mica (muscovite), clay minerals (montmorillonite and illite), carbonates (siderite), tectosilicate (quartz), phyllosilicate (Mg + Fe chlorite), sulphide ores (with no particular absorption features), and a minerals mixture. The featureless nature of the sulphide minerals can be used to map the ore and waste regions of the analysed samples using the SWIR image data. This map can show the distribution and relative abundance of the minerals at the surface of samples. However, SWIR cannot be used to discriminate between the sulphide minerals, and the image data cannot be used to relate the spectral information to specific elemental concentrations. Thus, it is challenging to indicate the ore and waste materials at different cut-off grades. The approach developed in this study allowed for establishing a relationship between the spectral data and the concentration of the elements of economic interest, and thus to classify the samples into ore and waste. This approach gives flexibility in analysing the spectra for various quantitative geochemical and mineralogical information. Therefore, it is efficient and has significant benefits in providing information about high-grade, medium-grade and low-grade areas in mining operations.
4.4. Image and Point Data Fusion
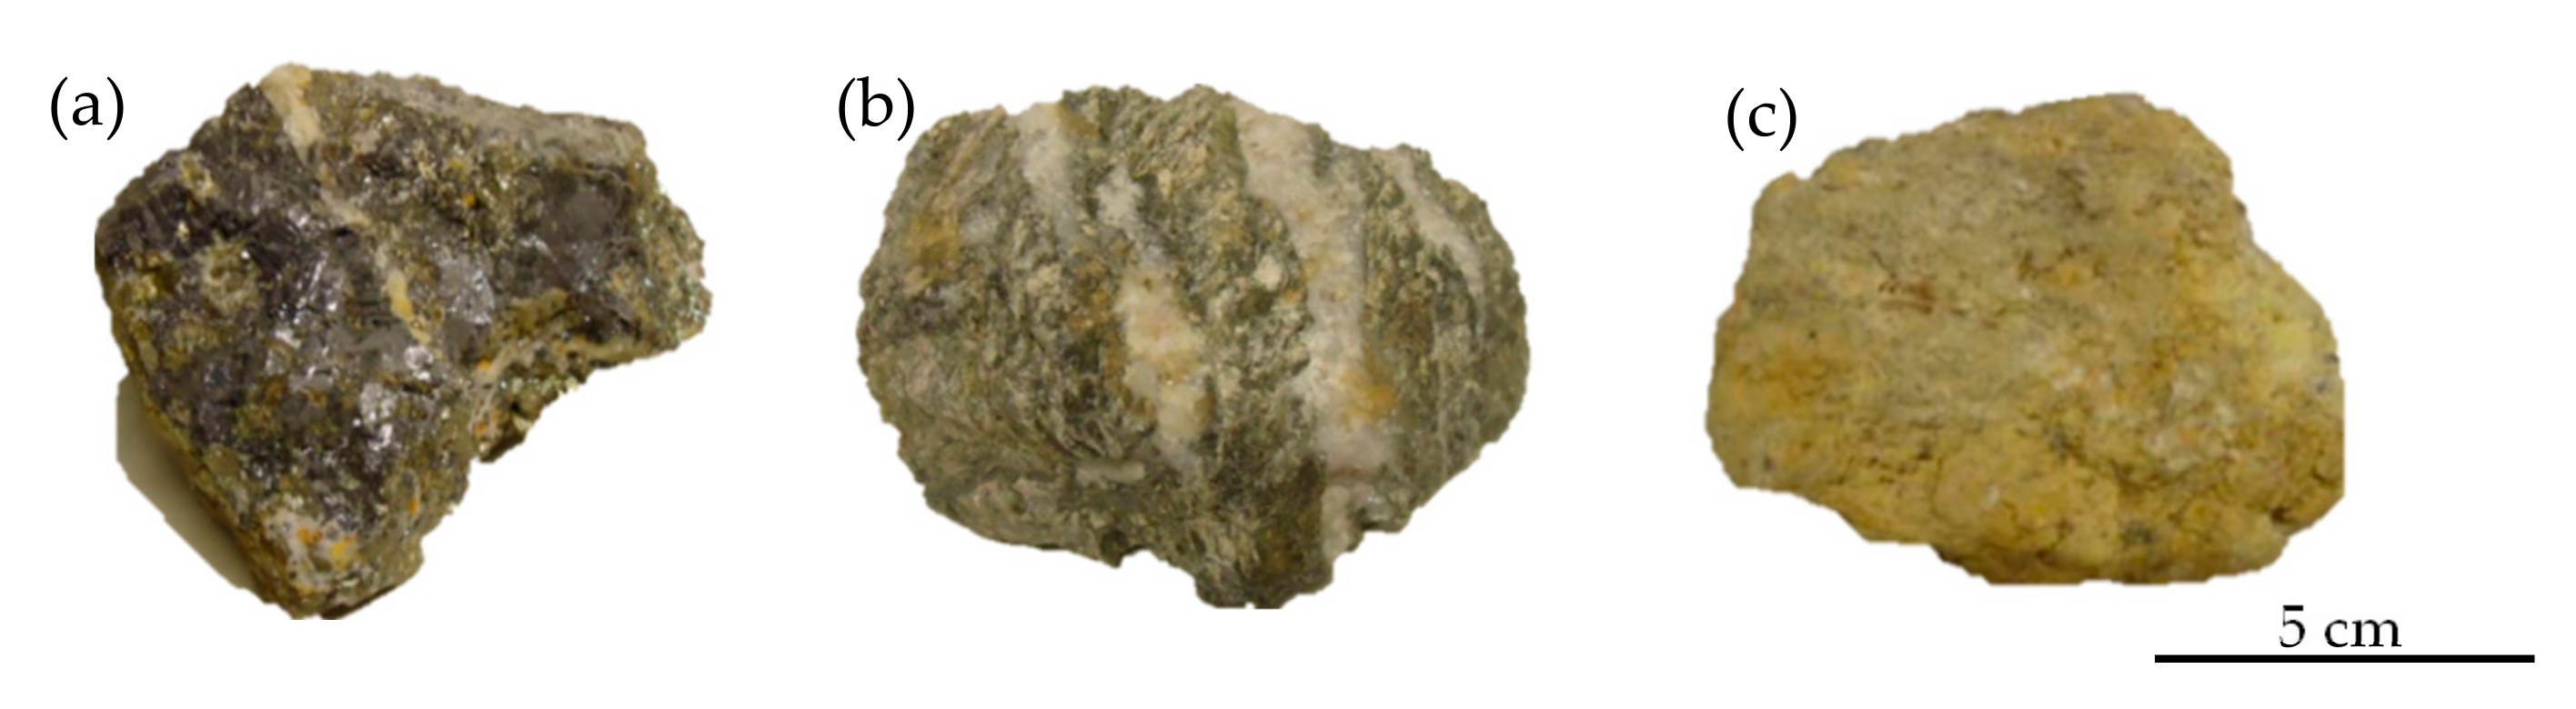
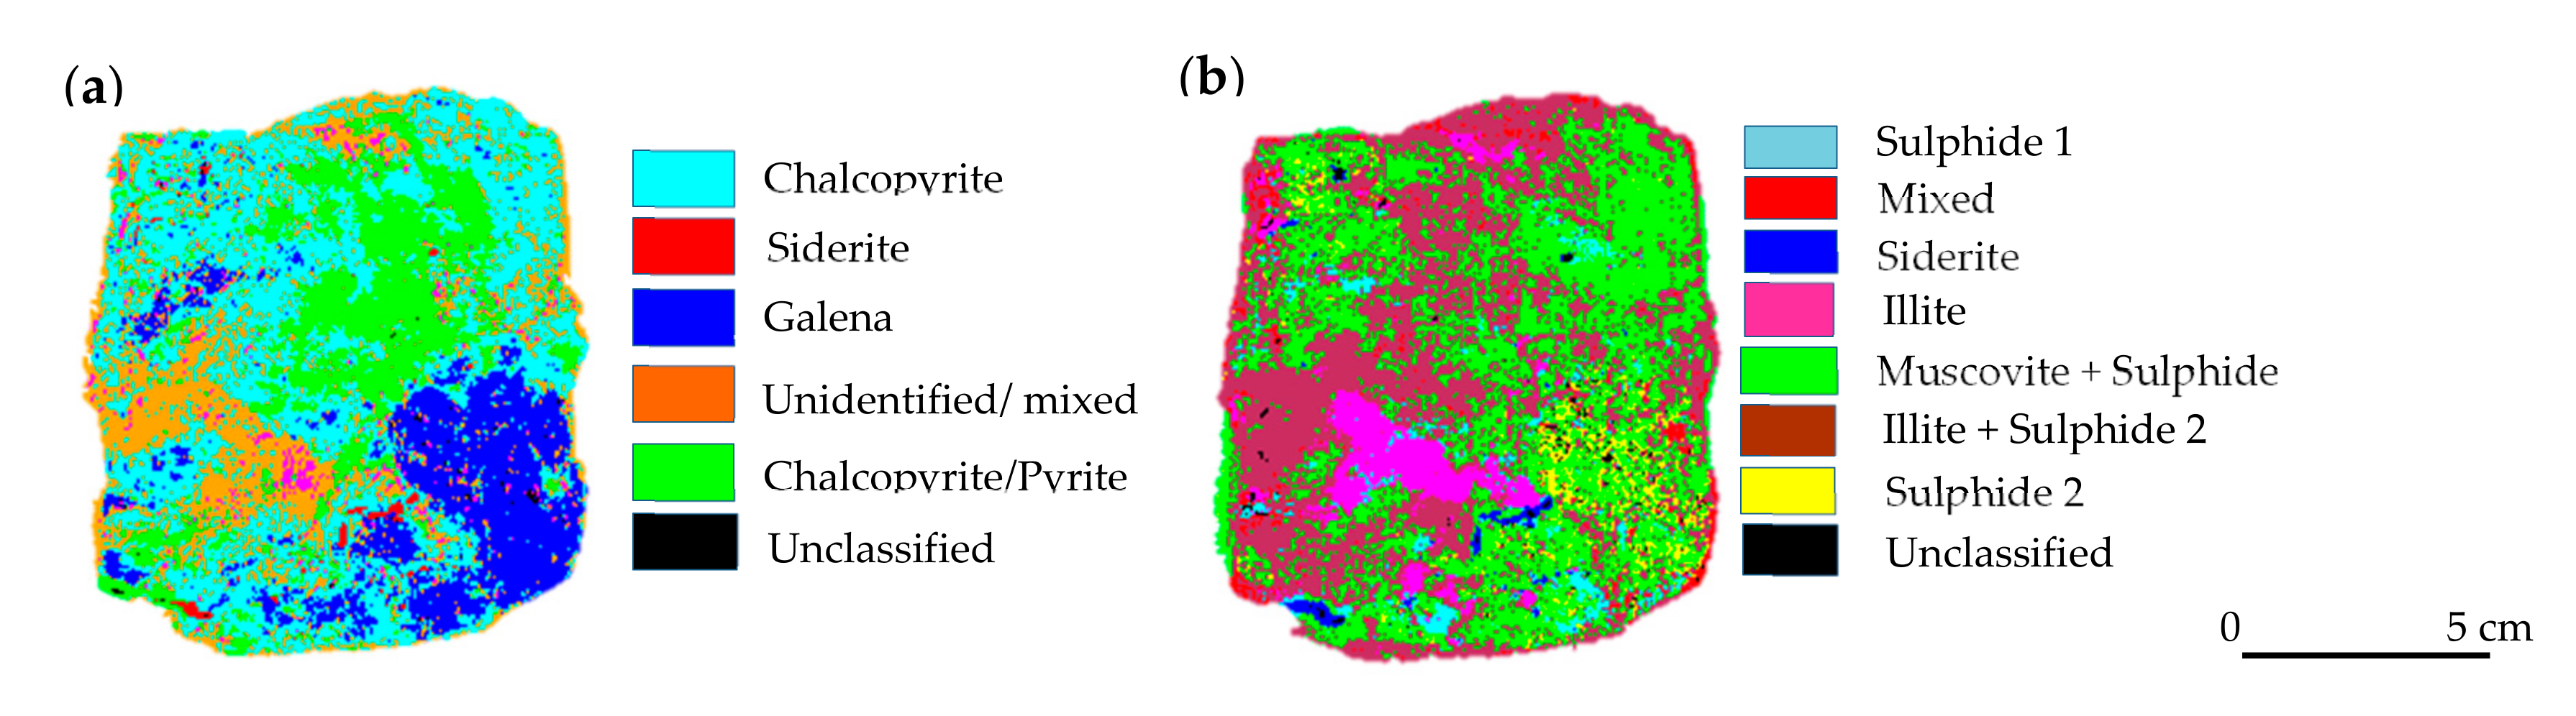
Imaging of the rock chips samples enables capturing the entire material composition at the surface of the sample. Examples of classified VNIR and SWIR images are shown in
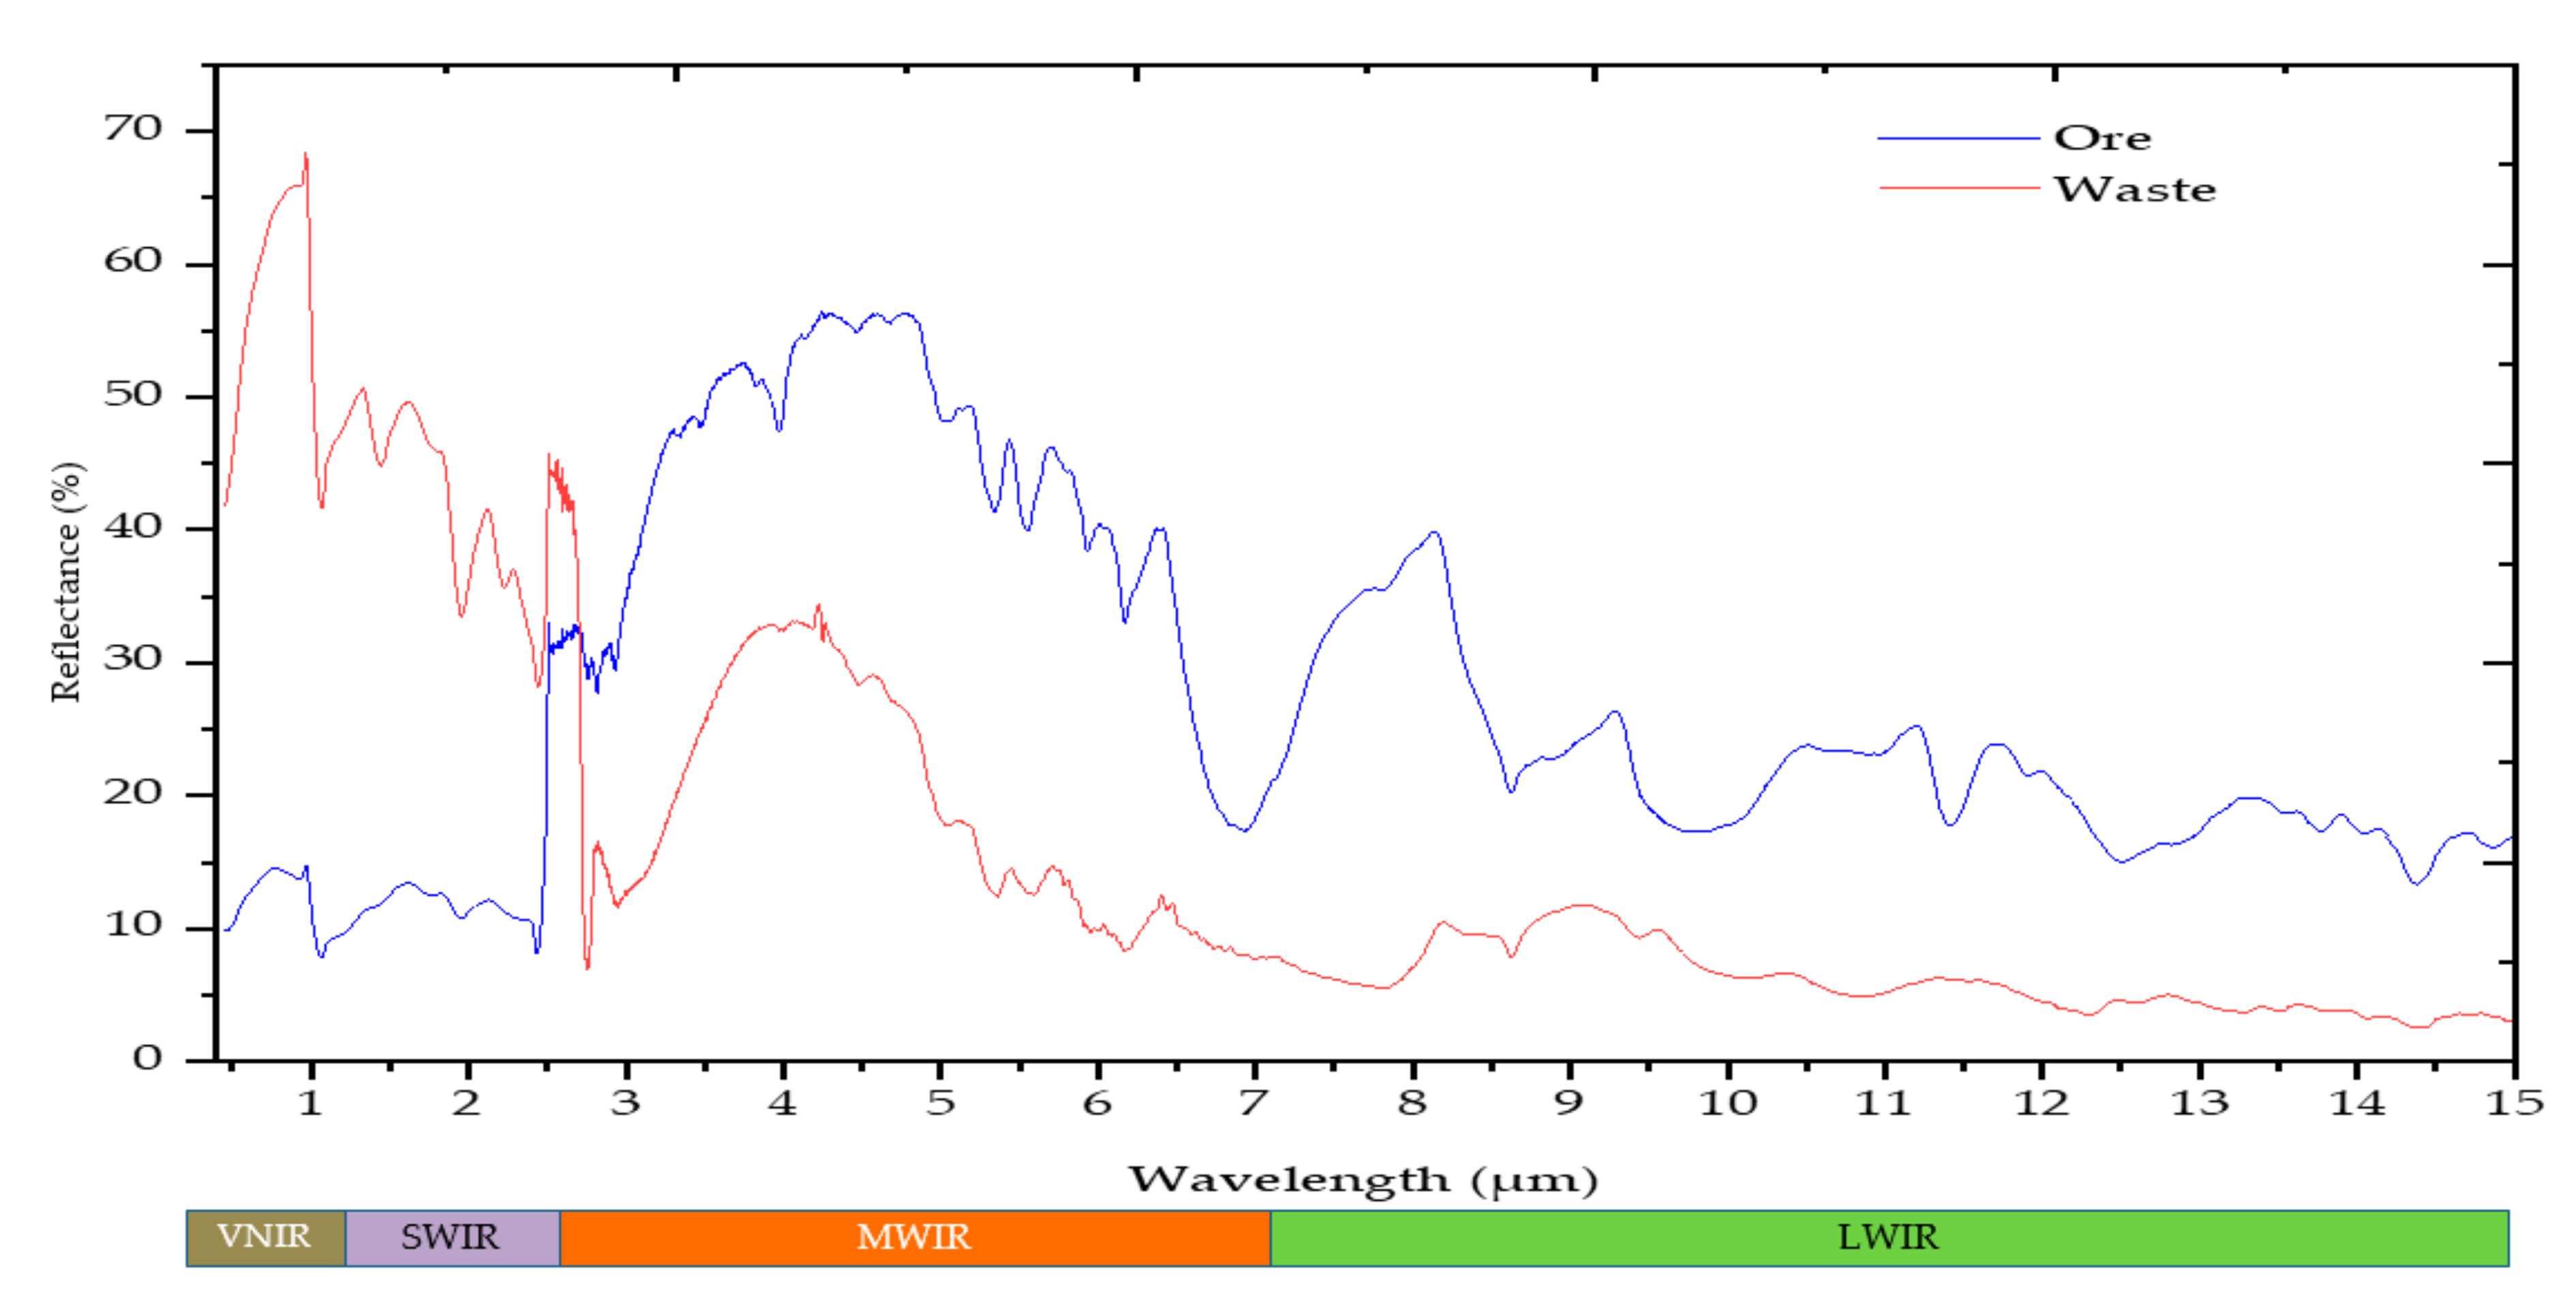
Figure 7. Depending on the spatial and spectral resolution of the imagers, imaging technologies can provide accurate and usable spectral information at every surface of the sample under the imaged scene. This allows the visualisation of the spatial distribution of minerals, and can also be used to estimate the relative abundances of minerals at the surface of the samples. However, the main drawback of hyperspectral images is the vast volume of data that require a large amount of computational power and data storage. Therefore, the proposed approach in this study is beneficial in minimising data volume by adopting a sequential features extraction and modelling approach. In addition to significantly minimising the volume of data, this approach allows the analysing of spectral data from multiple data sources operating over the wider range of the electromagnetic spectrum. An example of the representative spectra of ore and waste material across VNIR, SWIR, MWIR and LWIR is presented in
Figure 8. This kind of approach permits the use of the relevant information in each spectral region to address the material property of interest. Overall, the integration of image and point data enables the integration of data of different scales and types.
As shown in
Table 4 and
Table 5, multiple possible combinations of the image and point data were evaluated using the K-means and SVC techniques. For example, the integration of the SWIR and MWIR data improved the correct classification rate of the SVC model at the 3% and 5% cut-off grades compared to the individual data models (
Table 5 and
Table S6). Likewise, the fusion of these two data blocks resulted in enhanced K-means classification rates at the 5% and 7% cut-off grades (
Table 4). The integration of the VNIR, SWIR, MWIR and LWIR data blocks yielded better classification performance compared to those based on individual techniques. However, the classification performance of the fused four data blocks model did not show improvement over the fused SWIR and MWIR data model. This indicates the need for an optimised approach to identify the optimal combination or an alternative data fusion strategy. The likely reasons for not achieving improved results for the integration of the four data blocks compared to the results from the fused SWIR and MWIR data model could be the dominance of some of the data blocks or the occurrence of redundant information in the data blocks. Each data block resulted in good classification results and indicated the presence of relevant information in the spectra. Therefore, the result from the combination of the four data blocks might be maximised using alternative relevant information extraction techniques and classification models. The MWIR data model results show that MWIR technology alone can play a significant role in the discrimination of ore and waste in low-grade polymetallic sulphide deposits. However, looking at the overall performance trend of the two models (K-means and SVM), the results from fused data blocks models are better than those of the individual data blocks models for the classification of the materials at the indicated cut-off grades.
The classification of the materials at the three cut-off grades resulted in different model performances. For example, at the 3% cut-off grade, very good classification performances were achieved using the MWIR and LWIR data models (
Table 4,
Table 5 and
Table S7); however, at the higher cut-off grades, the performances of theses individual data blocks models declined. The fusion of the data blocks for the classification of the materials at the three cut-off grades resulted in improved classification performances compared to the outputs produced using the individual data blocks models. However, the difference in the performances of the models at the three cut-off grades suggests the importance of model calibration at the required threshold (in this case, cut-off grade).
Comparing the K-means and the SVC models, both models resulted in an improved classification rate for the fused data blocks compared to the individual datasets. Thus, the general performances of the models in showing the presence of relevant information in each data block, and the improved accuracies after data fusion, are comparable. Overall, the results of these models indicate the possibility of integrating image and point data for enhanced characterisation of materials in polymetallic sulphide deposits. These datasets have different scales and resolutions. The conversion of the image data into representative spectra allowed a significant reduction in data volume and permitted the fusion of the image data to point data for the enhanced separation of ore and waste materials in the analysed samples.
As discussed previously, the distinct spectral features were used to identify some of the minerals in VNIR and SWIR data. However, the interpretation and identification of minerals using sensor output (spectra) are sometimes challenging for various reasons, such as the co-occurrence of minerals, the physical matrix effect, environmental influences (e.g., moisture) and a weak spectral response from some of the minerals. Thus, the identification of minerals using sensor outputs may result in an incomplete description of the minerals in the analysed samples. This shows the importance of understanding unidentified unique spectra using machine-learning techniques. Accordingly, the features extracted from the VNIR and SWIR data encompass both the identified spectrally pure mineral spectra and the unidentified (e.g., spectrally mixed) unique spectra. The unidentified unique spectra were also represented in the computation of the final spectra. Thus, the proposed approach is beneficial in providing a comprehensive description of mineral compositions in mining operations. The other advantage of the approach is the use of multiple data sources to permit enhanced classification results via the use of relevant information from each technique.
Feature selection requires highly efficient data reduction methods, as the aim is to retain only the most important variables in the model. In this work, the extraction of the endmembers from the VNIR and SWIR data, as well as feature selection using the MWIR and LWIR data, enabled the screening of the most informative variables for the separation of ore and waste materials. While the approach generalises the spectral information (i.e., the conversion of the image data), the generalised data allow for the efficient simplification and classification of materials at different cut-off grades. Thus, the developed methodology is effective in enhancing material characterisation with enormously reduced data volume.
In material characterisation, the techniques VNIR, SWIR and LWIR are commonly used for separate analysis. An integrated analysis of the techniques for enhanced characterisation is very uncommon. Of these limited applications, pixel location-based hyperspectral image fusion is now becoming popular, especially in remote sensing applications. However, this kind of approach is applicable to image-to-image fusion. The proposed approach in this study allows the integration of image and point data, remotely operated sensors with sensors that need actual contact, and data of different coverage, resolutions and scales. The approach further allows the holistic description of materials by providing the opportunity to explore a wider range of the electromagnetic spectrum. The classification accuracies achieved in this study show promise in terms of the separation of ore and waste materials in polymetallic sulphide deposits using data sources that have different natures (i.e., image and point data). Therefore, this study can serve as a baseline for the integration of different forms of sensor outputs for the improved characterisation of materials in various deposit types.
4.5. The Opportunities and Limitations of the Approach
The fusion of multiple sensors is challenging due to data complexity. The extraction of the features from data blocks and fusion helps simplify the data, make the classification results efficient, and can be maximised using optimal features selection methods. The proposed approach significantly minimised data volume while maintaining most of the relevant information in the spectra that can be related to material properties. For example, the average data size of an SWIR hyperspectral image of one of the rock samples used in this study was ~215 MB. However, the conversion of the hyperspectral image to the representative point spectrum reduced the data size to ~27 KB. This considerable reduction in data volume has implications for the requirements for data storage, data processing and visualisation. Thus, it can allow the analysis of high-spatial and -spectral resolution images from large datasets. This suggests the practicality of the approach for use in high-throughput active operational mines.
As discussed in
Section 3.1 and
Table 2, both the image and point data have the advantage that the integration of the two datasets likely maximises the benefits. For example, the image data represent all the information from the sample surface at the scene, where the point measurements might be subjected to a subjective decision on the selection of the measurement spots. However, depending on the technology, the point techniques can offer a higher signal-to-noise ratio than the image spectral data. Thus, the fusion of the two data types likely benefits from the synergy between them. The integration of image and point data can also be performed by the decomposition of the point spectra into pure components and the extraction of endmembers from image data. Thus, both datasets can have multiple spectra for each sample; however, such a kind of fusion requires optimal spectral decomposition algorithms and sophisticated data processing techniques.
The sulphide minerals exhibit limited spectral signals in the infrared region of the electromagnetic spectrum. However, the combined analysis of a wide range of infrared spectral data yielded better classification accuracies than the individual data block models. Thus, a combined analysis of these technologies likely results in the enhanced classification or prediction of materials in various deposit types. Moreover, the approach allows for correlating the concentration of the combined Pb and Zn to the spectral responses of the extracted or computed spectra of the VNIR, SWIR, MWIR and LWIR data. The interpretation of spectra might fail to identify all the minerals due to the mineral mixture or weaker signals of the minerals. However, the proposed approach enables the unidentified (unknown) unique spectra to be considered in the computation of the final spectra. Therefore, they are represented in the models based on their proportion.
The developed methodological approach has several potential benefits. For example, it simplifies data, enables the fusion of data from multiple platforms, reduces data volume, enhances classification accuracies, minimises information loss by including information from unidentified unique spectra, and can be used to relate the infrared spectra to quantitative elemental data. Besides, it is a data-driven approach that does not require a prior specification or identification of minerals and elements.
Table 6 summarises some of the potential benefits and limitations of the proposed method. The limitations of the approach include that the conversion of the image data into a single spectrum causes the loss of spatial information from the hyperspectral images. The other possible limitation is the loss of information related to the unclassified pixels. The former can be compensated by representing the pixels based on their proportion. The latter can be minimised by representing most of the unique spectra in the training dataset. Overall, this approach is a multi-step process that involves endmember extraction and image classification. Thus, it requires optimal feature extraction and classification techniques to minimise the error propagation in the final results.
The main contribution of this work is to integrate the hyperspectral image and point data using multivariate data analysis techniques and a data fusion approach. The different scales of observations from the image and point data sources were converted to form fused data blocks. The fused data blocks allowed the incorporation of the two data types into a single model for the enhanced separation of ore and waste materials in the analysed samples. Overall, the experimental results suggest the use of the developed methodological approach for the discrimination of ore and waste materials. Besides this, the use of the approach for the separation of the materials at lower cut-off grades suggests its potential applicability in sub-economical deposits. The proposed approach provides a versatile solution for the fusion of multiple sensor outputs in raw material characterisation. The analysed samples are highly variable and limited in number. Going forward, better classification results are possible with extended datasets that sufficiently represent the observed material variability. The successful practical implementation of the approach can lead to the pre-concentration of complex sulphide ore into a major classification of concentrated and less concentrated materials. This plays a significant role in ensuring energy efficiency in mineral processing. The developed method can be a baseline for the development of a framework for the spectral–spatial fusion of data from multiple sensors that have a different scales of observation, spatial resolutions and spectral resolutions. Thus, it can play an essential role in the development of an optimally functioning process that informs decision-makers in real-time.
5. Conclusions
In this work, different scenarios were investigated to assess the use of image and point data integration for the discrimination of ore and waste materials in polymetallic sulphide deposits using infrared technologies, namely:
- (1)
the use of individual spectral regions (VNIR, SWIR, MWIR and LWIR);
- (2)
the use of the computed representative spectra from the hyperspectral images (VNIR and SWIR);
- (3)
potential for improvement in ore–waste discrimination accuracy by applying data fusion.
The experimental results reported in the preceding sections show that the representative spectra computed using the hyperspectral VNIR and SWIR images include relevant information that can be employed in ore–waste discrimination. Moreover, the fusion of the computed VNIR and SWIR spectra significantly improved the classification of ore and waste material in the analysed samples. At the 3% cut-off grade, the best achieved SVC model after fusion of the VNIR and SWIR resulted in a correct classification rate of 81.6%, whereas the results from the individual VNIR and SWIR data blocks at the same cut-off grade are 58% and 73.7%, respectively. At the 5% cut-off grade, the SWIR and MWIR data K-means models yielded correct classification rates of 79% and 81.6%, respectively. However, the fusion of the SWIR and MWIR data blocks improved the classification performance to 92%. Likewise, at the 7% cut-off grade, the fusion of the four data blocks improved the correct classification rate to 90%. Similarly, when the SVC model was applied to the fused four data blocks, the result improved to 95% for the classification of the material at the 3% cut-off grade. The multiple-level fusion of the four data blocks using both the K-means and SVC models resulted in improved classification performances compared to the individual data models. However, the achieved classification performances of the four data blocks models and the fused SWIR and MWIR data blocks are the same. This shows the need for an optimised data fusion approach to identify the optimal sensor combinations out of the possible options. Overall, the use of the individual data blocks coupled with K-means and SVC for the classification of ore and waste materials in the polymetallic sulphide deposit at the 3%, 5% and 7% cut-off grades resulted in good results. Moreover, the use of the data fusion strategy improved the model’s classification ability relative to the results yielded by using individual techniques.
The developed workflow provides a versatile solution for the integration of hyperspectral imaging and point spectrometer data for use in material characterisation. The fusion of multi-source (VNIR, SWIR, MWIR and LWIR) spectral data with different spectral information significantly improved ore–waste discrimination at different cut-off grades. This novel methodology is very promising in minimising data volume and provides enhanced material characterisation. The results indicate the possibility and opportunities of the approach in material characterisation. Going forward, better results are possible with an optimised fusion of multiple data blocks for the quantitative and qualitative analysis of materials in various low-grade and high-grade deposits.


