Article

Molybdenum Isotope Constraints on the Origin of Vanadium Hyper-Enrichments in Ediacaran–Phanerozoic Marine Mudrocks

Department of Earth and Environmental Sciences, University of Waterloo, Waterloo, ON N2L 3G1, Canada
*
Author to whom correspondence should be addressed.
Minerals 2020, 10(12), 1075; https://doi.org/10.3390/min10121075
Submission received: 1 November 2020 / Revised: 27 November 2020 / Accepted: 28 November 2020 / Published: 30 November 2020
(This article belongs to the Special Issue Copper and Other Metallic Isotope Systems)

Abstract

:
Vanadium is an important redox-sensitive trace metal for paleoenvironmental reconstructions. Modern organic-rich sediments persistently contain sediment V enrichments <500 μg/g, but many ancient marine organic-rich mudrocks record enrichments >500 μg/g. Previous studies propose that ancient V enrichments of these magnitudes (“V hyper-enrichments”) were deposited from hyper-sulfidic bottom-waters with higher H2S levels (≥10 mM) than observed in modern euxinic basins. To test the importance of hyper-sulfidic conditions for generating V hyper-enrichments, we compare V concentrations with Mo isotope (δ98Mo) compositions from mudrock samples ranging in age from Ediacaran to Pleistocene. In the modern ocean, sediments deposited from strongly euxinic bottom waters ([H2S]aq > 11 μM) closely record global seawater δ98Mo because conversion of molybdate to tri- and tetra-thiomolybdate is quantitative. By contrast, large Mo isotope fractionations occur during Mo adsorption to Fe-Mn particulates or because of incomplete formation of the most sulfidic thiomolybdates in weakly euxinic settings ([H2S]aq < 11 μM), which both favor removal of lighter-mass Mo isotopes to sediments. We find multiple examples when mudrocks with V hyper-enrichments are associated with a wide range of δ98Mo for a single time interval, including values at or below oceanic input δ98Mo (0.3–0.7‰). This observation suggests significant isotopic offset from reasonable seawater values (typically ≥1.0‰). Thus, we conclude that hyper-sulfidic conditions were not responsible for many V hyper-enrichments in Ediacaran–Phanerozoic mudrocks. Instead, sediment V hyper-enrichments can be explained by high Fe-Mn particulate fluxes to weakly euxinic sediments or by moderately restricted euxinic settings with strongly euxinic ([H2S]aq > 11 μM but not necessarily > 10 mM) or weakly euxinic (with slow clastic sedimentation rates and high organic carbon fluxes) bottom waters where vigorous water exchange provides a continuous V supply from the open ocean.

1. Introduction

Redox-sensitive trace metals in organic-rich mudrocks (ORM) are commonly used to infer ancient marine physicochemical conditions. Semi-quantitative trace metal proxies for oxygen (O2) and hydrogen sulfide (H2S) levels in ancient bottom waters are well-defined based on modern basin analogs. Such proxies include redox-sensitive metal concentrations (e.g., Mo, Re; [1,2]), sedimentary Fe speciation (e.g., FeHR/FeT, FePY/FeHR; [3,4]), elemental ratios (e.g., Fe/Al, Re/Mo, Mo/U; [2,3,5,6]) and stable isotope compositions (e.g., δ98Mo, δ238U; [7,8]). Vanadium is a redox-sensitive trace metal, which has garnered utility as a paleoredox proxy for its potential to identify sulfidic anoxia (euxinia) in ancient ORMs. A recent study invoked the utility of vanadium as an indicator of hyper-sulfidic conditions (H2S ≥ 10 mM) when “hyper-enriched” in ORM (V > 500 μg/g) based on the absence of V hyper-enrichments in the most strongly euxinic modern basin—the Framvaren Fjord [9]. Because V hyper-enrichments are not observed in any known modern marine sediments, constraints on environmental conditions during deposition of ancient organic-rich sediments with V hyper-enrichments cannot be made directly following uniformitarian assumptions. Hence, further evidence for the mechanism(s) of V hyper-enrichment is needed. An alternative method for determining V enrichment processes can be attempted by comparing V concentration data with well-constrained redox proxies having similar hypothesized depositional controls—such as the Mo-isotope system—on the same sample set.

2. Background Information

2.1. Vanadium

Vanadium is an abundant trace metal in the upper continental crust (VUCC = 107 μg/g; [10]) and oxic post-Archean Australian shales (VPAAS = 150 μg/g; [11]), and thus there is a large detrital contribution of V from rivers into the global oceans. The average V concentration in modern oxygenated seawater is ~35–40 nM [12,13], which is regulated by dissolved fluxes from rivers and oxic marine sediments (~62 × 109 g/yr; [13]) into hydrothermal deposits and anoxic organic-rich sediments (~53 × 109 g/yr; [13]). The modern residence time of V in seawater is an estimated 42 to 130 kyr [13,14,15], which is longer than the average ocean mixing time of 1050 years [16]. In seawater, V is present in one of three oxidation states: V(V) as soluble vanadate oxyanions HVO42− or H2VO4, V(IV) as soluble vanadyl ions VO2+ or VO(OH)3, or insoluble VO(OH)2, and V(III) as solid phase V2O3 or V(OH)3 [12,17]. Oxic waters (O2 > 2 mL/l; [18]) host the most oxidized vanadate phases, and moderate decreases in O2 levels and pH result in increased vanadyl concentrations [17]. Complete reduction to V(III) is thought to occur in anoxic waters (O2 = 0 mL/l; [18]) in the presence of H2S (euxinia), however, the reaction pathway remains uncertain [17,19].
Removal of V from the water column occurs via two principal mechanisms: particulate adsorption and ionic substitution. Vanadate is favored in oxic bottom waters and sediments, and is associated with Fe(III)/Al/Mn(IV)-(hydr)oxide particulates (especially Fe-oxides) onto which it can strongly adsorb over a wide pH range (4 to 10) [17]. When adsorption occurs in fully oxygenated environments, accumulation of (hydr)oxide particulates at the sediment–water interface act as a sink for V(V) if sediments remain well-oxygenated during burial [20]. However, in less-oxygenated settings, dissolution of (hydr)oxide particulates occurs upon encountering reducing conditions, releasing the adsorbed vanadate to the surrounding bottom or pore waters where it can be reduced to vanadyl (acidic conditions) or V(III) (euxinic water columns or sulfidic pore waters). Like vanadate, the vanadyl oxocation VO2+ has a strong affinity for surface adsorption to solid particulates, including inorganic oxide phases (e.g., Al2O3 and TiO2; [21]) and organic molecules (e.g., humic, fulvic and carboxylic acids; [17,22]). Scavenging of vanadyl onto particulate surfaces occurs under suboxidized to weakly anoxic conditions (O2 < 2 mL/L; [18,23]) and at lower pH (<5) than vanadate [21]. If particulates are deposited at a sediment–water interface with these conditions, vanadyl is retained on the solid surfaces. Under strongly reducing conditions when V(III) is thermodynamically favored, the removal mechanism shifts from surface adsorption to ionic substitution. V(III) can form solid solution series with Fe(III) in oxides (e.g., goethite, hematite; [24,25]), or Al in clays [22]. Such processes are observed near hydrothermal vents, including mid-ocean ridges and submarine volcanoes, where rapid scavenging of V onto abundant hydrothermal Fe-oxides occurs [13,20]. Direct precipitation of solid V(III) (hydr)oxides from the water column is possible, but unlikely in natural waters [17]. Additionally, while many redox-sensitive trace metals are similarly reduced in euxinic environments (e.g., Mo, Ni), and can form metal-sulfide phases, V interaction with H2S does not result in the production of V-sulfides or V-bearing Fe-sulfides [26].
Redox-stratified basins (oxygenated shallower waters and anoxic deeper waters) with active Fe- and/or Mn-(hydr)oxide cycling may play an exceptional role in producing sediments highly enriched with V [27,28]. Cycling begins with vanadate adsorption to Fe- or Mn-(hydr)oxides in oxic surface waters, followed by desorption as the particulates sink through the water column into anoxic or euxinic bottom waters where they dissolve. If the chemocline in the water column is sufficiently deep, then kinetic constraints allow the particulates to reach the anoxic or euxinic seafloor, and subsequent desorption and reduction of V(V) delivered by particulates facilitates the formation of organo-vanadyl complexes or authigenic V(III) phases [6]. By contrast, if the chemocline is high in the water column because of more strongly euxinic conditions, then the Fe-Mn (hydr)oxide particulates do not reach the seafloor, and hence, organo-vanadyl complexes and V(III) phases are derived directly from sulfidic waters and sinking organic matter.

2.2. Molybdenum

Molybdenum is a redox sensitive trace metal in modern seawater that is generally enriched in sediments under similar environmental conditions necessary for V enrichment. Molybdenum concentrations in the upper continental crust and post-Archean Australian shales are similar (1.5 μg/g and 1 μg/g, respectively; [10,11]) and the dissolved seawater Mo concentration is the highest of any redox-sensitive trace metal (105 nM; [12]). This enrichment of dissolved seawater Mo versus crustal content (seawater-to-crust ratio of ~7 on a weight-basis) means that detrital Mo is a minor proportion of the anoxic/euxinic marine sediment Mo budget. By contrast, V has a relatively low seawater-to-crust ratio of ~0.02 by weight and thus detrital V represents a larger proportion of the anoxic/euxinic sediment V budget.
The redox properties of Mo differ from those of V in that not all reducing environments produce reduced Mo species. In oxygenated and weakly anoxic (non-sulfidic) waters, molybdate (Mo(VI)O42−) is the most abundant species and readily adsorbs to Mn-particulates, however, the adsorption affinity of Mo is slightly weaker than for V [27]. In euxinic seawater, thiolation of molybdate to form mono-, di-, tri- and tetra-thiomolybdate species occurs via a four-step reaction, as shown by Equation (1) [29].
MoOxS2−4−x + H2S ⟷ MoOx−1S2−5−x + H2O,
where 1 ≤ x ≤ 4, and the reaction begins with x = 4. Once thiolated, Mo can be scavenged by clays, Fe-particulates and organic thiols [29]. When euxinia is weak (H2S ≤ 11 μM) and/or seasonal, the reaction does not result in complete conversion of molybdate to tetrathiomolybdate (Mo(VI)S42−) and intermediate mono-, di- and tri-thiomolybdate species likely predominate [29]. Under strong (H2S ≥ 11 μM) and persistent euxinia, complete conversion of molybdate to tetrathiomolybdate can occur. Thiolation is not a reductive process (all elements retain their initial oxidation state). It is possible that reduction of Mo(VI) in thiomolybdate species can occur in sulfidic water columns or sediment pore fluids by reactions with zero-valent sulfur to form particle-reactive Mo(IV)-polysulfides that fix Mo in pyrite or organic matter [30,31].
Measurement of molybdenum concentrations and isotope compositions (δ98Mo) can help discern if sediments were deposited from oxic, reducing but non-euxinic, weak/intermittently euxinic or strong/persistent euxinic settings. Mass-dependent fractionation of Mo isotopes in the marine environment occurs via two processes: during adsorption to Fe-Mn particulates and organic matter, and during thiolation in the presence of H2S [7,32]. Both processes lead to preferential solid phase removal of lighter Mo isotopes, leaving surrounding seawater or sediment pore fluids enriched in the heavier Mo isotopes. Thus, seawater δ98Mo depends on the global magnitude of these fractionation processes and as such has varied through geological time.
Modern oxygenated seawater δ98MoSW is homogeneous in the global oceans and has a value of 2.34‰ against international standard NIST-SRM-3134 = 0.25‰ (all δ98Mo values reported herein are relative to this scale; see Section 3 for details) because most of the seafloor is well-oxygenated [33]. In such settings, preferential adsorption of isotopically light Mo onto solid Mn-particulate surfaces (Δ98MoMn oxides–SW ≈ −3.0‰; [34,35]) drives seawater δ98Mo to high values. If the Mn-particulates are permanently buried, then this isotopic signature is retained in oxic sediments. Similarly, adsorption of Mo to Fe oxyhydroxides or organic matter preferentially removes lighter Mo isotopes from solution, however, these processes result in smaller isotopic offsets from seawater of Δ98MoFe-oxyhydroxides–SW = −1.0 to −2.6‰ [36] and Δ98MoOM–SW ≈ −1.4‰ [32].
When Fe-Mn particulates encounter anoxic waters, reductive dissolution of the particulates occurs, releasing Fe, Mn and adsorbed ions including Mo and V. The particulate shuttling process enhances anoxic bottom-water or sediment pore-fluid Mo content compared to average seawater. In anoxic/non-sulfidic waters, molybdate (desorbed from particulates or already present in seawater) largely remains in solution as it is not efficiently scavenged by solid phases present in anoxic waters (e.g., clays, carbonates) without first being thiolated [29]. If conditions are euxinic, the isotopically light Mo desorbed from particulates is thiolated by H2S(aq) by Equation (1) [29] and can be removed to sediments.
Thiolation reactions result in further Mo isotope fractionation where isotopically light Mo is favored in the more sulfidized thiomolybdates, and isotopically heavy Mo remains in the reactant species (molybdate and less sulfurized thiomolybdates) [37]. Due to non-quantitative conversion of molybdate to tetrathiomolybdate in weakly or intermittently euxinic waters, intermediate thiomolybdates scavenged by clays, sulfide minerals, and organic matter and subsequently deposited in sediments retain the low δ98Mo value produced during thiolation (−0.6 to 1.8‰; [7]). A combination of both Fe-Mn particulate delivery and weakly/intermittently euxinic conditions can produce even lower δ98Mo in sediments. When euxinia is strong and persistent, quantitative conversion of molybdate to tetrathiomolybdate occurs, so the δ98Mo of the MoO42− is inherited by the MoS42−. Thus, strongly euxinic sediments closely record the δ98Mo value of source waters (i.e., seawater).
The Mo isotope system is a strong tool to help determine the possible environments and/or mechanisms, which may have played a role in sediment V hyper-enrichments. Thus, we consider a simple hypothesis test to evaluate the likelihood that V hyper-enrichments in ORM are associated with strongly euxinic conditions during sediment deposition. If samples from Ediacaran and Phanerozoic ORMs with V hyper-enrichments were primarily deposited under strongly euxinic conditions, then those samples will also record high Mo enrichments as well as high δ98Mo values near contemporaneous seawater values. Alternatively, V hyper-enrichment may be explained by a high flux of Fe-Mn particulates to euxinic sediments if low δ98Mo is observed along with high Mo enrichments and high Mo/U ratios (because U adsorption to Fe-Mn oxides is considerably less efficient compared to Mo adsorption; [6]).

3. Materials and Methods

To evaluate this hypothesis, we compiled available Ediacaran and Phanerozoic ORM datasets from the literature that contain, at a minimum, V concentrations, δ98Mo, and at least one independent redox proxy to confirm the use of euxinic samples only. Our filtering protocol for euxinia uses these independent proxies in the following order of importance:
  • Iron speciation: FePY/FeHR > 0.7 (must also record FeHR/FeT > 0.38 for anoxia), where FeHR (highly reactive Fe) is the sum of Fe pools, which can react with H2S in the water or sediment column during deposition or early diagenesis (i.e., FePY + Feox + Fecarb + Femag) [4].
  • Total organic carbon content: TOC > 1 weight percent (wt%).
  • Rhenium–molybdenum ratio: Re/Mo < 4 [2,5].
  • Molybdenum concentration: [Mo] > 100 μg/g [1].
Although TOC content of >1 wt% can also be found in anoxic sediments from non-euxinic settings, this threshold was used to reject low-TOC samples (rarely found in euxinic settings) and was always used in tandem with at least one other independent proxy for sample filtering. When two or more of these independent proxies are available but do not support the same interpretation of redox state, Fe-speciation data is used rather than Re/Mo ratios and [Mo] and if Fe speciation data are not available, then Re/Mo ratios are used rather than [Mo]. The data-filtering step is required to eliminate samples, which were likely deposited under non-euxinic conditions because our hypothesis test is for euxinic settings only and δ98Mo values for non-euxinic environments may overlap with those of weakly euxinic environments or euxinic settings affected by high Fe-Mn particulate fluxes.
Sample Mo isotope compositions were calculated as per mil deviations from the international standard solution NIST-SRM-3134 using Equation (2) [7,33].
δ98Mo (‰) = [(98Mo/95Mo)sample / (98Mo/95Mo)NIST-SRM-3134 − 1] × 1000 + 0.25,
This practice is currently followed by most laboratories reporting Mo isotope data. For older samples measured against in-house standards with known deviation from the NIST-SRM-3134 scale, a correction can be made to published Mo isotope data [38]. See Appendix A for a list of geological units corrected to NIST-SRM-3134 = 0.25‰. The correction constant of +0.25‰ is used so that familiar δ98Mo values (e.g., for modern global seawater and Mn oxides in oxic marine sediments) originally measured against most in-house laboratory standards during the early years of Mo isotope research can be retained on the NIST-SRM-3134 scale [33].
We set δ98Mo ≥ 1.0‰ as a minimum threshold to indicate deposition under strong euxinia. This value likely represents a lower limit for seawater δ98Mo for most of the Ediacaran–Phanerozoic. This approach allows for a first-order comparison between data sets to determine the likelihood that samples were deposited from strongly euxinic bottom waters—because samples with δ98Mo at or below the oceanic input δ98Mo of ~0.3–0.7‰ (based on modern rivers and ground waters [39,40,41]) likely record large isotopic offsets between seawater and sediments and, thus, were probably not deposited in a strongly euxinic setting. Unless global seawater δ98Mo is well-constrained (e.g., Pleistocene), we do not make efforts to evaluate our compilation for higher seawater δ98Mo values because of the potential for significant variation in seawater δ98Mo within individual geologic periods in the Ediacaran–Phanerozoic. We avoided older Precambrian ORM units because the lower atmosphere-oceanic O2 levels on the early Earth likely caused a lower seawater V reservoir, thereby limiting opportunities for V hyper-enrichments in sediments [42].

4. Results

In the following subsections, the compiled datasets (see Supplemental Information) are reviewed to identify trends in V–δ98Mo covariations and assess the statistical likelihood of V hyper-enrichments under strongly euxinic conditions (δ98Mo ≥ 1.0‰). A summary of the compiled geochemical and geological data is presented in Table 1. Most geological periods since the beginning of the Ediacaran Period are covered, except for the Carboniferous and Triassic for which no known published V and δ98Mo were available for the same samples. Much of the data is not normally distributed, thus value ranges are given to demonstrate variation. If data are normally distributed, variation is displayed as ± one standard deviation.

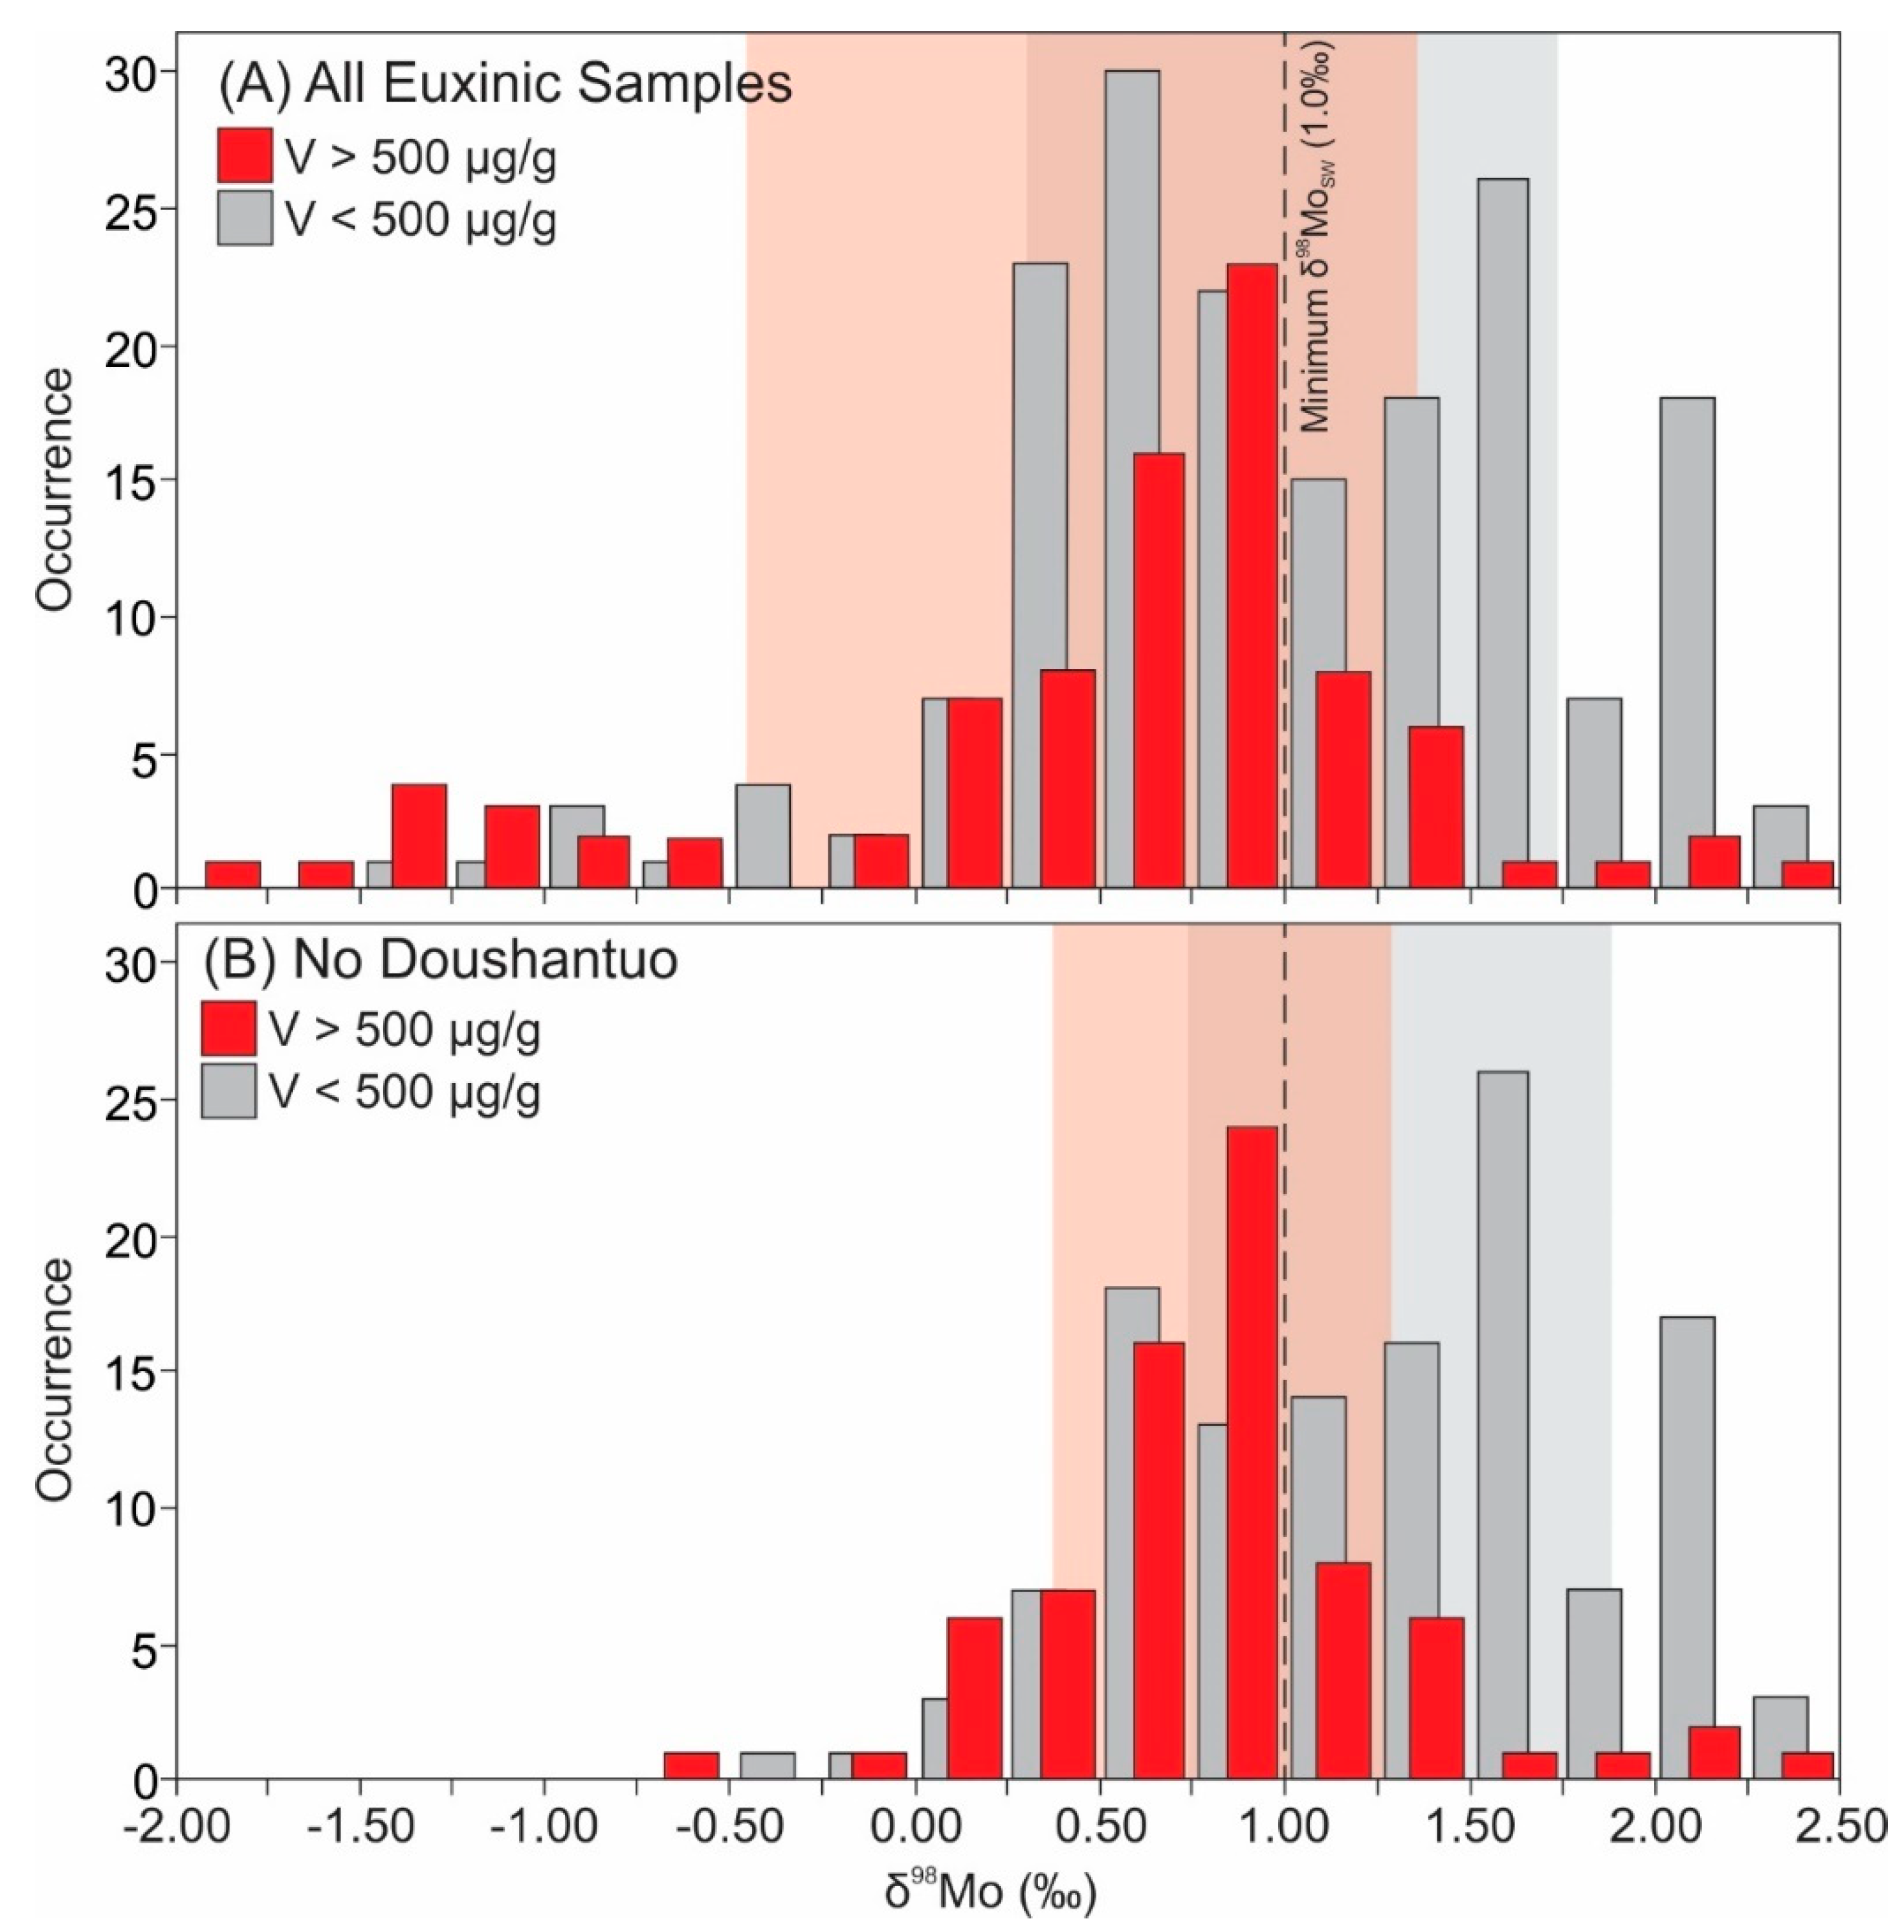
4.1. Mo Isotope Composition of Sediments with and without Vanadium Hyper Enrichments

We first evaluated if there are statistically significant differences between δ98Mo values of hyper-enriched versus non-hyper-enriched samples and if hyper-enriched samples lie within our defined Ediacaran–Phanerozoic seawater δ98Mo range (≥1.0‰). An unpaired t-test shows that the mean δ98Mo of hyper-enriched samples (0.52 ± 0.85‰) is significantly different from the non-hyper-enriched samples (1.00 ± 0.74‰) with p-value < 0.00001 (Figure 1A). A comparison of each group to a lower limit of 1.0‰ by a one-sample t-test shows that the mean δ98Mo of the V hyper-enriched group is significantly less than typical seawater values (p-value < 0.00001), whereas the mean δ98Mo of the non-hyper-enriched group does not vary significantly from the minimum seawater value (p-value = 0.48). However, these results may be skewed by the inclusion of Doushantuo Formation samples, which have unusually low δ98Mo. With Doushantuo Formation samples removed, mean δ98Mo of the V hyper-enriched and non-hyper-enriched groups increase to 0.82 ± 0.49‰ and 1.27 ± 0.60‰, respectively (Figure 1B). The means remain statistically different between the two groups (p-value < 0.00001) and the mean δ98Mo of the V hyper-enriched group remains statistically lower than 1.0‰ (p-value = 0.001). However, with the Doushantuo Formation samples removed, the mean δ98Mo of the non-hyper-enriched group is statistically greater than 1.0‰ (p-value < 0.00001).

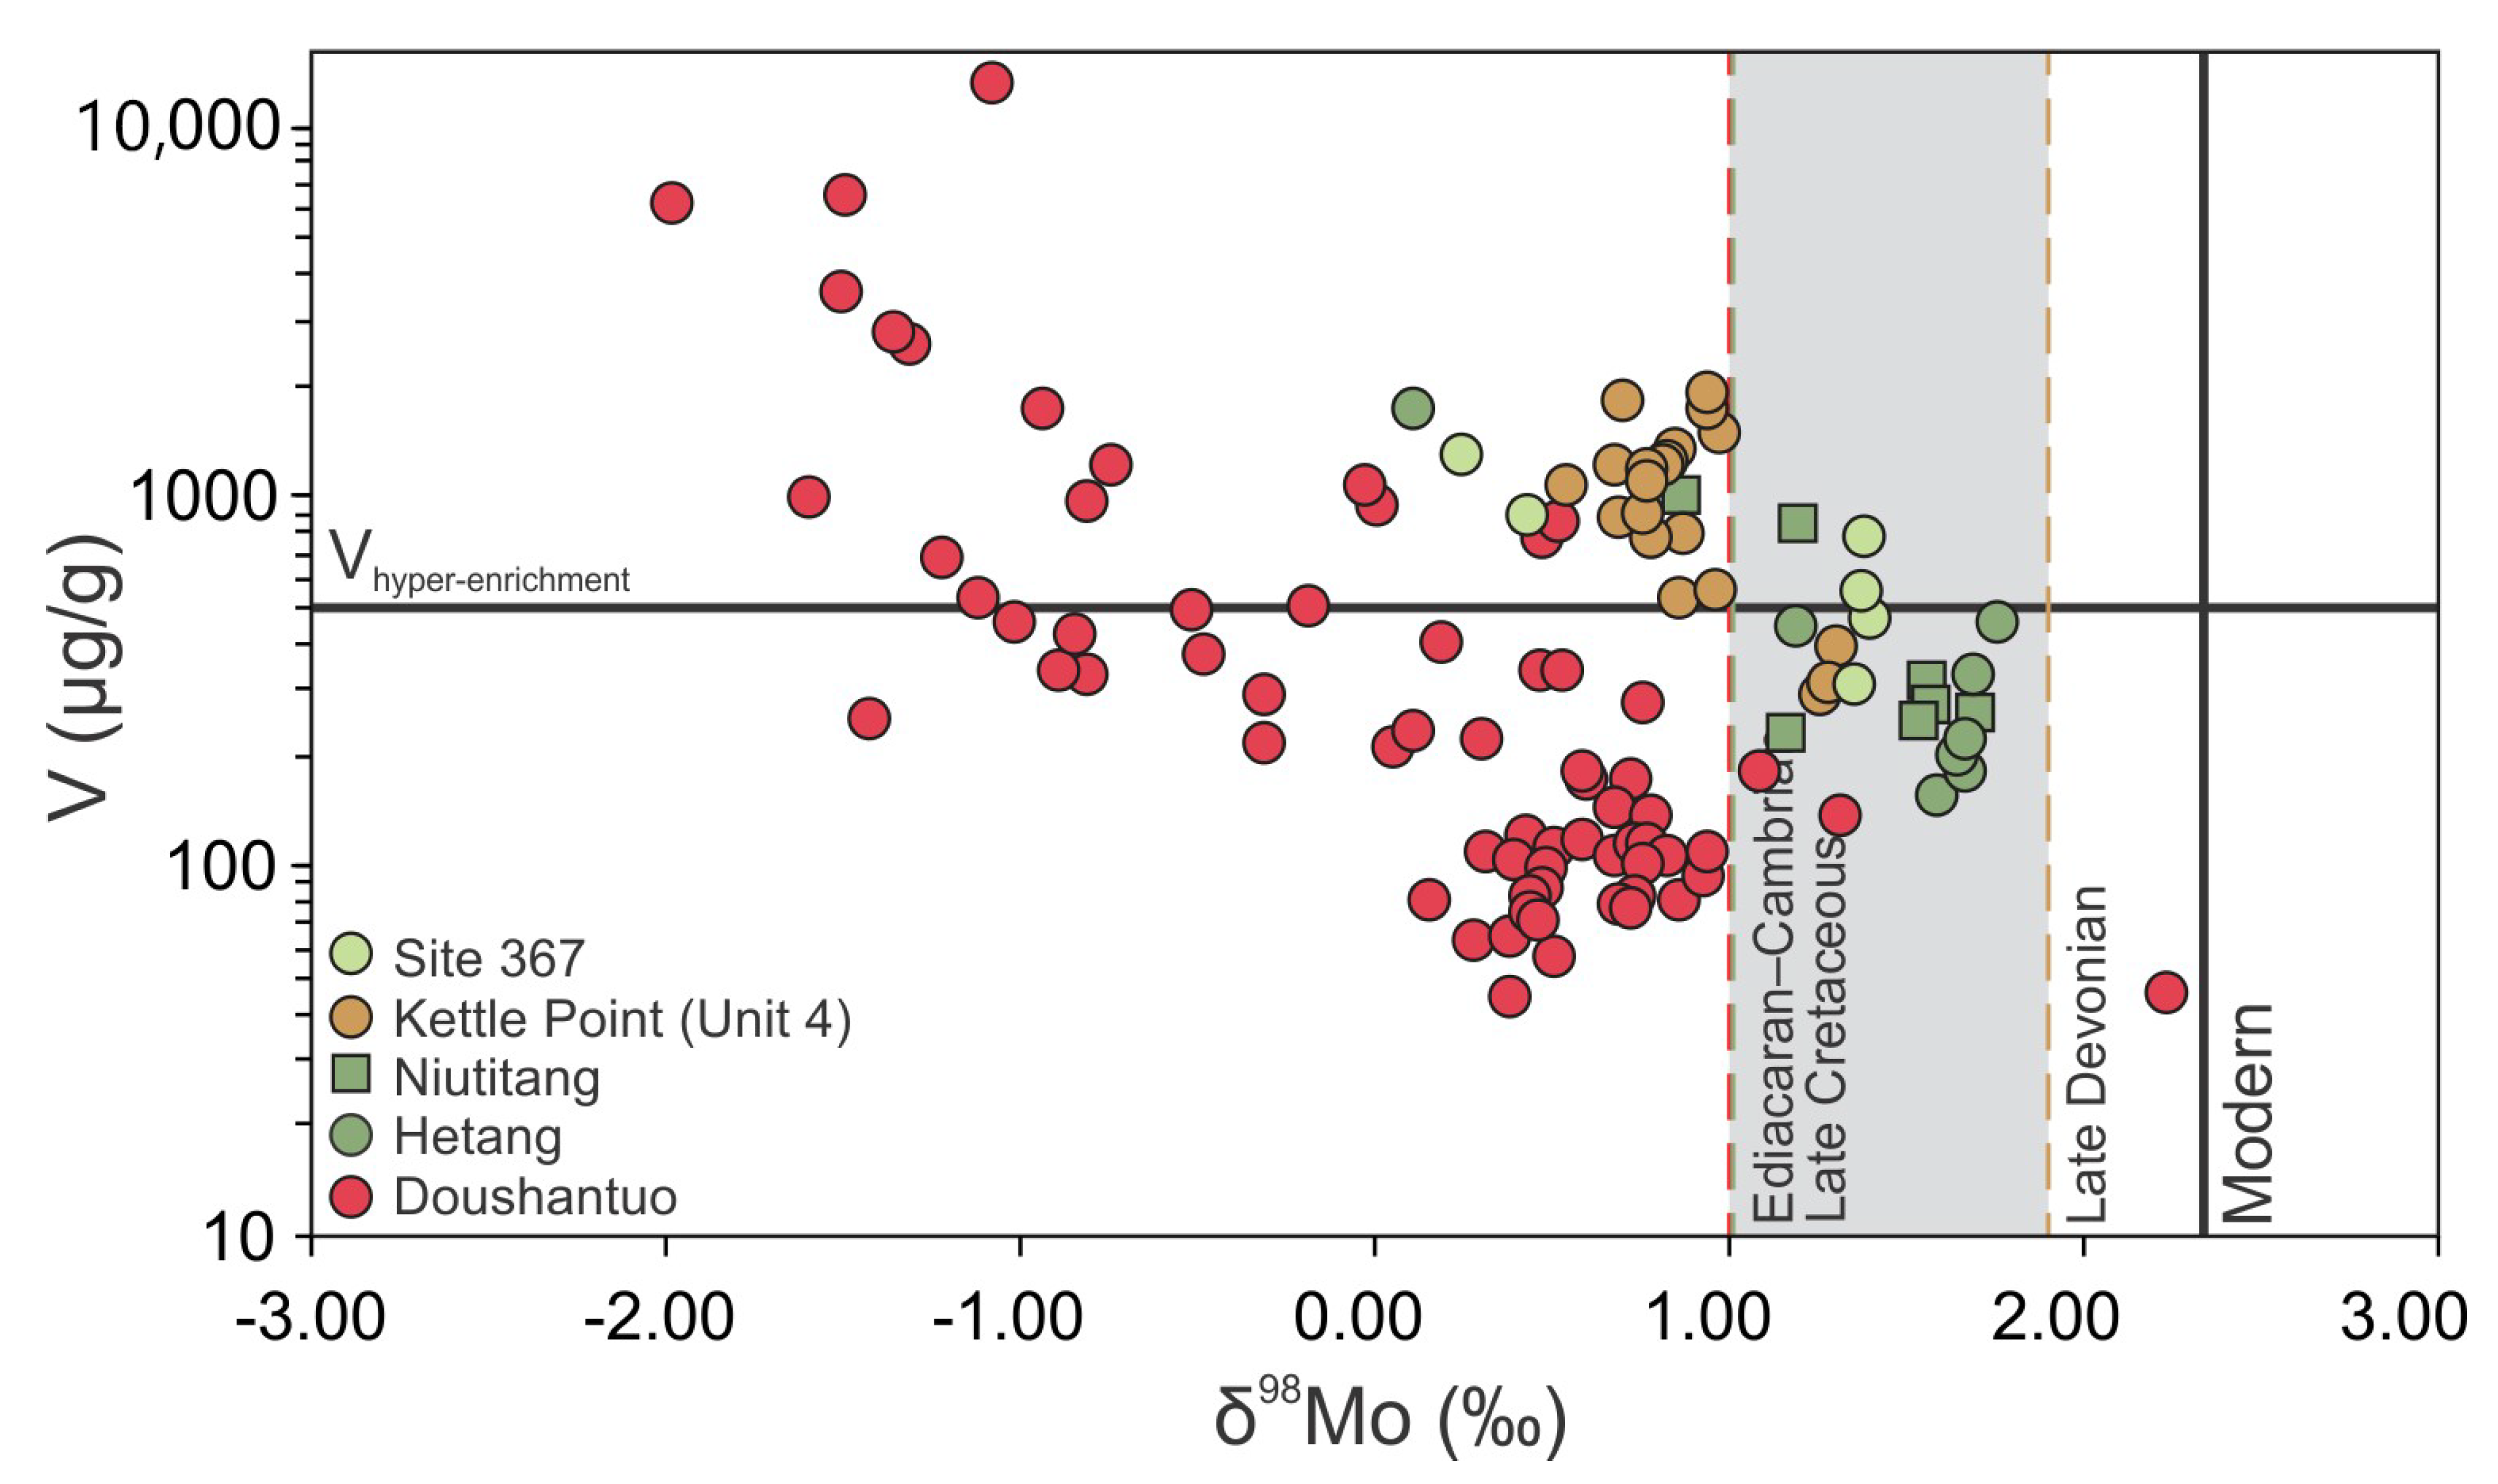
4.2. Vanadium Concentration and Molybdenum Isotope Covariation

To further explore the relationship between V concentrations and Mo isotope compositions, each study section is grouped by the trends, which emerged for V versus δ98Mo covariations (Table 1). Listed in Table 1 with each sample set are environmental characteristics noted by the original authors such as persistent euxinia, Fe-Mn particulate shuttles, local hydrothermal activity, upwelling processes, and/or sedimentation rates.

4.2.1. Sediments with Negative V-δ98Mo Trends

When plotted on a V–δ98Mo diagram, several ORMs exhibit a negative correlation, including the Ediacaran Doushantuo Formation, Cambrian Hetang and Niutitang formations, Late Devonian Kettle Point Formation (Unit 4) and Cretaceous OAE2 Black Shales (Site 367). Vanadium concentrations span several orders of magnitude (44 to 15271 μg/g; mean = 861 μg/g) and δ98Mo values encompass the large range for marine sediments (−1.98 to 2.24‰; mean = 0.40‰). A weak negative exponential correlation exists between V and δ98Mo from all localities (r2 = 0.17; p-value = 0.0001) and stronger negative correlations exist when the Doushantuo Formation is considered independently (r2 = 0.61; p-value < 0.00001) from the Hetang, Niutitang, and Kettle Point formations, and OAE2 black shales (r2 = 0.64; p-value < 0.00001). The δ98Mo values of Doushantuo Formation samples (0.09 ± 0.85‰) differ from the others (1.08 ± 0.43‰) and, by an unpaired t-test, the variation is highly significant (p-value < 0.00001). Doushantuo Formation samples record the highest V concentrations of any section (Vmax = 15271 μg/g) but the Doushantuo mean V concentration (814 ± 2127 μg/g) is not significantly (p-value = 0.92) different from the other sections (787 ± 511 μg/g).

4.2.2. Sediments within a Positive V-δ98Mo Trend

A positive trend emerges from a subset of the compiled data, including the Late Ediacaran Blovice Complex black shales, Ediacaran–Cambrian Ara Group (Core MMNW-7), Ordovician Fjäcka Shale, Late Permian Dalong Formation, Cretaceous OAE2 black shales (Tarfaya and La Contessa), and Pleistocene sapropels (ODP Hole 969D). Vanadium concentrations are less variable than the sections with a negative V–δ98Mo trend (81 to 2310 μg/g; mean = 750 μg/g), and the δ98Mo values are higher and do not encompass all possible marine compositions (−0.40 to 2.35‰; mean = 0.74‰). A weak positive linear correlation exists when all samples in this group are plotted (r2 = 0.19; p-value < 0.0001). Independently, many of the ORM units show no significant correlation between V and δ98Mo (Ara, Blovice, Dalong, La Contessa and Tarfaya; p-values > 0.08), which in some cases may be an effect of low sample count (Dalong, La Contessa and Tarfaya). Only the Fjäcka Shale and Pleistocene sapropels at Site 969D have moderate positive correlations between V and δ98Mo (r2 = 0.33 and 0.55; p-values = 0.02 and 0.002, respectively). Thus, unlike the negative correlations in Section 4.2.1, the positive trend here is defined largely by the group, and strong positive correlations are not observed in individual ORMs.

4.2.3. Organic-Rich Mudrocks without V Hyper-Enrichments

The samples in this category are from the Ediacaran–Cambrian Ara Group (ALNR-1), Late Ordovician Wufeng Formation, Devonian Kettle Point Formation (Units 1 to 3), Jurassic Posidonia Shales (Early), Whitby Mudstone Formation (Early) and Kimmeridge Clay Formation (Late), and Pleistocene Sapropels at Site 967C. These sections record very low V concentrations (56 to 548 μg/g) which are normally distributed around a mean of 187 ± 85 μg/g, and generally have moderate to heavy δ98Mo values (−0.09 to 2.42‰; mean = 1.47‰). No correlation between V concentrations and δ98Mo exists for this group (r2 → 0; p-value = 0.58).

5. Discussion

The following is a discussion of the proposed mechanisms for V hyper-enrichments in ORM from the perspective of Mo isotopes and provides insight on why V hyper-enrichments are not observed in modern marine sediments.

5.1. Universal Redox Interpretation from V Hyper Enrichments?

From the compiled data in this study, we find that (1) a universal cut-off for V enrichments in ORM (e.g., V hyper-enrichments) should not be used to indicate strongly euxinic depositional conditions and (2) interpretation of depositional conditions from V enrichments should be paired with other redox proxies to gain a complete understanding of the paleoenvironment. These findings are based on statistically lower δ98Mo values for the compiled V hyper-enriched sediments compared to non-hyper-enriched sediments and to a minimum seawater δ98Mo value of 1.0‰. These tests indicate that V hyper-enriched euxinic sediments are less likely to record the seawater δ98Mo values (>1.0‰) expected from strongly euxinic sediments ([H2S]aq > 11 μM). Instead, V hyper-enriched sediments record a range of δ98Mo values which encompass strongly euxinic, weakly/intermittently euxinic (H2S < 11 μM) and/or particulate-rich redox stratified environments. Additionally, if one mechanism or condition was most often responsible for V hyper-enrichments, it is expected that a consistent trend would be apparent on a V–δ98Mo plot. This, however, is not the case as plotting all compiled V and δ98Mo data simultaneously (figure not shown) reveals only a weak negative correlation (r2 = 0.13) and individual stratigraphic units display positive, negative, or negligible correlations.

5.2. Influence of Fe-Mn Particulate Shuttles on V Enrichments

Particulate shuttling in redox stratified basins is suggested as a mechanism for sediment V (and Mo) enrichment in several studies due their adsorption affinities with solid Fe-Mn (oxyhydr)oxide surfaces [1,12,27,28]. From the compiled data, the Doushantuo, Hetang, Niutitang and Kettle Point formations, and the OAE2 black shales at Site 367 host the strongest evidence for such activity within the water column during their deposition (e.g., high Mo/U ratios; [6,27,28,43,44,46]). The Kimmeridge Clay Formation also presents signs of possible weak particulate activity such as elevated Mo relative to U [59], but generally Mo–U follows a seawater trend [6] suggesting variations in Mo enrichment was primarily controlled by redox state rather than the strength of the particulate fluxes. Thus, the Doushantuo, Hetang, Niutitang, and Kettle Point formations best represent the direct effects of particulate activity on V enrichments and δ98Mo compositions and the following discussion centers on these formations (Figure 2). Due to the low sample count for OAE2 euxinic sediments at Site 367, this section will not be further discussed, nonetheless the V–δ98Mo exhibits a similar trend to the other ORM units in Figure 2.
The Ediacaran Doushantuo Formation contains discrete intervals with remarkably negative δ98Mo (minimum −1.98‰) that likely represent active Mn particulate shuttling and/or incomplete Mo thiolation [27]. These exceptionally low δ98Mo values correspond with the greatest V enrichments of any geological unit in the compilation and there is a negative correlation between V and δ98Mo. The highest δ98Mo value of 2.24‰ for euxinic sediments from the Doushantuo Formation is within error of modern seawater (2.34‰), thus a late Ediacaran seawater δ98Mo composition ≥ 2.24‰ is possible, at least episodically, and samples approaching this value may have been deposited in strongly euxinic waters. However, very few euxinic samples reach this δ98Mo value (when δ98Mo > 1, n = 3), and a cluster of samples around δ98Mo = 0.95 ± 0.39‰ (for all samples with δ98Mo > 0.7‰; n = 15) potentially suggest a lower baseline Ediacaran seawater composition [27]. Other Ediacaran units from the compilation—the Blovice Complex black shales deposited in the accretionary wedge of a back-arc basin—may also reflect lower seawater values (δ98Momax = 1.2‰, samples cluster at 0.68 ± 0.26‰) [47]. Deviation from the seawater δ98Mo in the Blovice Complex is hypothesized to be a function of periodic low temperature hydrothermal fluid mixing (δ98MoLTHT ≈ 0.75‰) or incomplete thiolation in an intermittently restricted, weakly euxinic basin [47].
Regardless of the true Ediacaran seawater value, no V hyper-enrichments are observed in Doushantuo samples when δ98Mo > 0.52‰, so strong euxinia is unlikely to have played a role in these V hyper-enrichments because global seawater δ98Mo should exceed oceanic input and crustal δ98Mo. Instead, nearly all V hyper-enrichments occur in samples with δ98Mo between −0.74‰ and −1.98‰ (12 of 16 hyper-enriched samples) equating to seawater offsets of −1.7‰ to −3.0‰ against the lower baseline seawater value of ~1.0‰. These offsets suggest delivery of Mn-rich particulates (Δ98Moparticulates–SW = −2.0 to −3.3‰) to the euxinic sediments, or the sediments were deposited in weakly euxinic bottom waters (Δ98Moweak euxinic sediments–SW = −0.5 to −2.8‰) (reviewed in [7]). However, to obtain the greatest offset of approximately −3‰, adsorption to Mn oxides likely occurred and this is hypothesized to be the primary mechanism for Doushantuo V hyper-enrichments and is likely responsible for V hyper-enrichments even in non-euxinic sediments of the Doushantuo Formation [27]. If seawater δ98Mo was >1.0‰ and Δ98Mosediment–SW was <−3.2‰, then a combination of a Mn-rich particulate flux, Mn redox cycling, and weakly/intermittently euxinic conditions likely occurred. Finally, we note that even some non-euxinic ORM from the Doushantuo Formation have been reported to contain V hyper-enrichments, thus highlighting the ability of a strong Fe-Mn particulate flux to drive such enrichments in sediments [27].
The Cambrian Hetang and Niutitang formations of the Nanhua Basin were similarly affected by particulate shuttling and record a negative correlation between V concentrations and δ98Mo. Like the Doushantuo Formation, the Hetang and Niutitang ORM with the heaviest δ98Mo are clustered around ~1.7‰, indicating strong euxinia and close capture of contemporaneous seawater δ98Mo [43]. None of these samples have V hyper-enrichments (155 to 456 μg/g), suggesting strong euxinia in the Hetang and Niutitang formations was not responsible for V hyper-enrichments. Two sample groups have lower δ98Mo: (1) a group with slightly lighter δ98Mo ~1.0‰ (seawater offset ≈ −0.7‰) with both hyper-enriched (up to 1005 μg/g) and non-hyper-enriched samples, and (2) a sample with the lowest δ98Mo value (0.11‰; seawater offset of −1.6‰) and V hyper-enrichment (1726 μg/g). Group 1 is likely associated with weak euxinia, whereas Group 2 is consistent with delivery of Fe-rich particulates to the euxinic sediments (Δ98MoFe–SW = −1.0 to −2.6‰; [7,36]), or sediments deposited in weakly euxinic bottom waters with lower H2S.
To distinguish between the Fe-rich particulate and weakly euxinic signal, Mo concentrations and V/Mo ratios should provide clarification. Inspection of Mo concentrations in the Hetang and Niutitang formations reveals that for samples without V hyper-enrichments (Mo = 76 ± 48 μg/g), Mo content is not significantly lower (p-value = 0.30) from that of V hyper-enriched samples (Mo = 108 ± 49 μg/g). Thus, the mechanism producing the V hyper-enrichment did not equally affect the Mo enrichments. If redox conditions were the sole control on these V enrichments, changes in Mo content should mirror changes in V content, so a transition from strong to weak euxinia is unlikely to have produced lighter δ98Mo and V hyper-enrichments. It has been demonstrated that V has a greater affinity (at least 3- to 4-fold; [27]) for Fe-Mn particulate surfaces (especially Fe) than Mo, which may explain the increased V relative to Mo. Further evidence for particulate activity is demonstrated through comparison of the V/Mo ratios of the V hyper-enriched samples to other samples. The V/Mo ratio for hyper-enriched Hetang and Niutitang ORM (35 ± 51) is roughly 6 times greater than the V/Mo of the non-hyper-enriched samples (5.6 ± 3.6).
The studied sections of the Doushantuo, Hetang, and Niutitang formations were deposited within euxinic wedges on continental margins with strong connection to the global oceans [27,43,44,45]. Some intervals of the Devonian Kettle Point Formation contain similar geochemical characteristics suggesting particulate shuttle activity; however, deposition occurred within a small epeiric structural sub-basin situated between the Appalachian and Michigan basins [28]. Global Late Devonian seawater δ98Mo is estimated to have been ≥ 1.9‰ [28,54,61], and several samples in the older Kettle Point Units 1 and 2 approach this value (1.60 to 2.02‰; n = 4). Most of the samples (8 of 9) in Units 1 to 3 have limited V enrichment above crustal values (113 to 255 μg/g) and are not greatly fractionated from the seawater value (Δ98Momax = −0.8‰). The Devonian Oatka Creek Formation (a “type euxinic” ORM) was coevally deposited on the seaward margin of the Appalachian orogeny and records near-seawater δ98Mo (1.68 ± 0.10‰) and no V hyper-enrichments (334 ± 72 μg/g). Thus, Units 1 to 3 were probably only weakly affected by particulate activity and represent deposition under weak to strong euxinic conditions.
In contrast, it is hypothesized that there was a high Fe-Mn particulate flux to sediments during deposition of the younger Kettle Point Unit 4 due to a drop in sea level and concomitant deepening of the redoxcline towards the sediment–water interface [28]. Deepening of the redoxcline to a position within the water column that is close to the sediment–water interface permits Fe-Mn oxides to dissolve and release adsorbed Mo and V ions on the seafloor where these metals can be sequestered into the euxinic sediments. Unit 4 has significantly lower δ98Mo values (0.88 ± 0.21‰; p-value = 0.001) and significantly higher V enrichments (1044 ± 489 μg/g; p-value < 0.001) than Units 1 to 3. Unit 4 δ98Mo represents an approximate average offset from Devonian seawater of −1.0‰, indicating deposition in an Fe-rich or weakly euxinic environment. Like V, the Kettle Point Mo concentrations are significantly greater (p-value = 0.02) in Unit 4 (Mo = 199 ± 122 μg/g) compared to Units 1 through 3 (Mo = 121 ± 17 μg/g). The V/Mo ratio is also significantly higher (p-value < 0.0001) in Unit 4 (6.0 ± 3.0) than Units 1–3 (1.6 ± 0.9). Thus, while both V and Mo concentrations increase up-section, the increase is not equivalent and represents a roughly 3.6-fold increase in V/Mo for Unit 4 compared to Units 1–3, consistent with our observations for the Hetang and Niutitang formations, and modern particulate V/Mo.
In summary, large Mo isotopic offsets from seawater (between −1‰ to −3‰) and increased V/Mo ratios similar to modern Fe-Mn particulates for Doushantuo, Hetang, Niutitang and Kettle Point samples with V hyper-enrichments suggest that Fe-Mn particulate cycling is the origin of the V hyper-enrichments.

5.3. V Hyper-Enrichments in Euxinic Semi-Restricted Basins

Vanadium hyper-enrichment of ≥ 500 μg/g were noted as a possible indicator of strong euxinia or even hyper-sulfidic conditions in the Late Devonian–Early Mississippian Bakken Formation of the Williston Basin (USA) [9]. The Williston Basin was a relatively deep (>200 m) epeiric basin fed by upwelling currents at intermediate depths (~100 m) promoting stratification between quiet bottom-water and turbulent, nutrient-rich surface waters [9]. This configuration promoted primary productivity in the upper water column, which would lead to increasingly intense reducing conditions in bottom waters as O2 was depleted during organic matter decomposition at the seafloor. Accumulation of extensive amounts of H2S in bottom waters, coupled with continuous renewal of seawater in the upper water column (thus supplying nutrients, sulfate, and dissolved trace metals) [17,22] may have produced V hyper-enrichments in euxinic TOC-rich sediments. While the Bakken shales have not been analyzed for δ98Mo, this enrichment model is commonly applied to black shale deposits [62].
Semi-isolated basins are produced when a physical barrier like a subaqueous sill—often a feature of continental margin ‘silled basins’ or intracratonic/epeiric seaways—inhibits deep-water exchange but allows upper water column interaction with global seawater circulation. Basins with continuous or frequent renewal of their water masses have the potential to closely capture seawater δ98Mo values if molybdate is quantitatively converted to tetrathiomolybdate in strongly euxinic bottom waters [7,29]. Under such conditions, the isotopic offset between the euxinic sediments and seawater is only ~0.3‰ when Mo removal from the bottom waters is not quantitative [63]. Moderately restricted basins can have access to a continuous supply of trace metals (e.g., V and Mo), so even if bottom water euxinia is strong and V and Mo are efficiently removed to euxinic sediments, water column concentrations will remain elevated if significant water exchange with the open ocean is maintained. This scenario contrasts with basins like the Black Sea which suffer from severe basin restriction effects—V and Mo are quantitatively removed from strongly euxinic bottom waters whose renewal time is sufficiently long that a lack of replenishment from open-ocean seawater leads to depleted metal concentrations in the basin’s euxinic water column and, over time, also in sediments [14,64]. In such cases, sediments may record seawater (heavier) δ98Mo values due to quantitative Mo removal from bottom waters, but the Mo (and V) enrichments will be subdued and Mo–δ98Mo (and V–δ98Mo) will depict a negative trend. Because both Mo and V enrichments remain elevated at heavier δ98Mo, and the V–δ98Mo trend in Figure 3 is not negative, it is unlikely that these ORMs were deposited in strongly restricted environments and therefore provide insight into enrichments in basins with seawater renewal from the open ocean and strongly euxinic bottom waters—a configuration that is not represented well on the modern Earth [65].
All ORM units in Figure 3 lack evidence of strong Fe-Mn particulate influence on δ98Mo (Mo is not greatly enriched relative to U; after [6]), thus lighter δ98Mo is likely a function of weakly euxinic conditions [46,48,50,51,52,53] and in one case may also reflect a possible local hydrothermal source [47]. Additionally, if particulate shuttling was active during the deposition of these ORM, it is expected that the V–δ98Mo trend would resemble that observed in Figure 2 (strong negative correlation), however, a weak (but not insignificant; p-value = 0.0001) positive trend is noted instead. Thus, the lack of particulate shuttling and positive Mo–δ98Mo (not shown) and V–δ98Mo trends eliminate both particulates and severe basin restriction as mechanisms for V hyper-enrichment.
Vanadium hyper-enrichments occur in many samples with δ98Mo offsets from seawater of up to −1.9‰ (e.g., Site 969D and Dalong sample offsets from Pleistocene and Late Permian seawater values) indicating conditions that were not strongly euxinic. For some groups like the Blovice Complex ORMs this can be reconciled as the lower δ98Mo is thought to be the result of local low temperature hydrothermal inputs (~0.75‰) that overprinted seawater values, so it is possible that bottom waters were strongly euxinic and produced V hyper-enrichments. However, for the other groups with lower δ98Mo values, V hyper-enrichments of the same magnitude as those in strongly euxinic sediments are not expected if weak euxinia is the only reason for the offset (modern weakly euxinic sediments do not contain V hyper-enrichments). Nevertheless, hyper enrichments still occur and require an explanation. Evidence for the Fe-Mn particulate mechanism is not clearly present in any of these sections (e.g., Mo/U ratios), so δ98Mo offsets from seawater due to oxide adsorption of isotopically light Mo is not likely.
Adsorption of Mo to organic matter has been shown to produce similar isotopic offsets of around −1.4‰ [32] as those observed in weakly euxinic settings. Vanadium–TOC correlations are positive in these sections, and in some the correlation is strong and significant (Tarfaya, r2 = 0.97, p-value = 0.02; Site 969D, r2 = 0.64, p-value = 0.0006), indicating that V enrichments in these sections are associated with TOC. For samples with low δ98Mo indicating weak euxinia, and no evident enrichment via Fe-Mn particulate shuttles, an association with organic matter and slow clastic sedimentation rate may help to amplify V enrichments, producing hyper-enrichments even under weak euxinia.
The semi-restricted upwelling zone configuration therefore provides a simple explanation as to why these ORM feature V hyper-enrichments at higher δ98Mo values when conditions were strongly euxinic and recorded seawater δ98Mo, or at lower δ98Mo when euxinia was weak without excess V delivery from particulate shuttles, but instead V was enriched in organic matter at times of slow clastic sedimentation. These scenarios indicate that hyper-sulfidic conditions (H2S > 10 mM; [9]) are not required to drive V hyper-enrichments, although we do not rule out the possibility that hyper-sulfidic conditions were occasionally achieved for those ORM deposited in semi-restricted upwelling zones and recording high δ98Mo values.

5.4. Ancient Localities without V Hyper-Enrichments

Several locations included in the compiled data set feature consistent, non-hyper-enriched V concentrations across a range of δ98Mo compositions (Figure 4). These localities include the ALNR-1 core in the Ediacaran Ara Group, the Late Ordovician Wufeng Formation, Devonian Oatka Creek Formation and Kettle Point Formation (Units 1 to 3), Jurassic Whitby Mudstone Formation, Posidonia Shale and Kimmeridge Clay Formation, and Pleistocene Sapropels at Site 967C. The Oatka Creek Formation is a “type euxinic” ORM deposit, meaning that deposition occurred under strongly euxinic conditions on a continental margin accessing global seawater [54]. Consistent δ98Mo around 1.7‰ is therefore likely close to the Late Devonian seawater composition, but V hyper-enrichments are not recorded even though conditions were strongly euxinic and the basin was not restricted. Hence, the driving mechanisms identified for V hyper-enrichments—a vigorous Fe-Mn particulate shuttle, moderate restriction (promoting higher bottom-water [H2S]aq compared to more open-ocean conditions), and unusually low clastic sedimentation coupled with high organic matter enrichment—were apparently not operating at sufficient magnitude to drive V hyper-enrichments in the Oatka Creek Formation and other ORMs. Two possible scenarios that could explain how the remaining units maintained such low V enrichments despite euxinic bottom-water conditions are considered: (1) globally significant seawater changes during the Ediacaran, Ordovician, Devonian, Jurassic, and Pleistocene compared to other geological periods, or (2) local basin hydrography and redox effects.
Global seawater reservoirs of redox-sensitive trace metals like V and Mo are controlled by burial in anoxic and/or euxinic marine sediments, as demonstrated in numerous mass balance modelling studies (e.g., Mo, Cr, U, Re; [66,67,68]). Vanadium concentrations in seawater are controlled in the same way, i.e., during times of globally expanded seafloor anoxia/euxinia, V becomes depleted in seawater as it is buried into larger areas of anoxic/euxinic sediment [42]. Thus, if the lack of V hyper-enrichments in the terminal Ediacaran, Late Ordovician, Late Devonian, Early, and Late Jurassic, and Pleistocene units in our compilation were simply caused by a lower seawater V reservoir at a time of globally expanded ocean anoxia/euxinia, then a lack of V hyper-enrichments should be observed in other coeval sections. A comparison of coeval geological units suggests this scenario is probably not correct. The terminal Ediacaran Blovice Complex and other Ara Group locations [47,48,49], Late Ordovician Fjäcka Shale [50], Late Devonian Bakken Formation (not in compilation because no Mo isotope data is available; [9]), Early Jurassic Gordondale Member (not in compilation; [69]), and Pleistocene Sapropels at Site 969D [53] are approximately coeval with the units depicted in Figure 4 and feature V hyper-enrichments.
Notably, the units with V hyper-enrichments differ from those without hyper-enrichments by their depositional environment. All hyper-enriched units were deposited in moderately semi-restricted, stratified basins (Figure 3), whereas the non-hyper-enriched units were deposited on open-ocean continental margins (Oatka Creek Formation), or in more severely restricted sub-basins of epeiric seaways (all other sections in Figure 4). Epeiric basins occur during sea level transgression or when tectonic processes created continental configurations with easily flooded, low-lying land areas. Today, sea level is relatively low and euxinic epeiric seaways lack a modern analog. Relative to open-ocean margins and less restricted basins, the more restricted epeiric seas likely had a much greater continental component of trace metal input relative to seawater [70]. Removal of trace metals into sediments in more restricted epeiric basins could produce depletions in local water column metal reservoirs over time. It is therefore possible that if seawater renewal rate into an epeiric sea was slow, continental sources (river and groundwater) were the major supplier of trace metals. Today, dissolved riverine V concentrations (~15 nM; [71]) are lower than the seawater concentration (~40 nM; [12,13]) whereas dissolved groundwater V concentrations are poorly constrained but may range from <15 nM to >900 nM, depending on local bedrock geology, redox, pH, seasonality, and microbial activity [72,73,74]. A lack of access to the large open-ocean seawater V reservoir may thus explain the near-constant, non-hyper-enriched V concentrations (165 ± 65 μg/g; only mildly higher than the crustal average V concentration of ~107 μg/g; [10]) in the ORM units from more restricted epeiric basins (Figure 4).
An example in the compiled data, which may demonstrate this scenario, is the Early Jurassic Whitby Mudstone Formation and Posidonia Shale, which were deposited in sub-basins of an epeiric sea covering western Europe at the time. It is postulated that the South German Basin (Posidonia Shale) was relatively well-connected to ocean circulation compared to the Cleveland Basin (Whitby Mudstone), and its redox state was not strongly euxinic. Rather, rapid renewal of seawater and weak euxinia led to consistently low δ98Mo of ~0.8‰ in the Posidonia shales, which was significantly lower than the seawater composition (~1.45‰) at the time [56]. Basin restriction and development of a strongly euxinic water column in the Cleveland Basin led to quantitative removal of Mo and during periodic marine influx captured seawater δ98Mo [56]. Using Al as a proxy for detrital input to each basin, it is observed that the Cleveland Basin (8.7 wt%) was receiving much more continental material than the South German Basin (5.3 wt%). Lower Al in the Posidonia Shale corresponds to higher authigenic V (Vauth = 136 ± 42 μg/g), and vice versa for the Whitby Mudstone in the equivalent interval (Vauth = 79 ± 32 μg/g). Drawdown of V in the Cleveland Basin due to strongly euxinic bottom waters with limited replenishment compared to the weakly euxinic, but frequently replenished South German Basin likely contributed to the discrepancy in V enrichment between the Early Jurassic units.
Pleistocene sapropels at Site 967C (Figure 4) and 969D (Figure 3), although not entirely temporally equivalent, represent a similar scenario to that of the Early Jurassic units. Site 967C is described as a restricted euxinic facies like the Black Sea [60], while Site 969D is thought to correspond to weakly restricted Cariaco Basin-style deposition, but lacking Cariaco-like particulate shuttling [53]. Redox states are correspondingly strongly (Site 967C) and weakly (Site 969D) euxinic based on maximum δ98Mo attained in each section. Seawater δ98Mo has been constant for the past ~60 million years at the modern composition (2.34‰) [7], which includes the Pleistocene sapropels. The strongly restricted and euxinic Site 967C sediments reach δ98Mo of 2.30‰ while the weakly restricted and euxinic Site 969D only reach 1.93‰. Variation in hydrography and redox state here correspond to notable V enrichments. Site 967C does not include any sediments with hyper-enrichments despite the strongly euxinic conditions, whereas Site 969D contains weakly euxinic sediments which frequently record V hyper-enrichments into the 1000s μg/g because of access to a larger seawater metal supply.
From the above discussion, it is hypothesized that sediments with low V concentrations (not hyper-enriched) arise from deposition in basins with poor water exchange with the open ocean (strong restriction). In these configurations, strong euxinia can develop as H2S accumulates and produces an initial drawdown of trace metals into sediments, depleting the non-replenished water column until an influx of seawater occurs. While some ORM units in the compilation were deposited during known periods of expanded anoxia (e.g., Early Jurassic), a global mechanism is unlikely to be the primary driver of low V enrichments because coeval sections deposited in semi- or non-restricted environments should exhibit similar non-hyper-enrichment of V, which is not the case.

5.5. Why Are V Hyper-Enrichments Absent in Modern Euxinic Sediments?

In the modern well-oxygenated ocean, euxinia is only found in a handful of locations, most of which are in upwelling zones (e.g., Peru, Mexico and California margins), moderately to strongly restricted basins (e.g., Cariaco Basin, Black Sea), or intermittently anoxic fjords and inlets (e.g., Framvaren Fjord, Saanich Inlet). No location studied to date has a record of modern V hyper-enrichments, including the Framvaren Fjord (whose water column H2S approaches 10 mM). In the ORM record, comparison of V concentration and Mo isotope data (along with supporting evidence like Mo/U ratios and V–TOC correlations) indicate that high Fe-Mn particulate fluxes to weakly euxinic sediments as well as large stratified basins with strong bottom water euxinia (and continual seawater replenishment based on high trace metal enrichments) or weak bottom water euxinia with high organic matter enrichments but slow clastic sediment input are associated with V hyper-enrichments. However, such environments are not well-represented in the small number of anoxic environments of the modern oceans [65]. For example, epeiric seas are common in the ancient sedimentary archive but are poorly represented on the modern Earth. Modern anoxic basins do share some features with epicontinental seaways. Basin restriction plays a substantial role in the buildup of H2S to produce strong euxinia and record seawater δ98Mo in both epeiric seaways and modern anoxic basins. However, V hyper-enrichments in sediments will be inhibited if there is inadequate replenishment from the seawater source or high clastic sedimentation rates, forcing V enrichments to low levels.

6. Conclusions

A recent study suggested that V hyper-enriched sediments (V > 500 μg/g) could indicate ORM deposition in hyper-sulfidic bottom waters (≥10 mM), based on an evaluation of the Devonian Bakken Formation shales in the Williston Basin and the absence of V hyper-enrichments in modern sediments from euxinic basins whose water columns have H2S < 10 mM [9]. The results of the present study suggest that this interpretation should be used only with thorough understanding of the depositional environment and cross-examination against other redox proxies. We do not rule out occurrence of V hyper-enrichment under hyper-sulfidic conditions, instead we argue that this is not the primary mechanism for V hyper-enrichment in ORM from most environments. Three groups of samples were observed in the compiled datasets with negative, positive and no V–δ98Mo trends, and provide insight into mechanisms for V hyper-enrichments in ancient ORMs:
  • Fe-Mn particulate shuttling providing excess adsorbed V to euxinic bottom waters facilitating removal into sediments when redoxclines deepen towards the sediment–water interface;
  • Water column stratification in moderately semi-restricted, highly productive basins with rapid water renewal from the open ocean is hypothesized to produce V hyper-enrichments under strongly euxinic conditions;
  • In a similar basin configuration to that of mechanism (2), weakly euxinic sediments may also obtain V hyper-enrichments, however, an association with organic matter and slow clastic sedimentation may amplify relative V concentrations leading to hyper-enrichments.
It is noted that these mechanisms are not presently active in modern euxinic basins to the extent inferred for ancient environments, and thus do not have a true modern basin analog. Thus, this study reveals that V hyper-enrichments in ancient ORM may have been the result of local- or basin-scale processes and hydrographic configurations, which are not found on the modern Earth.

Supplementary Materials

The following are available online at https://www.mdpi.com/2075-163X/10/12/1075/s1, Table S1: V and δ98Mo data for ancient euxinic sediments (Excel Spreadsheet “Kunert-Clarke-Kendall_Supplemental Material).

Author Contributions

Conceptualization, B.K. and A.K.; methodology, B.K.; formal analysis, A.K., J.C.; investigation, A.K.; resources, J.C.; data curation, A.K., J.C., and B.K.; writing—original draft preparation, A.K.; writing—review and editing, B.K., A.K., J.C.; visualization, A.K., J.C.; supervision, B.K.; project administration, B.K.; funding acquisition, B.K. All authors have read and agreed to the published version of the manuscript.

Funding

This research was funded by the Natural Sciences and Engineering Research Council of Canada, Discovery Grant number RGPIN-435930, as well as the Canada Research Chairs program.

Conflicts of Interest

The authors declare no conflict of interest. The funders had no role in the design of the study; in the collection, analyses, or interpretation of data; in the writing of the manuscript, or in the decision to publish the results.

Appendix A

The following geological units were measured against in-house standards listed with variation from NIST-SRM-3134 = +0.25‰ [38], and are thus corrected to the NIST-SRM-3134 scale:
  • Bern-Mo (−0.02): Ara Group [49], Niutitang Formation [44,45], Hetang Formation [43], Wufeng Formation [51], Dalong Formation [51]
  • BIG-Mo (−0.01): Scaglia Bianca [46], OAE2 Black Shale (Cape Verde Basin) [46]
  • Mary-Mo (+0.09): Sapropels 35–25 [53]
  • OU-Mo (−0.12): Yorkshire Outcrops [57], Kimmeridge Clay [59]
  • Roch-Mo1 (−0.12): Oatka Creek Formation [54]

References

  1. Scott, C.; Lyons, T.W. Contrasting molybdenum cycling and isotopic properties in euxinic versus non-euxinic sediments and sedimentary rocks: Refining the paleoproxies. Chem. Geol. 2012, 324–325, 19–27. [Google Scholar] [CrossRef]
  2. Crusius, J.; Calvert, S.; Pedersen, T.; Sage, D. Rhenium and molybdenum enrichments in sediments as indicators of oxic, suboxic and sulfidic conditions of deposition. Earth Planet. Sci. Lett. 1996, 145, 65–78. [Google Scholar] [CrossRef]
  3. Lyons, T.W.; Severmann, S. A critical look at iron paleoredox proxies: New insights from modern euxinic marine basins. Geochim. Cosmochim. Acta 2006, 70, 5698–5722. [Google Scholar] [CrossRef]
  4. Raiswell, R.; Hardisty, D.S.; Lyons, T.W.; Canfield, D.E.; Owens, J.D.; Planavsky, N.J.; Poulton, S.W.; Reinhard, C.T. The iron paleoredox proxies: A guide to the pitfalls, problems and proper practice. Am. J. Sci. 2018, 318, 491–526. [Google Scholar] [CrossRef] [Green Version]
  5. Turgeon, S.; Brumsack, H.-J. Anoxic vs dysoxic events reflected in sediment geochemistry during the Cenomanian–Turonian Boundary Event (Cretaceous) in the Umbria–Marche Basin of central Italy. Chem. Geol. 2006, 234, 321–339. [Google Scholar] [CrossRef]
  6. Algeo, T.J.; Tribovillard, N. Environmental analysis of paleoceanographic systems based on molybdenum–uranium covariation. Chem. Geol. 2009, 268, 211–225. [Google Scholar] [CrossRef]
  7. Kendall, B.; Dahl, T.W.; Anbar, A.D. Good Golly, Why Moly? The Stable Isotope Geochemistry of Molybdenum. Rev. Min. Geochem. 2017, 82, 683–732. [Google Scholar] [CrossRef]
  8. Andersen, M.B.; Stirling, C.H.; Weyer, S. Uranium Isotope Fractionation. Rev. Min. Geochem. 2017, 82, 799–850. [Google Scholar] [CrossRef]
  9. Scott, C.; Slack, J.F.; Kelley, K.D. The hyper-enrichment of V and Zn in black shales of the Late Devonian-Early Mississippian Bakken Formation (USA). Chem. Geol. 2017, 452, 24–33. [Google Scholar] [CrossRef] [Green Version]
  10. McLennan, S.M. Relationship between the trace element composition of sedimentary rocks and upper continental crust. Geochem. Geophys. Geosys. 2001, 2, 24. [Google Scholar] [CrossRef]
  11. Taylor, S.R.; McLennan, S.M. The Continental Crust: Its Composition and Evolution; Blackwell: Hoboken, NJ, USA, 1985. [Google Scholar]
  12. Tribovillard, N.; Algeo, T.J.; Lyons, T.; Riboulleau, A. Trace metals as paleoredox and paleoproductivity proxies: An update. Chem. Geol. 2006, 232, 12–32. [Google Scholar] [CrossRef]
  13. Schlesinger, W.H.; Klein, E.M.; Vengosh, A. Global biogeochemical cycle of vanadium. Proc. Natl. Acad. Sci. USA 2017, 114, E11092–E11100. [Google Scholar] [CrossRef] [Green Version]
  14. Emerson, S.R.; Huested, S.S. Ocean anoxia and the concentrations of molybdenum and vanadium in seawater. Mar. Chem. 1991, 34, 177–196. [Google Scholar] [CrossRef]
  15. Whitfield, M.; Turner, D.R. Water-rock partition coefficients and the composition of seawater and river water. Nature 1979, 278, 132–137. [Google Scholar] [CrossRef]
  16. Sarmiento, J.L.; Gruber, N. Ocean Biogeochemical Dynamics; Princeton University Press: Princeton, NJ, USA, 2006. [Google Scholar]
  17. Gustafsson, J.P. Vanadium geochemistry in the biogeosphere—speciation, solid-solution interactions, and ecotoxicity. Appl. Geochem. 2019, 102, 1–25. [Google Scholar] [CrossRef]
  18. Tyson, R.V.; Pearson, T.H. Modern and ancient continental shelf anoxia: An overview. In Modern and Ancient Shelf Anoxia, Geological Society Special Publication 58; Geological Society London: London, UK, 1991; pp. 1–26. [Google Scholar]
  19. Wanty, R.B.; Goldhaber, M.B. Thermodynamics and kinetics of reactions involving vanadium in natural systems: Accumulation of vanadium in sedimentary rocks. Geochim. Cosmochim. Acta 1992, 56, 1471–1483. [Google Scholar] [CrossRef]
  20. Trefry, J.H.; Metz, S. Role of hydrothermal precipitates in the geochemical cycling of vanadium. Nature 1989, 342, 531–533. [Google Scholar] [CrossRef]
  21. Wehrli, B.; Stumm, W. Vanadyl in natural waters: Adsorption and hydrolysis promote oxygenation. Geochim. Cosmochim. Acta 1989, 53, 69–77. [Google Scholar] [CrossRef]
  22. Breit, G.N.; Wanty, R.B. Vanadium accumulation in carbonaceous rocks: A review of geochemical controls during deposition and diagenesis. Chem. Geol. 1991, 91, 83–97. [Google Scholar] [CrossRef]
  23. Algeo, T.J.; Li, C. Redox classification and calibration of redox thresholds in sedimentary systems. Geochim. Cosmochim. Acta 2020, 287, 8–26. [Google Scholar] [CrossRef]
  24. Schwertmann, U.; Pfab, G. Structural vanadium in sythnetic goethite. Geochim. Cosmochim. Acta 1994, 58, 4349–4352. [Google Scholar] [CrossRef]
  25. Schwertmann, U.; Pfab, G. Structural vanadium and chromium in lateritic iron oxides: Genetic implications. Geochim. Cosmochim. Acta 1996, 60, 4279–4283. [Google Scholar] [CrossRef]
  26. Algeo, T.J.; Maynard, J.B. Trace-element behaviour and redox facies in core shales of Upper Pennsylvanian Kansas-type cyclothems. Chem. Geol. 2004, 206, 289–318. [Google Scholar] [CrossRef]
  27. Ostrander, C.M.; Sahoo, S.K.; Kendall, B.; Jiang, G.; Planavsky, N.J.; Lyons, T.W.; Nielsen, S.G.; Owens, J.D.; Gordon, G.W.; Romaniello, S.J.; et al. Multiple negative molybdenum isotope excursions in the Doushantuo Formation (South China) fingerprint complex redox-related processes in the Ediacaran Nanhua Basin. Geochim. Cosmochim. Acta 2019, 261, 191–209. [Google Scholar] [CrossRef]
  28. Kendall, B.; Wang, J.; Zheng, W.; Romaniello, S.J.; Over, D.J.; Bennett, Y.; Xing, L.; Kunert, A.; Boyes, C.; Liu, J. Inverse correlation between the molybdenum and uranium isotope compositions of Upper Devonian black shales caused by changes in local depositional conditions rather than global ocean redox variations. Geochim. Cosmochim. Acta 2020, 287, 141–164. [Google Scholar] [CrossRef]
  29. Erickson, B.E.; Helz, G.R. Molybdenum(VI) speciation in sulfidic waters: Stability and lability of thiomolybdates. Geochim. Cosmochim. Acta 2000, 64, 1149–1158. [Google Scholar] [CrossRef]
  30. Vorlicek, T.P.; Kahn, M.D.; Kasuya, Y.; Helz, G.R. Capture of molybdenum in pyrite-forming sediments: Role of ligand-induced reduction by polysulfides. Geochim. Cosmochim. Acta 2004, 68, 547–556. [Google Scholar] [CrossRef]
  31. Dahl, T.W.; Chappaz, A.; Fitts, J.P.; Lyons, T.W. Molybdenum reduction in a sulfidic lake: Evidence from X-ray absorption fine-structure spectroscopy and implications for the Mo paleoproxy. Geochim. Cosmochim. Acta 2013, 103, 213–231. [Google Scholar] [CrossRef]
  32. King, E.K.; Perakis, S.S.; Pett-Ridge, J.C. Molybdenum isotope fractionation during adsorption to organic matter. Geochim. Cosmochim. Acta 2018, 222, 584–598. [Google Scholar] [CrossRef]
  33. Nägler, T.F.; Anbar, A.D.; Archer, C.; Goldberg, T.; Gordon, G.W.; Greber, N.D.; Siebert, C.; Sohrin, Y.; Vance, D. Proposal for an international molybdenum isotope measurement standard and data representation. Geostand. Geoanalytical Res. 2014, 38, 149–151. [Google Scholar] [CrossRef] [Green Version]
  34. Siebert, C.; Nägler, T.F.; von Blanckenburg, F.; Kramers, J.D. Molybdenum isotope records as a potential new proxy for paleoceanography. Earth Planet. Sci. Lett. 2003, 211, 159–171. [Google Scholar] [CrossRef]
  35. Poulson Brucker, R.L.; McManus, J.; Severmann, S.; Berelson, W.M. Molybdenum behaviour during early diagenesis: Insights from Mo isotopes. Geochem. Geophys. Geosys. 2009, 10, 25. [Google Scholar] [CrossRef] [Green Version]
  36. Goldberg, T.; Archer, C.; Vance, D.; Poulton, S.W. Mo isotope fractionation during adsorption to Fe (oxyhydr)oxides. Geochim. Cosmochim. Acta 2009, 73, 6502–6516. [Google Scholar] [CrossRef]
  37. Tossell, J.A. Calculating the partitioning of the isotopes of Mo between oxidic and sulfidic species in aqueous solution. Geochim. Cosmochim. Acta 2005, 69, 2981–2993. [Google Scholar] [CrossRef]
  38. Goldberg, T.; Gordon, G.; Izon, G.; Archer, C.; Pearce, C.R.; McManus, J.; Anbar, A.D.; Rehkämper, M. Resolution of inter-laboratory discrepancies in Mo isotope data: An intercalibration. J. Anal. At. Spectrom. 2013, 28, 724–735. [Google Scholar] [CrossRef]
  39. Archer, C.; Vance, D. The isotopic signature of the global riverine molybdenum flux and anoxia in the ancient oceans. Nature Geosci. 2008, 1, 597–600. [Google Scholar] [CrossRef]
  40. King, E.K.; Pett-Ridge, J.C. Reassessing the dissolved molybdenum isotopic composition of ocean inputs: The effect of chemical weathering and groundwater. Geology 2018, 46, 955–958. [Google Scholar] [CrossRef]
  41. Neely, R.A.; Gislason, S.R.; Ólafsson, M.; McCoy-West, A.J.; Pearce, C.R.; Burton, K.W. Molybdenum isotope behaviour in groundwaters and terrestrial hydrothermal systems, Iceland. Earth Planet. Sci. Lett. 2018, 486, 108–118. [Google Scholar] [CrossRef] [Green Version]
  42. Sahoo, S.K.; Planavsky, N.J.; Kendall, B.; Wang, X.; Shi, X.; Scott, C.; Anbar, A.D.; Lyons, T.W.; Jiang, G. Ocean oxygenation in the wake of the Marinoan glaciation. Nature 2012, 489, 546–549. [Google Scholar] [CrossRef]
  43. Cheng, M.; Li, C.; Zhou, L.; Feng, L.; Algeo, T.J.; Zhang, F.; Romaniello, S.; Jin, C.; Ling, H.; Jiang, S. Transient deep-water oxygenation in the early Cambrian Nanhua Basin, South China. Geochim. Cosmochim. Acta 2017, 210, 42–58. [Google Scholar] [CrossRef]
  44. Cheng, M.; Li, C.; Zhou, L.; Algeo, T.J.; Zhang, F.; Romaniello, S.; Jin, C.-S.; Lei, L.-D.; Feng, L.-J.; Jiang, S.-Y. Marine Mo biogeochemistry in the context of dynamically euxinic mid-depth waters: A case study of the lower Cambrian Niutitang shales, South China. Geochim. Cosmochim. Acta 2016, 183, 79–93. [Google Scholar] [CrossRef] [Green Version]
  45. Xu, L.; Lehmann, B.; Mao, J.; Nägler, T.F.; Neubert, N.; Böttcher, M.E.; Escher, P. Mo isotope and trace element patterns of Lower Cambrian black shales in South China: Multi-proxy constraints on the paleoenvironment. Chem. Geol. 2012, 318–319, 45–59. [Google Scholar] [CrossRef]
  46. Westermann, S.; Vance, D.; Cameron, V.; Archer, C.; Robinson, S.A. Heterogeneous oxygenation states in the Atlantic and Tethys oceans during Oceanic Anoxic Event 2. Earth Planet Sci. Lett. 2014, 404, 178–189. [Google Scholar] [CrossRef]
  47. Kurzweil, F.; Drost, K.; Pašava, J.; Wille, M.; Taubald, H.; Schoeckle, D.; Schoenberg, R. Coupled sulfur, iron and molybdenum isotope data from black shales of the Teplá-Barrandian unit argue against deep ocean oxygenation during the Ediacaran. Geochim. Cosmochim. Acta 2015, 171, 121–142. [Google Scholar] [CrossRef]
  48. Schröder, S.; Grotzinger, J.P. Evidence for anoxia at the Ediacaran-Cambrian boundary: The record of redox-sensitive trace metals and rare earth elements in Oman. J. Geol. Soc. 2007, 164, 175–187. [Google Scholar] [CrossRef] [Green Version]
  49. Wille, M.; Nägler, T.F.; Lehmann, B.; Schröder, S.; Kramers, J.D. Hydrogen sulphide release to surface waters at the Precambrian/Cambrian boundary. Nature 2008, 453, 767–769. [Google Scholar] [CrossRef]
  50. Lu, X.; Kendall, B.; Stein, H.J.; Li, C.; Hannah, J.L.; Gordon, G.W.; Ebbestad, J.O.R. Marine redox conditions during deposition of Late Ordovician and Early Silurian organic-rich mudrocks in the Siljan ring district, central Sweden. Chem. Geol. 2017, 457, 75–94. [Google Scholar] [CrossRef]
  51. Zhou, L.; Wignall, P.B.; Su, J.; Feng, Q.; Xie, S.; Zhao, L.; Huang, J. U/Mo ratios and δ98/85Mo as local and global redox proxies during mass extinction events. Chem. Geol. 2012, 324–325, 99–107. [Google Scholar] [CrossRef]
  52. Goldberg, T.; Poulton, S.W.; Wagner, T.; Kolonic, S.F.; Rehkämper, M. Molybdenum drawdown during Cretaceous Oceanic Anoxic Event 2. Earth Planet Sci. Lett. 2016, 440, 81–91. [Google Scholar] [CrossRef] [Green Version]
  53. Scheiderich, K.; Zerkle, A.L.; Helz, G.R.; Farquhar, J.; Walker, R.J. Molybdenum and sulphur isotope ratios of early Pleistocene sapropels of ODP Hole 160-969D. PANGAEA 2010. [Google Scholar] [CrossRef]
  54. Gordon, G.W.; Lyons, T.W.; Arnold, G.L.; Roe, J.; Sageman, B.B.; Anbar, A.D. When do black shales tell molybdenum isotope tales? Geology 2009, 37, 535–538. [Google Scholar] [CrossRef]
  55. Ruvalcaba Baroni, I.; Coe, A.L.; Harding, S.M.; Papadomanolaki, N.M.; van Helmond, N.A.G.M.; van de Schootbrugge, B.; Cohen, A.S.; Slomp, C.P. Biogeochemical redox proxies in sediments from Dotternhausen during the Toarcian (Early Jurassic). PANGAEA 2018. [Google Scholar] [CrossRef]
  56. Dickson, A.J.; Gill, B.C.; Ruhl, M.; Jenkyns, H.C.; Porcelli, D.; Idiz, E.; Lyons, T.W.; van den Boorn, S.H.J.M. Molybdenum-isotope chemostratigraphy and paleoceanography of the Toarcian Oceanic Anoxic Event (Early Jurassic). Paleocean. Paleoclim. 2017, 32, 813–829. [Google Scholar] [CrossRef]
  57. Pearce, C.R.; Cohen, A.S.; Coe, A.L.; Burton, K.W. Molybdenum isotope evidence for global ocean anoxia coupled with perturbations to the carbon cycle during the Early Jurassic. Geology 2008, 36, 231–234. [Google Scholar] [CrossRef]
  58. Ruvalcaba Baroni, I.; Coe, A.L.; Harding, S.M.; Papadomanolaki, N.M.; van Helmond, N.A.G.M.; van de Schootbrugge, B.; Cohen, A.S.; Slomp, C.P. Biogeochemical redox proxies in sediments from Yorkshire during the Toarcian (Early Jurassic). PANGAEA 2018. [Google Scholar] [CrossRef]
  59. Pearce, C.R.; Coe, A.L.; Cohen, A.S. Seawater redox variations during the deposition of the Kimmeridge Clay Formation, United Kingdom (Upper Jurassic): Evidence from molybdenum isotopes and trace metal ratios. Paleocean. Paleoclim. 2010, 25, 15. [Google Scholar] [CrossRef]
  60. Andersen, M.B.; Matthews, A.; Vance, D.; Bar-Matthews, M.; Archer, C.; de Souza, G.F. A 10-fold decline in the deep Eastern Mediterranean thermohaline overturning circulation during the last interglacial period. Earth Planet Sci. Lett. 2018, 503, 58–67. [Google Scholar] [CrossRef] [Green Version]
  61. Dahl, T.W.; Hammarlund, E.U.; Anbar, A.D.; Bond, D.P.G.; Gill, B.C.; Gordon, G.W.; Knoll, A.H.; Nielsen, A.T.; Schovsbo, N.H.; Canfield, D.E. Devonian Rise in atmospheric oxygen correlated to the radiations of terrestrial plants and large predatory fish. Proc. Natl. Acad. Sci. USA 2010, 107, 17911–17915. [Google Scholar] [CrossRef] [Green Version]
  62. Algeo, T.J.; Heckel, P.H. The Late Pennsylvanian midcontinent sea of North America: A review. Palaeogeog. Palaeoclim. Palaeoecol. 2008, 268, 205–221. [Google Scholar] [CrossRef]
  63. Bura-Nakić, E.; Andersen, M.B.; Archer, C.; de Souza, G.F.; Marguš, M.; Vance, D. Coupled Mo-U abundances and isotopes in a small marine euxinic basin: Constraints on processes in euxinic basins. Geochim. Cosmochim. Acta 2018, 222, 212–229. [Google Scholar] [CrossRef] [Green Version]
  64. Algeo, T.J.; Lyons, T.W. Mo–total organic carbon covariation in modern anoxic marine environments: Implications for analysis of paleoredox and paleohydrographic conditions. Paleoceanogr. Paleoclimatol. 2006, 21, 23. [Google Scholar] [CrossRef]
  65. Smith, M.G.; Bustin, R.M. Production and preservation of organic matter during deposition of the Bakken Formation (Late Devonian and Early Mississippian), Williston Basin. Palaeogeog. Palaeoclim. Palaeoecol. 1998, 142, 185–200. [Google Scholar] [CrossRef]
  66. Reinhard, C.T.; Planavsky, N.J.; Robbins, L.J.; Partin, C.A.; Gill, B.C.; Lalonde, S.V.; Bekker, A.; Konhauser, K.O.; Lyons, T.W. Proterozoic ocean redox and biogeochemical stasis. Proc. Natl. Acad. Sci. USA 2013, 110, 5357–5362. [Google Scholar] [CrossRef] [Green Version]
  67. Partin, C.A.; Bekker, A.; Planavsky, N.J.; Scott, C.T.; Gill, B.C.; Li, C.; Podkovyrov, V.; Maslov, A.; Konhauser, K.O.; Lalonde, S.V.; et al. Large-scale fluctuations in Precambrian atmospheric and oceanic oxygen levels from the record of U in shales. Earth Planet Sci. Lett. 2013, 369–370, 284–293. [Google Scholar] [CrossRef]
  68. Sheen, A.I.; Kendall, B.; Reinhard, C.T.; Creaser, R.A.; Lyons, T.W.; Bekker, A.; Poulton, S.W.; Anbar, A.D. A model for the oceanic mass balance of rhenium and implications for the extent of Proterozoic ocean anoxia. Geochim. Cosmochim. Acta 2018, 227, 75–95. [Google Scholar] [CrossRef] [Green Version]
  69. Kunert, A. Reconstruction of Local and Global Marine Paleoredox Conditions for the Northeast-Panthalassan (British Columbia, Canada) Expression of the Toarcian Oceanic Anoxic Event Using a Multi-Proxy Approach. Master’s Thesis, University of Waterloo, Waterloo, ON, Canada, 2020. [Google Scholar]
  70. Holmden, C.; Creaser, R.A.; Muehlenbachs, K.; Leslie, S.A.; Bergström, S.M. Isotopic evidence for geochemical decoupling between ancient epeiric seas and bordering oceans: Implications for secular curves. Geology 1998, 26, 567–570. [Google Scholar] [CrossRef]
  71. Shiller, A.M.; Boyle, E.A. Dissolved vanadium in rivers and estuaries. Earth Planet. Sci. Lett. 1987, 86, 214–224. [Google Scholar] [CrossRef]
  72. Wright, M.T.; Stollenwerk, K.G.; Belitz, K. Assessing the solubility of controls on vanadium in groundwater, northeastern San Joaquin Valley, CA. Appl. Geochem. 2014, 48, 41–52. [Google Scholar] [CrossRef]
  73. Huang, J.-H.; Huang, F.; Evans, L.; Glasauer, S. Vanadium: Global (bio)geochemistry. Chem. Geol. 2015, 417, 68–89. [Google Scholar] [CrossRef]
  74. Wright, M.T.; Belitz, K. Factors controlling the regional distribution of vanadium in groundwater. Groundwater 2010, 48, 515–525. [Google Scholar] [CrossRef]
Figure 1. δ98Mo values in euxinic sediments with and without V hyper-enrichments. (A) All compiled euxinic sample data. (B) Compiled data but with Doushantuo Formation samples removed due to unusually low δ98Mo values. Highlighted areas encompass ±1 standard deviation around the mean for each group. Dashed line indicates the selected value for plausible minimum seawater δ98Mo during the Ediacaran and Phanerozoic.
Minerals 10 01075 g001
Figure 2. Ancient organic rich mudrocks with Fe-Mn particulate activity concurrent with euxinic deposition. Dashed lines are minimum contemporary seawater δ98Mo (labeled with approximate age) and grey shading is the range of seawater δ98Mo for the units depicted. Solid vertical line is modern seawater δ98Mo (~2.34‰) and solid horizontal line is V = 500 μg/g (hyper-enrichment threshold).
Minerals 10 01075 g002
Figure 3. Ancient organic rich mudrocks deposited in semi-restricted, stratified basins. Dashed lines are minimum contemporary seawater δ98Mo (labeled with approximate age) and grey shading is the range of seawater δ98Mo for the units depicted. Solid vertical line is modern seawater δ98Mo (~2.34‰) and solid horizontal line is V = 500 μg/g (hyper-enrichment threshold).
Minerals 10 01075 g003
Figure 4. Ancient organic rich mudrocks without V hyper-enrichments. Dashed lines are minimum contemporary seawater δ98Mo (labeled with approximate age) and grey shading is the range of seawater δ98Mo for the units depicted. Solid vertical line is modern seawater δ98Mo (~2.34‰) and solid horizontal line is V = 500 μg/g (hyper-enrichment threshold).
Minerals 10 01075 g004
Table 1. Compilation of vanadium (V) and molybdenum isotope (δ98Mo) data for Ediacaran and Phanerozoic euxinic organic rich mudrocks.
Geological UnitLocationSection (n)Characteristics (in Ref.)Age (Ma)V (range) μg/gδ98Mo (range)Ref.
Negative V–δ98Mo Trend804 (44–15271)0.44 (−1.98–2.24)
Doushantuo FormationSouth ChinaRongxi (7)Mn Particulate Shuttle632454 (137–1066)0.54 (−0.02–1.32)[27]
Taoying (8)Mn Particulate Shuttle1175 (119–6096)−0.91 (−1.98–0.78)
Wuhe (46)Mn Particulate Shuttle671 (44–15271)0.23 (−1.50–2.24)
Yuanjia (7)Mn Particulate Shuttle1775 (336–6417)−0.45 (−1.49–0.54)
Hetang FormationSouth ChinaLantian (8)Particulate Shuttle535–521461 (155–1726)1.42 (0.11–1.76)[43]
Niutitang FormationSouth ChinaYangjiaping (4)Weak Euxinia, Peripheral Particulate Activity529–514592 (228–1005)1.20 (0.87–1.49)[44]
Maluhe (2)521364 (310–417)1.62 (1.55–1.68)[45]
Dazhuliushui (1) 3201.56
Kettle Point FormationOntario (Canada)Chatham Unit 4 (18)Particulate Shuttle,
Brackish, Low Sea Level
3721044 (288–1912)0.88 (0.55–1.31)[28]
OAE2 Black ShaleCape Verde BasinDSDP Site 367 (6)Particulate Shuttle 716 (466–1300)0.83 (0.15–1.15)[46]
Positive V–δ98Mo Trend750 (81–2310)0.74 (−0.40–2.35)
Blovice ComplexPilsen (Czechia)HRM-3 (14)Low T Hydrothermal560–535926 (410–2020)0.82 (0.57–1.20)[47]
KA-5 (9)Low T Hydrothermal759 (331–1223)0.48 (0.12–0.83)
Ara GroupCentral OmanMM NW-7 (5)Salinity Stratification550–540477 (130–689)1.01 (0.04–1.29)[48,49] 1
Fjäcka ShaleCentral SwedenSolberga #1 (6)Persistent Euxinia448457 (219–720)0.62 (0.42–0.78)[50]
Stumsnäs #1 (10)Persistent Euxinia 658 (347–1175)0.91 (0.58–1.28)
Dalong FormationSouth ChinaShangsi (5)Well-ventilated2521069 (496–2227)1.69 (0.31–2.35)[51]
Scaglia Bianca FormationCentral ItalyLa Contessa (9)Weak Particulate Shuttle 531 (310–860)0.30 (0.14–0.71)[46]
OAE2 Black ShaleMoroccan ShelfTarfaya S57 (4)Upwelling Zone94381 (81–517)0.00 (−0.40–0.63)[52]
Sapropels 35–25Mediterranean BasinODP Hole 969D (15)Upwelling Zone, Weak Euxinia1.88–1.44975 (206–2310)0.78 (0.15–1.93)[53]
No V Hyper-Enrichments187 (56–548)1.45 (−0.09–2.42)
Ara GroupCentral OmanALNR-1 (3)Salinity Stratification550–540233 (208–253)1.37 (0.99–1.61)[48,49] 1
Wufeng FormationSouth ChinaWangjiawan (3)Slow sedimentation444133 (127–145)1.48 (−0.09–2.42)[51]
Oatka Creek FormationNew York (US)Akzo #9455 (4)Persistent Euxinia388334 (277–421)1.68 (1.57–1.77)[54]
Kettle Point FormationOntario (Canada)Chatham Units 1–3 (9)Brackish + Marine, High Sea Level (Units 1–2), Epeiric Sea372195 (113–548)1.42 (0.97–2.02)[28]
Posidonia ShaleSouth GermanyDotternhausen (8)Epeiric Sea183221 (124–336)0.76 (0.65–0.87)[55,56] 2
Whitby MudstoneUnited KingdomYorkshire Outcrops (27)Epeiric Sea183187 (147–242)1.27 (0.69–2.02)[57,58] 3
Kimmeridge ClayUnited KingdomDorset Outcrops (24)Weak Particulate Shuttle155–148119 (56–178)1.69 (1.00–2.34)[59]
Sapropel S5Mediterranean BasinODP Hole 967C (9)Persistent Euxinic (↑H2S with time), Redox Stratification0.13–0.12332 (228–397)2.02 (1.31–2.30)[60]
1 V from [48], 1δ98Mo from [49]; 2 V from [55], δ98Mo from [56]; 3 V from [58], δ98Mo from [57].
Publisher’s Note: MDPI stays neutral with regard to jurisdictional claims in published maps and institutional affiliations.

