Article

Function of Interface Deposition of Calcium Sulfate in Pressure Acid Leaching of Black Shale-Hosted Vanadium

1
School of Resource and Environmental Engineering, Wuhan University of Science and Technology, Wuhan 430081, China
2
State Environmental Protection Key Laboratory of Mineral Metallurgical Resources Utilization and Pollution Control, Wuhan University of Science and Technology, Wuhan 430081, China
*
Authors to whom correspondence should be addressed.
Minerals 2020, 10(11), 952; https://doi.org/10.3390/min10110952
Submission received: 15 September 2020 / Revised: 17 October 2020 / Accepted: 21 October 2020 / Published: 26 October 2020
(This article belongs to the Section Mineral Processing and Extractive Metallurgy)

Abstract

:
During pressure acid leaching process of black shale-hosted vanadium, increasing the reaction interface of muscovite dissolution can enhance the vanadium release. In this paper, calcium sulfate (CaSO4) deposition behavior and its effect on muscovite under K2SO4 assistance were focused on for demonstrating the function of CaSO4 on vanadium leaching from the black shale. Results showed that as K2SO4 mediated, the apparent activation energy of vanadium leaching and the apparent reaction order of sulfuric acid decreased from 24.37 kJ/mol to 16.63 kJ/mol and 2.7 to 1.9, respectively. The leaching rate and dependence on pH value were modified. The vanadium leaching acceleration owed to CaSO4 deposition on muscovite in the black shale. The ion absorption stimulations found that Ca2+ is confirmed to be easily absorbed on the six-membered ring cavity of silicon-oxygen tetrahedrons in muscovite structure prior to K+ and Na+. Meanwhile, SO42− provides two oxygen atoms to bond with Ca2+ absorbed on muscovite (001) surface. The continuous absorption and bonding create CaSO4 deposition on muscovite (001) surface which also involves the load transmitting. The stress load transmitting correlates to pore formation in muscovite particles. It was proved that massive micropores initiated and proliferated in the existing pores under K2SO4 assistance. The porosity caused by CaSO4 deposition greatly increased the reaction interface of muscovite dissolution and accelerate internal diffusion of H+ to the reaction interface, which can significantly weaken the vanadium leaching dependence on acid.

1. Introduction

Facing the increasing market demand for vanadium products and environmental problems [1,2,3,4], the efficient and sustainable utilization of vanadium-bearing mineral resources is increasingly necessary and urgent for vanadium industry. Vanadium-bearing black shale has been identified to have enrichments of vanadium, which is distributed in many provinces of China [5,6]. There are vanadium enrichments in black shale elsewhere in the world include United states, Australia, Argentina, and Kazakhstan [7]. The black shale-hosted vanadium deposits have average ore grades that range from 0.1 to 1 weight percent vanadium. In primary black shale, the vanadium can exist mostly as low-valence V3+ that replaces Al3+ isomorphically in mica or illite lattice [8], which poses a difficulty for vanadium extraction in a green and high-efficiency way.
At present, the roasting–leaching process has become the mainstream technology of vanadium extraction from the black shale in industrial production. It is essential of roasting to activate mica structure and remove the acid-consuming minerals in the black shale, such as pyrite and calcite [9]. Gravity or flotation separation can be combined as pretreatment way to improve the vanadium grade in the black shale [10,11,12,13]. In recent years, the direct acid leaching process, characterized by short flow, low energy consumption, easy control of technology conditions and low production cost, is getting increased attention, which has resulted in the development of the atmospheric pressure acid leaching process and the oxygen pressure acid leaching process. The relevant research is always centered on how to disintegrate the crystal lattice of muscovite in a green and high-efficiency way during direct acid leaching.
Muscovite identified as vanadium accumulator is the most common mica minerals in the black shale and weathered to form illite. Muscovite structure undergoes aeolotropic dissolution in acidic solution because of the obvious difference in the response of (001) surface and (hk0) surface to hydrogen ions(H+) [14,15,16]. The (001) surface is the leading reaction interface between muscovite and acidic solution, but due to its high energy requirement for atomic bond fracture, the (001) surface dissolves slowly. Breaking down the (001) surface will be critical to muscovite dissolution.
For the dioctahedral structure possessed by muscovite, the (001) surface is electronegative and can absorb H+ to form hydroxy groups with interfacial oxygen after dissolution of interlayer potassium ions in muscovite. The interfacial oxygen atoms of the (001) surface separate from muscovite lattice mainly because adjacent hydroxy groups combine with each other to form water molecule in acidic solution [17]. It is for this reason that the interfacial Al and Si atoms become charge unbalanced, making the (001) surface in an unstable state. Pressure acid leaching is just based on relatively higher temperature to reinforce this structural changes of the (001) surface causing mica dissolution.
However, numerous H+ are inevitable during pressure acid leaching process because of limited reaction interface of muscovite dissolution. The conventional auxiliaries, such as fluoride, chlorinated oxidizers, or fluosilicic acid can prompt vanadium leaching through participating in muscovite dissolution reaction. Differently, the sulfate is an intermediary to induce the common ion effect, thus causing a chain reaction between CaSO4 and CaSO4·2H2O. At the temperature below 100 °C, the common ion effect of K2SO4 produces the first conversion of CaSO4(aq)→CaSO4·2H2O(s); Once the temperature beyond 100 °C, the second conversion of CaSO4·2H2O(s)→CaSO4(s) becomes a spontaneous action [18]. CaSO4 produced by the dissolution of calcite or dolomite in the black shale is usually taken as useless product. As K2SO4 mediates in pressure acid leaching process, CaSO4 can be utilized through the conversions to strengthen vanadium leaching from the black shale, which should be attributed to the deposition of CaSO4 on muscovite particles [19]. However, to date, it is a pity that the deposition essence of CaSO4 and its function on muscovite dissolution have not been reported in details.
Therefore, in this work, the vanadium leaching kinetics of black shale, variation of the surface environment and pore structure of muscovite particles during pressure acid leaching of black shale were studied under K2SO4 assistance, and the absorption ways of Ca2+ and SO42− on muscovite (001) surface was simulated basing on first-principles density-functional theory (DFT), aiming at revealing the deposition process of CaSO4 and its promotion on vanadium quick release from muscovite. This research will reveal a different mechanism of strengthening vanadium release during pressure acid leaching of black shale.

2. Materials and Methods

The black shale used in this study comes from Hubei province, South China. The ICP-AES (IRIS Advantage Radial, USA) results and the SEM-EDS patterns of the black shale are shown in Table 1 and Figure 1. The black shale has a vanadium grade of 0.72% and a high calcium content of 5.82%. The vanadium valences in the black shale were analyzed by potentiometric titration and are summarized in Table 2. According to Figure 1 and Table 2, 75% of vanadium should exist mostly as low-valence V3+ that replaces Al3+ isomorphically in muscovite. Vanadium-rich muscovite in the black shale is represented by muscovite hereinafter.
Each leaching experiment is carried out in a zalium reaction vessel with a volume of 2 L and adopts PID temperature controller with a deviation of ±3 °C. The test ore samples are obtained after crushed and ground to 85% passing 74 microns. The sulfuric acid solution is chosen as leaching agent and prepared with deionized water at molarity from 1 to 4 M respectively. Then, 150 g of the test ore samples and the sulfuric acid solution are fed into the reaction vessel at the liquid to solid ratio of 1.5 mL/g and then the sulfate is added in. After sealing the reaction vessel, the 1.0 Mpa oxygen is inlet and it starts to heat up. The oxygen purity is 98%. The leaching temperature should be reached in 45 min by adjusting heater voltage. When the leaching temperature reaches the set value, the timing is started. After experiment, the leaching residues and leachate can be separated by vacuum filter. The experiments are replicated for three times. The dynamic leaching experiments are carried out within a time period, from 1 h to 5 h.
The morphology of leaching residues is observed by scanning electron microscope (JSM-IT300, Jeol, Tokyo, Japan). The pore structure of leaching residues is tested by automatic mercury porosimeter (AutoPore IV 9500, Micromeritics, Norcross, GA, USA) and automatic surface area and pore-size analyzer (ASAP 2020, Micromeritics, Norcross, GA, USA). The pore volume and pore surface area are derived via integration of the mercury injection and nitrogen adsorption curves. The surface chemical state of Al2p in the leaching residues was detected by X-ray photoelectron spectrometer (Multilab 2000, Thermo Fisher Scientific, Waltham, MA, USA). Vanadium concentration in leachate is measured by chemical titration with ferrous ammonium sulfate. The vanadium leaching efficiency is taken as index and calculated using Equation (1).
α = C L η M 100
where α is the vanadium leaching efficiency (%), η is the vanadium grade in black shale (%), C is the vanadium concentration in leachate (g/L), L is the leachate volume, and M is the feeding mass of black shale (g).
All periodic DFT calculations are performed with the Vienna ab initio simulation package (VASP) [20,21]. The exchange-correlation energy is approximatively treated by the generalized gradient approximation (GGA) with the function of PBE-version [22,23], and the electron–ion interactions are described by the projector augmented wave (PAW) method [24,25]. A kinetic energy cutoff value of 800 eV and a 3 × 3 × 1 mesh of Γ-point-centered k-points is adopted in the calculation of the muscovite (001) surface. The geometry optimization is convergent when the total energy change and the forces is less than 10-5 eV and 0.05 eV/Å, respectively. Moreover, the van der Waals force correction and a dipole correction along the z-direction are applied in all calculations.
The initial crystal structure of muscovite is taken from the optimized geometrical model with a = 5.29 Å, b = 9.12 Å, c = 20.26 Å, and β = 95.83° [26]. The muscovite (001) surface is modeled using one TOT slab with a 2 × 1 × 1 supercell. Meanwhile, a vacuum boundary of 20 Å is added to ignore the interactions between slabs. The two rows of bottom atoms are fixed for considering the influence of internal atoms on the surface reaction. Full calculations are performed without the constraint of the space group symmetry.

3. Results

3.1. Effect of Sulfate Type and Dosage on Vanadium Leaching

The three common sulfates (K2SO4, Na2SO4, and KAl(SO4)2·12H2O) were investigated and the leaching results are shown in Figure 2. The vanadium leaching efficiency can maintain at 85% after calcite in black shale was removed by hydrochloric acid in advance. The three sulfates can increase the vanadium leaching efficiency beyond 90%. The sulfates are directly related to the calcium phase in the black shale. The vanadium leaching efficiency firstly increased and then decreased with sulfate dosage. When adding K2SO4 at the dosage of 7wt.%, the vanadium leaching efficiency topped out at 95.60%. K2SO4 was chosen as assisted-leaching agent for investigating the vanadium leaching kinetics of black shale.

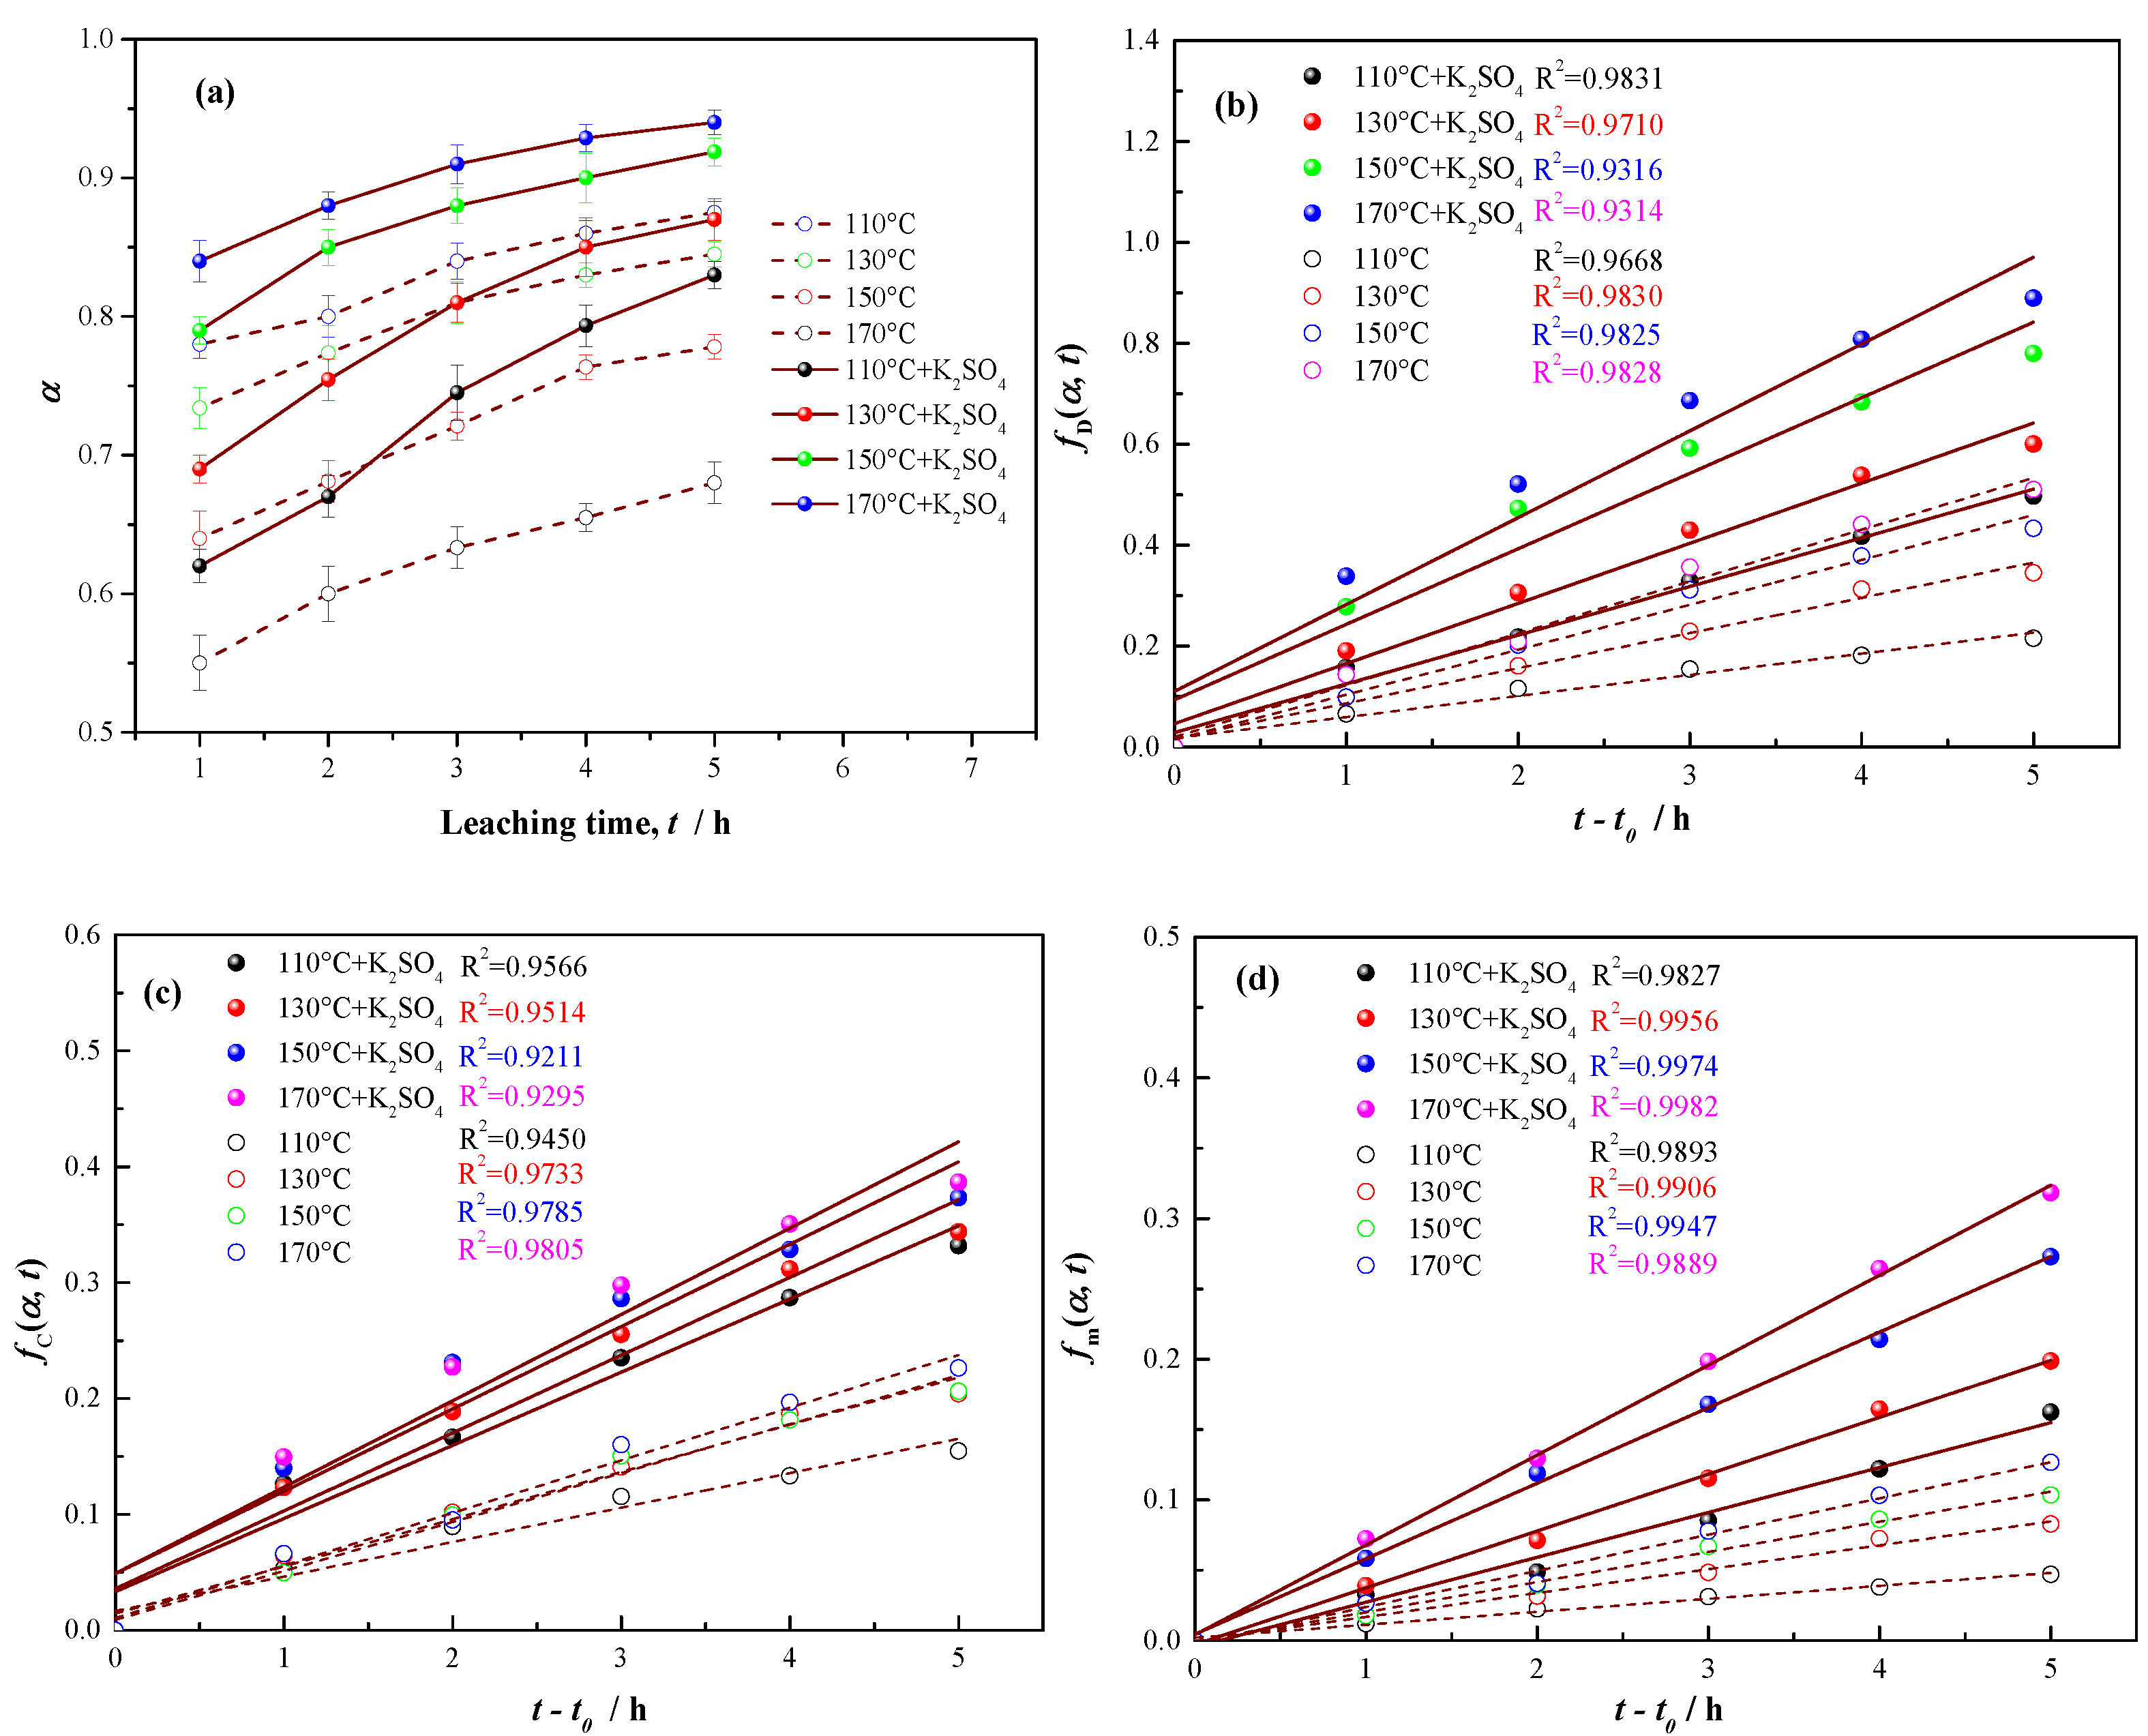
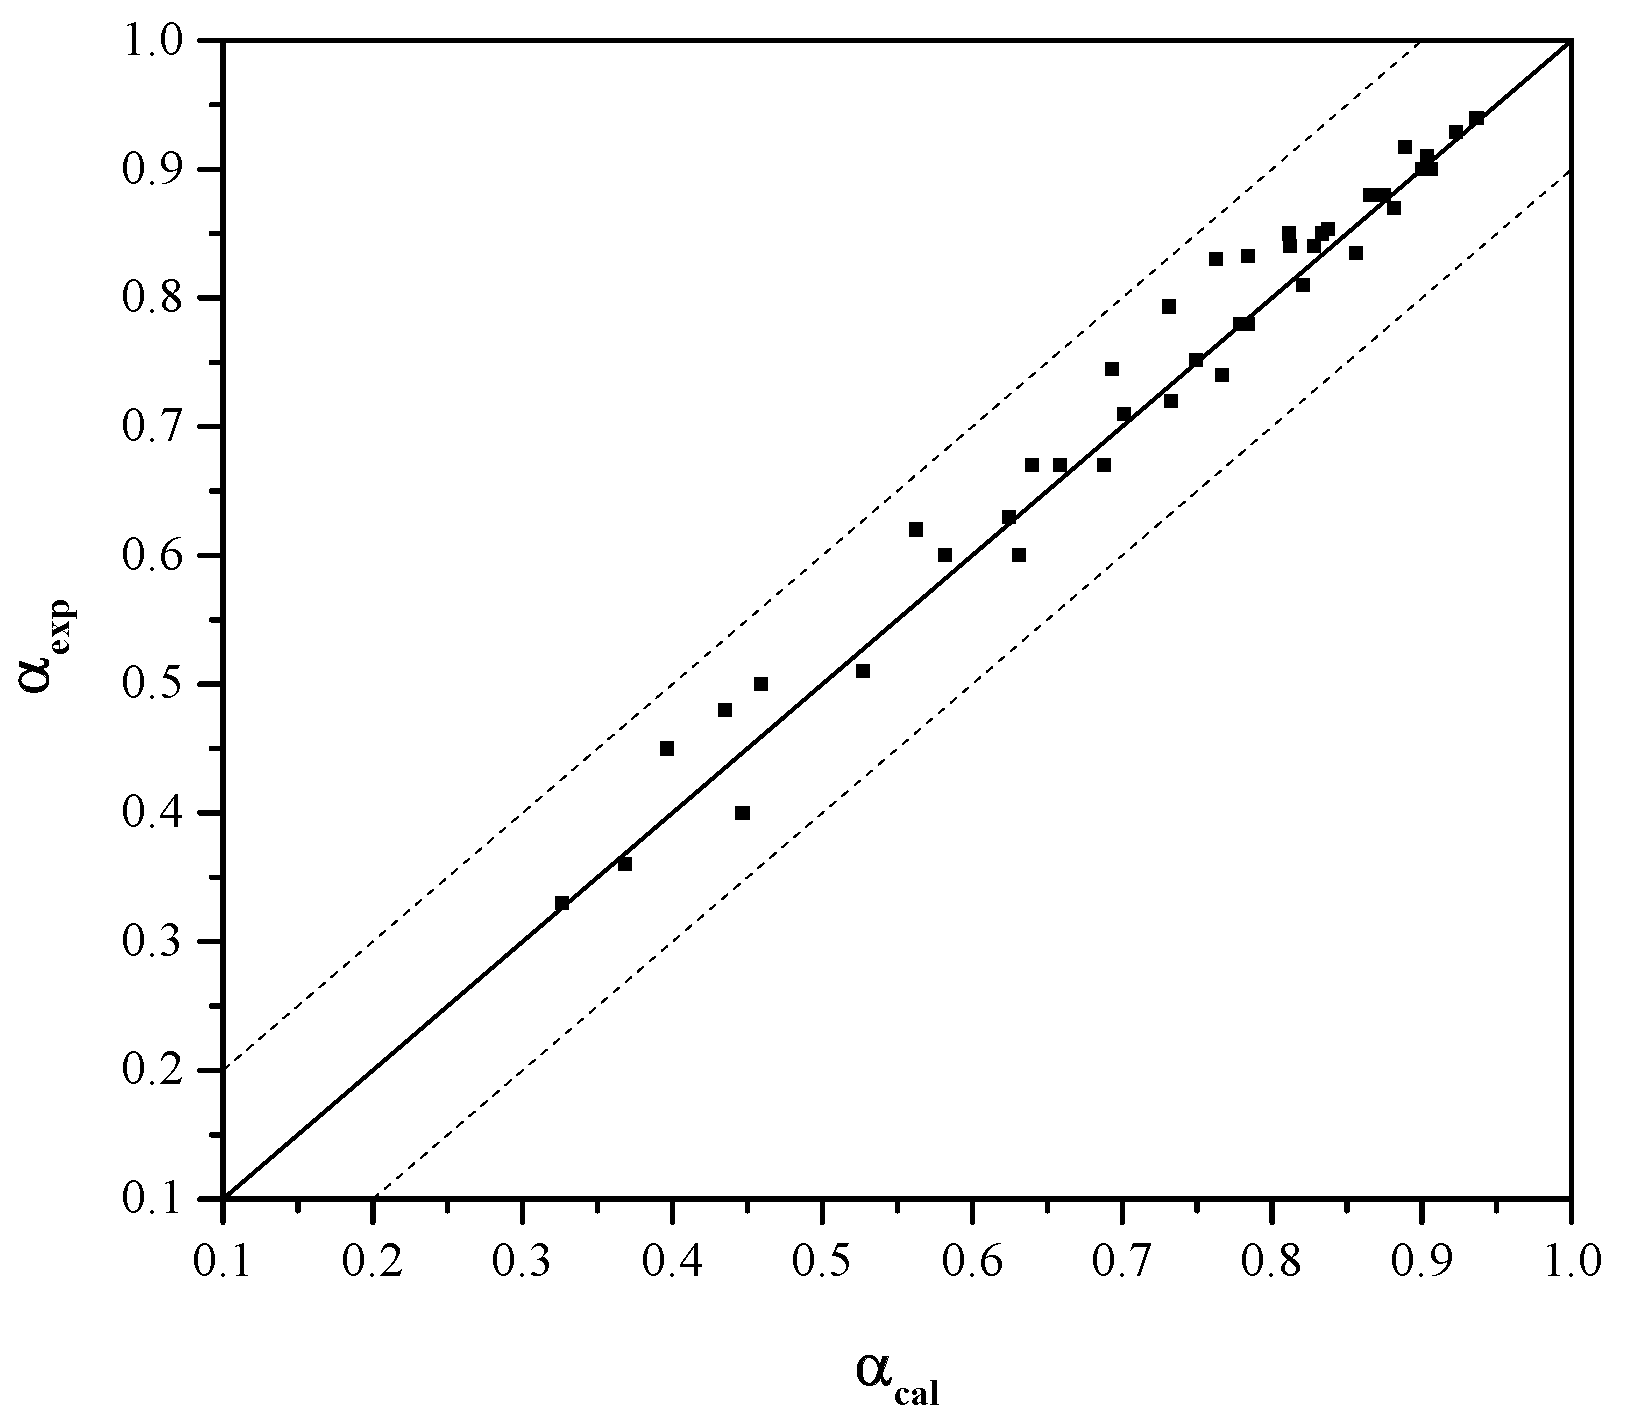
3.2. K2SO4-Assisted Pressure Acid Leaching Kinetics

Variations of the vanadium leaching efficiency over time under K2SO4 assistance are compared with no assistance in Figure 3a and Figure 5a. At the same leaching time, temperature and sulfuric acid concentration, the vanadium leaching efficiency was much higher under K2SO4 assistance than no assistance. The K2SO4-assisted pressure acid leaching of the black shale may have an advantage of vanadium leaching rate.

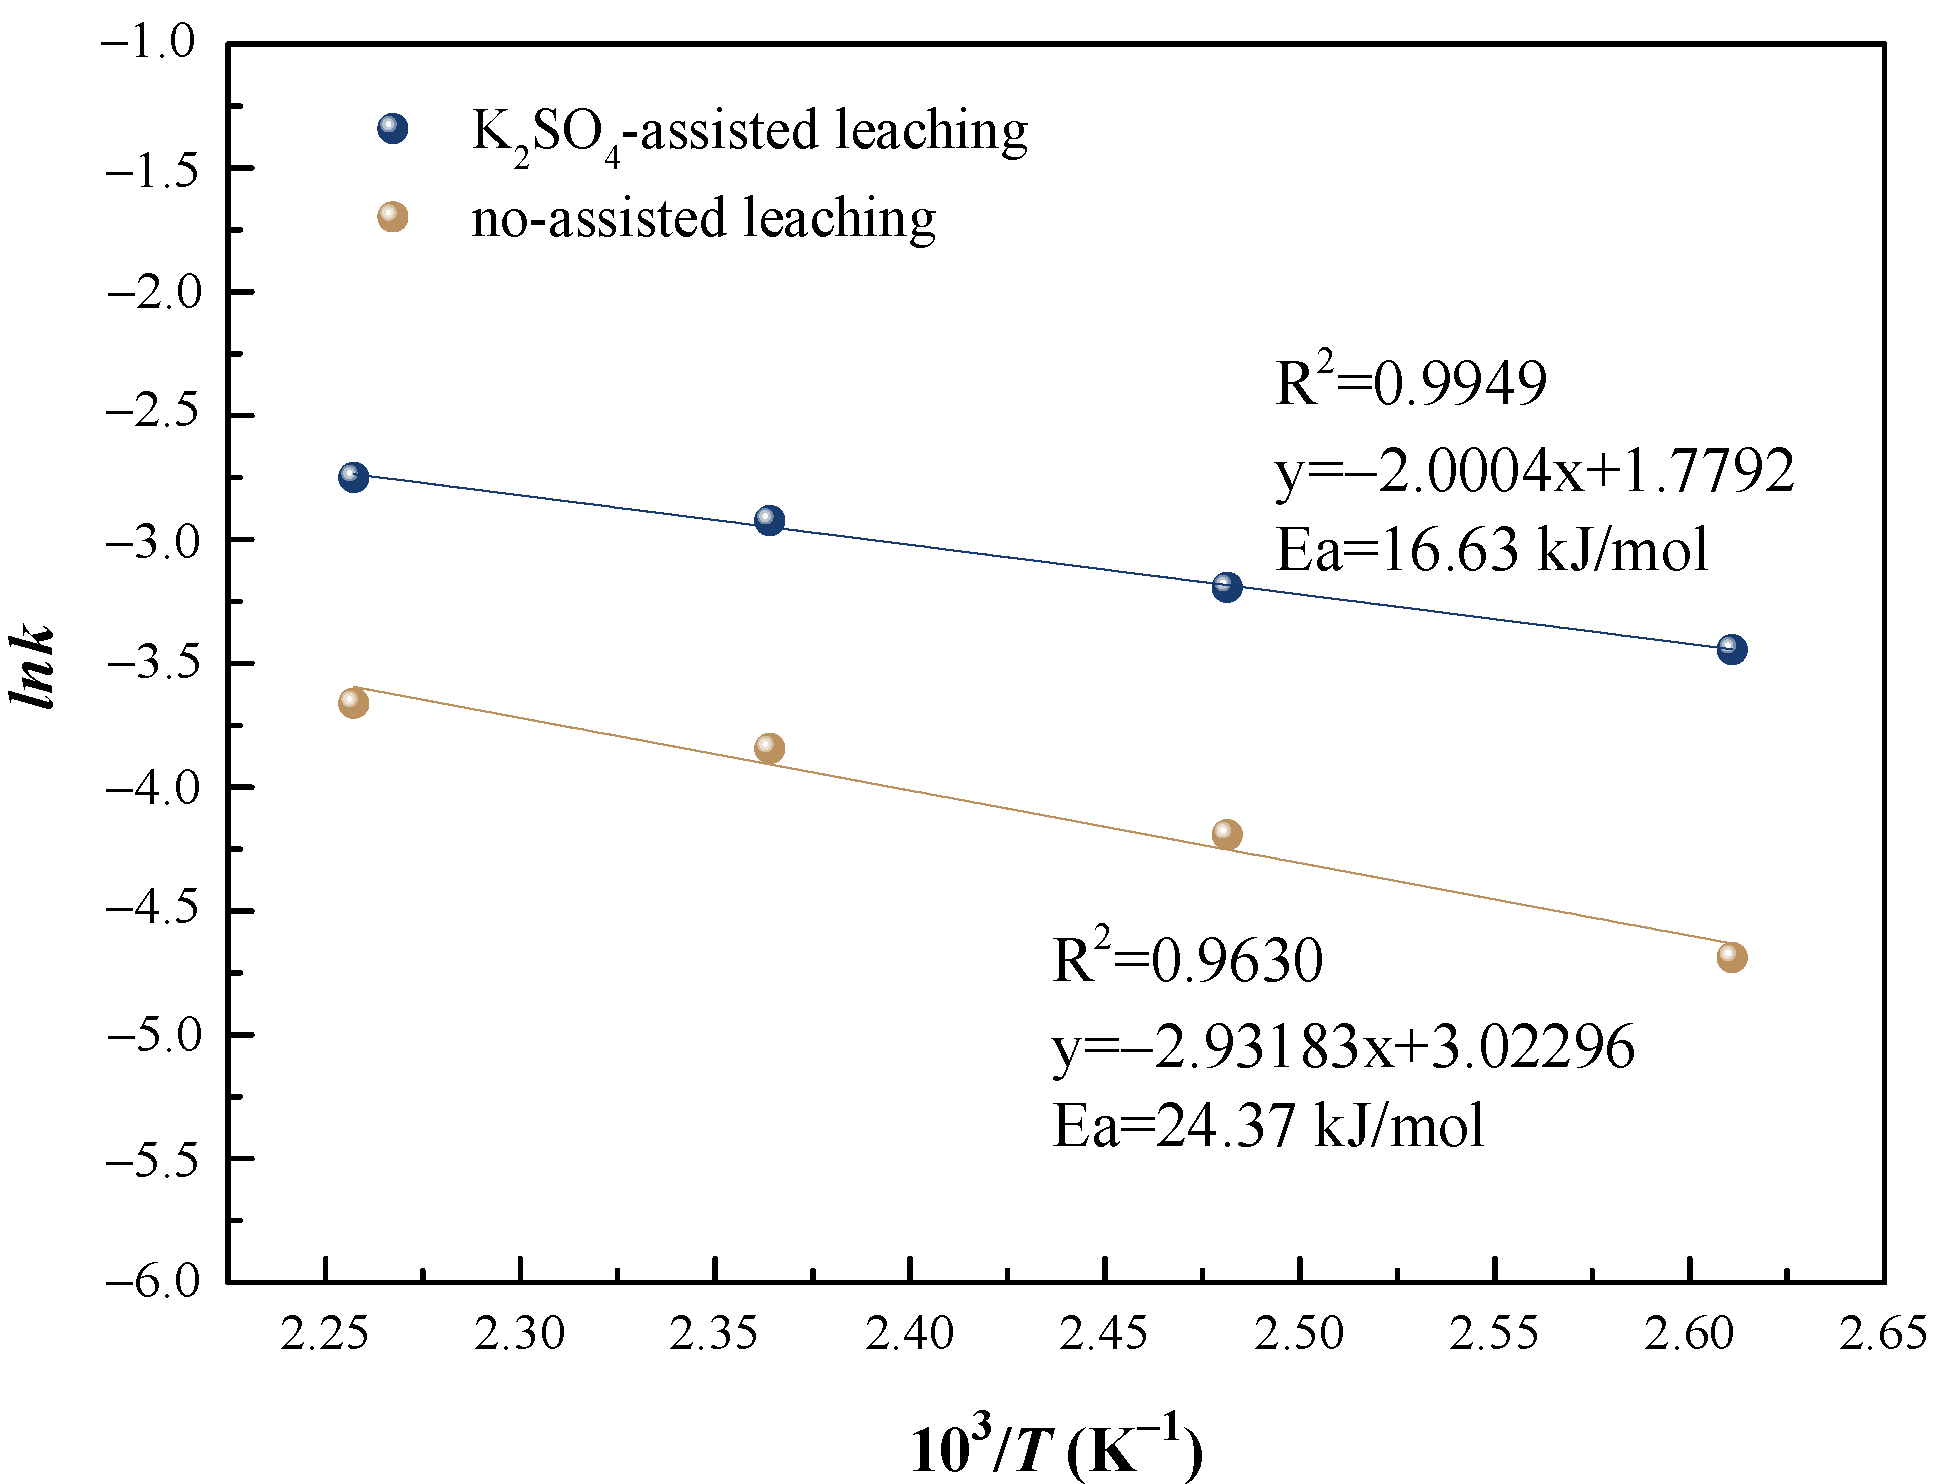
3.2.1. Apparent Activation Energy of Vanadium Leaching

Assuming the pressure acid leaching process of black shale conforms to the shrinking core model, When the leaching rate is controlled by interior diffusion, Equation (2) can be used to describe the leaching kinetics of the process [27].
k D ( t t 0 ) = 1 3 ( 1 α 1 α 0 ) 2 3 + 2 ( 1 ( 1 α 0 ) 2 3 ( α α 0 ) ) = f D ( α , t )
When the leaching rate is controlled by the interfacial chemical reaction, Equation (3) is employed to describe the leaching kinetics [27].
k C ( t t 0 ) = 1 ( 1 α 1 α 0 ) 1 3 = f C ( α , t )
When the leaching rate is under mixed control, Equation (4) may be used [28].
k ( t t 0 ) = 1 3 ( 1 α 0 ) 1 3 ln ( 1 α 1 α 0 ) 1 + ( 1 α 1 α 0 ) 1 3 = f m ( α , t )
In these equations, t, α, kD, kc, and k refer to the leaching time (s), fractional leaching efficiency of vanadium, and apparent rate constants of internal diffusion, chemical reaction, and mixed control, respectively. In the leaching experiments, the test sample experienced a temperature-rising stage where the leaching of V has already been taking place for a certain time. Considering the starting time of the leaching process, it is evident that the leaching efficiency (α0) calculated for the holding time of 0 h (t0) is not zero and should not be ignored in Equations (2)–(4).
The time-dependent leaching data in Figure 3a was fitted by Equations (2)–(4) and the fitting results are shown in Figure 3b–d. The linear fitting curves of Equation (4) can pass though the origin and the correlation coefficients R2 were higher than the required coefficient (0.9196) when the confidence is 99%. The vanadium leaching rate can be judged under mixed control. The apparent rate constants from the linear fitting results of Equation (4) was chosen to be substituted into the Arrhenius equation (lnk = lnAEa/RT) to construct the Arrhenius plot, as shown in Figure 4. The apparent activation energy (Ea) of vanadium leaching process is calculated from the slope of the Arrhenius plot. Comparing with no assisted leaching, the apparent activation energy of K2SO4-assisted leaching declined from 24.37 kJ·mol−1 to 16.63 kJ·mol−1, which marked the increasing vanadium leaching rate.

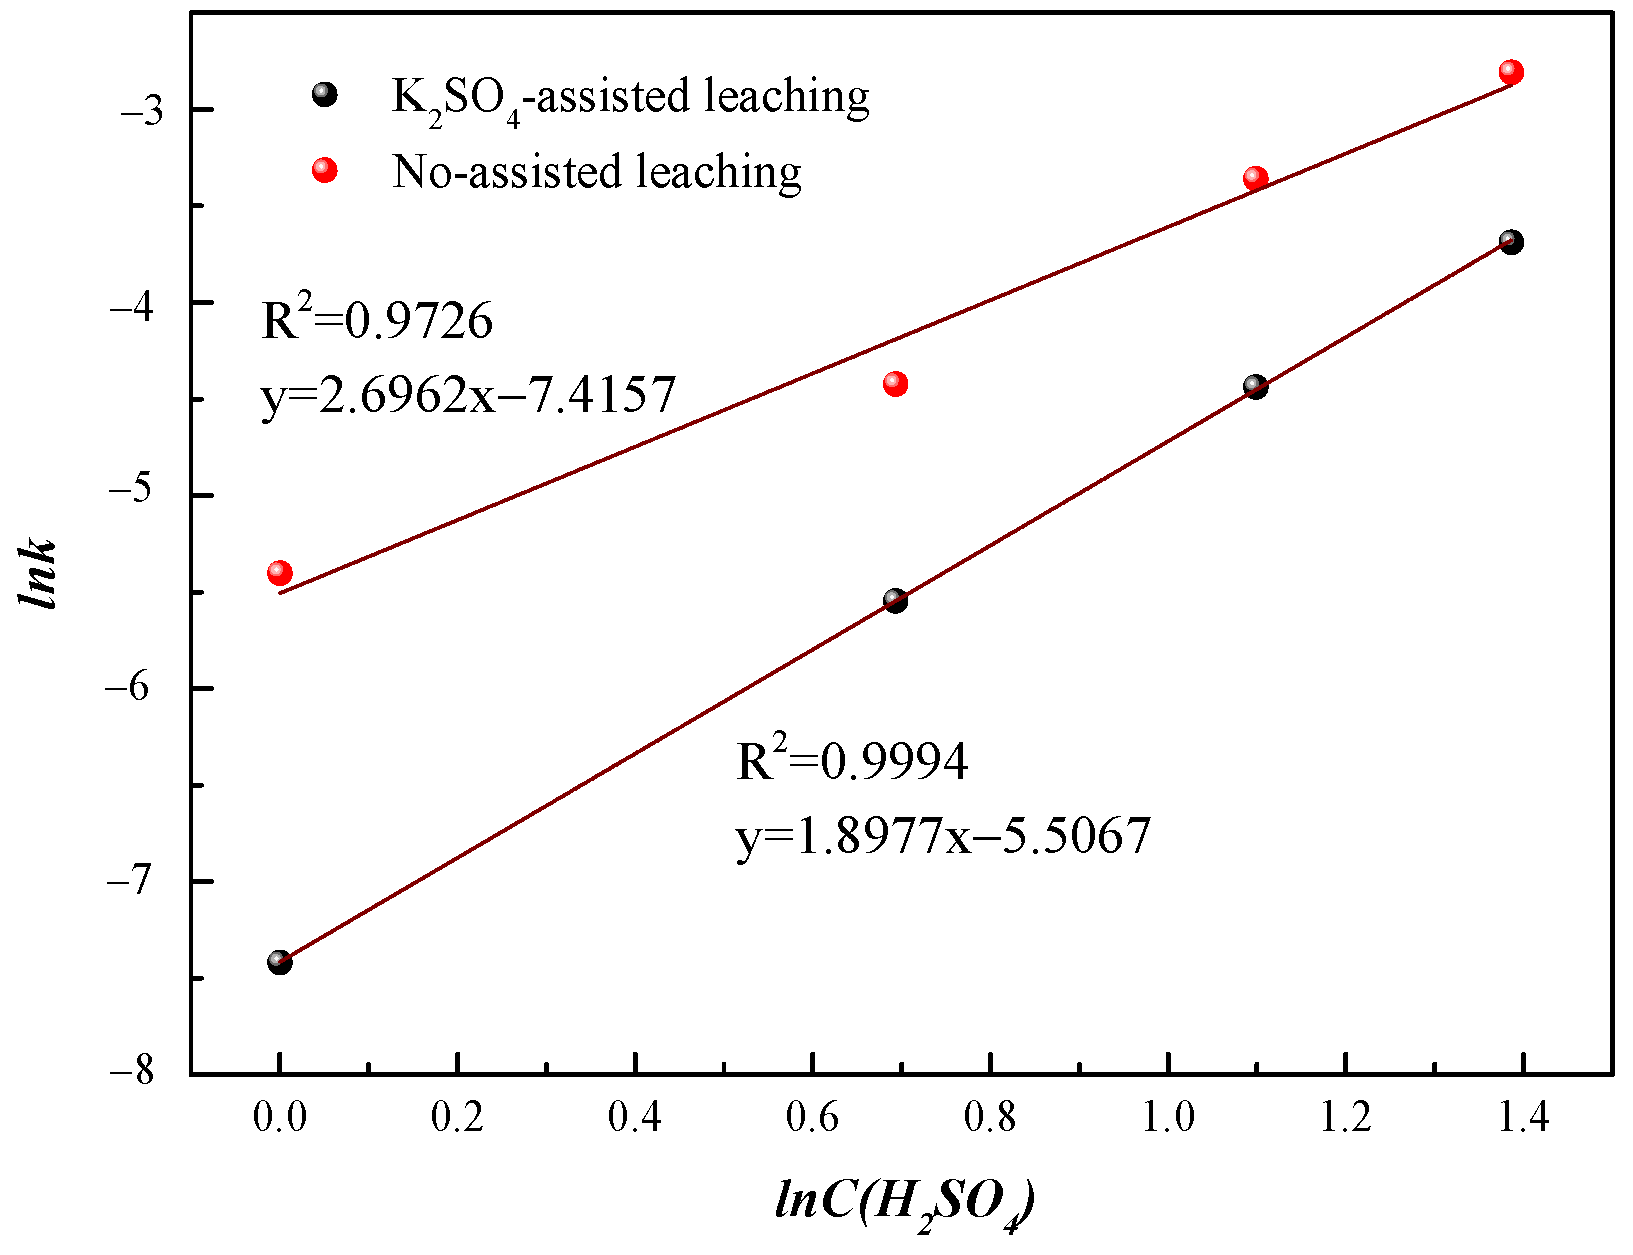
3.2.2. Apparent Reaction Order of Sulfuric Acid

The time-dependent leaching data in Figure 5a was fitted by Equation (4) and the fitting results are shown in Figure 5b. The general formula for vanadium leaching rate can be described as logarithmic equation (Equation (5)). The logarithm of the slope of the linear fitting curves (lnk) plotted with logarithm of sulfuric acid concentration, as shown in Figure 6.
l n d α d t = l n k exp [ E α R T ] + n l n C H 2 S O 4
where k is the apparent rate constant, Ea is the apparent activation energy of leaching (kJ·mol−1), CH2SO4 is the acid concentration (mol/L), n is the apparent reaction order of sulfuric acid and T is the leaching temperature (K).
As shown in Figure 5a, the sulfuric acid concentration greatly affects the vanadium leaching efficiency with or without K2SO4 addition. Muscovite dissolution reaction in sulfuric acid solution can be considered at far from equilibrium and have been traditionally interpreted to be a function of pH but independent of the aqueous concentrations of the metals present in the mineral itself [29]. So, the H+ concentration directly affects the reaction rate of Equation (6). K2SO4 does not participate in Equation (6) but can be involved in a chain reaction between CaSO4 and CaSO4·2H2O, as shown in Table 3.
KAl2(AlSi3O10)(OH)2 + 10H+ = 3Al3+ + K+ + 3H4SiO4
According to the line slope in Figure 6, the apparent reaction order (n) of sulfuric acid decreased from 2.7 to 1.9 under K2SO4 assistance, which means that the pH dependence of Equation (6) has been weakened as K2SO4 mediated in pressure acid leaching of the black shale. K2SO4 indirectly prompted Equation (6), which should be attributed to the conversions between CaSO4 and CaSO4·2H2O.
The apparent activation energy and the apparent reaction order of sulfuric acid are plugged into Equation (4), which obtained a mathematical model for the pressure acid leaching of the black shale as follows.
1 3 ( 1 - α 0 ) 1 / 3 ln ( 1 α 1 - α 0 ) 1 + ( 1 α 1 - α 0 ) 1 / 3 = 5.92 exp ( 4 × 10 3 T ) C H 2 S O 4 1.9 t
The vanadium leaching efficiency was forecasted with this model by iterative computation. To test the accordance between the experimental values and the calculated values from Equation (7), a plot of these values was drawn. As can be seen in Figure 7, a good coincidence was achieved between the calculated and the experimental values. The relative error is controlled in 10%.

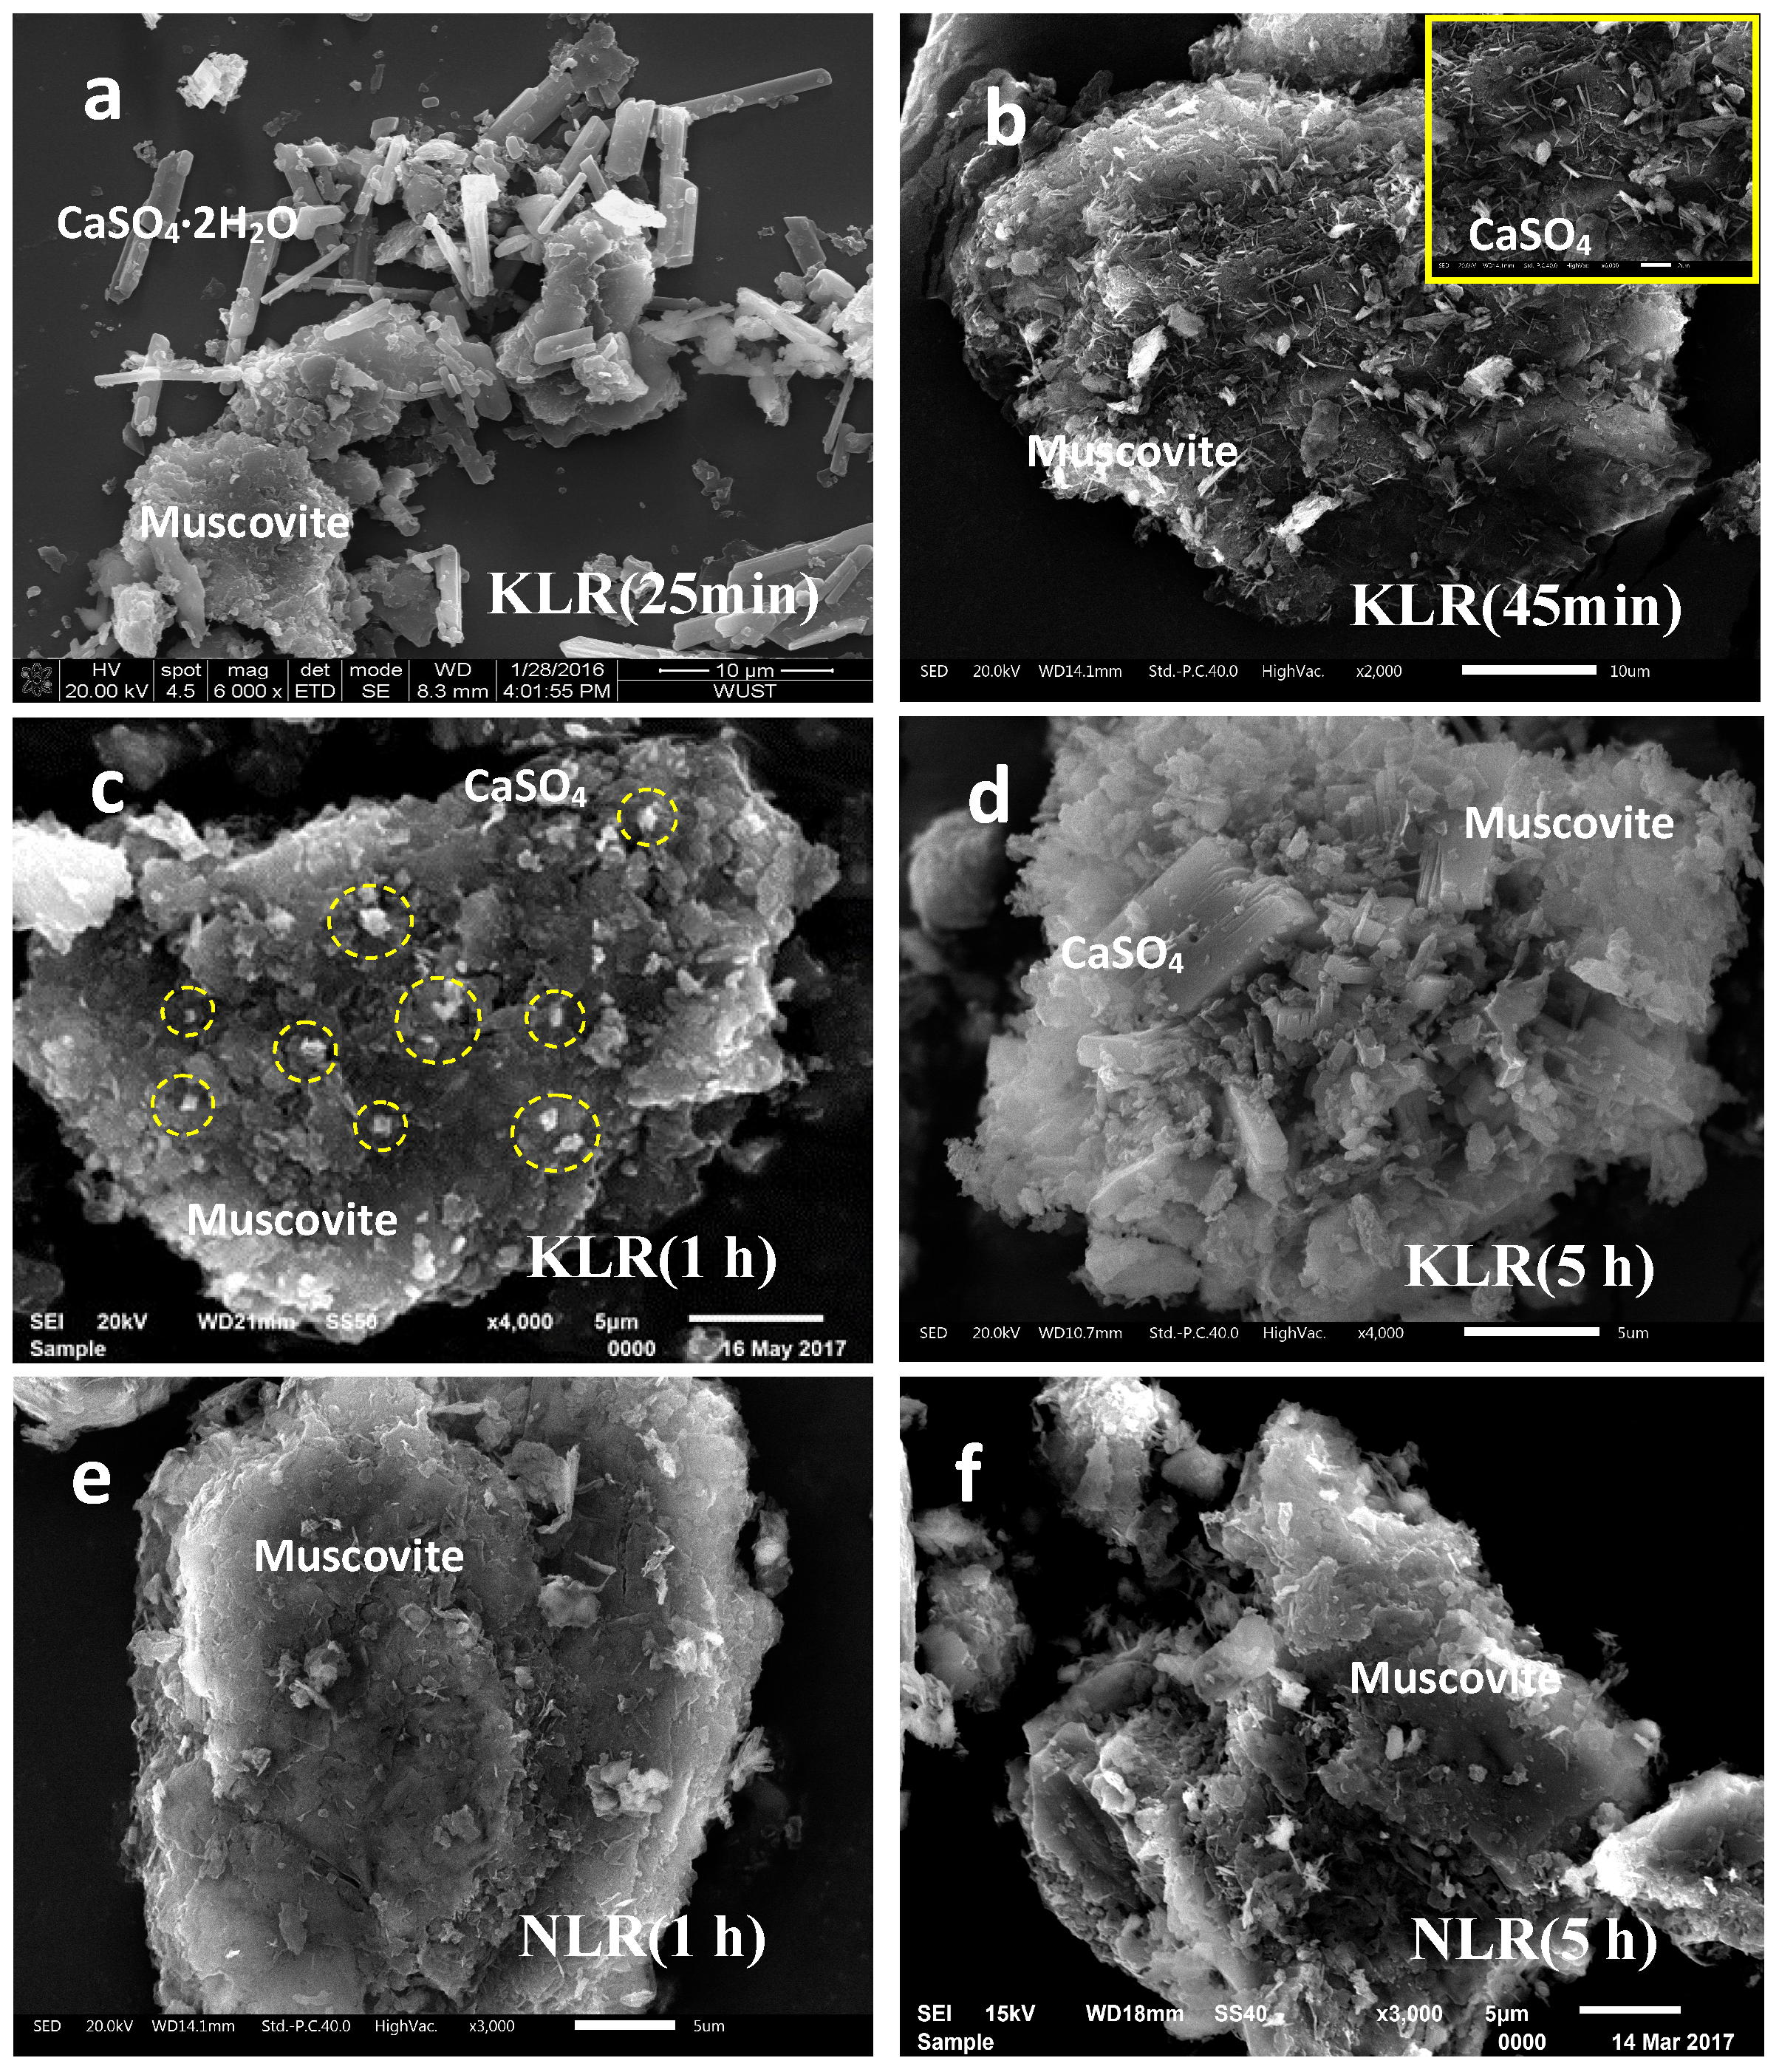
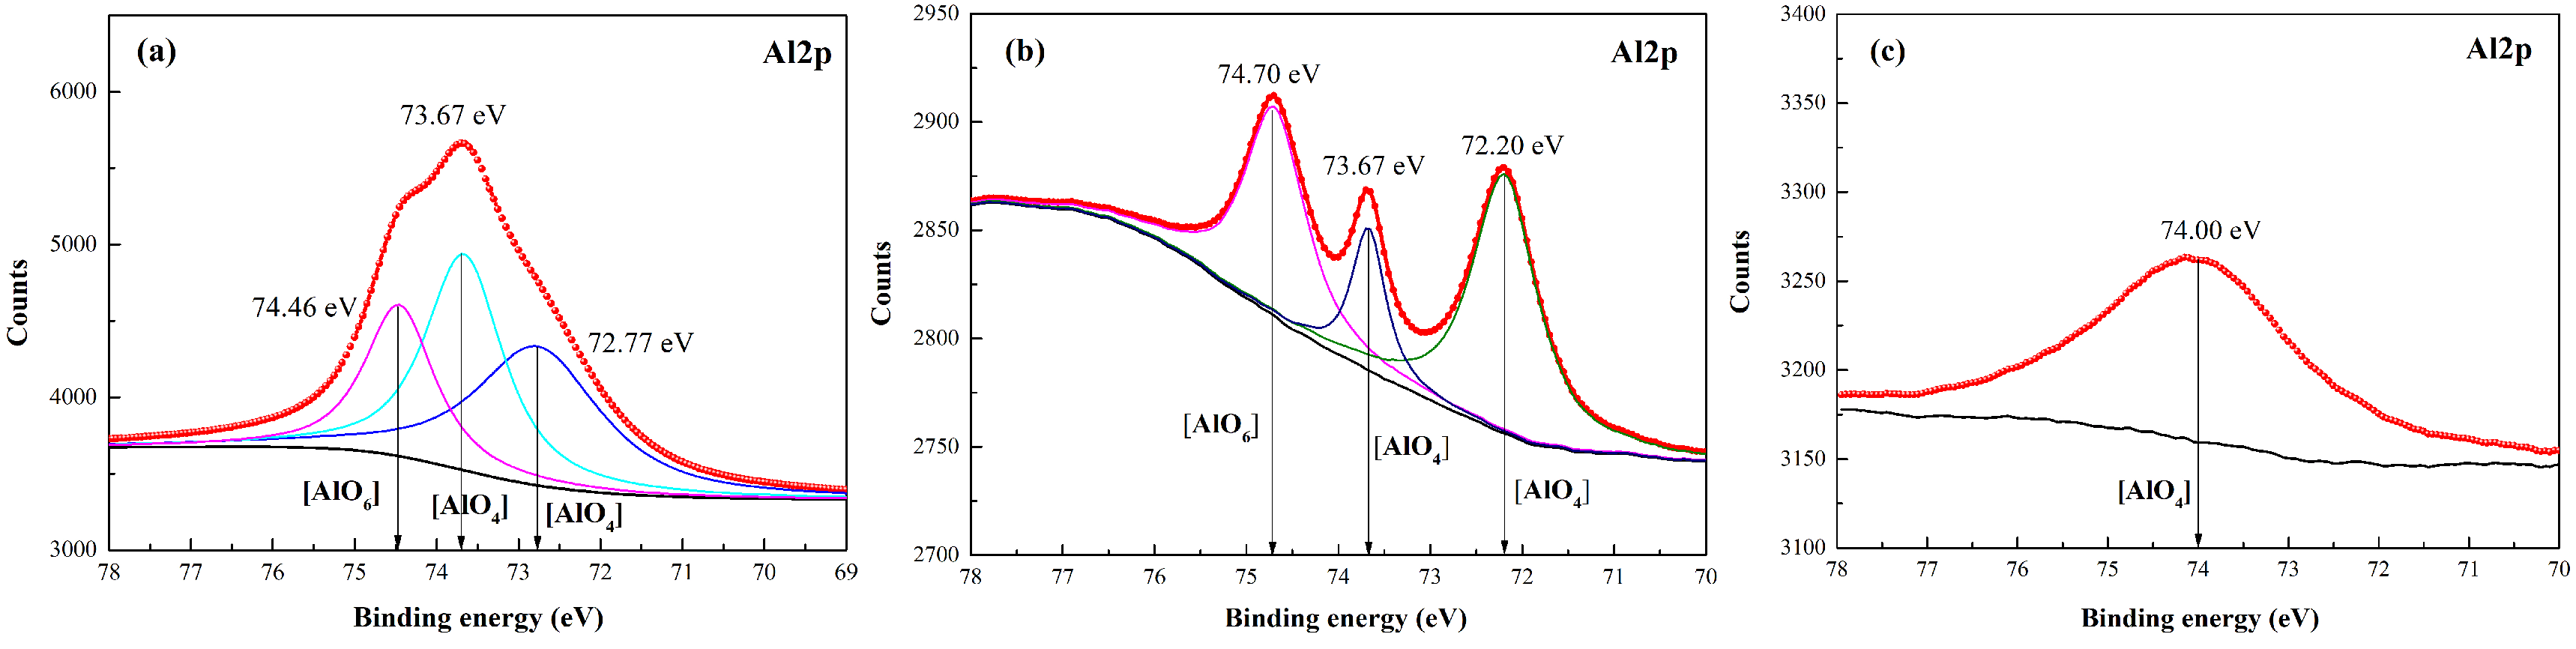
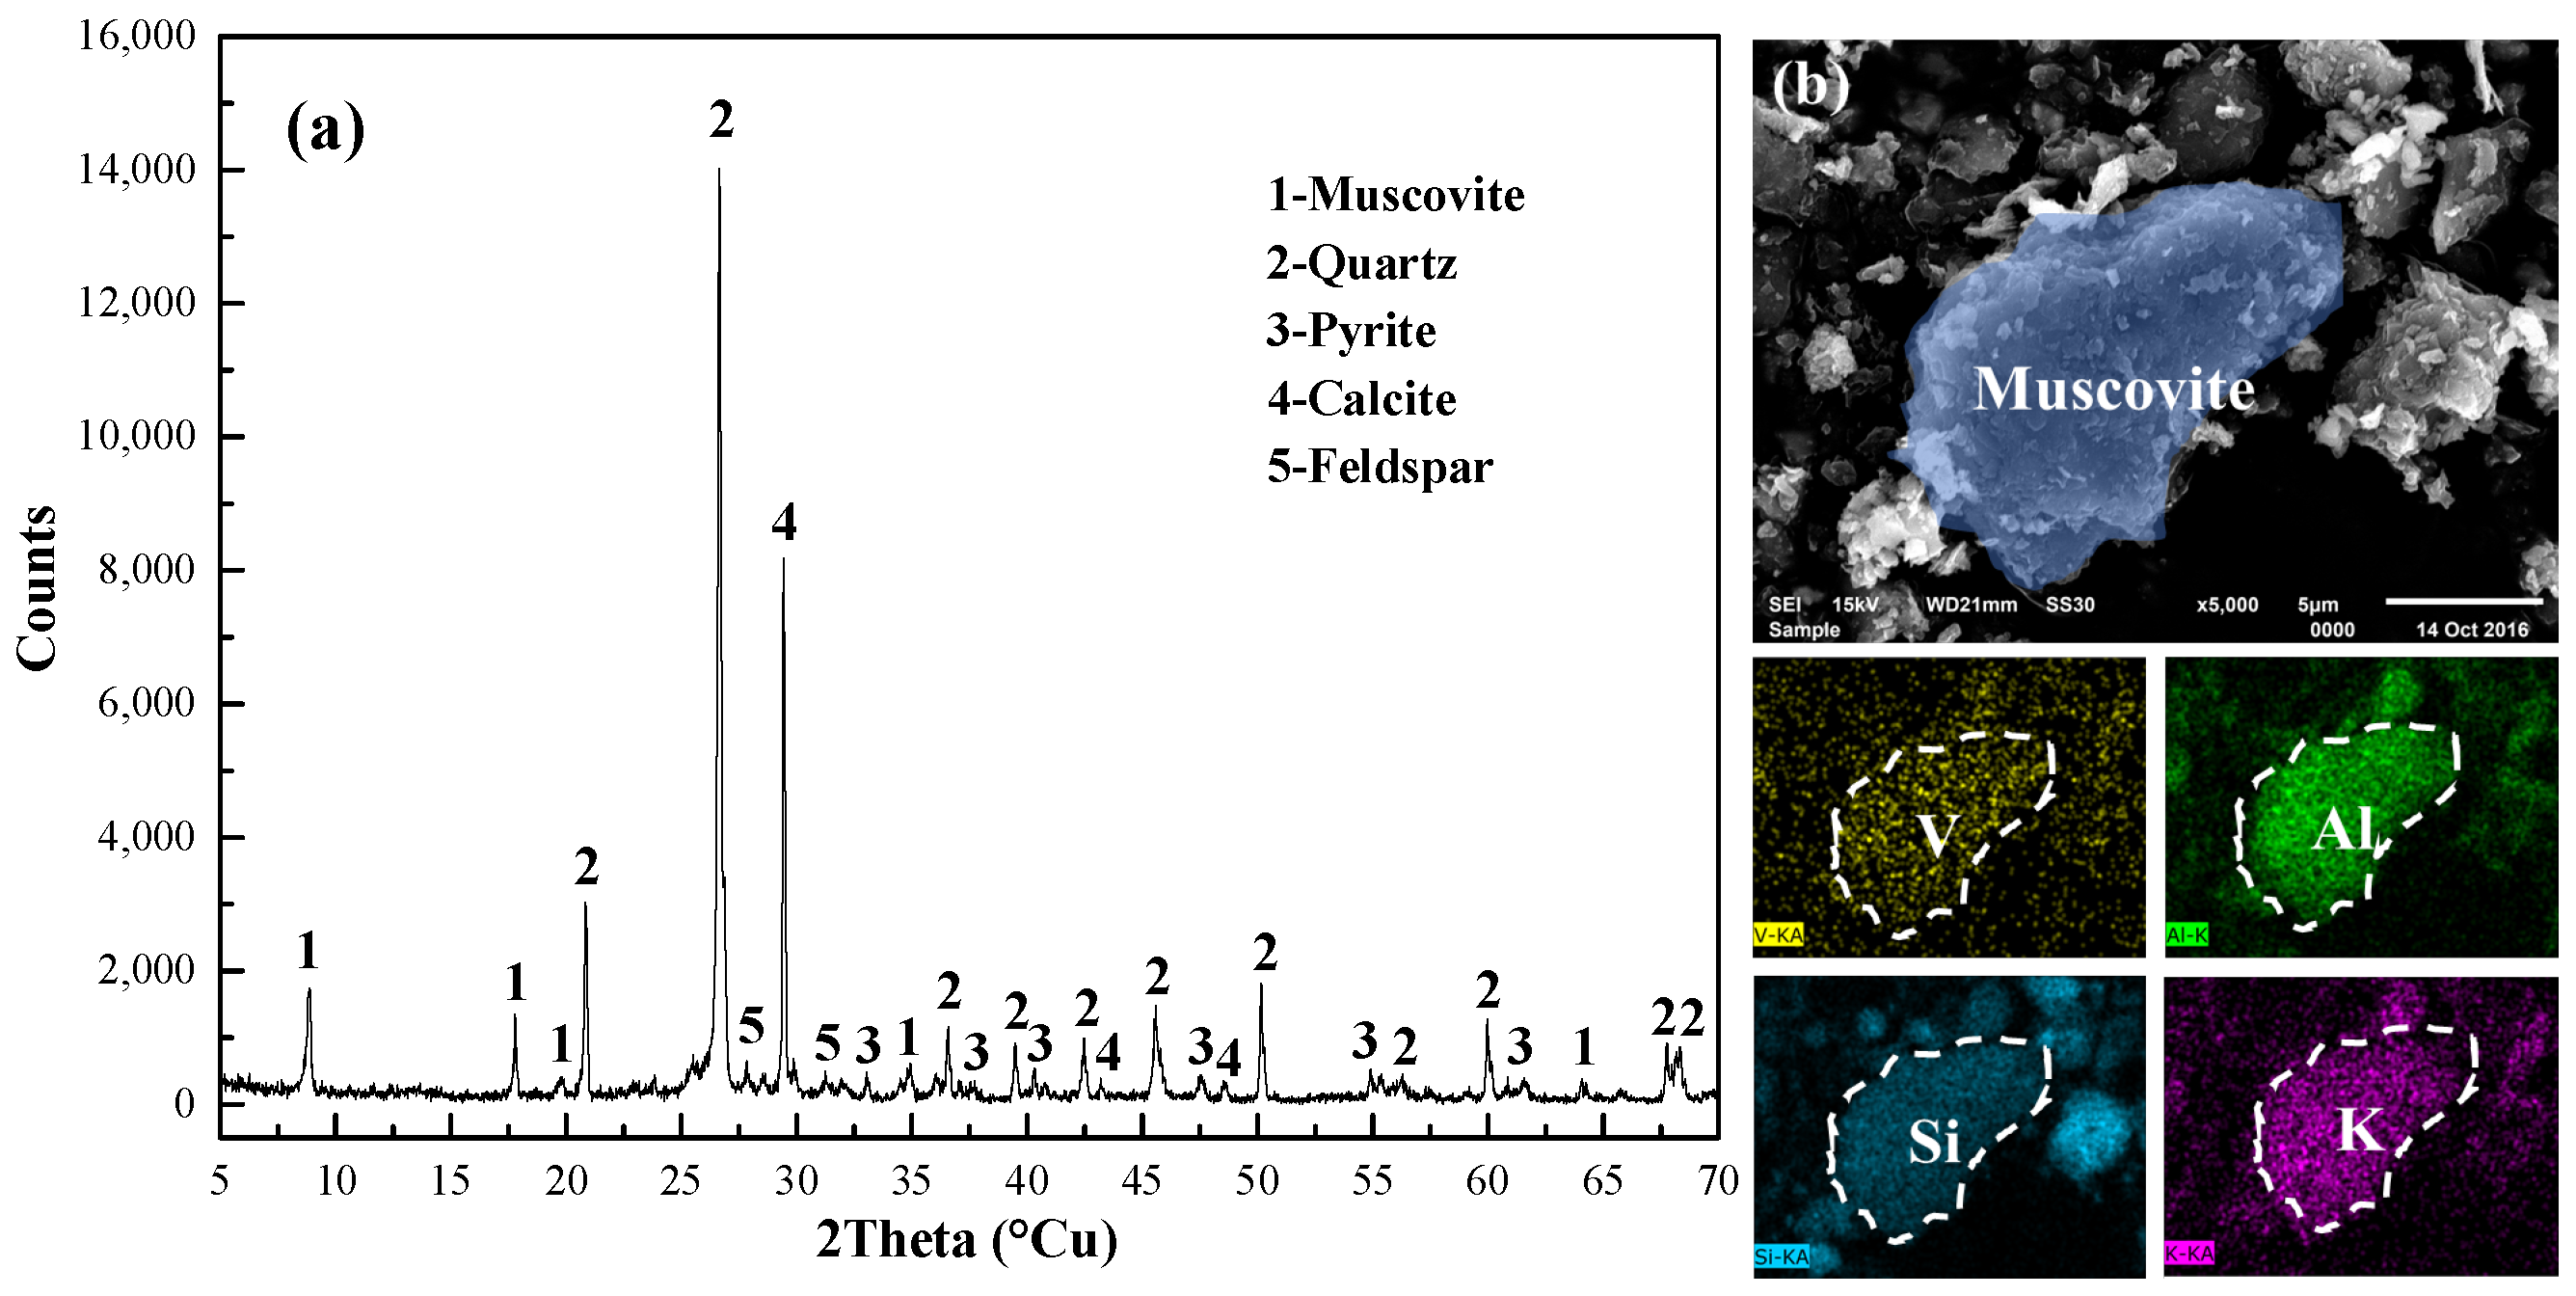
3.3. Surface Condition of Muscovite after K2SO4-Assisted Leaching

The morphology of the K2SO4-assisted leaching residues (KLR) and non-assisted leaching residues (NLR) was analyzed by SEM-EDS and shown in Figure 8.
It was observed that CaSO4 crystals were deposited on muscovite and disintegrated muscovite particles in the KLR. Rod-like CaSO4·2H2O crystals were observed below 100 °C in Figure 8a. Tiny CaSO4 crystals with longitudinal growth concentrated upon muscovite surface when the temperature initially rising to 150 °C (seen in Figure 8b) and transformed into lateral growth over time (seen in Figure 8c,d). This transformation of crystal shape was accompanied with muscovite surface cracking and decomposing.
By contrast in Figure 8e,f, CaSO4 crystals were not found on muscovite which still had a rough but intact surface in the NLR, indicating that muscovite was dissolved in a way of peeling off particle surface layer by layer without assistance.
The chemical states of Al2p in the KLR and the NLR were also studied by XPS and the results are shown in Figure 9. There are four-coordinated Al and six-coordinated Al in the black shale. The four-coordinated Al exists in muscovite and feldspar while the six-coordinated Al just exists in muscovite. So, the six-coordinated Al content can trace muscovite surface. The four-coordinated Al in aluminum-oxygen tetrahedron has a binding energy of about 73.4~74.55 eV and the six-coordinated Al in aluminum-oxygen octahedron has a binding energy of about 74.1~75.0 eV. As seen in Figure 9a, the Al2p fine spectrum of the black shale was split into three peaks, two of which at 74.46 eV and 73.67 eV belongs to the six-coordinated Al and the four-coordinated Al, respectively.
Under K2SO4 assistance, the Al2p fine spectrum peaked at the binding energy of 74.00 eV that belonged to the four-coordinated Al. Without assistance, the Al2p fine spectrum was split into three peaks, two of which at 74.70 eV and 73.67 eV belonged to the 6-coordinated Al and the four-coordinated Al, respectively. Moreover, it cannot be ignored that the peaks with binding energies of 72.20 eV and 72.77 eV in Figure 9a,b disappeared in Figure 9c. Based on XRD analysis (Figure 10), the four-coordinated Al in the KLR should be located in microcline. So the peaks with binding energies of 72.20 eV and 72.77 eV belonged to [AlO4] in muscovite structure and disappeared in the KLR, indicating the disorganization of muscovite structure.

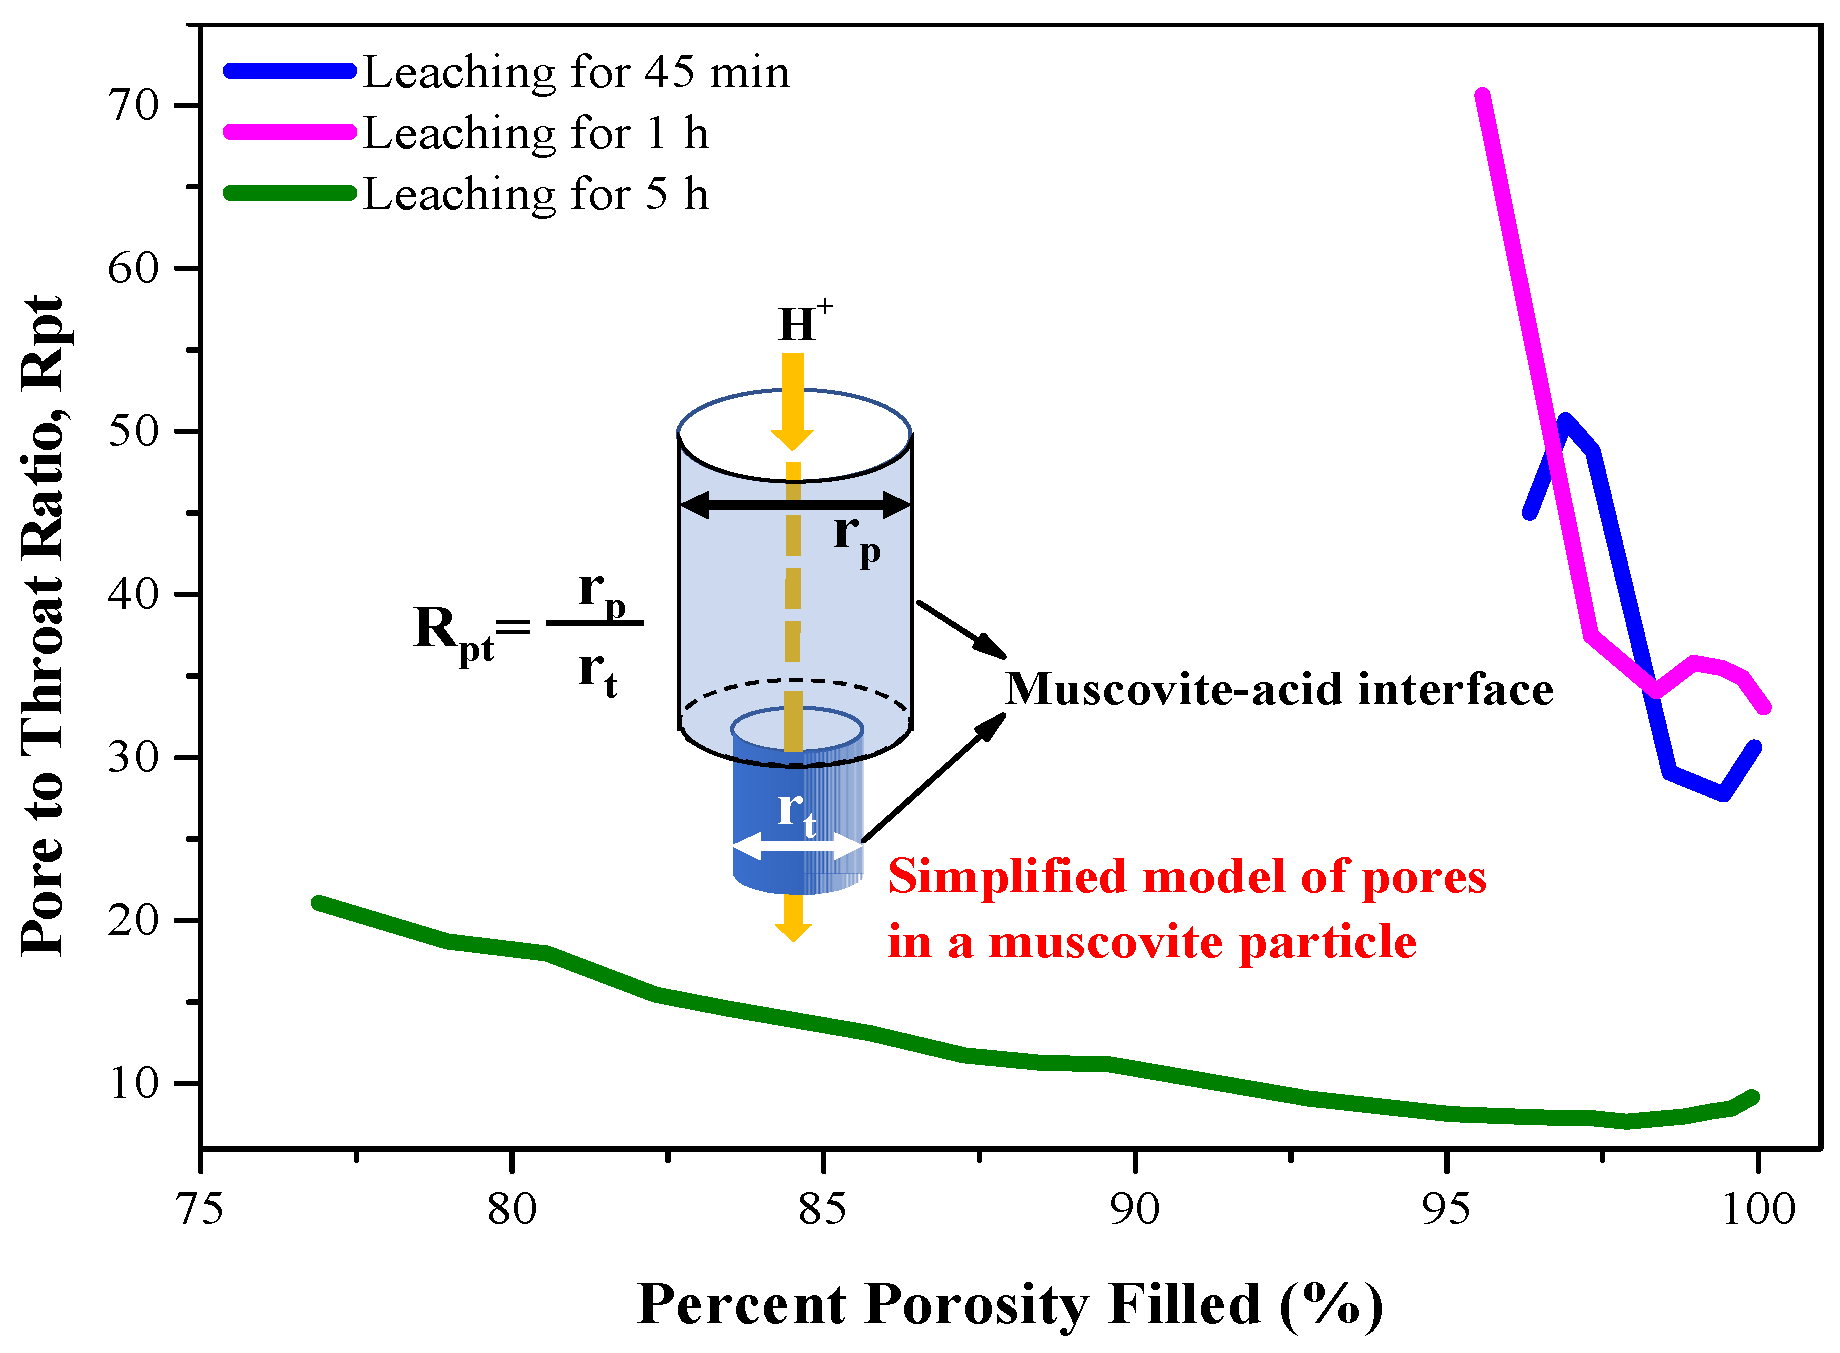
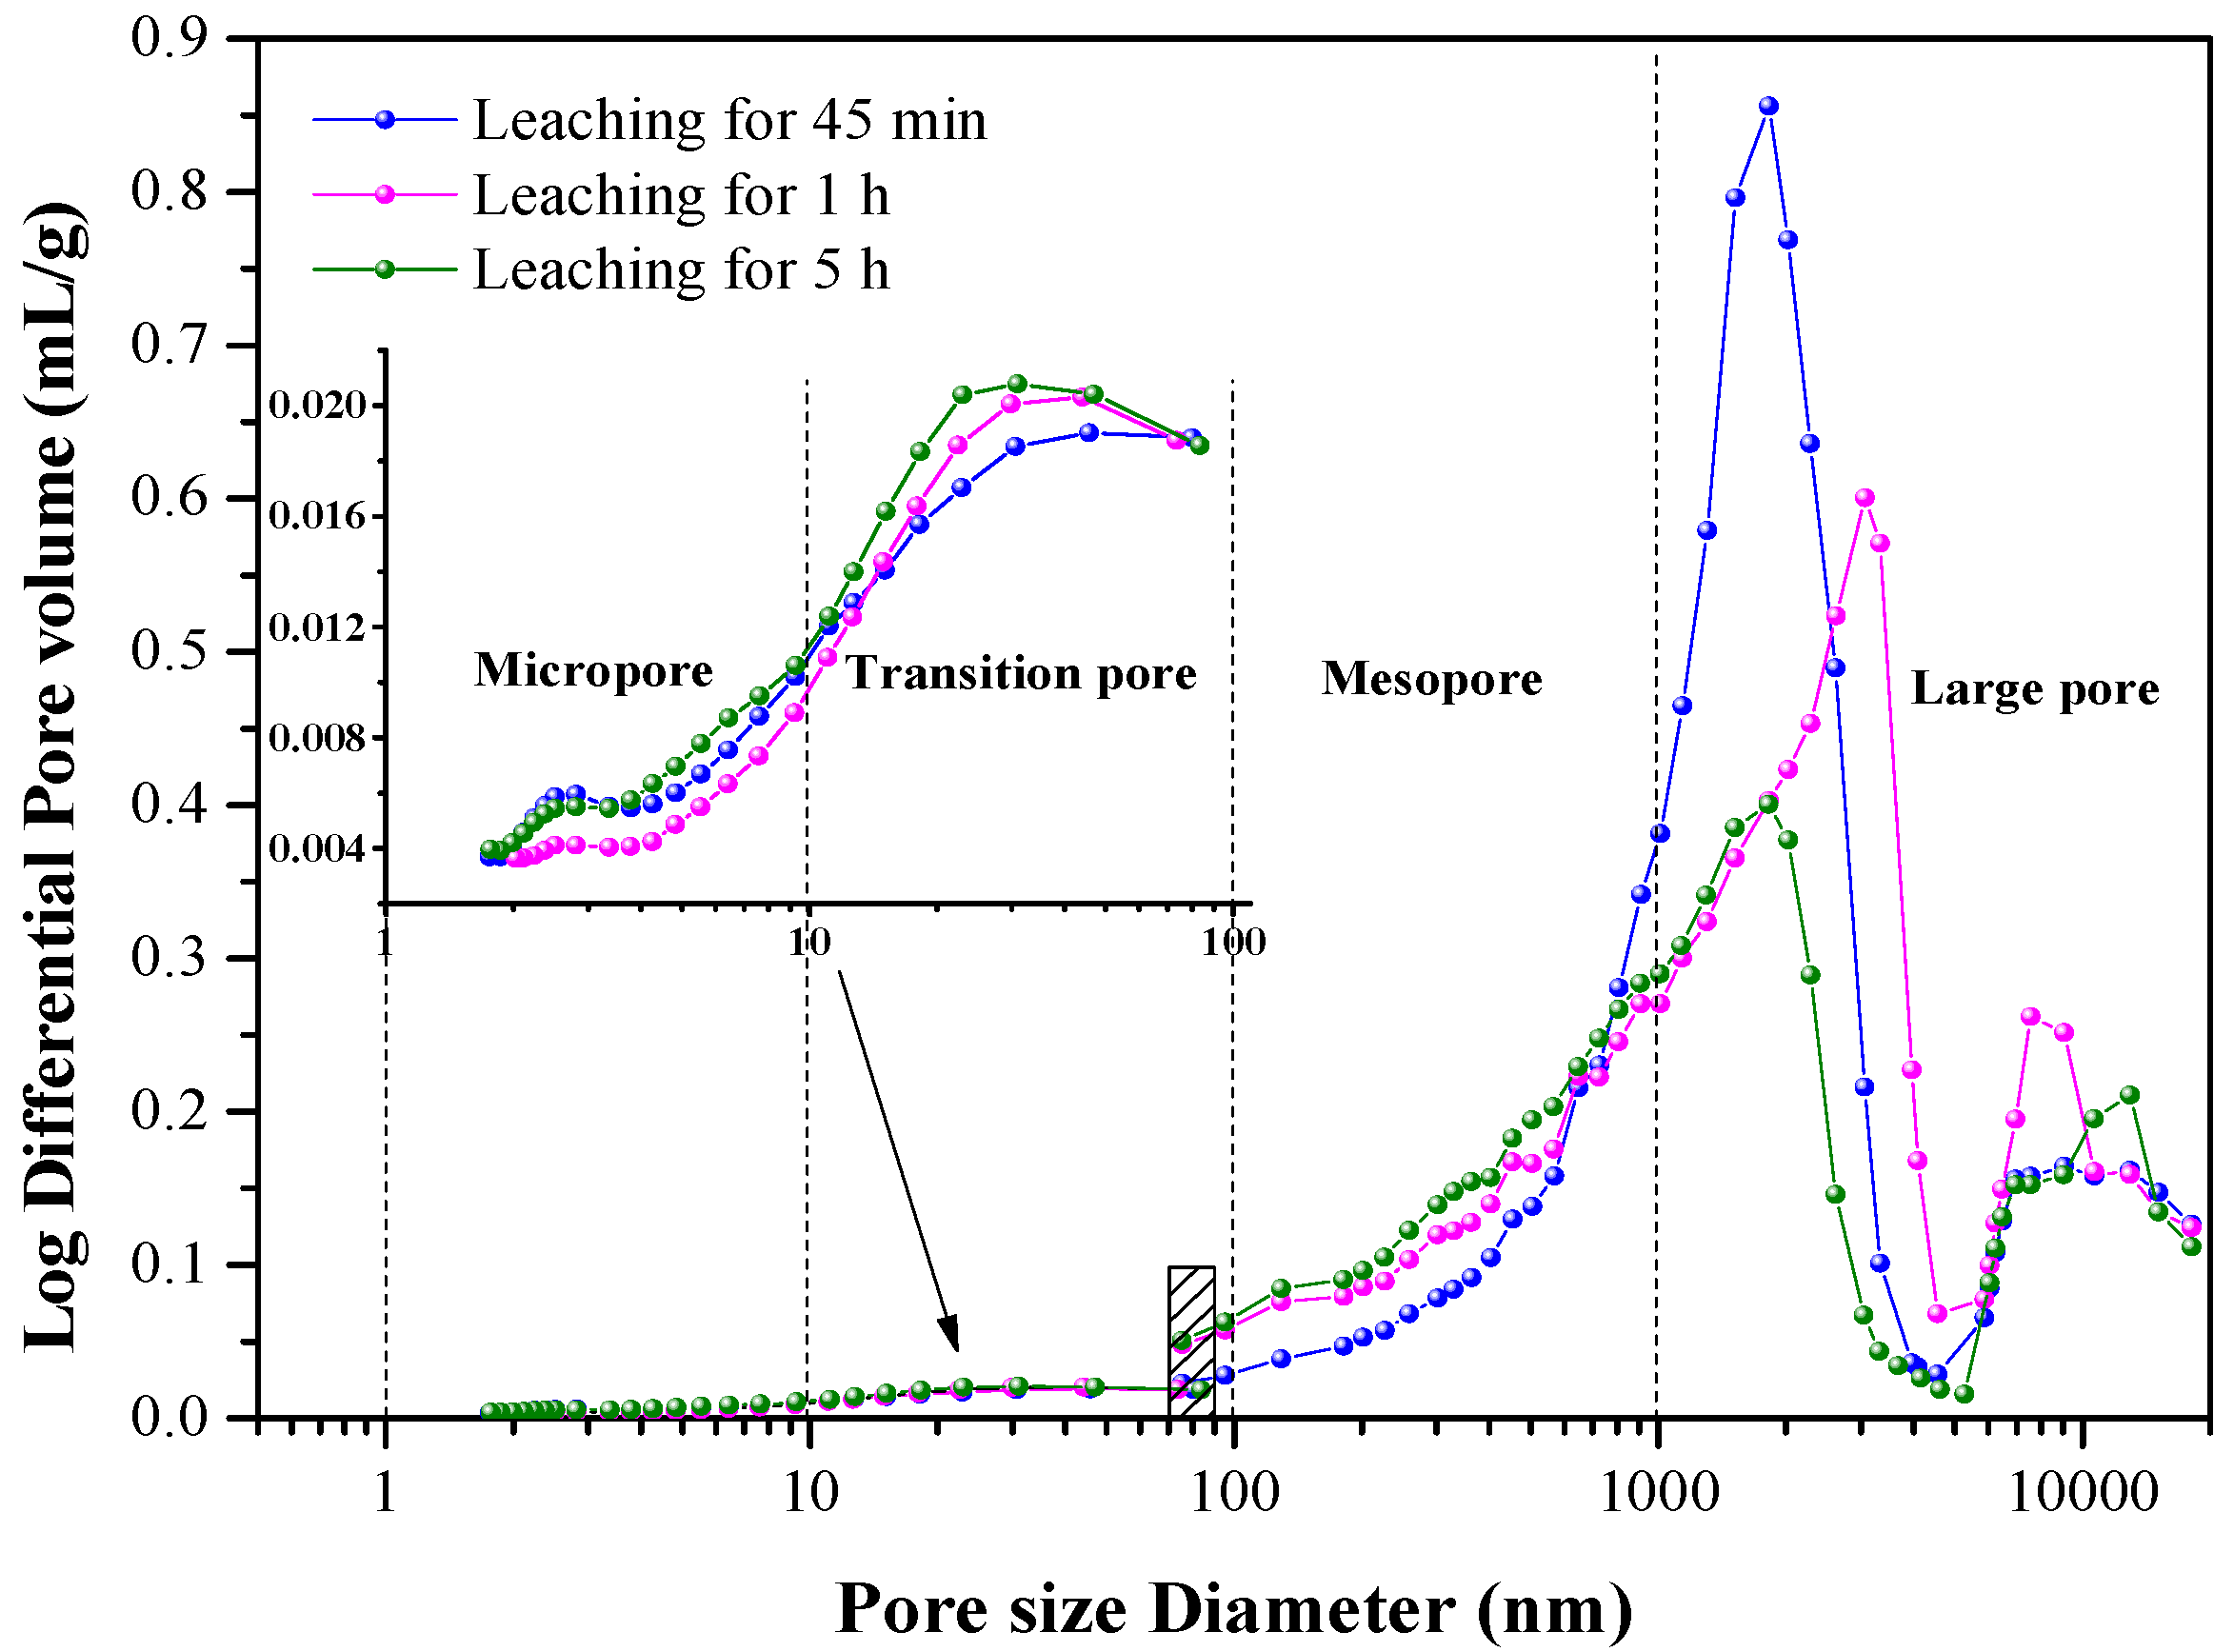
3.4. Pore Distribution in the KLR and the NLR

The pores in the black shale ore can be classified using pore classification of Xoaotb [30] as ultra-large pores (>100 μm, including microcracks), large pores (1 μm < d < 100 μm), mesopores (100 nm < d < 1 μm), transition pores (10 nm < d < 100 nm), and micropores (d < 10 nm). In terms of the micropores and transition pores, the relationship between the pore size and mercury-injection pressure cannot follow Washburn equation, leading to a distortion of pore size–pore volume distribution. The mercury intrusion method is not suitable for testing the micropores and transition pores. So, the combined method of nitrogen adsorption and mercury intrusion was adopted to analyze the pore structure of KLR and the results are shown in Figure 11 and Figure 12, and Table 4.
As shown in Figure 11, the KLR had a narrow pore to throat ratio (Rpt) range from 30 to 45 at the leaching time of 45 min. However, the Rpt went up and broadly ranged from 33 to 70 at the leaching time of 1 h, which indicated that the pore throat size decreased and the pore size increased. It can be deduced that massive pores initiated and proliferated in the existing pores within one-hour leaching. This change will bring about the increasing of muscovite–acid interface. As the leaching time reached five hours, the Rpt obviously dropped off and just ranged from 9 to 21, which manifested that the pore throat size was approaching the pore size. The pores should be expanded as a result of interfacial reaction of muscovite dissolution.
As shown in Figure 12, the KLR was mostly large pore based. The two peaks of large pore distribution concentrated in the pore size ranges from 1 μm to 5 μm and from 5 μm to 20 μm, respectively. The mesopores did not present the most probable distribution, marking a wide pore size range of the mesopores in the KLR. The transition pores and micropores were much less than the large pores and mesopores, but the two broad peaks respectively occurred in the pore size ranges from 2 nm to 4 nm and from 10 nm to 80 nm.
According to Table 4, the proportion of large pores decreased over time while the mesopores, transition pores and micropores increased, indicating that the proliferation of smaller pores involved in the mesopores, transition pores, and micropores. The surface areas of transition pores and micropores were higher than the large pores and mesopores. It was noted that the micropores in surface area decreased 1.6102 m2/g after leaching for 1 h and increased 1.7867 m2/g after leaching for 5 h, signaling that some micropores at first got blocked because of CaSO4 nucleation and further increasing time brought about the new micropores born under CaSO4 growth in situ. This behavior enlarged the reaction interface of muscovite dissolution so that more four-coordinated and six-coordinated Al were exposed on the reaction interface and equipped with high reactivity.

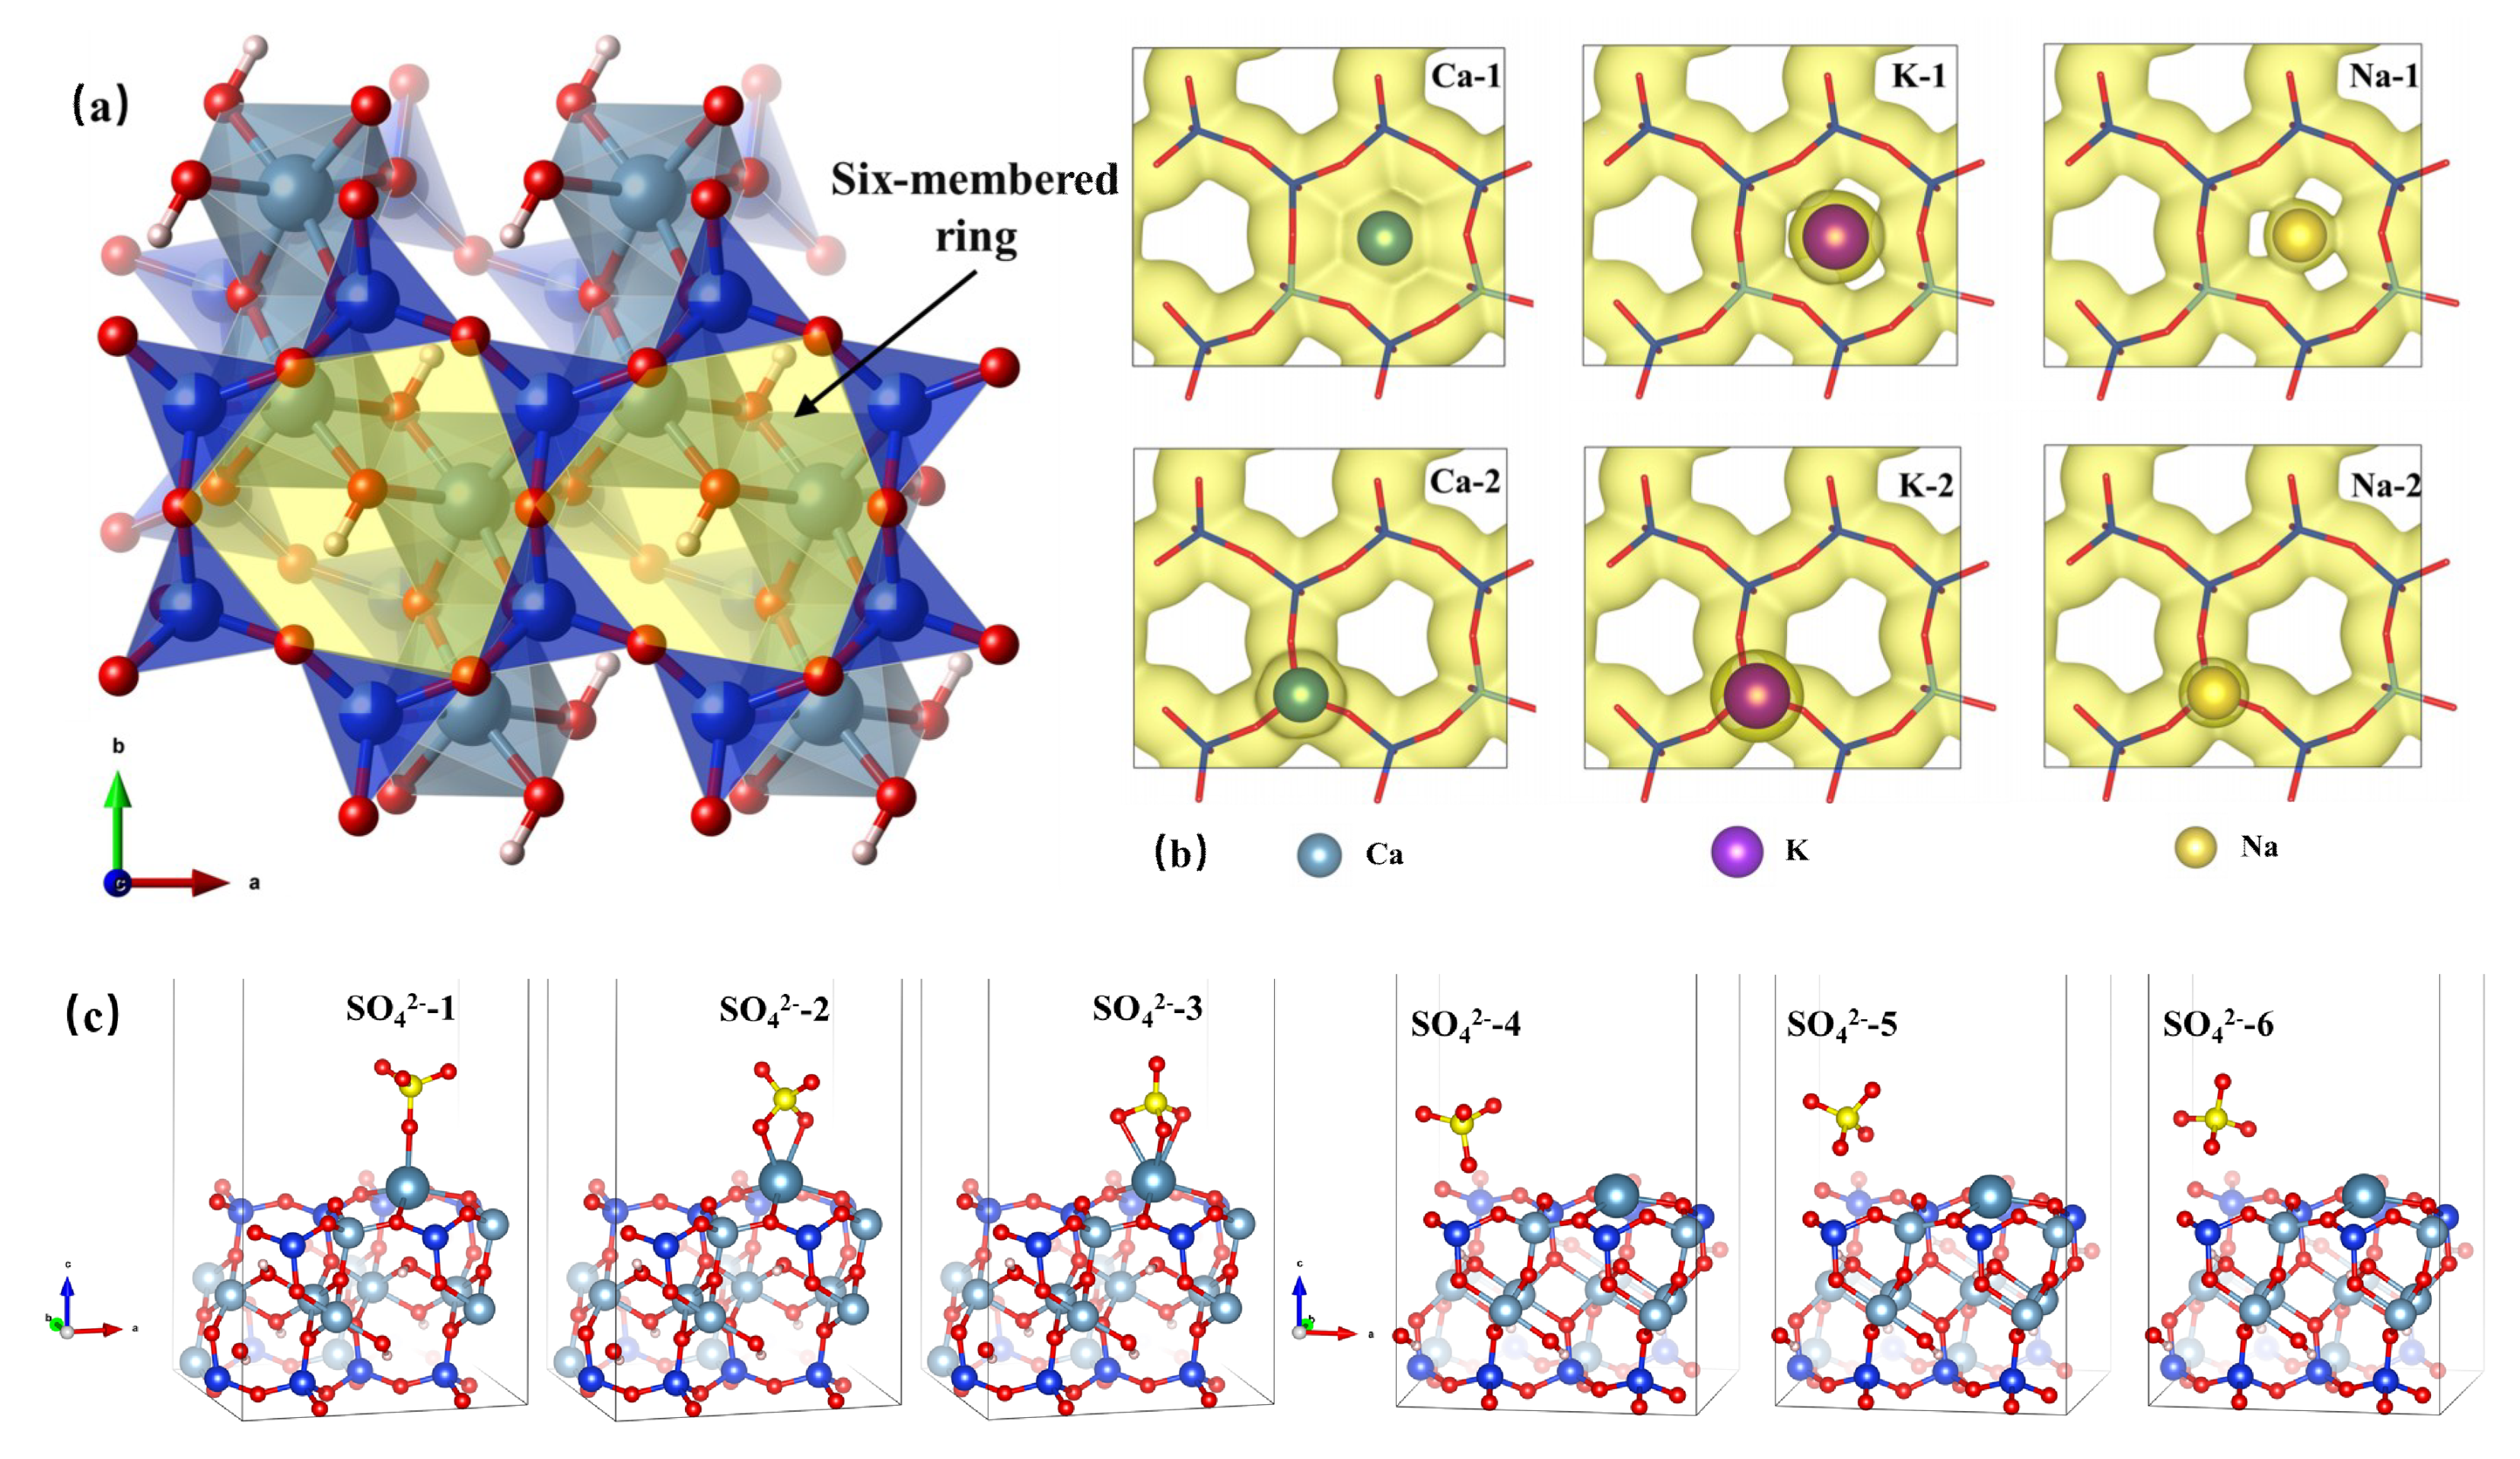
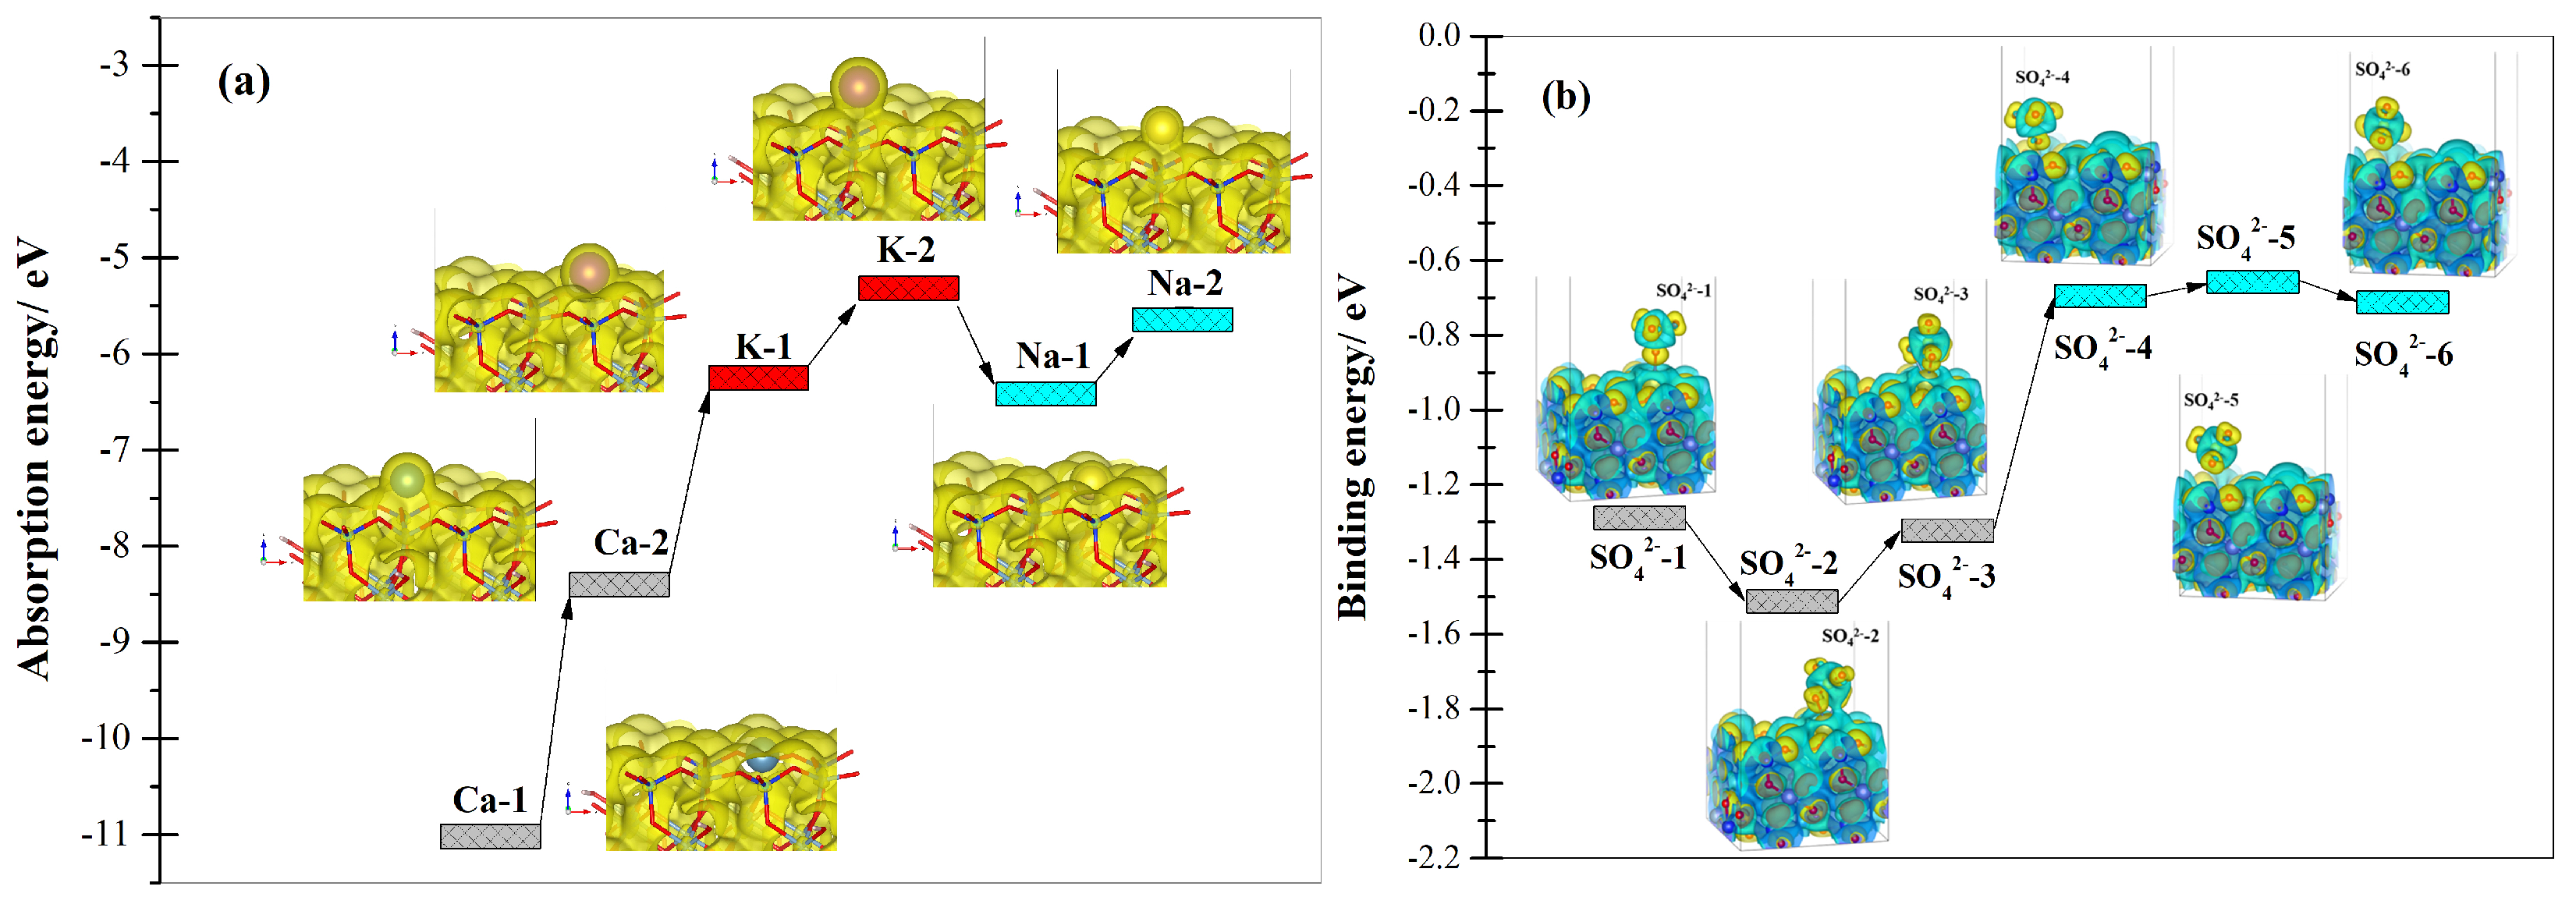
3.5. Mechanism of CaSO4 Deposition on Muscovite and Its Function

The (001) surface of muscovite structure is the main reaction interface of muscovite dissolution after releasing K+. On the basis of VASP software calculation, two potential sites on the (001) surface will be considered for determining the preferential deposition position of CaSO4. The first potential site is set in the six-membered ring cavity of silicon-oxygen tetrahedrons and the second potential site is set above Al atoms in aluminum-oxygen tetrahedrons, shown in Figure 13a.
Ca2+, K+, and Na+ are the main unavoidable cations during K2SO4-assisted pressure acid leaching of the black shale. The absorption competition among these three cations were investigated. As seen in Figure 13b, no matter locating on the first or second potential site, K+ and Na+ shared very few electrons with the six-membered ring of silicon-oxygen tetrahedrons. Differently, Ca2+ fully shared the electrons with the six-membered ring when positioned on the first potential site. However, once locating on the second potential site, Ca2+ barely shared the electrons with the six-membered ring. The electron sharing degree can signify interatomic interactions, which indicates that a strong interatomic interaction between Ca2+ and the (001) surface happened. The absorption energy of Ca2+ on the first potential site was the lowest of all the data in Figure 14a. So Ca2+ is capable of easily absorbing in the six-membered ring cavity of silicon-oxygen tetrahedrons prior to K+ and Na+.
The structure model of muscovite after Ca2+ absorbing in the six-membered ring cavity of silicon-oxygen tetrahedrons was thus built up. Six possible locations were selected to determine the optimal bond-making position of SO42− to this structure model. As shown in Figure 13c, the first three locations of SO42− are above Ca2+ with different location angles while the latter three locations of SO42− are in the cavity of six-membered ring of silicon-oxygen tetrahedrons with different location angles.
As found in Figure 14b, the binding energy of SO42− and Ca2+ reached the minimum at the second location of SO42−, closely followed by the third location and the first location. The binding energy of SO42− and Ca2+ at the latter three locations was obviously higher than at the first three locations. So SO42− tends to providing two oxygen atoms to bond with Ca2+ in order to form a stable new structure. Muscovite (001) surface gives CaSO4 deposition a suitable interfacial environment, which was validated by the experimental phenomenon in Figure 8d.
We can conclude that as the temperature exceeded 100 °C, CaSO4·2H2O was bound to decompose into Ca2+ and SO42−, so Ca2+-enriched environment happened to be formed. In this situation, the absorption and bonding of Ca2+ and SO42− can be continuous to get CaSO4 crystals deposited and growth on muscovite (001) surface. In the deposition process, CaSO4 crystals pass the stress load to muscovite, which is the reason for causing the porosity of muscovite particles in the leaching process of black shale. Strong tensile stress shall start with the six-membered ring cavity on muscovite (001) surface, thus breaking muscovite structure and then exposing more reaction interface. These reaction interfaces are full of dangling bonds, which makes the interfacial free energy increase. Equation (6) can be driven vastly on the reaction interface, which inevitably triggers muscovite structural dissolution.

4. Conclusions

In this study, it was shown that K2SO4 assistance was the most effective to the vanadium release from the black shale. When K2SO4 mediated the pressure acid leaching process, the vanadium leaching rate was still controlled by interior diffusion of H+ and muscovite–acid interfacial reaction, but the apparent activation energy of vanadium leaching decreased from 24.37 kJ/mol to 16.63 kJ/mol, which is a signal of the increasing leaching rate. The apparent reaction order of sulfuric acid decreased from 2.7 to 1.9, indicating the weaken leaching dependence on sulfuric acid.
The absorption simulation of Ca2+, K+, Na+, and SO42− on muscovite (001) surface can well explain the deposition process of CaSO4. Ca2+ is confirmed to be easily absorbed on the six-membered ring cavity of silicon-oxygen tetrahedrons in muscovite structure prior to K+ and Na+. Meanwhile, SO42− provides two oxygen atoms to bond with Ca2+ absorbed on muscovite (001) surface. Such continuous absorption and bonding of Ca2+ and SO42− creates CaSO4 deposition on muscovite (001) surface which involves the load transmitting. It can be deduced that starting with the six-membered ring cavity on muscovite (001) surface, CaSO4 crystals pass the stress load to the whole structure of muscovite. The stress load transmitting can correlate to pore formation in muscovite particles. The pore analysis helped us to prove that massive micropores initiated and proliferated in the existing pores under K2SO4 assistance. The porosity caused by CaSO4 deposition will greatly increase the reaction interface of muscovite dissolution and accelerate internal diffusion of H+ to the reaction interface, which can significantly weaken the vanadium leaching dependence on acid and accelerate the vanadium leaching rate.

Author Contributions

Conceptualization, N.X. and Y.Z.; methodology, N.X. and Q.Z.; software, Q.Z.; writing—original draft preparation, N.X.; writing—review and editing, N.X. and Y.Z. All authors have read and agreed to the published version of the manuscript.

Funding

This research was financially supported by National Key R&D Program of China (2018YFC1900500) and National Natural Science Foundation of China (No.51804226, 51774215).

Conflicts of Interest

The authors declare no conflict of interest.

References

  1. Xu, J.Q.; Chen, G.R.; Guo, F.; Xie, J.Q. Development of wide-temperature vanadium-based catalysts for selective catalytic reducing of NOx with ammonia: Review. Chem. Eng. J. 2018, 353, 507–518. [Google Scholar] [CrossRef]
  2. Aihemaiti, A.; Gao, Y.C.; Meng, Y.; Chen, X.J.; Liu, J.W.; Xiang, H.L.; Xu, Y.W.; Jiang, J.G. Review of plant-vanadium physiological interactions, bioaccumulation, and bioremediation of vanadium-contaminated sites. Sci. Total Environ. 2020, 712, 135637. [Google Scholar] [CrossRef] [PubMed]
  3. Lourenssen, K.; Williams, J.; Ahmadpour, F.; Clemmer, R.; Tasnim, S. Vanadium redox flow batteries: A comprehensive review. J. Energy Storage 2019, 25, 100844. [Google Scholar] [CrossRef]
  4. Gummow, B. Vanadium: Environmental pollution and health effects. In Encyclopedia of Environmental Health, 2nd ed.; Elsevier: Amsterdam, The Netherlands, 2011; pp. 19–326. [Google Scholar]
  5. Dai, S.F.; Zheng, X.; Wang, X.B.; Finkelman, R.B.; Jiang, Y.F.; Ren, D.Y.; Yan, X.Y.; Zhou, Y.P. Stone coal in China: A review. Int. Geol. Rev. 2018, 60, 736–753. [Google Scholar] [CrossRef]
  6. Fozia, A.; Muhammad, S.; Ata, A. Biohydrometallurgy techniques of low grade ores: A review on black shale. Hydrometallurgy 2012, 117, 1–12. [Google Scholar]
  7. Kelley, K.D.; Scott, C.T.; Polyak, D.E.; Kimball, B.E.; Schulz, K.J.; DeYoung, J.H., Jr.; Seal, R.R., II; Bradley, D.C. (Eds.) Critical Mineral Resources of the United States—Economic and Environmental Geology and Prospects for Future Supply: U.S. Geological Survey Professional Paper 1802; U.S. Geological Survey: Reston, VA, USA, 2017; pp. U1–U36.
  8. Northrop, H.R.; Goldhaber, M.B.; Landis, G.P.; Unruh, J.W.; Reynolds, R.L.; Campbell, J.A.; Wanty, R.B.; Grauch, R.I.; Whitney, G.; Rye, R.O. Genesis of the tabular-type vanadium-uranium deposits of the Henry basin. Econ. Geol. Utah 1990, 85, 215–269. [Google Scholar] [CrossRef]
  9. Zhang, Y.M.; Bao, S.X.; Liu, T.; Chen, T.J.; Huang, J. The technology of extracting vanadium from stone coal in China: History, current status and future prospects. Hydrometallurgy 2011, 109, 116–124. [Google Scholar] [CrossRef]
  10. Zhao, Y.L.; Zhang, Y.M.; Liu, T.; Chen, T.J.; Bian, Y.; Bao, S.X. Pre-concentration of vanadium from stone coal by gravity separation. Int. J. Miner. Process. 2013, 121, 1–5. [Google Scholar] [CrossRef]
  11. Wang, X.J.; Zhang, Y.M.; Liu, T.; Cai, Z.L. Influence of metal ions on muscovite and calcite flotation: With respect to the pre-treatment of vanadium bearing stone coal. Coll. Surf. A Physicochem. Eng. Asp. 2019, 564, 89–94. [Google Scholar] [CrossRef]
  12. Han, G.; Wen, S.M.; Wang, H.; Feng, Q.C. Selective adsorption mechanism of salicylic acid on pyrite surfaces and its application in flotation separation of chalcopyrite from pyrite. Sep. Purif. Technol. 2020, 240, 116650. [Google Scholar] [CrossRef]
  13. Zhao, W.J.; Liu, D.W.; Feng, Q.C. Enhancement of salicylhydroxamic acid adsorption by Pb(II) modified hemimorphite surfaces and its effect on floatability. Miner. Eng. 2020, 152, 106373. [Google Scholar] [CrossRef]
  14. Bickmore, B.R.; Bosbach, D.; Hochella, M.F., Jr.; Charlet, L.; Rufe, E. In situ atomic force microscopy study of hectorite and nontronite dissolution: Implications for phyllosilicate edge surface structures and dissolution mechanisms. Am. Mineral. 2001, 86, 411–423. [Google Scholar] [CrossRef]
  15. Rufe, E.; Hochella, M. Quantitative assessment of reactive surface area of phlogopite during acid dissolution. Science 1999, 285, 874–876. [Google Scholar] [CrossRef]
  16. Turpault, M.P.; Trotignon, L. The dissolution of biotite single crystals in dilute HNO3 at 24 °C: Evidence of an anisotropic corrosion process of micas in acidic solutions. Geochim. Cosmochim. Acta 1994, 58, 2761–2775. [Google Scholar] [CrossRef]
  17. Zheng, Q.S.; Zhang, Y.M.; Liu, T.; Huang, J.; Xue, N.N. Removal process of structural oxygen from tetrahedrons in muscovite during acid leaching of vanadium-bearing shale. Minerals 2018, 8, 208. [Google Scholar] [CrossRef] [Green Version]
  18. Azimi, G.; Papangelakis, V.G. The solubility of gypsum and anhydrite in simulated laterite pressure acid leach solutions up to 250 °C. Hydrometallurgy 2010, 102, 1–13. [Google Scholar] [CrossRef]
  19. Xue, N.N.; Zhang, Y.M.; Liu, T.; Huang, J.; Liu, H.; Chen, F. Mechanism of vanadium extraction from stone coal via hydrating and hardening of anhydrous calcium sulfate. Hydrometallurgy 2016, 166, 48–56. [Google Scholar] [CrossRef]
  20. Kresse, G.; Furthmüller, J. Efficiency of ab-initio total energy calculations for metals and semiconductors using a plane-wave basis set. Comp. Mater. Sci. 1996, 6, 15–50. [Google Scholar] [CrossRef]
  21. Kresse, G.; Hafner, J. Ab initio molecular dynamics for open-shell transition metals. Phys. Rev. B 1993, 48, 13115–13118. [Google Scholar] [CrossRef]
  22. Perdew, J.P.; Burke, K.; Wang, Y. Generalized gradient approximation for the exchange-correlation hole of a many-electron system. Phys. Rev. B 1996, 54, 16533–16539. [Google Scholar] [CrossRef] [PubMed] [Green Version]
  23. Perdew, J.P.; Chevary, J.A.; Vosko, S.H.; Jackson, K.A.; Pederson, M.R.; Singh, D.J.; Fiolhais, C. Atoms, molecules, solids, and surfaces: Applications of the generalized gradient approximation for exchange and correlation. Phys. Rev. B 1992, 46, 6671–6687. [Google Scholar] [CrossRef] [PubMed]
  24. Kresse, G.; Joubert, D. From ultrasoft pseudopotentials to the projector augmented-wave method. Phys. Rev. B 1999, 59, 1758–1775. [Google Scholar] [CrossRef]
  25. Blöchl, P.E. Projector augmented-wave method. Phys. Rev. B 1994, 50, 17953–17979. [Google Scholar] [CrossRef] [PubMed] [Green Version]
  26. Zheng, Q.; Zhang, Y.; Liu, T.; Huang, J.; Xue, N.N.; Shi, Q.H. Optimal location of vanadium in muscovite and its geometrical and electronic properties by DFT calculation. Minerals 2017, 7, 32. [Google Scholar] [CrossRef] [Green Version]
  27. Arabi-Karasgani, M.; Rashchi, F.; Mostoufi, N.; Vahidi, E. Leaching of vanadium from LD converter slag using sulfuric acid. Hydrometallurgy 2010, 102, 14–21. [Google Scholar] [CrossRef]
  28. Ke, Y.; Min, X.B.; Chai, L.Y.; Zhou, B.S.; Xue, K. Sulfidation behavior of Zn and ZnS crystal growth kinetics for Zn(OH)2-S-NaOH hydrothermal system. Hydrometallurgy 2016, 161, 166–173. [Google Scholar] [CrossRef]
  29. Eric, H.O.; Jacques, S.; Gauthier, M.J.; Teresa, H.R. An experimental study of the dissolution mechanism and rates of muscovite. Geochimica et Cosmochimica Acta 2008, 72, 4948–4961. [Google Scholar]
  30. Xoaotb, B.B. Coal and Gas Outburst; Song, S.Z.; Wang, Y.A., Translators; Industry Press: Beijing, China, 1966. [Google Scholar]
Figure 1. (a) XRD pattern of the black shale; (b) SEM-EDS patterns of the muscovite.
Minerals 10 00952 g001
Figure 2. Variation of vanadium leaching efficiency as a function of the three sulfate dosages with leaching temperature of 150 °C, leaching time of 5 h and acid concentration of 4 M.
Minerals 10 00952 g002
Figure 3. Variations of vanadium leaching efficiency as a function of leaching time with acid concentration of 4 M and K2SO4 dosage of 7 wt% at 110 °C, 130 °C, 150 °C, and 170 °C, respectively (a) and linear-fitting curves of Equations (2)–(4) (bd) basing on the data in (a). The dashed lines and hollow points represent the vanadium leaching efficiency and corresponding linear-fitting curves without K2SO4 addition, other leaching parameters being equal.
Minerals 10 00952 g003
Figure 4. Linear fitting curve of Arrhenius equation under mixed control.
Minerals 10 00952 g004
Figure 5. Variations of vanadium leaching efficiency as a function of leaching time with leaching temperature of 150 °C and K2SO4 dosage of 7 wt% at acid concentrations of 1 M, 2 M, 3 M, and 4 M, respectively, (a) and linear-fitting curves of Equation (4), (b) based on the data in (a). The dashed lines and hollow points represent the vanadium leaching efficiency and corresponding linear-fitting curves without K2SO4 addition, other leaching parameters being equal.
Minerals 10 00952 g005
Figure 6. Plot of lnk as a function of sulfuric acid concentration.
Minerals 10 00952 g006
Figure 7. Comparison of experimental and calculated values of the vanadium leaching efficiency.
Minerals 10 00952 g007
Figure 8. SEM patterns of the K2SO4-assisted leaching residues (KLR) obtained from leaching with 4 mol/L H2SO4 and 7wt% K2SO4 for (a) 25 min (100 °C), (b) 45 min (150 °C), (c) 1 h (150 °C), and (d) 5 h (150 °C) and the non-assisted leaching residues (NLR) obtained from contrast leaching with 4 mol/L H2SO4 for (e) 1 h (150 °C) and (f) 5 h (150 °C).
Minerals 10 00952 g008
Figure 9. XPS fine spectrums of Al2p in (a) the black shale, (b) the NLR and (c) the KLR obtained after leaching with 4 mol/L H2SO4 and 7wt% K2SO4 at 150 °C for 5 h.
Minerals 10 00952 g009
Figure 10. XRD patterns of the NLR (a) and the KLR (b) obtained after leaching with 4 mol/L H2SO4 and 7 wt% K2SO4 at 150 °C for 5 h.
Minerals 10 00952 g010
Figure 11. Pore to throat ratio of the KLR obtained after leaching at 45 min, 1 h, and 5 h with 4mol/L H2SO4 and 7 wt% K2SO4 under 150 °C (rp and rt respectively represent the pore size and the pore throat size that is the diameter of the thinnest part in porous channel).
Minerals 10 00952 g011
Figure 12. Pore size distribution in the KLR obtained from leaching for different time points with 4 mol/L H2SO4 and 7 wt% K2SO4 at 150 °C.
Minerals 10 00952 g012
Figure 13. Muscovite (001) surface (a), potential absorption sites of Ca(II), K(I), and Na(I) on muscovite (001) surface (b) and optimized bonding ways of sulfate ion on muscovite (001) surface after Ca(II) absorption (c).
Minerals 10 00952 g013
Figure 14. Absorption energy profile of Ca2+, K+, and Na+ on muscovite (001) surface (a) and binding energy of Ca2+ and SO42− on muscovite (001) surface (b).
Minerals 10 00952 g014
Table 1. Elemental compositions of the black shale (wt.%).
V2O5SiO2Al2O3Fe2O3CaOK2OMgONa2OBaOTiO2SCElse
0.7253.539.216.355.822.442.001.090.750.423.6010.303.73
Table 2. Vanadium valence distribution in the black shale (wt.%).
V(III)V(IV)V(V)Total V
75.424.60100
Table 3. A chain reaction from CaSO4·2H2O to CaSO4.
TemperatureReactions
T < 100 °CCaCO3(s) + H+ = Ca2+ + H2O + CO2
Ca2+ + SO42− + K2SO4 + H2O = K2Ca(SO4)2·H2O
K2Ca(SO4)2·H2O + H2O = CaSO4·2H2O(s) + K2SO4
T > 100 °CCaSO4·2H2O(s) = Ca2++SO42− + 2H2O
Ca2+ + SO42− = CaSO4(s)
Table 4. Pore characteristics of KLR based on the data of Figure 11.
PoreLeaching TimeProportion/%Pore Volume/mL·g−1Pore Surface Area/m2·g−1
Large pore45 min75.910.38070.3757
1 h70.970.34620.2744
5 h59.450.22940.2037
Mesopore45 min19.700.09880.4788
1 h24.110.11760.6532
5 h34.210.13200.7418
Transition pore45 min3.410.01712.8821
1 h4.180.02042.9374
5 h5.000.01933.2427
Micropore45 min0.980.00495.1398
1 h0.740.00363.5296
5 h1.350.00525.3163
Publisher’s Note: MDPI stays neutral with regard to jurisdictional claims in published maps and institutional affiliations.

