Predictive Model of Setting Times and Compressive Strengths for Low-Alkali, Ambient-Cured, Fly Ash/Slag-Based Geopolymers


Abstract
1. Introduction
- Curing Conditions: Curing in air-tight conditions can improve the strengths [46].
2. Materials and Methods
2.1. Materials
2.1.1. SCMs
2.1.2. Alkaline Activator
2.1.3. Fine Aggregate
2.1.4. Mix Design
2.1.5. Mixing, Sample Preparation, and Curing
- The fly ash and blast furnace slag were dry mixed in a 5 L Hobart mixer for 3 min.
- The alkaline activator solution was added to the mix and blended in the Hobart mixer for 5 min in order to activate the fly ash and blast furnace slag.
- Sand was added and the mixing continued for a further 5 min.
- The majority of the blended mix was transferred to a brass mould and spread into sixteen individual mould cavities.
- Mould filling was optimised by vibratory casting for 3 min on a vibrating table.
- Insufficient filling was compensated by supplementation from the remainder in the Hobart mixer bowl; excess filling was removed by guillotine scraping. These procedures were followed by additional vibratory casting for 1 min.
- The mould was placed in a zip-lock plastic bag and sealed without removing excess air.
- The cast samples were cured for 24 h at 23 ± 2 °C.
- The samples were removed from the mould, placed in an air-tight plastic container (7 L volume), which contained a bowl of water (200 mL volume), and retained as such until testing.
2.2. Methods
2.2.1. Setting Time
2.2.2. Compressive Strength
3. Results
3.1. Setting Time
3.2. Compressive Strength Data
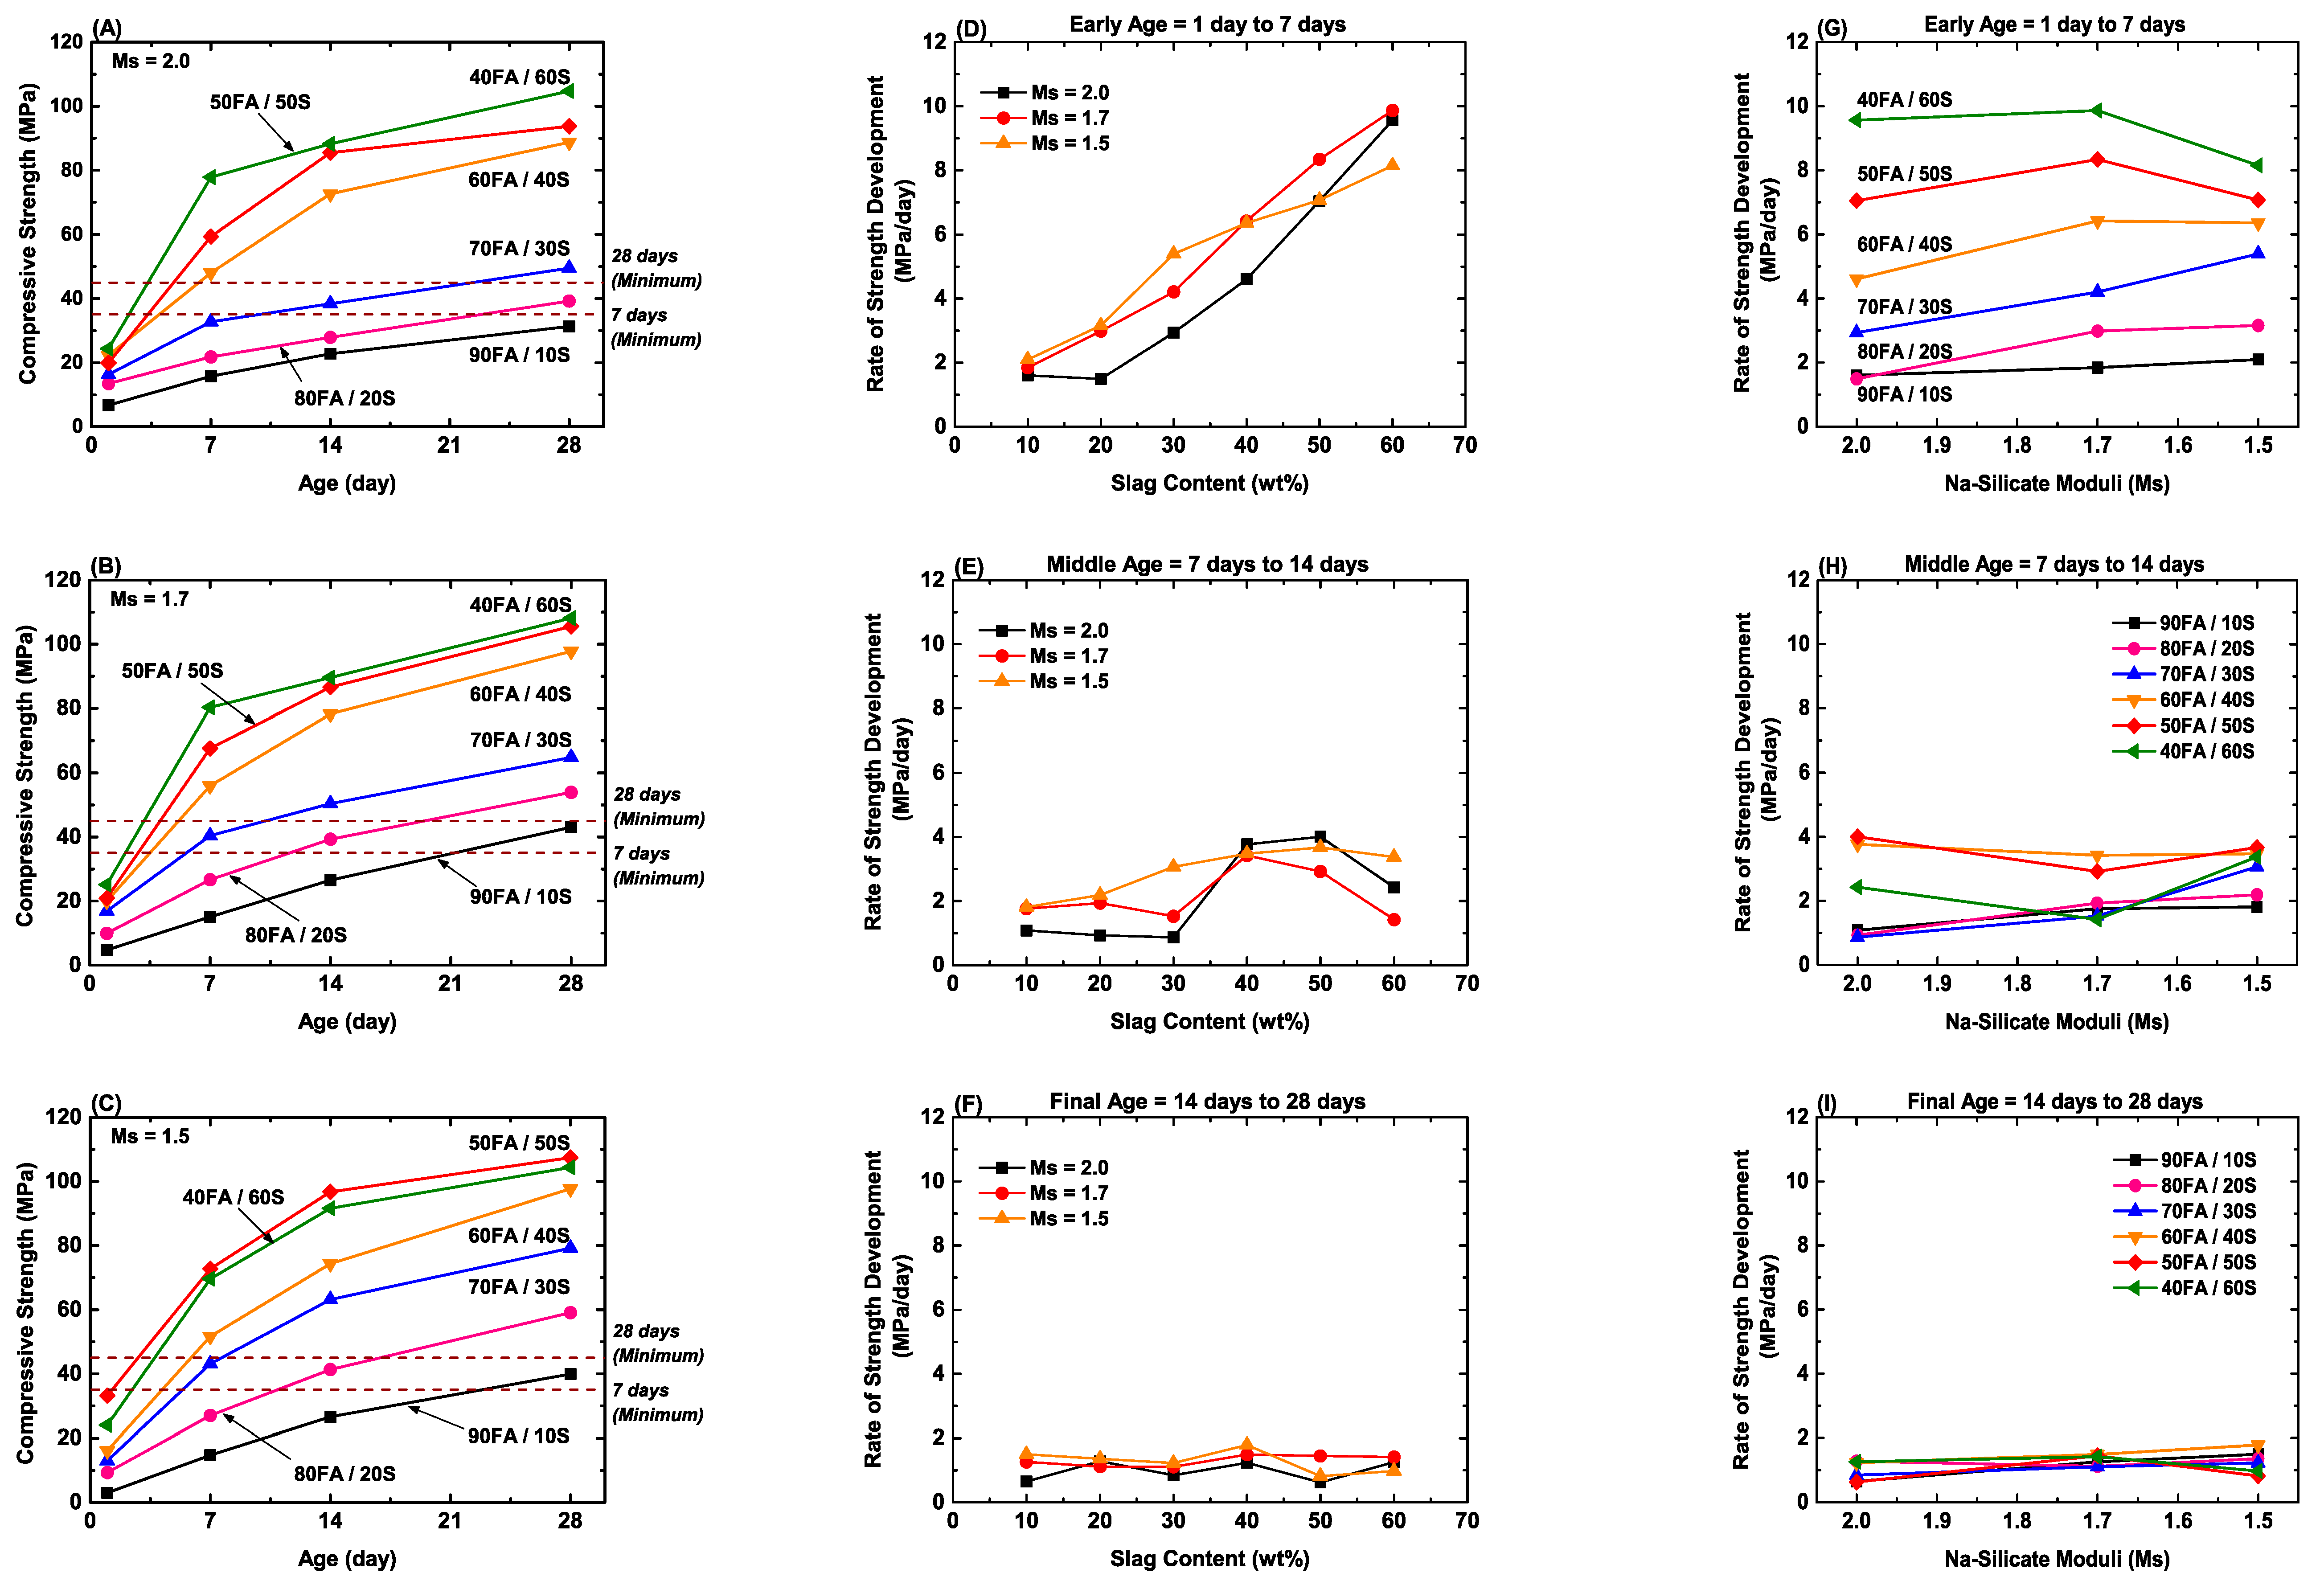
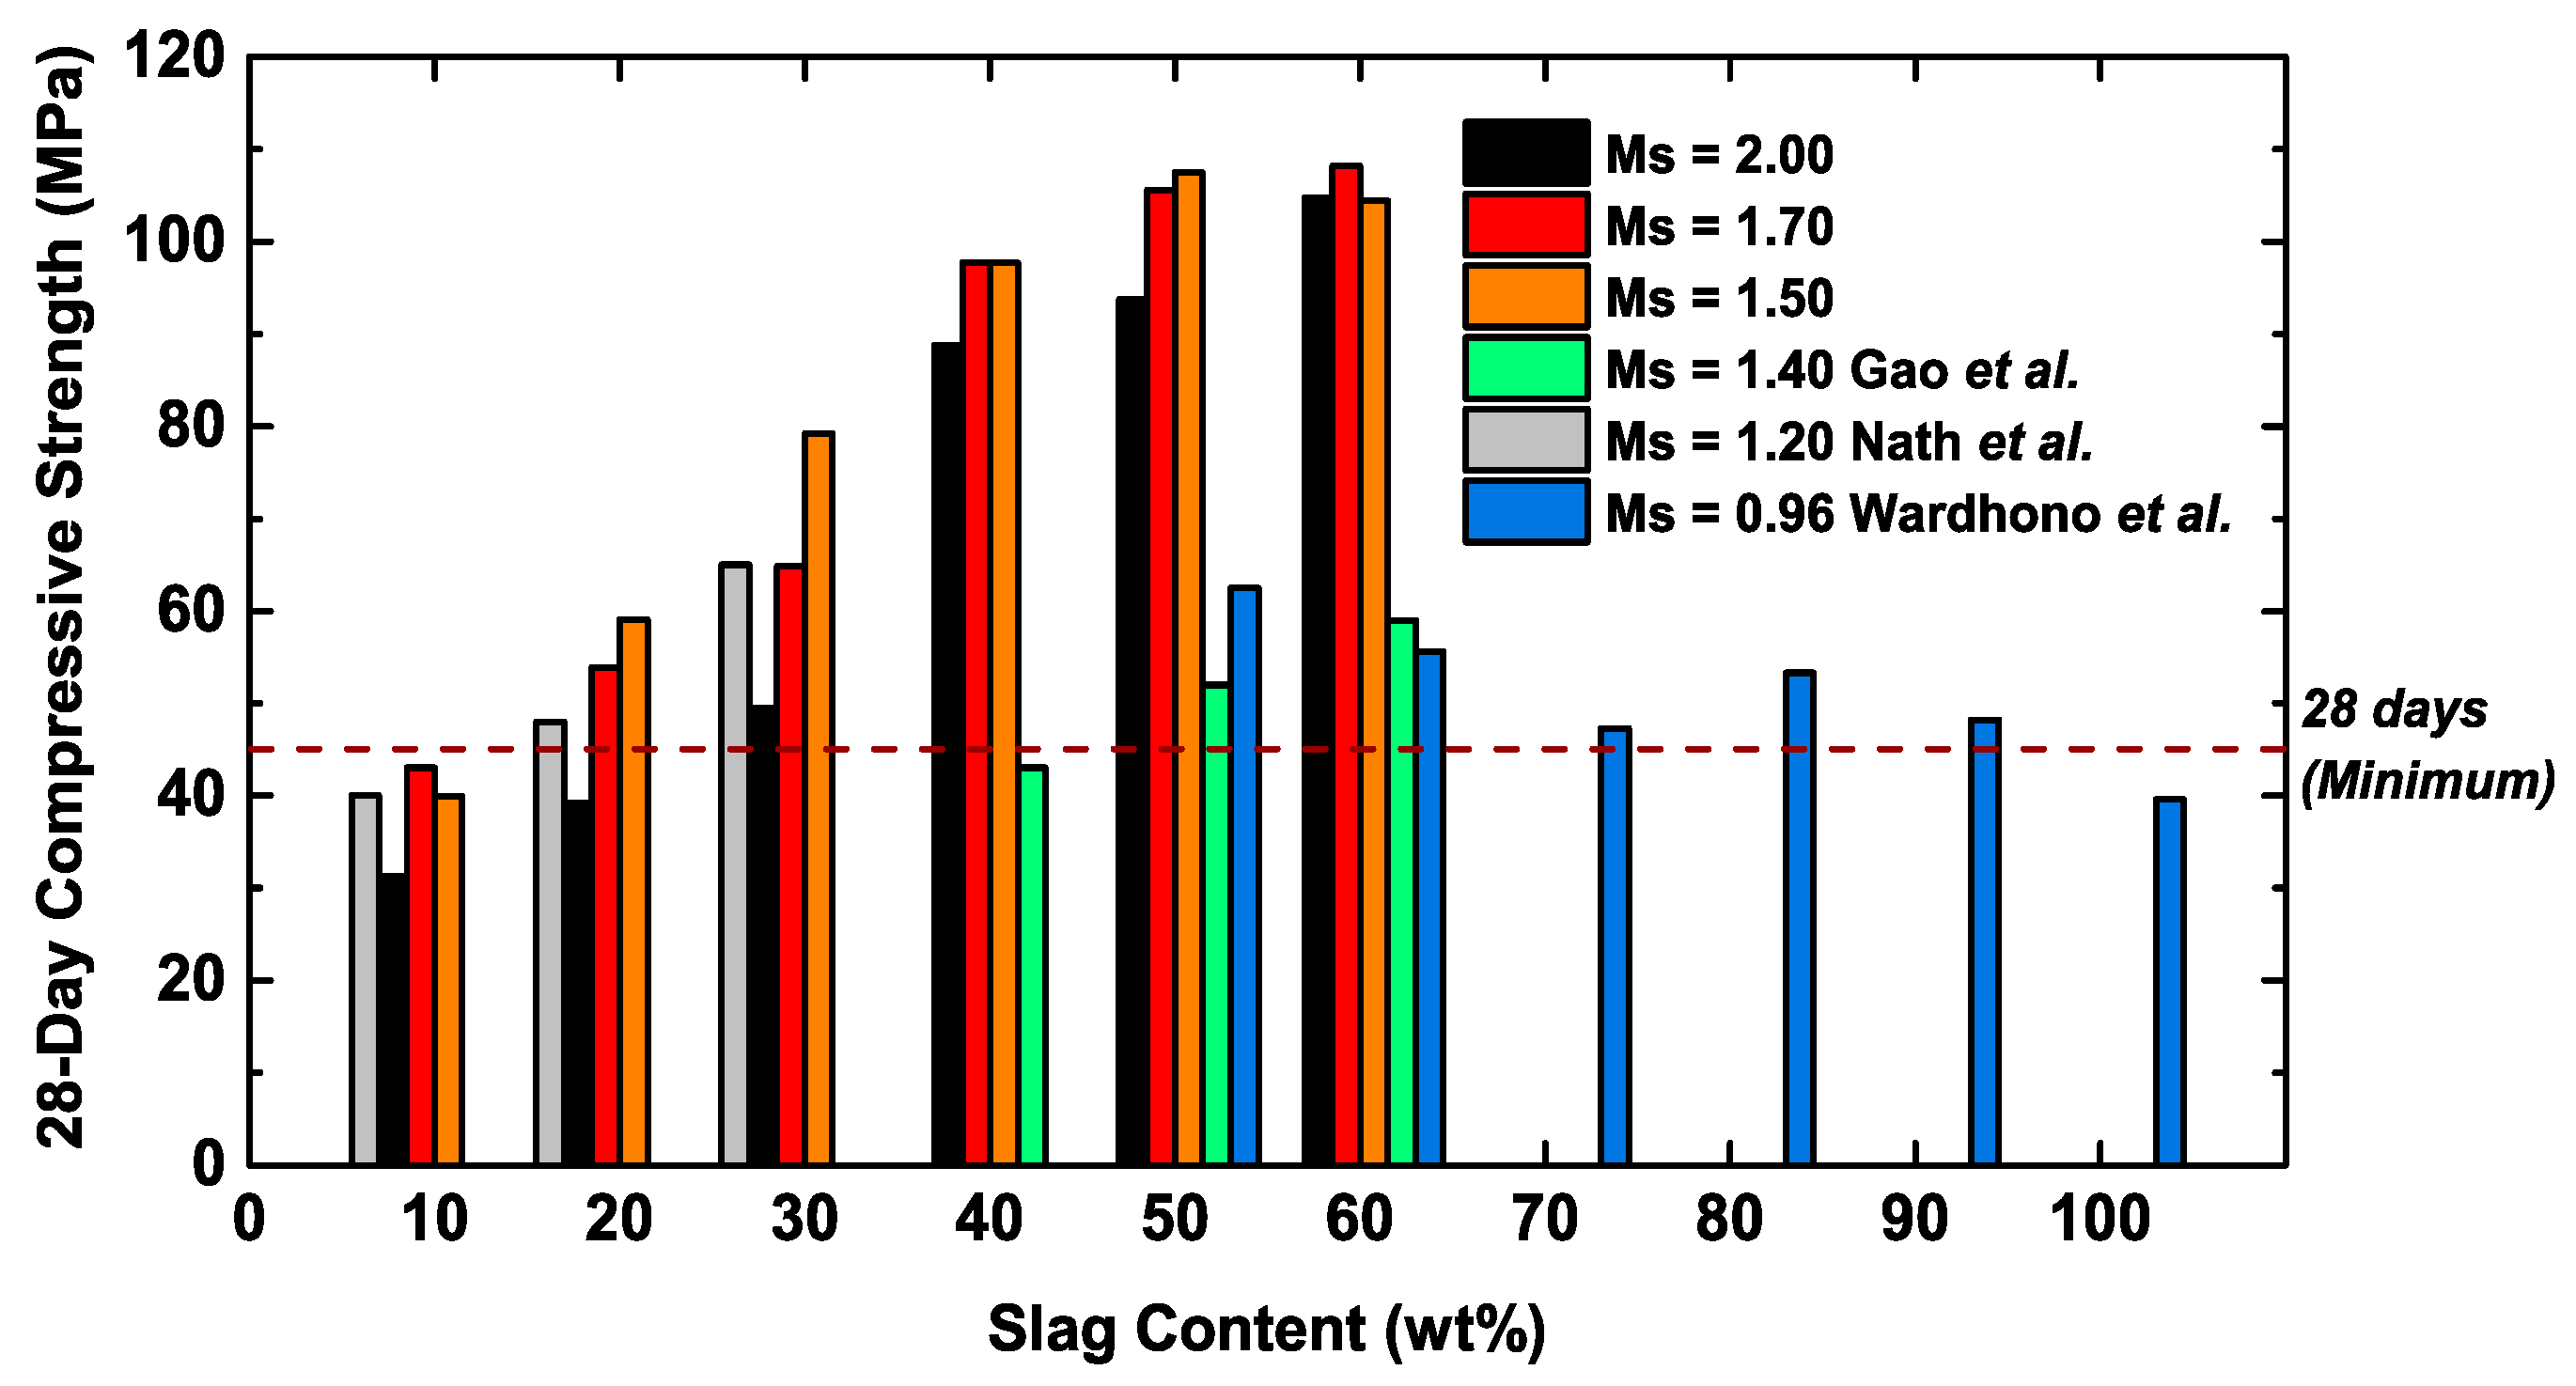
- Figure 6A–C show that the compressive strengths fall into regimes of low FA/S ratios (high-compressive strengths) and high FA/S ratios (low-compressive strengths).
- Figure 6A–F show that the kinetics of compressive strength development fall into regimes of rapid reaction (1–7 days) and slower reaction (14–28 days).
- Figure 6G–I show that the Ms has a decreasing effect on the rate of compressive strength development as the age increases.
- Figure 6G shows that the FA/S ratio and Ms exhibit competing effects at early age (1–7 days), where:
- High FA/S ratios: Low Ms decreases the rate of compressive strength development.
- Low FA/S ratios: Low Ms increases the rate of compressive strength development.
- Figure 6G also shows that for high FA/S ratios, the early age rate of compressive strength development is greatest for Ms = 1.7.
- Figure 6E suggests that there is a difference between the middle age compressive strength development between the lowest Ms and the two higher Ms. The elucidation of the specific reaction mechanisms of the geopolymerisation process currently is underway. Concerning the present data, it is likely that the geopolymerisation mechanisms can be differentiated between Ms of 1.5 and that of Ms of 1.7 and 2.0. The rapid increase in the rate of strength development between 30 and 40 wt% slag content for Ms of 1.7 and 2.0 suggests that the greater homogeneity of blast furnace slag relative to fly ash and the stress concentrations associated with the presence of crystalline quartz and mullite in the latter [10,66] equate to a shift from an inhomogeneous to a homogeneous microstructure at the transition. Conversely, the absence of the rapid increase in the rate of strength development for Ms of 1.5 results from greater influence of the Ms over that of the mineralogy. This is discussed in more detail below.
- More generally, these data suggest that a minimal slag content of 40 wt% can be expected to yield the most reproducible behaviour and hence, the greatest similarity in geopolymerisation mechanisms.
- Figure 6A–C,G–I demonstrate the highest compressive strengths and the most rapid compressive strength development results from minimal slag contents of 40 wt%.
3.3. Prediction of Long-Term Compressive Strength
4. Conclusions
4.1. Mix Design
- These mixes fail to meet both the final setting time and compressive strength requirements due to sluggish kinetics.
- These mixes have the most flexible setting times, but they fail to meet the compressive strength requirement.
- These mixes have high compressive strengths but, owing to the high blast furnace slag content, they set too quickly; also, there is no strength increase at slag contents >50 wt%.
- These mixes exhibit the most flexible setting times for those that meet the compressive strength requirement; however, at the slag content of 30 wt%, the compressive strengths depend on the Ms (Figure 6), which makes the process sensitive to the alkalinity of the activator.
- These mixes pass both the setting time and strength requirements, representing reproducible mix designs in terms of both blast furnace slag content and Ms; the mix in region 6 is optimal in that it shows the highest extrapolated ultimate compressive strength (~132 MPa at 60FA/40S at Ms = 1.7).
4.2. Predictive Models
- Variation of the alkaline activator/SCMs mass ratio;
- Variation of the water/binder mass ratio;
- Interpolative refinement of the Ms <1.50 and in the range 1.70–2.00;
- Optimisation of the sand/SCMs mass ratio <2.00 [63];
- Alteration of the alkaline activator from sodium silicate to potassium silicate;
- Variation in the fly ash type (Class C, Class F), mineralogy, glass chemistry, and particle size/surface area;
- Variation of the slag mineralogy, glass chemistry, and particle size/surface area.
Supplementary Materials
Author Contributions
Funding
Acknowledgments
Conflicts of Interest
References
- McLellan, B.C.; Williams, R.P.; Lay, J.; van Riessen, A.; Corder, G.D. Costs and Carbon Emissions for Geopolymer Pastes in Comparison to Ordinary Portland Cement. J. Clean. Prod. 2011, 19, 1080–1090. [Google Scholar] [CrossRef]
- Müller, N.; Harnisch, J. A Blueprint for a Climate Friendly Cement Industry; WWF International: Gland, Switzerland, 2007. [Google Scholar]
- Thomas, M. Supplementary Cementing Materials in Concrete; CRC Press: Boca Raton, FL, USA, 2013. [Google Scholar]
- Aldred, J.; Day, J. Is Geopolymer Concrete a Suitable Alternative to Traditional Concrete? In Proceedings of the 37th Conference on Our World in Concrete & Structures, Singapore, 29–31 August 2012; pp. 29–31. [Google Scholar]
- Milliken Infrastructure Solutions. Milliken GeoSprayTM Geopoymer Mortar: GeoSpray™ Geopolymer Mortar System for Structural Rehabilitation of Sewer and Storm Water Infrastructure; Milliken Infrastructure Solutions: Lafayette, CO, USA, 2013. [Google Scholar]
- Kosmatka, S.H.; Kerkhoff, B.; Panarese, W.C. Design and Control of Concrete Mixtures, 14th ed.; Portland Cement Association: Skokie, IL, USA, 2008. [Google Scholar]
- Davidovits, J. Geopolymer Chemistry and Applications, 2nd ed.; Institut Geopolymere: Saint-Quentin, France, 2008. [Google Scholar]
- Pavel, R. Effect of Curing Temperature on the Development of Hard Structure of Metakolin-Based Geopolymer. Constr. Build. Mater. 2010, 24, 1176–1183. [Google Scholar]
- Bakria, A.M.M.A.; Kamarudin, H.; BinHussain, M.; Nizar, I.K.; Zarina, Y.; Rafiza, A.R. The Effect of Curing Temperature on Physical and Chemical Properties of Geopolymers. Phys. Procedia 2011, 22, 286–291. [Google Scholar] [CrossRef]
- Ismail, I.; Bernal, S.A.; Provis, J.L.; San Nicolas, R.; Hamdan, S.; van Deventer, J.S.J. Modification of Phase Evolution in Alkali-Activated Blast Furnace Slag by the Incorporation of Fly Ash. Cem. Concr. Compos. 2014, 45, 125–135. [Google Scholar] [CrossRef]
- Temuujin, J.; van Riessen, A. Effect of Fly Ash Preliminary Calcination on the Properties of Geopolymer. J. Hazard. Mater. 2009, 164, 634–639. [Google Scholar] [CrossRef]
- Görhan, G.; Kürklü, G. The Influence of the NaOH Solution on the Properties of the Fly Ash-Based Geopolymer Mortar Cured at Different Temperatures. Compos. B. Eng. 2014, 58, 371–377. [Google Scholar] [CrossRef]
- Temuujin, J.; Williams, R.P.; van Riessen, A. Effect of Mechanical Activation of Fly Ash on the Properties of Geopolymer Cured at Ambient Temperature. J. Mater. Process. Technol. 2009, 209, 5276–5280. [Google Scholar] [CrossRef]
- Temuujin, J.; van Riessen, A.; Williams, R. Influence of Calcium Compounds on the Mechanical Properties of Fly Ash Geopolymer Pastes. J. Hazard. Mater. 2009, 167, 82–88. [Google Scholar] [CrossRef]
- Kingery, W.D. Introduction to Ceramics; Wiley: New York, NY, USA, 1960. [Google Scholar]
- Duxson, P.; Provis, J.L.; Lukey, G.C.; van Deventer, J.S.J. The Role of Inorganic Polymer Technology in the Development of ‘Green Concrete’. Cem. Concr. Res. 2007, 37, 1590–1597. [Google Scholar] [CrossRef]
- Turner, L.K.; Collins, F.G. Carbon Dioxide Equivalent (CO2-e) Emissions: A Comparison between Geopolymer and OPC Cement Concrete. Constr. Build. Mater. 2013, 43, 125–130. [Google Scholar] [CrossRef]
- Provis, J.L.; Palomo, A.; Shi, C. Advances in Understanding Alkali-Activated Materials. Cem. Concr. Res. 2015, 78, 110–125. [Google Scholar] [CrossRef]
- Ouellet-Plamondon, C.; Habert, G. Chapter 25—Life Cycle Assessment (LCA) of Alkali-Activated Cements and Concretes. In Handbook of Alkali-Activated Cements, Mortars and Concretes; Pacheco-Torgal, F., Labrincha, J., Leonelli, C., Palomo, A., Chindaprasit, P., Eds.; Woodhead Publishing: Oxford, UK, 2015; pp. 663–686. [Google Scholar]
- Gartner, E. Industrially Interesting Approaches to “Low-CO2” Cements. Cem. Concr. Res. 2004, 34, 1489–1498. [Google Scholar] [CrossRef]
- Lyon, R.E.; Balaguru, P.N.; Foden, A.; Sorathia, U.; Davidovits, J.; Davidovics, M. Fire-Resistant Aluminosilicate Composites. Fire Mater. 1997, 21, 67–73. [Google Scholar] [CrossRef]
- Chindaprasirt, P.; Chareerat, T.; Hatanaka, S.; Cao, T. High-Strength Geopolymer Using Fine High-Calcium Fly Ash. J. Mater. Civ. Eng. 2011, 23, 264–270. [Google Scholar] [CrossRef]
- Davidovits, J.; Davidovits, R.; Davidovits, M. Geopolymeric Cement Based on Fly Ash and Harmless to Use. U.S. Patent 8,202,362 B2, 19 June 2012. [Google Scholar]
- Heidrich, C.; Feuerborn, H.-J.; Weir, A. Coal Combustion Products: A Global Perspective. In Proceedings of the 2013 World Coal Ash (WOCA) Conference, Lexington, KY, USA, 22–25 April 2013; pp. 22–25. [Google Scholar]
- Diaz, E.I.; Allouche, E.N.; Eklund, S. Factors Affecting the Suitability of Fly Ash as Source Material for Geopolymers. Fuel 2010, 89, 992–996. [Google Scholar] [CrossRef]
- Duxson, P.; Provis, J.L. Designing Precursors for Geopolymer Cements. J. Am. Ceram. Soc. 2008, 91, 3864–3869. [Google Scholar] [CrossRef]
- Kong, D.L.Y.; Sanjayan, J.G. Effect of Elevated Temperatures on Geopolymer Paste, Mortar and Concrete. Cem. Concr. Res 2010, 40, 334–339. [Google Scholar] [CrossRef]
- Bakharev, T. Thermal Behaviour of Geopolymers Prepared using Class F Fly Ash and Elevated Temperature Curing. Cem. Concr. Res. 2006, 36, 1134–1147. [Google Scholar]
- Somna, K.; Jaturapitakkul, C.; Kajitvichyanukul, P.; Chindaprasirt, P. NaOH-Activated Ground Fly Ash Geopolymer Cured at Ambient Temperature. Fuel 2011, 90, 2118–2124. [Google Scholar]
- Xie, J.; Kayali, O. Effect of Initial Water Content and Curing Moisture Conditions on the Development of Fly Ash-Based Geopolymers in Heat and Ambient Temperature. Constr. Build. Mater. 2014, 67, 20–28. [Google Scholar] [CrossRef]
- Puertas, F.; Martı́nez-Ramı́rez, S.; Alonso, S.; Vázquez, T. Alkali-Activated Fly Ash/Slag Cements: Strength Behaviour and Hydration Products. Cem. Concr. Res 2000, 30, 1625–1632. [Google Scholar] [CrossRef]
- Noushini, A.; Babaee, M.; Castel, A. Suitability of Heat-Cured Low-Calcium Fly Ash-Based Geopolymer Concrete for Precast Applications. Mag. Concr. Res. 2016, 68, 163–177. [Google Scholar] [CrossRef]
- Wallah, S.; Rangan, B.V. Low-Calcium Fly Ash-Based Geopolymer Concrete: Long-Term Properties; Curtin University of Technology: Perth, Australia, 2006. [Google Scholar]
- Fernández-Jiménez, A.; Garcia-Lodeiro, I.; Palomo, A. Durability of Alkali-Activated Fly Ash Cementitious Materials. J. Mater. Sci. 2007, 42, 3055–3065. [Google Scholar] [CrossRef]
- Sumajouw, D.M.J.; Hardjito, D.; Wallah, S.E.; Rangan, B.V. Fly Ash-Based Geopolymer Concrete: Study of Slender Reinforced Columns. J. Mater. Sci. 2007, 42, 3124–3130. [Google Scholar]
- Castel, A.; Foster, S.J.; Ng, T.; Sanjayan, J.G.; Gilbert, R.I. Creep and Drying Shrinkage of a Blended Slag and Low Calcium Fly Ash Geopolymer Concrete. Mater. Struct. 2016, 49, 1619–1628. [Google Scholar] [CrossRef]
- Sarker, P.K.; Haque, R.; Ramgolam, K.V. Fracture Behaviour of Heat Cured Fly Ash Based Geopolymer Concrete. Mater. Des. 2013, 44, 580–586. [Google Scholar] [CrossRef]
- Castel, A.; Foster, S.J. Bond Strength between Blended Slag and Class F Fly Ash Geopolymer Concrete with Steel Reinforcement. Cem. Concr. Res. 2015, 72, 48–53. [Google Scholar] [CrossRef]
- Kumar, S.; Kumar, R.; Mehrotra, S. Influence of Granulated Blast Furnace Slag on the Reaction, Structure and Properties of Fly Ash Based Geopolymer. J. Mater. Sci. 2010, 45, 607–615. [Google Scholar] [CrossRef]
- Nath, P.; Sarker, P.K. Effect of GGBFS on Setting, Workability and Early Strength Properties of Fly Ash Geopolymer Concrete Cured in Ambient Condition. Constr. Build. Mater. 2014, 66, 163–171. [Google Scholar] [CrossRef]
- Fernández-Jiménez, A.; Puertas, F.; Sobrados, I.; Sanz, J. Structure of Calcium Silicate Hydrates Formed in Alkaline-Activated Slag: Influence of the Type of Alkaline Activator. J. Am. Ceram. Soc. 2003, 86, 1389–1394. [Google Scholar] [CrossRef]
- Liebau, F. Structural Chemistry of Silicates: Structure, Bonding, and Classification; Springer: Berlin/Heidelberg, Germany, 1985. [Google Scholar]
- De Silva, P.; Sagoe-Crenstil, K.; Sirivivatnanon, V. Kinetics of Geopolymerization: Role of Al2O3 and SiO2. Cem. Concr. Res. 2007, 37, 512–518. [Google Scholar] [CrossRef]
- Gao, X.; Yu, Q.; Brouwers, H. Reaction Kinetics, Gel Character and Strength of Ambient Temperature Cured Alkali Activated Slag–Fly Ash Blends. Constr. Build. Mater. 2015, 80, 105–115. [Google Scholar] [CrossRef]
- Phoo-ngernkham, T.; Sata, V.; Hanjitsuwan, S.; Ridtirud, C.; Hatanaka, S.; Chindaprasirt, P. High Calcium Fly Ash Geopolymer Mortar Containing Portland Cement for Use as Repair Material. Constr. Build. Mater. 2015, 98, 482–488. [Google Scholar] [CrossRef]
- Giasuddin, H.M.; Sanjayan, J.G.; Ranjith, P.G. Strength of Geopolymer Cured in Saline Water in Ambient Conditions. Fuel 2013, 107, 34–39. [Google Scholar] [CrossRef]
- Kumar, R.; Kumar, S.; Mehrotra, S.P. Towards Sustainable Solutions for Fly Ash through Mechanical Activation. Resour. Conserv. Recycl. 2007, 52, 157–179. [Google Scholar] [CrossRef]
- Yip, C.K.; Lukey, G.C.; Provis, J.L.; van Deventer, J.S.J. Effect of Calcium Silicate Sources on Geopolymerisation. Cem. Concr. Res. 2008, 38, 554–564. [Google Scholar] [CrossRef]
- Suwan, T.; Fan, M. Influence of OPC Replacement and Manufacturing Procedures on the Properties of Self-Cured Geopolymer. Constr. Build. Mater. 2014, 73, 551–561. [Google Scholar] [CrossRef]
- Inti, S.; Sharma, M.; Tandon, V. Influence of Curing on the Properties of Geopolymer Mortar Made with Low Molarity Sodium Hydroxide. Transp. Dev. Econ. 2017, 3, 11. [Google Scholar] [CrossRef]
- Morsy, M.S.; Alsayed, S.H.; Al-Salloum, Y.; Almusallam, T. Effect of Sodium Silicate to Sodium Hydroxide Ratios on Strength and Microstructure of Fly Ash Geopolymer Binder. Arab. J. Sci. Eng. 2014, 39, 4333–4339. [Google Scholar] [CrossRef]
- Wardhono, A.; Law, D.W.; Strano, A. The Strength of Alkali-activated Slag/fly Ash Mortar Blends at Ambient Temperature. Procedia Eng. 2015, 125, 650–656. [Google Scholar] [CrossRef]
- Chi, M.C.; Liu, Y.C. Effects of Fly Ash/Slag Ratio and Liquid/Binder Ratio on Strength of Alkali-Activated Fly Ash/Slag Mortars. Appl. Mech. Mater. 2013, 377, 50–54. [Google Scholar] [CrossRef]
- Gao, X.; Yu, Q.L.; Brouwers, H.J.H. Properties of Alkali Activated Slag–Fly Ash Blends with Limestone Addition. Cem. Concr. Compos. 2015, 59, 119–128. [Google Scholar] [CrossRef]
- ASTM C150/C150M-12. Standard Specification for Portland Cement; ASTM International: West Conshohocken, PA, USA, 2012. [Google Scholar]
- AS 3972-2010. General Purpose and Blended Cements; Standards Australia Limited: Sydney, Australia, 2010. [Google Scholar]
- Diamond, S. On the Glass Present in Low-Calcium and in High-Calcium Flyashes. Cem. Concr. Res. 1983, 13, 459–464. [Google Scholar] [CrossRef]
- ASTM C128-15. Standard Test Method for Relative Density (Specific Gravity) and Absorption of Fine Aggregate; ASTM International: West Conshohocken, PA, USA, 2015. [Google Scholar]
- Zhang, Z.; Provis, J.L.; Reid, A.; Wang, H. Geopolymer Foam Concrete: An Emerging Material for Sustainable Construction. Constr. Build. Mater. 2014, 56, 113–127. [Google Scholar] [CrossRef]
- Provis, J.L.; Yong, C.Z.; Duxson, P.; van Deventer, J.S.J. Correlating Mechanical and Thermal Properties of Sodium Silicate-Fly Ash Geopolymers. Colloids Surf. A 2009, 336, 57–63. [Google Scholar] [CrossRef]
- Xie, Z.; Xi, Y. Hardening Mechanisms of an Alkaline-Activated Class F Fly Ash. Cem. Concr. Res. 2001, 31, 1245–1249. [Google Scholar] [CrossRef]
- Sun, P. Fly Ash Based Inorganic Polymeric Building Material. Ph.D. Thesis, Wayne State University, Detroit, MI, USA, 2005. [Google Scholar]
- Thakur, R.N.; Ghosh, S. Effect of Mix Composition on Compressive Strength and Microstructure of Fly Ash Based Geopolymer Composites. Int. J. Appl. Eng. Res. 2009, 4, 68–74. [Google Scholar]
- Temuujin, J.; van Riessen, A.; MacKenzie, K.J.D. Preparation and Characterisation of Fly Ash Based Geopolymer Mortars. Constr. Build. Mater. 2010, 24, 1906–1910. [Google Scholar] [CrossRef]
- ASTM C191-13. Standard Test Methods for Time of Setting of Hydraulic Cement by Vicat Needle; ASTM International: West Conshohocken, PA, USA, 2013. [Google Scholar]
- ASTM C109/C109M-13. Standard Test Method for Compressive Strength of Hydraulic Cement Mortars (Using 2-in. or [50-mm] Cube Specimens); ASTM International: West Conshohocken, PA, USA, 2013. [Google Scholar]
- Morrell, R. Handbook of Properties of Technical and Engineering Ceramics; H.M. Stationary Office: Ann Arbor, MI, USA, 1985.
- Hamad, A.J. Size and Shape Effect of Specimen on the Compressive Strength of HPLWFC Reinforced with Glass Fibres. J. King Saud Univ. Eng. Sci. 2017, 29, 373–380. [Google Scholar] [CrossRef]
- Fernández-Jiménez, A.M.; Palomo, A.; López-Hombrados, C. Engineering Properties of Alkali-Activated Fly Ash Concrete. ACI Mater. 2006, 103, 106–112. [Google Scholar]
- Rao, G.M.; Rao, T.D.G. Final Setting Time and Compressive Strength of Fly Ash and GGBS-Based Geopolymer Paste and Mortar. Arab. J. Sci. Eng. 2015, 40, 3067–3074. [Google Scholar]
- Criado, M.; Fernández-Jiménez, A.; Palomo, A. Alkali Activation of Fly Ash: Effect of the SiO2/Na2O Ratio: Part I: FTIR Study. Micropor. Mesopor. Mater. 2007, 106, 180–191. [Google Scholar] [CrossRef]
- Dong, M.; Elchalakani, M.; Karrech, A. Development of High Strength One-Part Geopolymer Mortar using Sodium Metasilicate. Constr. Build. Mater. 2020, 236, 117611. [Google Scholar] [CrossRef]


 ; compressive strength
  ; (fail) initial setting time
  ; final setting time
  ; compressive strength
  .
; compressive strength ; (fail) initial setting time ; final setting time ; compressive strength .
.
; compressive strength ; (fail) initial setting time ; final setting time ; compressive strength .

| Aluminosilicate Source 1 | Alkaline Activator Proportions | Mix 3A:L:S | w/b 4 | Specimen | Curing Conditions | Compressive Strength (MPa) | Reference | |||||
|---|---|---|---|---|---|---|---|---|---|---|---|---|
| Fly Ash | Slag | Components | Mix | Shape | Size (mm) | Temperature (°C) | Age (Day) | |||||
| Na2SiO3 | NaOH | Silicate Modulus 2 | ||||||||||
| 70% | 30% | Ms = 2.78 | 14 M | Ms = 1.20 | 1.0:0.4:1.6 | 0.20 | Cube | 50 × 50 × 50 | 23 | 28 | 65.0 | [40] |
| 80% | 20% | 48.0 | ||||||||||
| 90% | 10% | 40.0 | ||||||||||
| 100% | - | 26.0 | ||||||||||
| - | 100% | Ms = 2.06 | 15 M | Ms = 0.96 | 1.0:0.75:2.75 | 0.66 | Cube | 50 × 50 × 50 | 20 | 28 | 39.6 | [52] |
| 10% | 90% | 48.2 | ||||||||||
| 20% | 80% | 53.3 | ||||||||||
| 30% | 70% | 47.3 | ||||||||||
| 40% | 60% | 55.6 | ||||||||||
| 50% | 50% | 62.5 | ||||||||||
| 100% | - | Ms = 2.39 | 6 M | Ms = 1.52 | 1.0:0.6:1.0 | - | Cube | 50 × 50 × 50 | 25 | 28 | 38.5 | [45] |
| 10 M | Ms = 1.25 | 50.5 | ||||||||||
| 14 M | Ms = 1.06 | 56.0 | ||||||||||
| - | 100% | Ms = 2.03 | - | Ms = 1.00 | 1.0:0.16:2.75 | 0.35 | Cube | 50 × 50 × 50 | 25 | 28 | 73.0 | [53] |
| 50% | 50% | 98.0 | ||||||||||
| 100% | - | 22.0 | ||||||||||
| - | 100% | 0.50 | 64.0 | |||||||||
| 50% | 50% | 89.0 | ||||||||||
| 100% | - | 20.0 | ||||||||||
| - | 100% | 0.65 | 35.0 | |||||||||
| 50% | 50% | 30.0 | ||||||||||
| 100% | - | 19.0 | ||||||||||
| 40% | 60% | Ms = 3.41 | - | Ms = 1.40 | 1.0:0.57:3.0 | 0.45 | Cube | 40 × 40 × 40 | 20 | 28 | 59.0 | [54] |
| 50% | 50% | 52.0 | ||||||||||
| 60% | 40% | 43.0 | ||||||||||
| Parameter | Criteria | ASTM C150 Type I | AS 3972 Type GP |
|---|---|---|---|
| Setting Time | Minimum | 45 min | 45 min |
| Maximum | 375 min | 360 min | |
| Mortar Compressive Strength | 3 days (min) | 12 MPa | - |
| 7 days (min) | 19 MPa | 35 MPa | |
| 28 days (min) | - | 45 MPa |
| Oxide | Fly Ash (wt%) | Slag (wt%) |
|---|---|---|
| SiO2 | 64.63 | 33.84 |
| Al2O3 | 24.40 | 13.76 |
| Na2O | 0.73 | 0.38 |
| K2O | 2.31 | 0.28 |
| CaO | 1.68 | 41.75 |
| MgO | 0.63 | 5.59 |
| Fe2O3 | 2.91 | 0.56 |
| SO3 | 0.14 | 2.42 |
| Loss on Ignition (LOI) | 1.34 | 0.13 |
| Total | 98.77 | 98.71 |
| Mix No. 1 | FA/S 2 | Fly Ash | Slag | Na2SiO3 | NaOH | Sand 3 | Free Water |
|---|---|---|---|---|---|---|---|
| Ms = 2.0 | |||||||
| 1 | 90/10 | 641.4 | 71.3 | 356.3 | 0.0 | 1069.0 | 62.0 |
| 2 | 80/20 | 570.1 | 142.5 | 356.3 | 0.0 | 1069.0 | 62.0 |
| 3 | 70/30 | 498.9 | 213.8 | 356.3 | 0.0 | 1069.0 | 62.0 |
| 4 | 60/40 | 427.6 | 285.1 | 356.3 | 0.0 | 1069.0 | 62.0 |
| 5 | 50/50 | 356.3 | 356.3 | 356.3 | 0.0 | 1069.0 | 62.0 |
| 6 | 40/60 | 285.1 | 427.6 | 356.3 | 0.0 | 1069.0 | 62.0 |
| Ms = 1.7 | |||||||
| 7 | 90/10 | 638.4 | 70.9 | 340.9 | 13.8 | 1064.0 | 72.0 |
| 8 | 80/20 | 567.5 | 141.9 | 340.9 | 13.8 | 1064.0 | 72.0 |
| 9 | 70/30 | 496.5 | 212.8 | 340.9 | 13.8 | 1064.0 | 72.0 |
| 10 | 60/40 | 425.6 | 283.7 | 340.9 | 13.8 | 1064.0 | 72.0 |
| 11 | 50/50 | 354.7 | 354.7 | 340.9 | 13.8 | 1064.0 | 72.0 |
| 12 | 40/60 | 283.7 | 425.6 | 340.9 | 13.8 | 1064.0 | 72.0 |
| Ms = 1.5 | |||||||
| 13 | 90/10 | 636 | 70.7 | 330.2 | 23.1 | 1060.0 | 80.0 |
| 14 | 80/20 | 565.3 | 141.3 | 330.2 | 23.1 | 1060.0 | 80.0 |
| 15 | 70/30 | 494.7 | 212.0 | 330.2 | 23.1 | 1060.0 | 80.0 |
| 16 | 60/40 | 424.0 | 282.7 | 330.2 | 23.1 | 1060.0 | 80.0 |
| 17 | 50/50 | 353.3 | 353.3 | 330.2 | 23.1 | 1060.0 | 80.0 |
| 18 | 40/60 | 282.7 | 424.0 | 330.2 | 23.1 | 1060.0 | 80.0 |
| Cube Specimen (mm3) | Compressive Strength (MPa) | Conversion Factor | Nature of Data | ||
|---|---|---|---|---|---|
| 7 Days | 28 Days | 7 Days | 28 Days | ||
| 150 × 150 × 150 | 11.40 | 15.80 | 0.70 | 0.68 | Determined |
| 100 × 100 × 100 | 14.20 | 19.00 | 0.87 | 0.81 | Determined |
| 50 × 50 × 50 | 15.00 | 21.80 | 0.92 | 0.93 | Determined |
| 25 × 25 × 25 | 16.23 | 23.37 | 1.00 | 1.00 | Extrapolated |
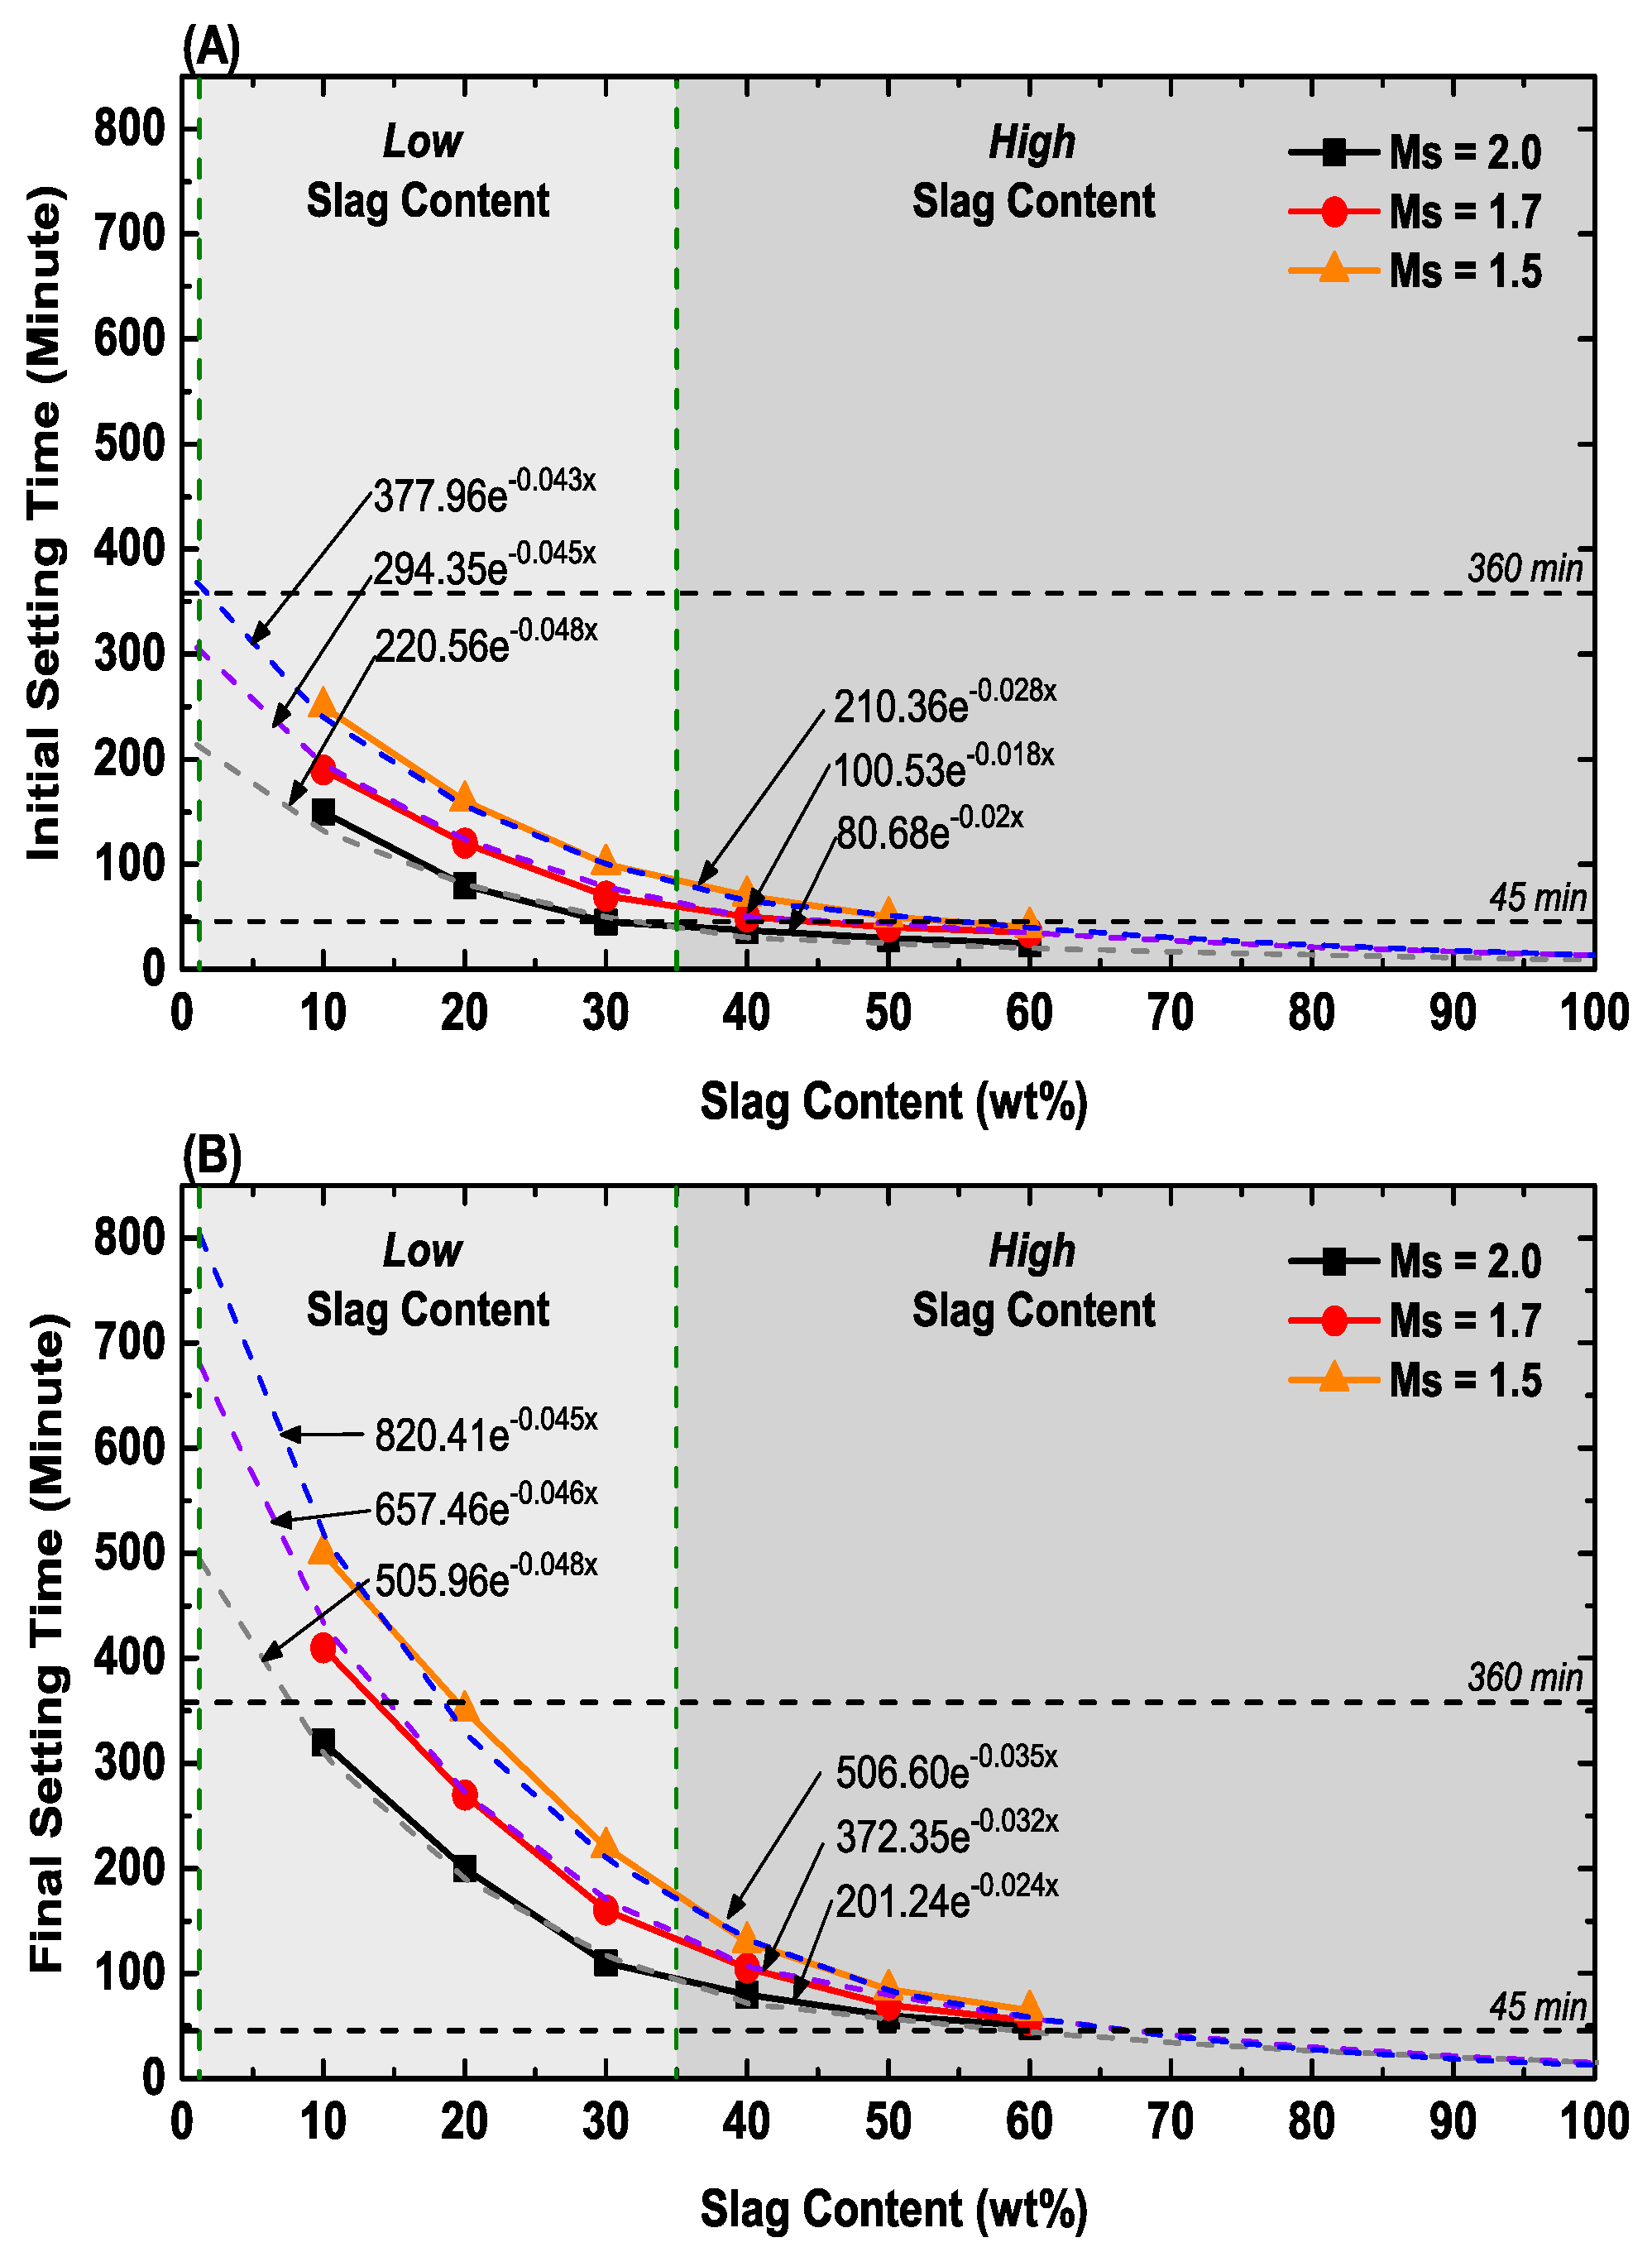
| Setting Time (min) | Low Slag Content (<40 wt% Slag) | High Slag Content (≥40 wt% Slag) |
|---|---|---|
| Initial | (−309.37Ms + 833.9) × e(Slag × [−0.0100Ms − 0.0280]) | (−244.12Ms + 553.7) × e(Slag × [+0.0142Ms − 0.0466]) |
| Final | (−619.12Ms + 1734.4) × e(Slag × [−0.0061Ms − 0.0358]) | (−607.53Ms + 1413.1) × e(Slag × [+0.0224Ms – 0.0691]) |
Publisher’s Note: MDPI stays neutral with regard to jurisdictional claims in published maps and institutional affiliations. |
© 2020 by the authors. Licensee MDPI, Basel, Switzerland. This article is an open access article distributed under the terms and conditions of the Creative Commons Attribution (CC BY) license (http://creativecommons.org/licenses/by/4.0/).
Share and Cite
Ukritnukun, S.; Koshy, P.; Rawal, A.; Castel, A.; Sorrell, C.C. Predictive Model of Setting Times and Compressive Strengths for Low-Alkali, Ambient-Cured, Fly Ash/Slag-Based Geopolymers. Minerals 2020, 10, 920. https://doi.org/10.3390/min10100920
Ukritnukun S, Koshy P, Rawal A, Castel A, Sorrell CC. Predictive Model of Setting Times and Compressive Strengths for Low-Alkali, Ambient-Cured, Fly Ash/Slag-Based Geopolymers. Minerals. 2020; 10(10):920. https://doi.org/10.3390/min10100920
Chicago/Turabian StyleUkritnukun, Supphatuch, Pramod Koshy, Aditya Rawal, Arnaud Castel, and Charles Christopher Sorrell. 2020. "Predictive Model of Setting Times and Compressive Strengths for Low-Alkali, Ambient-Cured, Fly Ash/Slag-Based Geopolymers" Minerals 10, no. 10: 920. https://doi.org/10.3390/min10100920
APA StyleUkritnukun, S., Koshy, P., Rawal, A., Castel, A., & Sorrell, C. C. (2020). Predictive Model of Setting Times and Compressive Strengths for Low-Alkali, Ambient-Cured, Fly Ash/Slag-Based Geopolymers. Minerals, 10(10), 920. https://doi.org/10.3390/min10100920