Article

Thermal Properties and Burial Alteration of Deep-Sea Sediments: New Indicators of Oxic−Suboxic Diagenesis

1
Institute of Marine and Environmental Sciences, University of Szczecin, Mickiewicza 16, 70-383 Szczecin, Poland
2
Faculty of Geology, Geophysics and Environmental Protection, AGH University of Science and Technology, Mickiewicza 30, 30-059 Kraków, Poland
3
Faculty of Chemical Technology and Engineering, West Pomeranian University of Technology Szczecin, Pułaskiego 10, 70-322 Szczecin, Poland
*
Author to whom correspondence should be addressed.
Minerals 2020, 10(10), 901; https://doi.org/10.3390/min10100901
Submission received: 28 July 2020 / Revised: 7 October 2020 / Accepted: 10 October 2020 / Published: 11 October 2020
(This article belongs to the Section Mineral Deposits)

Abstract

:
The application of thermal methods, such as Rock−Eval 6 pyrolysis or differential thermal analysis, provides complex information about sediment and rock properties, including thermal behaviour, degree of maturity, alteration of organic matter, and high temperature combustion synthesis mineral products. In this study, thermal methods included experiments on the thermokinetics of modern deep-sea sediments of the Northeast Pacific Basin. For experimental the procedure, twelve samples of siliceous clayey silts collected from the Clarion−Clipperton Fracture Zone (CCFZ), Interoceanmetal claim area, were analysed. CCFZ is highly prospective as a giant marine polymetallic deposit which contains several economically valuable metals, such as Ni, Cu, or Co. Hydrocarbon potential, thermal maturity, and roasting products were investigated. Mineralogical characteristics of thermal products were investigated. The obtained results of thermal experiments were compared with sedimentological, mineralogical, and geochemical data of bulk sediments. The total enthalpy ΔHTot. and activation energy Ea were proposed as a new lithogeochemical proxies of oxygen depletion during oxic−suboxic diagenesis. The distinctive increase in positive enthalpy (or heat transmission) was observed with the burial depth, where pelagic sediments showed strong oxygen depletion and consumed more energy during phase transformations.

Graphical Abstract

1. Introduction

The Miocene−Quaternary pelagic sediments covering abyssal basins of the equatorial Pacific have been widely studied in recent years, being host to economically valuable polymetallic nodules and sensitive, diverse deep-sea life [1,2,3,4,5]. Deep-sea basins are usually identified with increased biogenic accumulation, and a potential source of hydrocarbons released due to the decomposition of organic matter [6,7,8]. Both polymetallic nodules and pelagic sediments contain low amounts of organic carbon, being uniformly distributed on the seafloor [9,10,11]. Due to the location within the central Pacific convergence zone, sediments located here indicate traces of alteration and oxidation, which affect the distribution of benthic communities, accumulation of metals, and diagenetic processes. These factors are counted as the most important for polymetallic nodule formation and distribution on the seafloor [5,9,12].
The proposed thermal experiments, compared with complex lithogeochemical data, allowed us to understand the heating behaviour and properties of organic matter dispersed in pelagic sediments. Additionally, the results provided information about the intensity of oxic−suboxic diagenesis, which may be identified by changes in selected thermal parameters with the burial depth. It is notable that the estimated thermal parameters are highly dependable of organic matter content, grain size composition, clay minerals, and metal contents in sediments.
Rock−Eval pyrolysis (R−E) is widely applied in the petroleum industry and geological exploration for the evaluation of maturity, productivity, hydrocarbon potential, and complex source rock characteristics. Additionally, the method provides a general overview of sedimentary basin evolution and hydrocarbon potential [13,14]. In recent years, R−E and its newer developments, especially R−E6 and R−E7, have been widely used in marine geology and palaeoceanography [15,16,17,18], palaeoclimatology, and palaeoecology [8,19,20].
During R−E analysis, organic matter is pyrolysed in the absence of oxygen, then combusted, and the amount of released hydrocarbons and carbon dioxide is measured. The method enables us to understand thermal maturation of kerogen and provides a general overview of the organic richness of source rocks [21]. The R−E analysis combined with other thermal methods, such as differential thermal analysis (DTA), or nitrogen−sulphur combustion spectrometry (NS), provides valuable data of the alteration/oxidation potential of deep-sea sediments, especially in areas of high bioproductivity. Additionally, it gives information about the kinetics of pyrolysis [22].
The application of R−E and the construction of R−E-based pseudo-van Krevelen diagrams indicate biological input of organic matter into the sediments and its transformation, which may be compared with stratigraphical data, or related to depositional processes. The R−E analysis enables us to define kerogen types, basing on H/C and O/C ratios, or proxies, such as the hydrogen index (HI) and oxygen index (OI) [23]. All of these factors rely on the generation potential of hydrocarbons [24].
The primary factor, which determines whether a source rock can produce oil, gas, or condensate, is the so-called thermal maturity. It provides fundamental information for understanding the properties of source rocks, such as the presence of productive or non-productive zones, or migration patterns (e.g., [25,26,27]).
The main goal of the article is to present comprehensive data on the thermal behaviour, properties, and alteration products of deep-sea sediments from the Clarion−Clipperton Fracture Zone (CCFZ). The new potential proxies of oxic−suboxic diagenesis are proposed and discussed.

2. Geological Setting

The research area is located within the abyssal part of the CCFZ, northern equatorial Pacific, and covers approximately 5.5 million km2. The CCFZ extends 5200 km between 116° and 155° W and 1000 km between 5° and 15° N (Figure 1). To the east, the area is bounded by Mathematicians Ridge, which is believed to be the western slope of the palaeo–East Pacific Rise, and to the west by the Line volcanic island arc [9,28,29]. Several low-scale volcano−tectonic structures were observed in the CCFZ, including Cooper Rise, Central Rise, East Rise, and Shimada Seamount [30].
The CCFZ is one of the most extensively studied deep-sea areas, and one of the most prospective for the future deep-sea mining [33,34,35,36]. Various geological, economic, and environmental research projects have been conducted here since the mid-1960s (e.g., [1,37,38,39,40]). The area is under the jurisdiction of the International Seabed Authority (ISA), Kingston, Jamaica. During recent years, the ISA has entered into 15-year contracts for exploration for polymetallic nodules with fifteen contractors located in the CCFZ [41,42].
According to the complex geological data of the eastern CCFZ, the most important factors affecting the formation of sediments and polymetallic nodules are [2,6,43,44]:
  • The low rate of mixed-type (biogenic–clayey) sedimentation.
  • Mineralogy and geochemistry of sediments, characterised by the occurrence of amorphous opaline biosilica, clay mineral admixtures and oxygen non-resistible elements, such as Fe, Mn, Ni, Cu, Co, Zn, or rare earth elements (REE).
  • Diagenesis occurring under oxic–suboxic conditions, related with a relatively low thickness of sedimentary cover.
  • The presence/absence and thickness of the so-called “active layer”, which is the uppermost part of semiliquid sediments, indicating the greatest amount of polymetallic nodules.
  • The equatorial tropical climate zonation and high bioproductivity.
  • Relatively plain seafloor topography.
  • Distinctive changes in physical and chemical parameters of seawater, affecting sediment zonation, including regional and local patterns of palaeocurrents and bottom currents.
  • Spatial and temporal variability of geochemical barriers, including oxygen minimum zone and carbonate compensation depth.
  • Geochemistry of the underlying sediments and basement rocks.
  • The proximity of volcanic activity areas and volcanic and hydrothermal material supply, as well as the lack of distinctive terrestrial input (besides low aeolian influx).
  • Relatively low tectonic and seismic activity of the crust.
The geomorphology of the CCFZ is typical for adjacent abyssal basins and mid-ocean ridges. The gradual E−W increase in depth, from 3800–4200 m at 115° W, to 5400–5600 m 150° W, has been noticed. The average seafloor slope varies from 0.57° in the east, to <0.50° to the west. The greatest amount of polymetallic nodules usually occurs at depths of 4200–4500 m [3].
The eastern part of the CCFZ is characterised by the presence of adjacent linear groups of ridges and valleys, which are aligned perpendicularly to the bounding fractures of Clarion and Clipperton. The distances between the neighbouring forms vary between 1 and 10 km, with elevation differences up to hundreds of metres [9].
The oceanic crust is 10.6–10.8 km thick and composed mainly of tholeiitic basalts. The overlying pelagic sediments have a thickness of 100–300 m, and an age of Late Cretaceous to Quaternary [28,30].
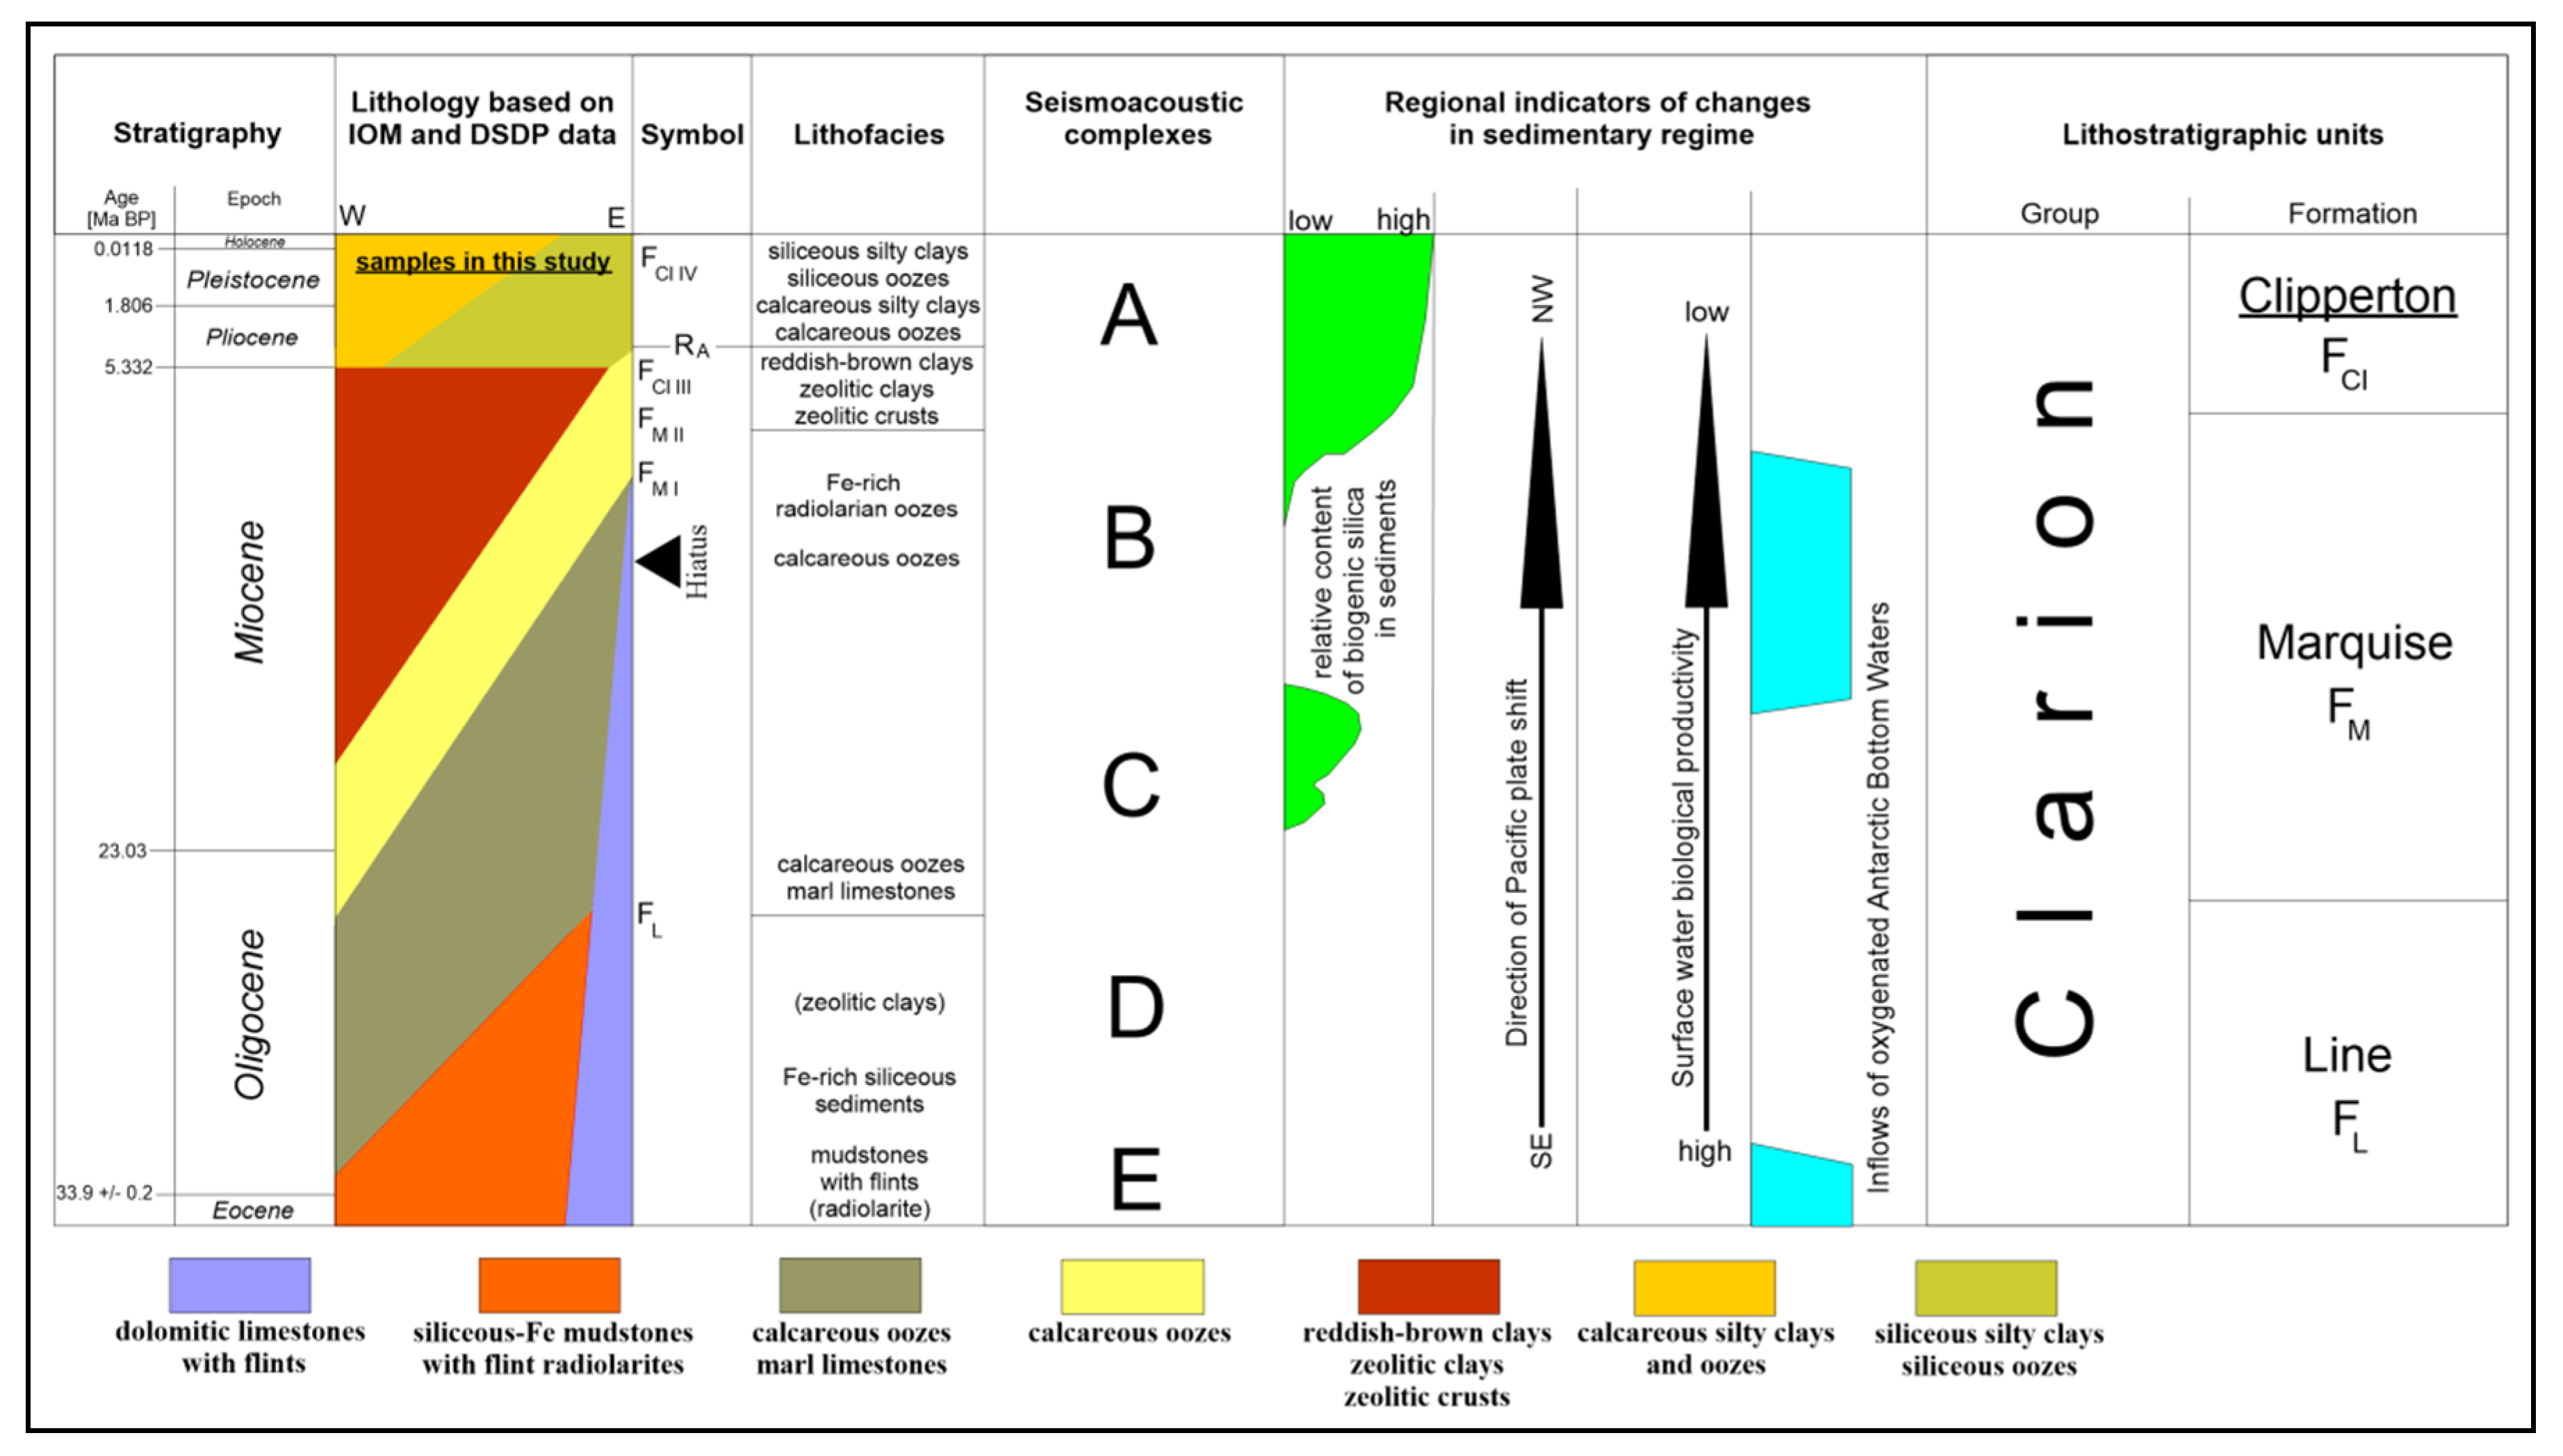
The palaeogeography of the CCFZ started to develop during the Early Miocene, more than 20 Ma ago, and was caused by a counter-clockwise rotation and extension of the Pacific plate, followed by rapid changes in oceanographic conditions (inflows of oxygenated Antarctic bottom water), and the closing of the Tethyan Seaway [30] (Figure 2).
Surface sediments in the area are characterised by zonal distribution, and are represented by the following categories: (i) carbonate sediments (carbonate silts and clays, as well as carbonate oozes; around 15% of the seafloor area), (ii) siliceous sediments (mainly red clays, diatom–radiolarian silts and oozes; 80% of seafloor area). Mixtures of diatom–radiolarian silts and oozes dominate. Additionally, some minor types of sediments (~5% of seafloor area) have been recognised, including: (iii) zeolitic clays, as well as (iv) polygenic sediments, highly enriched in volcanoclastic and hydrothermal components [30]. The input of hydrothermally and volcanically derived material was observed especially within the Mahi-Mahi Fracture Zone and Cooper Rise [3].
The CCFZ sediments are classified in the Clarion lithostratigraphic group, with three distinguished formations, and evidenced by five seismoacoustic complexes (Figure 2): (i) Formation Line (FL), (ii) Formation Marquise (FMI-II), and (iii) Formation Clipperton (FClIII-IV) [9,45].
Sediments studied in the paper belong to the youngest FClIV unit, characterised by the greatest lithological variability and the greatest thickness of all lithotypes, as well as the macroscopically visible boundary between the distinguished subunits. The FClIV is mainly represented by (i) calcareous silty clays (up to 47% CaCO3) and (ii) Ethmodiscus silty clays (up to 32% SiO2am.). The uppermost sediment layer, the so-called “semiliquid biochemically active sediment layer”, is composed of two major types of sediments: (i) siliceous silty clays (<30% SiO2am.) and (ii) slightly siliceous clayey silts (<10% SiO2am.). The age of these sediments is non-divided and varies from Pliocene to Holocene. The amount of biogenic siliceous components usually decreases with age [2,9]. Sediments indicate the presence of moderate bioturbation textures, such as dwelling tunnels and burrows, usually observed in the uppermost part of the sediment column (up to a 12–15 cm depth). Bioturbations are important factors for bioirrigation and ventilation processes, intensifying oxidation potential, porosity, and nutrient migration during the burial of sediments [4,46].
Besides the surface-located polymetallic nodules, sediments may contain buried nodules and micronodules. The last ones are small agglomerates (<2 mm in diameter) of Mn–Fe oxyhydroxides, formed due to the early diagenesis. Micronodules show increased contents of metals, such as Cu, Ni, Co, Zn, or REE, and occur frequently below 25 cm sediment depth [5].

3. Materials and Methods

The complex analyses of twelve sediment samples of siliceous clayey silts included thermal methods, such as Rock−Eval 6 pyrolysis (R−E6), differential thermal analysis (DTA), and nitrogen−sulphur combustion spectrometry (NS), combined with laser diffraction grain size analysis, bulk mineralogy (X−ray diffraction (XRD) analysis, clay minerals analysis), and geochemistry (atomic adsorption spectrometry (AAS), X−ray fluorescence (XRF), induced coupled plasma mass spectrometry (ICP−MS), flow injection analysis (FIA)).
The results of thermal experiments were compared with data of early diagenetic processes observed in pelagic sediments of the eastern CCFZ, Interoceanmetal (IOM) claim area [5]. As a part of the CCFZ, the IOM area is considered one of the most prospective polymetallic nodules deposits, extensively studied in recent years. Several research projects have been conducted, related to different economic and technological applications of polymetallic nodules and sediments [1,9,28,29,30,35,36,37,38,39,40].

3.1. Samples

Representative samples were collected in the IOM H11 and H22 polymetallic nodule exploratory areas (blocks), covering 5380 and 3800 km2, respectively (Figure 1). The local seafloor topography shows the presence of elongated streaked or rounded patchy zones, indicating a high coverage of nodules (>13 kg/m2). Several meridian and extended faults and seafloor escarpments (±200 m), implicating massive block-style tectonics, are visible in the 3D topography model (Figure 1). In the eastern part of the IOM H22, volcanic activity is known, with distinctive volcano–tectonic edifices visible in the seafloor morphology. Nodule-free sites are covered mainly by siliceous clayey silts or polygenic muds, and often associated with influences of erosional bottom currents which may expose older layers of sediments, or even crystalline rocks on the seafloor [32].
Twelve sediment samples from three sampling stations were collected in 2009 and 2014, using the box corer method, during IOM exploratory cruises of RV “Yuzhmorgeologiya”. The Reineck-type box corers (Ocean Instruments, Fall City, WA, USA) were recovered at water depths of: 4313 m (station 2269), 4342 m (station 3515-1), and 4529 m (station 2262). For further analyses, polymetallic nodules were separated from the “active layer” already onboard.
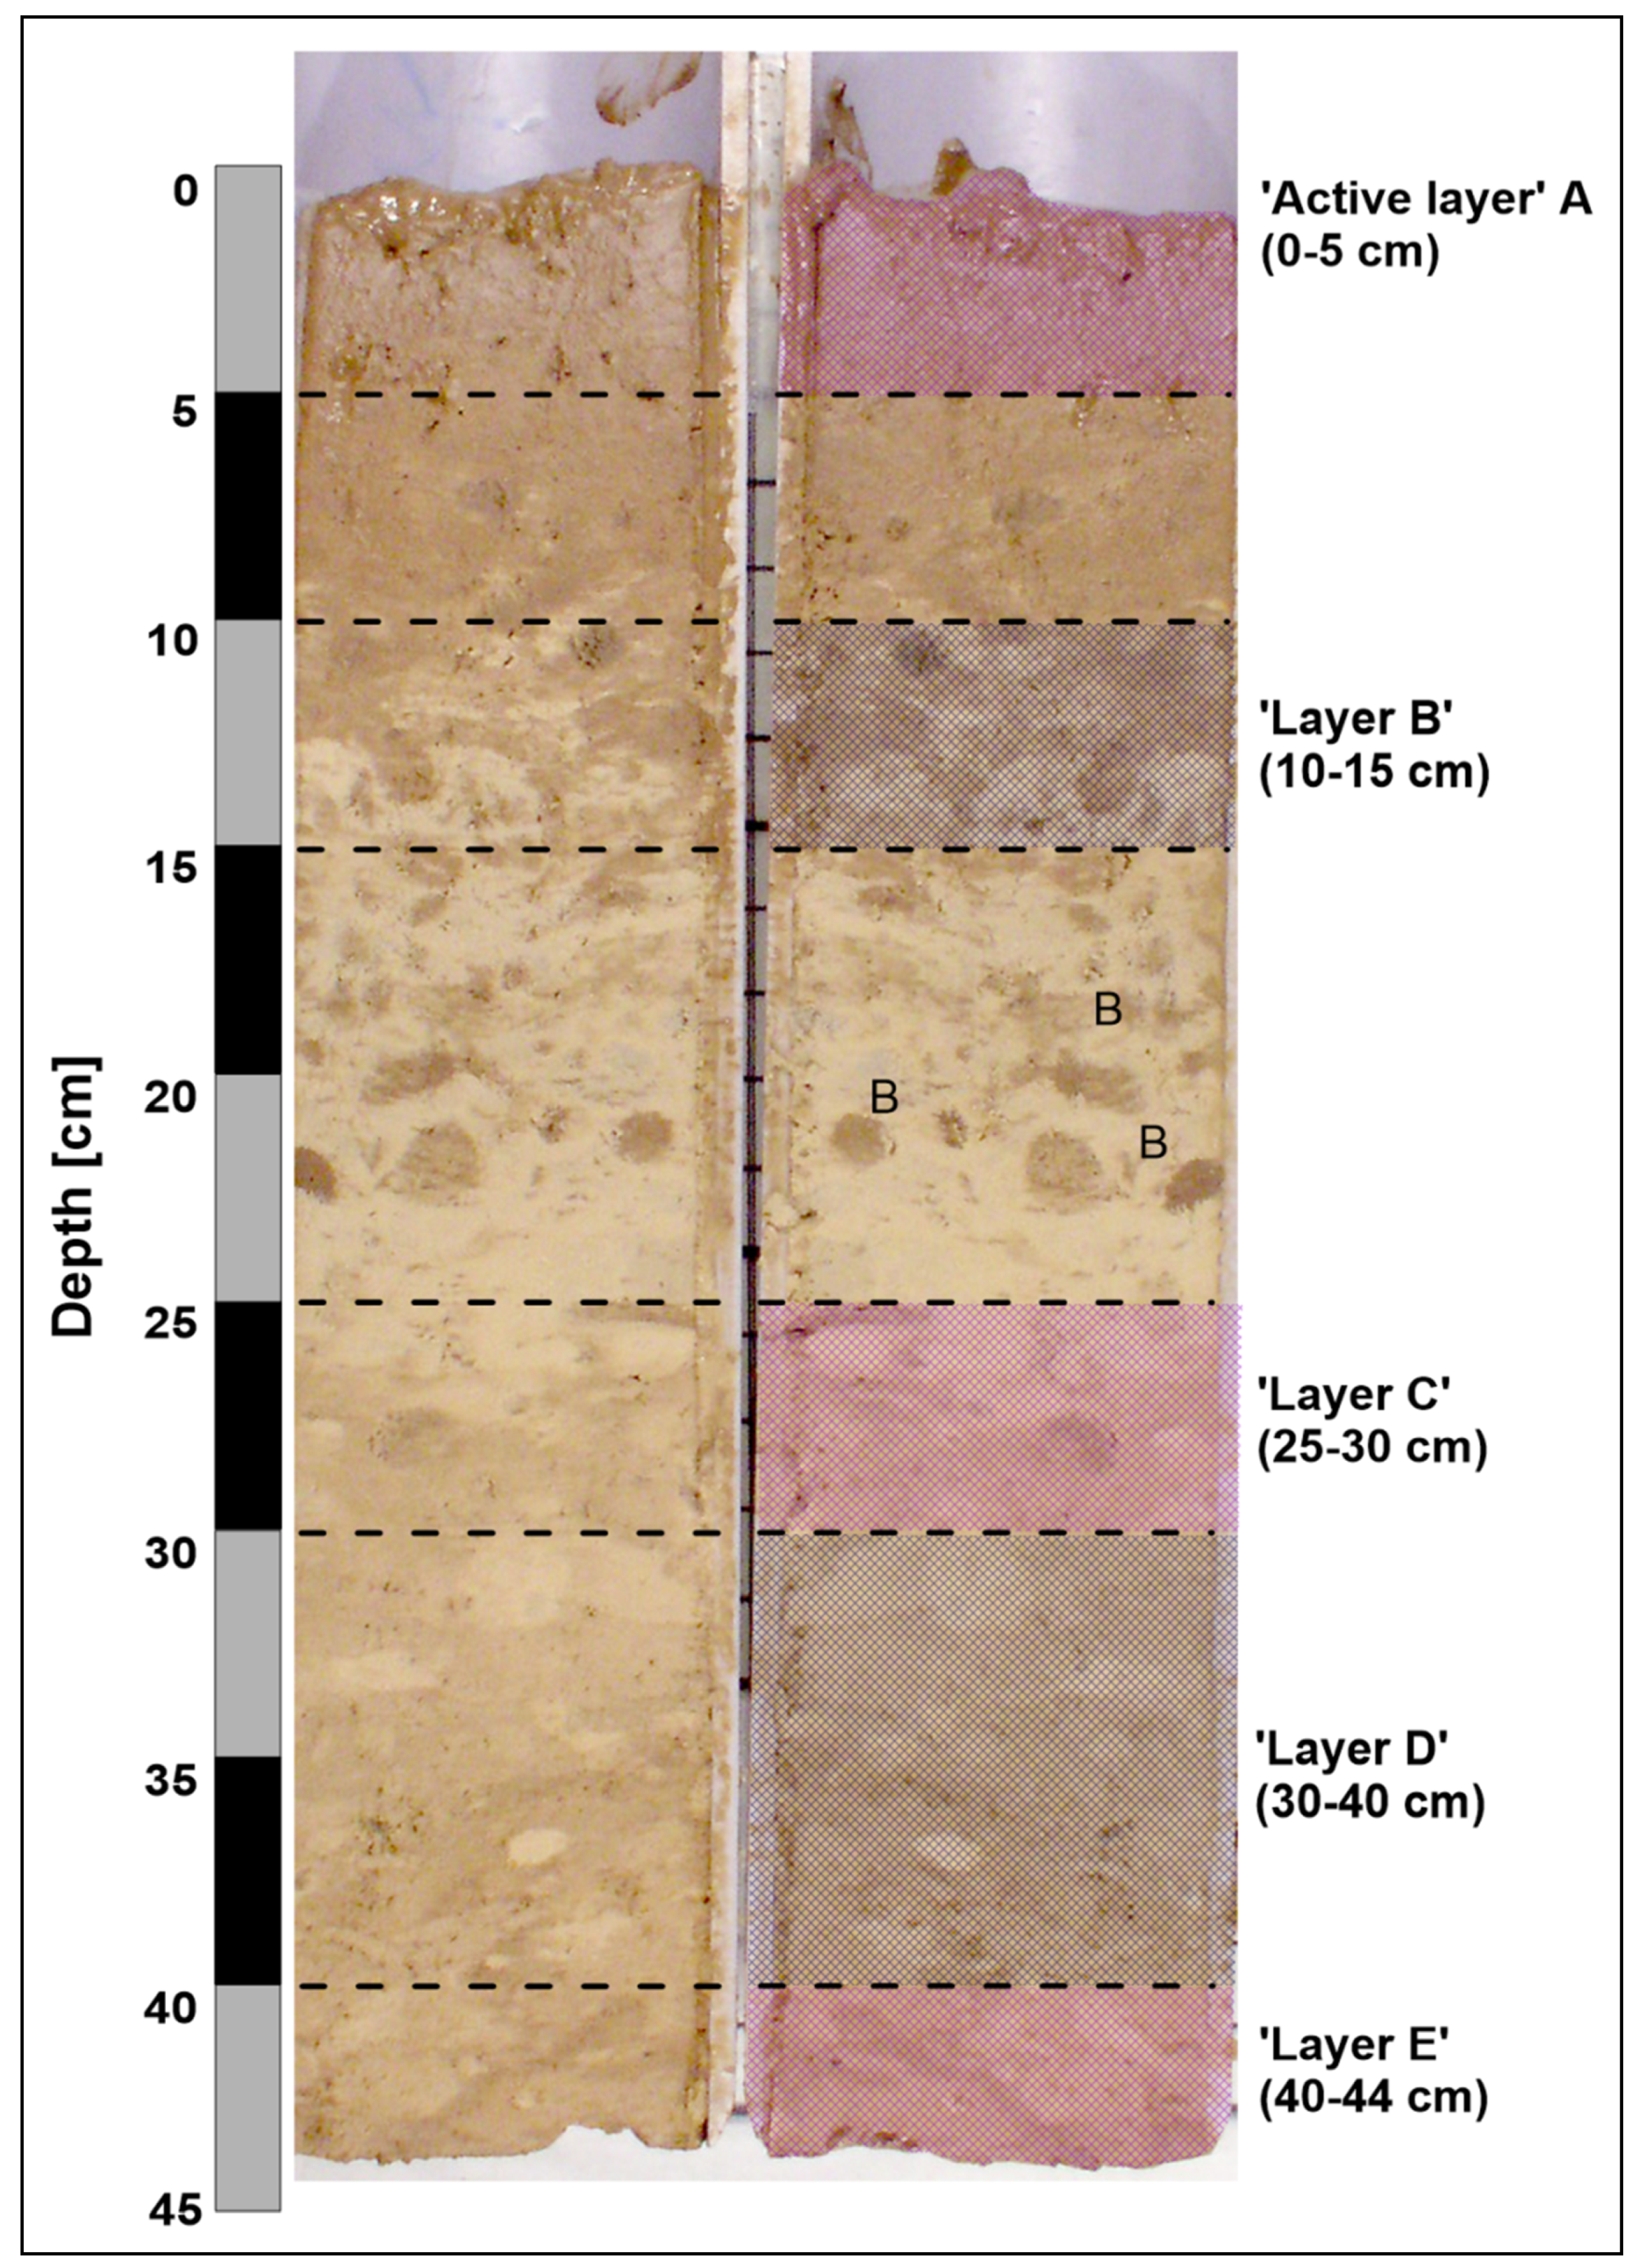
Based on an macroscopic description, the samples were divided into a few sections (also called “layers”): A (“active layer” or “top section”), B (the upper part of the “middle section”), C (the intermediate part of the “middle section”), D (the bottom part of the “middle section”), and E (the “bottom section”) [5]. Only in two cases (sampling stations 2262 and 3515-1) were the D and E layers sampled (Table 1; Figure 3).

3.2. Methods

The applied thermal methods included R–E6, thermal analysis (TA), and combustive nitrogen–sulphur spectrometry (NS). Additionally, the newly formed heating mineral products were analysed with the bulk XRD method, described in Section 3.5.

3.2.1. Rock–Eval 6 Pyrolysis (R–E6)

The R–E6 analysis was performed at the Laboratory of Organic Geochemistry and Environmental Biogeochemistry, AGH University of Science and Technology, Kraków, Poland, using Vinci Technologies Rock–Eval 6 Turbo (Vinci Technologies SA, Nanterre, France). Before the analysis, fresh sediment samples were freeze-dried in oxygen-free and low-vacuum conditions (<0.005 mbar). This process prevented the extreme oxidation of residual organic matter and partially removed the water absorbed by the skeletons of siliceous organisms. However, it needs to be noticed that freeze-drying may cause some loss of volatile compounds, e.g., mercury or free hydrocarbons. In the next step, the 100 mg samples were heated using pyrolysis and combustion programmes: (a) pyrolysis at a temperature of 300 to 650 °C, with a heating rate of 25 °C/min, and (b) combustion in air from 300 to 850 °C, with a heating rate of 20 °C/min. The measured parameters and calculated indices are presented in Table 2.

3.2.2. Thermal Analysis (TA)

The applied thermal analysis methods include differential thermal analysis (DTA), differential thermogravimetry (DTG), and thermogravimetry (TG). The samples were investigated to obtain information about thermal stability, oxygenation state, thermal weight loss, decomposition, and enthalpy. The research was performed using a MOM Q–1500D derivatograph (Budapest, Hungary) equipped with a “Derywat” data acquisition system (Kraków, Poland) at the University of Szczecin, Institute of Marine and Environmental Sciences, Szczecin, Poland (IMES-USz).
Before thermal experiments with sediment samples, measurement of the oven atmosphere (=background) was performed. In all three thermocouples of the MOM Q–1500D derivatograph, crucibles with thermally stable Al2O3 (800 mg) were mounted and heated with the standard programme (10 °C/min; 20 °C to 1000 °C). Normally, the third thermocouple (measuring the temperature in the oven) is not covered by a crucible, however, for the calculation of enthalpy changes, we applied the third crucible with Al2O3, assuming more steady P-T differences between the sample and oven. After these measurements, the obtained DTA curve was aligned by a linear function and levelled (the start and the end of the curve) to a 0 °C baseline. We adopted the theoretical heat capacity of Al2O3 as 80 J/mol K as a reference value [47]. The integral area of each reaction between the analysed part of the DTA curve and the baseline is directly proportional to the heat energy. Using “Derywat” software, the voltage of the thermocouples was directly converted from μV to °C, assuming 0 at the start of the reaction and a linear proportional increase (or decrease) of each effect during heating. Knowing the theoretical heat capacity of Al2O3 and the proportional changes of the DTA parameters, the calibration of DTA sensitivity was performed. Additionally, the control of TG with CaC2O4·H2O was conducted.
Next, the powdered sediment samples (800 mg each) were placed in alundum crucibles. Measurement conditions were the same as during the calibration procedure. Eight hundred milligrams of thermally stable Al2O3 were used as a reference material. The samples were heated linearly from 20 to 1000 °C, in an open-air atmosphere, and at a rate of 10 °C/min. A quartz glass cup was applied for stable and uniform heat transmission.
The individual DTA, DTG, and TG curves were smoothed and aligned for graphical purposes. The total enthalpy (=total heat transmission) was calculated using simple graphical differentiation. The integral of each thermal effect was calculated after subtracting background data and by the use of a levelled baseline method. The DTA electrical voltage between the sample crucible and reference crucible, which is typically expressed in µV, was converted to degrees Celsius using “Derywat” software, and by prior calibration with alumina. The DTA integral surface expressed in (°C·s) units, combined with sample weights, enabled us to calculate the activation energy.
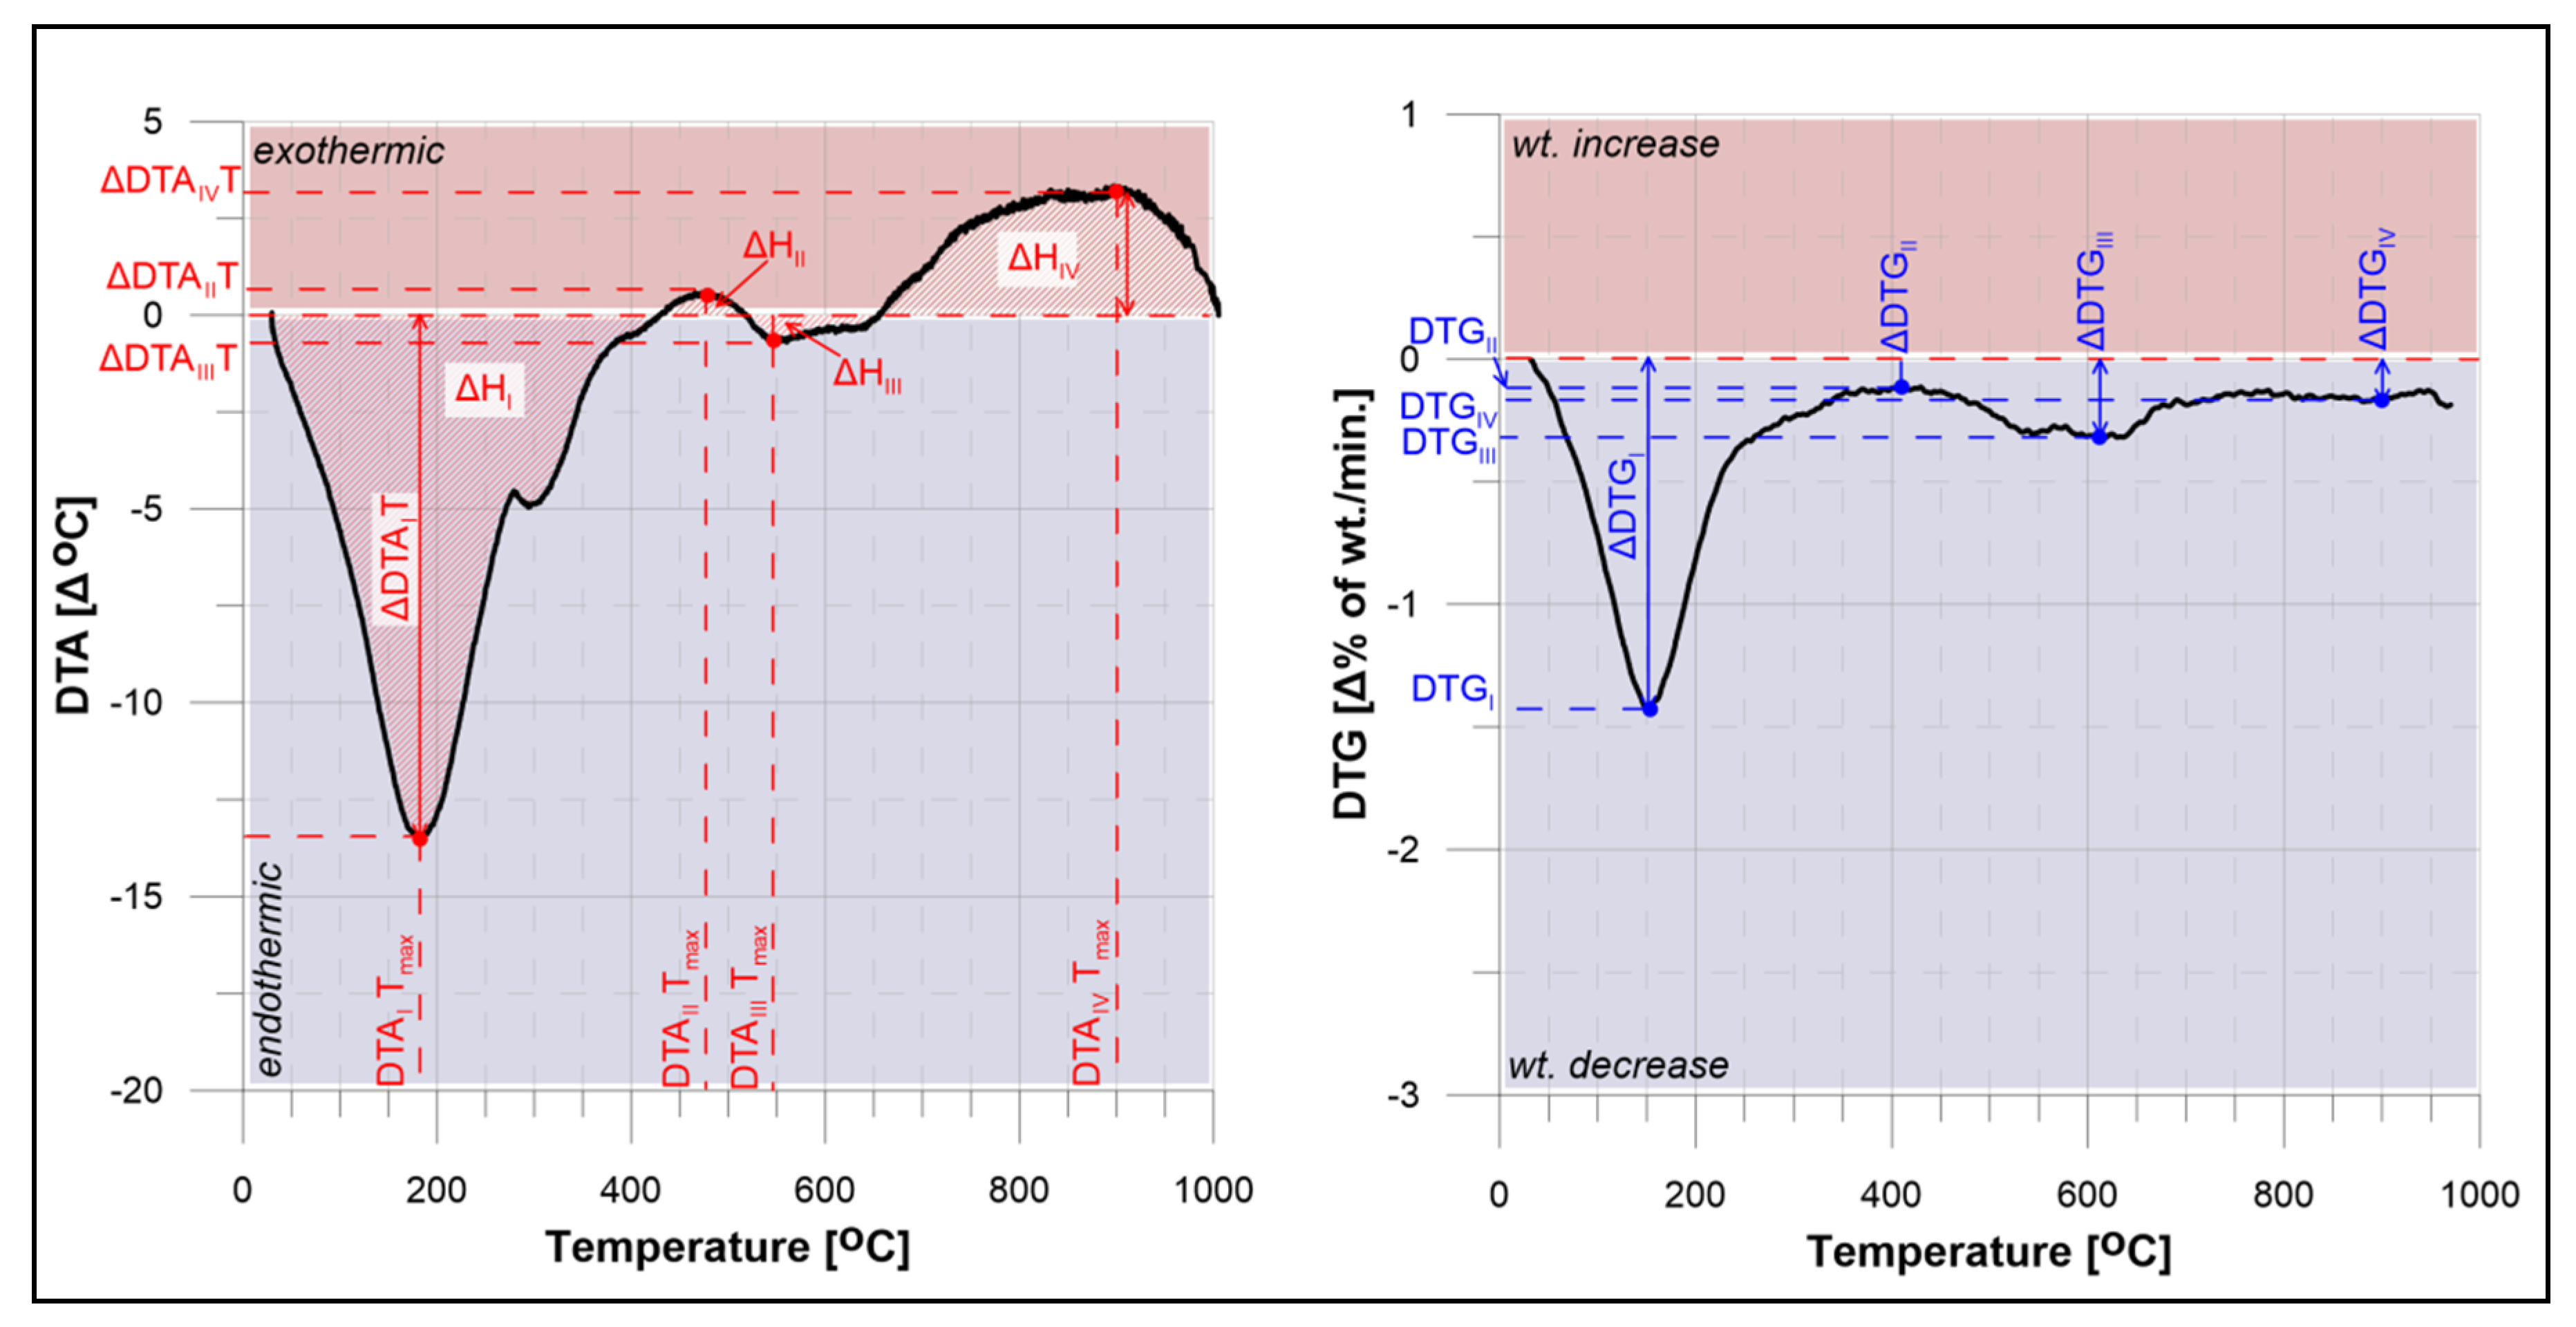
During TA, the total thermogravimetric weight loss (ΔTGT; %) due to the heating was estimated. Additionally, the maximum temperatures of endothermic/exothermic effects were calculated (DTAI-IV Tmax; °C), and the rate of the weight loss over time (ΔDTGI-IV; wt.%/min) was measured. For each endothermal and exothermal reaction, enthalpy (ΔHI-IV; J/g) was calculated. Finally, the total enthalpy of each sample (ΔHTot.; J/g) was estimated according to [47]:
Δ H T o t . = Δ H I + Δ H I I + Δ H I I I + Δ H I V .
The graphical representations of estimated DTA and DTG parameters as thermoanalytical curves are shown in Figure 4.

3.2.3. Nitrogen−Sulphur Combustion Spectrometry (NS)

The biogenic element analyses, including the estimation of total nitrogen (TN) and total sulphur (TS), were performed at the IMES-USz, using a Vario Max CNS Element Analyzer (Langenselbold, Germany). The method is based on Dumas’s theorem, which describes the thermal behaviour of a sample with a known mass at a high temperature, combusted in 800–900 °C, in a special chamber filled with oxygen or other gases. During heating reactions, the release of carbon dioxide, water, nitrogen, and sulphur occurs. The emitted gases are passed over special columns filled with absorbing material, such as silver wool or copper debris, which absorb water and selected oxides. The nitrogen content is usually measured by a conductivity detector installed in a separate column [48]. As the method and software provided no direct information on thermal kinetics, the results of the NS analysis are included and discussed with the geochemical data.

3.3. Grain Size Analysis

The grain size data were obtained at the IMES-USz by the application of the laser diffraction method. A Malvern Mastersizer 3000 (Malvern Panalytical Ltd., Malvern, UK) was used in the analysis [49]. The samples were freeze-dried using a Beta Christ 1–8 LDplus (Martin Christ Gefriertrocknungsanlagen GmbH, Osterode am Harz, Germany) low-vacuum dryer. Next, 0.1% Calgon dispersant and ultrasound disaggregation were applied. Finally, the grain size results were recalculated in Gradistat 8 software (Kenneth Pye Associates Ltd., Shinfield, UK) for basic statistical parameters, including Folk and Ward descriptive statistics [50,51]. The obtained data are presented using a logarithmic phi scale (φ) [52].

3.4. Geochemistry

The geochemical data of selected metals (Fe, Mn, Ni, Cu, Zn, Pb, and Cr) were collected using the AAS method (Solaar Unicam 969 spectrometer, Unicam Ltd., Cambridge, UK) at the IMES-USz. The samples were digested with a Berghoff speedwave XPERT microwave oven. For the metal extraction procedure, 0.6 g dry sediment samples were digested with a mixture of three acids (8 mL HNO3, 2 mL HCl 10%, and 2 mL H2O2 30%).
The abundance of vanadium was determined with a PANalytical Epsilon 3 EDXRF spectrometer (Malvern Panalytical, Royston, UK) at the West Pomeranian University of Technology, Faculty of Chemical Technology and Engineering, Szczecin, Poland (WPUT), equipped with an SDD detector and ceramic X–ray tube (50 kV, 9 W). The analysis was performed in a helium atmosphere, using the pressed pellet method, for three minutes per sample, and OMNIAN software was used for standardless analysis.
The cobalt content was determined following [53] after full acid digestion (HNO3, HF, HClO4 and H2O2) by ICP-MS (ELAN DRC II, Perkin Elmer, Waltham, MA, USA), at the Central Chemical Laboratory of the Polish Geological Institute—National Research Institute (PGI–NRI), Warsaw, Poland.
The total phosphorus content (TP) was analysed using flow injection analysis (FIA) and an MLE FIA Modula spectrometer (Medizin- und Labortechnik Engineering GmbH, Dresden, Germany) at the IMES-USz. The TN and TS analyses involved homogenised and air-dried samples of sediments. For the purpose of TP analysis, the samples were digested similarly as for AAS. The degradation rate of TOC* was calculated according to [20]:
TOC* = TOC + (2TSmC/mS),
where: TS—measured sulphur content, mC—molecular mass of carbon, mS—molecular mass of sulphur.

3.5. Mineralogy

Mineralogical analyses involved XRD of bulk sediments and roasted products of TA. The bulk XRD mineralogy was studied by the use of a PANalytical Empyrean diffractometer (Malvern Panalytical Ltd., Malvern, UK) at the WPUT. The analytical conditions were as follows: monochromatic Cu K-α radiation at 35 kV and 30 mA, scans from 5–70°2Θ, and a step size of 0.02°/2 s. The data of raw samples were converted and Rietveld quantitative analysis by RockJock 11 software was performed [54]. Amorphous phase content (biogenic opaline silica) was estimated as a background elevation of diffractograms, in the range of 20–33°2Θ [55]. For the analysis of roasted material, Rietveld-based Match! 3 software (Bonn, Germany) was used, with the COD-Inorg REV214414 (2019) database included.

4. Results

4.1. Thermal Proxies

4.1.1. The R–E6 and Selected Geochemical Signatures of Sedimentary Environment

The total carbon (TC) contents are low and vary from 0.58 to 1.07%. The TOC dominates over mineral carbon (MinC). The TOC and MinC contents vary from 0.51 to 0.72% and 0.06 to 0.23%, respectively. The MinC components are associated with calcium carbonate minerals (calcite, aragonite), which are less than 0.19%.
The contents of free hydrocarbons (S1) are low, and vary from 0.38 to 0.76% mg HC/g. The Tmax values are extremely high (601 to 605 °C), and not applicable for the analysis of hydrocarbon potential. Due to the strong dependence on the Tmax, the theoretical vitrinite reflectance Vr0 in all samples is overestimated (>3.5%), and shall not be considered further.
The hydrocarbons are dominated by thermally generated fractions (S2). The S2 contents vary from 4.54 to 6.76 mg HC/g. The amount of CO2 generated from the pyrolysis of organic and mineral matter (S3) is rather comparable, and varies from 0.85 to 2.56 mg CO2/g. The hydrocarbons generation potential (GP) and productivity index (PI) are generally low, 4.95 to 7.95 mg HC/g and 0.06 to 0.12, respectively.
The hydrogen index (HI) is high in all samples, and varies from 698 to 960 mg HC/g TOC. Additionally, the oxygen index (OI) values are elevated and highly variable (137 to 413 mg CO2/g TOC), compared with the other parameters. The full data of measured parameters and calculated R–E6 indices are shown in Table 3.
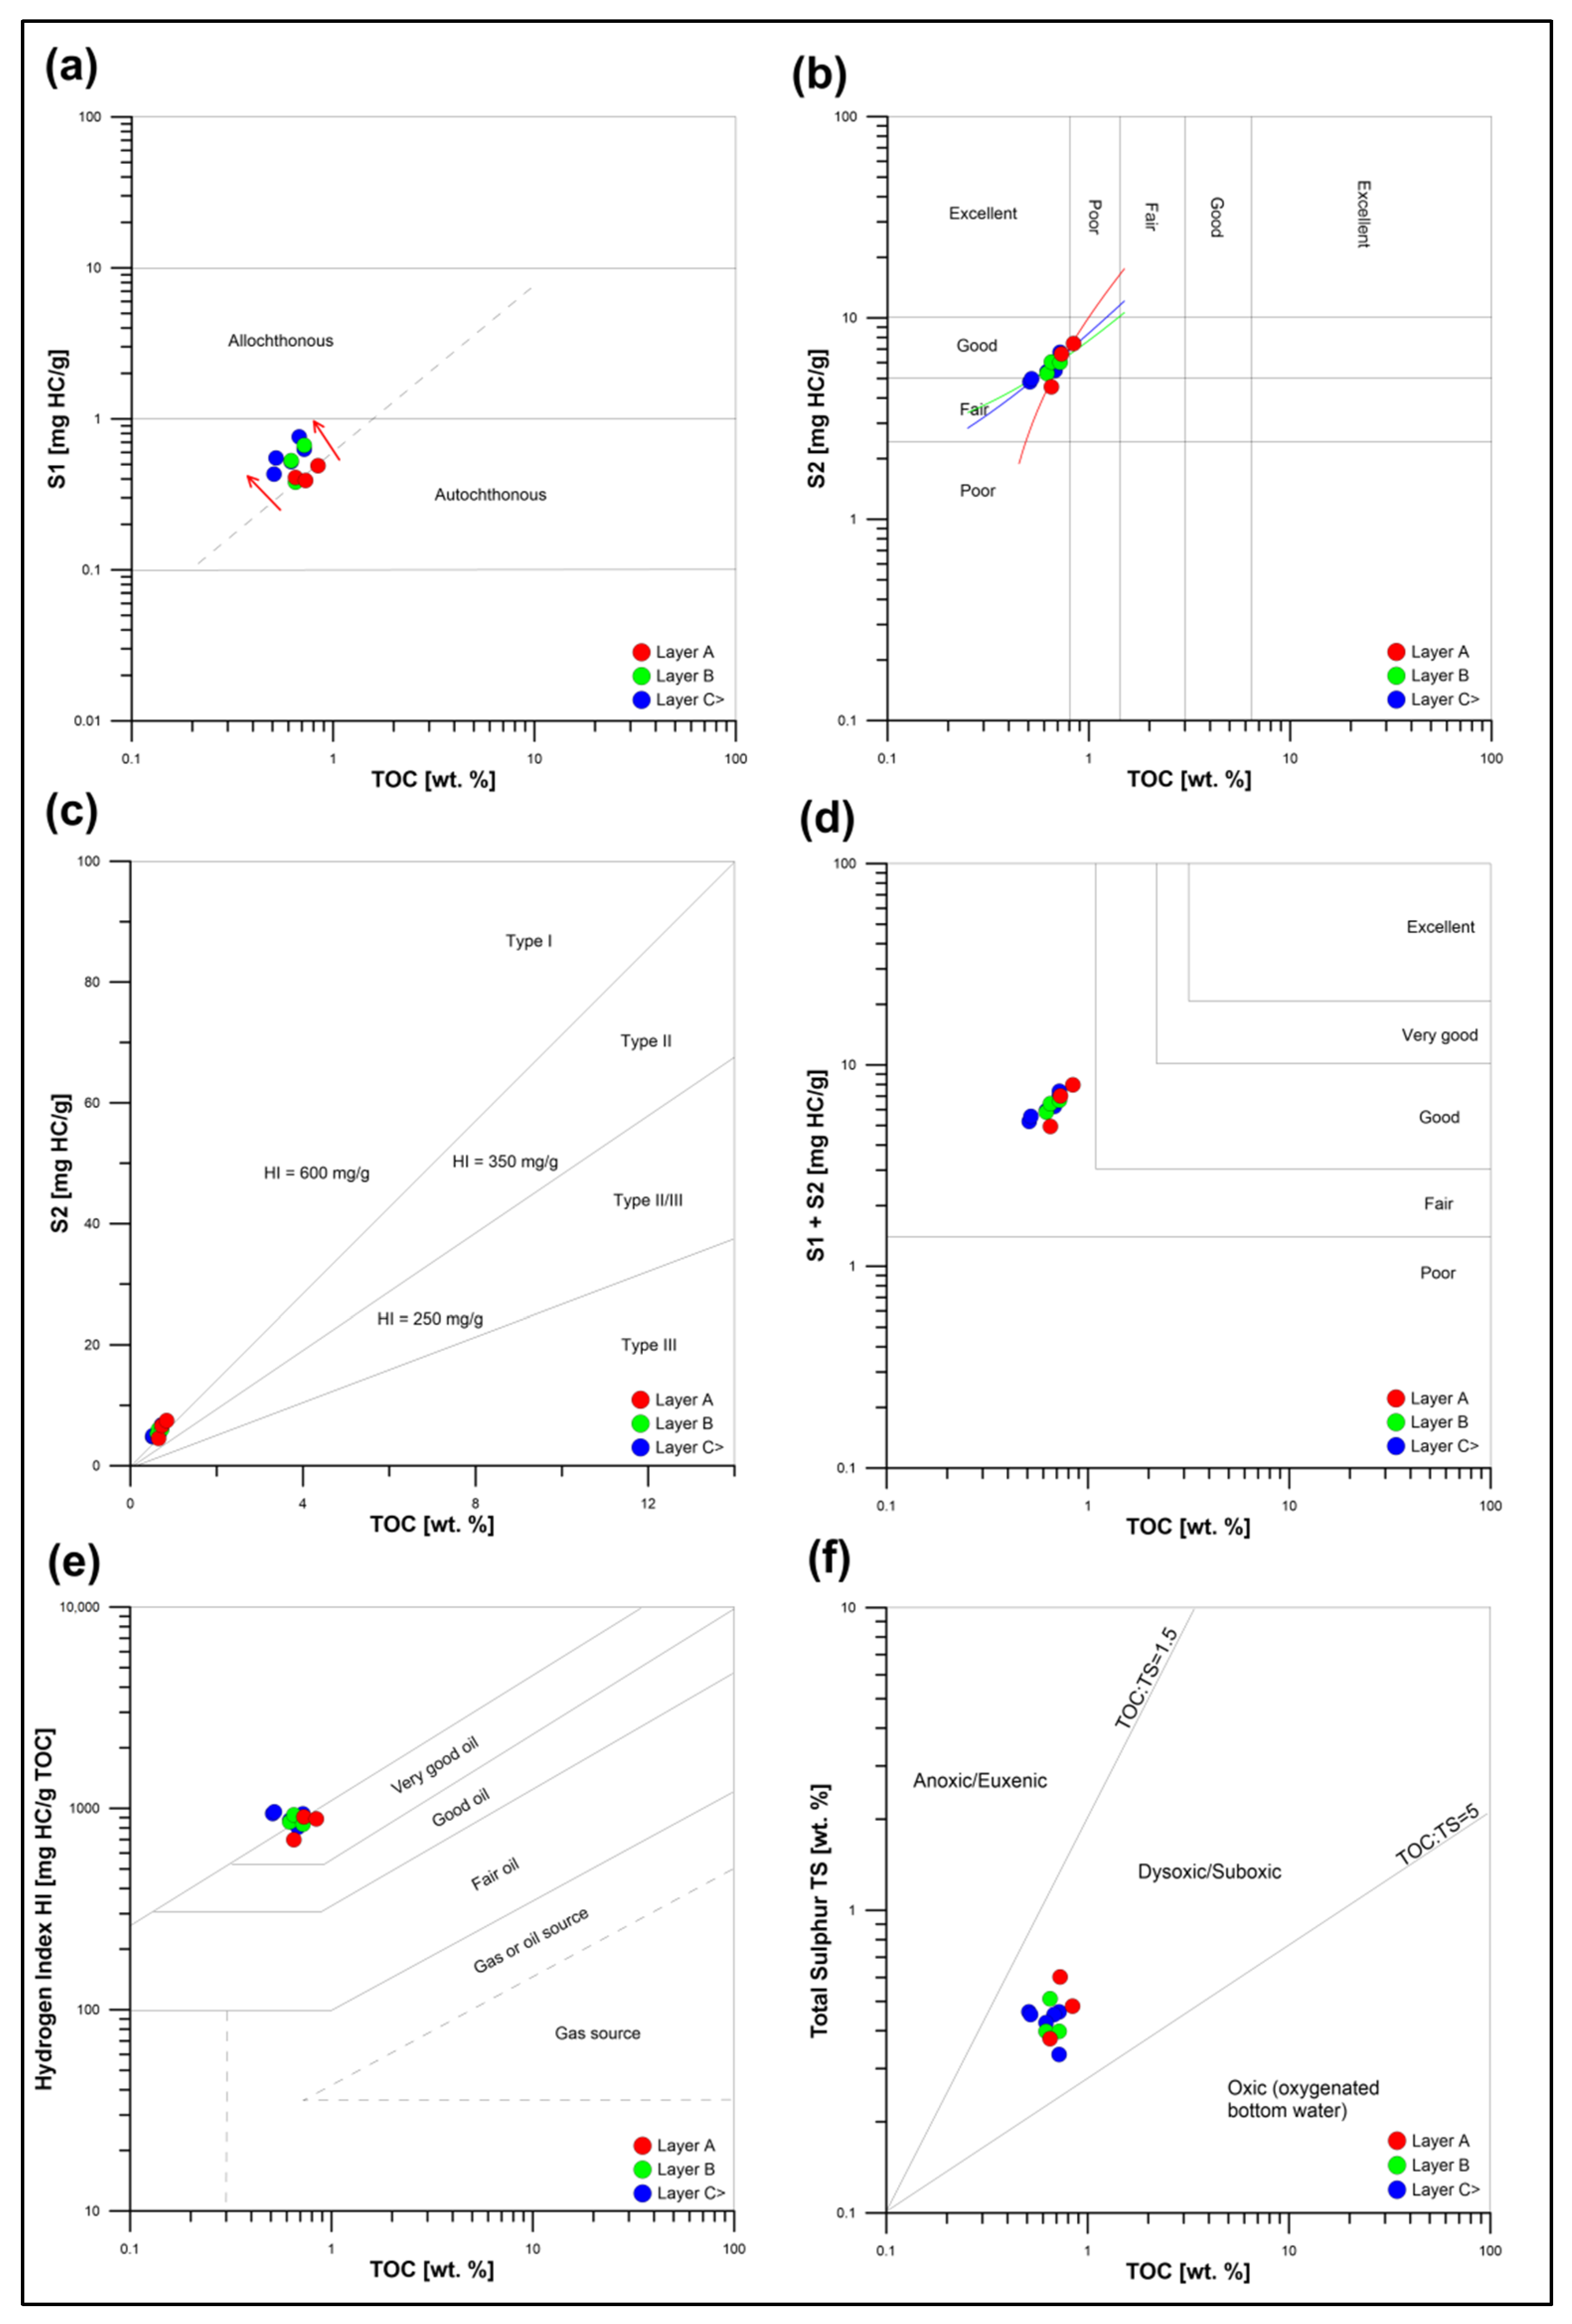
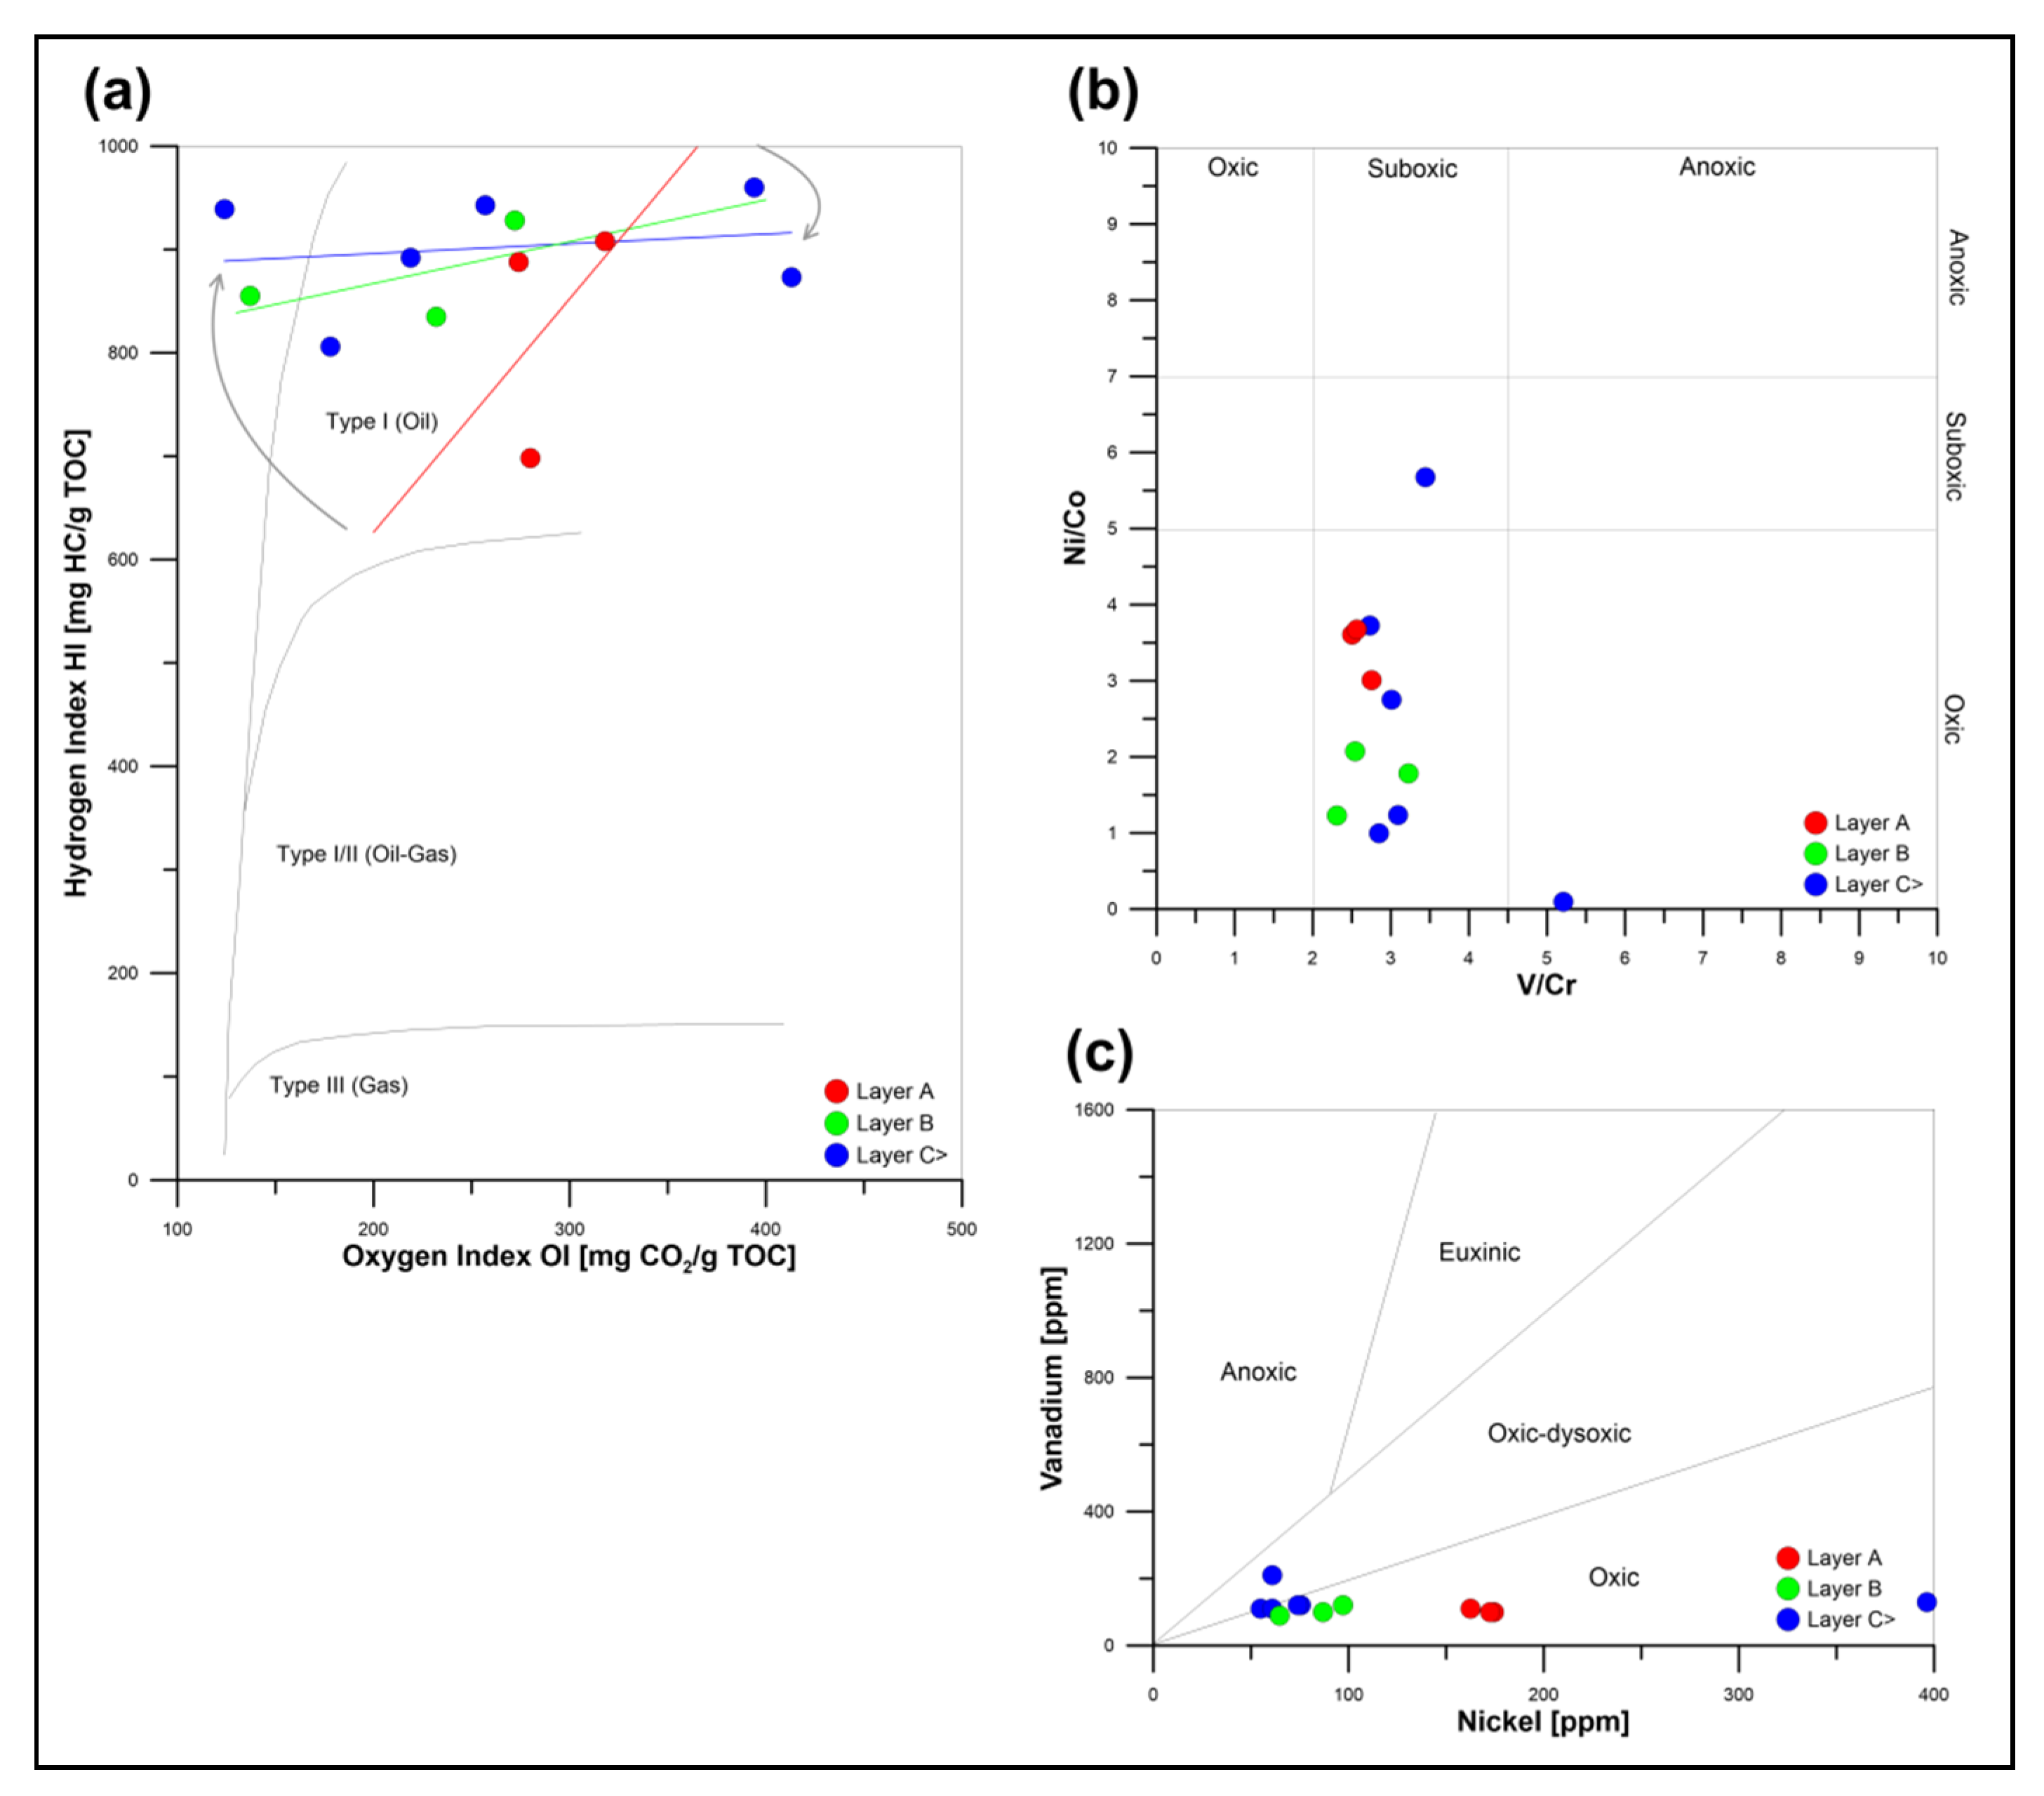
The comparison of TOC and S1 data suggests the slight dominance of allochthonous organic matter, especially in the lower sections of the sediment column. A greater content of autochthonous organic matter was found in “layer A” (Figure 5a). Low amounts of TOC (usually <1%) indicate poor hydrocarbon potential, however, when compared with S2, the potential increases to fair, or even good (Figure 5b).
The samples show a slight increase in hydrocarbon potential with burial depth, presented in Figure 5b by different trend lines for each sampling section. The comparison between TOC, S2, and HI (Figure 5c) suggest the dominance of type I kerogen (oil-prone). Additionally, fair generation potential is indicated by TOC vs. S1 + S2 (GP) (Figure 5d).
The relations between TOC and HI showed very good oil potential, however, they slightly decreased with the sampling depth (Figure 5e). It needs to be mentioned that elevated HI might be related with material immaturity or hydronation. Samples in “layer A” showed the highest porosity, oxygenation, and water content, being reduced by a slow burial and compaction, which slightly increased the maturity and, in consequence, HI.
When compared with each other, the TOC and TS contents indicate the suboxic to dysoxic states of sediments, suggesting the strong diagenetic depletion of oxygen (Figure 5f). The TOC/TS factor varies from 1.15 to 2.15, with slightly dysoxic conditions observed in “layer B” and deeper.
The relations between OI and HI suggest oil-prone kerogen type I, however, the transition between type I/II and II kerogen, occurring with the sediment burial depth (black arrows), was also observed (Figure 6a).

4.1.2. Thermal Analysis (TA)

The analysed pelagic sediments are predominantly mixtures of hydrated siliceous biogenic silica, clay minerals (mainly illite and Fe-smectite), and finely polydispersed Mn-Fe oxyhydroxides. Accessory components are related to the presence of detrital quartz, feldspars, halite, barite, and volcanic glass [5]. During heating, different minerals exhibit highly variable decomposition rates, weight loss, or characteristic endothermic/exothermic effects [47]. The general pattern of thermal transformations is similar to bentonites, siliceous mudstones, and shales [57,58,59].
Most thermal changes are related to the dehydration and dehydroxylation of clays and opaline biosilica. Clay minerals are dominated by dioctahedric Fe-smectite and illite, which are dehydrated in temperatures of 70–210 °C [60]. The reaction is endothermic and related to lost or sorbed moisture and interlayer free water [61,62]. Above 550 °C, dehydroxylation maxima usually occur and are related to the amorphisation of clay components, evidenced by endothermic reactions. The temperatures of these processes in clay Fe-rich polytypes are usually lower, compared with the Ca-, Na-, or Mg-dominated specimens. Dehydroxylation processes are usually finished in temperatures of 850–950 °C [63]. Directly above 850 °C, the variable peak system of endothermic–exothermic reactions is observed, related to the solid phase structural decomposition and crystallisation of clay-based secondary mineral phases (quartz, spinels, mullite, or hematite) [61,64]. The endothermic thermal effects of clay minerals are partially increased and overlapped with strong endothermic dehydration reactions of opaline silica, usually occurring in temperatures of 40–600 °C. During the heating process, the water is partially removed as molecular water (H2O), or by Si–OH groups [65,66]. Additionally, the described effects are reduced by the significant exothermic reactions of gradual and multistage dehydration–oxidation of fine, polydispersed, poorly crystalline Mn-Fe oxyhydroxide gels (e.g., micronodules), composed of birnessite, todorokite, vernadite, buserite, and ferrihydrite/feroxyhyte [5,12,61].
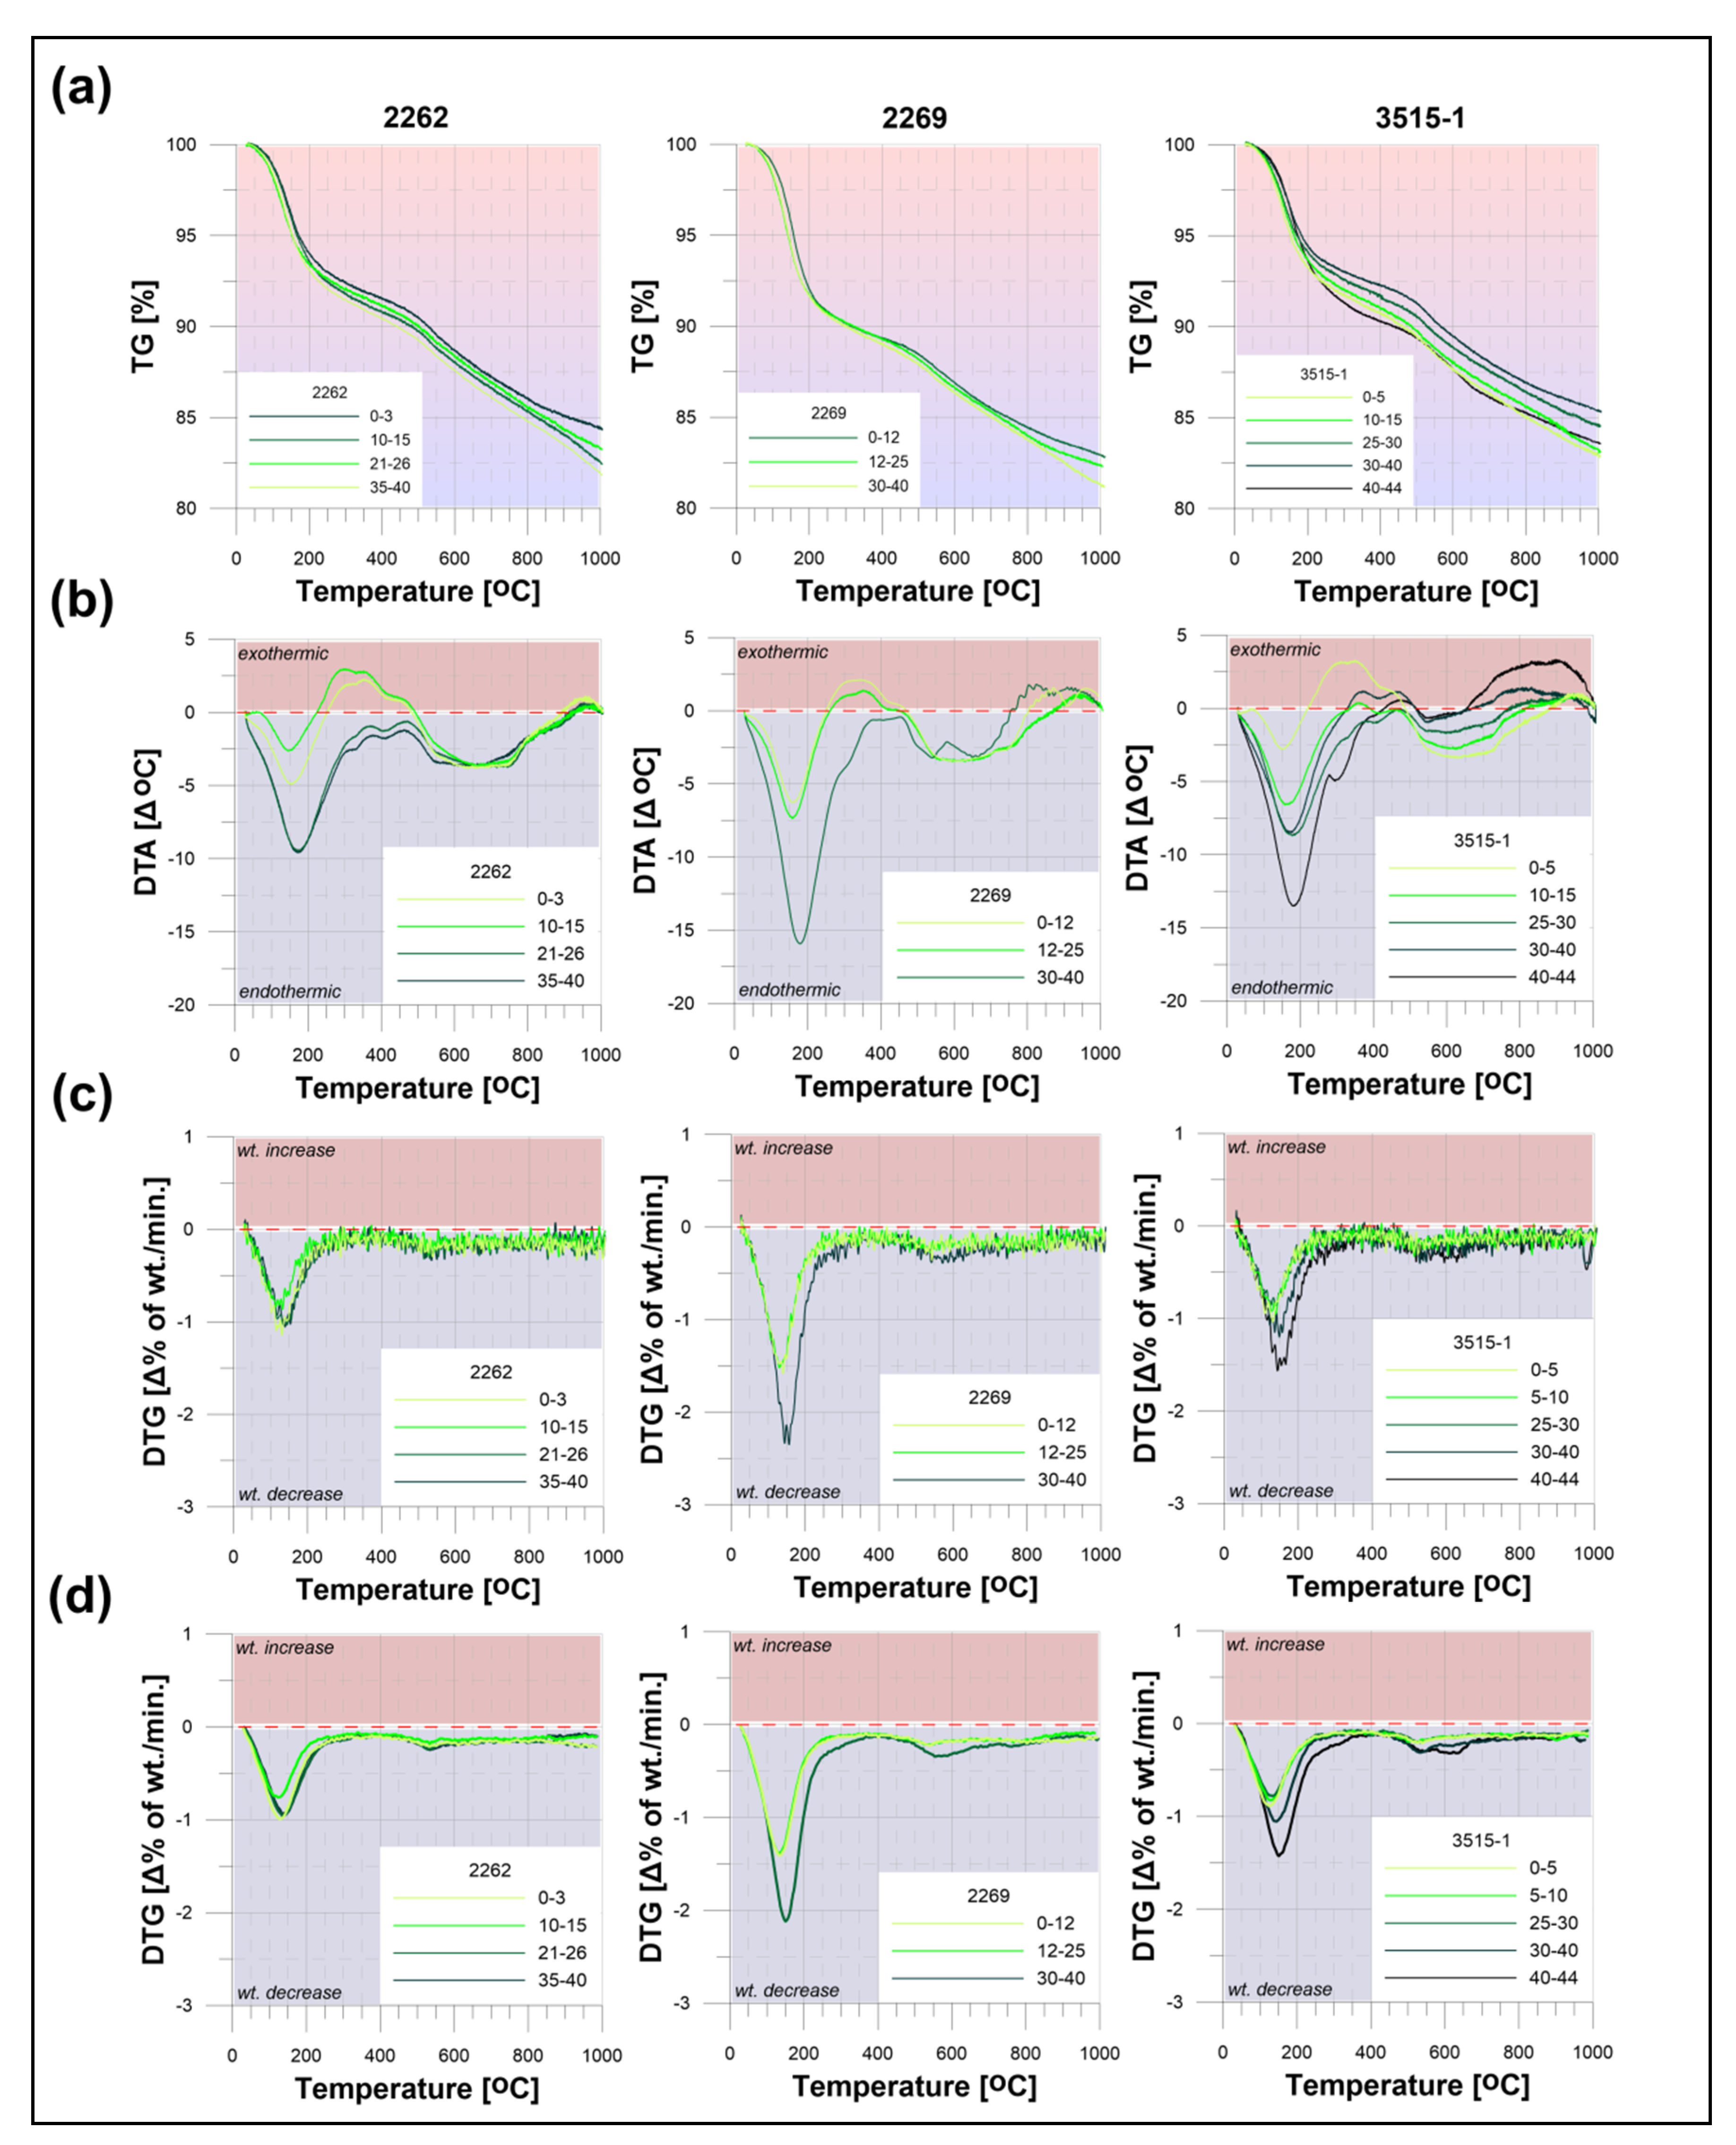
The obtained thermoanalytical curves indicate the presence of four major reaction types occurring due to heating samples to 1000 °C (Figure 7): (i) the dehydration of clay minerals, mainly illite and Fe-smectite, and opaline biocomponents of radiolarians and diatoms, occurring up to 210 °C; (ii) the transformation (burning and fusing) of dehydrated opaline silica, the dehydration of remnant micronodules (composed of Mn–Fe oxyhydroxides) and finely dispersed Mn–Fe compounds, starting directly after dehydration, and lasting till 450–500 °C; (iii) the dehydroxylation of clays overlapped with the endothermic decomposition of Mn-Fe oxyhydroxides (520–800 °C); (iv) the oxidation of initial Fe and Mn oxides, with the additional synthesis of new mineral phases (>800 °C).
The total (ΔTGT) weight loss varies from 14.65 to 18.78% (Figure 7a–d). The decrease in weight loss positively correlates with the increase in burial depth, usually from 2 to 3%. The DTAI Tmax of the 1st endothermal reaction changes from 149 to 183 °C, with the temperature increase observed with burial depth. The differences between the top and bottom layers vary between +18 and +29 °C. At the same time, an increase in negative thermal gradient (ΔDTAIT) with depth was observed (−2.76 to −16.50 °C). The lowest ΔDTAIT differences of the 1st reaction were noted at station 2262 (−4.5 °C). The differences in the other two stations are similar and reach over −10 °C, being mainly related to a greater variability of grain size and amorphic silica contents (and/or clays), compared with station 2262. The measured ΔDTGI is rather stable in all samples (−0.45 to −1.14% wt./min). The greatest rate of ΔDTGI was registered at station 2269 (−1.06 to −1.14% wt./min). The enthalpy of dehydration ΔHI varies from +202 to +1428 J/g, with a significant increase observed with burial depth.
Directly after the 1st endothermal reaction, the 2nd exothermal effect occurs, with the DTAII Tmax between 300 and 475 °C. The increase in exotherm Tmax is clearly visible with burial depth, however, the highest ΔDTAIIT were observed not in the bottom sections of the analysed stations, but in “active layer A” and “layer B”. This process is related to the higher oxygenation degree of finely dispersed Mn-Fe minerals, which produces more heat during the heating process, compared with the deeper layers. The ΔDTAIIT here even reach more than +3 °C, usually around +2 and +2.5 °C. The ΔDTGII is low, rather uniform, and varies from −0.17 to +0.05% wt./min. The negative enthalpy ΔHII decreases with burial depth (−583 to −12 J/g).
Substantially, above 520–530 °C, the 3rd endothermal reaction is visible (520 to 800 °C). The DTAIII Tmax is highly variable, with the minima registered between 543 and 691 °C. A decrease in DTAIII Tmax with burial depth (around 65 to 90 °C) was found, especially at stations 2269 and 3515-1. The ΔDTAIIIT is uniform in all samples, except station 3515-1. At stations 2262 and 2269, it varies from −3.45 to −3.83 °C, however, in the case of 3515-1, the decrease in ΔDTAIIIT was noted with depth (−0.96 to −3.31 °C). The rate of ΔDTGIII is rather low and uniform in all samples (−0.01 to −0.20% wt./min). The lowest values of ΔDTGIII were observed in samples from station 2262. The enthalpy ΔHIII changes from +38 to +1138 J/g, with significant decreases at all sampling stations, but especially at 3515-1.
The last reaction visible in the thermoanalytical curves is the exothermal effect observed above 800 °C. The DTAIV Tmax varies between 818 and 968 °C, however, it is stable in samples from station 2262 (954–968 °C). Samples from the other two stations show greater variability of DTAIV Tmax and a decrease in the temperature was noted with burial depth (from 950 to 830 °C). The ΔDTAIVT is highly variable and increases in the bottom sections of the analysed profiles, usually from +1.0 °C to 3.3 °C. This situation was not observed at station 2262, where a steady decrease in exotherm dominates. The ΔDTGIV varied here from −0.02 to −0.22 wt.%/min. The negative ΔDTG, related to the exothermal ΔDTA effect, is typical for the Si-rich melt-related synthesis stage, where a decrease in weight is observed, however, the overall temperature of the mineral system increases gradually. The enthalpy ΔHIV varies from −19 to −468 J/g, with a slight increase with depth at stations 2269 and 3515-1. In the case of station 2262, the highest ΔHIV is observed in “active layer A” (−60 J/g).
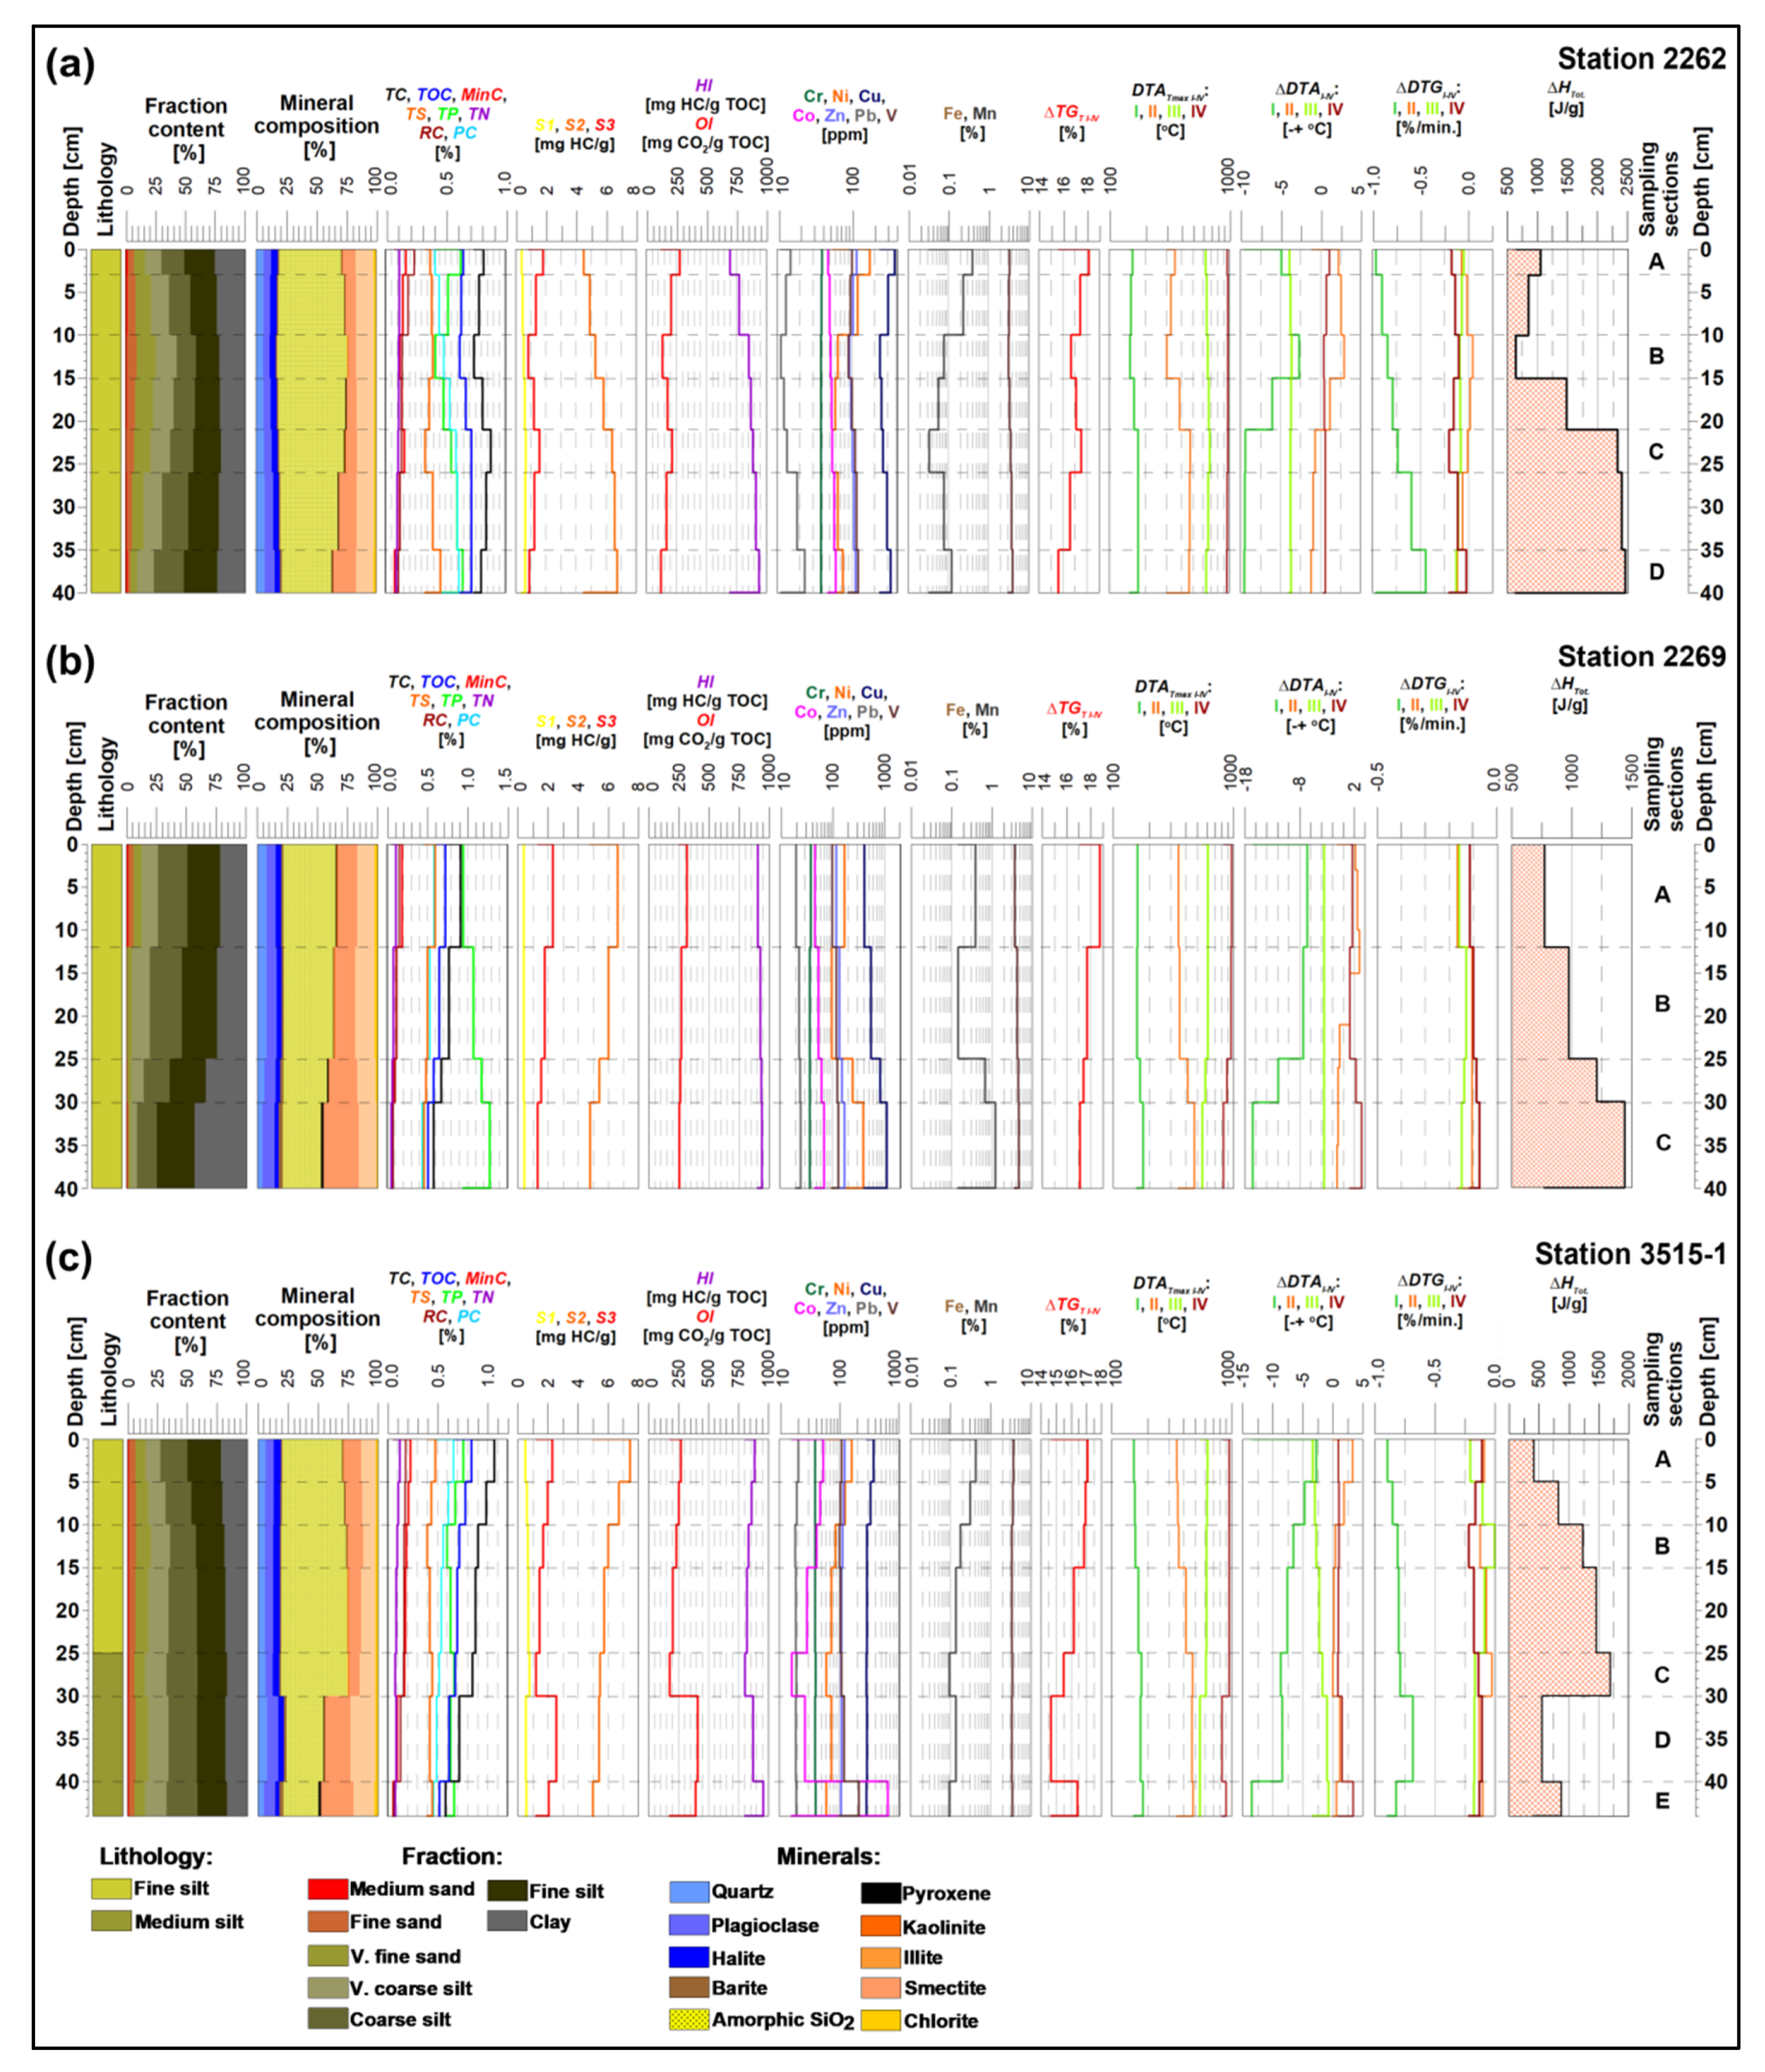
Finally, the total enthalpy ΔHTot. of the analysed samples varies from +423 to +2449 J/g. A steady increase in ΔHTot. was found at stations 2262 and 2269 and was strictly related to burial depth. Station 3515-1 showed the highest ΔHTot. in the middle part of the profile. All described parameters described are shown in Table 4, and in Figure 7a–d.

4.1.3. Nitrogen and Sulphur Combustion Spectrometry (NS)

Contents of TN and TS are low and vary from 0.05 to 0.12% and from 0.33 to 0.60%, respectively. A smooth decrease in TN content with burial depth was observed at all sampling stations.
The TS contents are rather uniform in all samples, however, at station 2269 a decrease with depth was seen. The TOC/TN and TOC/TS (Figure 5f) ratios are uniform and vary from 5.40 to 9.59 and 1.10 to 2.15, respectively. The TOC/TS parameter increases with depth, except for station 3515-1, where the highest values were noted in the middle section of the profile.
The TOC* ratio, which expresses the degradation rate of initial organic carbon, varies by 1.00 ± 0.11. In the case of sampling stations 2269 and 3515-1, the TOC* decreases with the burial depth, whereas at station 2262 it slightly increases.

4.2. Grain Size

According to the Folk and Ward textural classification of sediment types, the analysed samples are made up of medium and fine silts (5–7φ). The medium silts were found only in the middle and bottom sections of station 3515-1. The mean grain size varies from 5.92 to 7.99φ. The decrease in mean size (from 6 to 8φ) is observed with burial depth, mostly due to the increase in silt and clay fractions. The sorting is poor (±1.21–1.82φ), however, it slightly increases with depth. The silt fraction contents (0.004–0.063 mm) vary from 55.2 to 76.7%, and slightly increase with the burial depth. At station 2269, the silt amount decreases. The clay fraction content (<0.004 mm) varies from 17.1 to 43.2%. The greatest increase in clay fraction is observed at station 2269. The sand fraction content (>0.063 mm) varies from 1.0 to 9.4%, being dominated by very fine and fine sand subfractions. The increased contents of sand fractions are explained by the presence of micronodules, large microfossils, and diagenetic pellets. The grain size data are presented in Table 5.

4.3. Geochemistry

Analysed sediments are characterised by increased contents of metals, such as Fe, Mn, Cu, Ni, or Zn. The concentrations of Fe and Mn vary from 3.22 to 4.79% and 0.03 to 1.22%, respectively. The increase in Fe contents is observed at stations 2262 and 2269. Station 3515-1 showed uniform contents of Fe in all profiles. The increased contents of Mn were identified in “active layer A”, and in the bottom sections of described profiles. The Fe/Mn ratio varies from 3.8 to 107.7, with elevated values observed in the middle and bottom layers of sediments.
The Cu and Ni contents vary from 239 to 1108 ppm and 55 to 396 ppm, respectively. The highest Cu content is observed at station 2269. At the other two stations, the Cu content is less variable. The greatest amounts of Ni were identified in the top and bottom sections of sediment profiles. The Co contents (16 to 649 ppm) are strongly related to ∑(Cu, Ni). The increased amount of metals in “layer E” at station 3515-1 is related to the occurrence of diagenetic micronodules. The Ni/Co ratio varies from 0.09 to 3.61, with extreme values observed in the top and bottom sections.
The Zn and Pb contents vary from 93 to 170 ppm and 11 to 25 ppm, respectively. Both metals show similar behaviour to Cu or Ni.
The V and Cr contents are 90–210 ppm and 37–40 ppm, respectively, being important environmental indicators of the transition between oxic and suboxic conditions. The V content increases with burial depth. The Cr amount is rather uniform, showing a steady increase in V/Cr with burial depth (2.1 to 5.21).
The TP content is uniform in all samples, and varies from 0.42 to 1.28. The slight decrease in TP with burial depth was found at stations 2262 and 3515-1. Station 2269 shows an increase in TP. Variations in TP contents are mainly related to admixtures of biogenic carbonate–fluorapatite (CFA), which are mainly fish tooth and bone remnants [5]. The complete geochemical data of the analysed samples are shown in Table 6.

4.4. Mineralogy

4.4.1. Bulk XRD Analysis of Non-Heated Sediment Samples

According to XRD data, the analysed sediments are dominated by allogenic amorphous biogenic silica (opal–A) and clay minerals. The estimated contents of amorphous SiO2 vary from 29.5 to 58.4%, whereas the clay contents are 23.6–47.2%. The amount of amorphous SiO2 decreases with burial depth, whereas, at the same time, the clay amount increases (especially smectite).
Two major types of clay minerals were identified: (i) Fe-smectite and (ii) illite. Mg/Fe-chlorite and kaolinite are minor components (<3%). The analysed clays are genetically of mixed sources, partially composed of allogenic and authigenic sources [5,46].
Among the allogenic debris, the increased contents of quartz and feldspars were confirmed, varying from 5.3 to 7.7% and 5.4 to 10.1%, respectively. Feldspars are represented mainly by a plagioclase series (bytownite–andesine–oligoclase), with its amount slightly increasing with burial depth.
Similarly, at stations 2262 and 3515-1, the quartz content increases with depth, whereas it decreases in the case of station 2269. Beside the aforementioned components, traces of pyroxenes and amorphous volcanic glass were identified as minor components.
Halite and barite dominate among the diagenetic components. Halite contents steadily decrease (from 5.8 to 3.3%) with burial depth, whereas barite contents increase (from 1.1 to 3.3%). Barite is an important indicator of diagenesis occurring in oxic–suboxic conditions [67,68] and may be used as a correlative proxy for thermal data.
XRD results are presented in Table 7. Additional information about the studied samples was included in our recent paper [5].

4.4.2. Bulk XRD Analysis of Combustion Products

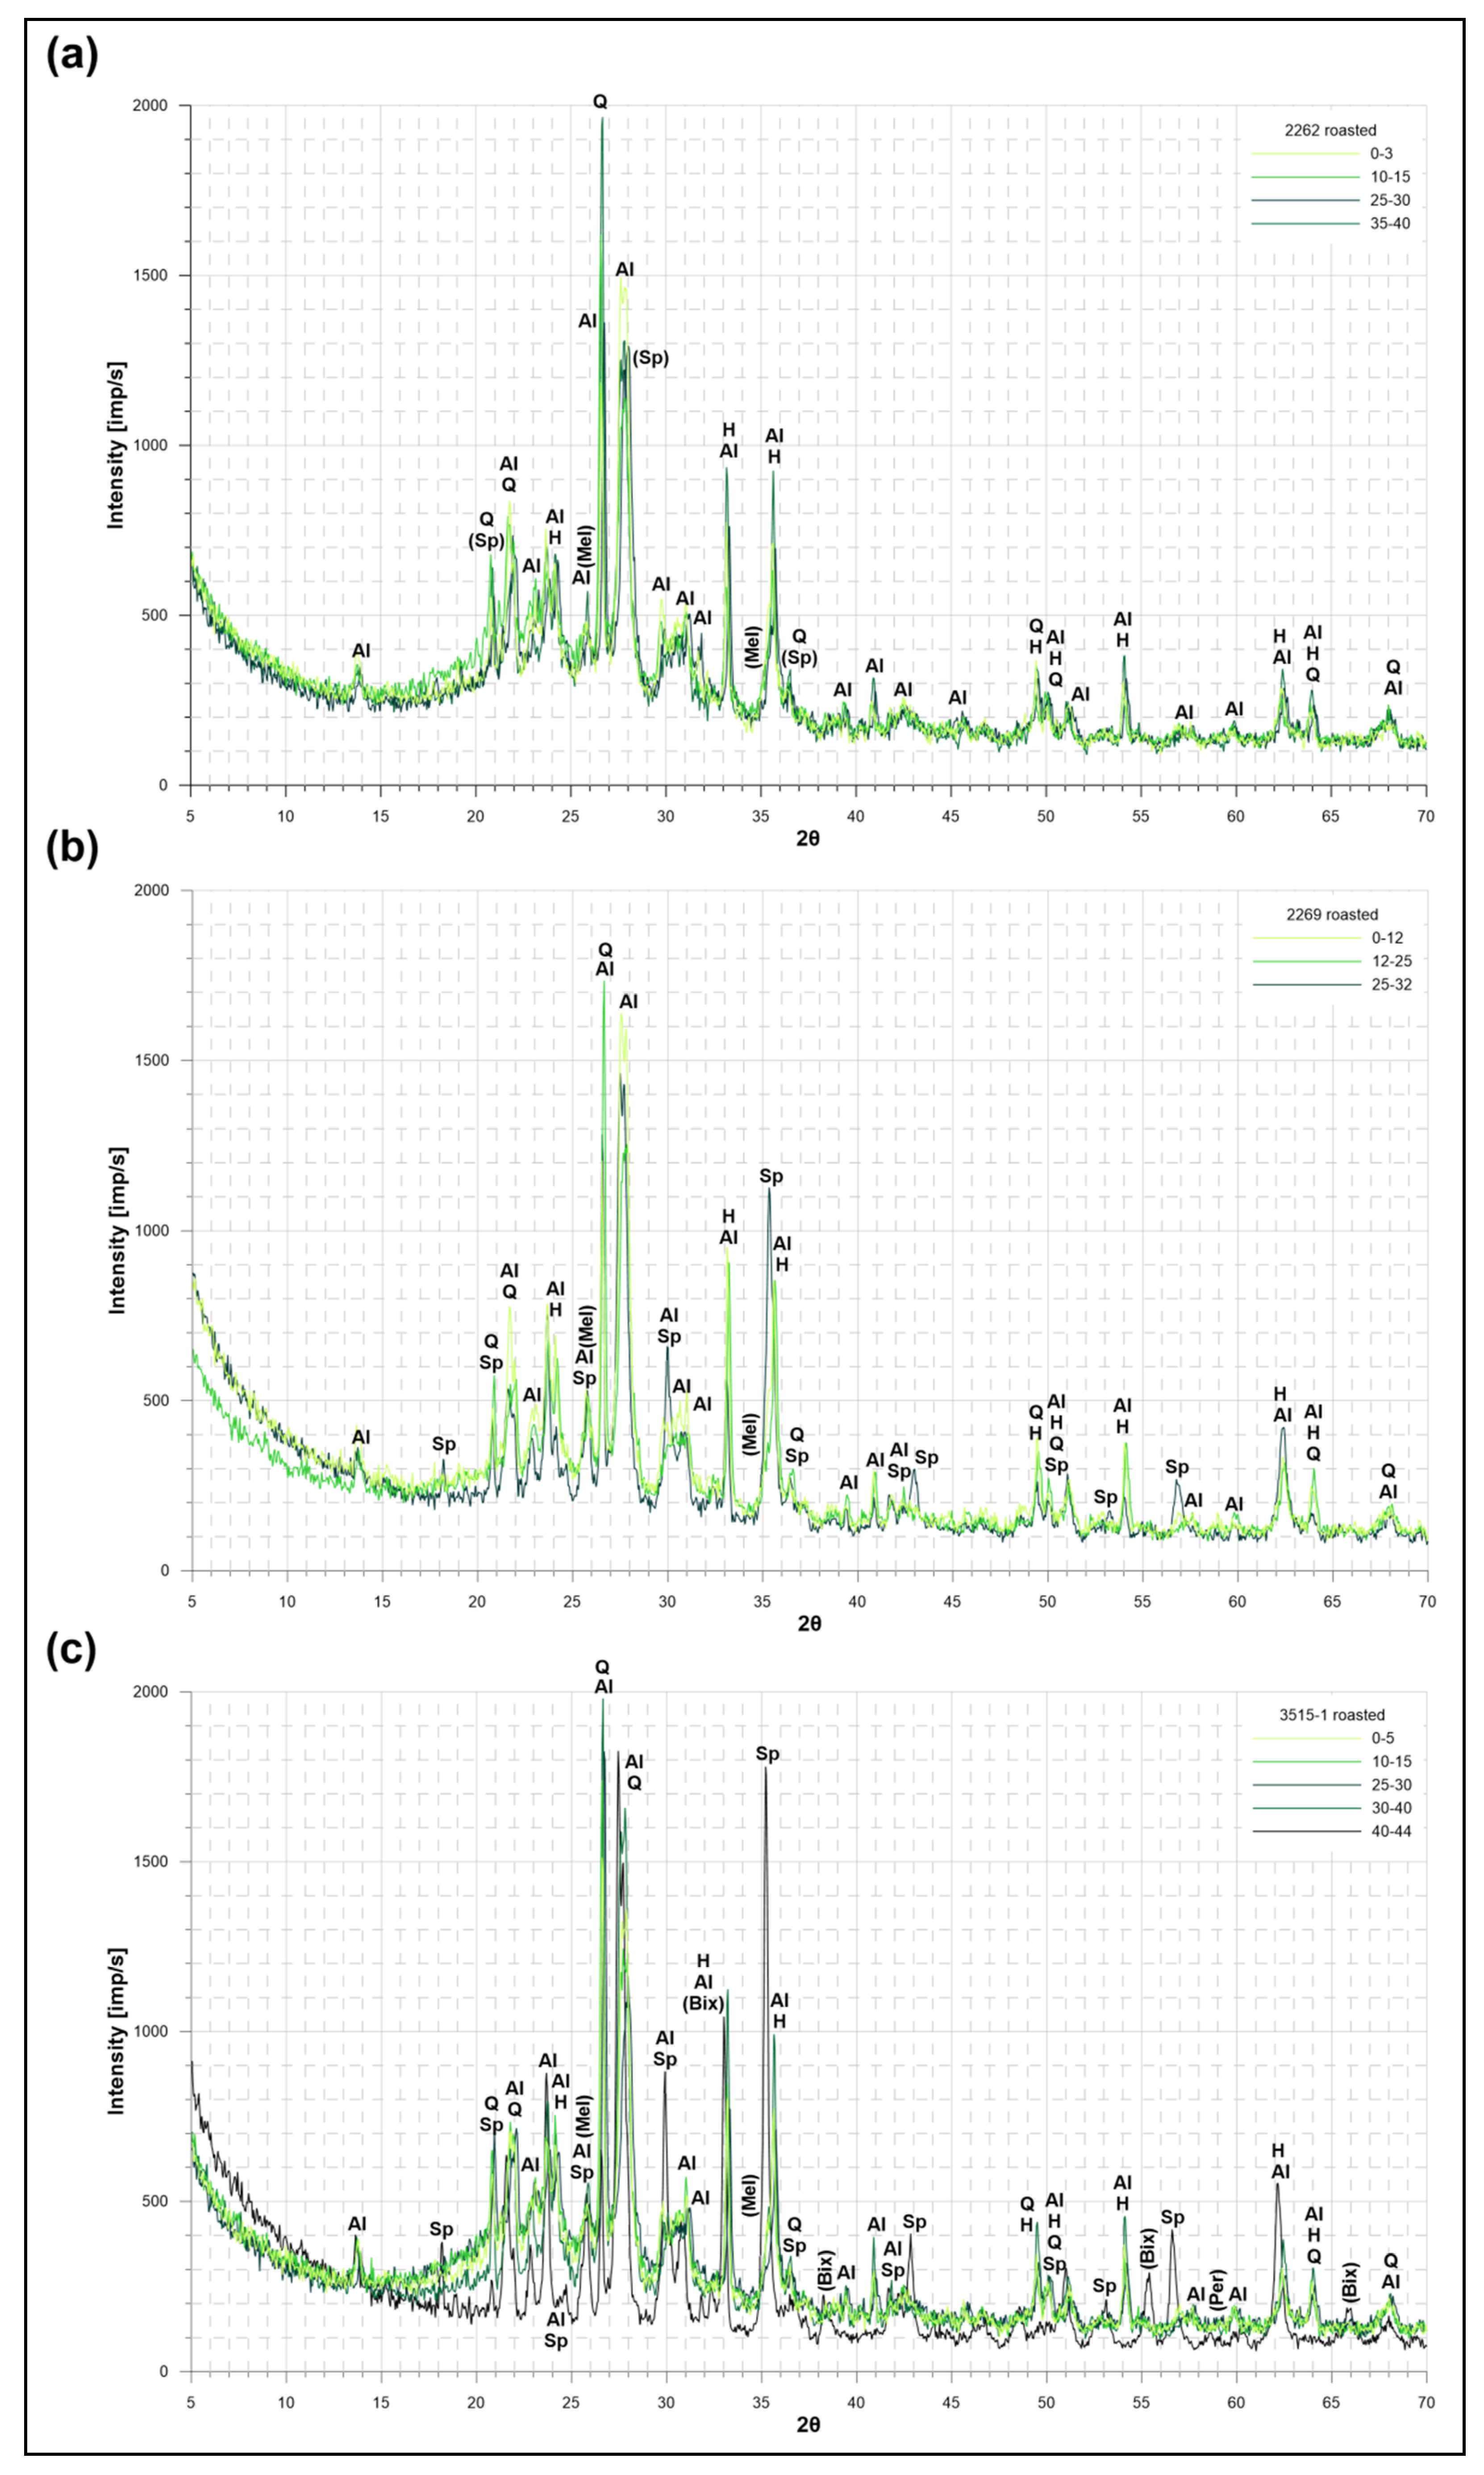
The minerals formed by heating to 1000 °C are chemically and structurally less variable, compared with the initial products. The dominating synthetic phase is feldspar of a low-temperature albite type [69]. Other new phases include oxidative metastable protohematite–hematite [70] and low-temperature quartz [71]. The latter was formed by the thermal decomposition of opaline biogenic silica and volcanic glass. Beside quartz, small admixtures of low-temperature crystobalite [72] were also identified. Additionally, the presence of spinel structures was confirmed, mostly of mixed Na–Al–Fe–Ca-rich ferrite types, with traces of magnetite [73]. Low amounts of synthetic melilite, bixbyite, and periclase were identified only in three samples from station 3515-1 (Figure 8a–c).
The amount of synthetic albite varies from 26.2 to 68.7%, with the highest values in “active layer A”, whereas it drops down to 45–50% with the burial depth (besides sample 30–40 at station 3515-1). The creamy white grains of albite are mixed with reddish protohematite–hematite in amounts ranging from 7.3 to 48.3%, mostly 12–16%. The Fe2O3 contents decrease with depth, except for sampling station 2262, where they increase (from 35.4 to 48.3%). The amounts of low-temperature quartz (and crystobalite) vary from 15.6 to 38.0%. At station 2262, the content of quartz gradually decreased with the depth, however, it was highly variable at the other two stations. The ratio between quartz and crystobalite is >3:1 and depends on the duration of heating and water content in the initial opaline biosilica [61,74]. The amount of spinels varies, from traces up to 20.3% (sample 40–44, station 3515-1), usually 5–15%. The increased spinel contents were observed in the case of stations 2269 and 3515-1, whereas at station 2262, a slight decrease was noticed. Beside spinels, melilite was identified as traces, with contents up to 5.2% in two samples from station 3515-1. Additionally, low amounts of periclase and bixbyite were observed in the bottom section of 3515-1.
In the selected samples, especially 3515-1 40–44 (or 2269 25–32), an increase in crystallinity (=background decrease) with burial depth was observed, as well as an increase in the intensity of the selected peaks of new mineral phases. Full data of roasted samples, including diffractograms, are shown in Figure 8 and in Table 8.

5. Discussion

5.1. Hydrocarbon Potential and Maturity of Pelagic Sediments from the CCFZ

The hydrocarbon distribution in Quaternary pelagic sediments generally reflects the composition of source organic matter, expressed as the euphotic zone bioproductivity, which is usually dominated by phytoplankton and algae. The contribution of terrestrial organic matter to deep-sea sediments is predominantly very low. The mean contents of hydrocarbons in modern sediments of this type usually vary from 20 to 100 ppm [75,76]. Long oxygen exposure times affect almost all sedimentary organic matter, as illustrated by low levels of organic matter in the oxic deep-sea sediments, including the presumed resistant biopolymers and geopolymers, which are ultimately mineralised with burial and time [7].
The characteristics and geochemical behaviour of organic matter in the surface sediments from the CCFZ are different, especially when compared with polymetallic nodules separated from the “active layer” of sediments. Allochthonous components in the sediments often present a high carbon preference index, due to slowing of the microbiologically induced processes. The compositional variations in the contents of the selected alkanes, dominated by n-C16, n-C18, and n-C20, are related to microbial activity and physicochemical conditions during burial [17]. The bacterial activity usually decreases utilisation and organic matter oxidation responses, leading to the termination of terrigenous component destruction and the preservation of biomarkers of land plants [18].
Referring to the R–E6 thermal maturation data, and especially to the elevated HI, the analysed samples need to be considered as oil prone, indicating fair hydrocarbon potential typical for algal and bacterial input. In these conditions, the amorphous liptinite macerals dominate, which are found in stratified organic-rich deep-sea sedimentary environments [77]. Kerogen type I is usually concentrated in condensed sections, especially in the areas where detrital sediment deposition is low and primarily pelagic [78], as in the case of the CCFZ. Only two samples at station 2262 showed signatures of a thermally immature oil-prone type identified as kerogen II-S, however, the TS contents were too low there, and did not confirm the significant impact of sulphates on the formation of this kerogen [79]. It shall be emphasised that elevated OI may be the effect of highly volatile oxide compounds, affecting the secondary oxidation of, e.g., Mn–Fe minerals, and steadily increasing the intensity of thermal reactions observed during the heating process. The elevated HI results from the thermal decomposition of siliceous organisms, where opaline silica loses absorbed and structural water. The factors mentioned, except for salt ionisation or some methodical aspects of R–E6 analysis, such as the high rate of heating [15], negatively affect the credibility of R–E6 applied for the analysis of the hydrocarbon potential of modern pelagic sediments. Nevertheless, the R–E6 data, compared with other thermal results (e.g., DTA), may provide useful information about the alteration and oxygenation of pelagic sediments.
As organic matter is preferentially degraded with burial depth, and due to oxygen depletion, a slight but stable increase in allochthonous organic matter content was found in all samples. In that case, biodegradation and diagenetic partitioning dominates [7].
The high values of the hydrogen index HI (698–960 mg HC/g TOC) are typical for immature, hydrogen-rich organic matter. The methanogenesis signatures are of kerogen type I, which is slightly dominated by allochthonous organic matter [80]. It should be noticed that the obtained Tmax of hydrocarbon generation was very high, always exceeding 600 °C, which suggests the extreme postmaturation of sediments. Thus, high temperatures may be an effect of the ionisation of chlorine or sulphate salts, formed as a halite, barite, or gypsum. In that specific case, the Tmax parameter is not useful for the indication of maturation degree [15]. Highly increased Tmax values may also be related to a high proportion of oxidative products, when compared with relatively low TOC contents [8]. Barite and halite are commonly found in the described sediments, mostly as diagenetic products of sulphate reduction and compaction processes [15,68], however, their low contents (<5%) do not affect the Tmax values.
In the case of station 2262, the increase in TOC* with burial depth positively correlates with Fe, TS, and diagenetic barite contents, suggesting the presence of a distinctive “oxidation front” (Figure 9a). Additionally, the TOC* positively correlates with an increase in S2 with burial depth, which was observed only at station 2262. Elevated Tmax may be connected with the presence of a high amount of hydrated biogenic silica of radiolarians and diatoms, or complex dehydration–oxidation processes affecting Fe–Mn minerals formation, e.g., micronodules. Opaline biocomponents strongly affect the volatilisation of the samples and, therefore, high Tmax values make it impossible to provide reliable data on the degree of thermal alteration of organic matter. In that case, the calculation of the theoretical vitrinite reflectance parameter Vr0 [81] is also unreasonable, due to the strong dependence on Tmax. Elevated Tmax values may wrongly suggest the extreme postmaturation of samples, which in the case of this study is definitely incorrect. Overestimated Tmax values (601 to 605 °C) may also be caused by the thermal disintegration of highly volatile oxide compounds (high values of OI varying from 124 to 413 mg CO2/g TOC; see Table 3), and the catalytic influences of finely dispersed metals, such as Fe, Mn, Cu, Ni, or Zn (Table 6).
Low values of the kerogen conversion production index PI (0.06 to 0.12) suggest the immaturity or low maturity of samples, and a low level of the conversion of organic matter. Dembicki [82] pointed out that the poor correlation of measured and calculated vitrinite reflectance of deep-sea shale source rocks strongly depends on a limited input of land-based higher plants debris, which are usually not accumulated in deep-sea basins. Additionally, vitrinite particles that are useful for reflectivity measurements and calculations are most likely to be found in type III and type II/III shales [83].
The relations between TOC and S2 indicate increased planktonic input as the main organic matter supplier. The skeletons of radiolarians and diatoms, dominant among siliceous biocomponents in the study area, contain a lot of lipids and carbohydrates, which provide organic nutrients and carbon-derived products [84,85].
According to the low TOC contents in all samples (0.51–0.84 wt.%), the hydrocarbon potential is poor, however, increased values of S2 (4.54 to 7.56 mg HC/g of sediment) suggest high and very high potential [86]. The potential is poor if compared to S2, however, there is a question of whether the shallow burial of sediments may slightly increase the values from fair to good. The GI also suggests fair potential of hydrocarbon generation, however, as mentioned before, S2 strongly depends on volatile compounds, hence these results might be unreliable.
The low maturity of organic matter in the CCFZ was confirmed by hydrocarbon extraction from polymetallic nodules, however, some of the analysed aromatic hydrocarbons showed greater maturity. Chromatographic and biomarker analysis suggested a migrating type of hydrocarbon, induced by sludge transport into deeper layers of sediment, and further migration to shallower parts, caused mainly by diffusion and imbuing. The generation of hydrocarbons was also related to the seafloor hydrothermal activity and sudden volcano–tectonic events. In that case, the organic matter in deep-sea sediments is decomposed due to natural pyrogenation, occurring by extreme heat flow in volcano–magmatic areas or hot springs. The aforementioned hydrothermal or volcanic processes may decompose organic matter rich in diatoms and other siliceous organisms [10].
The discrimination of kerogen types in pelagic sediments, based on pyrolytic analysis of organic matter, needs to consider several “mineral matrix effects” related to, e.g., the “polar effect” of clays, which usually retards the release of hydrocarbons from powdered whole-rock samples and may under-evaluate the quantity, quality, and thermal maturation of data. The “mineral matrix effect” occurs mostly by the clay reactions with polar organic molecules during the non-hydrous stage of Rock–Eval measurements [87,88,89].
The effects of different matrix constituents vary from the strongest to the weakest, as follows:
illite > smectites and kaolinite > calcium carbonates > gypsum (or barite).
These variations in the “mineral matrix effects”, related to the organic richness, usually occur in whole-rock samples, and indicate low TOC values (below 10%) (e.g., [87,88,90,91]). Due to the increased contents of clay minerals in the analysed samples, especially illite and Fe-smectite and admixtures of barite, the potential influences of matrix effects are highly probable. Due to geological burial, clays undergo physical and chemical alteration, usually preceding the slow and systematic thermal conversion (generation) of kerogen to petroleum. These changes occur in hydrous environments which reduce the reactive capabilities of clays, mainly before a significant hydrocarbon generation can occur. Nevertheless, some degree of mineral matrix effect probably does not persist under the mentioned geological conditions [92].

5.2. Thermal Behaviour and Combustion Products

During the R–E6 and TA, the whole-rock samples were heated rapidly in an anhydrous environment, resulting in rapid mineral changes and the formation of new combustion products. The S1 and S2 values are positively related to TOC, TN, halite, and amorphous silica contents, suggesting a slight dominance of allochthonous organic matter. PI showed a strong relation to S1, indicating a low amount of free hydrocarbons trapped in the sediments. The S1 was also positively related to the 1st endothermic effect observed in the TA data, suggesting hydrocarbon release mainly by the dehydration of clay minerals. Similar relations between S2 and TA data were observed, especially when compared with the 2nd exothermic effect, however, these are less significant. Nevertheless, the described processes are related to hydrocarbon release during the decomposition of Mn–Fe oxyhydroxides trapped, e.g., by micronodules or polydispersive Mn–Fe oxyhydroxides. S3 is mainly related to OI, and less to clays, TS, and TN. The hydrocarbon release in a highly volatile phase was less intense, compared to S2. HI shows strong relations with Fe-smectite, mean grain size, and ΔTGTot., correlating mainly with the H2O release. The behaviour of ΔTGTot. is comparable with Tmax, even if the differences with Tmax reached only a few degrees Celsius (Figure 9a–c).
The total enthalpy of sample ΔHTot., which is one of the most distinctive thermal parameters obtained during this study, shows a positive relation with S3 and OI, being caused by dehydration and volatilisation processes. These effects are partially visible in the DTA or DTG curves in the form of slightly jagged lines occurring mostly >650 °C (Figure 7a–d). The jagged shape of the curves is a direct result of: (i) an increase in internal pressure inside the crucible → (ii) an increase in viscosity caused by amorphous silica melting → (iii) the formation of gas bubbles with inhibited release, caused mainly by material amalgamation.
In that case, the ΔHTot. may be used as an indicator of reduction/oxidation potential. The distinctive increase in positive enthalpy was observed with burial depth in all samples, where the depletion of oxygen occurred (Figure 9a–c; last column).
As activation energy, Ea relates directly to the sample weight and total enthalpy (=total heat flux), varying from 423 to 2449 J/g. The highest values of Ea were found below 20 cm, where a strong oxygen deficiency occurred, and an increase in clay minerals was observed. Additionally, elevated Ea values were registered in “active layer A”, mainly due to high oxygenation and increased contents of hydrated biosilica.
The presence of the last exothermic reaction ΔDTAIV correlates positively with the increased contents of plagioclases, clays, grain size, or metals, suggesting alteration, decomposition, and mineral synthesis occurring in conditions of high volatility and internal pressure.
Formed mineral products are directly related to the primary components of sediments. The contents of synthetic albite are the highest in the “active layer”, and usually decrease with depth (caused by a gradual increase in the contents of clay minerals). Clays are predominant for the synthesis of low-temperature oxides, such as microcrystalline Fe–Mn spinels or silicates, mostly melilite. Apart from spinels, the formation of protohematite and hematite was found in most of the samples, with contents exceeding 10%. Protohematite and hematite are the products of the transformation of initial Fe–oxyhydroxides that make up micronodules, mainly ferrihydrite/feroxyhyte, and clay minerals. Remnants of biosilica formed metastable cristobalite and finally quartz.

5.3. Comparison of Thermal Proxies of Oxic–Suboxic Burial Diagenesis with Lithological Data

The relations between TOC and TS data suggest diagenetic processes occurring under dysoxic–suboxic conditions. The extreme R–E6 Tmax (>600 °C) is related to the presence of the 3rd endothermic effect visible in the TA data, ranging from 543–691 °C. The endothermic reaction described is explained as the dehydroxylation of illite and Fe-smectite. The intensity of this process is enhanced by a Mn+4 to Mn+3 reduction of Mn oxides [47], which is confirmed, e.g., in the samples from station 3515-1, where bixbyite (Mn,Fe)2O3 was found. The effects of halite ionisation are less probable, mainly due to the low NaCl contents, and a lack of typical reaction temperatures observed during TA. The influences of the thermal decomposition of opaline biosilica are also less likely, mainly due to the low temperature of endothermic water release, being usually 200–400 °C [61].
Due to the comparison of selected geochemical indicators of environmental parameters, such as Ni/Co and V/Cr, the transition between oxic and oxic–dysoxic conditions was confirmed and correlated with the thermal data. Oxic conditions are typical for “layer A” (active layer), however, they change rapidly with burial depth (see Figure 6b,c). Only in the case of one sample (3515-1; 40–44) were suboxic conditions observed, indicated by the increased contents of early diagenetic micronodules, clay minerals, and the lowest amount of opaline biosilica.
The Ni/Co ratios were the highest in the uppermost 10 cm of sediments, suggesting a slight increase in oxic conditions with burial depth [93], potentially caused by bioturbations. In addition, the TOC/TS ratios confirmed the transition between oxic–suboxic conditions. The TC and TOC contents usually decreased with burial depth, while TS and TP increased (or were quite stable), indicating a discharge of organic matter and phosphate/sulphate release due to burial. Additionally, these processes positively correlate with fluctuations of hydrocarbon pyrolysis expressed by S2 and with increased contents of clay minerals. The HI and OI indices showed positive correlations with clays and, additionally, with the hydrated biosilica.
Diagenetic modelling of sediments from the CCFZ conducted by [11] indicated that, due to the low sedimentation rates in the CCFZ, the labile fractions of TOC are limited to the upper 20 cm of sediments, where degradation is dominated by aerobic respiration. The Mn4+ reduction and denitrification are not so important there, and consume less than 2% of refractory organic matter.
The early diagenetic uptake, degradation of biogenic silica, and discharge consumption of carbon, nitrogen, sulphur, and phosphorus observed during sediment burial increase the fractionation of metals, such as Cu, Ni, Co, Zn, and REE. The contents of critical metals show positive correlations with fine fractions of the sediments (mostly fine silt and clay) and micronodules, which is direct proof of metal scavenging caused by a oxic–suboxic diagenesis [5].

6. Conclusions

  • Quaternary pelagic sediments from the Clarion–Clipperton Fracture Zone reveal fair hydrocarbon potential, related to the burial diagenesis of bio-siliceous organic matter, and its further degradation occurring in oxic–suboxic conditions.
  • Due to the intensive matrix effects, the occurrence of organic oxygen compounds, and catalytic influences of dispersed metals, the Tmax and Vr0 parameters estimated during Rock–Eval pyrolysis are not applicable for determining the thermal maturity of modern pelagic sediments.
  • The total enthalpy ΔHTot. calculated by the use of differential thermal analysis (DTA) is a new indicator of redox potential and alteration processes occurring during the early diagenesis stage. The distinctive increase in negative enthalpy is observed with burial depth, especially below the “active layer” (10 cm and deeper), where sediments show strong depletion of oxygen and intensive phase transformations occur.
  • The total activation energy Ea varied from +423 to +2449 J/g (=heat flux), with extremes found below 20 cm, where strong oxygen deficiency occurred, and an increase in clay mineral content was observed. Additionally, the elevated Ea values were related to “active layer A”, mainly due to high oxygenation and increased contents of hydrated biosilica. Increased Ea values were also found in the samples from station 3515-1 (below 30 cm), which showed high contents of clay minerals, finely dispersed metals, and increased R−E6 indices (mainly S2, OI, and HI).
  • Mineral products of combustion synthesis are related with the primary components of the CCFZ pelagic sediments and include: albite, Fe–Mn spinels (with potential vacancy of Cu, Ni, Co, Zn, and other metals), protohematite–hematite, and quartz–crystobalite. Traces of bixbyite, melilite, and periclase were also identified. Material enriched with Fe indicated weak paramagnetic properties and an increased degree of crystallinity.

Author Contributions

Conceptualisation, Ł.M., M.J.K. and A.P.; methodology, Ł.M., D.Z., M.J.K., R.W. and H.Z.; software, Ł.M., D.Z., M.J.K., R.W. and H.Z.; validation, Ł.M., A.P., M.J.K. and R.A.K.; formal analysis, Ł.M., D.Z., M.J.K., A.P. and R.A.K.; investigation, Ł.M., M.J.K. and H.Z.; resources, Ł.M., D.Z., A.P., R.W. and M.J.K.; data curation, Ł.M., M.J.K. and H.Z.; writing—original draft preparation, Ł.M., D.Z. and M.J.K.; writing—review and editing, Ł.M., D.Z., R.W. and M.J.K.; visualisation, Ł.M. and D.Z.; supervision, R.A.K. and M.J.K.; project administration, Ł.M.; funding acquisition, Ł.M., D.Z., A.P. and M.J.K. All authors have read and agreed to the published version of the manuscript.

Funding

The research was partially supported by statutory funds of the Institute of Marine and Environmental Sciences, University of Szczecin (No. 503-1100-230342) and the Faculty of Geology, Geophysics and Environmental Protection, AGH University of Science and Technology, Kraków, Poland (No. 16.16.140.315).

Acknowledgments

We would like to thank Tomasz Abramowski (General Director of IOM, Szczecin, Poland), for scientific co-operation and providing samples. We are grateful to our reviewers for constructive and detailed comments. We wish to thank Sylwia Zawadzka for linguistic assistance and correction of the final version of the manuscript.

Conflicts of Interest

The authors declare no conflict of interest. The funders had no role in the design of the study.

References

  1. Von Stackelberg, U.; Beiersdorf, H. The formation of manganese nodules between the Clarion and Clipperton Fracture-Zones south east of Hawaii. Mar. Geol. 1991, 98, 411–423. [Google Scholar] [CrossRef]
  2. Kotliński, R.A. Deep-sea sediments. In Mineral Resources of the Seas and Oceans; Kotliński, R., Szamałek, K., Eds.; Scholar: Warszawa, Poland, 1998; pp. 101–121, (In Polish with English Abstract). [Google Scholar]
  3. Kotliński, R.A. Relationships between nodule genesis and topography in the eastern area of the Clarion-Clipperton region. In Establishment of a Geological Model of Polymetallic Nodule Deposits in the Clarion-Clipperton Fracture Zone of the Equatorial North Pacific Ocean; ISA: Kingston, Jamaica, 2009; pp. 203–221. [Google Scholar]
  4. Radziejewska, T. Characteristics of the sub-equatorial north-eastern Pacific Ocean’s abyss, with a particular reference to the Clarion-Clipperton Fracture Zone. In Meiobenthos in the Sub-Equatorial Pacific Abyss; Springer Briefs in Earth System Sciences: Berlin/Heidelberg, Germany, 2014; pp. 13–28. [Google Scholar] [CrossRef]
  5. Zawadzki, D.; Maciąg, Ł.; Abramowski, T.; McCartney, K. Fractionation Trends and Variability of Rare Earth Elements and Selected Critical Metals in Pelagic Sediment from Abyssal Basin of NE Pacific (Clarion-Clipperton Fracture Zone). Minerals 2020, 10, 320. [Google Scholar] [CrossRef] [Green Version]
  6. Zawadzki, D.; Kotliński, R.A. Conditions of the occurrence and distribution prospective ferromanganese oxide deposits. Górnictwo i Geoinżynieria 2011, 35, 427–439, (In Polish with English Abstract). [Google Scholar]
  7. Zonneveld, K.A.F.; Versteegh, G.J.M.; Kasten, S.; Eglinton, T.I.; Emeis, K.-C.; Huguet, C.; Koch, B.P.; de Lange, G.J.; de Leeuw, J.W.; Middelburg, J.J.; et al. Selective preservation of organic matter in marine environments; processes and impact on the sedimentary record. Biogeosciences 2010, 7, 483–511. [Google Scholar] [CrossRef] [Green Version]
  8. Holtvoeth, J. Terrigenous Organic Matter in Sediments of the Eastern Equatorial Atlantic—Distribution, Reactivity, and Relation to Late Quaternary Climate. Ph.D. Thesis, Faculty of Geosciences, Bremen University, Bremen, Germany, 2004; pp. 1–135. [Google Scholar]
  9. A Geological Model of Polymetallic Nodule Deposits in the Clarion–Clipperton Fracture Zone; International Seabed Authority Technical Study No. 6; ISA: Kingston, Jamaica, 2010; pp. 1–211. Available online: https://ran-s3.s3.amazonaws.com/isa.org.jm/s3fs-public/files/documents/tstudy6.pdf (accessed on 12 February 2020).
  10. Hu, W.; Jin, Z.; Yao, S.; Lu, Z.; Chen, Z.; Zhang, L.; Zhang, X.; Zhou, H. Discovery of low-mature hydrocarbon in manganese nodules and ooze from the Central Pacific deep sea floor. Chin. Sci. Bull. 2002, 47, 939–944. [Google Scholar] [CrossRef]
  11. Volz, J.B.; Mogollón, J.M.; Geibert, W.; Arbizu, P.M.; Koschinsky, A.; Kasten, S. Natural spatial variability of depositional conditions, biogeochemical processes and element fluxes in sediments of the eastern Clarion-Clipperton Zone, Pacific Ocean. Deep Sea Res. Part I Oceanogr. Res. Pap. 2018, 140, 159–172. [Google Scholar] [CrossRef]
  12. Wegorzewski, A.V.; Kuhn, T. The influence of suboxic diagenesis on the formation of manganese nodules in the Clarion Clipperton nodule belt of the Pacific Ocean. Mar. Geol. 2014, 357, 123–138. [Google Scholar] [CrossRef]
  13. Espitalié, J.; Laporte, J.L.; Madec, M.; Marquis, F.; Leplat, P.J.; Paulet, F.; Boutefeu, A. Rapid Method for Source Rocks Characrerysation and for Determination of Petroleum Potential and Degree of Evolution. Rev. Inst. Fr. Petrol. 1977, 32, 23–42, (In French with English Abstract). [Google Scholar] [CrossRef]
  14. Espitalié, J.; Deroo, G.; Marquis, F. Rock-Eval pyrolysis and its application. Rev. Inst. Fr. Petrol. 1985, 40, 755–784. [Google Scholar] [CrossRef]
  15. Baudin, F.; Disnar, J.-R.; Aboussou, A.; Savignac, F. Guidelines for Rock-Eval analysis of recent marine sediments. Org. Geochem. 2015, 86, 71–80. [Google Scholar] [CrossRef] [Green Version]
  16. Hazra, B.; Wood, D.A.; Mani, D.; Singh, P.K.; Singh, A.K. Evaluation of Shale Source Rocks and Reservoirs; Springer International Publishing: Berlin/Heidelberg, Germany, 2019; pp. 1–142. [Google Scholar] [CrossRef]
  17. Shulga, N.A. Characteristics of Alkanes in Ferromanganese Nodules of the Clarion–Clipperton Fracture Zone. Oceanology 2018, 58, 672–678. [Google Scholar] [CrossRef]
  18. Shulga, N.A. Distribution of n-alkanes in the ferromanganese nodule–sediment–pore water system (Clarion–Clipperton Fracture Zone). Lithol. Miner. Resour. 2017, 52, 435–441. [Google Scholar] [CrossRef]
  19. Bąk, K. Sedimentological, geochemical and microfaunal responses to environmental changes around the Cenomanian-Turonian boundary in the Outer Carpathian Basin; a record from the Subsilesian Nappe, Poland. Palaeogeogr. Palaeoecol. Palaeoclimatol. 2006, 237, 335–358. [Google Scholar] [CrossRef]
  20. Littke, R.; Lückge, A.; Welte, D.H. Quantification of organic matter degradation by microbial sulfate reduction for Quaternary sediments from the Northern Arabian Sea. Naturwissenschaften 1997, 84, 312–315. [Google Scholar] [CrossRef]
  21. Law, A.C. Evaluating source rocks. In Treatise of Petroleum Geology. Handbook of Petroleum Geology: Exploring for Oil and Gas Traps; Beaumont, E.A., Foster, N.H., Eds.; The American Association of Petroleum Geologists: Matarza, OK, USA, 1999; pp. 1–41. [Google Scholar] [CrossRef]
  22. Johannes, I.; Kruusement, K.; Veski, R.; Bojesen-Koefoed, J.A. Characterisation of pyrolysis kinetics by Rock-Eval basic data. Oil Shale 2006, 23, 249–257. [Google Scholar]
  23. Tissot, B.P.; Welte, D.H. Petroleum Formation and Occurrence, 2nd ed.; Springer: New York, NY, USA, 1984. [Google Scholar] [CrossRef]
  24. Labus, M.; Matyasik, I.J. Application of different thermal analysis techniques for the evaluation of petroleum source rocks. J. Therm. Anal. Calorim. 2019, 136, 1185–1194. [Google Scholar] [CrossRef] [Green Version]
  25. El Nady, M.M.; Hammad, M.M. Organic richness, kerogen types and maturity in the shales of the Dakhla and Duwi formations in Abu Tartur area, Western Desert, Egypt: Implication of Rock–Eval pyrolysis. Egypt. J. Pet. 2015, 24, 423–428. [Google Scholar] [CrossRef] [Green Version]
  26. Kontakiotis, G.; Karakitsios, V.; Cornée, J.-J.; Moissette, P.; Zarkogiannis, S.D.; Pasadakis, N.; Koskeridou, E.; Manoutsoglou, E.; Drinia, H.; Antonarakou, A. Preliminary results based on geochemical sedimentary constraints on the hydrocarbon potential and depositional environment of a Messinian sub-salt mixed siliciclastic-carbonate succession onshore Crete (Plouti section, eastern Mediterranean). Mediterr. Geosci. Rev. 2020. [Google Scholar] [CrossRef]
  27. Grohmann, S.; Fietz, S.W.; Littke, R.; Daher, S.B.; Romero-Sarmiento, M.F.; Nader, F.H.; Baudin, F. Source rock characterization of mesozoic to cenozoic organic matter rich marls and shales of the Eratosthenes Seamount, Eastern Mediterranean Sea. Oil Gas Sci. Technol. Rev. d’IFP Energ. Nouv. 2018, 73. [Google Scholar] [CrossRef] [Green Version]
  28. Kotliński, R.A. Clarion-Clipperton nodule field—A future source of mineral deposits. Górnictwo i Geoinżynieria 2011, 35, 195–214, (In Polish with English Abstract). [Google Scholar]
  29. Mewes, K.; Mogollón, J.M.; Picard, A.; Rühlemann, C.; Kuhn, T.; Nöthen, K.; Kasten, S. Impact of depositional and biogeochemical processes on small scale variations in nodule abundance in the Clarion-Clipperton Fracture Zone. Deep Sea Res. Part I Oceanogr. Res. Pap. 2014, 91, 125–141. [Google Scholar] [CrossRef]
  30. Yubko, V.; Kotliński, R. Volcanic, tectonic and sedimentary factors. In Prospectors Guide for the Clarion–Clipperton Zone Polymetallic Nodule Deposits, Development of a Geological Models for the Clarion-Clipperton Zone Polymetallic Nodule Deposit, 1st ed.; Morgan, C., Ed.; ISA: Kingston, Jamaica, 2009; Volume 1, pp. 11–34. [Google Scholar]
  31. International Seabed Authority. Available online: https://www.isa.org.jm/ (accessed on 10 July 2020).
  32. Dreiseitl, I. Deep sea exploration for metal reserves—Objectives, methods and look into the future. In Deep Sea Mining Value Chain: Organization, Technology and Development; Abramowski, T., Ed.; IOM: Szczecin, Poland, 2016; pp. 105–118. [Google Scholar]
  33. Hein, J.R.; Koschinsky, A. Deep-ocean ferromanganese crusts and nodules. In The Treatise on Geochemistry; Scott, S., Ed.; Elsevier: Amsterdam, The Netherlands, 2013; Volume 12, pp. 273–290. [Google Scholar] [CrossRef]
  34. Zawadzki, D. The state of knowledge and possibilities to extract strategic raw materials from the ocean polymetallic deposits. Przegląd Geol. 2013, 61, 45–53, (In Polish with English Abstract). [Google Scholar]
  35. Kotliński, R.A.; Maciąg, Ł.; Zawadzki, D. Potential and Recent Problems of the Possible Polymetallic Sources in the Oceanic Deposits. Geol. Miner. Resour. World Ocean 2015, 40, 65–80. [Google Scholar]
  36. Petersen, S.; Krätschell, A.; Augustin, N.; Jamieson, J.; Hein, J.; Hannington, M.D. News from the seabed—Geological characteristics and resource potential of deepsea mineral resources. Mar. Policy 2016, 70, 175–187. [Google Scholar] [CrossRef]
  37. Morgan, C. Resource estimates of the clarion-clipperton manganese nodule deposits. In Handbook of Marine Mineral Deposits; Cronan, D., Ed.; CRC Press: London, UK, 2000; pp. 145–170. [Google Scholar]
  38. Kotliński, R.A.; Stoyanova, V. Control factors of polymetallic nodules distribution within the Eastern area of the Clarion-Clipperton Zone (CCZ). In Proceedings of the 2005 VI ISOPE Ocean Mining Symposium, Changsha, China, 9–13 October 2005; pp. 1–11. [Google Scholar]
  39. Zawadzki, D.; Maciąg, Ł.; Kotliński, R.A. Eupelagic sediments as a potential resource for rare earth elements. Biul. Państwowego Inst. Geol. 2015, 465, 131–142, (In Polish with English Abstract). [Google Scholar] [CrossRef]
  40. Maciąg, Ł.; Zawadzki, D. Spatial variability and resources estimation of selected critical metals and rare earth elements in surface sediments from the Clarion-Clipperton Fracture Zone, equatorial Pacific Ocean, Interoceanmetal claim area. In Proceedings of the IAMG 2019—20th Annual Conference of the International Association for Mathematical Geosciences, State College, PA, USA, 10–16 August 2019; pp. 174–178. [Google Scholar]
  41. Szamałek, K. The state of knowledge concerning on oceanic mineral resources. Przegląd Geol. 2018, 66, 189–194, (In Polish with English Abstract). [Google Scholar]
  42. Kotliński, R.A.; Piestrzyński, A.; Maciąg, Ł.; Zawadzki, D. Metallogenic potential of the oceans. In Aktualia i Perspektywy Gospodarki Surowcami Mineralnymi; Instytut Gospodarki Surowcami Mineralnymi i Energią PAN: Kraków, Poland, 2019; pp. 117–144, (In Polish with English Abstract). [Google Scholar]
  43. Kazmin, Y. Geology of the Clarion-Clipperton Zone: Existing geological information in respect of polymetallic nodules. In Estabilishment of a Geological Model of Polymetallic Nodule Deposits in the Clarion-Clipperton Fracture Zone of the Equatorial North Pacific Ocean; ISA: Kingston, Jamaica, 2009; pp. 106–144. [Google Scholar]
  44. Maciąg, Ł.; Harff, J. Application of multivariate geostatistics for local-scale lithological mapping—Case study of pelagic surface sediments from the Clarion–Clipperton Fracture Zone, north-eastern equatorial Pacific (Interoceanmetal claim area). Comput. Geosci. 2020, 104474. [Google Scholar] [CrossRef]
  45. ODP—Ocean Drilling Program. Leg 199 Preliminary Report, Shipboard Scientific Party. 2002. Available online: http://www-odp.tamu.edu/publications/prelim/199_prel/199PREL.PDF (accessed on 14 June 2020).
  46. Maciąg, Ł.; Kotliński, R.A.; Borówka, R.K. Lithological Variability of Siliceous Clayey Silts from IOM Area (Clarion–Clipperton Fracture Zone, East Pacific). Górnictwo i Geoinżynieria 2011, 4, 243–255, (In Polish with English Abstract). [Google Scholar]
  47. Schultze, D. Differentialthermoanalyse; VEB: Berlin, Germany, 1971; pp. 1–335, (In German with English Abstract). [Google Scholar]
  48. Thompson, M.; Owen, L.; Wilkinson, K.; Wood, R.; Damant, A. A comparison of the Kjeldahl and Dumas methods for the determination of protein in foods, using data from a proficiency testing scheme. Analyst 2002, 127, 1666–1668. [Google Scholar] [CrossRef]
  49. Szyduk, A.; Maciąg, Ł.; Skowronek, A.; Mianowicz, K.; Strzelecka, A. Numerical data extraction and evaluation of grain shape factor using laser diffraction method—Case study from Szczecin Lagoon, Northern Poland. In The International Multidisciplinary Scientific GeoConference Surveying Geology and Mining Ecology Management; SGEM: Albena, Bulgaria, 2019; Volume 19, pp. 385–390. [Google Scholar] [CrossRef]
  50. Folk, R.L.; Ward, W.C. Brazos River bar: A study in the significance of grain size parameters. J. Sediment. Petrol. 1957, 27, 3–26. [Google Scholar] [CrossRef]
  51. Blott, S.J.; Pye, K. GRADISTAT: A grain size distribution and statistics package for the analysis of unconsolidated sediments. Earth Surf. Process. Landf. 2001, 26, 1237–1248. [Google Scholar] [CrossRef]
  52. Donoghue, J.F. Phi scale. In Encyclopedia of Estuaries; Encyclopedia of Earth Sciences Series; Kennish, M.J., Ed.; Springer: Dordrecht, The Netherlands, 2016. [Google Scholar] [CrossRef]
  53. Sindern, S. Analysis of Rare Earth Elements in Rock and Mineral Samples by ICP-MS and LA-ICP-MS. Phys. Sci. Rev. 2017, 2, 1–14. [Google Scholar] [CrossRef]
  54. Eberl, D.D. User’s Guide to Rockjock—A Program For Determining Quantitative Mineralogy From Powder X-ray Diffraction Data; Open-File Report 03-78; U.S. Geological Survey: Boulder, CO, USA, 2003; pp. 1–48. [CrossRef] [Green Version]
  55. Muszyński, M. Skały krzemionkowe. In Przewodnik do Petrografii; Manecki, A., Muszyński, M., Eds.; Uczelniane Wydawnictwa Naukowo-Dydaktyczne AGH: Kraków, Poland, 2008; pp. 336–348. (In Polish) [Google Scholar]
  56. Togunwa, O.; Abdullah, W. Geochemical characterization of Neogene sediments from onshore West Baram Delta Province, Sarawak: Paleoenvironment, source input and thermal maturity. Open Geosci. 2017, 9, 302–313. [Google Scholar] [CrossRef] [Green Version]
  57. Cuadros, J.; Altaner, S. Compositional and structural features of the octahedral sheet in mixed-layer illite/smectite from bentonites. Eur. J. Miner. 1998, 10, 111–124. [Google Scholar] [CrossRef]
  58. Önal, M.; Sarıkaya, Y. Thermal behavior of a bentonite. J. Therm. Anal. Calorim. 2007, 90, 167–172. [Google Scholar] [CrossRef]
  59. Panna, W.; Wyszomirski, P.; Myszka, R. Characteristics of the clayey-siliceous rock from the Dylągówka–Zapady deposit (polish flysch Carpathians) as a mineral raw material. Gospod. Surowcami Miner. Miner. Resour. Manag. 2014, 30, 85–102. [Google Scholar] [CrossRef]
  60. Muller, F.; Drits, V.; Plançon, A.; Robert, J.-L. Structural Transformation of 2:1 Dioctahedral Layer Silicates during Dehydroxylation-Rehydroxylation Reactions. Clays Clay Miner. 2000, 48, 572–585. [Google Scholar] [CrossRef]
  61. Földvári, M. Handbook of thermogravimetric system of minerals and its use in geological practice. Occas. Pap. Geol. Inst. Hung. 2011, 213, 1–180. [Google Scholar]
  62. Húlan, T.; Trník, A.; Medveď, I. Kinetics of thermal expansion of illite-based ceramics in the dehydroxylation region during heating. J. Therm. Anal. Calorim. 2017, 127, 291–298. [Google Scholar] [CrossRef]
  63. Wyrwicki, R. Analiza Derywatograficzna Skał Ilastych; Wydawnictwo Uniwersytetu Warszawskiego: Warszawa, Poland, 1988; pp. 1–228. (In Polish) [Google Scholar]
  64. Earnest, C.M. Thermal analysis of selected illite and smectite clay minerals. Part II. Smectite clay minerals. In Thermal Analysis in the Geosciences; Smykatz-Kloss, W., Warne, S.S.J., Eds.; Lecture Notes in Earth Sciences; Springer: Berlin/Heidelberg, Germany, 1991; Volume 38, pp. 288–312. [Google Scholar] [CrossRef]
  65. Mendioroz, S.; Belzunce, M.J.; Pajares, J.A. Thermogravimetric study of diatomites. J. Therm. Anal. 1989, 35, 2097–2104. [Google Scholar] [CrossRef]
  66. Jones, J.B.; Segnit, E.R. The nature of opal I. nomenclature and constituent phases. J. Geol. Soc. Aust. 1971, 18, 57–68. [Google Scholar] [CrossRef]
  67. Kasten, S.; Haese, R.R.; Zabel, M.; Ruhlemann, C.; Schulz, H.D. Barium peaks at glacial terminations in sediments of the equatorial Atlantic Ocean—Relicts of deglacial productivity pulses? Chem. Geol. 2001, 175, 635–651. [Google Scholar] [CrossRef]
  68. Maciąg, Ł.; Zawadzki, D.; Kotliński, R.A.; Borówka, R.K.; Wróbel, R. Authigenic barite crystals from the eupelagic sediments of CCFZ (IOM H22 area, Clarion-Clipperton Fracture Zone, Pacific). In Joint 5th Central-European Mineralogical Conference and 7th Mineral Sciences in the Carpathians Conference. Book of Contributions and Abstracts; Ondrejka, M., Cempírek, J., Bačík, P., Eds.; Comenius University: Bratislava, Slovakia, 2018; pp. 122–124. [Google Scholar]
  69. Prewitt, C.T.; Sueno, S.; Papike, J.J. The crystal structures of high albite and monalbite at high temperatures. Am. Miner. 1976, 61, 1213–1225. [Google Scholar]
  70. Gualtieri, A.; Venturelli, P. In situ study of the goethite-hematite phase transformation by real time synchrotron powder diffraction. Am. Miner. 1999, 84, 895–904. [Google Scholar] [CrossRef]
  71. Kihara, K. An X-ray study of the temperature dependence of the quartz structure. Eur. J. Miner. 1990, 2, 63–77. [Google Scholar] [CrossRef]
  72. Dera, P.; Lazarz, J.D.; Prakapenka, V.B.; Barkley, M.; Downs, R.T. New insights into the high-pressure polymorphism of SiO2 cristobalite. Phys. Chem. Miner. 2011, 38. [Google Scholar] [CrossRef]
  73. Bolewski, A.; Wyderko-Delekta, M. Mineralogia Spieków i Grudek Rudnych; Wydawnictwo AGH: Kraków, Poland, 1995; pp. 1–275. (In Polish) [Google Scholar]
  74. Hillier, S.; Lumsdon, D. Distinguishing opaline silica from cristobalite in bentonites: A practical procedure and perspective based on NaOH dissolution. Clay Miner. 2008, 43, 477–486. [Google Scholar] [CrossRef]
  75. Hunt, J.M. Distribution of hydrocarbons in sedimentary rocks. Geochim. Cosmochim. Acta 1961, 22, 37–49. [Google Scholar] [CrossRef]
  76. Hatcher, P.G. The Organic Geochemistry of Mangrove Lake, Bermuda (NOAA Professional Paper); U.S. Dept. of Commerce, National Oceanic and Atmospheric Administration: Washington, DC, USA, 1978; pp. 1–92.
  77. Waples, D. Geochemistry in Petroleum Exploration Boston; IHRDC: Boston, MA, USA, 1985; pp. 1–232. [Google Scholar] [CrossRef]
  78. Haq, B.U.; Hardenbohl, J.; Vail, P.K. Mesozoic and Cenozoic chronostratigraphy and cycles of sea-level change. In Sea-Level Changes: An Integrated Approach; Wilgus, C.K., Hastings, B.S., Posamentier, H., Wagoner, J.V., Ross, C.A., Kendall, C.G.S.C., Eds.; SEPM Special Publication: Tulsa, OK, USA, 1988; Volume 42, pp. 71–108. [Google Scholar] [CrossRef]
  79. Peters, K.E.; Curry, D.J.; Kacewicz, M. An overview of basin and petroleum system modeling: Definitions and concepts. In Basin Modeling: New Horizons in Research and Applications; Peters, K.E., Curry, D.J., Kacewicz, M., Eds.; AAPG Hedberg Series; No. 4; American Association of Petroleum Geologists: Tulsa, OK, USA, 2012; pp. 1–16. [Google Scholar] [CrossRef]
  80. Tissot, B.P.; Pelet, R.; Ungerer, P. Thermal history of sedimentary basins, maturation indices, and kinetics of oil and gas generation. AAPG Bull. 1987, 71, 1445–1466. [Google Scholar] [CrossRef]
  81. Jarvie, D.M.; Claxton, B.L.; Henk, F.; Breyer, J.T. Oil and shale gas from the Barnett Shale, Fort Worth basin, Texas. AAPG National Convention, 3–6 June 2001, Denver, CO. AAPG Bull. 2001, 85 (Suppl. 13), A100. [Google Scholar]
  82. Dembicki, H. An interlaboratory comparison of source rock data. Geochim. Cosmochim. Acta 1984, 48, 2641–2649. [Google Scholar] [CrossRef]
  83. Jarvie, D.M. Factors affecting Rock-Eval derived kinetic parameters. Chem. Geol. 1991, 93, 79–99. [Google Scholar] [CrossRef]
  84. Anderson, O.R. Protozoa, radiolarians. In Encyclopedia of Ocean Sciences, 1st ed.; Steele, J.H., Ed.; Academic Press: Cambridge, MA, USA, 2001; Volume 4, pp. 613–617. [Google Scholar] [CrossRef]
  85. Yi, Z.; Xu, M.; Di, X.; Sigurdur, B.; Fu, W. Exploring Valuable Lipids in Diatoms. Front. Mar. Sci. 2017, 7. [Google Scholar] [CrossRef] [Green Version]
  86. Peters, K.E.; Walters, C.C.; Moldowan, M. The Biomarker Guide; Biomarkers and Isotopes in the Environment and Human History; Cambridge University Press: Cambridge, UK, 2005; Volume 1–2. [Google Scholar]
  87. Espitalié, J.; Madec, M.; Tissot, B. Role of mineral matrix in kerogen pyrolysis: Influence on petroleum generation and migration. Am. Assoc. Pet. Geol. Bull. 1980, 64, 59–66. [Google Scholar] [CrossRef]
  88. Horsfield, B.; Douglas, A.G. The influence of minerals on the pyrolysis of kerogens. Geochim. Cosmochim. Acta 1980, 44, 1110–1131. [Google Scholar] [CrossRef]
  89. Voorhees, K.J. Analytical Pyrolysis—Techniques and Applications; Butterworth-Heinemann: Southampton, UK, 1984; pp. 1–496. [Google Scholar] [CrossRef]
  90. Dembicki, H.; Horsfield, B.; Ho, T.Y. Source rock evaluation by pyrolysis-gas chromatography. AAPG Bull. 1983, 67, 1094–1103. [Google Scholar] [CrossRef]
  91. Dembicki, H. Three common source rock evaluation errors made by geologists during prospect or play appraisals. AAPG Bull. 2009, 93, 341–356. [Google Scholar] [CrossRef]
  92. Jacobson, S.R. Petroleum source rocks and organic facies. In Source and Migration Processes and Evaluation Techniques; Merill, E.K., Ed.; American Association of Petroleum Geologists: Tulsa, OK, USA, 1991; pp. 3–11. [Google Scholar] [CrossRef]
  93. Arora, A.; Banerjee, S.; Dutta, S. Black shale in late Jurassic Jhuran Formation of Kutch: Possible indicator of oceanic anoxic event? J. Geol. Soc. India 2015, 85, 265–278. [Google Scholar] [CrossRef]
Figure 1. Location of the sampling area within the Clarion−Clipperton Fracture Zone (CCFZ). Individual contractors are shown with different colours (map adapted from [31]). On the right, the geomorphological map of Interoceanmetal (IOM) H11 and H22 polymetallic nodules polygons [32]. Yellow crosses indicate sediment sampling stations 2262, 2269, and 3515-1. The general topography of the seafloor reveals meridian-like streaked patchy zonation. In the northern part, several NW–SE-oriented volcanic hills are distinctive in the seafloor morphology.
Minerals 10 00901 g001
Figure 2. The complex lithostratigraphic scheme of the eastern CCFZ [2,9]. Samples described in the study are classified in the top section of the Clipperton Formation (FCl).
Minerals 10 00901 g002
Figure 3. Representative scheme of sampling intervals (station 3515-1). The “B” stands for bioturbations (sediment photos by courtesy of IOM). The “layer” is called a “section”, as explained in the main text. Red and brown signature patterns indicate sediments analysed in this study.
Minerals 10 00901 g003
Figure 4. Schematic representation of differential thermal analysis (DTA) and differential thermogravimetry (DTG) parameters. Subscript numbers indicate thermal effects described in detail in Section 4.1.2.
Minerals 10 00901 g004
Figure 5. The pseudo-van Krevelen diagrams (af) based on R–E6 data: (a) the relations between auto- and allochthonous organic matter; the slight increase in the amount of allochthonous organic matter with the burial depth is shown by red arrows; (b) comparison between TOC contents and generated hydrocarbon potential (S2); the trend lines indicate a slight increase in generated hydrocarbon potential occurring with burial depth; (c) relations between TOC, S2, and HI, revealing type I kerogen (oil-prone), usually 600 mg HC/g TOC or above; (d) the fair generation potential indicated by TOC and GP; (e) the immaturity (or very good oil potential) of samples shown by TOC and HI data; slight decrease in potential was observed with burial depth and in relation to the consumption of organic matter; (f) the suboxic to dysoxic conditions of the sedimentary environment visible due to the comparison of TOC and TS data.
Minerals 10 00901 g005
Figure 6. The pseudo-van Krevelen and environmental diagrams of analysed samples: (a) HI versus OI showing rotational variability (black arrows) of kerogen type highly related to sediment burial depth; (b) Ni/Co and V/Cr as environmental indicators of oxic to suboxic conditions; (c) the V and Ni relations indicate a transition between oxic and oxic–dysoxic conditions; the oxic conditions are typical for “layer A” (active layer), being reduced rapidly with burial depth; (b) and (c) follow [56].
Minerals 10 00901 g006
Figure 7. Thermoanalytical curves of pelagic sediments from the CCFZ, IOM claim area. The last row represents smoothed DTG data: (a) the thermogravimetry (TG) curves showing sample weight change; (b) DTA curves indicating differences between temperatures of sample and reference material (Al2O3); (c) DTG curves showing rate of weight variations over time; (d) smoothed DTG curves (removed short-scale oscillations of weight).
Minerals 10 00901 g007
Figure 8. The XRD diffraction patterns of heated samples from the CCFZ, IOM claim area (ac): Q—quartz and crystobalite, Al—albite, H—protohematite and hematite, Sp—spinels, Mel—melilite, Bix—bixbyite, Per—periclase. Increase in crystallinity (=background decrease) observed with burial depth.
Minerals 10 00901 g008
Figure 9. Representative lithogeochemical profiles of IOM stations 2262 (a), 2269 (b), and 3515-1 (c). Abbreviations of R–E6, thermal analysis (TA) parameters, and calculated indices are the same as in the main text (see Table 2, Table 3 and Table 4 and Table 6). Parameters of non-analysed sections were estimated and interpolated as an arithmetic mean.
Minerals 10 00901 g009
Table 1. General description of analysed samples (n = 12).
Station ID (Box Corer Sampling Depth)Sediment Depth (cm)Description
Station 2262 (4529 m bsl)
10–3Active “layer A”: highly liquid, brownish, containing small amounts of nodules (3.9 kg/m2), siliceous clayey silt.
210–15Intermediate upper “layer B”: semiliquid, more compacted than “layer A”, light brown-yellowish, siliceous clayey silt with patchy texture, without nodules but with several bioturbations.
321–26Intermediate bottom “layer C”: more compacted, brown-yellowish, siliceous clayey silt, without nodules, less bioturbation.
435–40Bottom “layer D”: more compacted, brown-yellowish, siliceous clayey silt, less bioturbation, without nodules.
Station 2269 (4313 m bsl)
50–12Active “layer A”: highly liquid, brownish, containing small amounts of nodules (4.0 kg/m2), siliceous clayey silt.
612–25Intermediate “layer B”: semiliquid, more compacted than “layer A”, light brown-yellowish, siliceous clayey silt with patchy texture, without nodules but with several bioturbations.
730–40Bottom “layer D”: more compacted, brown-yellowish, siliceous silty clay without bioturbations, containing several micronodules.
Station 3515-1 (4342 m bsl)
80–5Active “layer A”: highly liquid, brownish, containing large amounts of nodules (18.3 kg/m2), siliceous clayey silt.
910–15Intermediate upper “layer B”: semiliquid, more compacted than “layer A”, light brown-yellowish, patchy texture, without nodules, several bioturbations.
1025–30Intermediate middle “layer C”: more compacted, light brown-yellowish, patchy texture with several bioturbations, without nodules.
1130–40Intermediate bottom “layer D”: more compacted, brown-yellowish and patchy, less bioturbation, without nodules.
1240–44Bottom “layer E”: highly compacted, brownish, siliceous clayey silt with almost no bioturbation, nodules, or micronodules.
Table 2. The measured parameters and calculated indices of Rock−Eval 6 (R–E6).
Parameters and IndicesUnitDescriptionMeasuredCalculated
TCwt.%Total carbon. v
TOCwt.%Total organic carbon. v
MinCwt.%Mineral carbon. v
Tmax°CThe maximal temperature of hydrocarbon generation.v
S1mg HC/gFree hydrocarbons.v
S2mg HC/gHydrocarbons generated during pyrolysis.v
S3mg CO2/gCO2 from organic matter.v
GPmg HC/gHydrocarbon generation potential. v
PI-Productivity index.v
HImg HC/g TOCHydrogen index.v
OImg CO2/g TOCOxygen index.v
RCwt.%Total residual carbon. v
PCwt.%Pyrolytic carbon. v
Table 3. Selected measured parameters and calculated indices of R–E6 (n = 12).
No.Depth
(cm)
TC
(wt.%)
TOC
(wt.%)
MinC
(wt.%)
RC
(wt.%)
PC
(wt.%)
Tmax
(°C)
S1
(mg HC/g)
S2
(mg HC/g)
S3
(mg CO2/g)
S2/S3
(-)
GP
(mg HC/g)
PI
(-)
HI
(mg HC/g TOC)
OI
(mg CO2/g TOC)
Station 2262
10–30.820.650.170.240.416040.414.541.822.494.950.08698280
210–150.740.620.120.140.486030.535.300.856.245.830.09855137
321–260.880.720.160.130.596030.656.421.584.067.070.09892219
435–400.800.720.080.110.616050.636.760.897.607.390.08939124
Station 2269
50–120.920.730.190.150.586050.396.632.322.867.020.06908318
612–250.770.650.120.120.536040.386.031.773.416.410.06928272
730–400.580.510.070.080.436040.434.811.313.675.240.08943257
Station 3515-1
80–51.070.840.230.180.666040.497.462.303.247.950.06888274
910–150.910.720.190.170.556040.676.011.673.606.680.10835232
1025–300.850.680.170.160.526030.765.481.214.536.240.12806178
1130–400.720.620.100.130.496020.525.412.562.115.930.09873413
1240–440.580.520.060.060.466010.554.992.052.435.540.10960394
Table 4. Thermokinetics data of samples from the IOM claim area (n = 12).
No.Depth
(cm)
ΔTGT
(%)
ΔHTot.
(J/g)
DTAI Tmax (°C)ΔDTAI
(°C)
ΔDTGI
(%/min.)
ΔHI
(J/g)
DTAII Tmax
(°C)
ΔDTAII
(°C)
ΔDTGII
(%/min.)
ΔHII
(J/g)
DTAIII Tmax
(°C)
ΔDTAIII
(°C)
ΔDTGIII
(%/min.)
ΔHIII
(J/g)
DTAIV Tmax
(°C)
ΔDTAIV
(°C)
ΔDTGIV
(%/min.)
ΔHIV
(J/g)
Station 2262
10–318.181050.98156−4.86−0.96437.773532.23−0.07−303.93638−3.83−0.04958.779601.09−0.17−59.66
210–1516.70645.58149−2.63−0.84201.883002.940.05−582.75661−3.62−0.091137.579680.37−0.10−18.75
321–2617.552333.13174−9.41−0.73916.00469−0.68−0.01-691−3.72−0.08840.489680.56−0.20−23.64
435–4015.622449.43174−9.53−0.45877.49461−1.20−0.11-642−3.68−0.13708.389540.59−0.02−21.91
Station 2269
50–1218.78772.98159−6.59−1.06453.373492.14−0.17−257.56614−3.46−0.16667.729601.59−0.11−84.16
612–2517.69975.01158−7.27−1.12575.803551.38−0.11−121.99612−3.45−0.13772.579451.20−0.10−71.30
730–4017.101440.40177−16.50−1.141080.21472−0.81−0.11-549−3.46−0.15374.718183.32−0.07−136.52
Station 3515-1
80–517.10422.53154−2.76−0.89206.393493.27−0.09−560.36633−3.31−0.20872.489500.93−0.11−69.97
910–1516.861242.59158−6.56−0.81834.533610.41−0.12−12.01619−2.760.00594.909460.97−0.22−85.98
1025–3015.501692.26178−8.66−0.791428.15469−0.08−0.02-612−1.70−0.17193.149530.80−0.14−33.44
1130–4014.65560.49174−8.44−0.68777.054651.15−0.13−29.97543−0.94−0.1758.158321.46−0.10−183.65
1240–4416.42876.95183−13.48−0.821318.034750.59−0.10−20.78543−0.69−0.1737.588973.35−0.13−467.63
Table 5. The grain size data of analysed sediments (n = 12).
No.Depth
(cm)
Textural NameMean Grain Size
(φ)
Sorting
(φ)
Skewness
(-)
Kurtosis
(-)
Dist. ShapeSand
(%)
Silt
(%)
Clay
(%)
Station 2262
10–3Fine silt6.781.68−0.240.93Mesokurtic7.467.125.5
210–15Fine silt6.391.77−0.050.76Platykurtic9.468.921.7
321–26Fine silt6.521.65−0.130.83Platykurtic7.272.320.4
435–40Fine silt6.971.41−0.151.04Mesokurtic4.372.323.4
Station 2269
50–12Fine silt6.861.50−0.181.07Mesokurtic5.972.221.9
612–25Fine silt7.101.22−0.050.91Mesokurtic1.074.524.5
730–40Fine silt7.731.21−0.141.11Mesokurtic1.655.243.2
Station 3515-1
80–5Fine silt6.411.75−0.190.82Platykurtic6.871.022.2
910–15Fine silt5.921.820.120.72Platykurtic7.373.419.2
1025–30Medium silt5.761.770.220.79Platykurtic6.176.817.1
1130–40Medium silt7.261.30−0.191.09Mesokurtic6.775.118.2
1240–44Medium silt7.991.35−0.011.23Leptokurtic6.176.817.1
Mean6.811.54−0.080.94-5.871.322.9
Std. dev.0.640.220.130.16-2.35.66.7
Table 6. Geochemistry of pelagic sediments from the CCFZ, IOM claim area (n = 12).
No.Depth
(cm)
Fe
(%)
Mn
(%)
Cu
(ppm)
Ni
(ppm)
Co
(ppm)
Zn
(ppm)
Pb
(ppm)
V
(ppm)
Cr
(ppm)
TP
(%)
TN
(%)
TS
(%)
Fe/Mn
-
Cu/Zn
-
V/Cr
-
Ni/Co
-
TOC/TS
-
TOC/TN
-
TOC*
-
MethodAASAASAASAASICP-MSAASAASXRFAASFIANSNSxxxxxxx
Station 2262
10–33.440.40371.2174.448.4115.215.210039.90.630.120.388.573.222.503.611.725.590.93
210–153.220.08238.664.752.693.111.39039.00.420.110.4040.342.562.311.231.565.400.92
321–263.650.03258.954.854.9101.613.611038.60.550.110.33107.702.552.851.002.156.630.97
435–404.120.12330.175.661.3111.923.512038.80.650.090.4633.792.953.091.231.568.011.07
Station 2269
50–123.790.39413.3172.547.0121.220.610039.00.950.110.609.763.412.573.671.216.621.18
612–254.350.15551.997.254.5136.923.212037.21.070.080.5129.954.033.231.781.288.391.03
730–404.701.221107.9396.269.8170.825.213037.81.280.050.463.846.493.445.681.109.590.86
Station 3515–1
80–53.780.43372.9162.554.0122.120.811039.90.760.120.488.703.052.763.011.746.761.20
910–153.400.18291.487.042.0113.118.510039.40.600.100.4018.992.582.542.071.817.171.02
1025–303.540.09285.261.016.4107.619.311040.30.670.080.4538.282.652.733.731.508.311.02
1130–403.470.14288.374.026.9110.318.912039.80.630.090.4325.562.613.012.751.466.810.94
1240–443.540.09285.261.0649.1107.619.321040.30.670.080.4538.282.655.210.091.156.360.86
Mean3.750.28399.6123.498.1117.619.111839.20.740.100.4530.313.233.022.491.527.141.00
Std. dev.0.420.31228.692.9166.719.23.9300.90.230.020.0726.521.070.731.480.301.170.11
Table 7. Bulk X-ray diffraction (XRD) data of the analysed pelagic sediments from the CCFZ, IOM claim area (n = 12). The “+” signs indicate contents <2%.
No.Depth
(cm)
Quartz
(%)
Plagioclase
(%)
Halite
(%)
Barite
(%)
Am. SiO2
(%)
Pyroxene
(%)
Illite
(%)
Chlorite
(%)
Smectite
(%)
Kaolinite
(%)
∑Clays
(%)
Station 2262
10–36.66.05.61.551.4+14.82.110.8+28.4
210–156.15.45.11.258.4+14.71.66.6+23.6
321–266.86.25.11.254.1+14.01.69.6+25.8
435–407.38.34.31.841.6+14.52.119.2+36.0
Station 2269
50–127.57.64.91.743.5+14.52.516.1+34.0
612–257.98.24.31.741.1+16.22.417.1+36.4
730–404.410.13.33.331.8+14.61.029.4-44.9
Station 3515–1
80–56.36.85.81.350.1+12.51.514.8+29.3
910–156.16.85.51.354.2+10.32.013.0+25.9
1025–306.36.15.61.155.9+13.12.28.8+24.9
1130–407.59.34.82.031.2+21.02.021.3+44.3
1240–445.39.03.43.329.6+17.43.026.9-47.3
Mean6.57.54.81.845.2-14.82.016.10.533.4
Std. dev.0.91.40.80.79.9-2.50.56.80.38.1
Table 8. The XRD data of heated samples (1000 °C) of pelagic sediments from the CCFZ, IOM claim area (n = 12). The amount of synthetic phases was calculated using the Rietveld method. The “+” signs indicate contents <5%.
No.Depth
(cm)
Feldspar
(Albite)
Hematite
(Protohematite)
SpinelsMeliliteQuartz
(Crystobalite)
Other
Station 2262
10–353.57.35.1+34.0-
210–1526.248.35.0+20.4-
321–2647.237.0++15.6-
435–4045.035.4++19.4-
Station 2269
50–1263.615.5++15.6-
612–2550.212.215.6+19.9-
730–4044.110.716.0+17.4-
Station 3515–1
80–561.519.5++16.5-
910–1541.216.95.35.131.5-
1025–3036.315.114.95.238.0Periclase
1130–4068.712.5++14.9Bixbyite
1240–4447.18.620.3+20.9Bixbyite
Mean48.719.97.3+22.0-
Std. dev.11.412.57.1+7.6-