Article

Synchysite-(Ce) from Cinquevalli (Trento, Italy): Stacking Disorder and the Polytypism of (Ca,REE)-Fluorcarbonates

by
Giancarlo Capitani
Department of Earth and Environmental Sciences, University of Milano-Bicocca, Piazza della Scienza 4, 20126 Milan, Italy
Minerals 2020, 10(1), 77; https://doi.org/10.3390/min10010077
Submission received: 10 December 2019 / Revised: 8 January 2020 / Accepted: 15 January 2020 / Published: 18 January 2020

Abstract

:
Synchysite-(Ce) at Cinquevalli occurs as fine needles intergrown with quartz in quartz-dikes and in association with altered K-feldspar and oxidized chalcopyrite as major constituents. Synchysite-(Ce) [Ca1.00(Ce0.43La0.26Nd0.17Y0.07Pr0.04Sm0.02Gd0.01)Σ=1.00(CO3)2(F0.58(OH)0.42)], shows an overgrowth rim of bastnäsite-(Ce) [(Ce0.34La0.25Nd0.17Pb0.07C a0.06Y0.06Pr0.04S m0.02Gd0.01)Σ=1.00C O3(F0.75(OH)0.25)]. Unit cell refinement of synchysite (C2/c) and bastnäsite (P62c) led to a = 12.272(4), b = 7.100(2), c = 18.640(5) Å, β = 102.71(5)°, and a = 7.085(1), c = 9.746(2) Å, respectively. Polysomatic faults are sporadic, but polytypic disorder is widespread. High resolution transmission electron microscopy images taken along [100] or ⟨130⟩ show an apparent order and the related diffraction patterns are streak-free. Conversely, along [010] or ⟨110⟩, a high density of stacking faults is observed and the related diffraction patterns show hhl rows with h ≠ 3n affected by streaks. No ordered domain larger than a few unit cells was detected. The stacking sequence of (Ca,REE)-fluorcarbonates can be compared with subfamily-B mica polytypes (2M2, 2O and 6H), which are characterized by n·60° (n = odd) rotations. Subfamily-A polytypes (1M, 2M1 and 3T), characterized by n·60° (n = even) rotations, should not be possible. Synchysite, characterized by ±60° rotations, can be likened to the 2M2 polytype.

1. Introduction

Synchysite [CaREE(CO3)2F] represents the Ca-rich end member of the (Ca,REE)-fluorcarbonates’ polysomatic series. The REE-rich end member is bastnäsite [REE(CO3)F]. Both are important ore minerals for rare earth elements (REEs). The chemical formula of individual, intermediate polysomes can be expressed as [REE(CO3)F]m[CaREE(CO3)2F]n, where m and n refer to the number of bastnäsite (B) and synchisite (S) basic units of the BmSn series. Notable intermediate members of the series are parisite (BS) and röntgenite (BS2). A number of additional polysomes/polytypes have been observed with transmission electron microscopy (TEM) by several authors [1,2,3,4,5,6,7]. Cerium is commonly the dominant REE, but fluorcarbonates of the bastnäsite-synchysite series with dominant La or Y or Nd have been recorded [8,9,10,11,12]. Other REEs normally present as minor constituents are Gd, Pr, and Sm. Bastnäsites with a partial or complete substitution of hydroxyl for fluorine have also been described [13,14].
The (Ca,REE)-fluorcarbonates have a layered topology with planar carbonate groups “standing-on-edge” with respect to the overall structural layering [15]. The most striking consequence of this structural layering is the formation of syntaxial intergrowths and, therefore, ordered and disordered domains with polysomatic and polytypic connections [7,16,17,18].
Diverse layer definitions in terms of composition, thickness, position (within the sequence), and symmetry have been employed so far, making the situation quite confusing (for a summary of all these diverse notations, their correspondence, pros and cons, see Reference [7]). Throughout this paper, the VB notation code (V = vaterite; B = bastnäsite) will be employed, since it is congenial for the interpretation of high resolution transmission electron microscopy (HRTEM) images. Briefly, B in BS notation remains B in VB notation and S in BS notation becomes VB in VB notation; V alone has no equivalent in BS notation. For example, the sequence BS (parisite) becomes VBB (Figure 1). Moreover, whenever required, a comparison with the former defg code, where: d = CeF-layer; e = CO3-layer between CeF-layers (not present in synchysite); f = Ca-layer; and g = CO3-layer between a CeF- and a Ca-layer [16] (Figure 1), is provided.
In this study, we undertook a HRTEM study of synchysite-(Ce) from Cinquevalli (Trento, Italy) that have been never studied before, with the aim to contribute to the assessment of the BmSn polysomatic series. Structural defects are thoroughly characterized, a widespread polytypic disorder detected, and a comparison with the polytypism of mica is provided.

2. Materials and Methods

The studied (Ca,REE)-fluorcarbonates are hosted in quartziferous veins extracted from the gangue material of the Cinquevalli Mine, sited near Roncegno, Trento, Italy (Figure 2). The mining area is located on the southern slope of the Mount Fravort, along the valley carved by the Argenta stream, at altitude around 1500 m. The ore body is represented by quartziferous dikes and veins, from a few centimeters to tens of meters in thickness (not reported in the map either because too small or cropping out only in mine tunnels), cross cutting Paleozoic phyllites and micaschists of the crystalline basement and the Roncegno granodiorite-monzogranite pluton. The beginning of the mining activity dates back to the 12th century, as documented by the finding of mining inlets, melting furnaces, and abundant melting slags. In the Middle Ages, silver and especially copper were mined at Cinquevalli. In the last century, until the end of the activity that took place in 1940, the area was exploited for sphalerite, galena, and copper. In the last years of activity and for a short period, fluorite was extracted [21]. Fluorcarbonates are scarce and dispersed and, therefore, have never represented an exploitable ore.
Representative hand specimens were sliced with a diamond wheel saw and prepared as polished thin sections suitable for both optical and scanning electron microscopy (SEM) observations. Representative aliquots of the samples were powdered and used for energy dispersive X-ray fluorescence (EDXRF) and X-ray powder diffraction (XRPD) bulk analyses. For the TEM sample preparation, the green parts recognized on the hand specimen were scratched with a needle and left to settle directly in an agate mortar, where the grain size was reduced with a pestle. The resulting powder was ultrasonicated in isopropanol and a few microliters of solution were pipetted in holey-carbon Cu-grids.
XRPD analyses were performed with a PANanalytical X’Pert-Pro PW3060 diffractometer, operating in Bragg-Brentano specular (θ-θ) geometry and equipped with a X’Celerator position sensitive detector. Diffractometer scans were recorded in the 3–70° 2θ range with step size of 0.02° and 30 s counting time, at 40 mA and 40 kV (CuKα radiation). A Ni filter along the diffracted beam path was used to filter out the CuKβ radiation. The sample holder was allowed to spin horizontally during measurements to improve particle statistics.
The identification of major and minor phases was done with the X’Pert High Score software (PANanalytical) using the ICSD PDF2-2004 database. Quantitative phase analyses (QPA) were performed with the Rietveld method [23,24] as implemented in the GSAS/EXPEGUI program [25].
Semi-quantitative bulk chemical analyses were obtained with a Pananalytical Epsilon 3X EDXRF instrument using a standardless method. Volatile components (H2O and CO2) were determined through the weight loss on ignition (LOI).
SEM investigations were performed with a Tescan VEGA TS 5136XM instrument operating at 20 keV and equipped with an EDAX GENESIS 4000XMS energy dispersive system (EDS), and with a Zeiss Gemini 500 field emission gun (FEG) instrument, equipped with a Bruker XFlash® EDS detector. The standardless method and the ZAF correction method were used for semi-quantitative analyses.
TEM observations were performed at the Department of Physical Sciences, Earth and Environment of the University of Siena with a Jeol JEM 2010 instrument operating at 200 keV and equipped with an Oxford Link EDS and an Olympus Tengra 2.3k × 2.3k × 14-bit slow-scan CCD camera. To remove noise contrast due to amorphous materials, HRTEM images were rotationally filtered [26] with the HRTEM filter [27], as implemented in the Gatan Digital Micrograph version 3.9. High resolution image simulations were performed with JEMS© [28]. Finally, semi-quantitative EDS analyses were obtained with the standardless method using the Cliff & Lorimer approximation [29].

3. Results

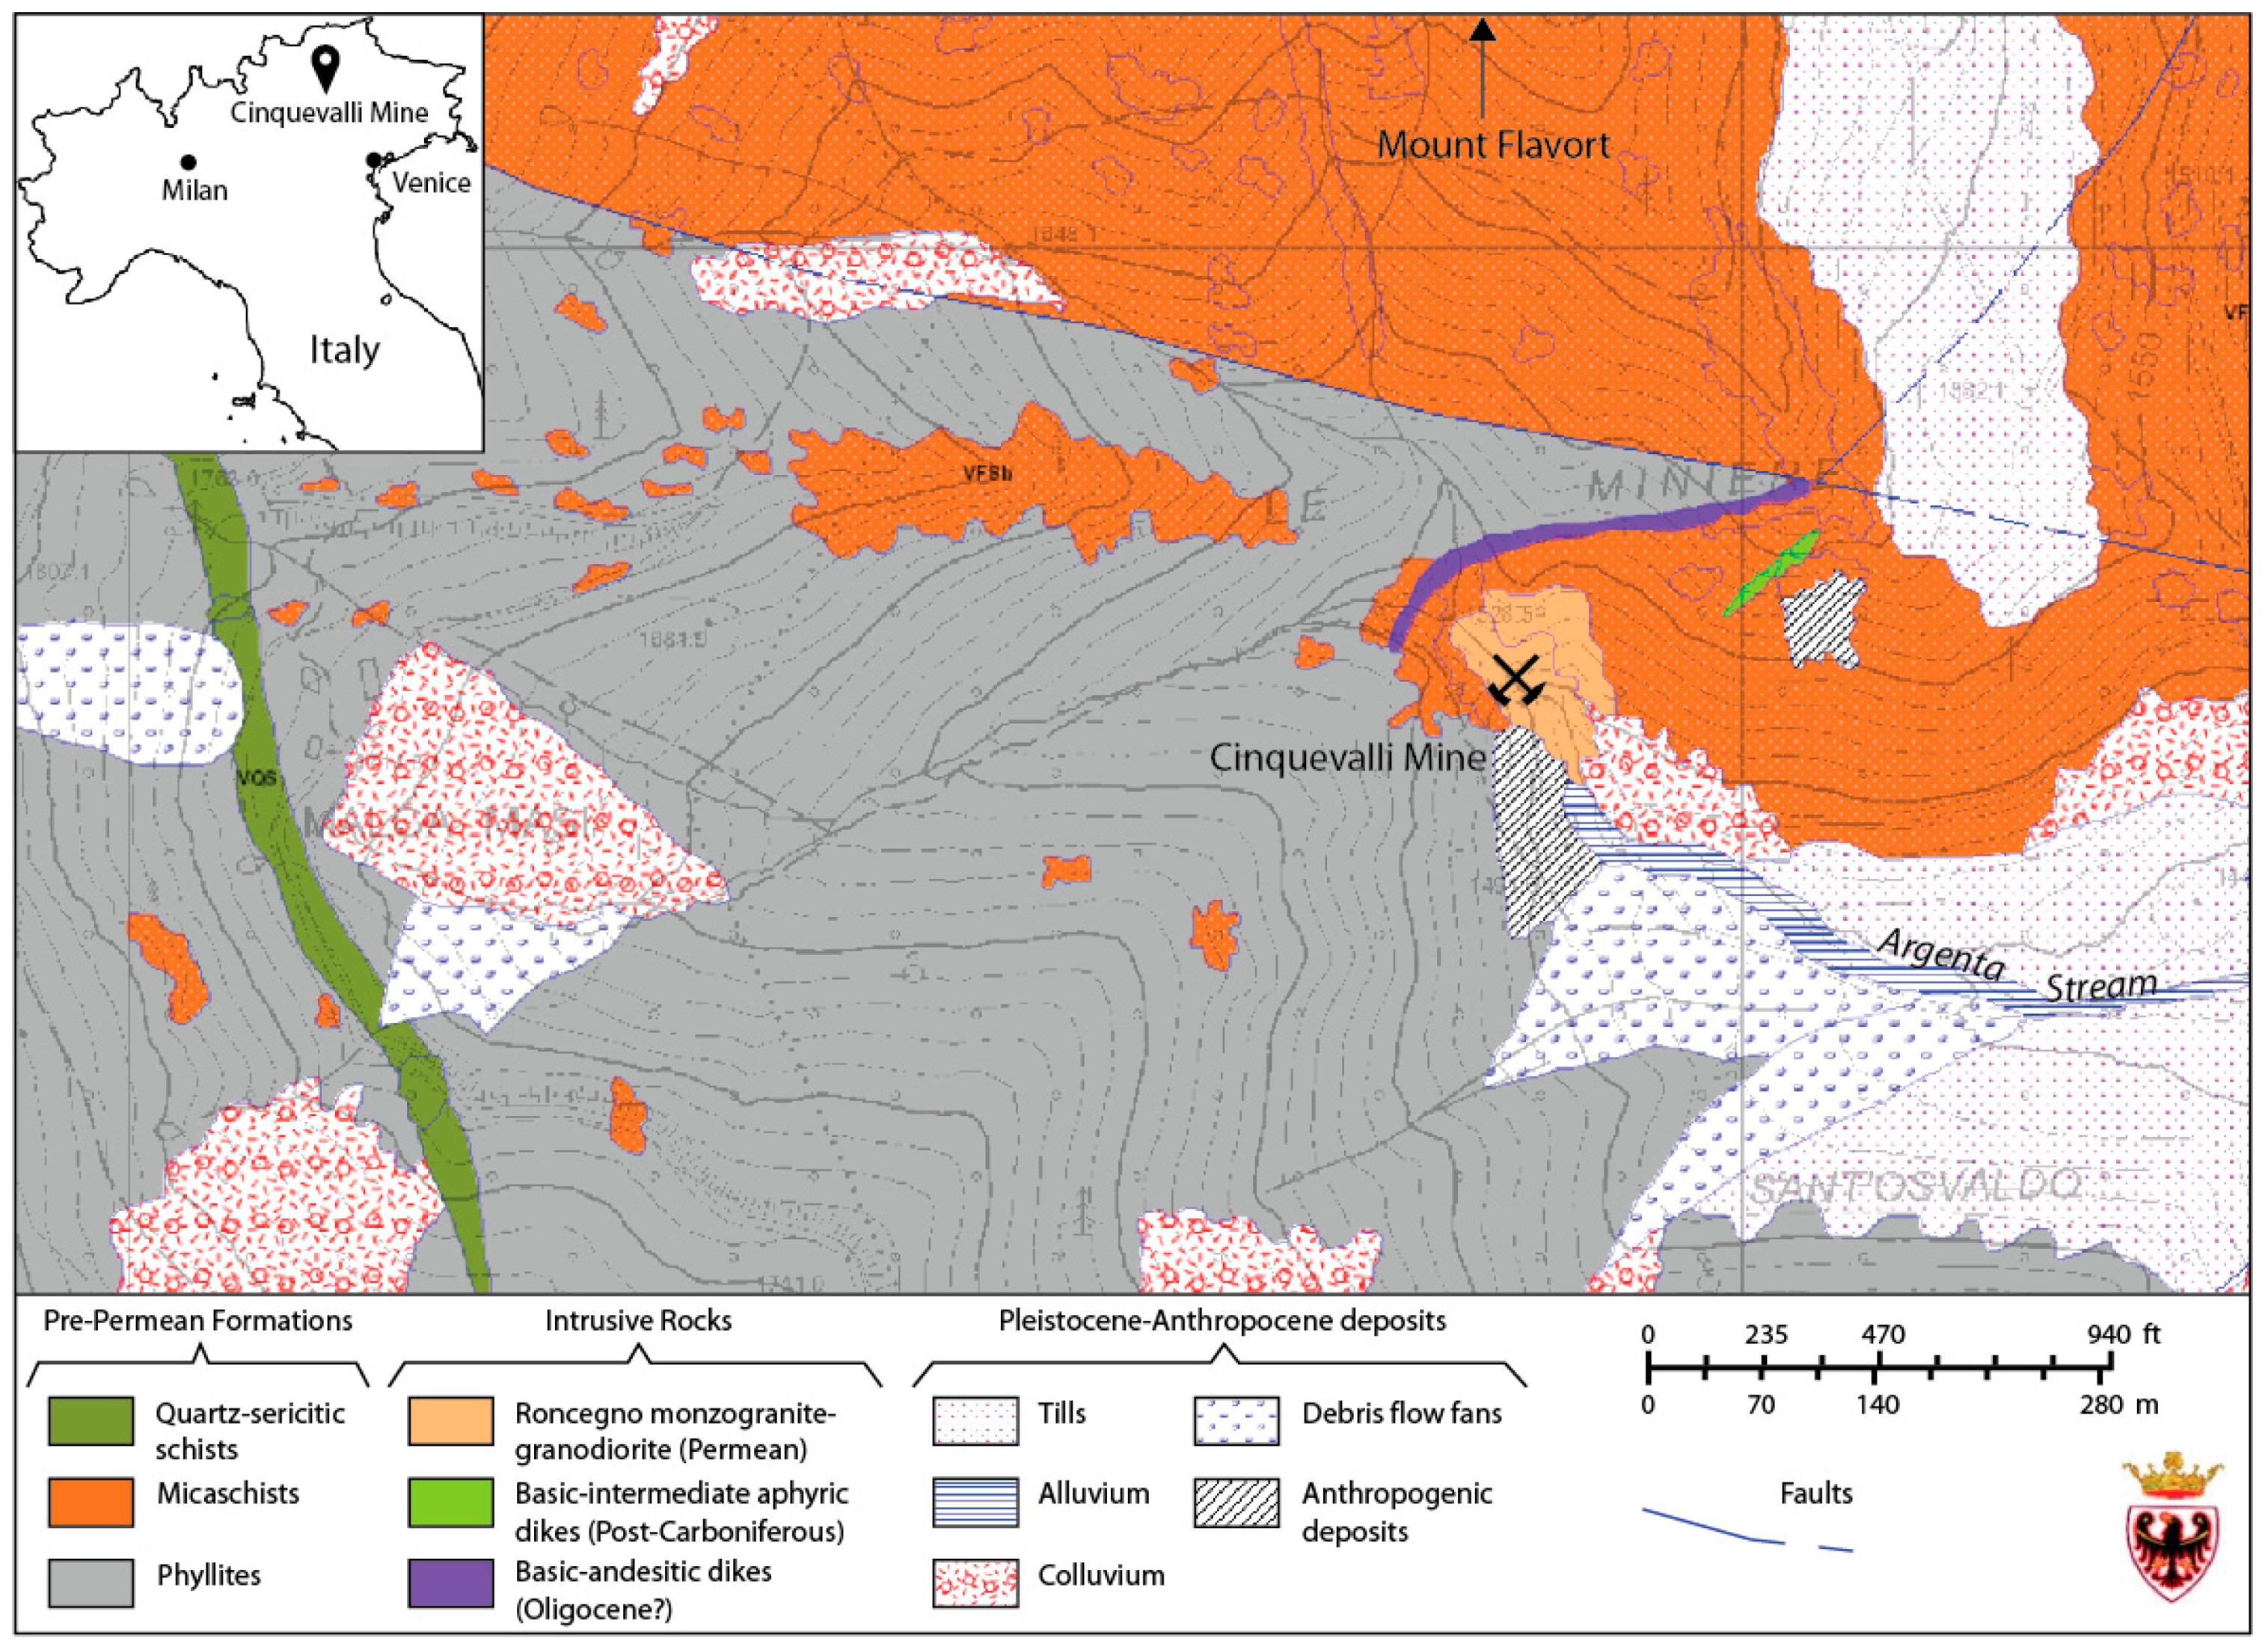
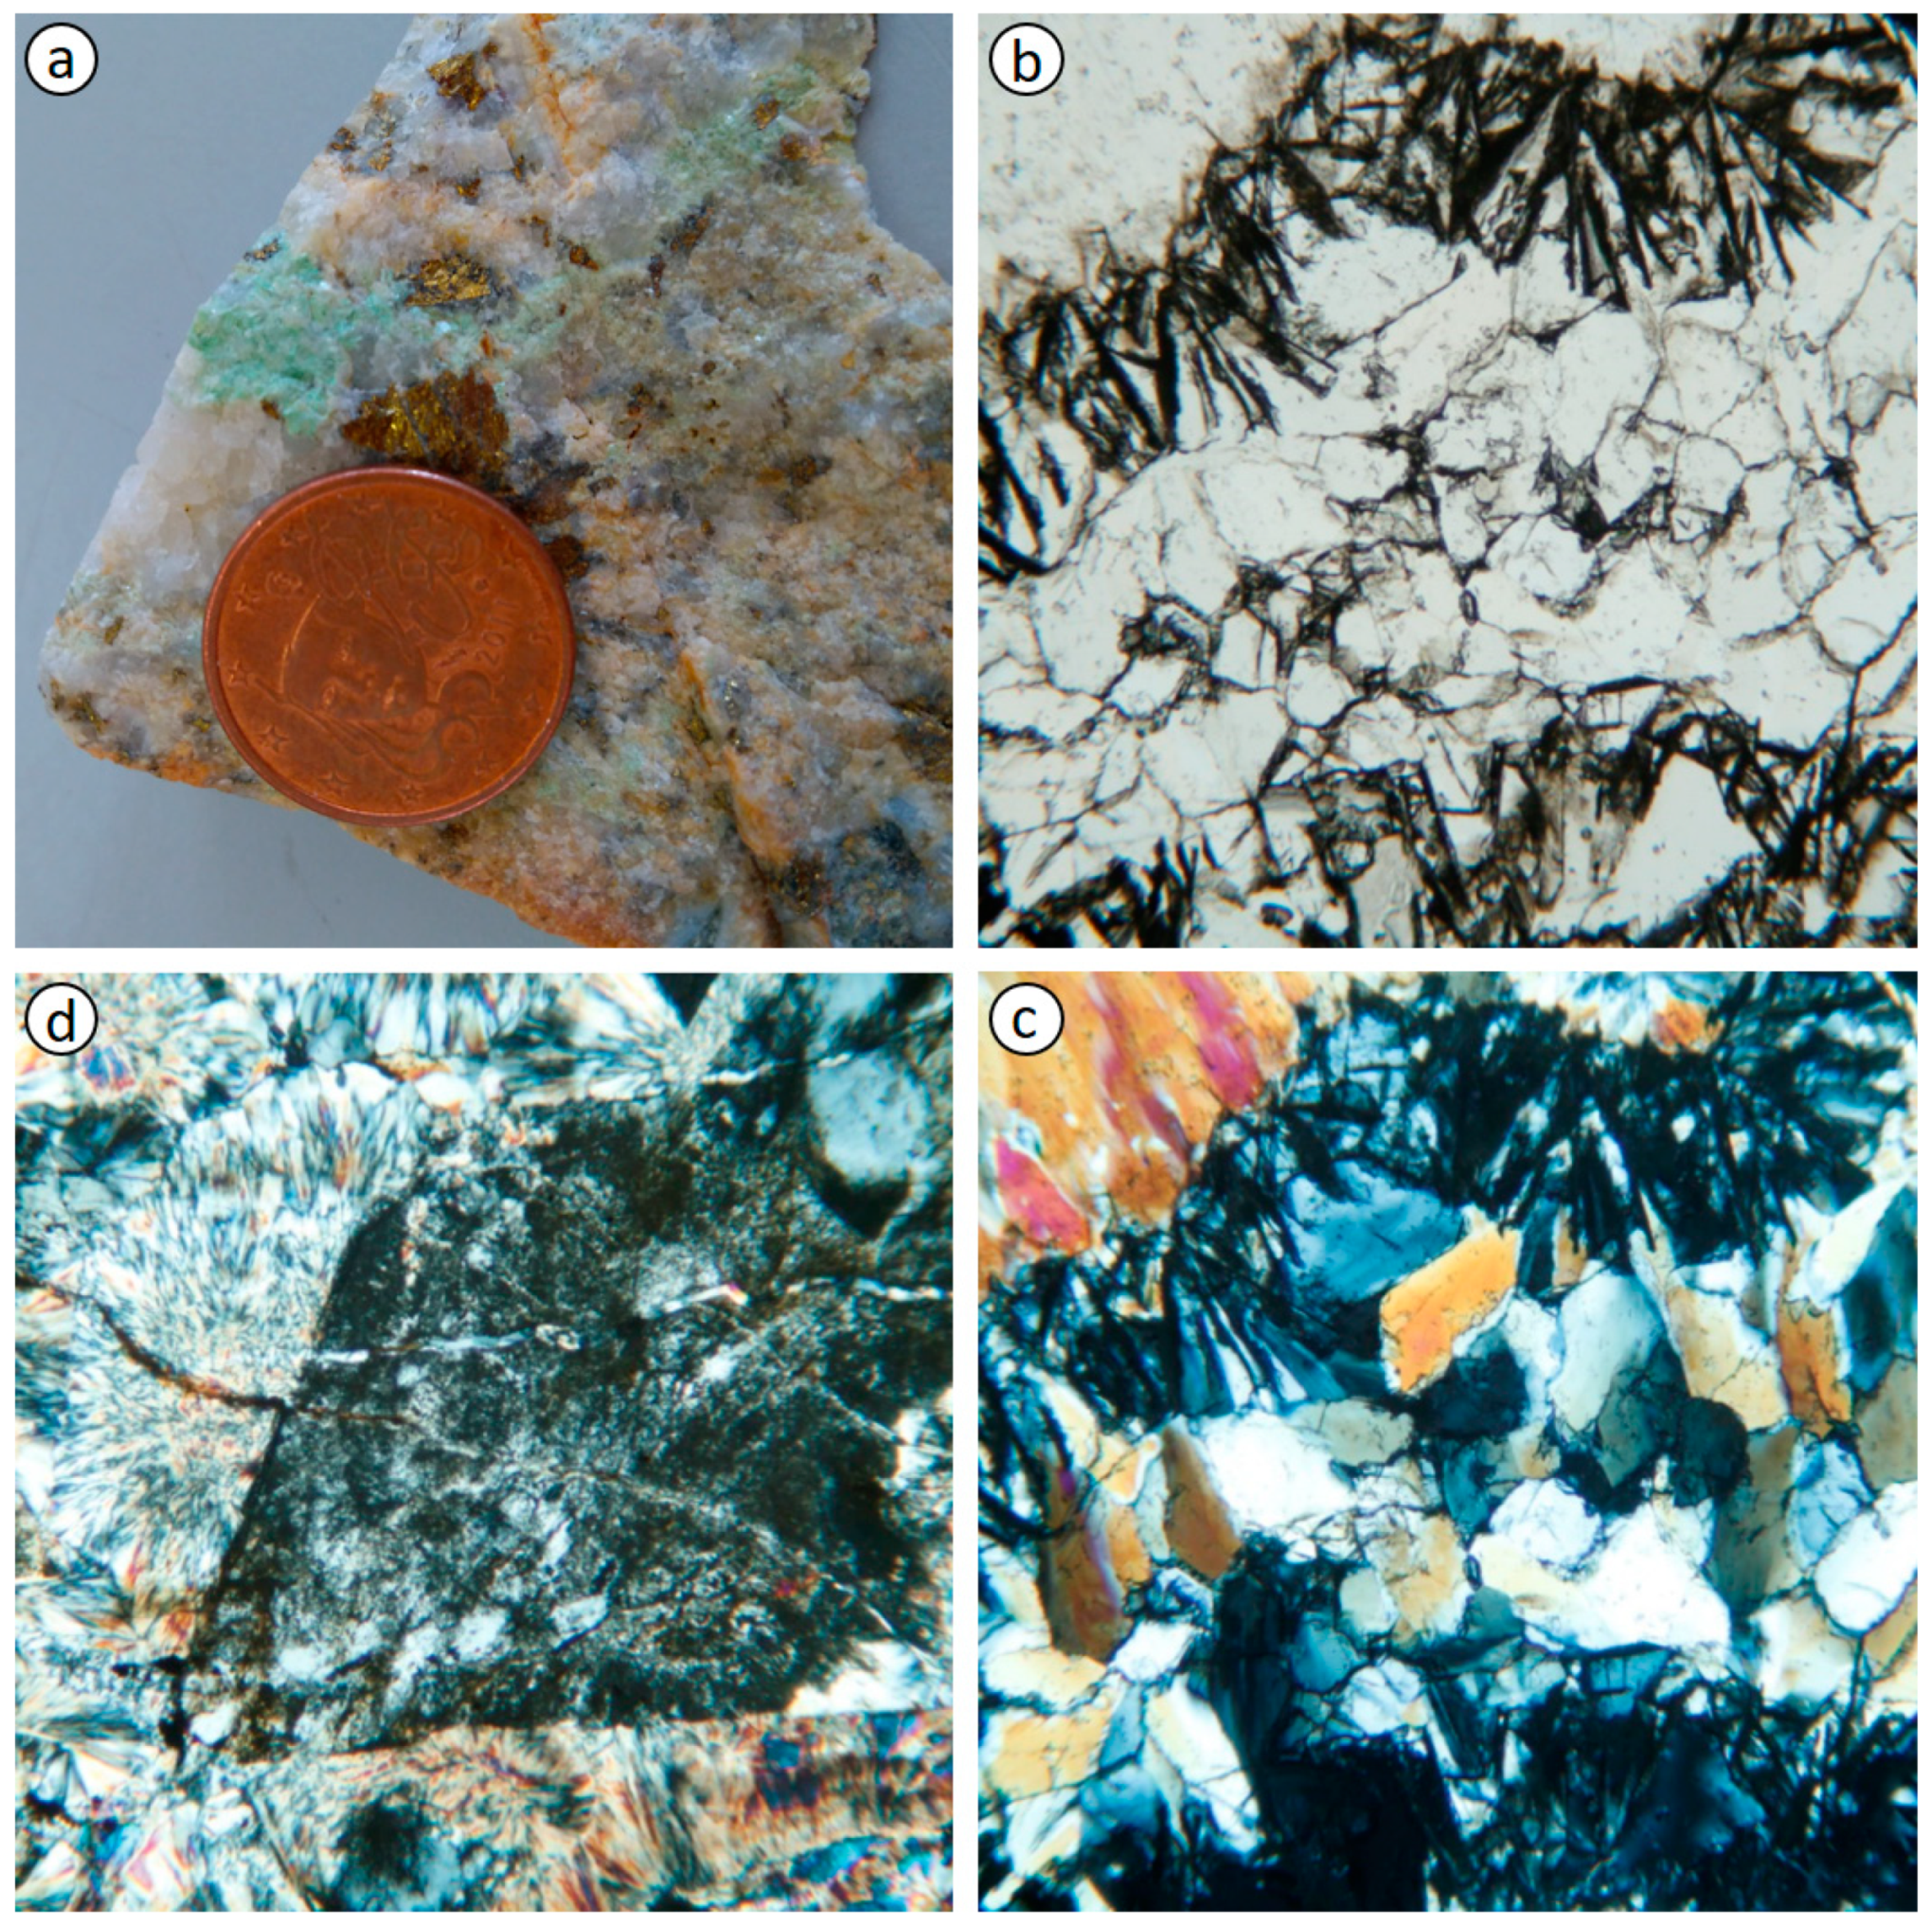
3.1. Rock Mineral Assemblage and Composition

At the hand-specimen scale, the fluorcarbonate-bearing rocks show a granitic texture made of quartz, K-feldspar, and chalcopyrite as major constituents. The fluorcarbonates are recognizable because of their pale green color (Figure 3a) and form fine needles or lamellae intergrown with quartz. Chalcopyrite appears oxidized and reddish oxides decorate rock joints.
In thin section, under polarized light, the fluorcarbonates appear as opaque needles intergrown with granular quartz. The needle morphology may also result from cross sectioning thin lamellae of fluorcarbonates at high angle to the thin section plane (Figure 3b,c). Coarse, euhedral K-feldspar is sometimes altered to white mica (Figure 3d). In addition to granular quartz, fibrous quartz recalling chalcedony is present, in the latter case not intergrown with fluorcarbonates (Figure 3d). Therefore, two generations of quartz seem present. In the thin section, chalcopyrite shows a reddish rim, suggesting later alteration in hematite/goethite.
XRPD Rietveld refinement of a representative aliquot of the sample (Rp = 8.18%; Rwp = 11.22%; X2 = 6.703) gave the following composition (wt%): quartz 79.4(1)%, muscovite 9.5(4)%, K-feldspar 6.9(3)%, chalcopyrite 1.4(1)%, bastnäsite 1.5(1)% and synchysite 1.2(1)%. These results are in keeping with the optical observations, although muscovite, possibly as an alteration of K-feldspar, is probably overestimated because of (001) preferential orientation. Unit cell refinement of bastnäsite (P62c) and synchysite (C2/c) gave the following results: a = 7.085(1), c = 9.746(2) Å, and a = 12.272(4), b = 7.100(2), c = 18.640(5) Å, β = 102.71(5)°, respectively, which are consistent with literature data, although should be taken with caution because of their low concentration.
EDXRF data of a representative aliquot of the studied samples are close to a typical granitic aplite composition, except the Al2O3 content reduced by half, absence of NaO and higher abundance of exotic components, such as REE-oxides (Table 1). The low Al2O3 content and the absence of NaO determines the strong prevalence of quartz over feldspars evidenced by the Rietveld refinement. Among the other major components, K2O is present in K-feldspar and in its white mica alteration; S, Cu and Fe are hosted in chalcopyrite (of course not as oxides); Fe2O3 is present in the chalcopyrite alteration halo; REEs (and CaO) are hosted in fluorcarbonates. On the basis of the texture, mineral assemblage, and chemical composition, the fluorcarbonate-hosting rock can be defined as a quartz dike.

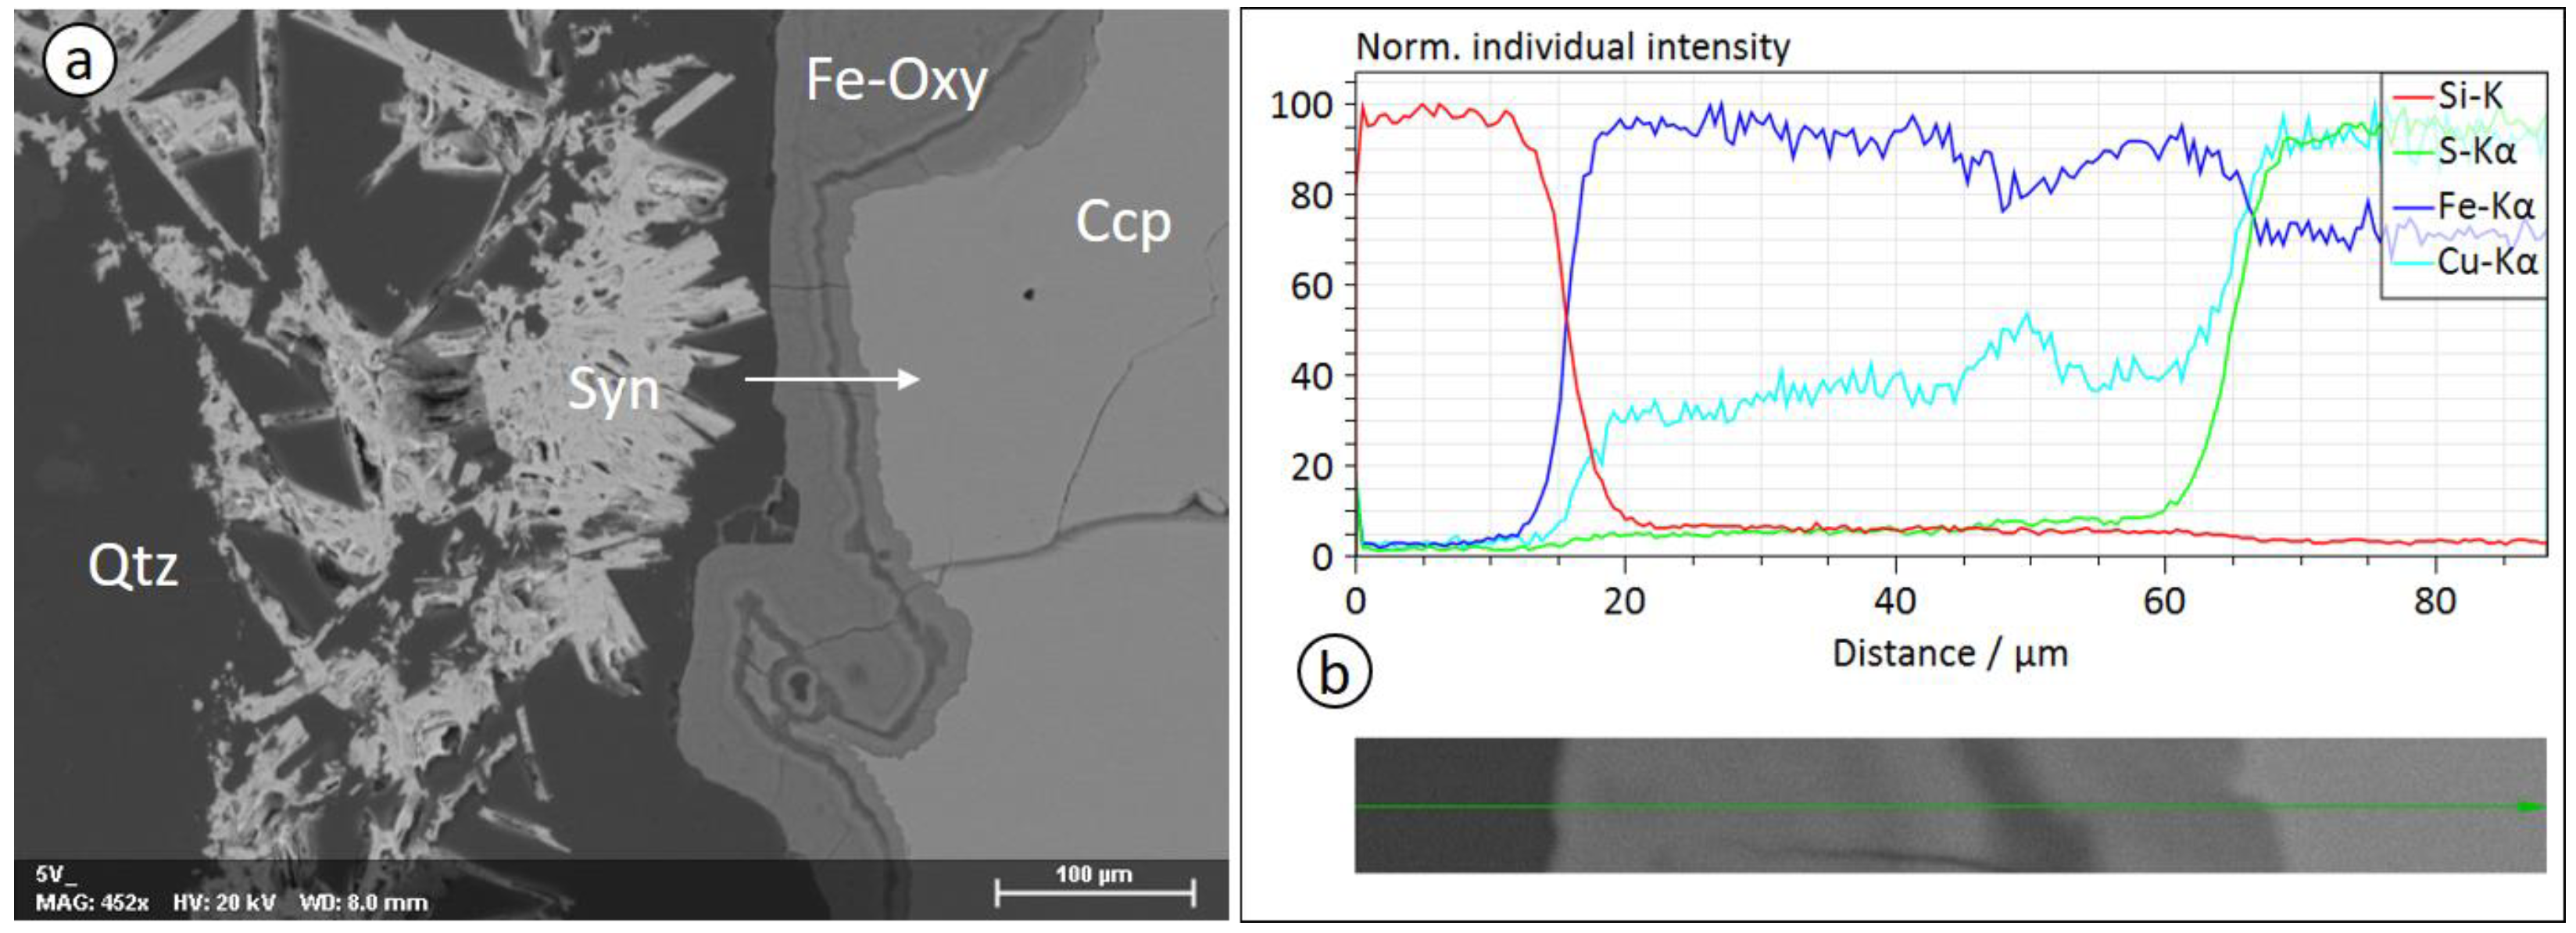
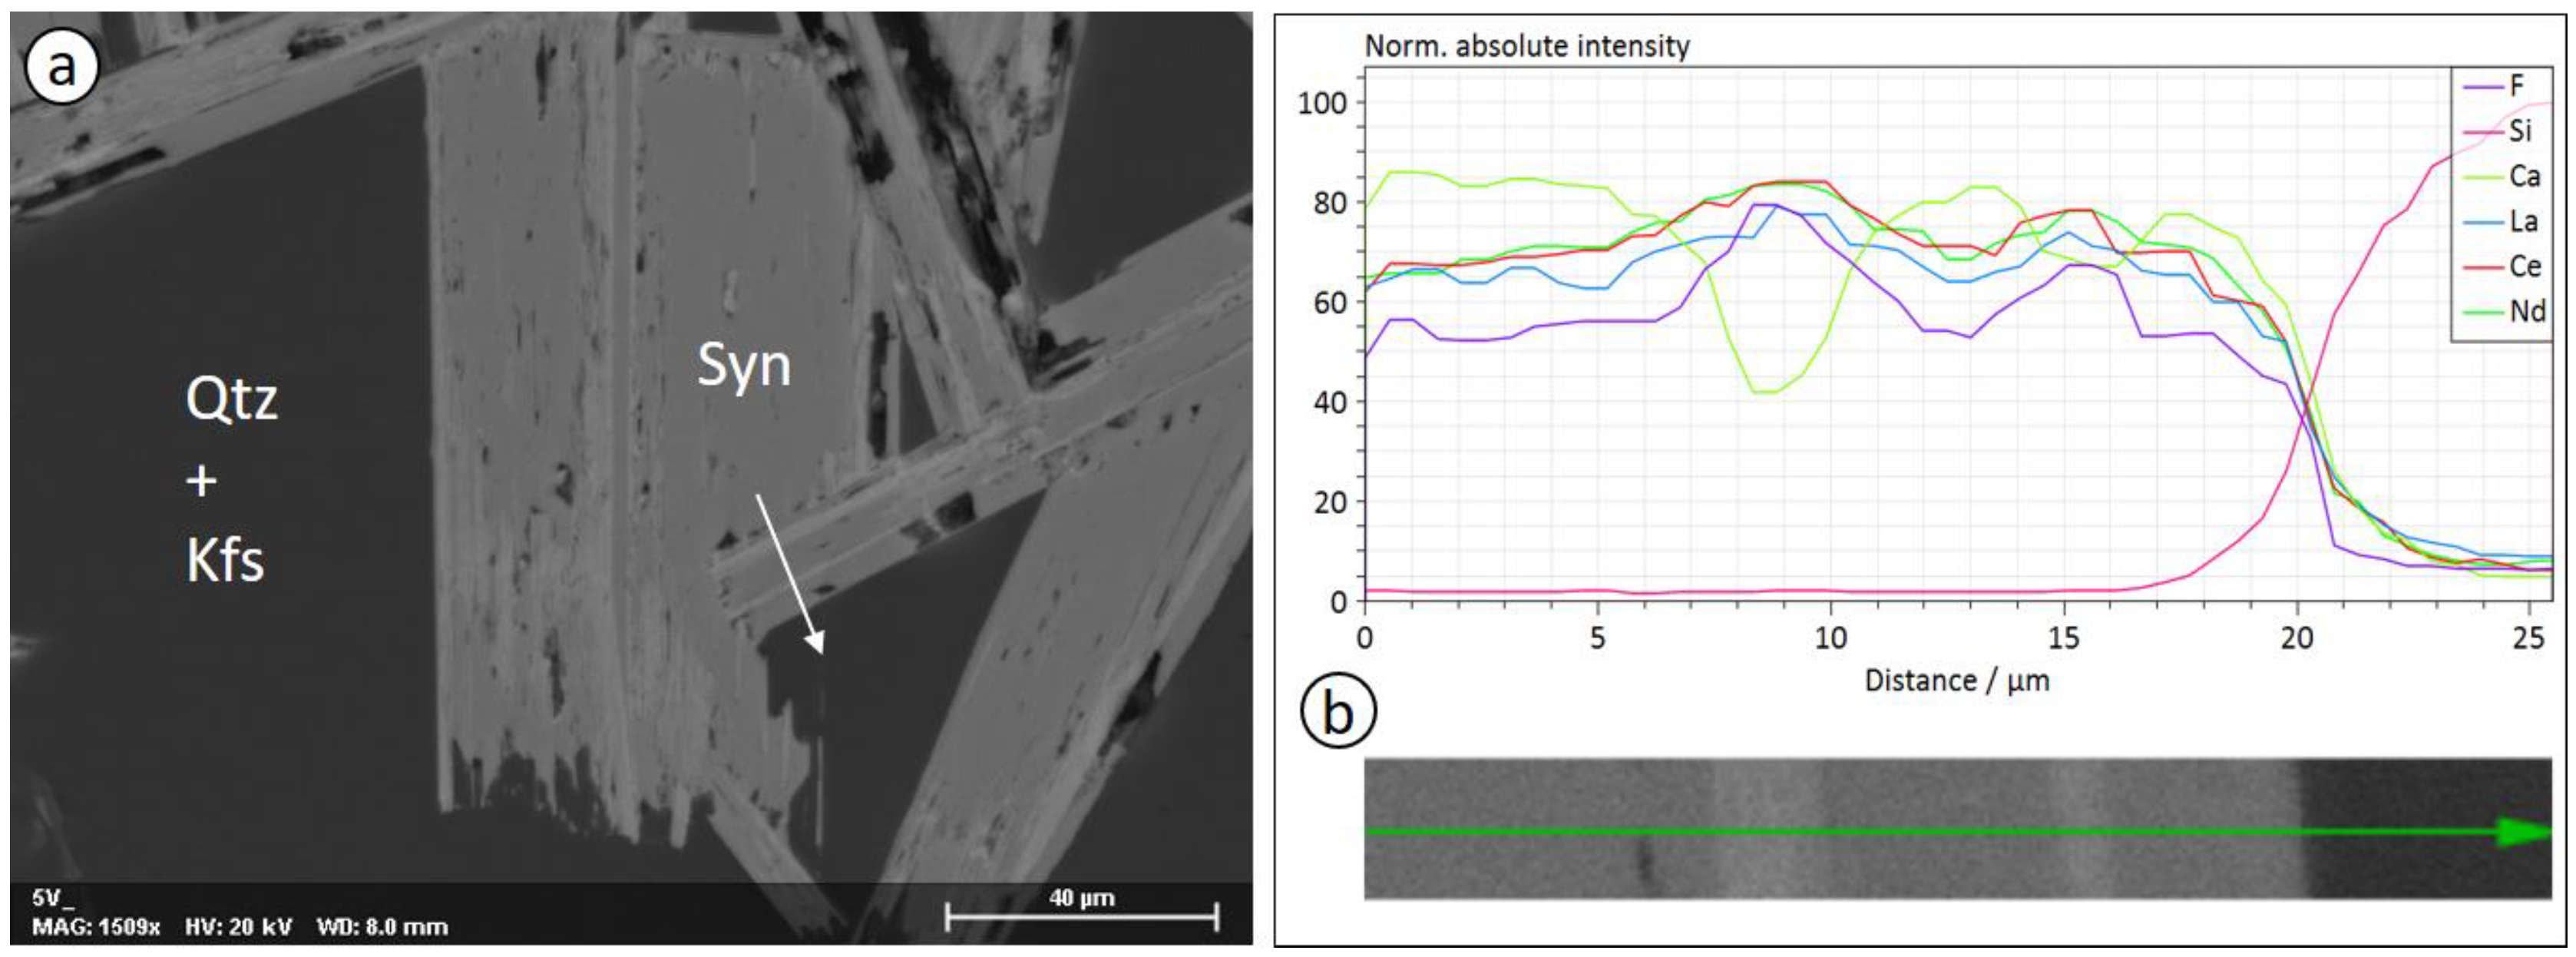
3.2. Microstructure and Mineral Composition

In order to complement optical observations as well as XRPD and EDXRF results, a SEM-EDS investigation was undertaken. As argued from the optical examination, the fluorcarbonates form interwoven needle-like crystals embedded in quartz and K-feldspar (Figure 4). An additional phase not detected with the previous techniques is metallic bismuth, which accounts for the Bi2O3 component detected with EDXRF. The presence of metallic bismuth and chalcopyrite are consistent with a reducing environment. However, the pinite alteration of K-feldspar and the Fe-Cu-oxide halo wrapping chalcopyrite (Figure 5) suggest a late alteration stage under high oxygen fugacity in the presence of water.
The fluorcarbonate needles show a core richer in Ca and a rim richer in REEs (Figure 6), suggesting an enrichment of REEs in the final stage of crystallization. The related SEM-EDS analyses are reported in Table 2, and are consistent with synchysite-(Ce), ideally CaCe(CO3)2F, and bastnäsite-(Ce), ideally Ce(CO3)F, respectively. In fact, Ce is the dominant REE in both minerals (~0.43 and ~0.69 a.p.f.u. in average in synchysite and bastnäsite, respectively) and the Ca/(Ca + REE) ratio is close to 0.50 for synchysite and very low in bastnäsite (0.03–0.09). Few analyses show Ca/(Ca + REE) lower than 0.50 (e.g., the n. 4 in Table 2), suggesting compositional (polysomatic) faults towards the bastnäsite composition, as commonly observed in (Ca,REE)-fluorcarbonates. Lanthanum (~0.26 and ~0.50) and Nd (~0.17 and ~0.33) are the other abundant REEs, whereas Y (~0.07 and ~0.11) and Pr (~0.04 and ~0.08) are less abundant and Sm (~0.02 and ~0.04) and Gd (<0.02) are definitely scarce, especially the latter, which is sometimes below the detection limit.
Detectable amounts of Pb (~0.13 a.p.f.u.) are present in bastnäsite, whereas Pb is always below the detection limit in synchysite. Of course, CO2 and any possible presence of H2O could not be detected (ideally, synchysite-(Ce) contains 27.6 wt% of CO2 component and bastnäsite-(Ce) 20.08%). Additionally, the data show that F is lower than expected. In part this deficiency may be due to the presence of OH substituting for F in the structure, but mostly is due to diffusion of F under the highly focused electron beam, a problem further exaggerated in TEM-EDS analyses, where F is not detected at all (see ahead). In summary, taking into account that fluorine can be underestimated and the (OH) content, as calculated by difference, overestimated, the average composition of synchysite-(Ce) and bastnäsite-(Ce) read: Ca1.00(Ce0.43La0.26Nd0.17Y0.07Pr0.04Sm0.02Gd0.01)Σ=1.00(CO3)2(F0.58(OH)0.42), and (Ce0.34La0.25Nd0.17Pb0.07Ca0.06Y0.06Pr0.04Sm0.02Gd0.01)Σ=1.00CO3(F0.75(OH)0.25), respectively.

3.3. Observations at the Nanoscale
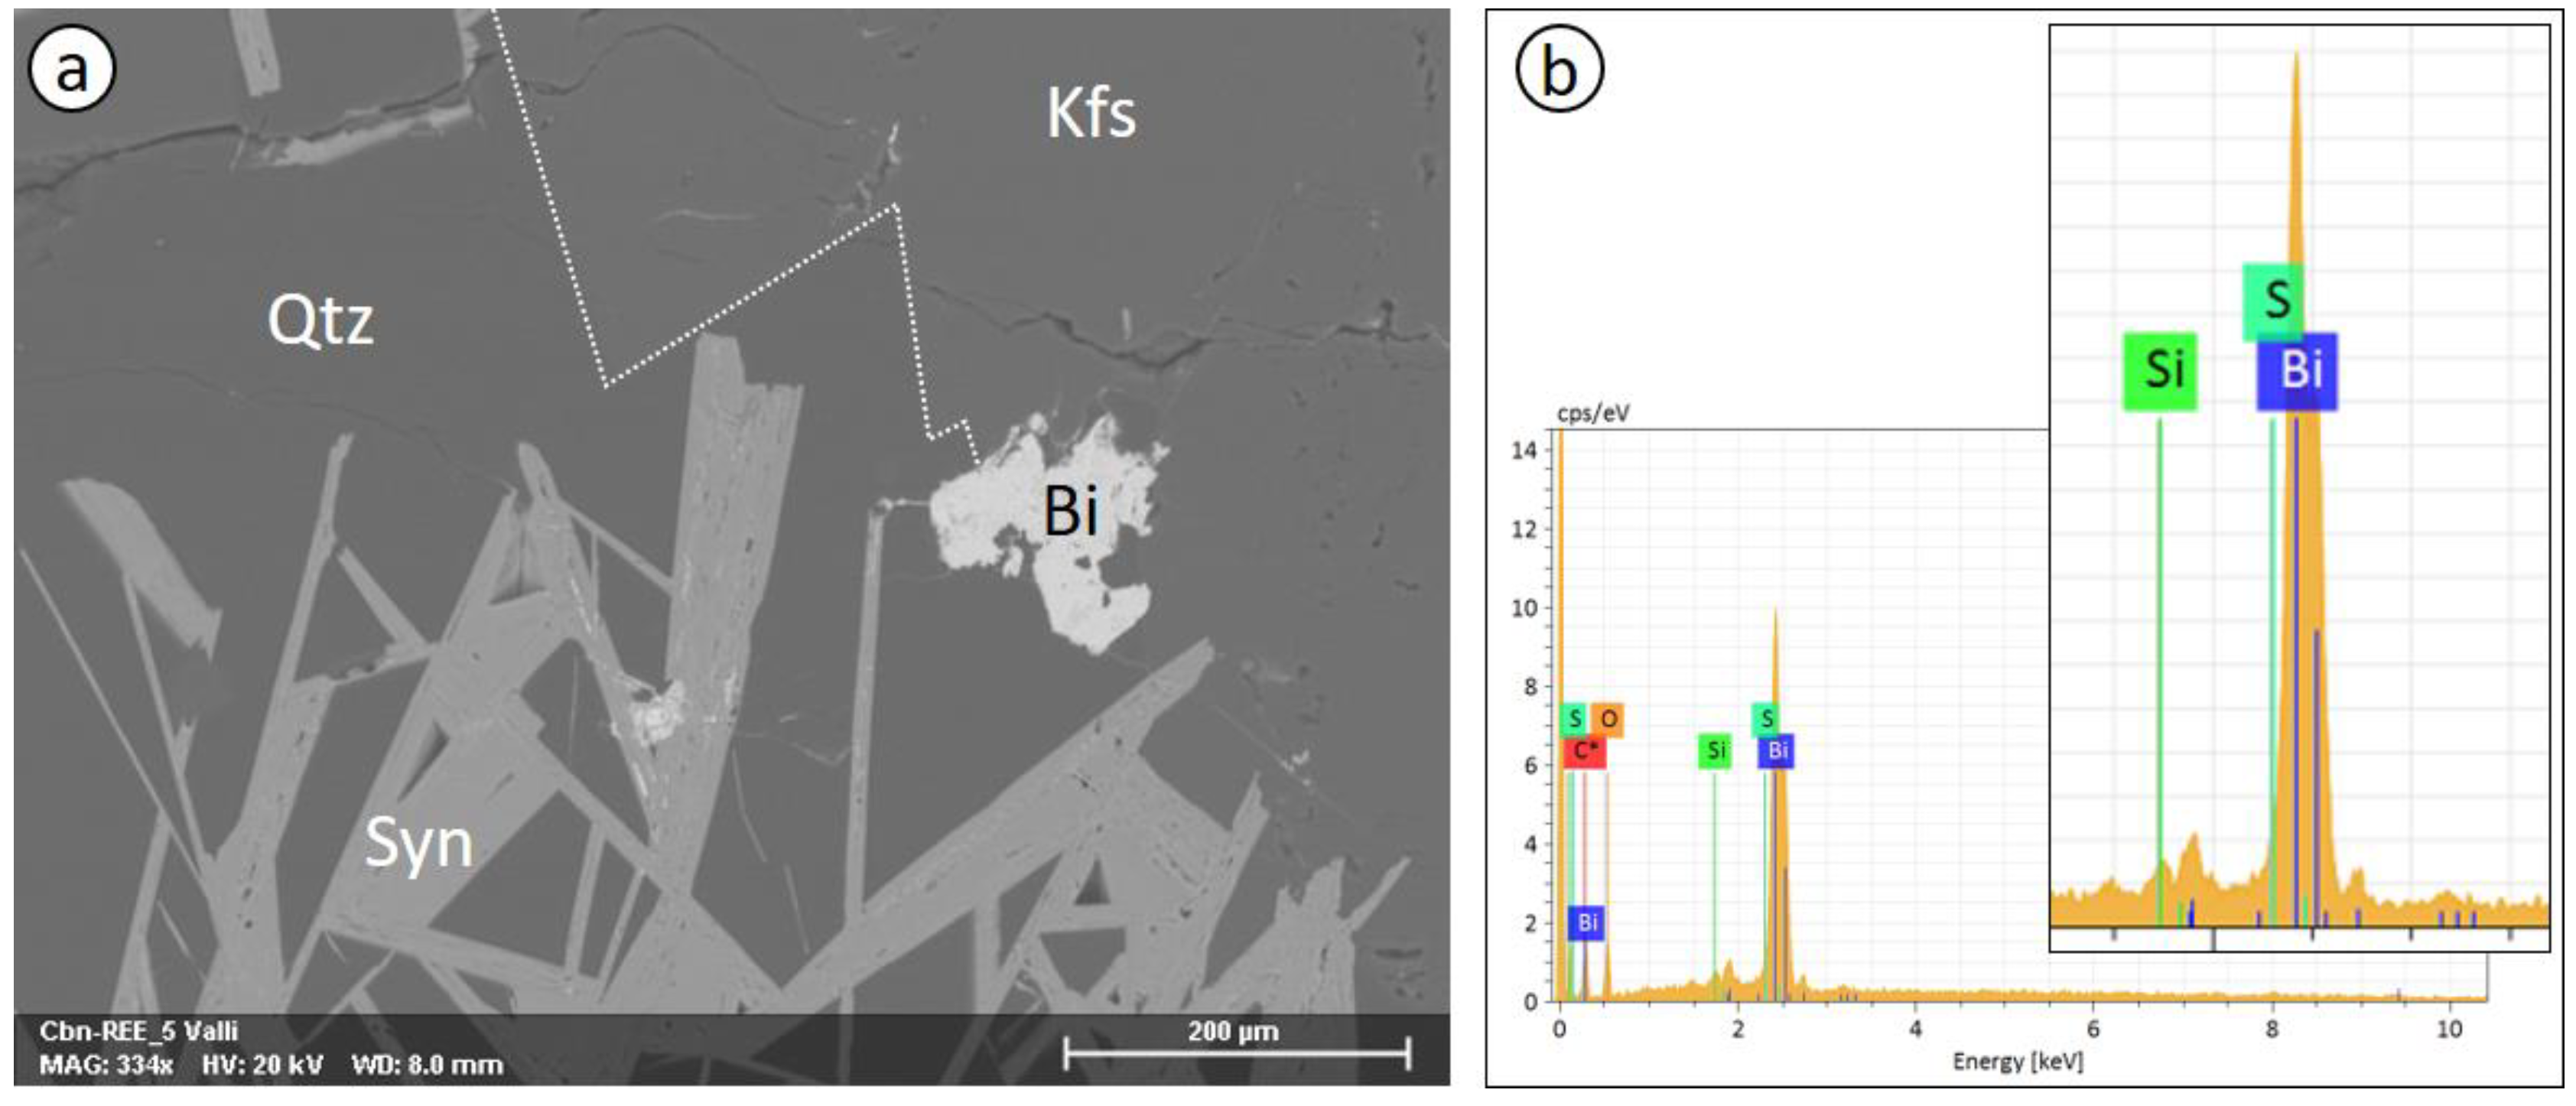
3.3.1. EDS Analysis

Fluorcarbonate grains dispersed on the grid were first discerned from other more abundant grains (quartz, K-feldspar) on the basis of a fast EDS spectrum, then checked for their orientation (see ahead) and in suitable cases studied in HR mode. The final EDS analysis was taken at the end, in order to preserve the crystal for HR imaging.
TEM-EDS analyses are reported in Table 3. Overall, they are consistent with SEM-EDS analyses, although the low sensitivity of TEM-EDS did not allow for the detection of Pr, Sm, and Gd. Fluorine is also not detected because of diffusion during the analysis. In fact, in the TEM the electron beam is focused on a thin foil, the irradiated volume is therefore much lower than in the SEM and the electron dose per atom much higher. Moreover, the electron energy is an order of magnitude higher than for the SEM. Both factors determined the diffusion of the total amount of F.
Consistently with SEM-EDS of bastnäsite, TEM-EDS analyses also show detectable amounts of Pb in the latter. Few analyses show a Ca/(Ca + REE) ratio slightly lower than 0.50 (e.g., 2 and 4), whereas most analyses show values slightly higher (especially 3 and 5). Whereas lower values can be explained with bastnäsite lamellae within synchysite (polysomatic faults), higher values would suggest the presence of vaterite lamellae, which has never been observed so far and it is considered improbable because metastable [18]. Therefore, unless vaterite lamellae could be imaged, the most plausible explanation of the observed higher values is an overestimation of Ca due to the low accuracy of TEM-EDS analysis.

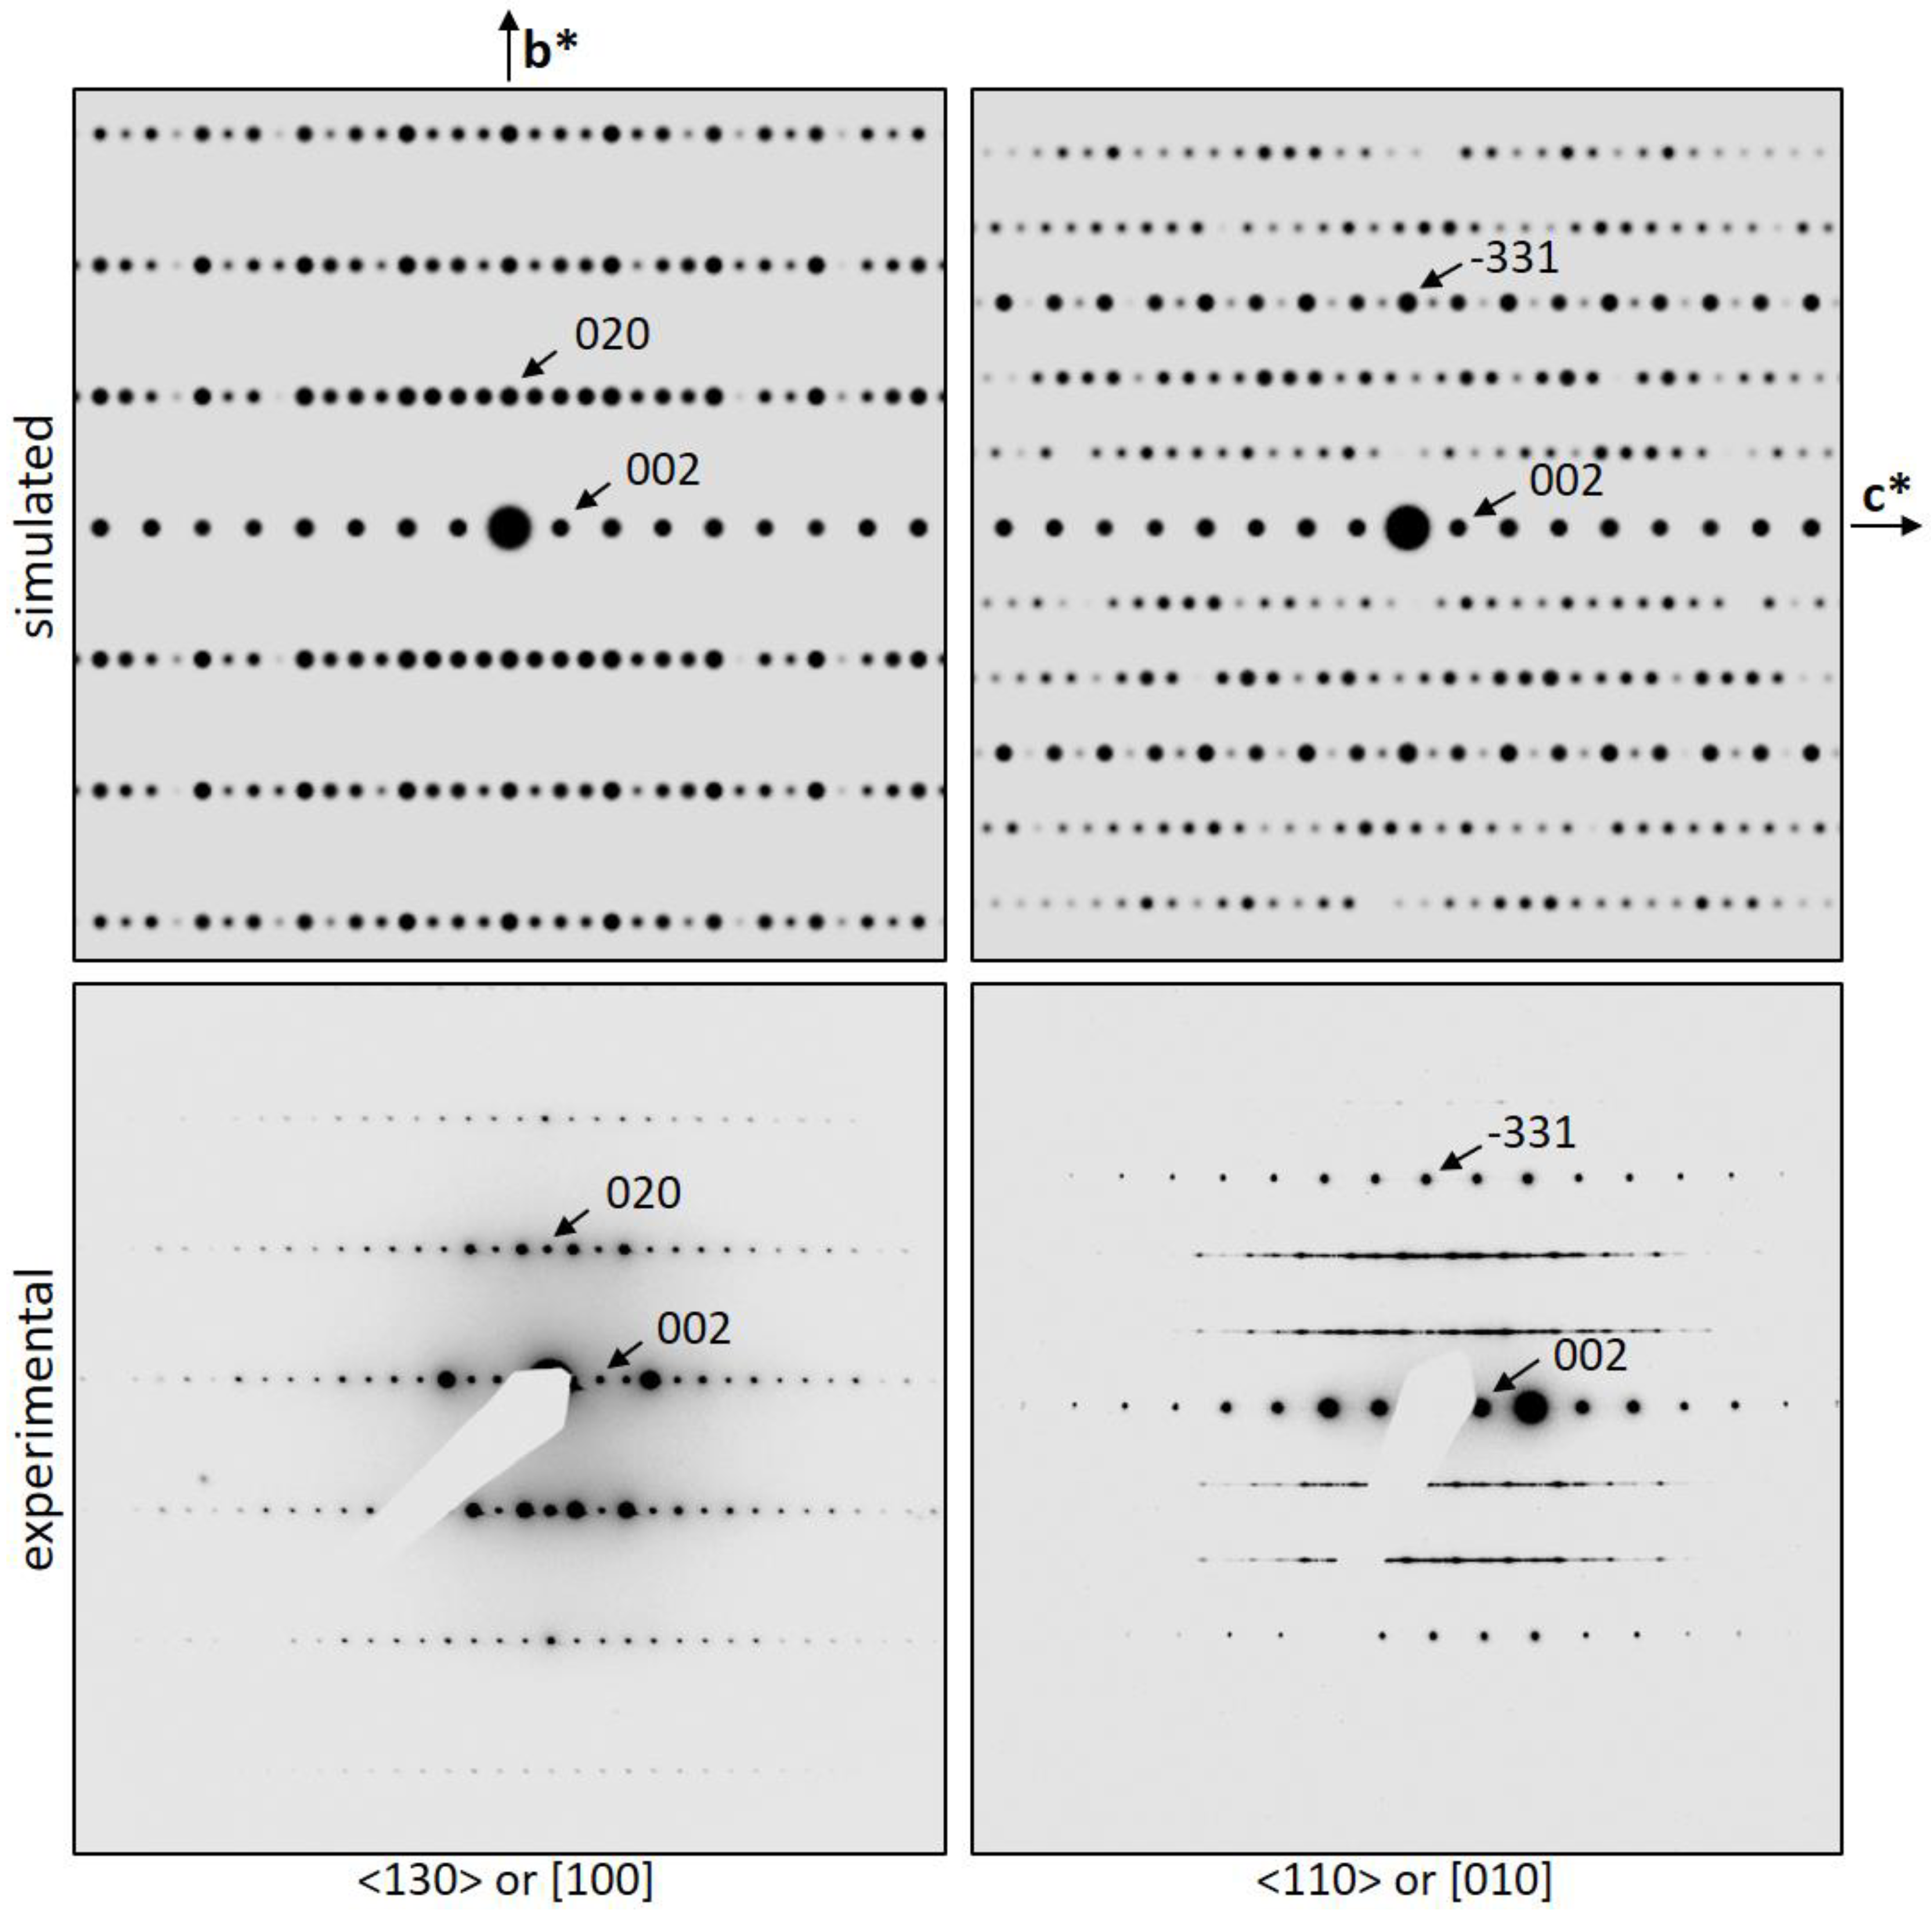
3.3.2. Suitable Crystal Orientation for Order/Disorder Assessment

Stacking order/disorder information in (Ca,REE)-fluorcarbonates, and therefore polytypic and polysomatic analyses, can be achieved along low indexed orientations perpendicular to the c*-axis, which is the stacking directions of (001)-layers. In principle, four different nonequivalent orientations are suitable in C2/c synchysite: 〈130〉, [100], 〈110〉 and [010]. However, [100] is indistinguishable from 〈130〉 in any case and [010] is undistinguishable from 〈110〉 in case of dynamical scattering, which makes h0l, l ≠ 2n reflections, normally absent by symmetry, to be indeed present, and level out any intensity difference present under kinematic conditions. Polytypic disorder and related streaking on selected area diffraction (SAED) patterns, further complicate any possible distinction. Therefore, the number of distinguishable orientations reduces to two: [130], [100], and [130] (and related Friedel’s opposites) can be grouped as 〈100〉 orientation type; [110], [010], and [110] (and related Friedel’s opposites) can be grouped as 〈110〉 orientation type. These two distinguishable orientation types alternate every ~30° rotating the crystal around c* (Figure 7).

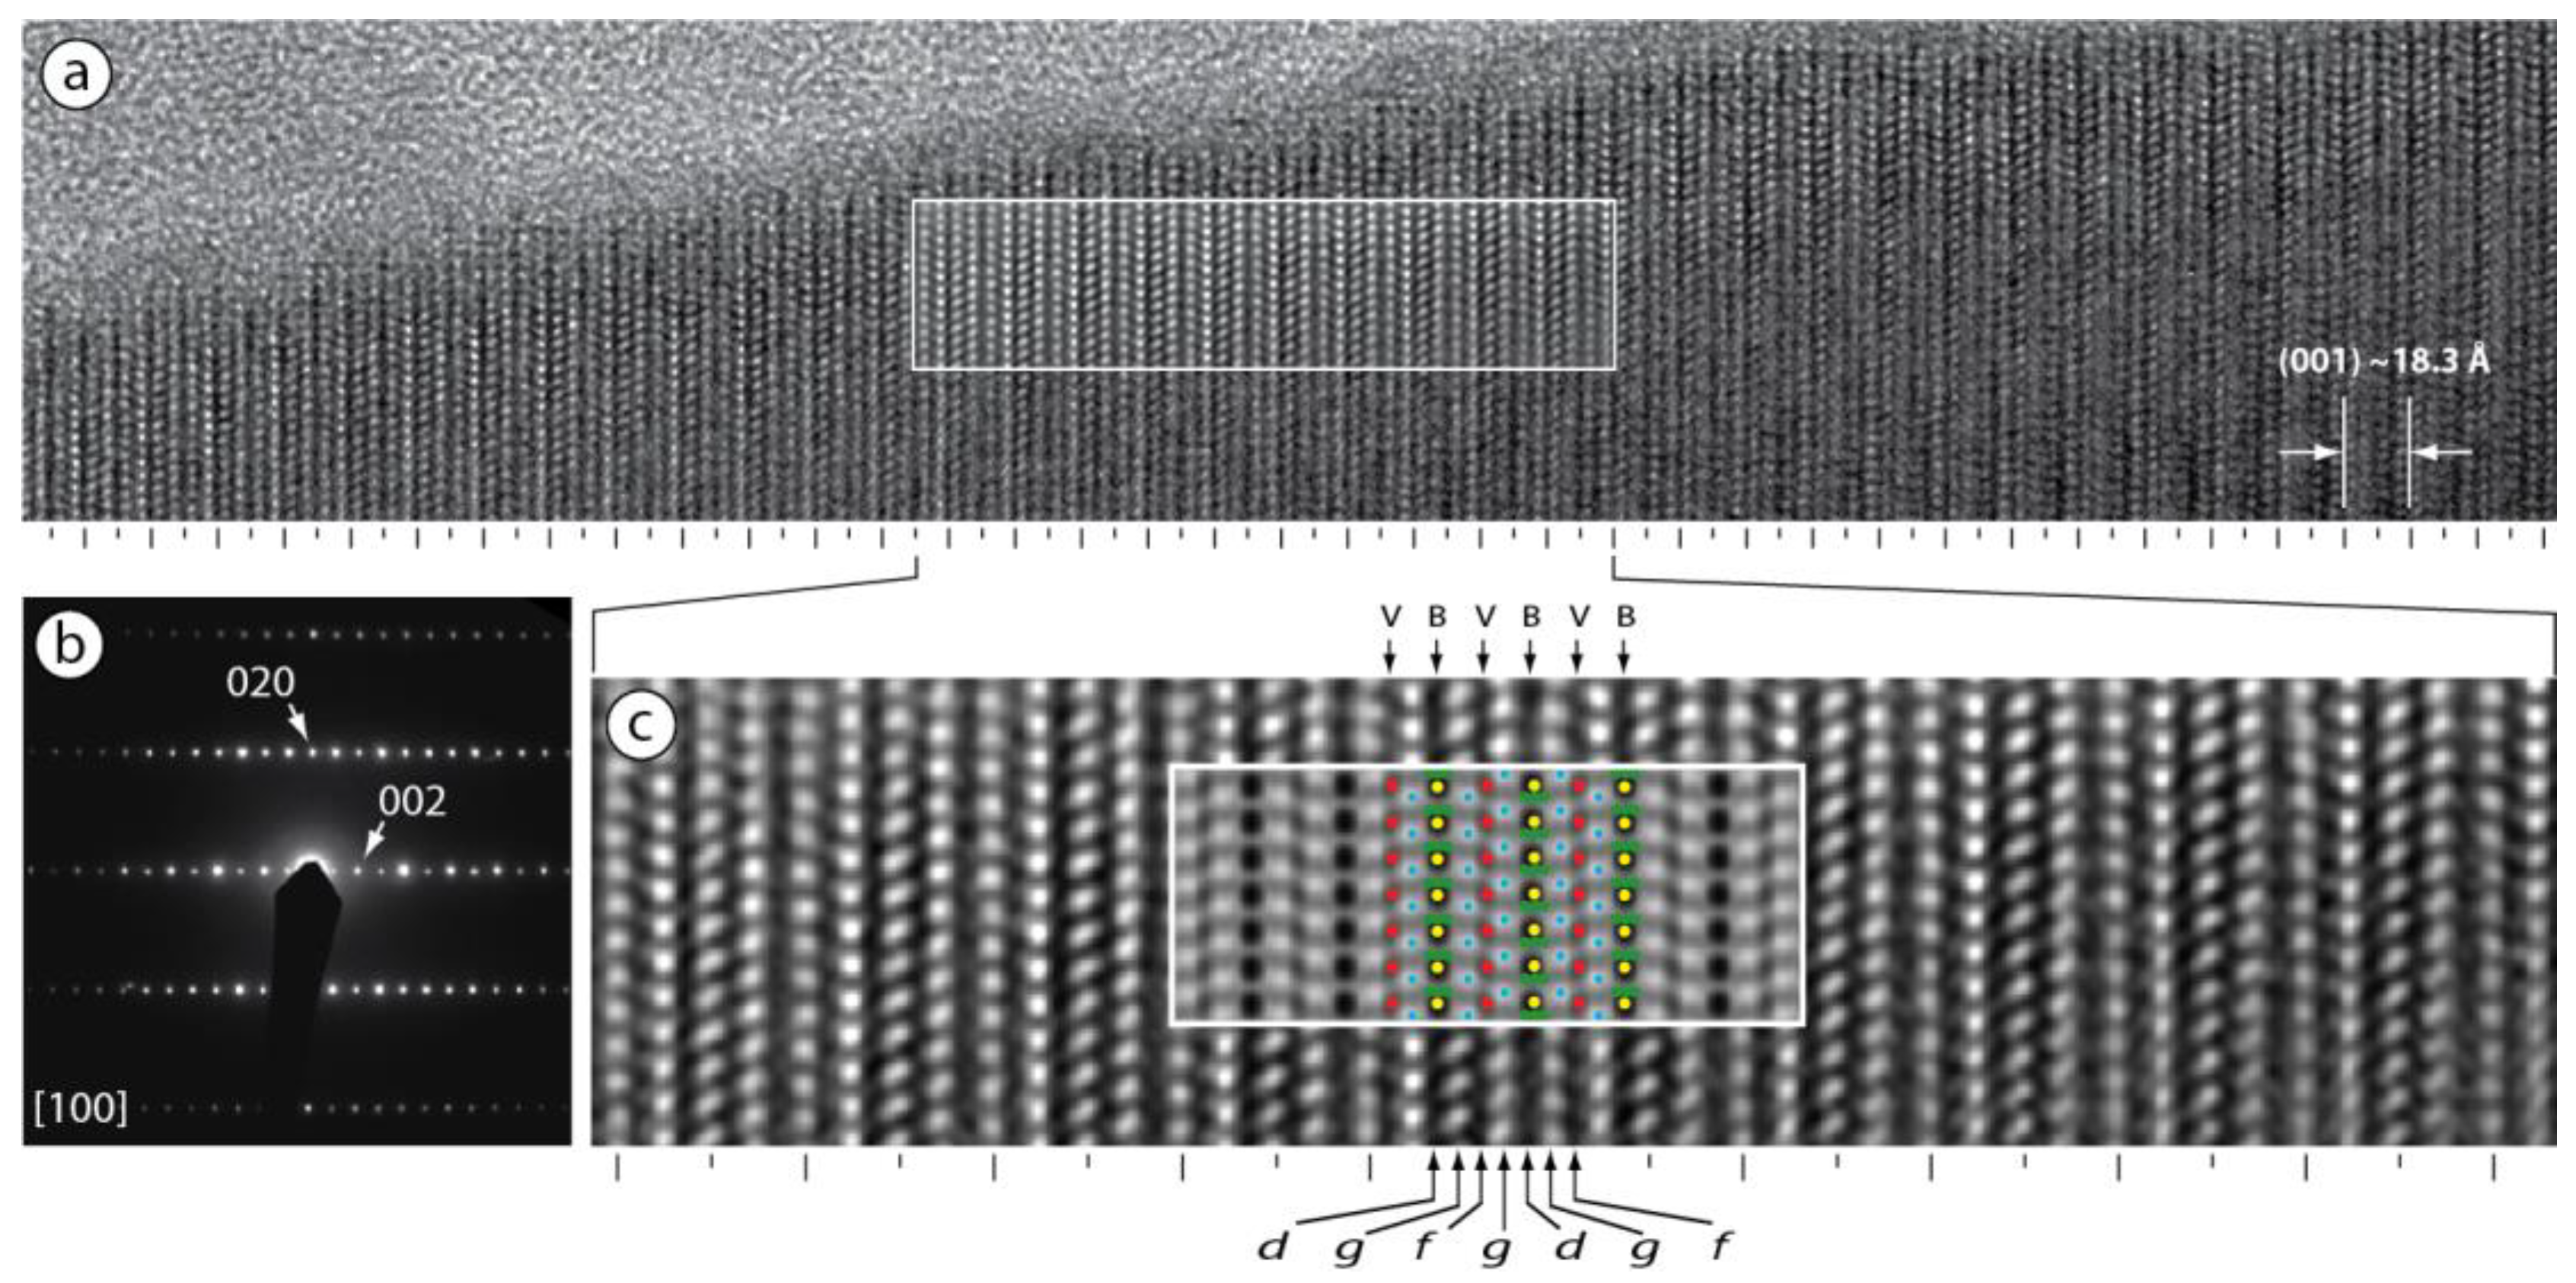
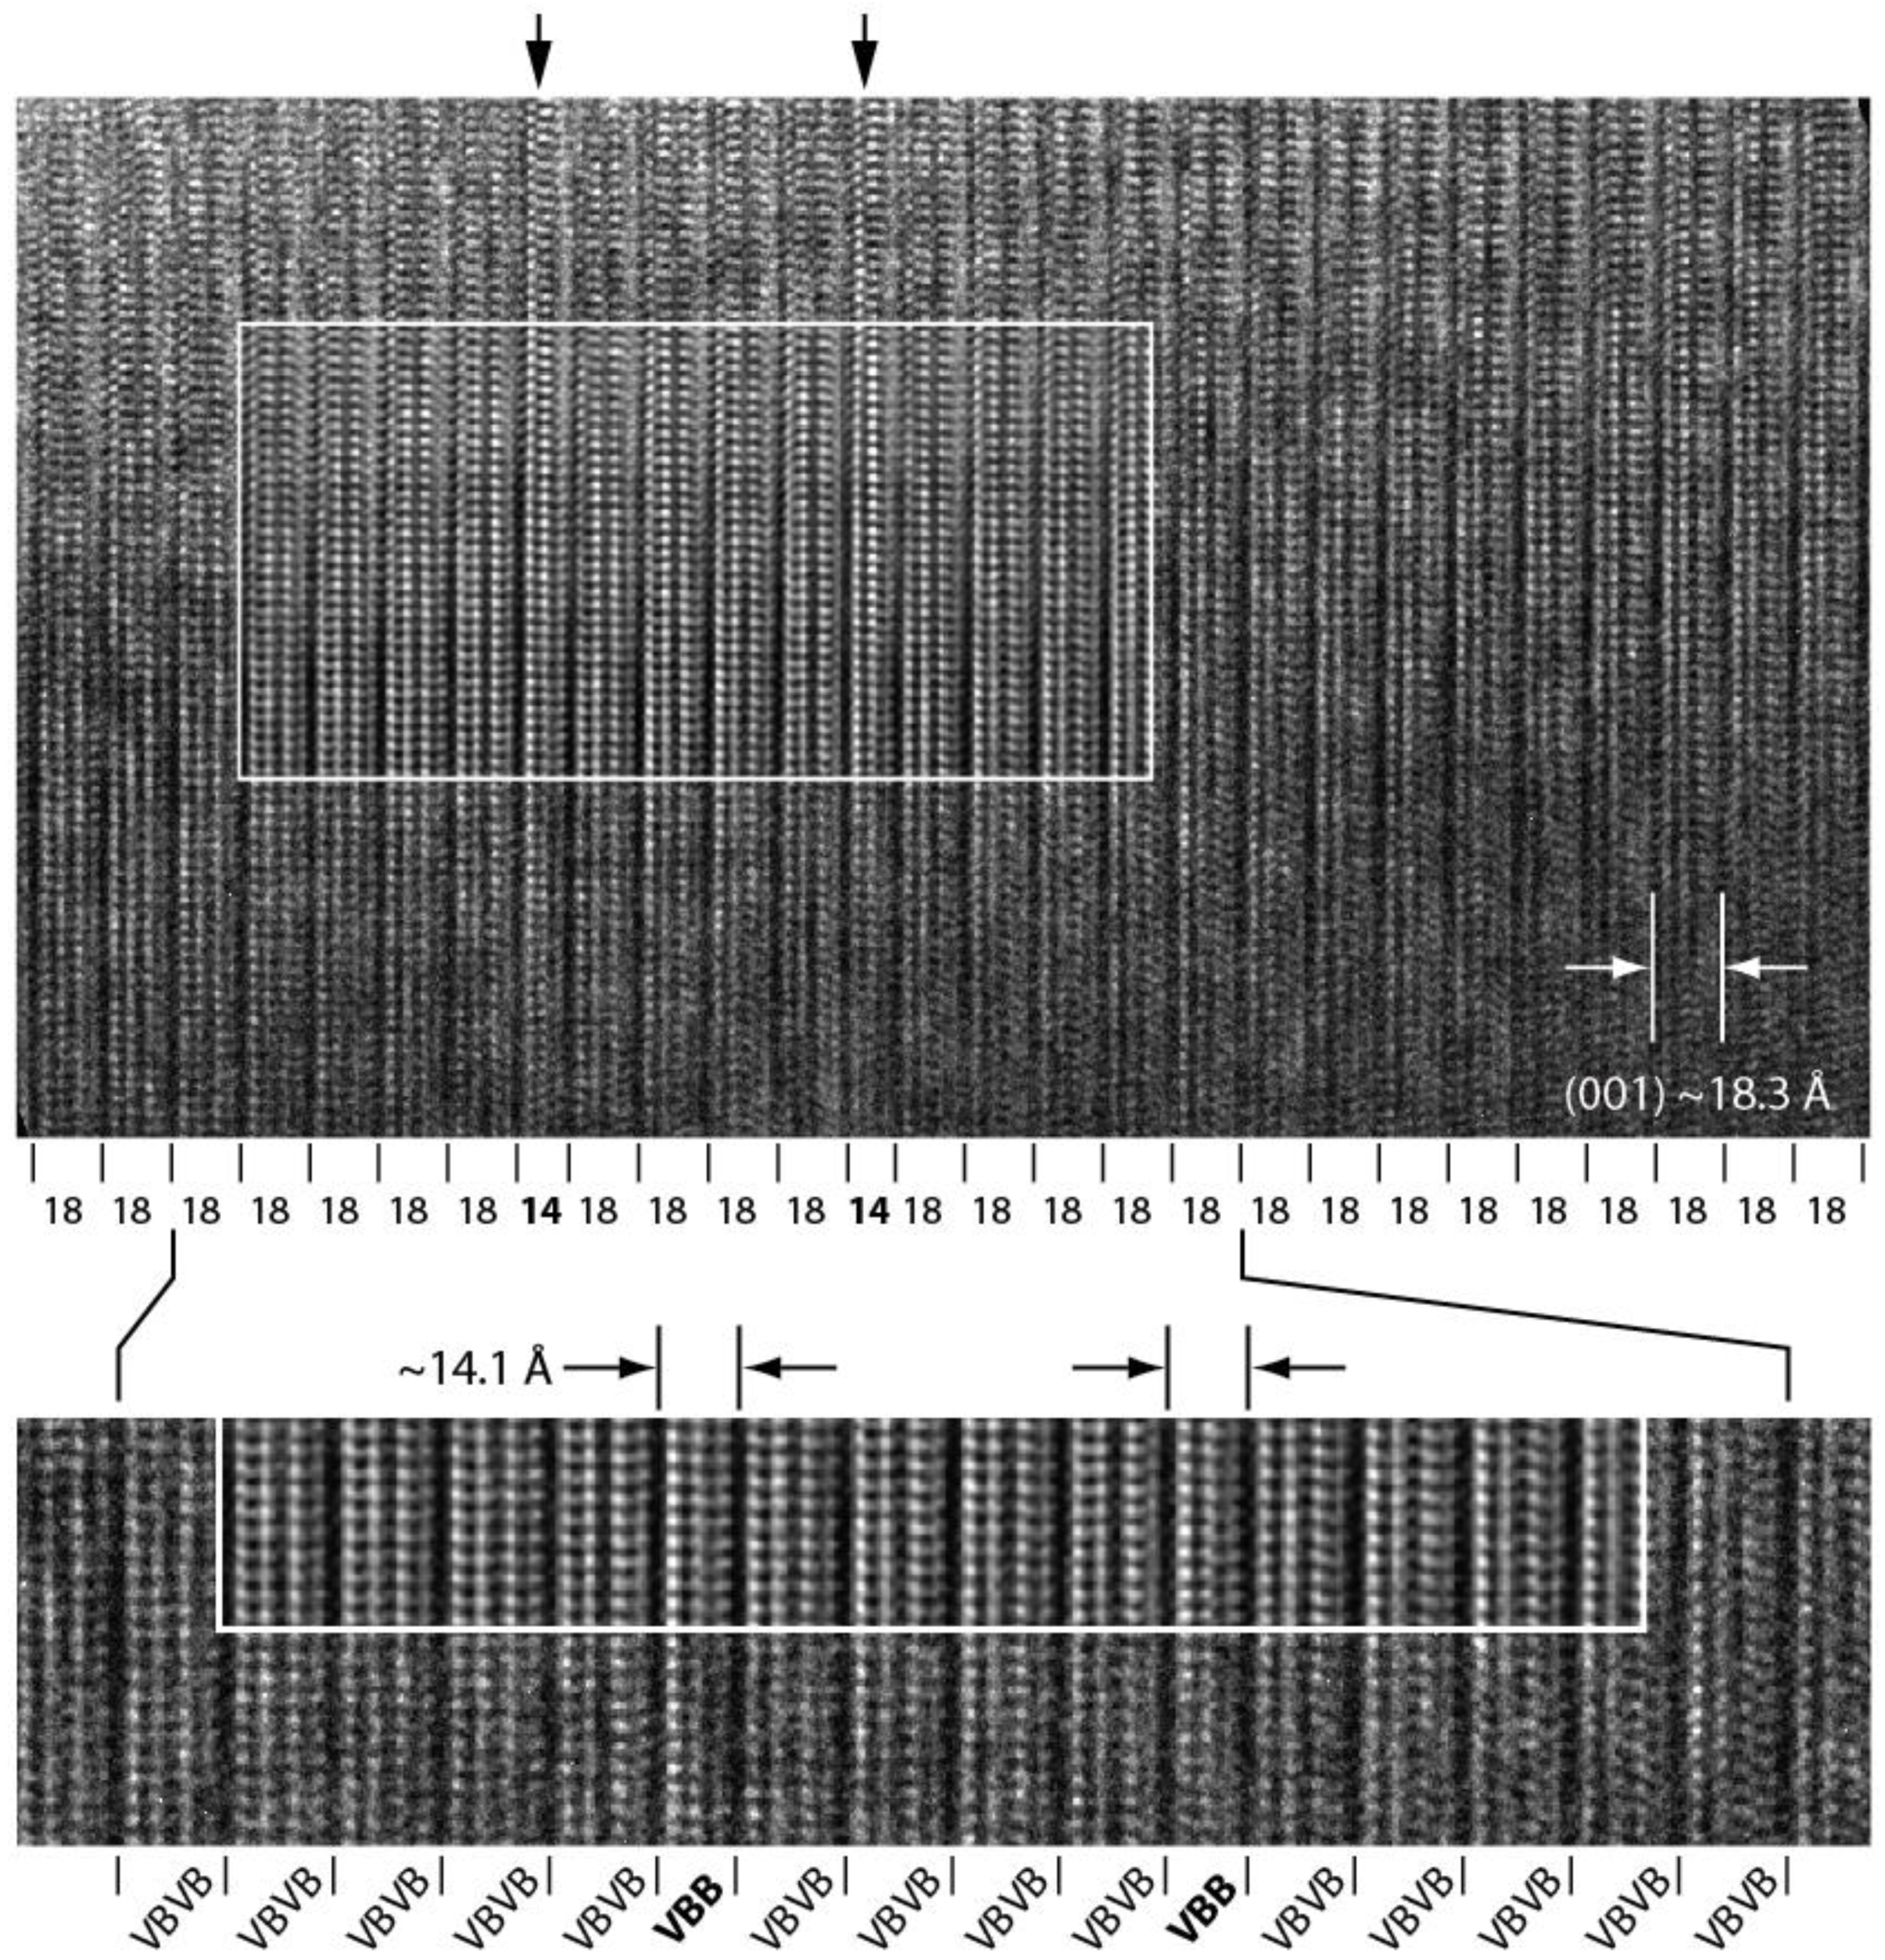
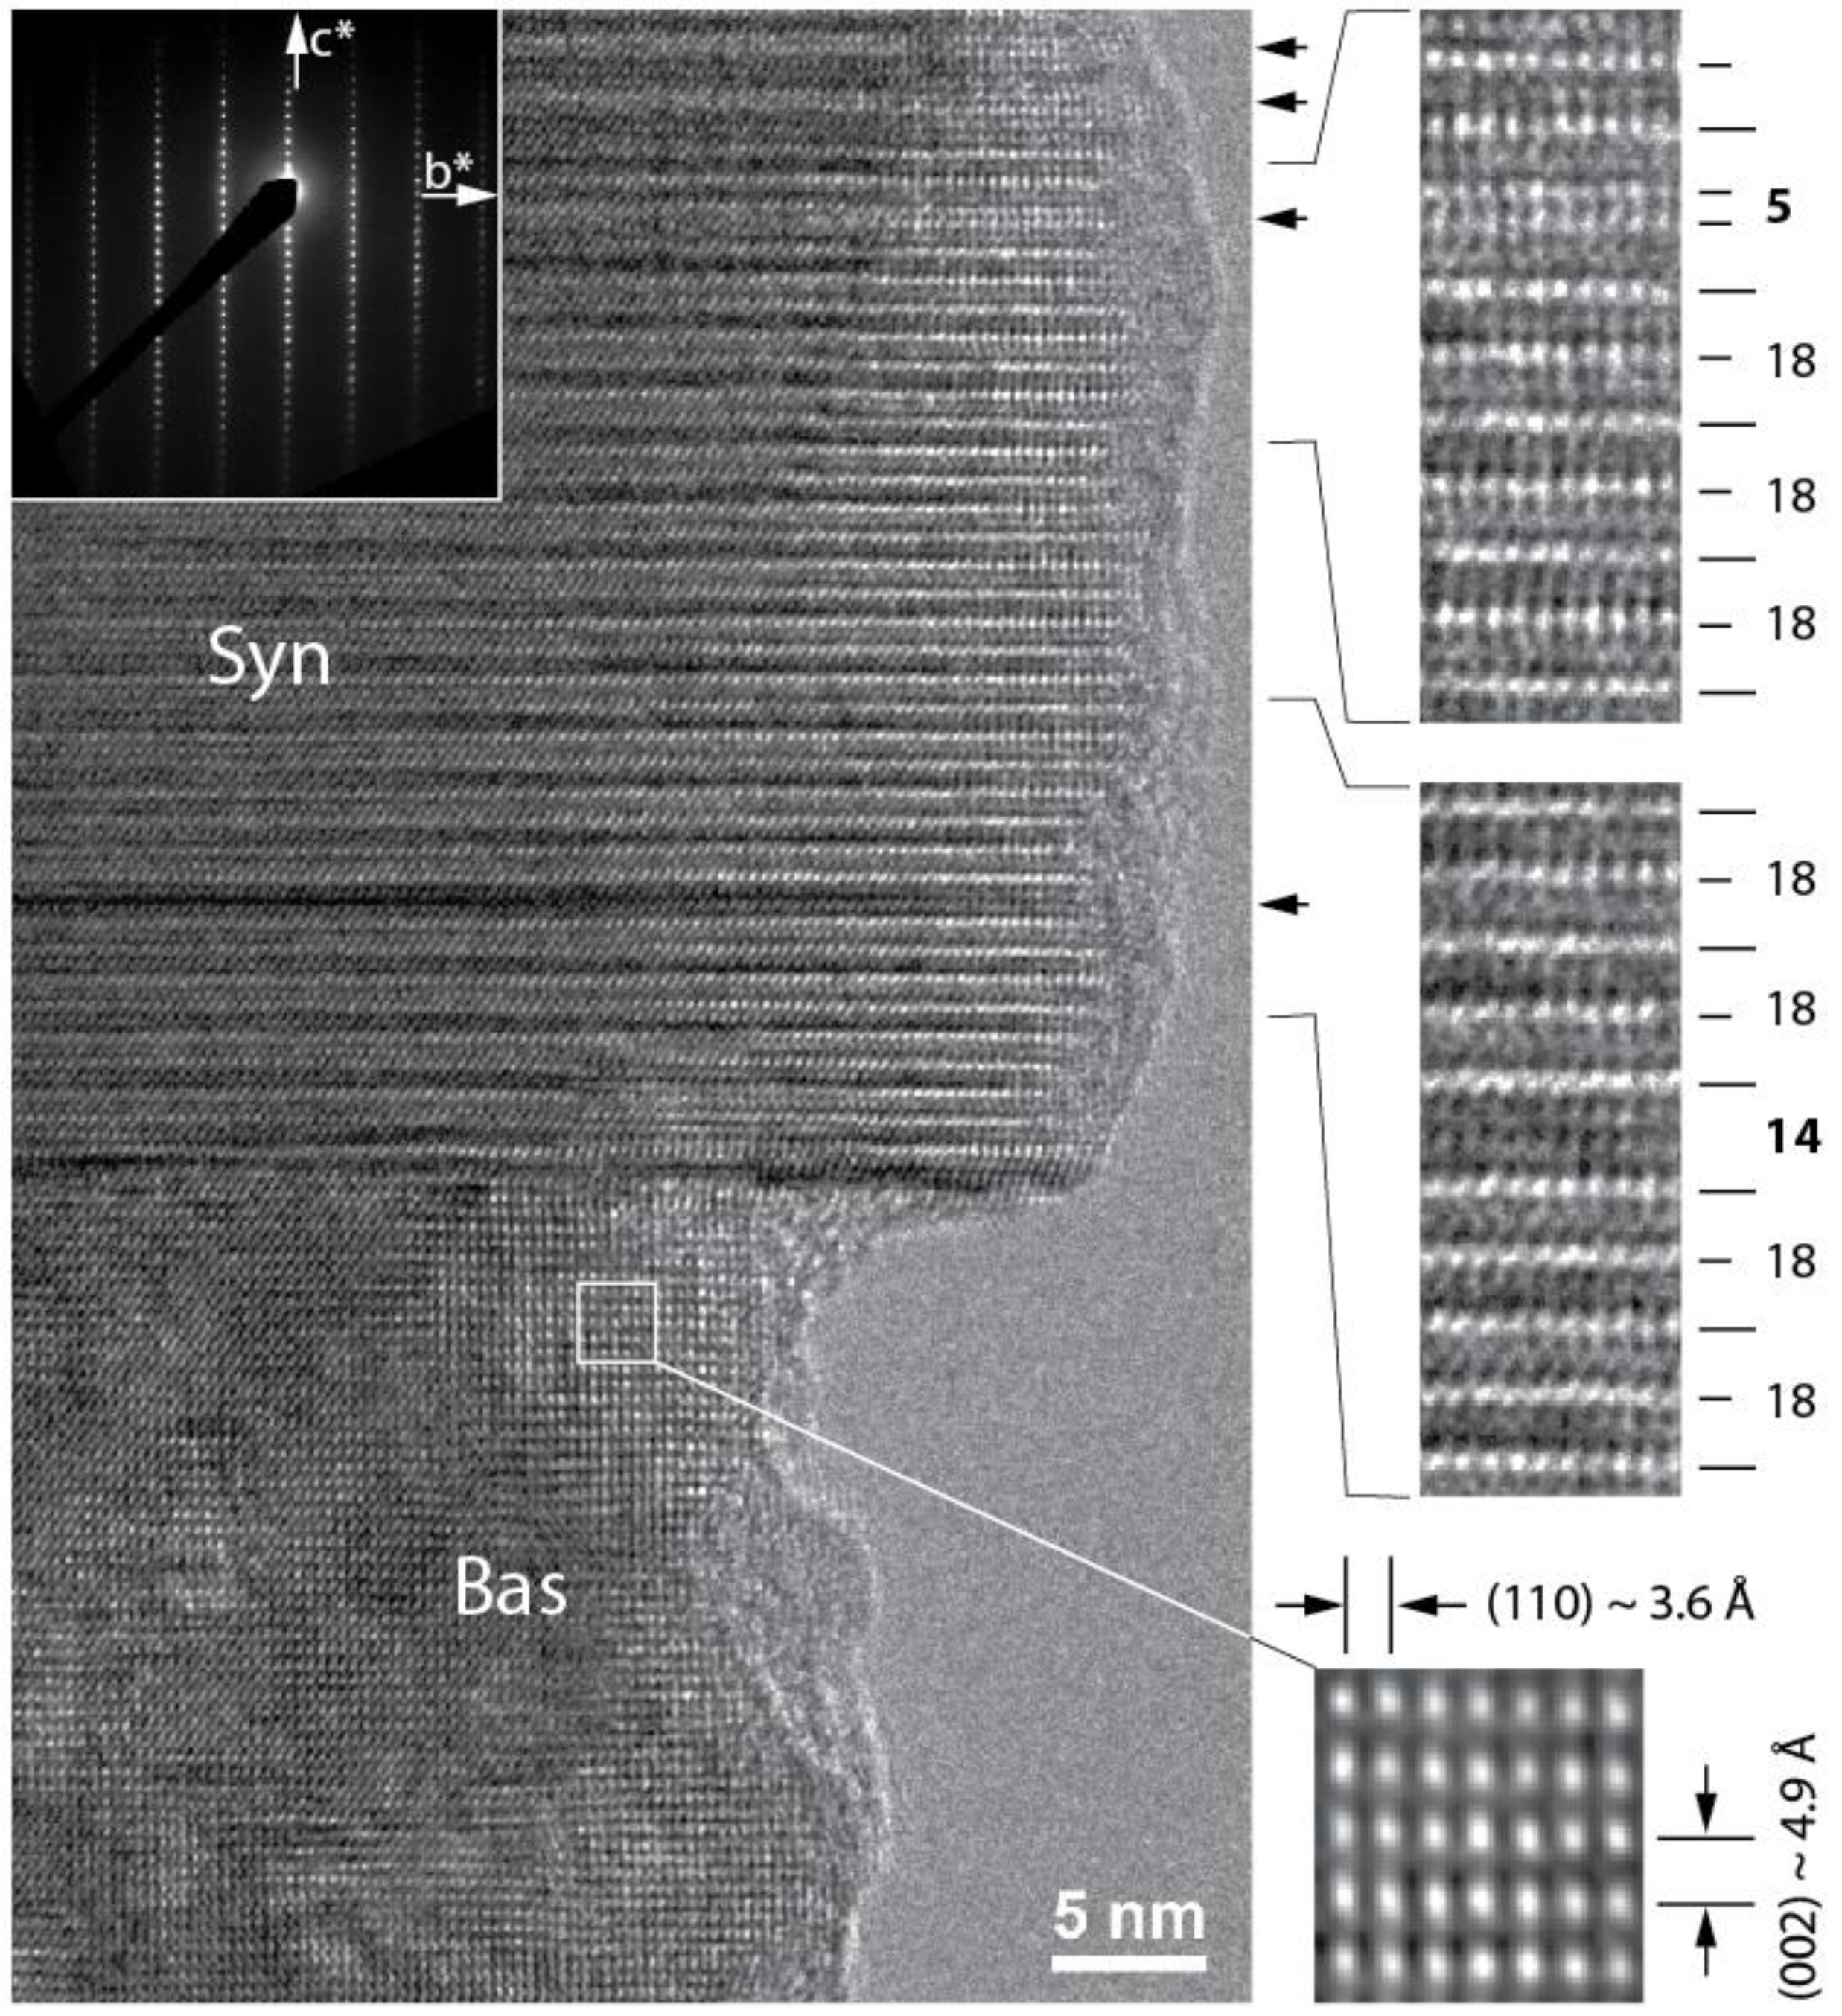
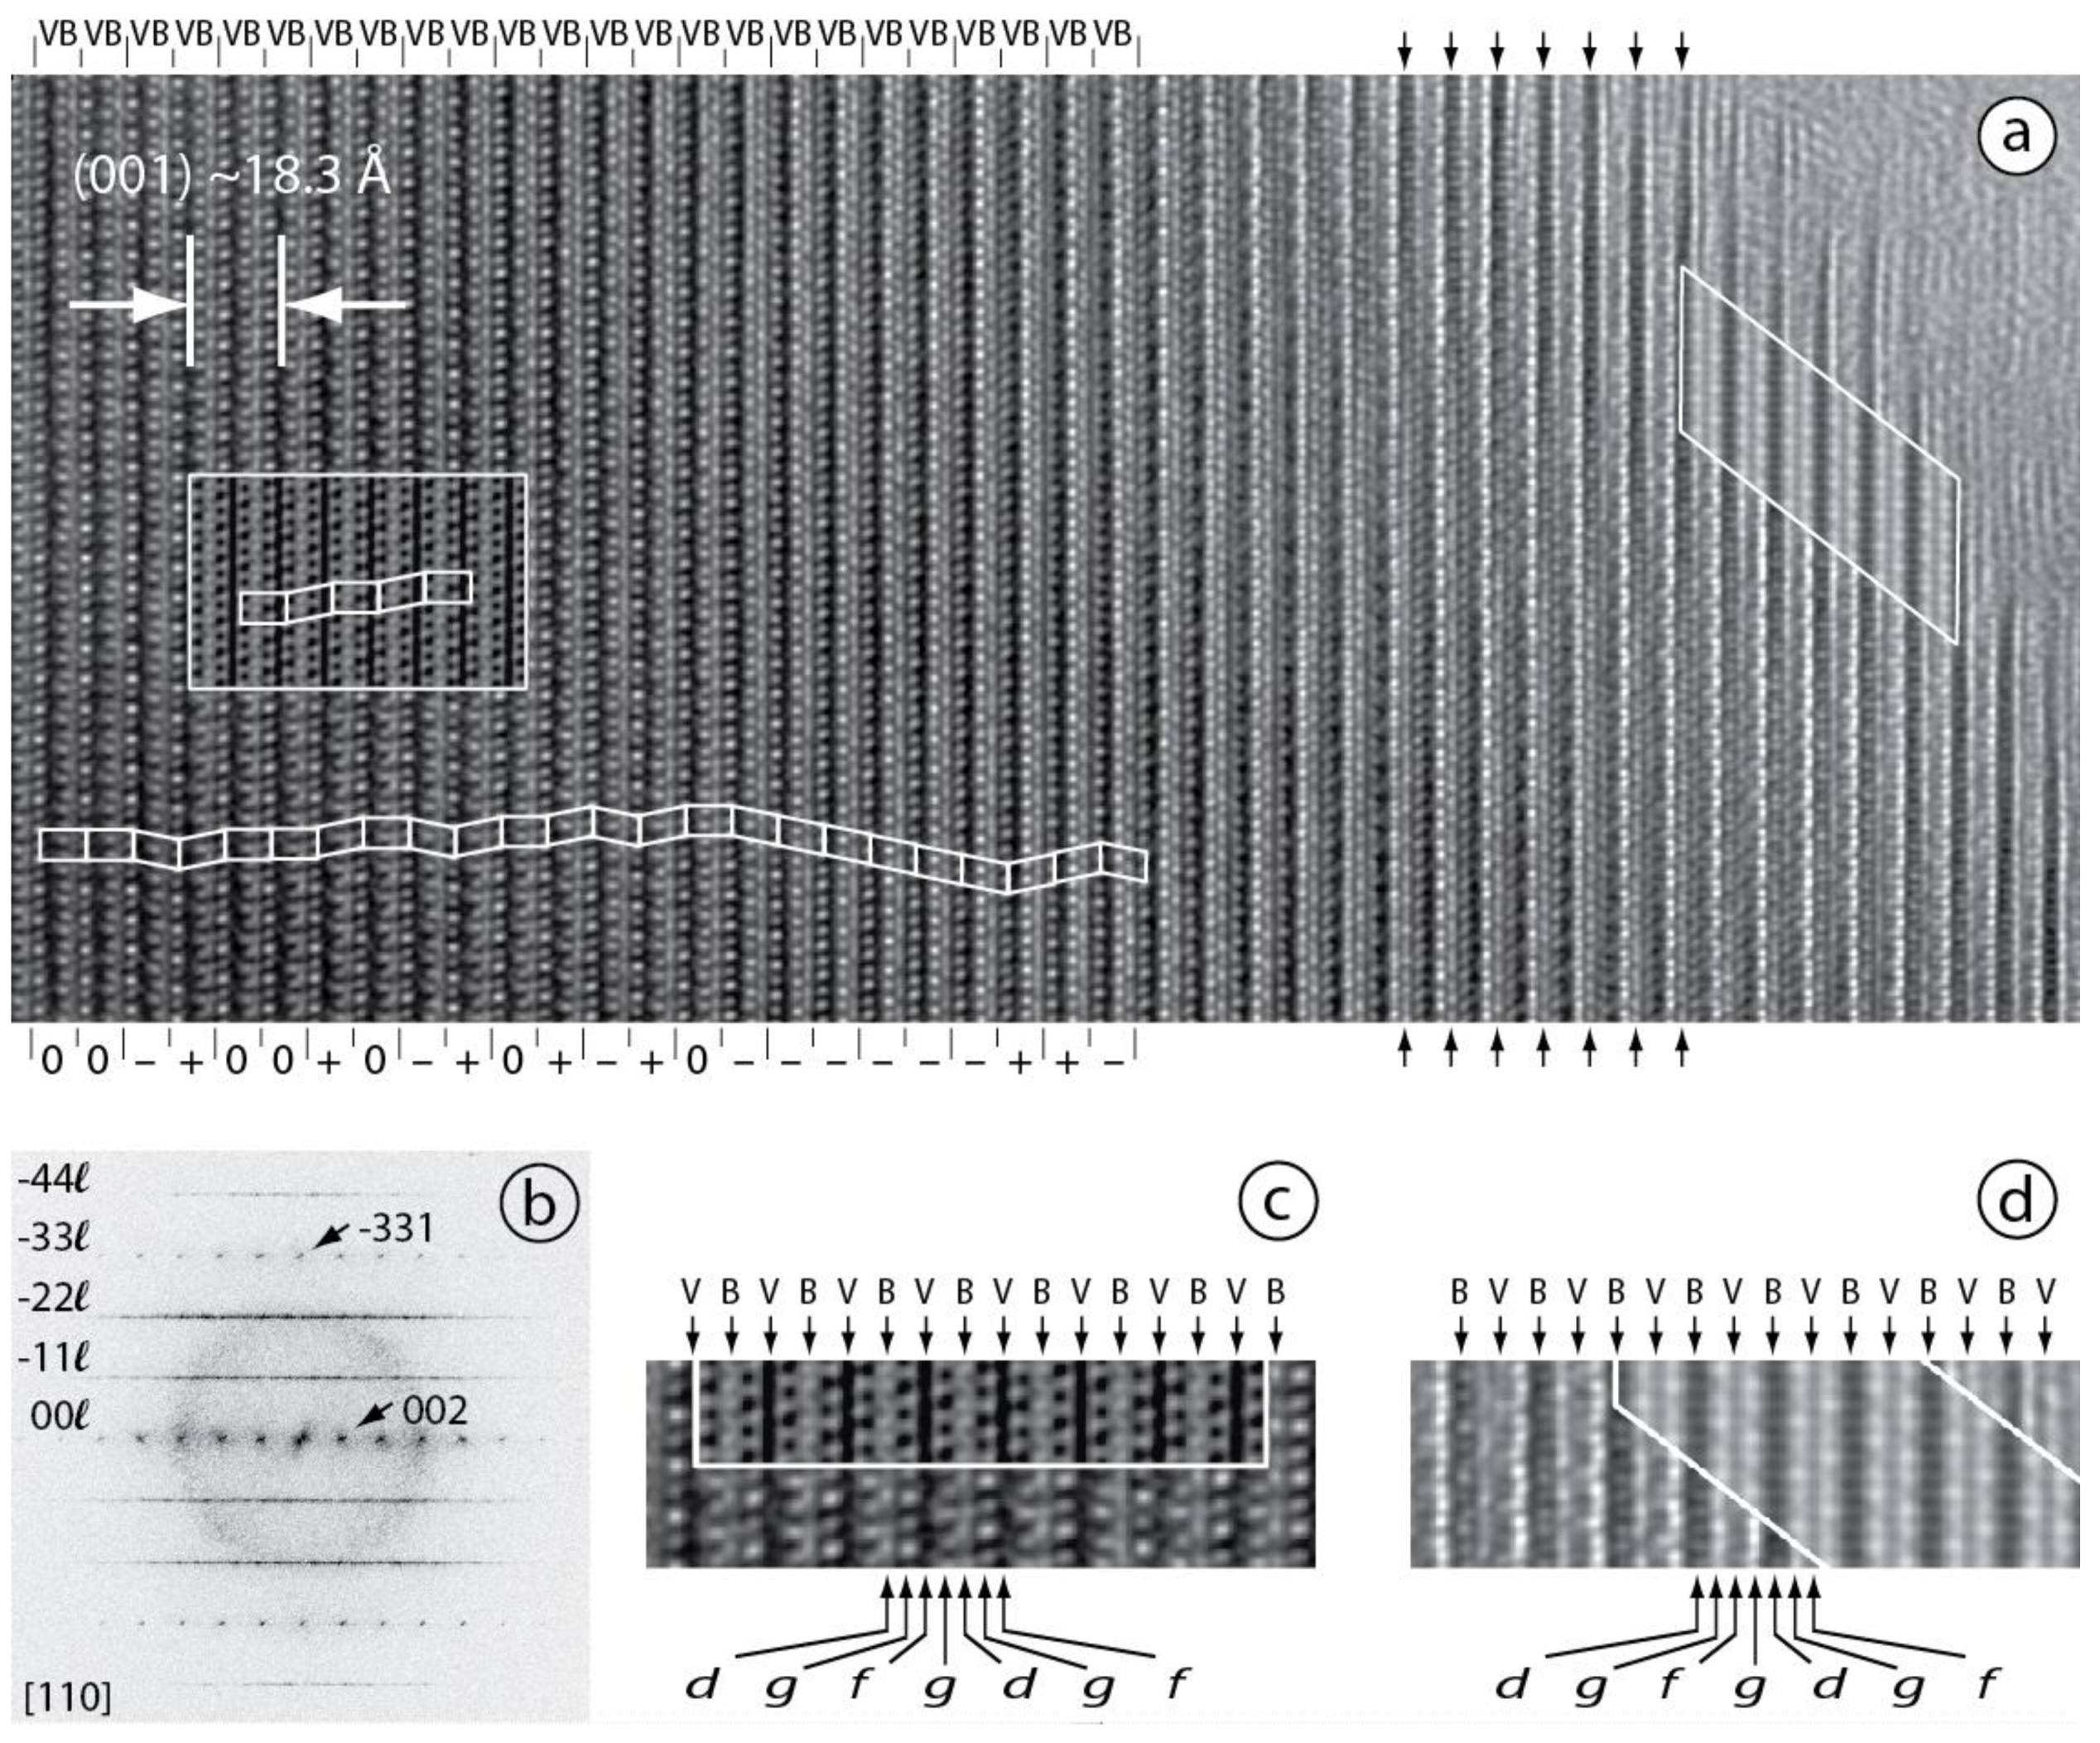
3.3.3. [100] HRTEM Observations

HRTEM images of the 〈100〉 orientation type (hereafter [100] HR images), mostly show a zig-zag contrast which corresponds to a perfectly ordered sequence of synchysite half-cells (repeat unit ~9.1 Å). The zig-zag contrast is caused by the alternating positions of fluorine atoms with respect to Ce atoms in CeF-layers (Figure 8). Two adjoining half-cells determine the actual ~18.3 Å (001) periodicity of synchysite. These observations suggest that: i) most samples are free of polysomatic disorder, and ii) any polytypic disorder, if present, can only have a component along the observation direction. The related SAED pattern, which is an average view of a larger area (in this case ~0.5 µm in diameter), is streak-free (Figure 8b), suggesting that this apparent order is maintained over larger distances than those reproduced in HR images (~70 nm). The HR image above and the related simulation (Figure 8c), reveal that under optimal experimental conditions, i.e., close to Scherzer defocus (35–43 nm) and thin enough crystals (few nm), heavy atoms appear as dark fringes, which are thicker (darker) for CeF-layers (d) than for Ca-layers (f), separated by rows of white dots, corresponding to C-layers (g). Average carbon positions appear offset along b* across the Ca-layers, whereas no shift is seen across the CeF-layers. Unfortunately, this detailed structural information could not be always achieved, because fluorcarbonates have been revealed to be very beam sensitive, and in some cases the samples could not be perfectly oriented.
The only exception to the situation described so far is the presence of sporadic polysomatic faults detected in few [100] HR images. They are revealed by the presence of a thicker dark fringe every four dark fringes, whereas in normal synchysite a thicker dark fringe occurs every five dark fringes (Figure 9). The faulted lamellae measure ~14.1 Å, which is consistent with the lack of a vaterite layer (~4.2 Å) within synchysite (~18.3 Å), therefore transforming the VBVB synchysite sequence into VBB, i.e., a single parisite half-cell. It should be noted, however, that if a bastnäsite layer (~4.9 Å) was missing, instead of a vaterite one, a slightly thinner lamella would have resulted (~13.4 Å), with sequence VVB. The difference involved is probably close to the measuring error. Unfortunately, whereas we can reasonably assume that darker fringes correspond to heavy atoms layers, we cannot confidently distinguish between Ca-layers and CeF-layers, because of the slight misalignment affecting this HR image. Therefore, the actual layer sequence cannot be demonstrated, although on the basis of the measurements, the VBB sequence seems more probable and in line with the belief that adjoining Ca-layers are metastable [18].
In the studied TEM samples, free bastnäsite grains could not be found. Bastnäsite usually forms fine lamellae at synchysite borders with coherent boundaries (Figure 10). Taking into account the poor to impossible distinguishability between certain diffraction patterns reported above, the following crystallographic relationships could be established: [100]Syn//[110]Bas; (001)Syn//(001)Bas; (010)Syn//(110)Bas. A higher frequency of compositional faults consistent with VBB parisite half-cells within VBVB synchysite were observed close to the contact with bastnäsite. The contrast in the HRTEM image shown in Figure 10 is characterized by rows of bright spots ~9.1 Å apart, corresponding to the width of a synchysite half-cell. In several places, the distances between these rows are different from the 9.1 Å periodicity, indicating the presence of compositional faults. The fault in the center, closer to the boundary with bastnäsite, is characterized by a larger distance between neighboring bright fringes, i.e., ~14.1 Å, corresponding to an additional B-layer introduced in the regular VBVB sequence of synchysite, i.e., corresponding to a parasite half-cell. The bright fringes characterizing the faults in the upper part of the image are only ~4.9 Å apart, which corresponds to the width of a B-layer. Despite the difference in contrast, also these faults correspond to additional B-layer in the regular VBVB sequence of synchysite. Indeed, as inferred from the SAED, the crystal is slightly misaligned, causing the two VB synchysite half-cells to be clearly distinguished. Therefore, a possible explanation of the different appearance of the VBB lamellae is that the extra B-layer enters the VBVB sequence in two distinguished half-cells, i.e., VBBVB vs. VBVBB.

3.3.4. [110] HRTEM Observations

Similarly to what has already been reported for parisite-(Ce) [7], synchysite-(Ce) imaged down 〈110〉 shows alternating bright and dark fringes that in the thinnest part of the sample and under conditions close to Scherzer defocus can be assigned to V- and B-layers, respectively (Figure 11). As for parisite-(Ce), V- and B-layers are delimited by rows of white dots that correspond to the C-layers. Whereas any change in the regular sequence of bright and dark fringes indicates the presence of polysomatic disorder, the positions of the white dots, whenever the image has sufficient resolution and is not too severely affected by beam damage, reveal the presence of polytypic disorder, if present. Indeed, polytypism and polytypic disorder in fluorcarbonates arises through the different possibilities to link the vaterite layers with the adjacent bastnäsite layers (s. below), which are revealed in 〈110〉 HRTEM images by the relative positions of the bright dots in adjacent synchysite half-ells. Taking the bright spots as corners of a half-cell, the different stacking possibilities can lead to three different geometries of the half-cells: a rectangular cell (labelled 0 in Figure 11), and two oblique cells, one with a positive slant (+) and the other with a negative slant (−).
HRTEM images of the 〈110〉 orientation type (hereafter [110] HR images), reveal that the order observed along 〈100〉 is only apparent. Whereas the (001) lattice periodicity of ~18.3 Å is constant, the slant of the synchysite half-cells is highly variable (Figure 11). Basically, no ordered sequence larger than few unit cells was observed in these samples. In addition, SAED patterns along this zone are affected by streaks on hhl layers with h ≠ 3n, whereas hhl layers with h = 3n are streak-free (Figure 11b). These observations, in agreement with previous studies [7], indicate diffuse polytypic disorder and absence of polysomatic disorder.

4. Discussion

4.1. Rock Mineral Association

(Ca,REE)-fluorcarbonates from Cinquevalli are hosted in quartz-dikes with granitic texture made of quartz (79.4%), K-feldspar (6.9%), and chalcopyrite (1.4%) as major, primary, constituents. Quartz is present as: i) equant grains intergrown with (Ca,REE)-fluorcarbonates and ii) as in fibrous crystals recalling chalcedony and unrelated to fluorcarbonates. Muscovite (9.5%), possibly overestimated by Rietveld refinement because of (001) preferential orientation, has not been observed by optical or electron microscopy, but in the alteration of K-feldspar as white mica (pinite). Alteration also affects chalcopyrite, which shows an Fe-Cu-oxide rim. Metallic bismuth, detected by SEM-EDS, completes the mineral association.
These observations suggest that the crystallization of the quartz-dikes was a multistage event, at least judging from the two generations of quartz. Chalcedony possibly formed in a later stage under higher undercooling conditions. The graphic texture of the intergrowth between primary quartz and (Ca,REE)-fluorcarbonates suggest a simultaneous crystallization of quartz and fluorcarbonates. The presence of metallic bismuth and chalcopyrite are consistent with a reducing environment during the first stage of crystallization, but the pinite alteration of K-feldspar and the oxide rim wrapping chalcopyrite suggest a late alteration stage under higher oxygen fugacity and in the presence of water.
SEM-EDS analyses reveal that synchysite and bastnäsite are Ce-rich, with significant amounts of La and Nd, lower amounts of Y and Pr, and minor amounts of Sm and Gd. In total, in the REE-oxides amount to ~2.8 wt% of the rock and are confined in fluorcarbonates finely intergrown with quartz. The small concentration and the dispersion within a resilient silicate matrix make this occurrence scarcely interesting for the ore mineral industry.

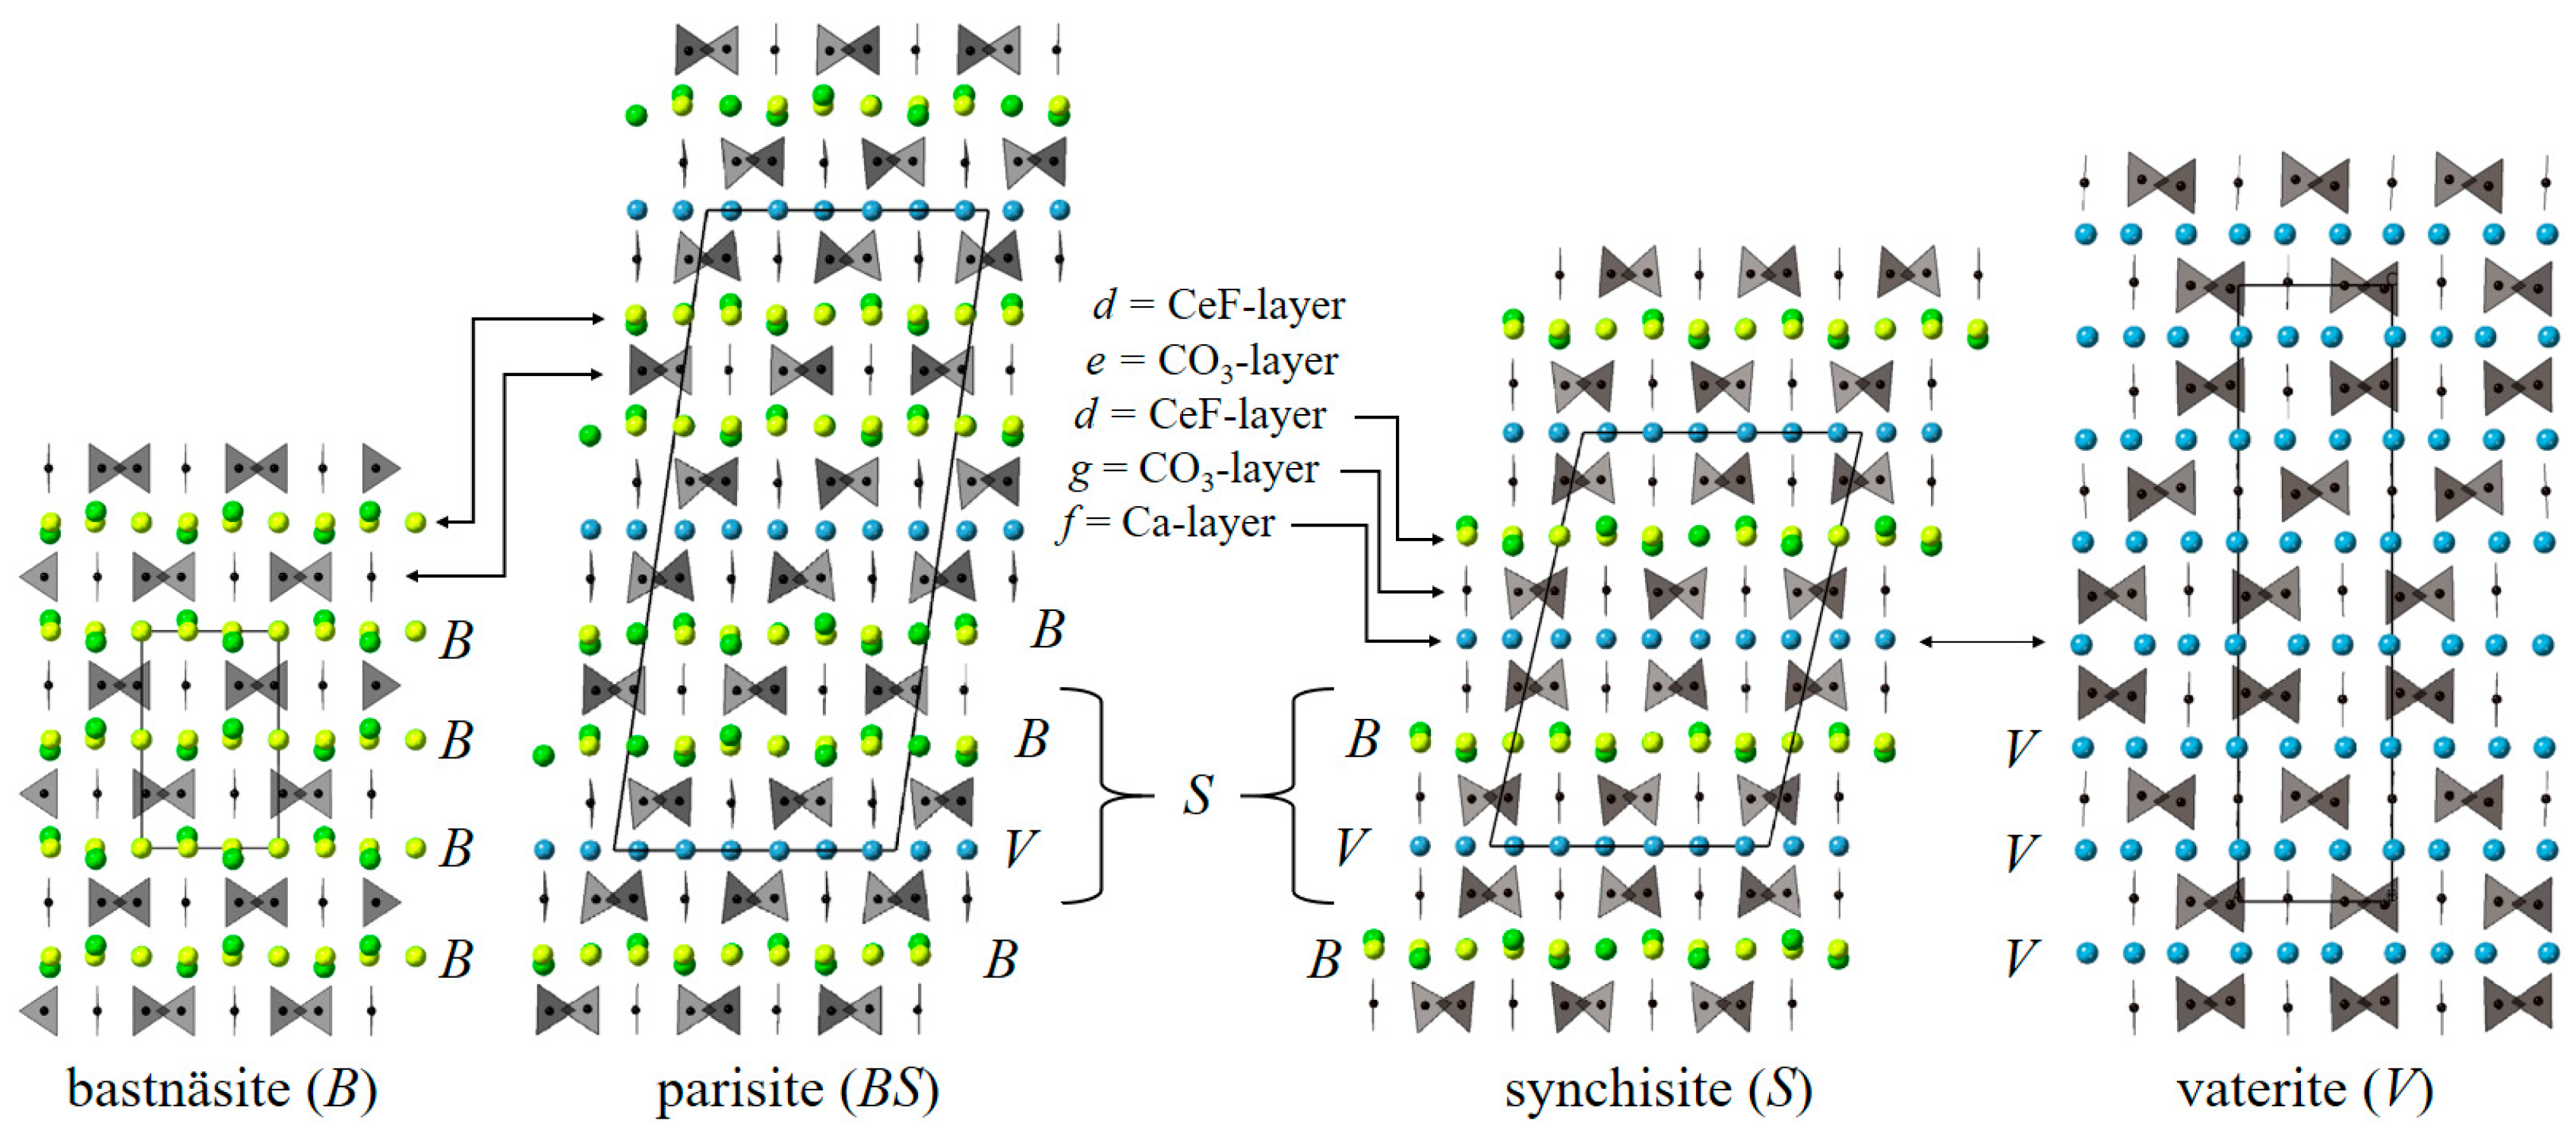
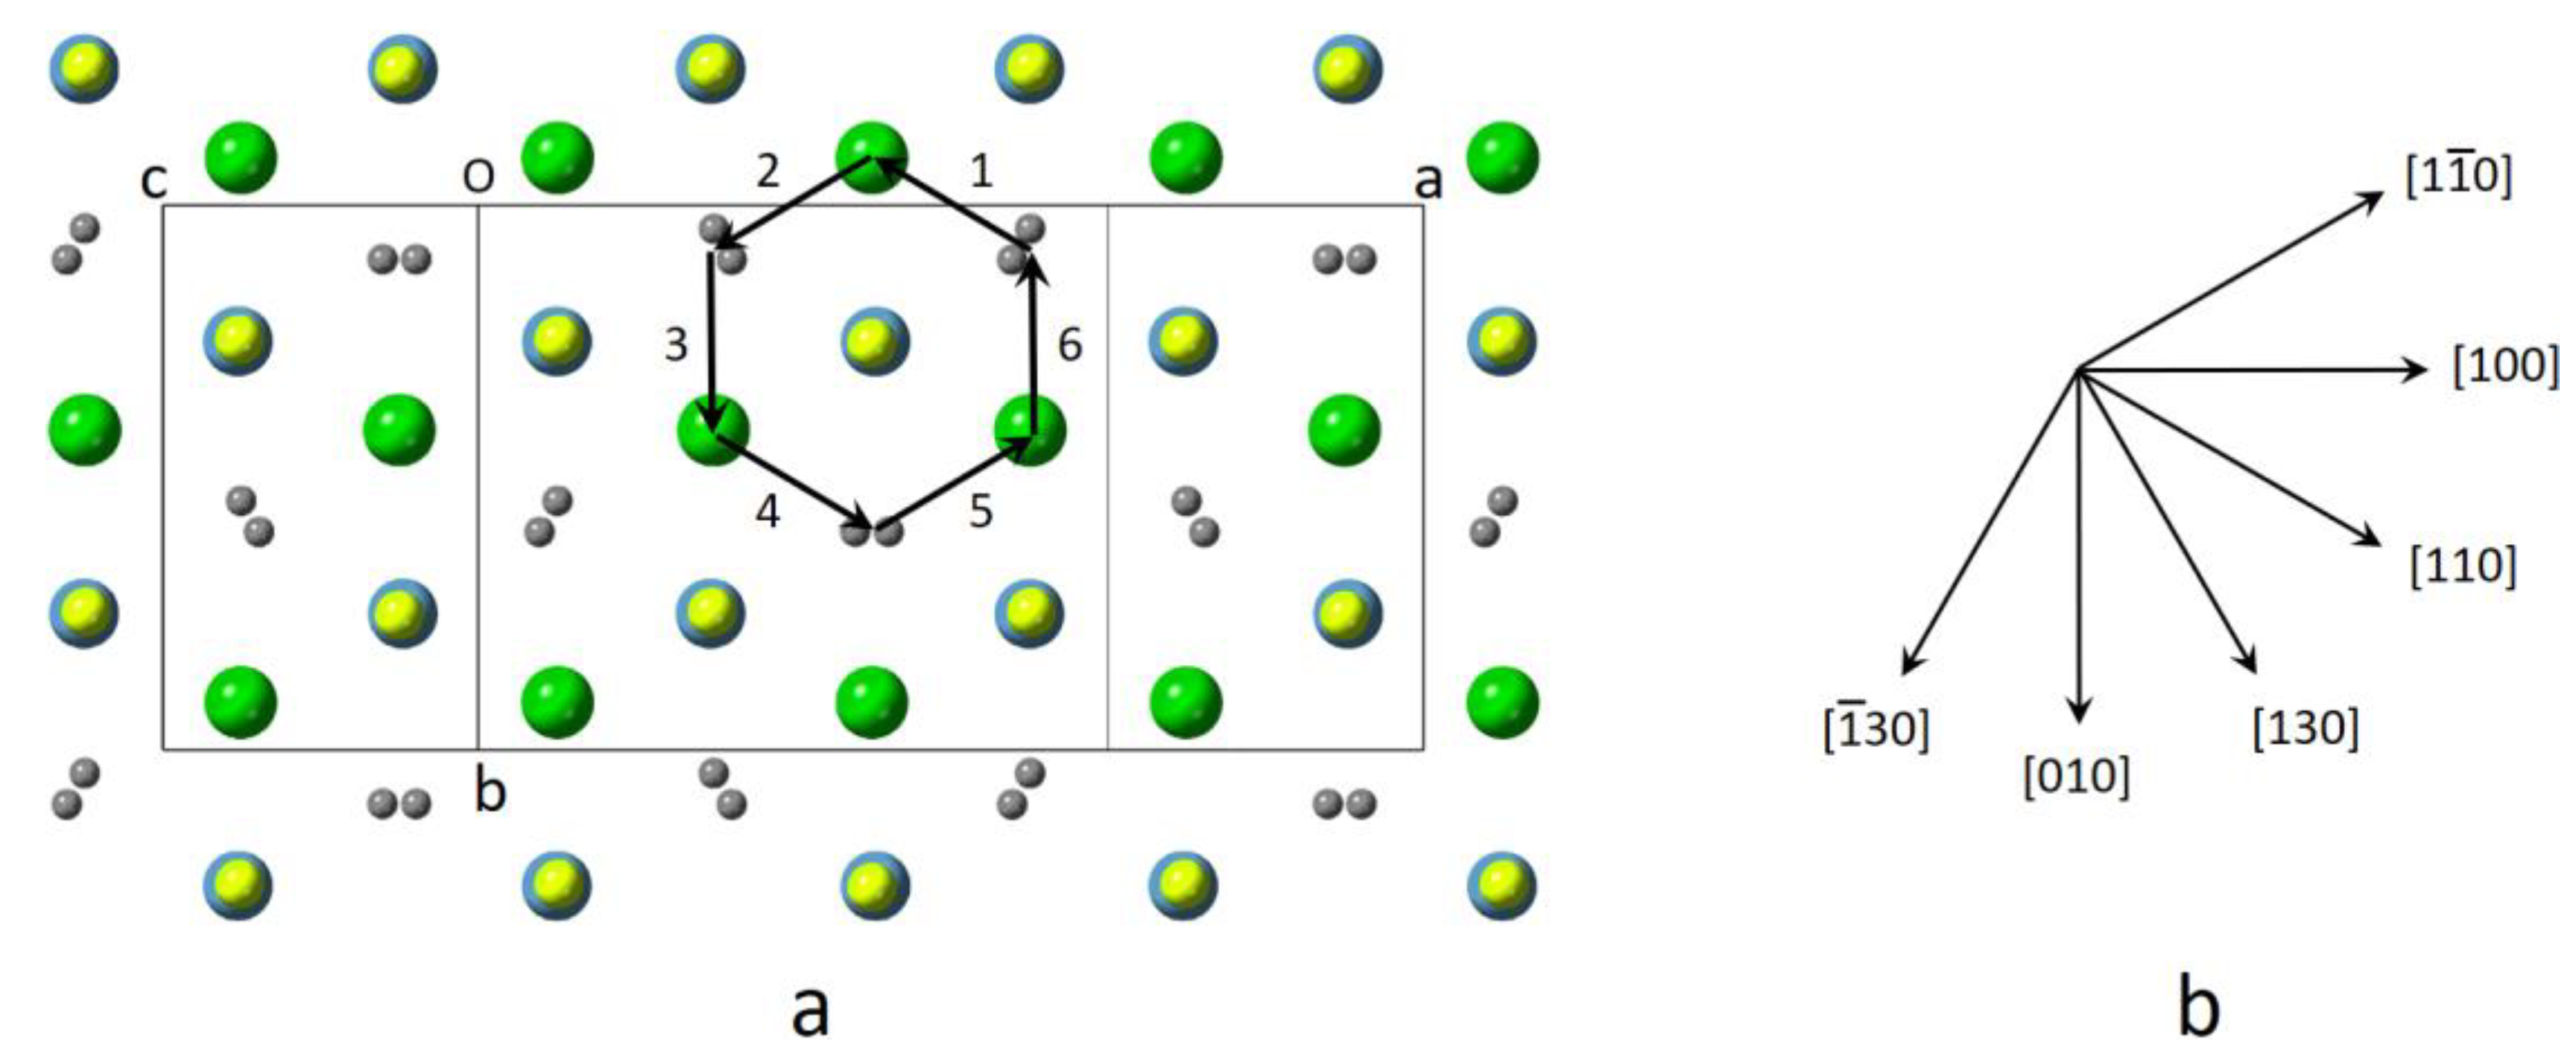
4.2. Polytypism of Synchysite

The crystal structure of synchysite-(Ce) has been refined and described in the C2/c space group [17]. The synchysite structure consists of Ca-layers at z = 0 and z = ½, alternating with CeF-layers at z = ¼ and z = ¾, all separated by intercalated CO3-layers. The heavy atoms form columns of Ca and Ce alternating along c* in a hexagonal stacking, as formerly predicted [16]. To accomplish chemical bonding, the CO3-layers above z = ½ are shifted by ~2.37 Å along [110] and those above z = 1 by another ~2.37 Å along [110] with respect to the position that they should have in bastnäsite, therefore breaking the hexagonal symmetry and leading to monoclinic symmetry. The overall shift of the CO3-layers along a is ~4.11 Å, leading to a monoclinic angle of ~102.7°.
It can be easily realized that the layered structure of the (Ca,REE)-fluorcarbonates is at the origin of syntaxial intergrowths with a theoretically unlimited number of polysomatic and polytypic stacking variants. In the studied samples, polysomatic faults are sporadic, but polytypic disorder is widespread. Basically, no ordered domain, i.e., free of polytypic faults, larger than few unit cells was found. Polytypism results from the insertion of a Ca-layer between bastnäsite portions and the different types of linkages it can form with the bastnäsite portions above and below it [18]. As discussed above, in ordered synchysite-(Ce), the operating stacking vectors between CO3-layers in alternating bastnäsite portions are [110] and [110], respectively, which are related by ±60° rotations (Figure 12). A consistent bonding pattern, however, is also obtained for shifts in the second bastnäsite portion along [010] and [110], which are rotated by –60° and 180°, respectively, from the former shift (i.e., [110]). In contrast, shift directions rotated either 0° or ±120° relative to the first stacking vector (n·60°, n = even) would put the CO3 groups aligned with the heavy atoms columns along c*, impeding a consistent bonding pattern. Therefore, all polytypes and polytypic faults in synchysite-(Ce) are based on n·60° (n = odd) shifts.
The complete set of all possible shifts and how they are recognized in HR images has been derived for parisite [7] and here reproduced for synchysite (Table 4). Such shifts are common to all (Ca,REE)-fluorcarbonates, once a consistent monoclinic unit cell is chosen.
When the structure is seen down [100], the [110] and [110] shifts would appear as –b/6 and +b/6 translations in HR images (Table 4), leading to a zig-zag sequence, as actually observed in Figure 8. Any polytypic departure from the ordered sequence will move the structure towards the allowed [010] shift, if occurring after the [110] one, or [010], if occurring after [110]. Both faults involve translation of b/3. Because of the half-cell periodicity due to the C-centring of the structure, a shift of +b/3 will appear as a –b/6 shift on [100] HR images, and a shift of –b/3 as a +b/6 shift, therefore undistinguishable from the structural changes expected in an ordered sequence. A similar analysis can be done for any of the 〈100〉-type indistinguishable directions.
As can be seen in [110] HRTEM images, synchysite-(Ce) from Cinquevalli is extensively faulted. In [100] HR images, however, these faults cannot be seen, due to the equality between the projected shifts in regularly stacked sequences and in faulted sequences (and not because it has component along the observation direction only as assumed at first glance). When synchysite is observed along [110], the [110] shift, which is collinear with the observation direction, has no component perpendicular to c*, whereas the [110] shift when projected onto the image plane results in a shift component equal to b/3·cos(30°) ~2.05 Å (or a/6) perpendicular to the stacking direction (Figure 12).
Therefore, ordered synchysite should appear in [110] HR images as VB half-cells with alternating “0” and “+” slants (or “0” and “–” slants). This situation is hardly observed in synchysite-(Ce) from Cinquevalli, where random repetitions of “–”, “0” and “+” slants dominate and where ordered regions are no thicker than few unit cells (Figure 11a). Subsequent “0” slants in [110] HR images can be interpreted as stacking vectors related by ± 180° rotations, e.g., vectors 1 and 4 in Figure 12, and alternating “+” and “–” slants as stacking vectors related by ± 180° rotations, e.g., vectors 2 and 5. A similar analysis can be done for any of the 〈110〉-type indistinguishable directions.

4.3. A Brief Comparison with the Polytypism of Mica

The stacking sequence of synchysite-(Ce) is analogous to that of 2:1 mica, such as muscovite, if the CO3-layer is equated to the (Si,Al)O4-layer, the CeF-layer to the AlO5(OH)-layer, and the Ca-layer to the K-layer (interlayer) [17]. Mica polytypes result from the translation of the (Si,Al)O4-layers relative to each other, whereas synchysite polytypes, from the translation of CO3-layers above the Ca-layer.
The six standard mica polytypes (1M, 2M1, 3T, 2M2, 2O and 6H) are classified in subfamily-A polytypes (1M, 2M1 and 3T), characterized by stacking vectors related by n·60° rotations (n = even), and subfamily-B polytypes (2M2, 2O and 6H), characterized by n·60° rotations (n = odd) [30,31]. These basic polytypes along with their stacking vectors and notable examples are reported in Table 5.
Synchysite-(Ce) is characterized by ±60° rotations of subsequent bastnäsite portions above the Ca-layers, therefore can be likened to the 2M2 subfamily-B mica polytype, such as lepidolite, for instance. Hypothetical subfamily-A (Ca,REE)-fluorcarbonates, since entailing rotations of 0 or ±120° that would align the vertical edges of the CO3 triangles above the heavy atoms columns have, as expected, never been observed. In contrast, subfamily-A mica polytypes are even more abundant in nature than subfamily-B mica polytypes. This can be ascribed to the different atomic arrangement in the interlayer. In subfamily-B polytypes, basal tetrahedral oxygens on the adjacent layers are exactly superimposed along the c* direction. In subfamily-A polytypes, these basal oxygens are laterally displaced from each other due to ditrigonal distortion of the tetrahedral rings, thereby reducing the repulsive forces between the oxygens facing across the interlayer and making the structural configuration energetically more favorable [58].
Parisite-(Ce), the other (Ca,REE)-fluorcarbonate whose structure has been refined [18], should be considered again as belonging to the 2M2 polytype, since it is characterized by the same stacking vectors as synchysite-(Ce). Other possible short range (Ca,REE)-fluorcarbonate polytypes should be the 2O and the 6H. The 2O polytype has been observed as a few unit cells repeats at the TEM scale (Figure 11), whereas the 6H has not yet been clearly characterized, not even at the TEM scale.

Funding

This article is an outcome of MIUR Project—Dipartimenti di Eccellenza 2018–2022. The university grant (Fondi di Ateneo) from the University of Milano-Bicocca is also greatly acknowledged. All authors have read and agreed to the published version of the manuscript.

Acknowledgments

Paolo Gentile kindly provided the Cinquevalli samples. Lucia Galimberti carried out EDXRF and XRPD analyses. Simone Suardi prepared the sample and carried out a preliminary characterization of the samples during his bachelor thesis. The manuscript benefits from the revision from two anonymous referees.

Conflicts of Interest

The author declares no conflict of interest.

References

  1. Van Landuyt, J.; Amelinckx, S. Multiple beam direct lattice imaging of new mixed-layer compounds of the bastnäsite-synchysite series. Am. Mineral. 1975, 60, 351–358. [Google Scholar]
  2. Wu, X.; Meng, D.; Pan, Z.; Yang, G. Transmission electron microscope study of new, regular, mixed-layer structures in calcium-rare earth fluorcarbonate minerals. Mineral. Mag. 1998, 62, 55–64. [Google Scholar]
  3. Meng, D.; Wu, X.; Mou, T.; Li, D. Determination of six new polytypes in parisite-(Ce) by means of high-resolution electron microscopy. Mineral. Mag. 2001, 65, 797–806. [Google Scholar]
  4. Meng, D.; Wu, X.; Mou, T.; Li, D. Microstructural investigation of new polytypes of parisite-(Ce) by high-resolution transmission electron microscopy. Can. Mineral. 2001, 39, 1713–1724. [Google Scholar] [CrossRef]
  5. Meng, D.; Wu, X.; Han, Y.; Meng, X. Polytypism and microstructures of the mixed-layer member B2S, CaCe3(CO3)4F3 in the bastnaesite-(Ce)-synchysite-(Ce) series. Earth Planet. Sc. Lett. 2002, 203, 817–828. [Google Scholar] [CrossRef]
  6. Ciobanu, C.L.; Kontonikas-Charos, A.; Slattery, A.; Cook, N.J.; Ehrig, K.; Wade, B.P. Short-range stacking disorder in mixed-layer compounds: A HAADF STEM study of bastnäsite-parisite intergrowths. Minerals 2017, 7, 227. [Google Scholar] [CrossRef] [Green Version]
  7. Capitani, G. HRTEM investigation of bastnäsite–parisite intergrowths from Mount Malosa (Malawi): Ordered sequences, polysomatic faults, polytypic disorder, and a new parisite-(Ce) polymorph. Eur. J. Mineral. 2019, 31, 429–442. [Google Scholar] [CrossRef]
  8. Smith, W.L.; Stone, J.; Ross, D.R.; Levine, H. Doverite, a possible new yttrium fluocarbonate from Dover, Morris County, New Jersey. Am. Mineral. 1960, 45, 92–98. [Google Scholar]
  9. Scharm, B.; Kühn, P. Synchysite-(Nd), Ca(Nd,Y,Gd,...)[F,(CO3)2], a new mineral. Neues Jahrb. Mineral. 1983, 5, 201–210. [Google Scholar]
  10. Wall, F.; Le Bas, M.J.; Srivastava, R.K. Calcite and Carbocernaite Exsolution and Cotectic Textures in a Sr,REE-Rich Carbonatite Dyke from Rajasthan, India. Mineral. Mag. 1993, 57, 495–513. [Google Scholar] [CrossRef]
  11. Forster, H.-J. Synchysite-(Y)-synchysite-(Ce) solid solutions from Markersbach, Erzgebirge, Germany: REE and Th mobility during high-T alteration of highly fractionated aluminous A-type granites. Mineral. Petrol. 2001, 72, 259–280. [Google Scholar] [CrossRef]
  12. Kalatha, S.; Perraki, M.; Economou-Eliopoulos, M.; Mitsis, I. On the origin of bastnaesite-(La,Nd,Y) in the Nissi (Patitira) bauxite laterite deposit, Lokris, Greece. Minerals 2017, 7, 45. [Google Scholar] [CrossRef] [Green Version]
  13. Maksimović, Z.; Pantó, G. Hydroxyl-bastnaesite-(Nd), a new mineral from Montenegro, Yugoslavia. Mineral. Mag. 1985, 49, 717–720. [Google Scholar] [CrossRef] [Green Version]
  14. Michiba, K.; Miyawaki, R.; Minakawa, T.; Terada, Y.; Nakai, I.; Matsubara, S. Crystal structure of hydroxylbastnäsite-(Ce) from Kamihouri, Miyazaki Prefecture, Japan. J. Mineral. Petrol. Sc. 2013, 108, 326–334. [Google Scholar] [CrossRef]
  15. Grice, J.D.; Maisonneuve, V.; Leblanc, M. Natural and synthetic fluoride carbonates. Chem. Rev. 2007, 107, 114–132. [Google Scholar] [CrossRef]
  16. Donnay, G.; Donnay, J.D.H. The crystallography of bastnaesite-(Ce), parisite-(Ce), roentgenite-(Ce) and synchisite-(Ce). Am. Mineral. 1953, 38, 932–963. [Google Scholar]
  17. Wang, L.; Ni, Y.; Hughes, J.M.; Bayliss, P.; Drexler, J.W. The atomic arrangement of synchysite-(Ce), CeCaF(CO3)2. Can. Mineral. 1994, 32, 865–871. [Google Scholar]
  18. Ni, Y.; Post, J.E.; Hughes, J.M. The crystal structure of parisite-(Ce), Ce2CaF2(CO3). Am. Mineral. 2000, 85, 251–258. [Google Scholar] [CrossRef]
  19. Ni, Y.; Hughes, J.M.; Mariano, A.N. The atomic arrangement of bastnäsite-(Ce), Ce(CO3)F, and structural elements of synchysite-(Ce), röntgenite-(Ce), and parisite-(Ce). Am. Mineral. 1993, 78, 415–418. [Google Scholar]
  20. Wang, J.; Becker, U. Structure and carbonate orientation of vaterite (CaCO3). Am. Mineral. 2009, 94, 380–386. [Google Scholar] [CrossRef]
  21. Maiello, F. Molti, diversi per origine, sorprendenti… I minerali del Trentino. Nat. Alp. 2006, 1, 23–52. (In Italian) [Google Scholar]
  22. Autonomous Province of Trento, Environment and Territory Information System. Available online: https://patn.maps.arcgis.com/apps/webappviewer/index.html?id=8e6cda8cc23844c9a6d3484f9bbd20f0 (accessed on 3 December 2019).
  23. Hill, R.J. Expanded use of the Rietveld method in studies of phase abundance in multiphase mixtures. Powder Diffr. 1991, 6, 74–77. [Google Scholar] [CrossRef]
  24. Bish, D.L.; Post, J.E. Quantitative mineralogical analysis using the Rietveld full-pattern fitting method. Am. Mineral. 1993, 78, 932–940. [Google Scholar]
  25. Larson, A.C.; Von Dreele, R.B. General Structure Analysis System (GSAS); Los Alamos National Laboratory Report LAUR 86-748; Los Alamos National Laboratory: Los Alamos, NM, USA, 2004. [Google Scholar]
  26. Kilaas, R. Optimal and near-optimal filters in high-resolution electron microscopy. J. Microsc. 1998, 190, 45–51. [Google Scholar] [CrossRef]
  27. Mitchell, D.R. HRTEM Filter. Digital Micrograph Script Database. Available online: https://www.felmi-zfe.at/dm_script/ (accessed on 6 December 2019).
  28. Stadelmann, P.J. Electron Microscopy Software, Java Version 3.6322U2011; CIME-EPFL: Ecublens, Switzerland, 1999–2011. [Google Scholar]
  29. Cliff, G.; Lorimer, G.W. The quantitative analysis of thin specimens. J. Microsc. 1975, 103, 203–207. [Google Scholar] [CrossRef]
  30. Smith, J.V.; Yoder, H.S. Experimental and theoretical studies of the micas polymorphs. Mineral. Mag. 1956, 31, 209–235. [Google Scholar] [CrossRef]
  31. Bailey, S.W. Crystal chemistry of the true micas. In Micas; Bailey, S.W., Ed.; Reviews in Mineralogy; Mineralogical Society of America: Chantilly, VA, USA, 1984; Volume 13, pp. 13–60. [Google Scholar]
  32. Birle, I.D.; Tettenhorst, R. Refined muscovite structure. Mineral. Mag. 1968, 36, 883–886. [Google Scholar] [CrossRef]
  33. Hazen, R.M.; Burnham, C.W. The crystal structures of one-layer phlogopite and annite. Am. Mineral. 1973, 58, 889–900. [Google Scholar]
  34. Zhoukhlistov, A.P.; Zvyagin, B.B.; Lazarenko, E.K.; Pavlishin, V.I. Refinement of the crystal structure of ferrous celadonite. Sov. Phys. Crystallogr. 1977, 22, 284–288. [Google Scholar]
  35. Backhaus, K.O. Structure refinement of a lepidolite-1M. Cryst. Res. Technol. 1983, 18, 1253–1260. [Google Scholar] [CrossRef]
  36. Joswig, W.; Amthauer, G.; Takeuchi, Y. Neutron diffraction and Mössbauer spectroscopic study of clintonite (xanthophyllite). Am. Mineral. 1986, 71, 1194–1197. [Google Scholar]
  37. Tyrna, P.L.; Guggenheim, S. The crystal structure of norrishite, KLiMn3+2 Si4O12: An oxygen-rich mica. Am. Mineral. 1991, 76, 266–271. [Google Scholar]
  38. Oberti, R.; Ungaretti, L.; Tlili, A.; Smith, D.C.; Robert, J. The crystal structure of preiswerkite. Am. Mineral. 1993, 78, 1290–1298. [Google Scholar]
  39. Evsyunin, V.G.; Kashaev, A.A.; Rastsvetaeva, R.K. Crystal structure of a new representative of Cr micas. Cryst. Rep. 1997, 42, 571–574. [Google Scholar]
  40. Brigatti, M.F.; Lugli, C.; Poppi, L.; Foord, E.E.; Kile, D.E. Crystal chemical variations in Li- and Fe-rich micas from Pikes Peak Batholith (central Colorado). Am. Mineral. 2000, 85, 1275–1286. [Google Scholar] [CrossRef]
  41. Guggenheim, S.; Bailey, S.W. Refinement of the margarite structure in subgroup symmetry. Am. Mineral. 1975, 60, 1023–1029. [Google Scholar]
  42. Sidorenko, O.V.; Zvyagin, B.B.; Soboleva, S.V. Refinement of the crystal structure of 2M1 paragonite by the method of high-voltage electron diffraction. Sov. Phys. Crystallogr. 1977, 22, 554–556. [Google Scholar]
  43. Swanson, T.H.; Bailey, S.W. Redetermination of the lepidolite-2M1 structure. Clays Clay Miner. 1981, 29, 81–90. [Google Scholar] [CrossRef]
  44. Lin, J.-C.; Guggenheim, S. The crystal structure of a Li, Be-rich brittle mica: A dioctahedral-trioctahedral intermediate. Am. Mineral. 1983, 68, 130–142. [Google Scholar]
  45. Gnos, E.; Armbruster, T. Kinoshitalite, Ba(Mg)3(Al2Si2)O10(OH,F)2, a brittle mica from a manganese deposit in Oman: Paragenesis and crystal chemistry. Am. Mineral. 2000, 85, 242–250. [Google Scholar] [CrossRef]
  46. Sidorenko, O.V.; Zvyagin, B.B.; Soboleva, S.V. Crystal structure of 3T paragonite. Sov. Phys. Crystallogr. 1977, 22, 557–559. [Google Scholar]
  47. Brown, B.E. The crystal structure of 3T lepidolite. Am. Mineral. 1978, 63, 332–336. [Google Scholar]
  48. Amisano-Canesi, A.; Chiari, G.; Ferraris, G.; Ivaldi, G.; Soboleva, S.V. Muscovite- and phengite-3T: Crystal strutture and conditions of formation. Eur. J. Mineral. 1994, 6, 489–496. [Google Scholar] [CrossRef]
  49. Levinson, A.A. Studies in the mica group; relationship between polymorphism and composition in the muscovite-lepidolite series. Am. Mineral. 1953, 38, 88–107. [Google Scholar]
  50. Shimoda, S. A hydromuscovite from the Shakanai Mine, Akita Prefecture, Japan. Clays Clay Miner. 1970, 18, 269–274. [Google Scholar] [CrossRef]
  51. Sartori, F. The crystal structure of a 1M lepidolite. Tscher. Miner. Petrog. 1976, 23, 65–75. [Google Scholar] [CrossRef]
  52. Zhoukhlistov, A.P.; Zvyagin, B.B.; Soboleva, S.V.; Fedotov, A.F. The crystal structure of the dioctahedral mica 2M2 determined by high voltage electron diffraction. Clays Clay Miner. 1973, 21, 465–470. [Google Scholar] [CrossRef]
  53. Ni, Y.; Hughes, J.M. The crystal structure of nanpingite-2M2, the Cs end-member of muscovite. Am. Mineral. 1996, 81, 105–110. [Google Scholar] [CrossRef]
  54. Mesto, E.; Scordari, F.; Lacalamita, L.; Schingaro, E. Tobelite and NH4-rich muscovite single crystals from Ordovician Armorican sandstones (Brittany, France): Structure and crystal chemistry. Am. Mineral. 2012, 97, 1460–1468. [Google Scholar] [CrossRef]
  55. Giuseppetti, G.; Tadini, C. The crystal structure of 2O brittle mica: Anandite. Tscher. Miner. Petrog. 1972, 18, 169–184. [Google Scholar] [CrossRef]
  56. Ferraris, G.; Gula, A.; Ivaldi, G.; Nespolo, M.; Sokolova, E.; Uvarova, Y.; Khomyakov, A.P. First structure determination of an MDO-2O mica polytype associated with a 1M polytype. Eur. J. Mineral. 2001, 13, 1013–1023. [Google Scholar] [CrossRef]
  57. Brigatti, M.F.; Guggenheim, S. Mica crystal chemistry and the influence of pressure, temperature, and solid solution on atomistic models. In Micas: Crystal Chemistry and Metamorphic Petrology; Mottana, A., Sassi, F.P., Thompson, J.B., Jr., Guggenheim, S., Eds.; Reviews in Mineralogy and Geochemistry; Mineralogical Society of America: Chantilly, VA, USA, 2002; Volume 46, pp. 1–97. [Google Scholar]
  58. Ferraris, G.; Ivaldi, G. Structural features of micas. In Micas: Crystal Chemistry and Metamorphic Petrology; Mottana, A., Sassi, F.P., Thompson, J.B., Jr., Guggenheim, S., Eds.; Reviews in Mineralogy and Geochemistry; Mineralogical Society of America: Chantilly, VA, USA, 2002; Volume 46, pp. 117–153. [Google Scholar]
Figure 1. Structures of bastnäsite-(Ce) [19], synchysite-(Ce) [17], parisite-(Ce) [18] and vaterite [20], all as seen along [010]. Yellow = Ce, blue = Ca, green = F, black = C. Oxygen atoms at the vertices of triangular CO3 groups are omitted for clarity. Analogous layers in the different structures are connected by arrows and indicated with their relative codes.
Minerals 10 00077 g001
Figure 2. Localization and geological map of the Cinquevalli Mine area (elaborated from the on-line source [22]).
Minerals 10 00077 g002
Figure 3. (a) Representative hand specimen of a (Ca,REE)-fluorcarbonate-bearing rock from Cinquevalli Mine. (Ca,REE)-fluorcarbonates are recognizable by the pale green color. Oxidized chalcopyrite (gold metal luster), quartz (white) and K-feldspar (pink) can also be recognized. The latter, however, is overestimated by visual inspection, because most of the reddish color is due to oxides and hydroxides that alter sulphides. (b) Photomicrograph (plain polarized light; 50X) showing bands of needle-like, randomly oriented crystals of (Ca,REE)-fluorcarbonates (dark) embedded in quartz. (c) Related cross polarized light photomicrograph. (d) Photomicrograph (cross polarized light) of coarse, euhedral K-feldspar (center) altered by white mica and bordered by ribbons of fibrous quartz (chalcedony). Photomicrograph side ~9 mm.
Minerals 10 00077 g003
Figure 4. (a) Backscattered electron (BSE) SEM image of a sample from Cinquevalli showing randomly oriented, needle-like crystals of synchysite-(Ce) (Syn) embedded in quartz (Qtz) and K-feldspar (Kfs). The saw-teeth contact between Qtz and Kfs is marked by a dotted line in the central top part of the image. Rarer aggregates of metallic bismuth (Bi) are also observed. (b) EDS spectrum of the bismuth grain (Bi) imaged in (a) showing the lack of the S peak.
Minerals 10 00077 g004
Figure 5. (a) Large chalcopyrite crystal (Ccp) with a Fe-Cu-oxide reaction rim. (b) Compositional profile along the trace evidenced in (a). Note that how the fine dark rim within the oxide yields a Cu/Fe ratio higher than the surrounding, which conflicts with the darker gray tone, suggesting a (Cu,Fe)-bearing material with a lower average atomic number, possibly an hydroxide.
Minerals 10 00077 g005
Figure 6. (a) SEM-BSE image of fluorcarbonates from Cinquevalli showing elongated crystals of synchysite-(Ce), embedded in quartz (dark gray), with brighter lamellae parallel to the elongation of the crystals near the borders or filling cavities. (b) Line profile along the trace evidenced in (a) crossing two bright lamellae. Note the mutual decrease of Ca and increase of REEs as well as F in the brighter lamellae. Because the spatial resolution of the EDS is larger than the thickness of the lamellae, the EDS spectra of the latter contain always contribution of the surrounding matrix richer in Ca. The thinner the lamella, the higher the matrix contribution, which may explain the higher Ca/REE ratio observed in the thinner lamella.
Minerals 10 00077 g006
Figure 7. First row: kinematic simulations of SAED patterns along [100] (left), which is indistinguishable from 〈130〉, and 〈110〉 (right), which is indistinguishable in case of dynamical scattering from [010] (indexing according to [010]). These patterns alternate every ~30° rotating the crystal around c*. Second row: corresponding experimental images. Note that: i) 00l reflection with l ≠ 2n may be present in experimental images because of dynamical scattering, and ii) the diffuse streaking affecting hhl rows, h ≠ 3n in 〈110〉 patterns.
Minerals 10 00077 g007
Figure 8. Synchysite-(Ce) from Cinquevalli (Trento, Italy): (a) [100] HRTEM image showing a zig-zag contrast of perfectly ordered sequence of synchysite half-cells (~9.1 Å). Every two of them originate the (001) lattice repeat of ~18.3 Å. (b) Related SAED pattern. Consistently with the HR image, it is free of streaks. 00l reflections with l ≠ 2n should be absent by symmetry but are indeed present because of dynamical effects. (c) Enlarged filtered portion of (a) compared with a calculated image (inset; simulation parameters are: defocus = 43 nm; thickness = 1 nm, atomic vibration = 0.05 nm). Atomic positions are indicated by dots: red = Ca; yellow = Ce; green = F; blue = average position of C atoms). Note how Ca-layers (f) and CeF-layers (d) form dark fringes that are separated by rows of white dots, corresponding to C-layers (g). Corresponding vaterite-like (V) and bastnäsite-like (B) layers are also indicated. Under optimal experimental conditions, Ce-layers form thicker fringes than Ca-layers; moreover, the average positions of white dots related to carbon atoms is offset along b* across the Ca-layers, whereas no shift is seen across the CeF-layers.
Minerals 10 00077 g008
Figure 9. [100] HR image of synchysite showing two polysomatic faults (arrows). The measured width is ~14.1 Å, consistent with a single parisite half-cell with sequence VBB, within VBVB synchysite with (001) repeat distance ~18.3 Å. Inset filtered region.
Minerals 10 00077 g009
Figure 10. [100] HRTEM image of synchysite (Syn) with an overgrowth of bastnäsite (Bas) along with the SAED pattern of synchysite (inset). According to the high resolution image (enlarged filtered image of the squared region in the lower right side) bastnäsite is oriented along [110]. Synchysite shows some polysomatic faults (arrows). The measured ~14.1 Å width is consistent with a VBB lamella within VBVB synchysite (~18.3 Å). The narrow faults present in the upper region measure ~4.9 Å, which is consistent with an extra B-layer within VBVB synchysite, therefore also these faults correspond to VBB sequences within synchysite (for explanation see text).
Minerals 10 00077 g010
Figure 11. (a) Filtered [110] HRTEM image of synchysite-(Ce) from Cinquevalli. (b) Related FFT pattern. The latter shows distinct reflections along hhl rows with h = 3n, and severely streaked hhl rows with h ≠ 3n, indicating absence of polysomatic disorder and extensive polytypic disorder. Consistently, the HR image shows (002) half-cells with varying slants, but constant interplanar distance (lower left). Therefore, the VBVB sequence is maintained throughout the crystal, as well as the composition, but the relative orientation of the VB-layers within the sequence may be different from cell to cell. The white boxes in (a) include simulations for two different thickness and defocus conditions, which are in part reproduced and magnified in (c) (thickness = 15 nm, defocus = 43 nm, atomic vibrations = 0.05 nm) and (d) (thickness = 3.5 nm, defocus = 45 nm, atomic vibrations = 0.09 nm), respectively. Although disordered and affected by beam damage, the HR images allow recognition of vaterite (V) and bastnäsite (B) layers as alternating bright and dark fringes. Note, however, as dark and bright fringes invert contrast with increasing thickness of the thin foil (top and bottom arrows in (a) are aligned vertically).
Minerals 10 00077 g011
Figure 12. (a) Projection on (001) of a fgdg-layer of synchysite-(Ce) showing the allowed shifts related by 60° rotations (1 to 6) of the carbonate-layer (arrows). Filled circles indicate atom positions (green = F; blue = Ca; yellow = Ce; grey = C) and solid lines the monoclinic unit cell. (b) Drawing of the main crystallographic directions along which fluorcarbonates are commonly observed by HRTEM. Note that, depending on the observation direction, on the image plane (perpendicular to it) a given shift may have a component equal to b/3 (~2.37 Å); b/3·cos(30°) (~2.05 Å, or a/6); or b/3·cos(60°) (~1.18 Å or b/6); or 0 (summary in Table 4).
Minerals 10 00077 g012
Table 1. EDXRF Bulk Composition (wt%) of a Representative Fluorcarbonate-Bearing Quartz Dike Sample.
MgO0.12Rb2O0.01
Al2O37.68Y2O30.15
SiO274.62SnO20.01
P2O50.04La2O30.76
SO32.35CeO21.28
K2O3.39Nd2O30.65
CaO0.70PbO0.25
TiO20.08Bi2O30.04
Fe2O33.57LOI2.64
CuO1.47Tot.99.8
Table 2. Composition of (Ca,REE)-Fluorcarbonates from Cinquevalli (Trento, Italy). Atoms Calculated on the Basis of Two Cations in the Chemical Formula. Relative Error in Brackets (Values in Italics when Below 2σ).
1 2 3 Mean 4 5 6 7 8 9 Mean
SynSynSynSynMixBasBasBasBasBasBas
F0.539(17)0.656(18)0.546(16)0.580(17)0.642(19)1.283(23)1.652(25)1.648(24)1.507(24)1.390(23)1.496(24)
Ca0.987(9)0.987(9)1.012(9)0.996(9)0.754(9)0.168(7)0.098(6)0.063(6)0.144(6)0.080(6)0.111(6)
Y0.061(5)0.082(5)0.079(5)0.074(5)0.094(5)0.114(7)0.136(7)0.109(7)0.104(7)0.109(7)0.114(7)
La0.273(6)0.263(6)0.255(6)0.264(6)0.322(7)0.475(9)0.496(9)0.520(9)0.496(9)0.505(9)0.498(9)
Ce0.431(7)0.422(7)0.421(7)0.425(7)0.468(8)0.704(10)0.751(11)0.666(10)0.659(10)0.662(10)0.688(10)
Pr0.036(5)0.046(5)0.038(4)0.040(5)0.046(5)0.075(7)0.063(7)0.083(7)0.087(6)0.075(7)0.077(7)
Nd0.181(6)0.163(5)0.158(5)0.167(5)0.237(6)0.303(8)0.319(8)0.348(8)0.328(8)0.355(8)0.331(8)
Sm0.017(5)0.021(5)0.020(4)0.019(5)0.024(5)0.033(7)0.036(7)0.038(7)0.037(7)0.035(7)0.036(7)
Gd0.009(5)0.016(5)0.018(5)0.014(5)0.023(5)0.024(7)0.006(7)0.021(7)0.012(7)0.006(7)0.014(7)
Pb0.004(3)- - - 0.033(3)0.104(4)0.094(4)0.152(5)0.134(4)0.174(5)0.132(4)
ΣREE1.009 1.013 0.988 1.003 1.214 1.728 1.808 1.785 1.722 1.746 1.758
Ca/Ca + REE0.49 0.49 0.51 0.50 0.38 0.09 0.05 0.03 0.08 0.04 0.06
Table 3. TEM-EDS Analysis of (Ca,REE)-Fluorcarbonates from Cinquevalli (Trento, Italy). Each Column Refers to a Single Grain (if not a Single Spot Analysis, the Number of Averaged Analyses is Indicated in Brackets). Atoms are Calculated on the Basis of Two Cations in the Chemical Formula. Relative Error in Brackets (Values in Italics when Below 2σ).
1(3)2(3)3(3)4(3)5(3)6(4)7(2)89101112
SynSynSynSynSynSynSynSynBasBasBasBas
Ca1.05(4)0.98(6)1.08(7)0.96(3)1.10(3)1.01(7)1.00(5)1.04(7)0.18(7)0.14(4)0.19(5)0.20(2)
Y0.05(1)0.03(1)0.06(2)0.05(1)0.04(1)0.04(2)0.02(2)0.03(2)0.13(8)0.11(5)0.14(5)0.13(2)
La0.27(2)0.27(3)0.25(3)0.30(2)0.26(1)0.29(4)0.31(3)0.28(4)0.52(15)0.43(9)0.48(10)0.47(3)
Ce0.45(2)0.47(4)0.41(4)0.49(2)0.42(1)0.48(4)0.49(3)0.48(4)0.80(17)0.80(10)0.94(10)0.79(3)
Nd0.18(2)0.24(3)0.20(3)0.19(1)0.19(1)0.18(3)0.19(3)0.17(3)0.37(13)0.40(8)0.24(8)0.34(3)
Pb- - - - - - - - - 0.12(3)- 0.08(1)
Ca/Ca + REE0.53 0.49 0.54 0.48 0.55 0.51 0.50 0.52 0.09 0.07 0.10 0.10
Table 4. Shift Magnitude on the (001) Plane of the Carbonate-Layer in (Ca,REE)-Fluorcarbonates as Function of Both the Operating Stacking Vector (First Row) and of The Observation Direction (Left Column). The Minus Sign Indicates that the Shift Has a Component Along the Negative Semi-Axis of the Monoclinic Unit Cell.
[110] (1) [110] (2) [010] (3) [110] (4) [110] (5) [010] (6)
[110]a/60a/6a/60a/6
[100]b/6b/6b/3b/6b/6b/3
[110]0a/6a/60a/6a/6
[130]b/6b/3b/6b/6b/3b/6
[010]a/6a/60a/6a/60
[130]b/3b/6b/6b/3b/6b/6
Table 5. Comparison Between Mica and (Ca,REE)-Fluorcarbonate Polytypes.
Polytype SymbolVector RotationsSymbolic ChartsNotable Examples
Micas *(Ca,REE)-Fluorcarbonates
1M Minerals 10 00077 i001Muscovite [32]; Phlogopite [33]
Annite [33]; Celadonite [34]
Polylithionite [35]; Clintonite [36]
Norrishite [37]; Preiswerkite [38]
Chromophyllite [39]; Siderophyllite [40]
Should not be possible
2M1± 120° Minerals 10 00077 i002Margarite [41]; Paragonite [42]
Polylithionite [43]; Bityite [44]
Kinoshitalite [45]
Should not be possible
3T+ 120° Minerals 10 00077 i003Paragonite [46]
Polylithionite [47]
Muscovite [48]
Should not be possible
2M2± 60° Minerals 10 00077 i004Lepidolite [49]; Illite [50]
Polylithionite [51]; Muscovite [52]
Nanpingite [53]; Tobelite [54]
Synchysite-(Ce) [17]
Parisite-(Ce) [18]
2O± 180° Minerals 10 00077 i005Anandite [55]
Phlogopite [56]
Possible, few unit cells observed at the TEM scale (this work, Figure 11).
6H+60° Minerals 10 00077 i006Possible, but never observed as ordered single crystal.Possible, should have a “0 + − 0 − + 0” sequence on [110] HR images, not found yet.
* For a comprehensive review of mica-polytypes see Reference [57].

