Article

Pore Structure and Fractal Characteristics of Different Shale Lithofacies in the Dalong Formation in the Western Area of the Lower Yangtze Platform

1
School of Energy and Resources, China University of Geosciences (Beijing), Beijing 100083, China
2
Key Laboratory of Strategy Evaluation for Shale Gas, Ministry of Land and Resources, Beijing 100083, China
3
Wuxi Research Institute of Petroleum Geology, RIPEP, SINOPEC, Wuxi 214126, China
4
State Key Laboratory of Shale Oil and Gas Accumulation Mechanism and Effective Development, Wuxi 214126, China
5
Nanjing Geological Survey Center of China Geological Survey, Nanjing 210061, China
6
School of Earth Sciences and Engineering, Xi’an Shiyou University, Xi’an 710065, China
7
Key Laboratory of Tectonics and Petroleum Resources, Ministry of Education, China University of Geosciences (Wuhan), Wuhan 430074, China
*
Author to whom correspondence should be addressed.
Minerals 2020, 10(1), 72; https://doi.org/10.3390/min10010072
Submission received: 25 November 2019 / Revised: 8 January 2020 / Accepted: 14 January 2020 / Published: 16 January 2020

Abstract

:
The purpose of this article was to quantitatively investigate the pore structure and fractal characteristics of different lithofacies in the upper Permian Dalong Formation marine shale. Shale samples in this study were collected from well GD1 in the Lower Yangtze region for mineral composition, X-ray diffraction (XRD), and nitrogen adsorption–desorption analysis, as well as broad-ion beam scanning electron microscopy (BIB-SEM) observation. Experimental results showed that the TOC (total organic carbon) content and vitrinite reflectance (Ro) of the investigated shale samples were in the ranges 1.18–6.45% and 1.15–1.29%, respectively, showing that the Dalong Formation shale was in the mature stage. XRD results showed that the Dalong Formation shale was dominated by quartz ranging from 38.4% to 54.3%, followed by clay minerals in the range 31.7–37.5%, along with carbonate minerals (calcite and dolomite), with an average value of 9.6%. Based on the mineral compositions of the studied samples, the Dalong Formation shale can be divided into two types of lithofacies, namely siliceous shale facies and clay–siliceous mixed shale facies. In siliceous shale facies, which were mainly composed of organic pores, the surface area (SA) and pore volume (PV) were in the range of 5.20–10.91 m2/g and 0.035–0.046 cm3/g, respectively. Meanwhile, the pore size distribution (PSD) and fractal dimensions were in the range 14.2–26.1 nm and 2.511–2.609, respectively. I/S (illite-smectite mixed clay) was positively correlated with SA, PV, and fractal dimensions, while illite had a negative relationship with SA, PV, and fractal dimensions. I/S had a strong catalytic effect on organic matter for hydrocarbon generation, which was beneficial to the development of organic micropores, so I/S was conducive to pore structure complexity and the increase in SA and PV, while illite easily filled organic pores, which was not beneficial to the improvement of pore space. In clay–siliceous mixed shale facies, which mainly develop inorganic pores such as intergranular pores, SA and PV were in the range of 6.71–11.38 m2/g and 0.030–0.041 cm3/g, respectively. Meanwhile, PSD and fractal dimensions were in the range of 14.3–18.9 nm and 2.563–2.619, respectively. Quartz and I/S showed weak positive correlations with SA, PV, and fractal dimensions. The various compact modes between quartz particles and the disorder of I/S were conducive to the complexity of pore structure and the improvement of SA and PV. The research findings can provide a reference for the optimization and evaluation of shale gas favorable area of the Lower Yangtze Platform.

1. Introduction

Shale gas, as one type of unconventional natural gas resource which is generated and stored in organic-rich shale, has become an important direction of work on exploration and development around the world in recent years. Different from conventional natural gas resources, shale gas can be preserved as free gas in nanopores and micro-fractures, adsorbed gas on the surface of organic matter (OM), and clay minerals, and dissolved gas in oil, water, or kerogens [1,2]. Meanwhile, organic-rich shale has a complicated nanoscale pore system and consists of a large number of nanopores, which seriously influence the gas storage-flow behavior and, in some ways, affect the store capacity of hydrocarbons [3,4,5]. Therefore, it is important to study the pore structure in shale reservoirs, such as surface area (SA), pore volume (PV), pore size distribution (PSD), and fractal dimensions [3,4,5,6,7].
In recent decades, several researchers achieved progress in developing testing methods for shale reservoir evaluation, which can provide a good opportunity for us to study the shale pore structure. The occurrence of advanced 2/3D imaging techniques, such as combined broad ion beam-milling and scanning electron microscopy (BIB-SEM), can support the qualitative visualization of nanoscale pores in shales to characterize pore types and development [8,9,10,11,12]. Furthermore, quantitative measurement of the shale pore structure parameters, including SA, PV, and PSD, is mainly obtained using a low-pressure gas adsorption and mercury injection technique [3,11,13,14,15,16,17,18,19,20]. Among them, nitrogen gas adsorption has been proven to be an effective method to calculate shale pore structure parameters. Moreover, fractal dimension has been extensively used to describe the irregularities of shale pore structure in recent years [21,22,23,24,25,26]. The fractal Frenkel–Halsey–Hill (FHH) model and the thermodynamic method are common means to calculate fractal dimensions [27], and the FHH model seems to be the better one.
Previous studies have shown that although the sedimentary background, compaction process, and mineral composition of different shale lithofacies are quite different, the pore type classification is almost certain. Pore types can be divided into pores associated with OM, clay minerals, and brittle minerals [8,10,28]. The organic pores, which often occur in highly mature shale, are usually believed to be generated due to the expulsion of hydrocarbons [28,29,30,31]. Pores associated with clay minerals include intra-aggregate pores and interlayer pores. Pores associated with brittle minerals mainly consist of inter-crystalline pores, intergranular pores, and dissolution pores. It needs to be emphasized that the development degree of each kind of pores would decrease due to compaction, especially in the late stage of diagenesis [28,32,33].
For a long time, shale gas exploration and development in southern China has been mainly concentrated in the Upper Yangtze Platform and has seen great success [34,35,36]. However, the exploration work in the Lower Yangtze Platform has not experienced a breakthrough. In recent years, shale gas exploration in the Lower Yangtze region has received much more attention. The implementation of several shale gas exploration wells and a series of basic researches has shown that the upper Permian shale in the Lower Yangtze region has good conditions for shale oil and gas accumulation and considerable gas bearing property [37]. The high brittle mineral content in the region is conducive to the later fracturing development [38]. The upper Permian Dalong Formation organic-rich shale has high organic carbon content and middle organic matter maturity. Furthermore, some publications reported that shale gas content in the Dalong Formation is around 0.5–1.2 m3/t, and the methane content of shale gas can reach or exceed 80% [39]. Therefore, these elements determine that the Dalong Formation is the key target for shale gas exploration in the Lower Yangtze Platform. However, the lack of understanding of pore structures has seriously hindered the exploration and development of shale gas in the region.
The purpose of this paper was to attempt to identify the characteristics of pore structure and the fractal dimension of different lithofacies in the upper Permian Dalong Formation marine shale using the nitrogen adsorption–desorption method. The results can provide some suggestions for the exploration of marine shale gas reservoirs in this region.

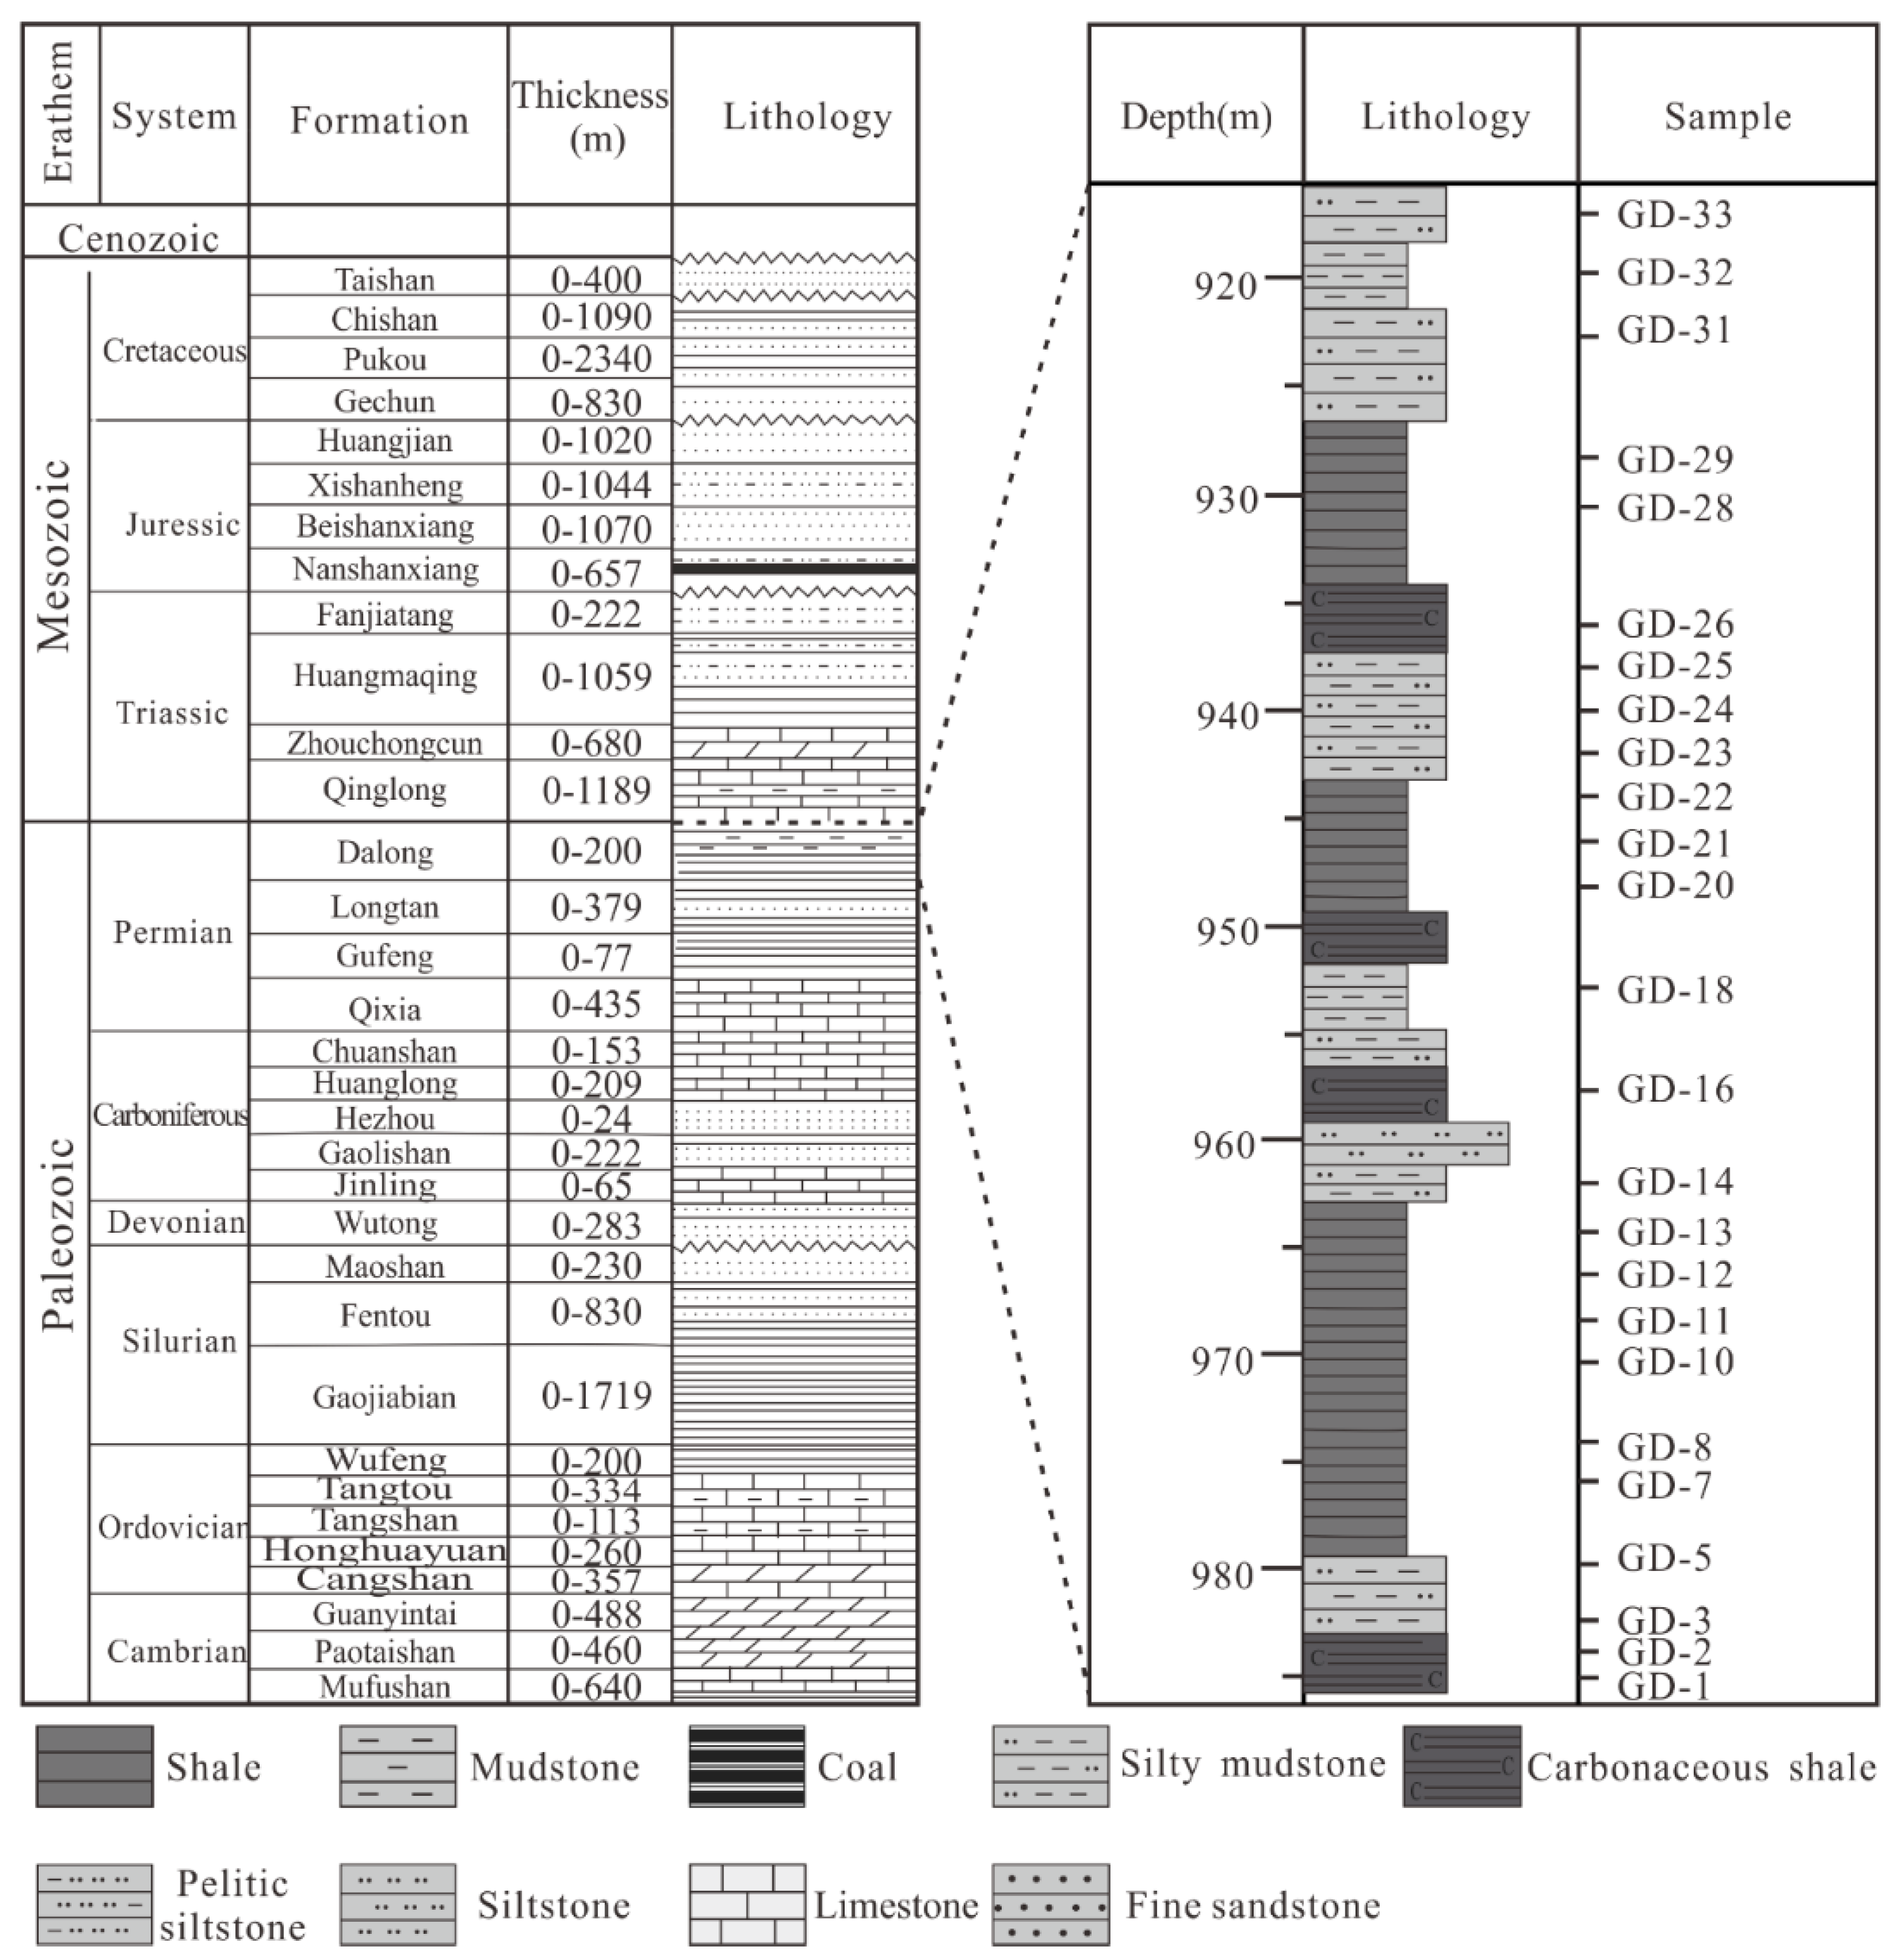
2. Geological Setting

The Lower Yangtze region is bounded by the Tanlu fault zone on the northwest, the Qinling-Dabie mountain tectonic zone on the west, and the Jiangshao fault zone on the southeast. The structures are mainly distributed in the northeast–southwest direction [40,41]. The large-scale left-handling of the Tanlu fault zone staggers the Qinling-Dabie orogenic belt and the Jiaonan orogenic belt. From north to south, the Lower Yangtze region can be divided into six secondary structural units, namely the Jiaonan orogenic belt, the Chuquan depression, the Yanjiang depression, the southern Anhui-southern Jiangsu depression, the Jiangnan uplift belt, and the Qiantang depression (Figure 1).
The Lower Yangtze Platform has undergone several tectonic movements and changes in sedimentary environments, which can be roughly divided into three stages of evolution: The marine sedimentary period from Sinian to Middle Triassic, the continental sedimentary period from Late Triassic to Early Cretaceous, and the structural transformation period from late Cretaceous to Cenozoic. The Lower Yangtze platform was uplifted and denuded, which resulted in the denudation of Mesozoic strata. During the marine sedimentary stage of Permian, part of the marine-continental transitional facies was included. The Lower Yangtze region developed three sets of organic-rich shale formations, including the lower Cambrian Huangbailing Formation ( ϵ 1 h ), the upper Ordovician Wufeng Formation (O3w), the lower Silurian Gaojiabian Formation (S1g), the middle Permian Gufeng Formation (P1g), the upper Longtan Formation (P2l), and the upper Dalong Formation (P3d), which are important sources of shale gas in this region. A simplified stratigraphic column of this area is shown in Figure 2.
Permian is widely distributed in the study area and relatively well-preserved, with a total thickness of 500–1000 m. It is in conformable contact with the underlying Carboniferous system and in parallel unconformity contact with the overlying Triassic system. It is divided into the Qixia Formation, the Gufeng Formation, the Longtan Formation, and the Dalong Formation from bottom to top. The Qixia Formation mainly develops dark gray/grayish black micrite and calcareous mudstone, while the Gufeng Formation is mainly composed of grayish black/black mudstone with a thickness of black shale about 30–60 m. The Longtan Formation is mainly composed of marine-continental transitional facies, with grayish black mudstone, carbon mudstone, and coal seam developed. Black shale is generally 100–200 m thick. The Dalong formation and Longtan formation are closely related to one another and mainly consist of black siliceous shale. The thickness of black shale is about 20–50 m, which thins from east to west in the study area (Figure 2).

3. Samples and Methods

Shale samples at a depth of 917 m to 984 m collected from the GD1 well in the Lower Yangtze region were tested for organic geochemical features, mineral composition, and pore structure. Three main experiments were used, namely X-ray diffraction (XRD), N2 adsorption–desorption, and BIB-SEM.
We tested these samples for microscopic composition under the Chinese Oil and Gas Industry Standard SY/T 5125 (2014) [42]. With the help of a LECO CS230 carbon/sulfur analyzer produced by LECO Company (St. Joseph, MI, USA) in the Beijing Research Institute of Uranium Geology, the total organic carbon (TOC) was obtained following the Chinese National Standard GB/T19145-2003 [43]. Before the analysis, all the powdered samples were prepared with HCl at 60 °C for 24 h to remove carbonate minerals, and then washed with distilled water to remove the HCl. The vitrinite reflectance (Ro) of the samples were measured through a reflecting light microscope with oil immersion subjected to the Chinese Oil and Gas Industry Standard SY/T 5124 (2012) [44] in the State Key Laboratory of Heavy Oil Processing, China University of Petroleum, Beijing, China.
Mineral compositions were measured by X-ray diffraction (XRD) adhering to the Chinese Oil and Gas Industry Standard SY/T5163 (2018) [45], which were tested in the Beijing Research Institute of Uranium Geology, Beijing, China. Our samples were crushed to less than 40 μm to completely disperse the minerals. The samples were scanned from 3° to 7°, with a step size of 0.02° during the experiment process from which we obtained the identification of minerals and quantitative results of the weight percentage of each kind of mineral.
N2 adsorption isotherms were provided using a ASAP 2020 (Micromeritics Instrument Corp., Norcross, GA, USA) apparatus at 77K in accordance with Chinese National Standard SY/T 6154-1995 [46], which were tested in the Key Laboratory of Strategy Evaluation for Shale Gas, Ministry of Land and Resources, Beijing, China. In order to complete this test, approximately 0.5 g of the powdered sample (<80 mesh) was prepared, which was dried at 150 °C for 24 h in an oven to control moisture and humidity, followed by eight hours of degassing under high vacuum (<10 mmHg) at 90 °C in the apparatus to remove residual gas. After these two steps, all the atmospheric moisture can be removed. Before gas adsorption, the standard sample was used for calibration. The errors of all samples were not higher than 7%. SA was calculated from the sorption curve based on the adsorbed volume in a relative pressure (P/P0) range of 0.05–0.35 using the Brunauere–Emmete–Teller (BET) method [47]. Furthermore, PV and PSD from the sorption curves were obtained for a pore size range of 1.7–200 nm under a relative pressure (P/P0) range of 0.06–0.99 using the Barrett–Johner–Halenda (BJH) method [48]. In this paper, a slit-shaped pore was used for the Kelvin equation in BJH PSD calculations that—due to the comprehensive consideration of SEM images and hysteresis loop shapes, organic pores, and mineral intergranular pores—were abundant in the Dalong Formation shales. The BJH equation can be expressed in the form:
V pm = ( r pm r km + Δ t n / 2 ) 2 ( Δ V n Δ t n j 1 n 1 A cj )
where Vpm is the pore volume, rpm is the maximum pore radius, rkm is the capillary radius, Vn is the capillary volume, tn is the thickness of adsorbed nitrogen layer, and Acj is the area after previous evacuation. Meanwhile, the nitrogen adsorption data was used to calculate the fractal dimension through the fractal FHH method [49], which was used to present the fractal characterization.
The scanning electron microscope experiment (SEM) was conducted in China University of Petroleum (Beijing), China, which was used to get high-resolution images with back-scattered electrons (BSE). Before the experiment, the samples needed to be polished with an argon ion mill to create an artifact-free surface. The shade of the grayscale image is a function of the density of the mineral in BSE imaging. Loucks et al. (2009) [8] documented the identification method in detail.

4. Results

4.1. Organic Geochemistry

The maceral composition, TOC, and Ro of the selected samples are listed in Table 1 and Table 2. The maceral composition of the Dalong Formation shale was predominantly liptinite, accounting for 73.7–94.5% with an average value of 88.5%, followed by vitrinite content ranging from 5.0% to 25.0% with an average value of 10.2%, while the exinite and inertinite contents were less than 3.0%. Generally speaking, the maceral groups can be divided into four types, including sapropelic type I, humic-sapropelic type II1, sapropelic-humic type II2, and humic type III, based on the kerogen type index TI value, which is expressed as follows:
TI = (Lipinite × 100 + Exinite × 50 − Vitrinite × 75 − Inertinite × 100)/100
Whereas TI ≥ 80, 80 > TI ≥ 40, 40 > TI ≥ 0 and TI < 0 indicate type I, type II1, type II2, and type III, respectively. According to the calculated TI (Table 1), the kerogen of the Dalong Formation shale was chiefly type I with a small amount of type II1, further suggesting that the kerogen was inclined to sapropelic type. The massive occurrence of sapropelic components elucidates that OM input in the western area of the Lower Yangtze Platform during the Late Permian Dalong period was dominantly planktonic algae and bacteria, and the appearance of a small amount of humic components reveals the input of minor terrestrial higher plants.
The Dalong Formation shale had a relative high TOC value ranging from 1.18% to 6.45%, with an average value of 2.80% (Table 2). Ro ranging between 1.15% and 1.29%, at an average of 1.21% (Table 2), suggests that the Dalong Formation shale was in the mature stage and underwent a certain degree of thermal degradation.

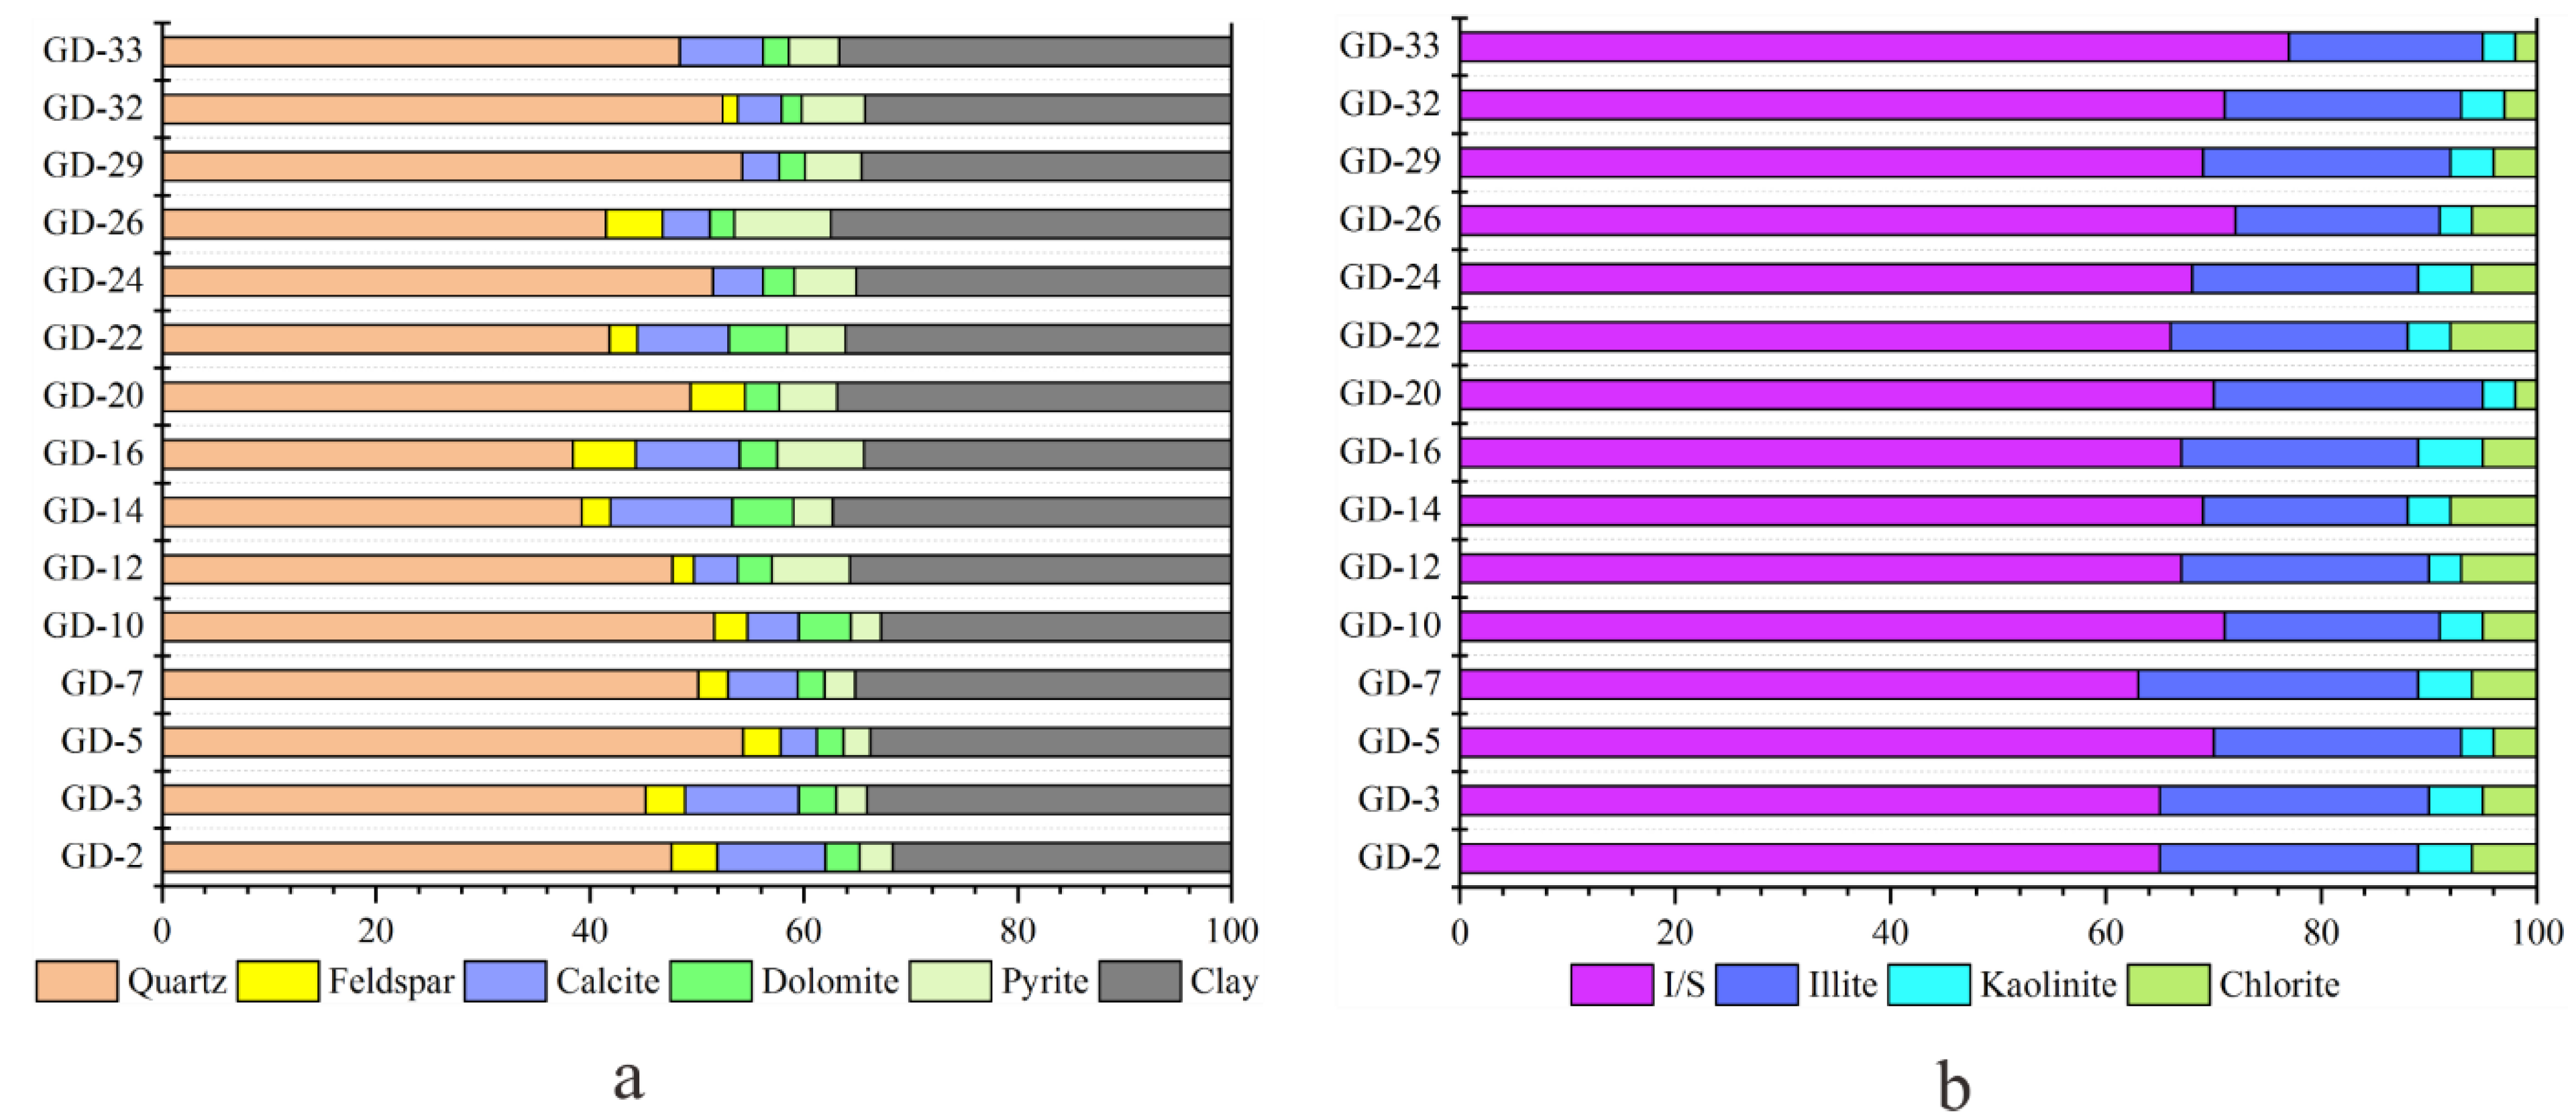
4.2. Mineral Compositions and Lithofacies Division

According to XRD data, the mineral compositions of the investigated samples are given in Table 3 and Figure 3. The Dalong Formation shale was dominated by quartz ranging from 38.4% to 54.3% with an average value of 47.6%, followed by clay minerals in the range of 31.7–37.5% with an average value of of 35.1%, along with carbonate minerals (calcite and dolomite) with an average value of 9.6%. In addition, feldspar and pyrite also developed in smaller content (Figure 3a). Thus, contents of brittle minerals (quartz and feldspar) were relatively high in the Dalong Formation shale, which was beneficial to the later fracturing reconstruction.
With respect to clay mineral composition, illite-smectite mixed clay (I/S) played the dominant role, ranging from 63% to 77% with an average value of 68.7%. Apart from I/S, clay mineral composition also involved illite, chlorite, and kaolinite, which accounted for 22.1%, 4.1%, and 4.1%, respectively (Table 3).
The Dalong Formation shale was mainly composed of quartz, clay, and carbonate minerals, with less feldspar minerals and pyrite according to the XRD data of the samples. The high contents of detrital minerals (quartz, feldspar, etc.) usually represent the strong input of terrigenous debris. A large number of clay minerals usually indicates weak hydrodynamic conditions during the sedimentation period. The middle contents of carbonate minerals during the sedimentation period often represent the shallow water environment [50]. These environmental factors have a great influence on the development of various pores in shale. The relative content of the three minerals also directly affects shale porosity, rock strength and brittleness. Based on this, we adopted quartz and feldspar, clay minerals, and calcite and dolomite as the three-terminal component to divide lithofacies [51].
First, quartz and feldspar, clay minerals, and calcite and dolomite were taken as three end elements to establish a triangular chart. According to the classification standard of sedimentary petrology, lithofacies are divided into four types, namely shale, clay rock, siliceous rock, and limestone. Then, the shale lithofacies can be further divided into clay shale, siliceous shale, calcareous shale, clay–siliceous mixed shale, clay–calcareous mixed shale, calcareous-siliceous mixed shale, and calcareous-siliceous clay mixed shale facies. On the basis of the setting lithofacies division scheme, the division results of investigated samples are shown in Figure 4, from which we can discern that the Dalong Formation shales were mainly distributed in the siliceous shale facies (GD-2, GD-5, GD-7, GD-10, GD-20, GD-24, GD-29, GD-32) and clay–siliceous mixed shale facies (GD-3, GD-12, GD-14, GD-16, GD-22, GD-26, GD-33).

4.3. N2 Adsorption–Desorption Isotherm Characteristics

From the shape of the adsorption isotherms and the hysteresis loops, we can obtain useful information relating to the mechanism of the physisorption process in the shale pores, which can help qualitatively indicate the shale pore types and shapes.

4.3.1. Adsorption Isotherms Types and Their Implications for PSD

The International Union of Pure and Applied Chemistry (IUPAC) classified N2 adsorption isotherms into six types, type I to type VI (Figure 5a), and the detailed description provided by IUPAC is in Rouquerol, J. et al. (1994) [52]. The Dalong Formation shales belong to type IV isotherm with a hysteresis loop (Figure 6), which resulted from capillary condensation in the mesopores (diameter, 2 < d < 50 nm) at the relative pressure range of 0.45–0.9 P/P0. From Figure 6, it can be worked out whether it the shale was siliceous or clay–siliceous mixed. The adsorption isotherms of the investigated samples rose progressively during the relative pressure range of 0–0.4 P/P0, which means mono-molecule layer adsorption occurring on the shale surface. Then, the adsorption curves rose steadily, resulting in the saturation of mono-molecule layer adsorption followed by the multi-molecular layer adsorption. When the relative pressure was 0.4–0.9 P/P0, the desorption branch was obviously higher than the adsorption branch, along with the appearance of capillary condensation, which resulted in the hysteresis loop. At the relative pressure of 0.9–1.0 P/P0, the adsorption branch and desorption branch suddenly rose and coincided at the end. Therefore, the occurrences of hysteresis loops indicate that the Dalong Formation shale had a lot of mesopores. Similarly, the smaller adsorption amount at P/P0 < 0.4 and the large adsorption amount at P/P0 > 0.9 show that the Dalong Formation shale had a certain number of macropores (d > 50 nm) and a small amount of micropores (d < 2 nm).

4.3.2. Hysteresis Loops and Reflections on Shale Pore Shapes and Types

The IUPAC classified hysteresis loops into four types, each representing a different pore shape (Figure 5b) [53]. Type H1 represents cylindrical pores in which both ends are open and capillary condensation occurs in the middle of the relative pressure; Type H2 is associated with ink-bottle-shaped pores with poor connectivity and uneven pore structure, Type H3 is attributed to wedge-shaped pores formed by the loose stacking of flaky particles, and Type H4 is a result of slit-shaped pores resulting from internal parallel pore structure.
Accordingly, hysteresis loops of the Dalong Formation shales belong to type H3, along with a small amount of type H4, demonstrating that slit-shaped pores or wedge-shaped pores took the primary position in the Dalong Formation shales. Previous studies proved that plate-like pores are associated with clay minerals [5,9,32,54,55,56]. The differences in hysteresis loops between H3 and H4 may be caused by the various compositions of clay minerals. The smectite and I/S have inner and outer surfaces generated slit-shaped pores, while illite, kaolinite, and chlorite can only produce wedge-shaped pores formed by loosely stacking of flaky particles. Therefore, shales with more I/S were mainly composed of type H4, caused by the internal interlayer structure of I/S, while shales with less I/S were dominated by type H3, resulting from the pellet stacking of illite, kaolinite, etc.

4.4. Pore Structure Parameters

4.4.1. Pore Volume (PV) and Surface Area (SA)

Pore structure parameters obtained from the nitrogen adsorption experiment are listed in Table 4. The BJH pore volumes of the siliceous shale facies ranged from 0.035 cm3/g to 0.046 cm3/g, with an average value of 0.039 cm3/g. The BET surface areas were in the range of 5.20–10.91 m2/g, with an average value of 8.53 m2/g. In the clay–siliceous mixed shale facies, the PV was of a relative low value, ranging from 0.030 cm3/g to 0.041 cm3/g, with an average value of 0.035 cm3/g, while the SA ranged from 6.71 cm3/g to 11.38 m2/g, with an average value of 8.59 m2/g.
The average BET surface area and the average pore volume of the Longmaxi Formation shale were 18.65 m2/g and 0.042 cm3/g, respectively [57]. The Permian Longtan Formation shale had a relatively low surface area and pore volume, which were around 15.79 m2/g and 0.032 cm3/g, respectively [58]. Compared with these two samples, the SA of the different lithofacies shales in the Dalong Formation was relatively low, but the PV was higher than that of the Longtan Formation shale, which provided more space for free gas storage.

4.4.2. Pore Size Distribution (PSD)

In Table 4, it can be seen that the average pore size (APS) ranged from 14.2 nm to 26.1 nm in the siliceous shale facies, while APS was in the range of 14.3–18.9 nm in the clay–siliceous mixed shale facies. Through observing the PSD curves (Figure 7), it can be found that there were two different forms existing in both shale facies. The first one appears to be unimodal, with a major peak ranging from 4 nm to 10 nm, including GD-5, GD-16, GD-24, GD-32, and GD-33. The second one appears to be a bimodal distribution, with one major peak at 3–6 nm and another at 8–12 nm, including GD-2, GD-3, GD-7, GD-10, GD-12, GD-14, GD-20, GD-22, GD-26, and GD-29.
In the PSD curves of some samples (e.g., GD-12, GD-16, GD-22, GD-24, GD-32), the vertical axis (dV/dlog(d)) representing the rate of change of pore volume with pore diameter increased with the increasing pore diameter, and tended to be flat when the pore diameter approached 50 nm, which means micropores (<2 nm) and mesopores at 2–50 nm contributed more pore space, while macropores (>50 nm) were rare. This indicates that micropores and mesopores were predominant in such samples, and mesopores contributed more to PV. The results are consistent with those observed by BIB-SEM. In this kind of sample, pyrite intergranular pores (Figure 8a–c) and inorganic pores (Figure 8d–h), such as clay mineral intergranular pores and intragranular pores, played a dominant role, along with some organic pores (Figure 8i–l). However, in other samples (e.g., GD-2, GD-14, GD-26, GD-33), when the dV/dlog(d) also increased gradually with the increasing pore size, the pronounced difference is that when the pore diameter was close to 50 nm, the dV/dlog(d) curve continued to rise without the tendency of being flat. This difference indicates that mesopores and macropores in such samples took more proportion, which is in line with the BIB-SEM analysis that all kinds of pores are well developed. The main pore space was occupied by mesopores and macropores, including clay mineral intergranular pores and carbonate dissolution pores (Figure 8m–o).

4.5. FHH Fractal Dimensions

The FHH model can be described as follows:
ln ( V / V 0 ) = λ ln [ ln ( P 0 / P ) ] + K
where P is the equilibrium pressure, MPa; P0 is the saturation pressure, MPa; V is the volume of adsorbed gas molecules at the equilibrium pressure p, cm3/g; V0 is the monolayer coverage volume, cm3/g; λ is the linear correlation coefficient; and K is the constant.
The fractal dimension (D) can be calculated through the following equation: D = λ + 3 [33,57,58,59,60,61,62]. According to previous studies [63], when the fractal dimension of rock is between two and three, it accords with the fractal meaning of pore system. Fractal dimension is related to the complexity and anisotropism of the pore structure. Generally, the larger the fractal dimension is, the more complex the pore structure becomes. Concretely speaking, when D is close to two, the pore surface becomes more regular. When D is close to three, the pore surface becomes more irregular, which indicates that the pore structure of the sample is more complex. Because the divergence of the adsorption–desorption curve was at the value of P/P0 approximating 0.45, D was calculated with the experimental data of adsorption process when the relative pressure P/P0 > 0.45. The FHH plots of 15 shale samples are shown in Figure 9. Table 5 summarizes the slopes of the regression lines and D values. Prob > F refers to the significant value, both of which were less than 0.005, indicating that the fitting equation is statistically significant. D ranged from 2.511 to 2.609, with the average value of 2.570 in the siliceous shale facies, while D was in the range of 2.563–2.619, on an average of 2.597 in the clay–siliceous mixed shale facies, which means that the pore structures of samples in both shale facies were complex and the microscopic pore heterogeneity was strong.

5. Discussion

5.1. Relationships between TOC and Clay Minerals and Quartz

The depositional environment can be judged by observing the mineral composition. The relationships between TOC content and clay minerals and quartz are shown in Figure 10. It could be found that TOC was negatively correlated with clay minerals (Figure 10a) and had no obvious linear correlation with quartz (Figure 10b).
The relationships between TOC and mineral compositions mainly depend on the sedimentary environment. On one hand, as mentioned above, the Dalong Formation shales were deposited in a marine sedimentary setting in which OM was predominantly derived from planktonic algae living in deep-water shelf. Therefore, it is not beneficial to the input of continental clay minerals because the sedimentary environment is far away from land. Previous studies also discussed the relationships between TOC and clay minerals in the marine sedimentary environment, which coincide with ours [16,64,65,66]. Deep-water shelf and other sedimentary environments conducive to the formation of organic-rich marine shales are usually relatively low in clay content due to the long distance from the provenance, which results in a lack of various transported continental minerals [34,35,67,68,69]. On the other hand, quartz in the marine sedimentary setting mainly comes from siliceous or calcareous planktonic aquatic organisms, which mainly live in the upper part of the water [16,70,71]. Generally, the marine shale has relatively high quartz content, which has positive linear relation with TOC, because the lower part of the water body is in a strong reducing environment [16,72]. However, quartz content in the present study showed no obvious correlation with TOC, which indicates the Dalong Formation shale in the western area of the Lower Yangtze Platform probably experienced multiperiod hydrothermal activities, resulting in the quartz being of hydrothermal origin [73,74,75].

5.2. Relationships among Pore Structure Parameters

The relationships between different pore structure parameters in the Dalong Formation shales are shown in Figure 10. PV showed a relatively positive correlation with SA (Figure 11a), which is consistent with previous studies of mature marine shales [11,76,77]. SA exhibited an obvious negative correlation with APS (Figure 11b), while PV had no obvious linear correlation with APS (Figure 11c). Previous studies suggested that micropores have a significant contribution to SA and that mesopores contribute more to PV [78,79]. Fractal dimension had a relatively positive correlation with SA (Figure 11d), which indicates that the fractal dimension and SA jointly reflected the complexity of pore structure.
As presented in Figure 12, there was no obvious variation trend among SA, PV, and APS, along with depth change. However, at the depth of 975–980 m (the shaded rectangle in Figure 12), we noticed that there were obvious abnormalities in SA, PV, and APS, where SA and PV significantly decreased, while APS suddenly increased. The TOC contents of two samples (GD-7 and GD-10) were twice or more than that of the surrounding samples. Therefore, it is supposed that the exceptional increase in TOC was a possible factor [17,31,80,81], and that the easy compaction of rock structure, the abnormal pressure in the process of hydrocarbon generation [28,82,83], the collapse of organic pores, and the occupation of pore space by some non-hydrocarbon-generating macerals [35,83,84,85,86,87] may be actual factors which led to the decrease in SA and PV, as well as the increase in APS.

5.3. Relationships between Mineral Compositions and SA, PV

As described above, shale lithofacies in the Dalong Formation were composed of siliceous shale and clay–siliceous mixed shale. Therefore, the relationships between mineral compositions and SA, PV in different shale lithofacies are separately discussed.
In siliceous shale facies, quartz had no obvious linear correlation with SA (Figure 13a) and PV (Figure 13b), while I/S was positively correlated with SA (Figure 13c) and PV (Figure 13d), and illite had negative correlation with SA (Figure 13e) and PV (Figure 13f). Siliceous shale had a significant amount of hydrothermal quartz, which resulted in the inconspicuous linear relationship between quartz and SA/PV. BIB-SEM images showed that pore type in siliceous shale was dominated by organic pores (Figure 14a), while I/S had a catalytic effect on OM for hydrocarbon generation [87,88]. Therefore, I/S associated with OM was beneficial for the formation of organic pores, resulting in the positive correlation with SA and PV [3,89,90]. Although illite mainly produced wedge-shaped pores formed by the loose accumulation of lamellar single crystals, it easily filled organic pores. Consequently, illite was not conducive to the development of organic pores in siliceous shale, so it was negatively correlated with SA and PV.
In clay–siliceous mixed shale facies, quartz had a positive correlation with SA (Figure 13a) and PV (Figure 13b), while I/S and illite had no obvious correlation with SA and PV. Based on BIB-SEM images, it can be figured out that pore type in clay–siliceous mixed shale was chiefly composed of inorganic pores, such as intergranular pores (Figure 14b), with fewer organic pores. The positive correlations between quartz and SA/PV resulted from intergranular pores generated by the complex contact modes between hydrothermal quartz particles [91,92,93,94]. SA (Figure 13g) and PV (Figure 13h) had no obvious linear correlations with TOC, while TOC was negatively related with clay minerals, as discussed in Section 5.1. Therefore, the negative relationship between TOC and clay minerals resulted in I/S and illite, demonstrating no obvious linear correlation with SA and PV (Figure 13c–f). The result illustrates that quartz had great influence on the development of inorganic pores, while organic pores were mainly affected by TOC in the clay–siliceous mixed shale.
The correlation differences between mineral compositions and SA/PV in both shale lithofacies largely depend on which kind of pore developed in shale. The Dalong Formation siliceous shale mainly developed organic pores, which were greatly influenced by hydrocarbon generation catalyzed by clay minerals, while clay–siliceous mixed shale chiefly developed inorganic pores, which were significantly affected by the complex contact modes between quartz particles.

5.4. Relationships between Mineral Compositions and Fractal Dimensions

In order to deeply understand the influence of mineral compositions on shale pore structure, the relationships between mineral compositions and fractal dimensions in different shale lithofacies are also separately discussed.
In siliceous shale facies, quartz had no obvious linear correlation with fractal dimensions (Figure 15a), while I/S was positively correlated with fractal dimensions (Figure 15b), and illite showed a negative correlation with fractal dimensions (Figure 15c). As discussed in Section 4.5, fractal dimension can be applied for representing the complexity of pore structure. Therefore, I/S contributed much more complexity to the pore structure and illite presented the opposite effects. I/S has a strong catalytic effect on OM for hydrocarbon generation [87,88], resulting in the formation of a large number of micropores, so I/S showed positive correlation with fractal dimensions, which was beneficial to the complexity of pore structure. Because illite can easily fill organic pores, it has a negative correlation with fractal dimensions. Furthermore, the relationships between mineral compositions and fractal dimensions were consistent with the corresponding conclusions between mineral compositions and SA and PV as discussed in Section 5.3. Therefore, the fractal dimension was positively correlated with SA and PV.
In clay–siliceous mixed shale facies, quartz (Figure 15a) and I/S (Figure 15b) showed weak positive correlations with fractal dimensions, while illite had no obvious linear relationship with fractal dimension (Figure 15c). Clay–siliceous mixed shale had less quartz than siliceous shale. Therefore, the complex contact modes between quartz particles resulting from the hydrothermal activities were conducive to the complexity of pore structure followed by the increase of fractal dimension. Clay–siliceous mixed shale mainly developed inorganic pores along with less organic pores related to clay minerals, so the relationships between I/S, illite, and fractal dimension were weak. Under the effect of compaction, the preferred orientation of flake clay minerals begins to generate, but the orientation of smectite with larger surface occurs more slowly [95]. Furthermore, the structure of I/S was more disordered than that of illite. Therefore, the slow preferred orientation of smectite in I/S and the disordered structure of I/S were conducive to the complexity of pore structure, which resulted in the relatively positive correlation between I/S and fractal dimension.

6. Conclusions

In this study, based on our analysis of organic geochemistry, XRD, nitrogen adsorption–desorption and BIB-SEM, pore structure, and the fractal characteristics of different shale lithofacies in the upper Permian Dalong Formation in the western area of the Lower Yangtze Platform were discussed. The following conclusions can be drawn:
(1) The Dalong Formation shale is in the mature stage and its TOC content is relatively high. The Dalong shale is dominated by quartz, while I/S accounts for the majority of clay group composition. The shale lithofacies in the Dalong Formation can be divided into the siliceous shale facies and the clay–siliceous mixed shale facies according to the mineral composition.
(2) The Dalong Formation shale exhibits a low value of SA and PV compared with the Longmaxi shale, while its PV is relatively high compared with the Longtan shale. Additionally, in the Dalong Formation shales, the siliceous shale has a relatively low SA and relatively high PV compared with the clay–siliceous mixed shale. Furthermore, PSD curves mainly tend to indicate bimodal distribution, with one major peak at 3–6 nm and another one at 8–12 nm.
(3) The factors influencing the pore structure parameters of different shale lithofacies in the Dalong Formation are different. I/S is the main contributor to SA and PV, while illite is not conducive to them in the siliceous shale facies. Quartz contributes significantly to SA and PV, while OM contributes less to them in the clay–siliceous mixed shale.
(4) The influence factors of fractal characteristics of both shale lithofacies in the Dalong Formation are different. In the siliceous shale facies, I/S is beneficial to the complexity of pore structure because of its beneficial effect on the development of micro organic pores. In the clay–siliceous mixed shale facies, quartz and I/S contribute more to the complexity of pore structure because of the various contact modes between quartz particles and the disorder of I/S.

Author Contributions

Methodology, J.D. and T.L.; validation, J.Z.; formal analysis, X.L.; investigation, W.D., Y.C. and R.G.; resources, G.S.; writing—original draft preparation, L.X.; writing—review and editing, L.X. and J.D.; project administration, J.Z. All authors have read and agreed to the published version of the manuscript.

Funding

This research was jointly funded by the National Science and Technology Major Project (2016ZX05034002-001), the National Natural Science Foundation of China (41802156), the National Natural Science Foundation of China (41927801), the Natural Science Basic Research Plan in Shanxi Province of China (2019JQ-367) and the Open Funding of Key Laboratory of Tectonics and Petroleum Resources, Ministry of Education, China (TPR-2019-01).

Acknowledgments

We would like to express our appreciation to Nanjing Geological Survey Center of China Geological Survey for providing the valuable samples studied in this paper.

Conflicts of Interest

The authors declare that they have no known competing financial interests or personal relationships that could have appeared to influence the work reported in this paper.

References

  1. Curtis, J.B. Fractured shale-gas systems. AAPG Bull. 2002, 86, 1921–1938. [Google Scholar]
  2. Jarvie, D.M.; Hill, R.J.; Ruble, T.E.; Pollastro, R.M. Unconventional shale-gas systems: The Mississippian Barnett Shale of north-central Texas as one model for thermogenic shale-gas assessment. AAPG Bull. 2007, 91, 475–499. [Google Scholar] [CrossRef]
  3. Ross, D.J.K.; Bustin, R.M. The importance of shale composition and pore structure upon gas storage potential of shale gas reservoirs. Mar. Pet. Geol. 2009, 26, 916–927. [Google Scholar] [CrossRef]
  4. Zhang, T.; Ellis, G.S.; Ruppel, S.C.; Milliken, K.; Yang, R. Effect of organic-matter type and thermal maturity on methane adsorption in shale-gas systems. Org. Geochem. 2012, 47, 120–131. [Google Scholar] [CrossRef]
  5. Ji, L.; Zhang, T.; Milliken, K.; Qu, J.; Zhang, X. Experimental investigation of main controls to methane adsorption in clay-rich rocks. Appl. Geochem. 2012, 27, 2533–2545. [Google Scholar] [CrossRef]
  6. Chen, S.; Zhu, Y.; Wang, H.; Liu, H.; Wei, W.; Fang, J. Shale gas reservoir characterisation: A typical case in the southern Sichuan Basin of China. Energy 2011, 36, 6609–6616. [Google Scholar] [CrossRef]
  7. Hu, Q.; Gao, X.; Gao, Z.; Ewing, R.; Dultz, S.; Kaufmann, J. American Association of Petroleum Geologists Unconventional Resources Technology Conference. In Proceedings of the 2nd Unconventional Resources Technology Conference-Pore Accessibility and Connectivity of Mineral and Kerogen Phases for Shales, Denver, CO, USA, 24–27 August 2014. [Google Scholar]
  8. Loucks, R.G.; Reed, R.M.; Ruppel, S.C.; Jarvie, D.M. Morphology, genesis, and distribution of nanometer-scale pores in siliceous mudstones of the Mississippian Barnett shale. J. Sediment. Res. 2009, 79, 848–861. [Google Scholar] [CrossRef] [Green Version]
  9. Milliken, K.L.; Reed, R.M. Multiple causes of diagenetic fabric anisotropy in weakly consolidated mud, Nankai accretionary prism, IODP Expedition 316. J. Struct. Geol. 2010, 32, 1887–1898. [Google Scholar] [CrossRef]
  10. Slatt, R.M.; O’Brien, N.R. Pore types in the Barnett and Woodford gas shales: Contribution to understanding gas storage and migration pathways in fine-grained rocks. AAPG Bull. 2011, 95, 2017–2030. [Google Scholar] [CrossRef]
  11. Chalmers, G.R.; Bustin, R.M.; Power, I.M. Characterization of gas shale pore systems by porosimetry, pycnometry, surface area, and field emission scanning electron microscopy/transmission electron microscopy image analyses: Examples from the Barnett, Woodford, Haynesville, Marcellus, and Doig units. AAPG Bull. 2012, 96, 1099–1119. [Google Scholar]
  12. Keller, L.M.; Schuetz, P.; Erni, R.; Rossell, M.D.; Lucas, F.; Gasser, P.; Holzer, L. Characterization of multi-scale microstructural features in Opalinus Clay. Microporous Mesoporous Mater. 2013, 170, 83–94. [Google Scholar] [CrossRef]
  13. Clarkson, C.R.; Freeman, M.; He, L.; Agamalian, M.; Melnichenkom, Y.B.; Mastalerz, M.; Bustin, R.M.; Radliński, A.P.; Blach, T.P. Characterization of tight gas reservoir pore structure using USANS/SANS and gas adsorption analysis. Fuel 2012, 95, 371–385. [Google Scholar] [CrossRef]
  14. Clarkson, C.R.; Solano, N.R.; Bustin, R.M.; Bustin, A.M.M.; Blach, T.P. Pore structure characterization of North American shale gas reservoirs using USANS/SANS, gas adsorption, and mercury intrusio. Fuel 2013, 103, 606–616. [Google Scholar] [CrossRef]
  15. Labani, M.M.; Rezaee, R.; Saeedi, A.; Hinai, A.A. Evaluation of pore size spectrum of gas shale reservoirs using low pressure nitrogen adsorption, gas expansion and mercury porosimetry: A case study from the Perth and Canning Basins, Western Australia. J. Pet. Sci. Eng. 2013, 112, 7–16. [Google Scholar] [CrossRef]
  16. Tian, H.; Pan, L.; Xiao, X.; Wikins, R.W.T.; Meng, Z.; Huang, B. A preliminary study on the pore characterization of Lower Silurian black shales in the Chuandong Thrust Fold Belt, southwestern China using low pressure N2 adsorption and FE-SEM methods. Mar. Pet. Geol. 2013, 48, 8–19. [Google Scholar] [CrossRef]
  17. Tian, H.; Pan, L.; Zhang, T.; Xiao, X.; Meng, Z.; Huang, B. Pore characterization of organic-rich Lower Cambrian shales in Qiannan Depression of Guizhou Province, Southwestern China. Mar. Pet. Geol. 2015, 62, 28–43. [Google Scholar] [CrossRef]
  18. Wang, Y.M.; Dong, D.Z.; Yang, H.; He, L.; Wang, S.Q.; Huang, J.L.; Pu, B.L.; Wang, S.F. Quantitative characterization of reservoir space in the Lower Silurian Longmaxi Shale, southern Sichuan, China. Sci. China Earth Sci. 2014, 57, 313–322. [Google Scholar] [CrossRef]
  19. Cao, T.; Song, Z.; Wang, S.; Cao, X.; Li, Y.; Xia, J. Characterizing the pore structure in the Silurian and Permian shales of the Sichuan Basin, China. Mar. Pet. Geol. 2015, 61, 140–150. [Google Scholar] [CrossRef]
  20. Liu, X.; Xiong, J.; Liang, L. Investigation of pore structure and fractal characteristics of organic-rich Yanchang formation shale in central China by nitrogen adsorption/desorption analysis. J. Nat. Gas Sci. Eng. 2015, 22, 62–72. [Google Scholar] [CrossRef]
  21. Huang, S.J.; Yu, Y.C.; Lee, T.Y.; Lu, T.S. Correlations and characterization of porous solids by fractal dimension and porosity. Physica A 1999, 274, 419–432. [Google Scholar] [CrossRef]
  22. Yu, B.; Ping, C. A fractal permeability model for bi-dispersed porous media. Int. J. Heat Mass Transf. 2002, 45, 2983–2993. [Google Scholar] [CrossRef]
  23. Bird, N.; Díaz, M.C.; Saa, A.; Tarquis, A.M. Fractal and multifractal analysis of pore-scale images of soil. J. Hydrol. 2006, 322, 211–219. [Google Scholar] [CrossRef]
  24. Zhang, S.; Tang, S.; Tang, D.; Huang, W.; Pan, Z. Determining fractal dimensions of coal pores by FHH model: Problems and effects. J. Nat. Gas Sci. Eng. 2014, 21, 929–939. [Google Scholar] [CrossRef]
  25. Liang, L.; Xiong, J.; Liu, X. An investigation of the fractal characteristics of the Upper Ordovician Wufeng Formation shale using nitrogen adsorption analysis. J. Nat. Gas Sci. Eng. 2015, 27, 402–409. [Google Scholar] [CrossRef]
  26. Yang, C.; Zhang, J.; Wang, X.; Tang, X.; Chen, Y.; Jiang, L.; Gong, X. Nanoscale pore structure and fractal characteristics of a marine-continental transitional shale: A case study from the lower Permian Shanxi Shale in the southeastern Ordos Basin, China. Mar. Pet. Geol. 2017, 88, 54–68. [Google Scholar] [CrossRef]
  27. Avnir, D.; Jaroniec, M. An isotherm equation for adsorption on fractal surfaces of heterogeneous porous materials. Langmuir 1989, 5, 1431–1433. [Google Scholar] [CrossRef]
  28. Loucks, R.G.; Reed, R.M.; Ruppel, S.C.; Hammes, U. Spectrum of pore types and networks in mudrocks and a descriptive classification for matrix-related mudrock pores. AAPG Bull. 2012, 96, 1071–1098. [Google Scholar] [CrossRef] [Green Version]
  29. Bernard, S.; Horsfield, B.; Schulz, H.M.; Wirth, R.; Schreiber, A.; Sherwood, N. Geochemical evolution of organic-rich shales with increasing maturity: A STXM and TEM study of the Posidonia Shale (Lower Toarcian, northern Germany). Mar. Pet. Geol. 2012, 31, 70–89. [Google Scholar] [CrossRef]
  30. Curtis, M.E.; Cardott, B.J.; Songdergeld, C.H.; Rai, C.S. Development of organic porosity in the Woodford Shale with increasing thermal maturity. Int. J. Coal Geol. 2012, 103, 26–31. [Google Scholar] [CrossRef]
  31. Milliken, K.L.; Rudnicki, M.; Awwiller, D.N.; Zhang, T. Organic matter-hosted pore system, Marcellus Formation (Devonian), Pennsylvania. AAPG Bull. 2013, 97, 177–200. [Google Scholar] [CrossRef]
  32. Kuila, U.; McCarty, D.K.; Derkowski, A.; Fischer, T.B.; Topór, T.; Prasad, M. Nano-scale texture and porosity of organic matter and clay minerals in organic-rich mudrocks. Fuel 2014, 135, 359–373. [Google Scholar] [CrossRef] [Green Version]
  33. Yang, C.; Zhang, J.; Tang, X.; Ding, J.; Zhao, Q.; Dang, W.; Chen, H.; Su, Y.; Li, B.; Lu, D. Comparative study on micro-pore structure of marine, terrestrial, and transitional shales in key areas, China. Int. J. Coal Geol. 2017, 171, 76–92. [Google Scholar] [CrossRef]
  34. Nie, H.; Tang, X.; Bian, R. Controlling factors for shale gas accumulation and prediction of potential development area in shale gas reservoir of South China. Acta Pet. Sin. 2009, 30, 484–491. [Google Scholar]
  35. Zou, C.; Dong, D.; Wang, S.; Li, J.; Li, X.; Wang, Y.; Li, D.; Cheng, K. Geological characteristics, formation mechanism and resource potential of shale gas in China. Pet. Explor. Dev. 2010, 37, 641–653. [Google Scholar] [CrossRef]
  36. Guo, S.; Huang, L. Gas-bearing influential factors and evaluation of shale gas reservoir: A case study of Paleozoic shale gas reservoir in upper Yangtze region. Pet. Geol. Exp. 2013, 35, 601–606. [Google Scholar]
  37. Wu, H. The Gelogical Conditions and Exploration Prospect of Paleozoic Shale in Lower Yangtz Area, Anhui; Nanjing University: Nanjing, China, 2014. [Google Scholar]
  38. Song, T.; Lin, T.; Chen, K.; Meng, F.; Li, H.; Wang, P. The discovery of shale gas in Upper Permian transitional facies at Jingye-1 well in Lower Yangtze region. Geol. China 2017, 44, 606–607. [Google Scholar]
  39. Shi, G.; Huang, Z.; Zheng, H.; Xu, Z.; Zhao, M.; Shao, W.; Yin, Q.; Zhou, D.; Fang, C.; Teng, L.; et al. Drilling discovery of “Three Gas One Oil” in the Permian strata of Lower Yangtze area. Geol. China 2018, 45, 416–417. [Google Scholar]
  40. Zhu, G.; Xu, J.; Liu, G. Tectonic pattern and dynamic mechanism of the foreland deformation in the lower yangtze region. Reg. Geol. China 1999, 1, 74–80. [Google Scholar]
  41. Ye, Z.; Ma, L.; Liang, X.; Wu, G.; Xu, K.; Zhang, T. The independent Lower Yangtze block and Mesozo icreformed residual basins. Chin. J. Geol. 2006, 1, 81–101. [Google Scholar]
  42. SY-T 5125-2014. Identification and Classification of Microscopic Components of Kerogen through Transmission Light-Fluorescence; China National Petroleum Corporation: Beijing, China, 2014. [Google Scholar]
  43. GB/T 19145-2003. Method for Determination of Total Organic Carbon in Sedimentary Rocks; General Administration of Quality Supervision, Inspection and Quarantine of the People’s Republic of China: Beijing, China, 2003.
  44. SY-T 5124-2012. Method for Determination of Vitrinite Reflectance in Sedimentary Rocks; China National Petroleum Corporation: Beijing, China, 2012. [Google Scholar]
  45. SY-T 5163-2018. Methods of X-ray Diffraction Analysis of Clay minerals and Common Non-Clay Minerals in Sedimentary Rocks; China National Petroleum Corporation: Beijing, China, 2018. [Google Scholar]
  46. SY-T 6154-1995. Determination of Rock Specific Surface and Pore Diameter Distribution: Static Nitrogen Adsorption Capacity Method; China National Petroleum Corporation: Beijing, China, 1995. [Google Scholar]
  47. Brunauer, S.; Emmett, P.H.; Teller, E. Adsorption of gases in multimolecular layers. J. Am. Chem. Soc. 1938, 60, 309–319. [Google Scholar] [CrossRef]
  48. Barrett, E.P.; Joyner, L.G.; Halenda, P.P. The determination of pore volume and area distributions in porous substances. Computations from nitrogen isotherms. J. Am. Chem. Soc. 1951, 73, 373–380. [Google Scholar]
  49. Xu, L.; Zhang, D.; Xian, X. Fractal dimensions of coals and cokes. J. Colloid Interface Sci. 1997, 190, 357–359. [Google Scholar] [CrossRef] [PubMed]
  50. Chen, K.L.; Zhang, T.S.; Liang, X.; Zhang, Z.; Wang, G.G. Analysis of shale lithofacies and sedimentary environment on Wufeng Formation lower Longmaxi Formation in Dianqianbei depression. Acta Sedimentol. Sin. 2018, 36, 743–755. [Google Scholar]
  51. Wang, Y.; Wang, S.; Dong, D.; Li, X.; Huang, J.; Zhang, C.; Guan, Q. Lithofacies characterization of Longmaxi Formation of the Lower Silurian, southern Sichuan. Earth Sci. Front. 2016, 23, 119–133. [Google Scholar]
  52. Rouquerol, J.; Avnir, D.; Fairbridge, C.W.; Everett, D.H.; Haynes, J.H.; Pernicone, N.; Ransay, J.D.F.; Sing, K.S.W.; Unger, K.K. Recommendations for the characterization of porous solids (Technical Report). Pure Appl. Chem. 1994, 66, 1739–1758. [Google Scholar] [CrossRef]
  53. Sing, K.S.W.; Everett, D.H.; Haul, R.A.W.; Moscou, L.; Pierotti, R.A.; Rouquerol, J.; Siemieniewska, T. Reporting physisorption data for gas/solid systems with special reference to the determination of surface area and porosity. Pure Appl. Chem. 1985, 57, 603–619. [Google Scholar] [CrossRef]
  54. Milner, M.; Mclin, R.; Peteriello, J.; Tek, T. Imaging texture and porosity in mudstones and shales: Comparison of secondary and ion-milled backscatter SEM methods. In Proceedings of the Canadian Unconventional Resources and International Petroleum Conference, Calgary, AB, Canada, 19–21 October 2010. [Google Scholar]
  55. Kuila, U.; Prasad, M. Specific surface area and pore-size distribution in clays and shales. Geophys. Prospect. 2013, 61, 341–362. [Google Scholar] [CrossRef]
  56. Yang, C.; Zhang, J.; Han, S.; Wang, X.; Wang, L.; Yu, W.; Wang, Z. Compositional controls on pore-size distribution by nitrogen adsorption technique in the Lower Permian Shanxi Shales, Ordos Basin. J. Nat. Gas Sci. Eng. 2016, 34, 1369–1381. [Google Scholar] [CrossRef]
  57. Xu, Y.; Lu, C.; Chen, G.; Zhong, J.; Yang, W.; Xue, L. Fractal characteristics of shale pores of Longmaxi Formation in southeast Sichuan Basin. Lithol. Reserv. 2015, 27, 32–39. [Google Scholar]
  58. Zhang, P.; Huang, Y.; Zhang, J.; Liu, H.; Yang, J. Fractal characteristics of the Longtan formation transitional shale in northwest Guizhou. J. China Coal Soc. 2018, 43, 1580–1588. [Google Scholar]
  59. Dang, W.; Zhang, J.; Wei, X.; Tang, X.; Chen, Q.; Li, Z.; Zhang, M.; Liu, J. Geological controls on methane adsorption capacity of Lower Permian transitional black shales in the Southern North China Basin, Central China: Experimental results and geological implications. J. Pet. Sci. Eng. 2017, 152, 456–470. [Google Scholar] [CrossRef]
  60. Dathe, A.; Eins, S.; Niemeyer, J.; Gerold, G. The surface fractal dimension of the soil–pore interface as measured by image analysis. Geoderma 2001, 103, 203–229. [Google Scholar] [CrossRef]
  61. Rigby, S.P. Predicting surface diffusivities of molecules from equilibrium adsorption isotherms. Colloids Surf. A (Physicochem. Eng. Asp.) 2005, 262, 139–149. [Google Scholar] [CrossRef]
  62. Xie, D.; Guo, Y.; Zhao, D. Fractal characteristics of adsorption pore of shale based on low temperature nitrogen experiment. J. China Coal Soc. 2014, 39, 2466–2472. [Google Scholar]
  63. Jaroniec, M. Evaluation of the fractal dimension from a single adsorption isotherm. Langmuir 1995, 11, 2316–2317. [Google Scholar] [CrossRef]
  64. Qin, J.; Fu, X.; Shen, B.; Liu, W.; Teng, G.; Zhang, Q.; Jiang, Q. Characteristics of ultramicroscopic organic lithology of excellent marine shale in the upper Permian sequence, Sichuan Basin. Pet. Geol. Exp. 2010, 32, 164–170. [Google Scholar]
  65. Liu, S.G.; Ma, W.X.; Jansa, L.; Huang, W.M.; Zeng, X.L.; Zahng, C.J. Characteristics of the shale gas reservoir rocks in the Lower Silurian Longmaxi Formation, East Sichuan Basin, China. Acta Petrol. Sin. 2011, 27, 2239–2252. [Google Scholar] [CrossRef]
  66. Ding, J.; Zhang, J.; Tang, X.; Huo, Z.; Han, S.; Lang, Y.; Zheng, Y.; Li, X.; Liu, T. Elemental geochemical evidence for depositional conditions and organic matter enrichment of black rock series strata in an inter-platform basin: The Lower Carboniferous Datang Formation, Southern Guizhou, Southwest China. Minerals 2018, 8, 509. [Google Scholar] [CrossRef] [Green Version]
  67. Dong, D.; Cheng, K.; Wang, Y.; Li, X.; Wang, S.; Huang, J. Forming conditions and characteristics of shale gas in the Lower Paleozoic of the Upper Yangtze region, China. Oil Gas Geol. 2010, 31, 288–299. [Google Scholar]
  68. Wu, C.; Zhang, M.; Ma, W.; Liu, Y.; Xiong, D.; Sun, L.; Tuo, J. Organic matter characteristic and sedimentary environment of the Lower Cambrian Niutitang shale in southeastern Chongqing. Nat. Gas Geosci. 2014, 25, 1267–1274. [Google Scholar]
  69. Li, A.; Ding, W.; Zhang, G.; Zhang, M.; Zhang, Z.; Yan, B.; Zhou, C.; Chen, Z.; Bai, P. Reservoir characteristics and comparison analysis of marine shale in the Malong block of eastern Yunnan Province. Earth Sci. Front. 2016, 23, 176–189. [Google Scholar]
  70. Zhao, J.; Jin, Z.; Jin, Z.; Wen, X.; Geng, Y.; Yan, C. The genesis of quartz in Wufeng-Longmaxi gas shales, Sichuan Basin. Nat. Gas Geosci. 2016, 27, 377–386. [Google Scholar]
  71. Liu, H.; Guo, W.; Liu, D.; Zhou, S.; Deng, J. Authigenic embrittlement of marine shale in the process of diagenesis. Nat. Gas Ind. 2018, 38, 17–25. [Google Scholar] [CrossRef]
  72. Luo, S.; Liu, A.; Li, H.; Chen, X.; Zhang, M. Gas-bearing characteristics and controls of the Cambrian Shuijingtuo Formation in Yichang area, Middle Yangtze region. Pet. Geol. Exp. 2018, 41, 56–67. [Google Scholar]
  73. Wang, M.; Zhang, X.; Wang, A.; Xiao, G.; Wang, J. Depositional facies of Longtan and Dalong Formations in the southern depression of south Yellow Sea Basin. Mar. Geol. Front. 2014, 30, 46–50. [Google Scholar]
  74. Liao, Z.; Hu, W.; Cao, J.; Yao, S.; Xu, Z.; Zhang, Y.; Wan, Y.; Ding, H. A preliminary investigation of the development and hydrocarbon potentialofthethe black shalesinthe upper Permian Dalong Formation, Southern Anhui province in the Lower Yangze Region, China. Geol. J. China Univ. 2016, 22, 138–151. [Google Scholar]
  75. Zhang, Y.Y.; He, Z.L.; Jiang, S.; Lu, S.F.; Xiao, D.S.; Chen, G.H.; Zhao, J.H. Controls on the organic carbon content of the lower Cambrian black shale in the southeastern margin of Upper Yangtze. Pet. Sci. 2018, 15, 709–721. [Google Scholar] [CrossRef] [Green Version]
  76. Yang, F.; Ning, Z.; Liu, H. Fractal characteristics of shales from a shale gas reservoir in the Sichuan Basin, China. Fuel 2014, 115, 378–384. [Google Scholar] [CrossRef]
  77. Xiong, J.; Liu, X.; Liang, L. Experimental study on the pore structure characteristics of the Upper Ordovician Wufeng Formation shale in the southwest portion of the Sichuan Basin, China. J. Nat. Gas Sci. Eng. 2015, 22, 530–539. [Google Scholar] [CrossRef]
  78. Yang, F.; Ning, Z.; Hu, C.; Wang, B.; Liu, H. Characterization of microscopic pore structures in shale reservoirs. Acta Petrol. Sin. 2013, 34, 301–311. [Google Scholar]
  79. Zheng, Y.; Liu, J.; Zhang, B. Analysis of the relationship between specific surface area and pore structure of shales. J. Hebei Univ. Eng. (Nat. Sci. Ed.) 2019, 36, 75–79. [Google Scholar]
  80. Cao, T.; Song, Z. Effects of organic matter properties on organic pore development and reservoir. Spec. Oil Gas Reserv. 2016, 23, 7–13. [Google Scholar]
  81. Han, J.; Chen, B.; Zhao, X.; Zheng, C.; Zhang, J. Development characteristics and influential factors of organic pores in the Permian shale in the Lower Yangtze Region. Nat. Gas Ind. 2017, 37, 17–26. [Google Scholar]
  82. Cao, T.; Deng, M.; Luo, H.; Liu, H.; Liu, G.; Stefan, H.A. Characteristics of organic pores in Middle and Upper Permian shale in the Lower Yangtze region. Pet. Geol. Exp. 2018, 40, 315–322. [Google Scholar]
  83. Bernard, S.; Wirth, R.; Schreiber, A.; Schulz, H.M.; Horsfield, B. Formation of nanoporous pyrobitumen residues during maturation of the Barnett Shale (Fort Worth Basin). Int. J. Coal Geol. 2012, 103, 3–11. [Google Scholar] [CrossRef]
  84. Cardott, B.J.; Landis, C.R.; Curtis, M.E. Post-oil solid bitumen network in the Woodford Shale, USA: Apotential primary migration pathway. Int. J. Coal Geol. 2015, 139, 106–113. [Google Scholar] [CrossRef]
  85. Hackley, P.C.; Cardott, B.J. Application of organic petrography in North American shale petroleum systems: A review. Int. J. Coal Geol. 2016, 163, 8–51. [Google Scholar] [CrossRef] [Green Version]
  86. Topór, T.; Derkowski, A.; Ziemiański, P.; Szczurowski, J.; McCarty, D.K. The effect of organic matter maturation and porosity evolution on methane storage potential in the Baltic Basin (Poland) shale-gas reservoir. Int. J. Coal Geol. 2017, 180, 46–56. [Google Scholar] [CrossRef]
  87. Ding, J.; Zhang, J.; Yang, C.; Huo, Z.; Lang, Y. Formation evolution and influencing factors of organic pores in shale. J. Southwest Pet. Univ. (Sci. Technol. Ed.) 2019, 41, 33–44. [Google Scholar]
  88. Wang, X.; Cai, J.; Bao, Y. Catalysis of clay mineral to organic matter in hydrocarbon genesis. Mar. Orig. Pet. Geol. 2006, 11, 27–38. [Google Scholar]
  89. Li, J.; Yu, B.; Liu, C.; Sun, M. Clay minerals of black shale and their effects on physical properties of shale gas reservoirs in the southeast of Chongqing: A case study from Lujiao outcrop section in Pengshui, Chongqing. Geoscience 2012, 26, 732–740. [Google Scholar]
  90. Li, Y.; Cai, J. Effect of smectite illitization on shale gas occurrence in argillaceous source rocks. Pet. Geol. Exp. 2014, 36, 352–358. [Google Scholar]
  91. Han, S.; Zhang, J.; Horsfield, B.; Jiang, S.; Wang, P. Pore types and characteristics of shale gas reservoir: A case study of Lower Paleozoic shale in Southeast Chongqing. Earth Sci. Front. 2013, 20, 247–253. [Google Scholar]
  92. Wang, Y.; Dong, C.; Chen, H.; Su, Z.; Zhang, C.; Hao, Z. Petrological evidence of ordovician hydrothermal activities and its geological significance to reservoir development in central and western parts of ordos basin. Mar. Orig. Pet. Geol. 2014, 15, 85–108. [Google Scholar]
  93. Han, Y. Study of Effect on Material Composition for Shale Reservoir Pore Heterogeneity—A Case Study of w2 Well; China University of Mining and Technology: Xuzhou, China, 2017. [Google Scholar]
  94. Chen, Y.; Ma, D.; Wu, S.; Li, X.; Fang, S.; Guo, C. Pore characteristics and main controlling factors of mud shale in coal-bearing strata of eastern Ordos Basin. Nat. Gas Geosci. 2018, 29, 189–198. [Google Scholar]
  95. Ji, L.; Qiu, J.; Song, Z.; Xia, Y. Impact of internal surface area of pores in clay rocks on their adsorption capacity of methane. Geochimica 2014, 43, 187–193. [Google Scholar]
Figure 1. Location of the study area showing regional tectonic profile of the Lower Yangtze area and the location of the sampling well.
Minerals 10 00072 g001
Figure 2. The study area stratigraphic column and its corresponding depositional environment, with sampling location of the Dalong Formation.
Minerals 10 00072 g002
Figure 3. Distribution diagrams of mineral composition (a) and clay mineral (b).
Minerals 10 00072 g003
Figure 4. The lithofacies division results of the Dalong Formation shale (base map cited from Wang et al., 2016) [43].
Minerals 10 00072 g004
Figure 5. Types of adsorption isotherms (a), hysteresis loops and corresponding pore types (b) (base map cited from Sing, K. S. W. et al., 1985) [53].
Minerals 10 00072 g005
Figure 6. N2 adsorption–desorption isotherms of the Permian Dalong Formation shales.
Minerals 10 00072 g006
Figure 7. Barrett–Johner–Halenda (BJH) pore size distribution curves of the Dalong Formation shales.
Minerals 10 00072 g007
Figure 8. Combined broad ion beam-milling and scanning electron microscopy (BIB-SEM) images of different kinds of pores in the Dalong Formation shales (ac: Pyrite intergranular pore; dh: Inorganic pore; il: Organic pore; mo: Clay mineral intergranular pore and carbonate dissolution pore).
Minerals 10 00072 g008
Figure 9. The fractal dimensions of the Dalong Formation shales. P is the equilibrium pressure, MPa; P0 is the saturation pressure, MPa; V is the volume of adsorbed gas molecules at the equilibrium pressure p, cm3/g; V0 is the monolayer coverage volume, cm3/g.
Minerals 10 00072 g009
Figure 10. Relationships between TOC and clay (a) and quartz (b).
Minerals 10 00072 g010
Figure 11. Relationships between pore volume and surface area (a), surface area and average pore size (b), pore volume and average pore size (c), surface area and fractal dimension (d).
Minerals 10 00072 g011
Figure 12. Variations of surface area (SA), pore volume (PV), average pore size (APS), and total organic carbon (TOC) with burial depth (lithology legend is the same as in Figure 2).
Minerals 10 00072 g012
Figure 13. Relationships between quartz, I/S, illite, TOC content, and SA, PV among different shale lithofacies. (a) realtionships between quartz and SA among differnet shale lithofacies; (b) realtionships between quartz and PV among differnet shale lithofacies; (c) realtionships between I/S and SA among differnet shale lithofacies; (d) realtionships between I/S and PV among differnet shale lithofacies; (e) realtionships between illite and SA among differnet shale lithofacies; (f) realtionships between illite and PV among differnet shale lithofacies; (g) relationship between SA and TOC in clay-siliceous mixed shale; (h) relationship between PV and TOC in clay-siliceous mixed shale.
Minerals 10 00072 g013
Figure 14. Different kinds of pores in siliceous shale and clay–siliceous mixed shale (a: organic pore, GD-7; b: intergranular pore, GD-22).
Minerals 10 00072 g014
Figure 15. Relationships between mineral compositions and fractal dimension among different shale lithofacies. (a) relationships between quartz and fractal dimension among different sgale lithofacies; (b) relationships between I/S and fractal dimension among different sgale lithofacies; (c) relationships between illite and fractal dimension among different sgale lithofacies.
Minerals 10 00072 g015
Table 1. Results of kerogen microscopic analysis of the Dalong Formation shales.
Sample IDDepth (m)Maceral Composition (%)Type Index (TI)Kerogen Type
LiptiniteExiniteVitriniteInertinite
GD-1984.973.7025.01.353.7II1
GD-5979.392.706.70.787.0I
GD-8973.789.709.31.081.7I
GD-11967.587.7010.71.778.0II1
GD-13964.089.409.41.281.2I
GD-18953.586.63.09.31.180.0I
GD-21945.994.505.00.590.3I
GD-23941.890.208.41.482.5I
GD-25937.890.508.91.082.8I
GD-28932.591.807.40.885.5I
GD-31920.786.31.011.80.977.1II1
Table 2. Organic abundance and maturity of the Dalong Formation shales.
Sample IDDepth (m)TOC (%)Ro (%)
GD-1984.93.541.29
GD-2983.86.45
GD-3982.01.89
GD-5979.32.021.20
GD-7975.74.35
GD-8973.73.051.17
GD-10970.54.56
GD-11967.53.681.24
GD-12966.82.59
GD-13964.03.201.19
GD-14961.51.42
GD-16957.26.10
GD-18953.52.051.25
GD-20948.42.61
GD-21945.92.811.15
GD-22944.12.94
GD-23941.81.861.24
GD-24940.12.04
GD-25937.81.701.21
GD-26936.61.90
GD-28932.52.181.16
GD-29929.52.89
GD-31920.71.181.24
GD-32918.91.80
GD-33917.21.24
Average 2.801.21
Table 3. Mineral composition and clay composition of the Dalong Formation shales.
SampleMineral Composition (%)Clay Composition (%)
QuartzFeldsparCalciteDolomitePyriteClayI/SIlliteKaoliniteChlorite
GD-247.64.310.13.23.131.7652456
GD-345.23.710.63.52.934.1652555
GD-554.33.53.42.52.533.8702334
GD-750.12.86.52.52.935.2632656
GD-1051.63.14.84.92.832.8712045
GD-1247.72.04.13.27.335.7672337
GD-1439.22.711.45.73.737.3691948
GD-1638.45.99.73.58.134.4672265
GD-2049.45.103.25.436.9702532
GD-2241.82.68.65.45.536.1662248
GD-2451.504.72.95.835.1682156
GD-2641.55.34.42.39.037.5721936
GD-2954.203.52.45.334.6692344
GD-3252.41.44.11.95.934.3712243
GD-3348.407.82.44.736.7771832
Average47.62.86.23.35.035.168.722.14.15.1
Note: I/S means illite-smectite mixed clay.
Table 4. Pore structure parameters of the Dalong Formation shales.
LithofaciesSampleSA (m²/g)R2 (SA)PV (cm³/g)APS (nm)
Siliceous shaleGD-27.760.99890.03618.1
GD-58.660.99980.04018.2
GD-75.200.99940.03526.1
GD-1010.910.99990.04616.6
GD-2010.220.99980.03714.2
GD-248.310.99990.03717.6
GD-296.920.99980.03821.6
GD-3210.240.99990.04115.8
Average8.53 0.03918.6
Clay–siliceous mixed shaleGD-38.870.99970.03415.0
GD-1211.380.99990.04114.3
GD-147.020.99950.03017.1
GD-167.920.99990.03316.5
GD-227.900.99980.03718.4
GD-266.710.99990.03218.9
GD-3310.320.99990.04115.8
Average8.59 0.03516.6
Note: SA: BET surface area; PV: Barrett–Johner–Halenda (BJH) pore volume; APS: Average pore size.
Table 5. Fractal dimensions derived from Frenkel–Halsey–Hill (FHH) model. R2: Correlation coefficient.
LithofaciesSampleFitting EquationR2Prob > FD
Siliceous shaleGD-2y = −0.447x + 1.0300.997902.553
GD -5y = −0.441x + 1.1340.999802.559
GD-7y = −0.489x + 0.6280.999602.511
GD-10y = −0.406x + 1.3790.999702.594
GD-20y = −0.399x + 1.3210.999402.601
GD-24y = −0.405x + 1.1060.999802.595
GD-29y = −0.462x + 0.9190.999702.538
GD-32y = −0.391x + 1.3130.999802.609
Clay—siliceous mixed shaleGD-3y = −0.406x + 1.1800.999402.594
GD-12y = −0.385x +1.4280.999502.615
GD-14y = −0.397x + 0.9290.998702.603
GD-16y = −0.408x + 1.0550.999602.592
GD-22y = −0.437x + 1.0560.999602.563
GD-26y = −0.410x + 0.8910.999602.590
GD-33y = −0.381x + 1.3170.999702.619

