You are currently viewing a new version of our website. To view the old version click .
Symmetry
  • Article
  • Open Access

29 November 2017

A Novel Framework for Assessing Facial Attractiveness Based on Facial Proportions

,
,
,
and
1
Department of HCI Robotics, University of Science and Technology, Daejeon 34113, Korea
2
Center for Imaging Media Research, Korea Institute of Science and Technology, Seoul 02792, Korea
*
Author to whom correspondence should be addressed.

Abstract

In this paper, we present a novel framework for automatically assessing facial attractiveness that considers four ratio feature sets as objective elements of facial attractiveness. In our framework, these feature sets are combined with three regression-based predictors to estimate a facial beauty score. To enhance the system’s performance to make it comparable with human scoring, we apply a score fusion technique. Experimental results show that the attractiveness score obtained by the proposed framework better correlates with human assessments than the scores from other predictors. The framework’s modularity allows any features or predictors to be integrated into the facial attractiveness measure. Our proposed framework can be applied to many beauty-related fields, such as the plastic surgery, cosmetics, and entertainment industries.

1. Introduction

Attractiveness is one of the most critical social characteristics of the human face. Several studies have shown that facial attractiveness is considered to be a basis for social and intellectual competencies, such as mate choice and income [1,2]. In recent years, beauty-related industries have grown rapidly in many countries [3]. Thus, the analysis and measurement of facial attractiveness have garnered attention from scientists, physicians, and artists because of its many potential applications in entertainment, virtual media, plastic surgery, and cosmetic industries. Although it is debatable whether facial attractiveness is objective or subjective, recent empirical results support the idea that attractiveness is objective, achievable by measuring cross-cultural consistency [4], brain activity patterns [5], and infant preference [6]. Studies in psychology and medical science have also explored aesthetic evidence of what makes a face more attractive, finding facial averageness [7] and symmetry [8] to be important. That is, facial attractiveness increases as averageness and symmetry increase. Facial skin colors and texture are also significantly related to face attractiveness [9,10], and has been included in evaluations of facial attractiveness [11,12]. Moreover, research has shown that attractive faces should follow certain defined ratios of facial proportions, such as neoclassical canons [13] and the golden ratio [14] which have been believed to be ideal ratios for beautiful faces since ancient times by artists, physicians, and orthodontists [15]. In machine learning, several methods have been proposed to assess facial attractiveness by encoding these objective factors from a face. However, due to the improper feature extraction, these elements have not been investigated thoroughly. Moreover, they have not been compared and combined in an overall framework, even though this approach might decrease the gap between human and machine performance. Therefore, there is a need to develop an efficient framework as an initial step towards a machine obtaining human-level performance in predicting facial attractiveness. In this paper, we focus on developing a framework for assessing facial attractiveness based on facial proportion factors widely believed to be objective elements for facial beauty. The remainder of the paper is organized as follows. Section 2 presents a brief summary of previous machine learning approaches for assessing or enhancing facial attractiveness. Section 3 explains the proposed framework. Section 4 discusses the experimental results and possible applications. Conclusions and future work are addressed in Section 5.

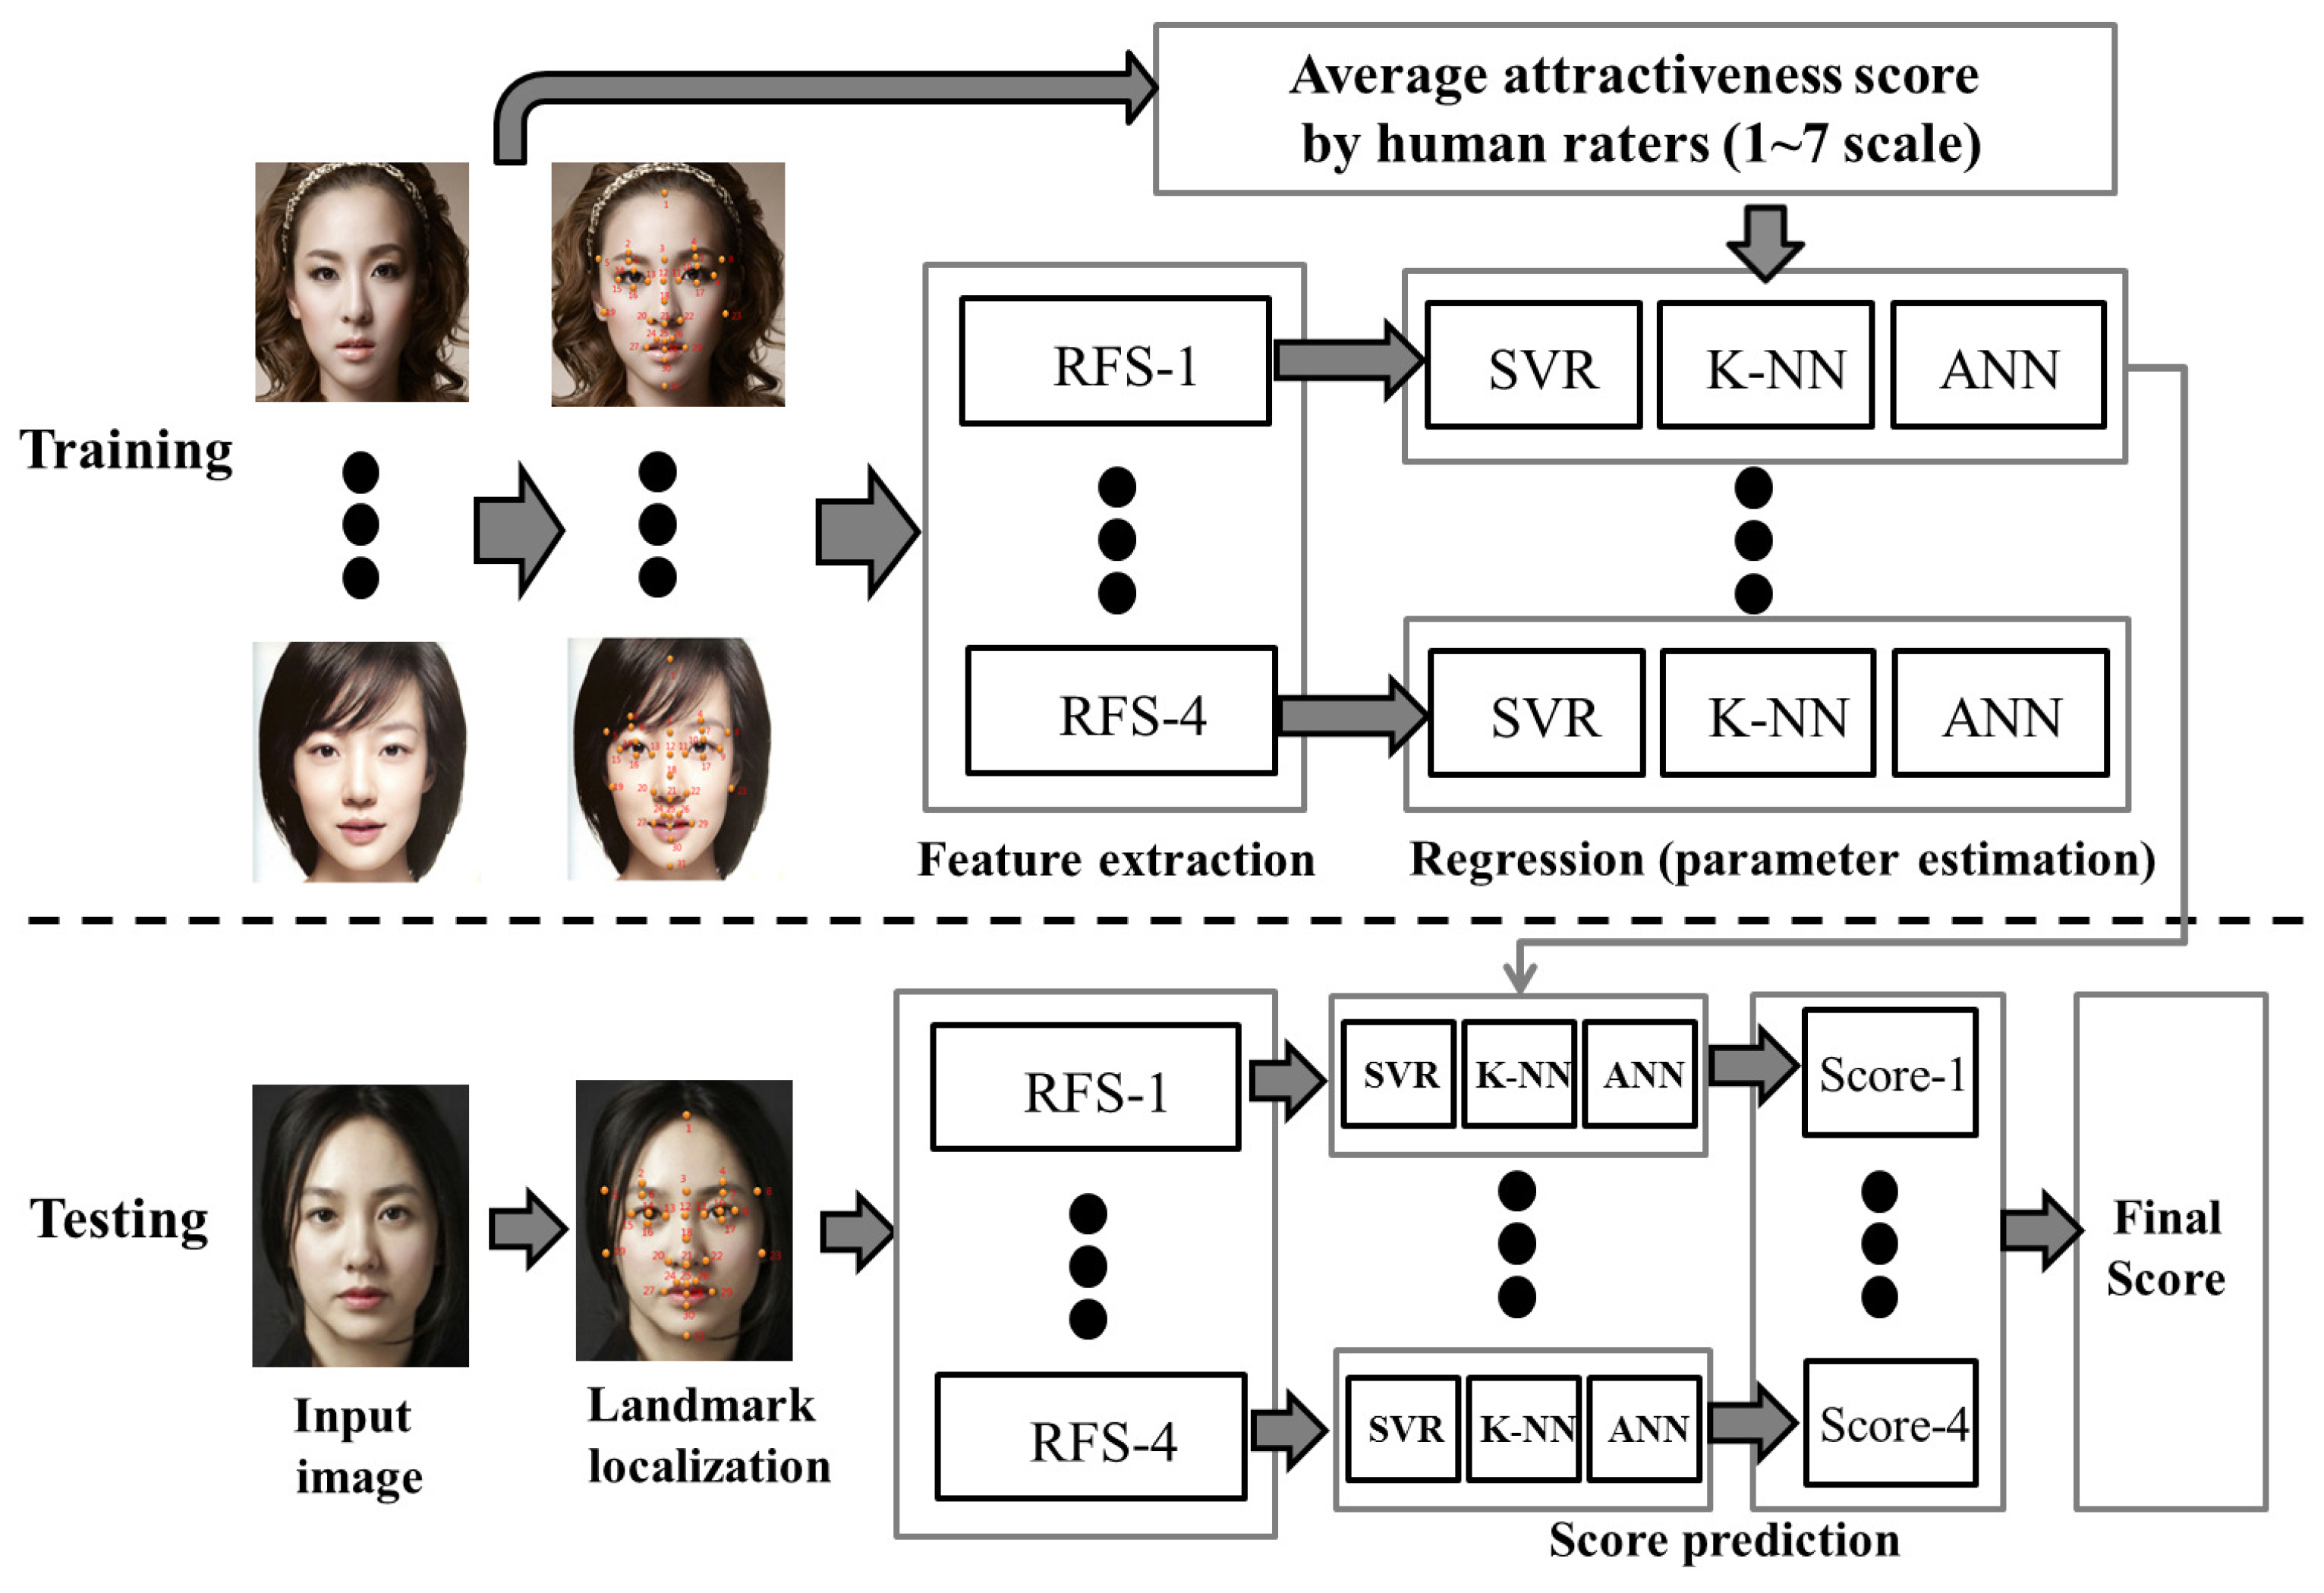
3. Proposed Framework

A flowchart of the proposed framework is illustrated in Figure 1. The framework consists training and testing procedures. In training, four facial ratio feature sets (RFSs) were extracted from each training image, along with the average attractiveness score from human raters. The optimal parameter sets of each predictor (based on regression) were obtained for each feature set. In testing, given an arbitrary face image, the trained predictor for each feature set was applied to corresponding feature sets to obtain scores for each. Then, the final score was fused at the score level. Due to the modular structure of the framework, any features and predictors can be applied. In the remainder of this section, we explain the proposed method in detail.
Figure 1. A proposed framework for assessing facial attractiveness.

3.1. Training Procedure

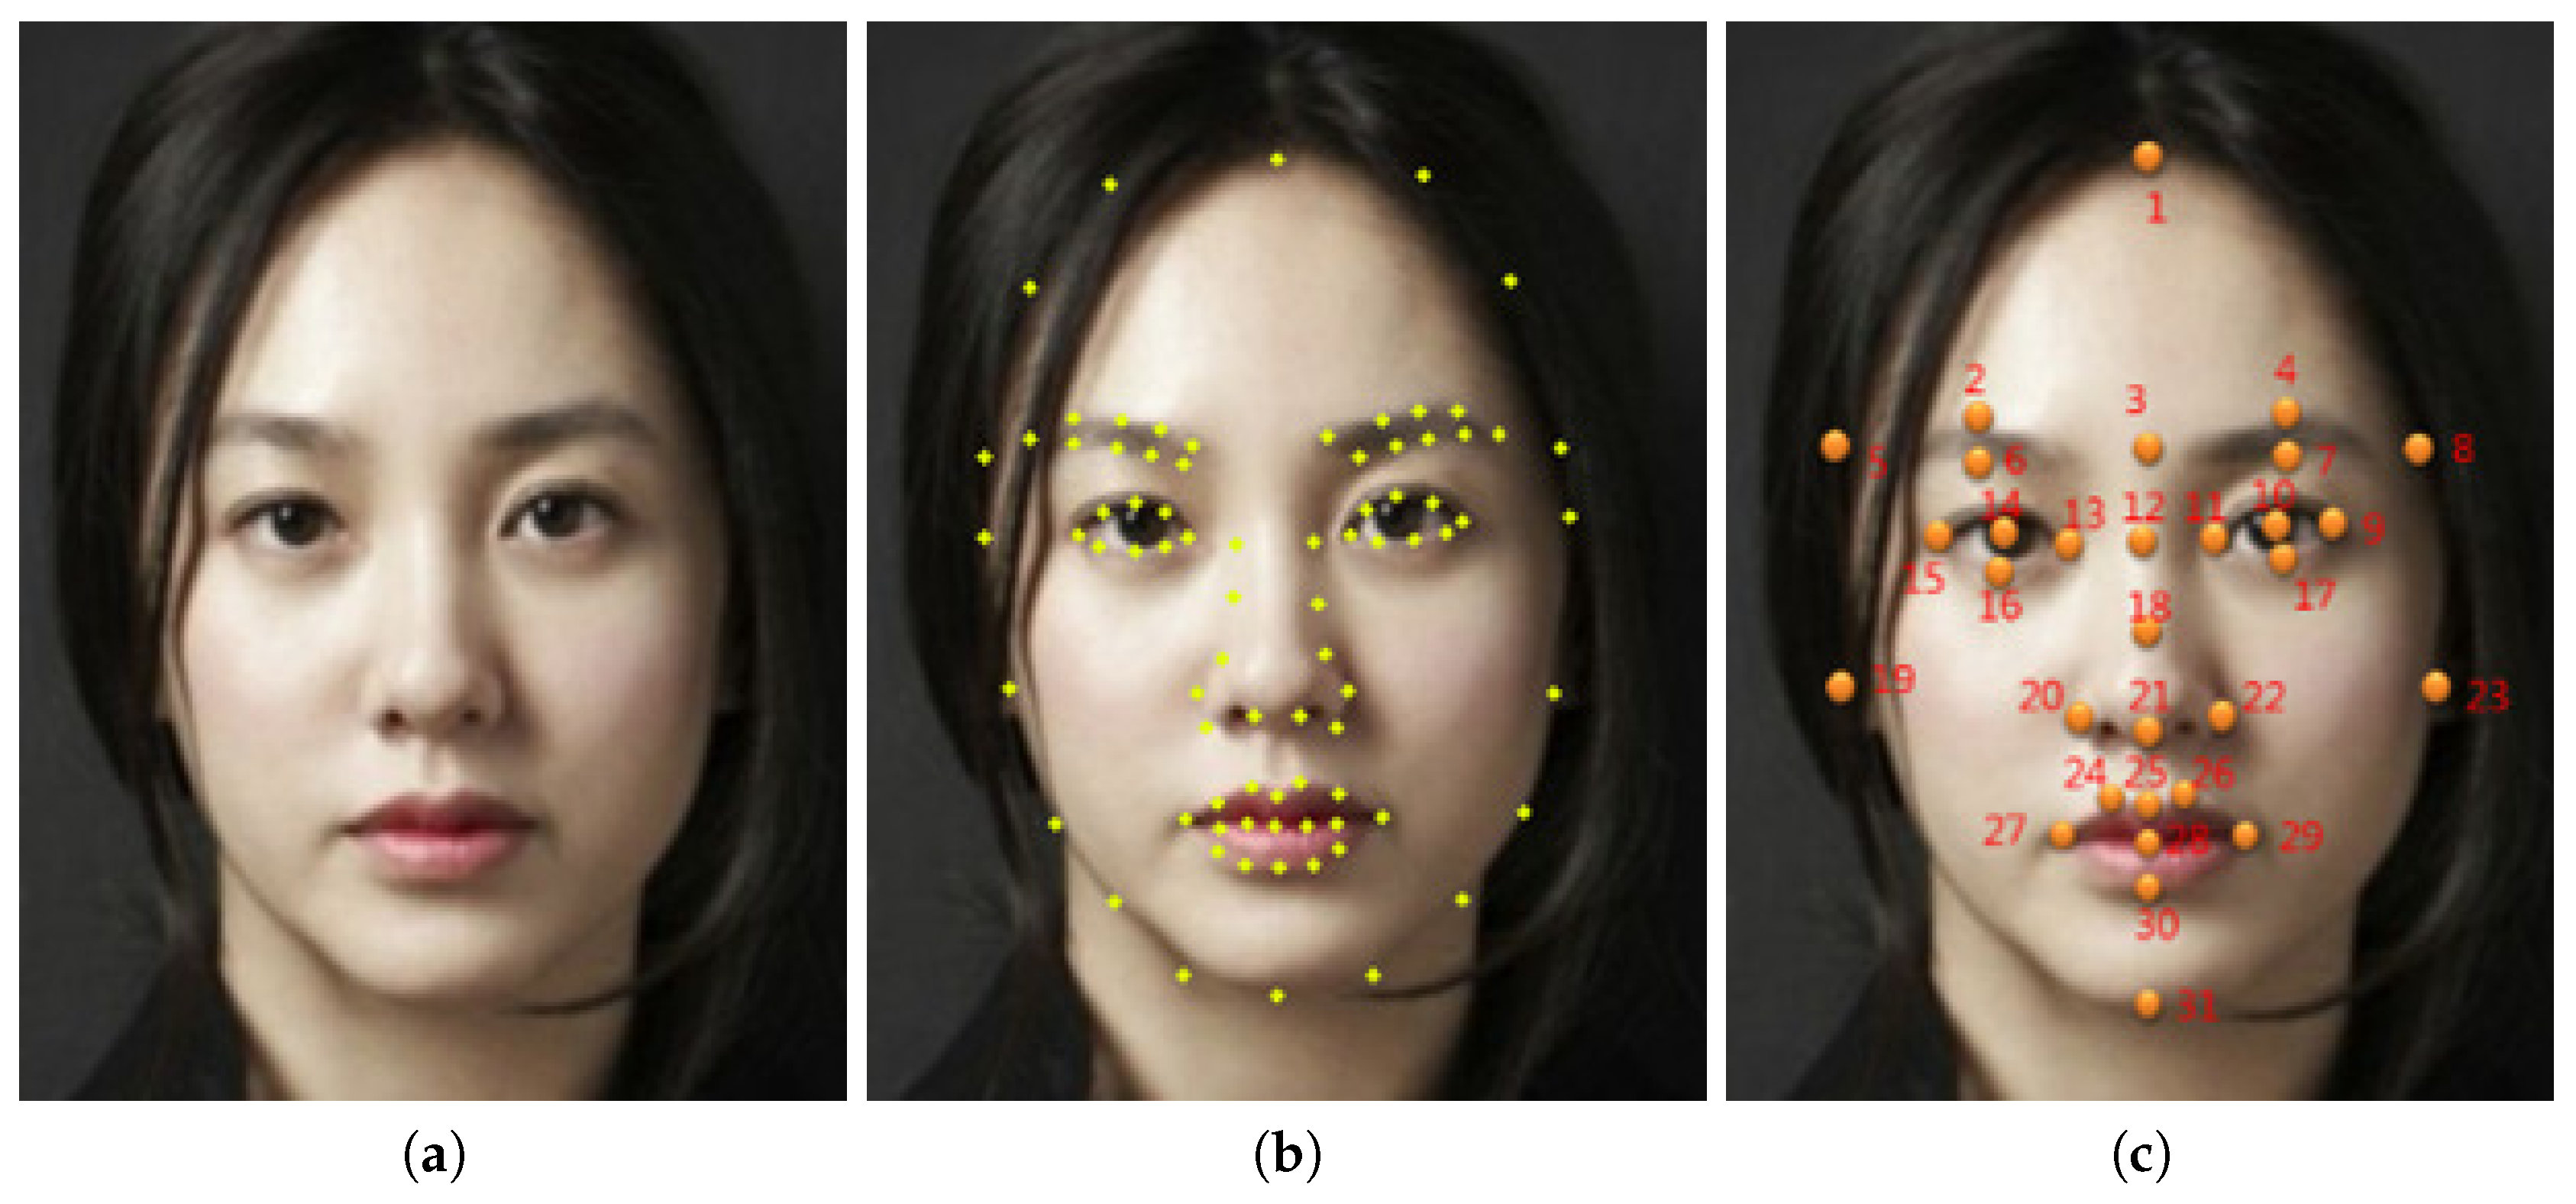
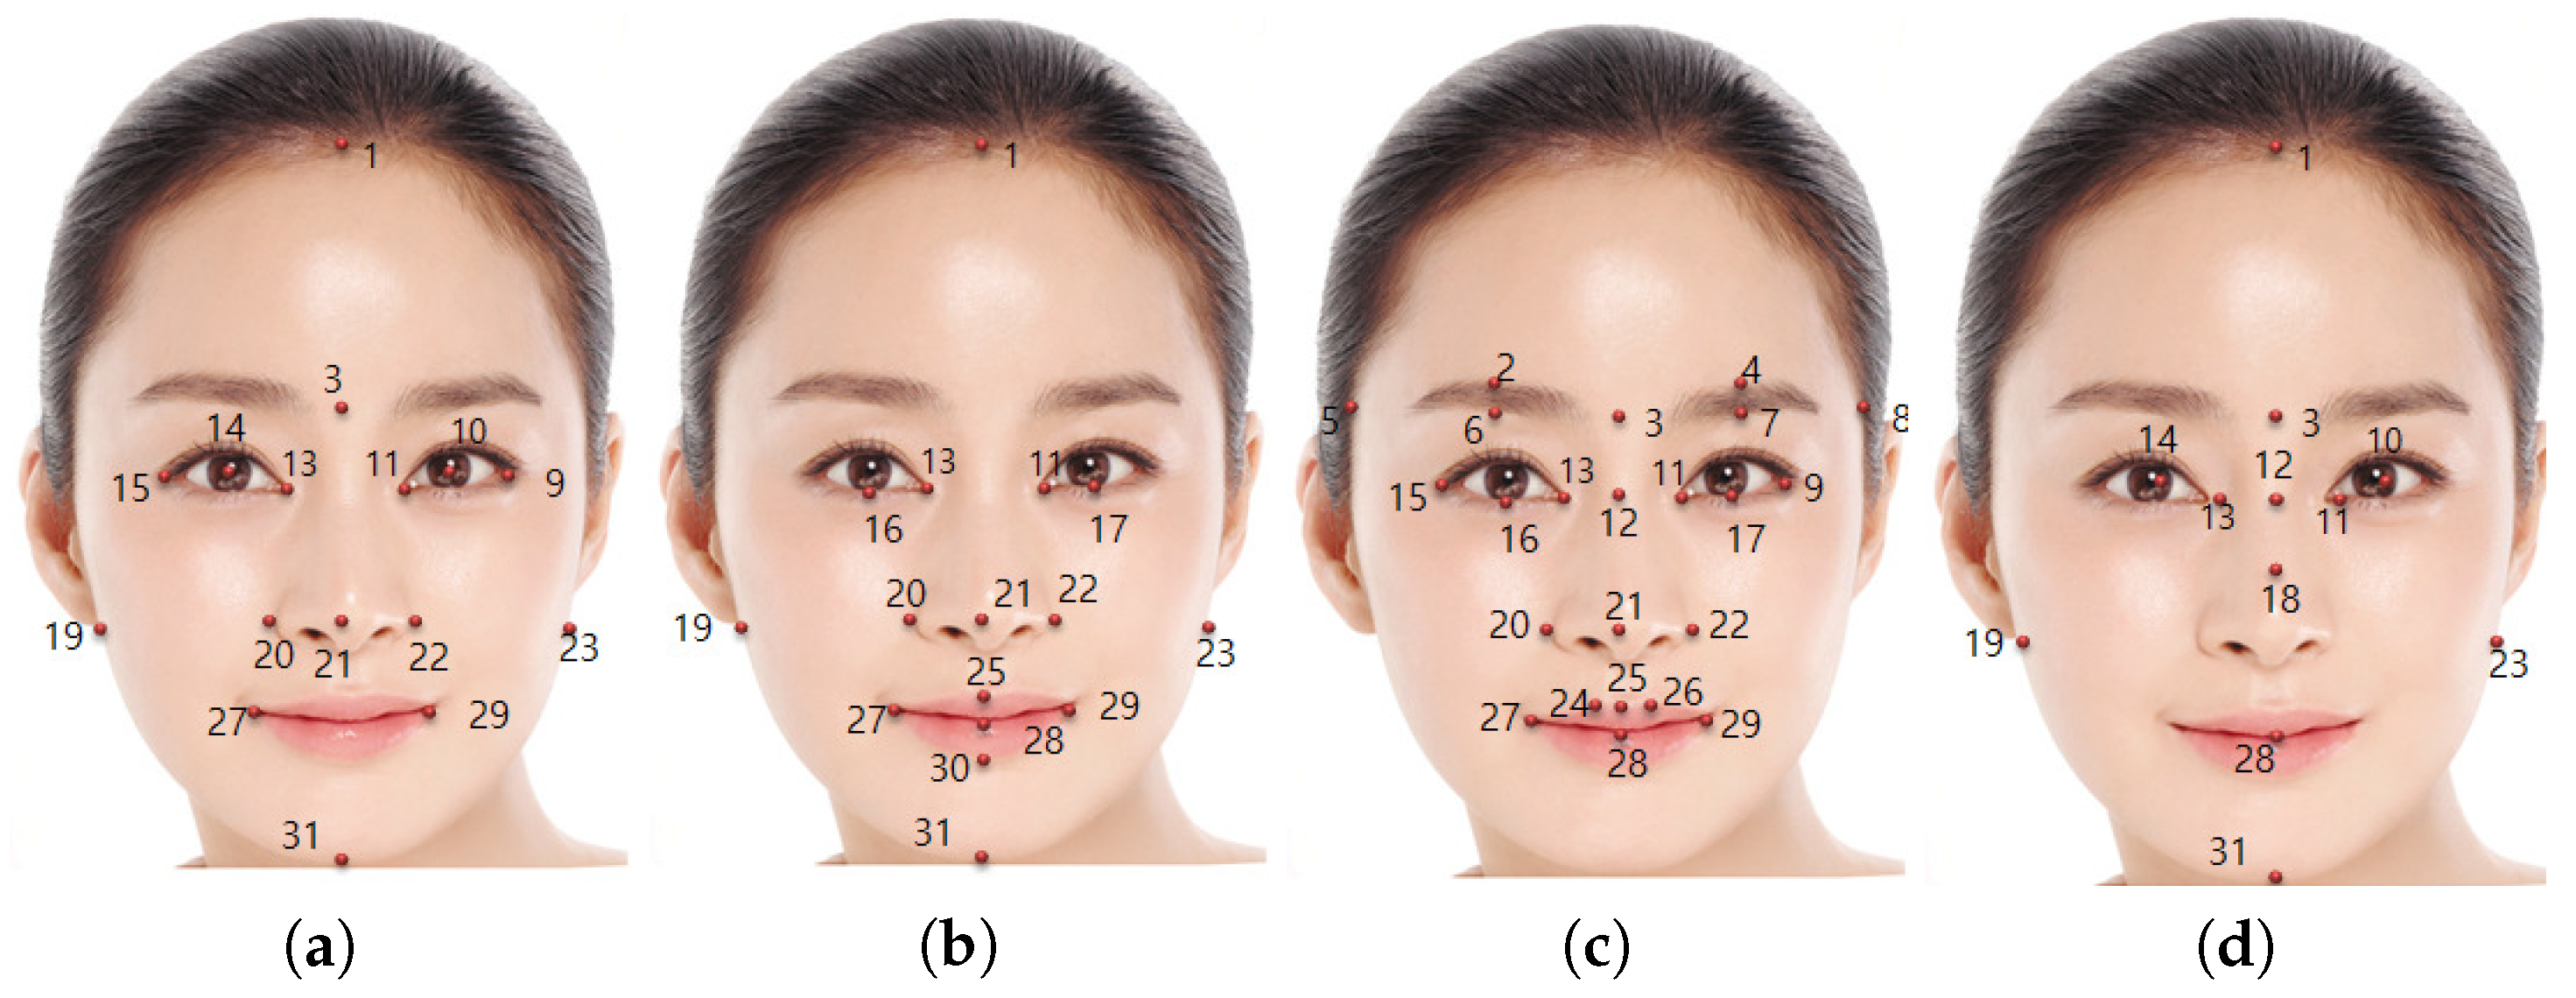
3.1.1. Facial Landmark Localization

To detect facial landmarks automatically, the active shape model (ASM)-based method [34] is applied to each face. The open source software STASM [35] was utilized as an initial detector for 81 predefined facial landmarks. Then, only 31 landmarks (covering the eyebrows, eyes, noses, mouth, forehead, and head contours), sufficient for calculating ratio feature values, were selected (see Figure 2).
Figure 2. Facial landmark localization: (a) Original face image; (b) 81 facial landmarks found by STASM [35]; (c) Refined set of 31 facial landmarks.

3.1.2. Ratio Feature Set (RFS) Extraction

After acquiring facial landmarks, ratio feature components which have been reported as an objective elements for facial attractiveness are extracted. Neoclassical canon refers to the ratio used by Renaissance artists to draw a beautiful face. Farkas et al. [13] summarized these rules into nine neoclassical features. Neoclassical canonical features were proposed long ago and, despite the changes in beauty standards over time, are still valid measures in the present age in anatomy, art, and medicine studies [36,37]. Although there is controversy over the correlation between the golden ratio and facial beauty [38,39,40,41], we tested it as one of our ratio feature sets, because it accounts for the ratio between elements of the eyes, nose, and mouth, as well as the aspect ratio of the width and height of the face. Symmetry is known to be important in evaluating facial attractiveness [12,18], and has been defined and studied in various ways. In many previous studies, symmetry was measured along the vertical axis of the face. In this study, we measured symmetry based on the center point of the face, thus considering both the left and right sides of the face [12,26]. In addition, eight ratio values have been proposed by artists and scientists [23,42,43,44]. This measure assumes that the facial contour is an ellipse and detects the exact position of the eyes and mouth to calculate eight proportional features, enabling simple measurements with several facial landmarks. Schmid et al. [26] analyzed the role of symmetry, neoclassical canons, and golden ratio for the determination of facial attractiveness. The basic premise is that portions of an attractive face should follow certain defined ratios. They summarized these principles in nine neoclassical canons (RFS-1), 14 golden ratios (RFS-2) and nine symmetry values (RFS-3). Moreover, according to [23], they applied eight ratio values (RFS-4) to determine the facial attractiveness. We call these four types of feature vectors as ratio feature sets (RFSs) hereafter. To assess facial attractiveness based on facial proportion features, we applied nine neoclassical canon (RFS-1), 14 golden ratio (RFS-2), nine symmetry (RFS-3), and eight ratio (RFS-4) values. A detailed description and used landmarks for calculating the feature sets are shown in Table 2 and Figure 3. In Table 2, dist(a,b) means Euclidean distance of the landmark a and b and mid(a,b) calculates the average point of the landmark a and b. These RFSs were incorporated as input vectors in our framework. Due to the different value ranges of each feature set, these RFSs were normalized. In the golden ratio set (RFS-2), attractive faces should have ratios approaching a value of 1.618. In the neoclassical canon (RFS-1) and symmetry (RFS-3) sets, the ratios should approach 1. Therefore, to normalize features into a unit interval [0, 1], we applied the exponential function to each ratio value as follows:
x n = e - ( x - m ) 2 ,
where x and x n denote the original and normalized ratio values, respectively, and m is 1.618 for RFS-2 and 1 for RFS-1 and RFS-3. Meanwhile, RFS-4 does not follow any predefined ratio, so min-max normalization was performed.
Table 2. Descriptions of the four feature sets (RFSs).
Figure 3. Landmarks for ratio feature sets (RFSs). (a) RFS-1: Neoclassical canons; (b) RFS-2: Golden ratio; (c) RFS-3: Symmetry; (d) RFS-4: Eight ratio values.

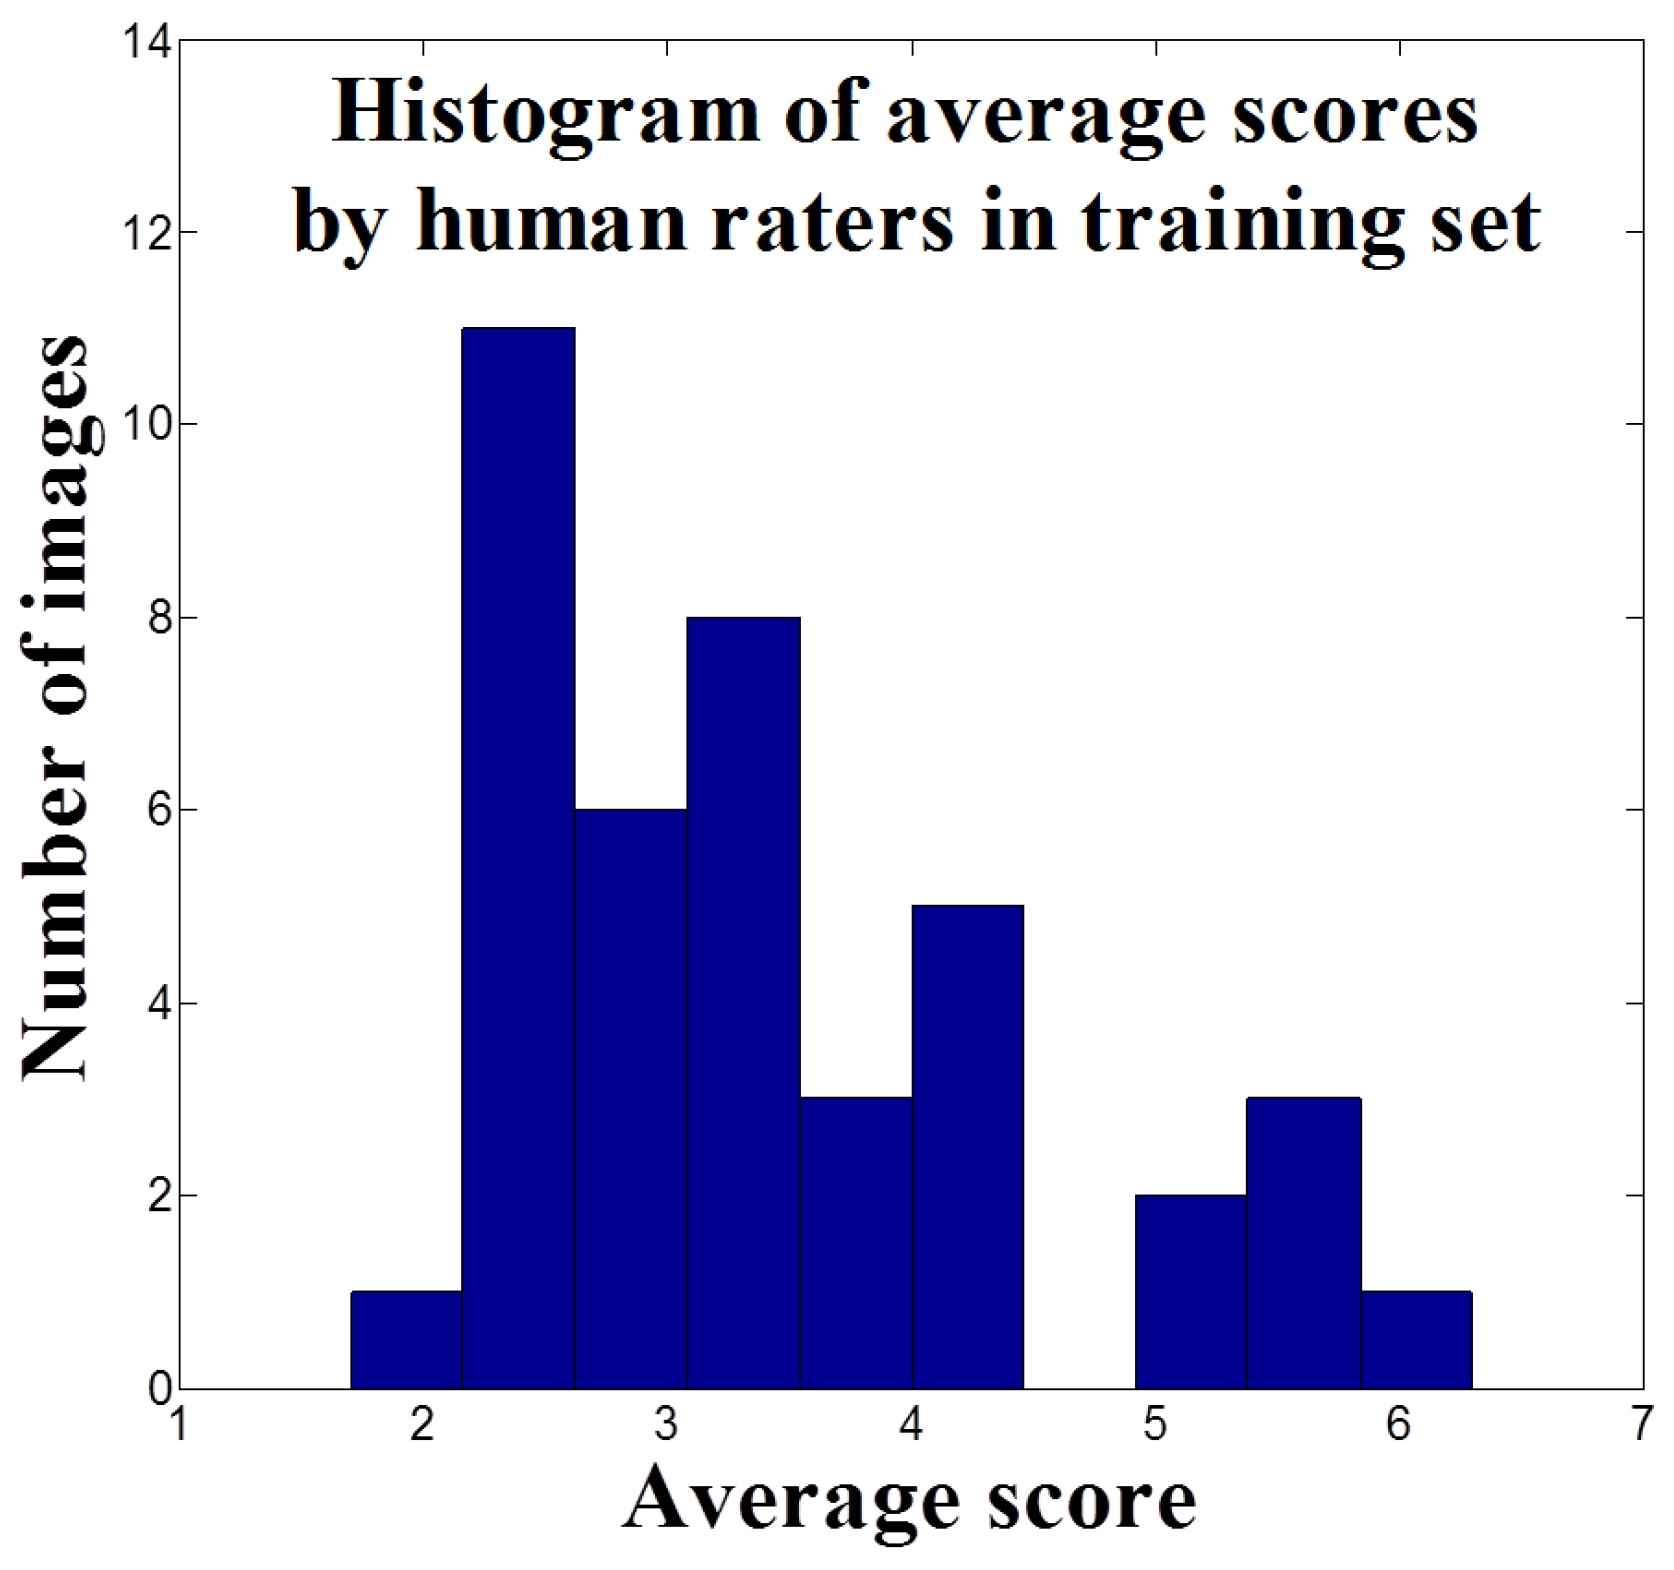
3.1.3. Dataset and Facial Attractiveness Rating by Humans

We used a collection of 80 frontal face image of Asian women with neutral expression. Half were randomly selected for training, and the remainder were used for testing. Thirteen human assessors (five men and eight women) were asked to score the attractiveness of each face on a seven-point scale (one being the least attractive and seven being the most attractive). There is subjectivity in each rater’s scoring [24]. For example, a score of four could be considered a high score for one rater, and an average score for another rater, we applied both z-score normalization and linear scaling transformation to keep the score values of each human rater within the same range. First, given a score set S of a human rater, the following z-score normalization was applied.
z i = s i - m e a n ( S ) s t d ( S )
where s i and z i denote the ith original and normalized score values, respectively, and m e a n ( · ) and s t d ( · ) denote the mean and standard deviation of a score set S. Then, to scale a score range from one (lower bound) to seven (upper bound), the z-scores are transformed according to:
z i = l b + z i - m i n ( Z ) m a x ( Z ) - m i n ( Z ) × ( u b - l b )
where l b and u b denote the lower bound and upper bound of a target score range, and m i n ( · ) and m a x ( · ) denote the minimum and maximum values of a given score set, respectively. Then, the final attractiveness score of each image was calculated by averaging each score from all human referees. Figure 4 shows the distribution of the average scores of each face in the training set (40 images).
Figure 4. Histogram of average scores by human raters in the training set. The mean and standard deviation value of the scores are 3.42 and 1.12, respectively.

3.1.4. Predictor Construction

The predictors used in our framework were trained based on the feature sets (Section 3.1.2) and attractiveness ratings from humans (Section 3.1.3). In this study, we adopted three well-known regression-based predictors, support vector regression (SVR), K-nearest neighbor (K-NN) and artificial neural network (ANN). SVR transforms and analyzes data in a high-dimensional feature space mapped by a kernel function; accordingly, it is possible to arrive at an optimal linear function from a small amount of data. Here, we applied a Gaussian radial basis function (RBF) for kernel selection; parameters for training the RBF-SVR can be optimally selected during training and validation. K-NN regression is used to estimating facial attractiveness scores by analyzing a certain number K of the nearest feature vectors to the training samples. We used a weighted average of the K nearest neighbors, the weight of which was decided by the Euclidean distance of the K closest training samples. For ANN regression, we applied a multi-layer perceptron (MLP) composed of an input layer, hidden layers, and an output layer. Each layer has one or more neurons directionally linked with the neurons from the previous and next layers. A sigmoid function was applied as the activation function to compute the output of the hidden layer in each neuron. Due to the paucity of large training data, we used leave-one-out cross validation (LOOCV) to estimate the optimal parameter sets for each predictor. LOOCV involves using one training sample as a validation set and the remaining samples as the training set when building a target model. This process was repeated for each of the available training samples. Then, the optimal parameter sets allowing the lowest mean square error (MSE) were applied to build each predictor. The predictors then estimated attractiveness scores in a testing procedure. The parameter ranges considered in each score predictor are shown in Table 3.
Table 3. Parameter ranges of each score predictor.

3.2. Testing Procedure

In testing, given a new image, RFSs were extracted by the same procedure as in the training step. Then, trained score predictors were applied to each RFS. Hence, for each RFS, three intermediate attractiveness scores were obtained. Even the score for each predictor can be utilized to estimate the attractiveness score, we applied a score fusion scheme to reduce the dependence on single score predictors and increase prediction performance. Score level fusion techniques are widely used in pattern recognition applications to enhance accuracy [45]. Among various kinds of score fusion schemes (average, product, maximum, minimum rule, etc.), average rule performed best in our case.
Table 4 shows the Pearson correlation value according to different fusion scenarios (different predictor fusion). As shown in Table 4, average score of three predictors has the best performance compared to the performance of the single or average score of only two predictors. Accordingly, for each RFS, the average score ( S R F S = a v g ( S S V R , S K N N , S A N N ) ) of the three predictors was calculated. Then the final attractiveness score ( S F ) was calculated as follows:
S F = a v g ( S RFS - 1 , S RFS - 2 , S RFS - 3 , S RFS - 4 )
Table 4. The performance (Pearson correlation value) comparison of different fusion scenarios.

4. Experimental Results

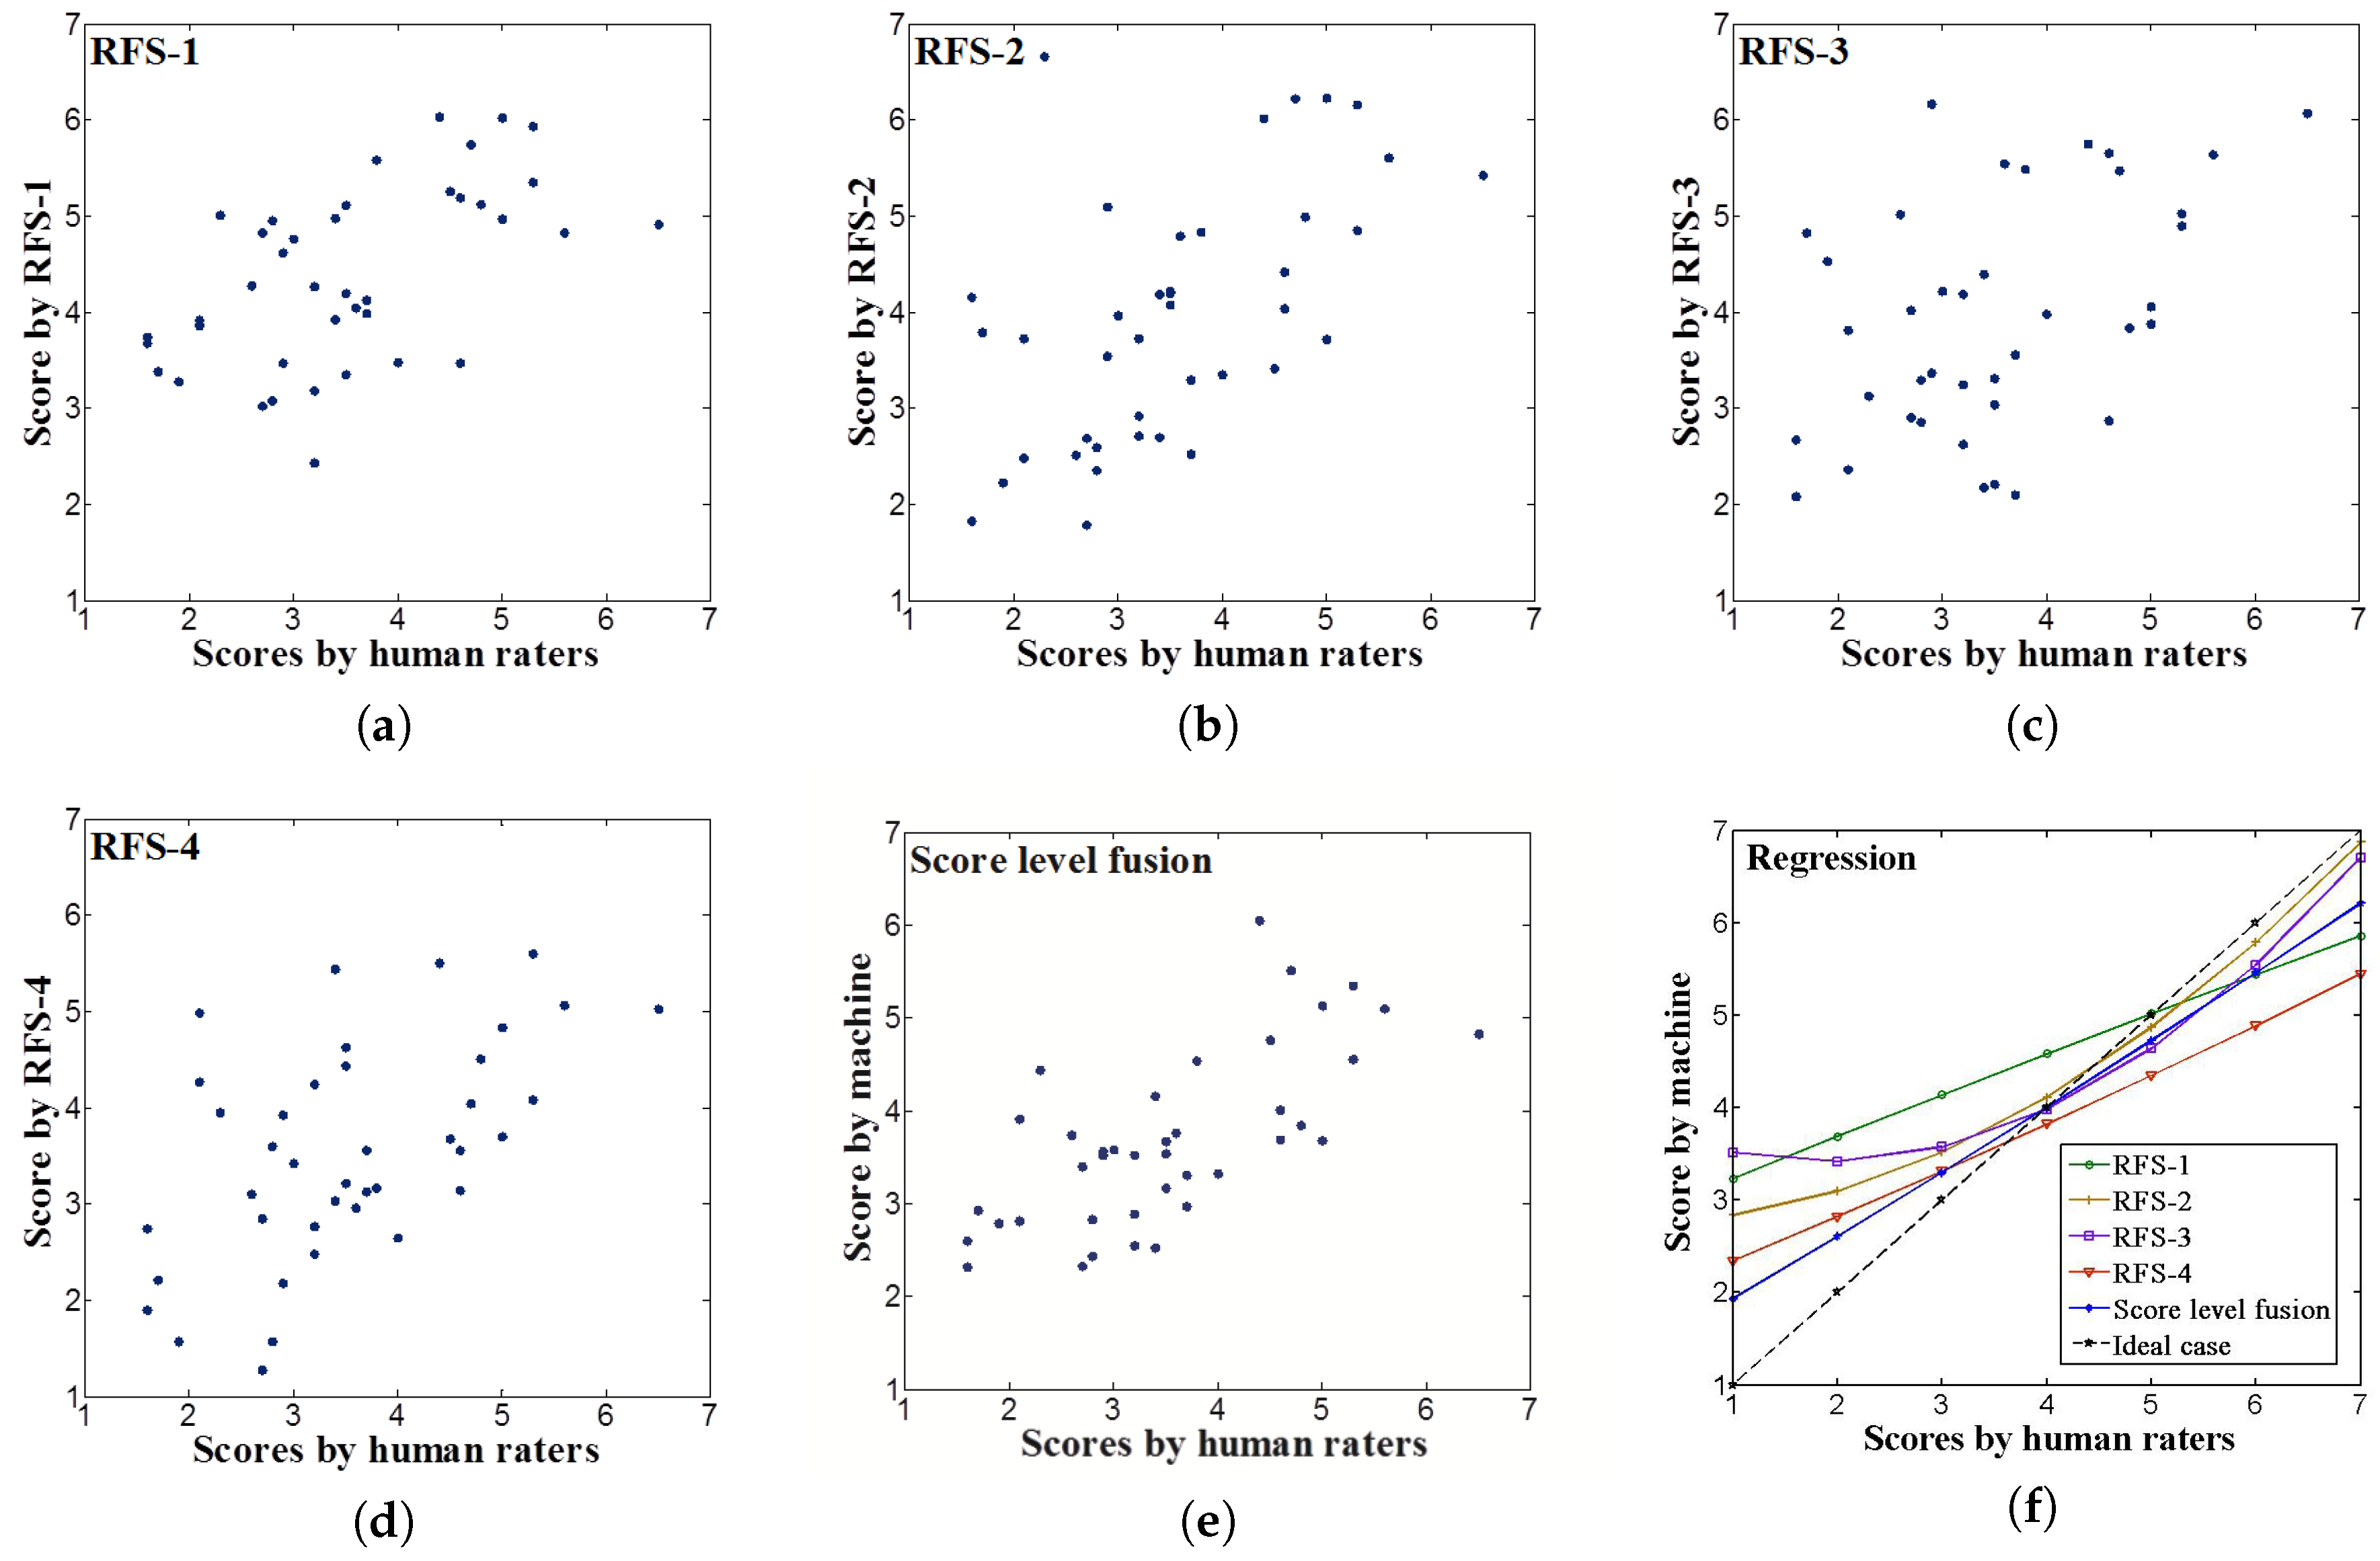
4.1. Comparison with Human-Level Performance
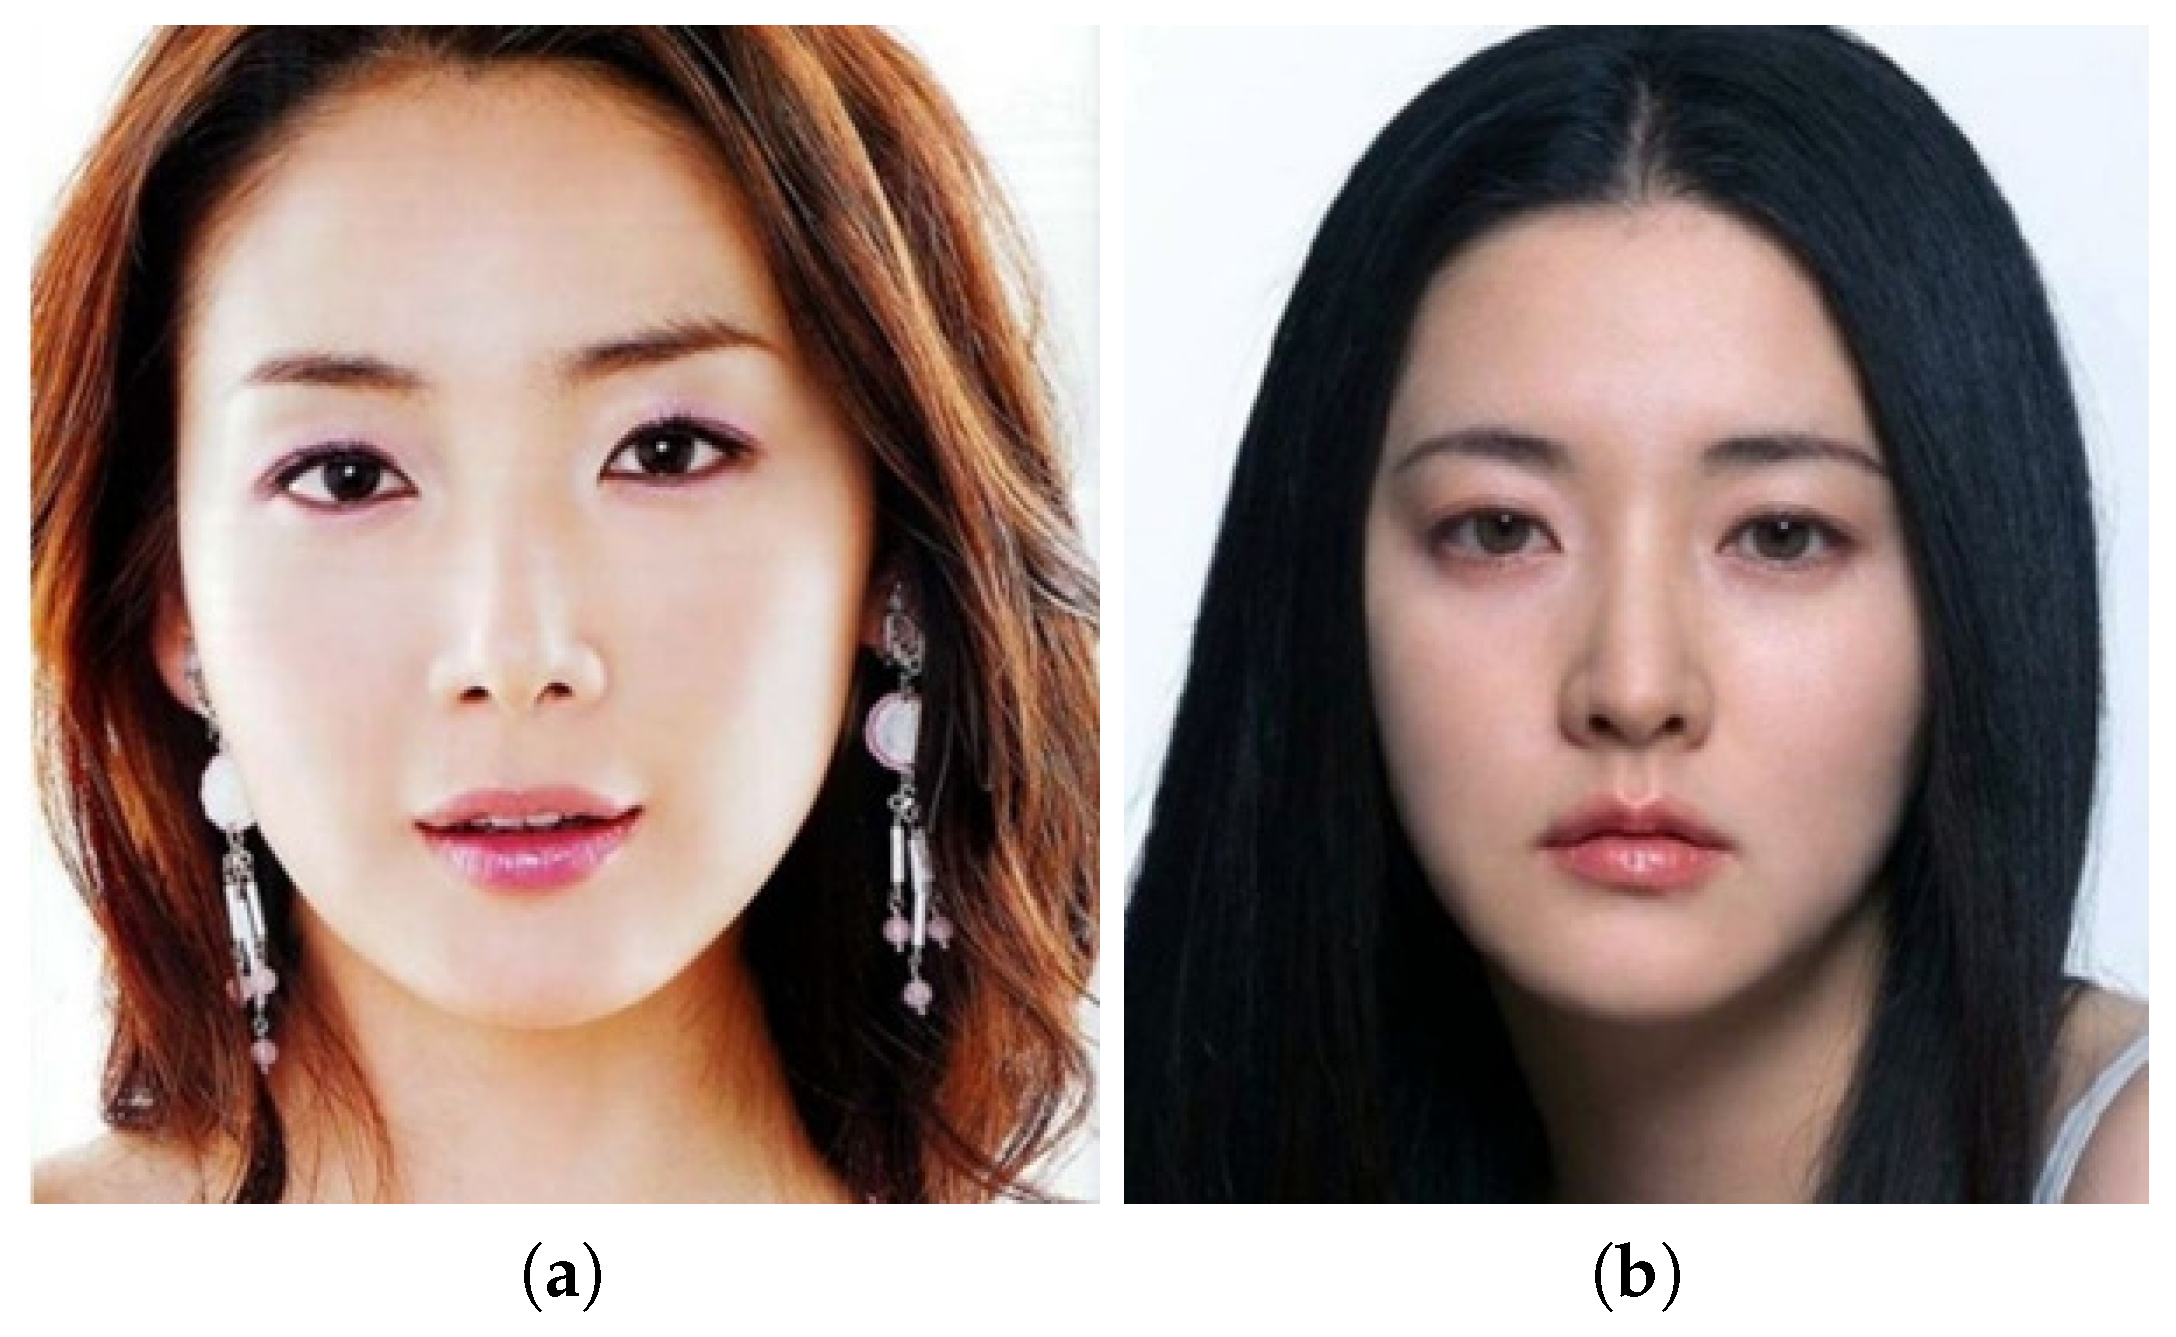
The aim of this evaluation was to analyze the performance of each RFS with that of human assessors and to validate the performance improvement by our framework. As described in Section 3.1.3, 40 female faces were evaluated on a seven-point scale by 13 human assessors; additionally, SVR, KNN and ANN predictors were applied to each of the four RFSs and their average was the final attractiveness score. We therefore compared how human scoring correlates with machine scoring of attractiveness measures. Comparative performance was evaluated using Pearson correlation and MSE. As shown in Figure 5 and Table 5, each feature set has relatively high correlation with human raters in the test set.
Figure 5. Correlation between predicted scores and average human scores in the test set (ae) and regression curves of predictive scores and average human scores in the test set (f): (a) RFS-1; (b) RFS-2; (c) RFS-3; (d) RFS-4; (e) score level fusion; (f) regression curves.
Table 5. Correlation, MSE and R-squared between the predicted and human scores.
In Figure 5, the x-axis represents scores from human raters on a seven-point scale, and the y-axis denotes corresponding prediction values from our framework. Neoclassical canons (RFS-1) and golden ratio values (RFS-2) have similar high correlation values. However, in the case of symmetry (RFS-3), the distribution of predicted values is more scattered, which corroborates studies that have shown that symmetry has less influence on facial attractiveness than other measures [12,20,21]. Score fusion for each RFS shows the highest correlation with human judgement. Since the factors that determine facial attractiveness are diverse and complicated, a single feature does not entirely estimate the attractiveness of a face, verifying that fusing complementary feature sets can improve attractiveness evaluation performance.
Also, we performed multiple regression analysis based on second order polynomial model to find which measure is the most predictive of human scores. As shown in Figure 5f, the regression curve for score fusion (blue curve) is the most similar with the ideal case (black dotted line). The second similar measure is RFS-2, and the less predictive ones are RFS-1 and RFS-3. As a result, fusion of four feature sets was found to be the most predictive of the human scores. After fitting data with our model, we have to evaluate the goodness of fit. To calculate the goodness of fit, we applied the well-known R-Square ( R 2 ) statistic. R 2 measures how successful the fit is in explaining the variation of the data so it represents the reliability of the predicted regression function. It is defined as the ratio of the sum of squares of the regression and the total sum of squares. It can take on any value between 0 and 1, with a value closer to 1 indicating that a greater proportion of variance is accounted for by the model. As shown in Table 5, the R 2 value of score fusion is the highest compared to other measure (four RFSs). Consequently, it was confirmed that score fusion is the most predictive of the human score among the attractiveness scores of each RFS.

4.2. Applications

Our framework can be applied to many areas, such as beauty ranking and plastic surgery. For example, Figure 6 demonstrates the predicted attractiveness scores of two female Korean celebrities. The two celebrities have relatively higher attractiveness scores than the average in our test set (3.69). Figure 7 shows the validation of a facial beauty enhancement method [27] using the proposed framework. An increase in beauty score is observed from the original to the beauty-enhanced face image. Hence, it is possible to evaluate surgery results, or to recommend methods of attractiveness enhancement based on our framework.
Figure 6. Examples of predicted attractiveness score. Two Korean female celebrities, (a,b), obtain scores of 5.1 and 5.34, respectively. Note that the average and standard deviation values of our test set are 3.69 and 0.69, respectively.
Figure 7. Examples of the validation of a facial beauty enhancement system [27]. The facial attractiveness score increases from 2.82 (original face (a)) to 4.44 (beauty enhanced face (b)) after applying the facial beauty enhancement system.

5. Conclusions

In this study, we have proposed a novel framework for assessing facial attractiveness. The proposed framework utilizes four types of ratio feature sets derived from universal standards of facial beauty. To enhance the system’s performance to be comparable to human rating, three types of regression-based predictors were incorporated to estimate an attractiveness score, and score level fusion was performed. Experimental results showed that the attractiveness score obtained by score fusion better correlates with those of human assessors than scores from other predictors, indicating that a fusion of multiple facial proportion features, rather than a single feature, can provide better performance for automatic facial beauty evaluation and enhancement. In addition, our result showed that symmetry performed more poorly than other proportion-based features, supporting the conclusion of other studies.
Our proposed method has shown that simple proportion-based facial attractiveness measurements, such as symmetry, the golden ratio, and neoclassical canon, are associated with human judgement. Combining complementary proportion features can improve prediction performance and it is the most predictive of the human scores. Moreover, the modularity of the proposed framework enables any features or predictors to be integrated into automatic facial attractiveness measurements. Therefore, the framework can be utilized in various attractiveness evaluation and enhancement applications. Our future work consists of consolidating the framework by increasing the face dataset with diverse human referees; adopting more facial shape features, such as averageness and femininity; considering facial appearance features such as colors, tones, and texture; finding the most predictive features and modeling method compatible with human scoring; analyzing face attractiveness in various races and genders; and extending the framework to measure the facial impressions (trustworthiness, dominance, etc.) in social dimensions.

Acknowledgments

This work was supported by a KIST Institutional Program [Project No. 27190 and No. 2V05260].

Author Contributions

I.K. and H.C. conceived and designed the experiments; Y.H. performed the experiments; Y.H . and H.C. analyzed the data; G.P.N. and J.C. contributed analysis tools; Y.H. wrote the paper. All authors read and approved the final manuscript.

Conflicts of Interest

The authors declare no conflict of interest.

References

  1. Rhodes, G. The evolutionary psychology of facial beauty. Annu. Rev. Psychol. 2006, 57, 199–226. [Google Scholar] [CrossRef] [PubMed]
  2. Said, C.P.; Todorov, A. A statistical model of facial attractiveness. Psychol. Sci. 2011, 22, 1183–1190. [Google Scholar] [CrossRef] [PubMed]
  3. Adamson, P.A.; Galli, S.K.D. Modern concepts of beauty. Plast. Surg. Nurs. 2009, 29, 5–9. [Google Scholar] [CrossRef] [PubMed]
  4. Perrett, D.I.; May, K.A.; Yoshikawa, S. Facial shape and judgements of female attractiveness. Nature 1994, 368, 239–242. [Google Scholar] [CrossRef] [PubMed]
  5. Winston, J.S.; O’Doherty, J.; Kilner, J.M.; Perrett, D.I.; Dolan, R.J. Brain systems for assessing facial attractiveness. Neuropsychologia 2007, 45, 195–206. [Google Scholar] [CrossRef] [PubMed]
  6. Rubenstein, A.J.; Kalakanis, L.; Langlois, J.H. Infant preferences for attractive faces: A cognitive explanation. Dev. Psychol. 1999, 35, 848–855. [Google Scholar] [CrossRef] [PubMed]
  7. Langlois, J.H.; Roggman, L.A. Attractive faces are only average. Psychol. Sci. 1990, 1, 115–121. [Google Scholar] [CrossRef]
  8. Rhodes, G.; Proffitt, F.; Grady, J.M.; Sumich, A. Facial symmetry and the perception of beauty. Psychon. Bull. Rev. 1998, 5, 659–669. [Google Scholar] [CrossRef]
  9. Fink, B.; Grammer, K.; Thornhill, R. Human (Homo sapiens) facial attractiveness in relation to skin texture and color. J. Comp. Psychol. 2001, 115, 92–99. [Google Scholar] [CrossRef] [PubMed]
  10. Jones, A.L.; Russell, R.; Ward, R. Cosmetics Alter Biologically-Based Factors of Beauty: Evidence from Facial Contrast. Evol. Psychol. 2015, 13, 210–229. [Google Scholar] [CrossRef] [PubMed]
  11. Kagian, A.; Dror, G.; Leyvand, T.; Cohen-Or, D.; Ruppin, E. A humanlike predictor of facial attractiveness. In Proceedings of the Advances in Neural Information Processing Systems, Vancouver, BC, Canada, 3 December 2007; pp. 649–656. [Google Scholar]
  12. Jones, A.L. The influence of shape and colour cue classes on facial health perception. Evol. Hum. Behav. 2017, in press. [Google Scholar] [CrossRef]
  13. Farkas, L.G.; Hreczko, T.A.; Kolar, J.C.; Munro, I.R. Vertical and horizontal proportions of the face in young adult north american caucasians: A revision of neoclassical canons. Plast. Reconstr. Surg. 1985, 75, 328–337. [Google Scholar] [CrossRef] [PubMed]
  14. Narain, D.L. The Golden Ratio. Availabel online: http://cuip.uchicago.edu/~dlnarain/golden/ (accessed on 5 April 2017).
  15. Jefferson, Y. Facial beauty: Establishing a universal standard. Int. J. Orthod. 2004, 15, 9–22. [Google Scholar]
  16. Galton, F. Composite portraits, made by combining those of many different persons into a single resultant figure. J. Anthropol. Inst. Greatt. Br. Irel. 1879, 8, 132–144. [Google Scholar] [CrossRef]
  17. Thomas, R.A.; Michael, R.C. Averaged faces are attractive, but very attractive faces are not average. Psychol. Sci. 1991, 2, 123–125. [Google Scholar]
  18. Grammer, K.; Thornhill, R. Human (Homo sapiens) facial attractiveness and sexual selection: The role of symmetry and averageness. J. Comp. Psychol. 1994, 108, 233–242. [Google Scholar] [CrossRef] [PubMed]
  19. Perrett, D.I.; Lee, K.J.; Penton-Voak, I.; Rowland, D.; Yoshikawa, S.; Burt, D.M.; Henzi, S.P.; Castlesm, D.L.; Akamatsu, S. Effects of sexual dimorphism on facial attractiveness. Nature 1998, 394, 884–887. [Google Scholar] [CrossRef] [PubMed]
  20. Scheib, J.E.; Gangestad, S.W.; Thornhill, R. Facial attractiveness, symmetry and cues of good genes. Proc. Biol. Sci. 1999, 266, 1913–1917. [Google Scholar] [CrossRef] [PubMed]
  21. Bronstad, P.M.; Russell, R. Computational models of facial attractiveness judgments. Perception 2008, 37, 126–142. [Google Scholar] [CrossRef] [PubMed]
  22. Jones, B.C.; Little, A.C.; Burt, D.M.; Perrett, D.I. When facial attractiveness is only skin deep. Perception 2004, 33, 569–576. [Google Scholar] [CrossRef] [PubMed]
  23. Aarabi, P.; Hughes, D.; Mohajer, K.; Emami, M. The automatic measurement of facial beauty. In Proceedings of the IEEE International Conference on Systems, Man, and Cybernetics, Tucson, AZ, USA, 7–10 October 2001; Volume 4, pp. 2644–2647. [Google Scholar]
  24. Gunes, H.; Piccardi, M. Assessing facial beauty through proportion analysis by image processing and supervised learning. Int. J. Hum.-Comput. Stud. 2006, 64, 1184–1199. [Google Scholar] [CrossRef]
  25. Eisenthal, Y.; Dror, G.; Ruppin, E. Facial attractiveness: Beauty and the machine. Neural Comput. 2006, 18, 119–142. [Google Scholar] [CrossRef] [PubMed]
  26. Schmid, K.; Marx, D.; Samal, A. Computation of a face attractiveness index based on neoclassical canons, symmetry, and golden ratio. Pattern Recogn. 2008, 41, 2710–2717. [Google Scholar] [CrossRef]
  27. Leyvand, T.; Cohen-Or, D.; Dror, G.; Lischinski, D. Data-driven enhancement of facial attractiveness. In Proceedings of the ACM SIGGRAPH, Los Angeles, CA, USA, 11–15 August 2008; pp. 38.1–38.9. [Google Scholar]
  28. O’Toole, A.J.; Price, T.; Vetter, T.; Bartlett, J.C.; Blanz, V. 3D shape and 2D surface textures of human faces: The role of “averages” in attractiveness and age. Image. Vis. Comput. 1999, 18, 9–19. [Google Scholar] [CrossRef]
  29. Fink, B.; Grammer, K.; Matts, P.J. Visible skin color distribution plays a role in the perception of age, attractiveness, and health in female faces. Evol. Hum. Behav. 2006, 27, 433–442. [Google Scholar] [CrossRef]
  30. Jang, K.S.; Bayome, M.; Park, J.H.; Park, K.H.; Moon, H.B.; Kook, Y.A. A three-dimensional photogrammetric analysis of the facial esthetics of the Miss Korea pageant contestants. Korean J. Orthod. 2017, 47, 87–99. [Google Scholar] [CrossRef] [PubMed]
  31. Vezzetti, E.; Marcolin, F.; Tornincasa, S.; Ulrich, L.; Dagnes, N. 3D geometry-based automatic landmark localization in presence of facial occlusions. Multimed. Tools Appl. 2017, in press. [Google Scholar] [CrossRef]
  32. Marcolin, F.; Vezzetti, E. Novel descriptors for geometrical 3D face analysis. Multimed. Tools Appl. 2017, 76, 13805–13834. [Google Scholar] [CrossRef]
  33. Liao, Q.; Jin, X.; Zeng, W. Enhancing the Symmetry and Proportion of 3D Face Geometry. IEEE Trans. Vis. Comput. Graph. 2012, 18, 1704–1716. [Google Scholar] [CrossRef] [PubMed]
  34. Cootes, T.; Taylor, C.; Cooper, D.; Graham, J. Active shape models—Their traning and application. Comput. Vis. Image Underst. 1995, 61, 38–59. [Google Scholar] [CrossRef]
  35. Milborrow, S.; Nicolls, F. Locating facial features with an extended active shape model. In Proceedings of the ECCV, Marseille, France, 12–18 October 2008; pp. 504–513. [Google Scholar]
  36. Torsello, F.; Mirigliani, L.; D’Alessio, R.; Deli, R. Do the neoclassical canons still describe the beauty of faces? An anthropometric study on 50 Caucasian models. Prog. Orthod. 2010, 11, 13–19. [Google Scholar] [CrossRef] [PubMed]
  37. Mommaerts, M.Y.; Moerenhout, B.A. Ideal proportions in full face front view, contemporary versus antique. J. Craniomaxillofac. Surg. 2011, 39, 107–110. [Google Scholar] [CrossRef] [PubMed]
  38. Naini, F.B.; Moss, J.P.; Gill, D.S. The enigma of facial beauty: Esthetics, proportions, deformity, and controversy. Am. J. Orthod. Dentofacial. Orthop. 2006, 130, 277–282. [Google Scholar] [CrossRef] [PubMed]
  39. Pancherz, H.; Knapp, V.; Erbe, C.; Heiss, A.M. Divine proportions in attractive and nonattractive faces. World J. Orthod. 2010, 11, 27–36. [Google Scholar] [PubMed]
  40. Magne, P.; Gallucci, G.O.; Belser, U.C. Anatomic crown width/length ratios of unworn and worn maxillary teeth in white subjects. J. Prosthet. Dent. 2003, 89, 453–461. [Google Scholar] [CrossRef]
  41. Ong, E.; Brown, R.A.; Richmond, S. Peer assessment of dental attractiveness. Am. J. Orthod. Dentofacial. Orthop. 2006, 130, 163–169. [Google Scholar] [CrossRef] [PubMed]
  42. Cunningham, M.R. Measuring the physical in physical attractiveness: Quasi-experiments on the sociobiology of female facial beauty. J. Personal. Soc. Psychol. 1986, 50, 925–935. [Google Scholar] [CrossRef]
  43. Johnston, V.S.; Franklin, M. Is beauty in the eye of the beholder? Ethol. Sociobiol. 1993, 14, 183–199. [Google Scholar] [CrossRef]
  44. Etcoff, N.L. Beauty and the beholder. Nature 1994, 368, 186–187. [Google Scholar] [CrossRef] [PubMed]
  45. Jain, A.; Nandakumar, K.; Ross, A. Score normalization in multimodal biometric systems. Pattern Recogn. 2005, 38, 2270–2285. [Google Scholar] [CrossRef]

Article Metrics

Citations

Article Access Statistics

Multiple requests from the same IP address are counted as one view.