Deep Learning-Based Iris Segmentation for Iris Recognition in Visible Light Environment

 ,
, 
Abstract
:1. Introduction
2. Related Works
- -
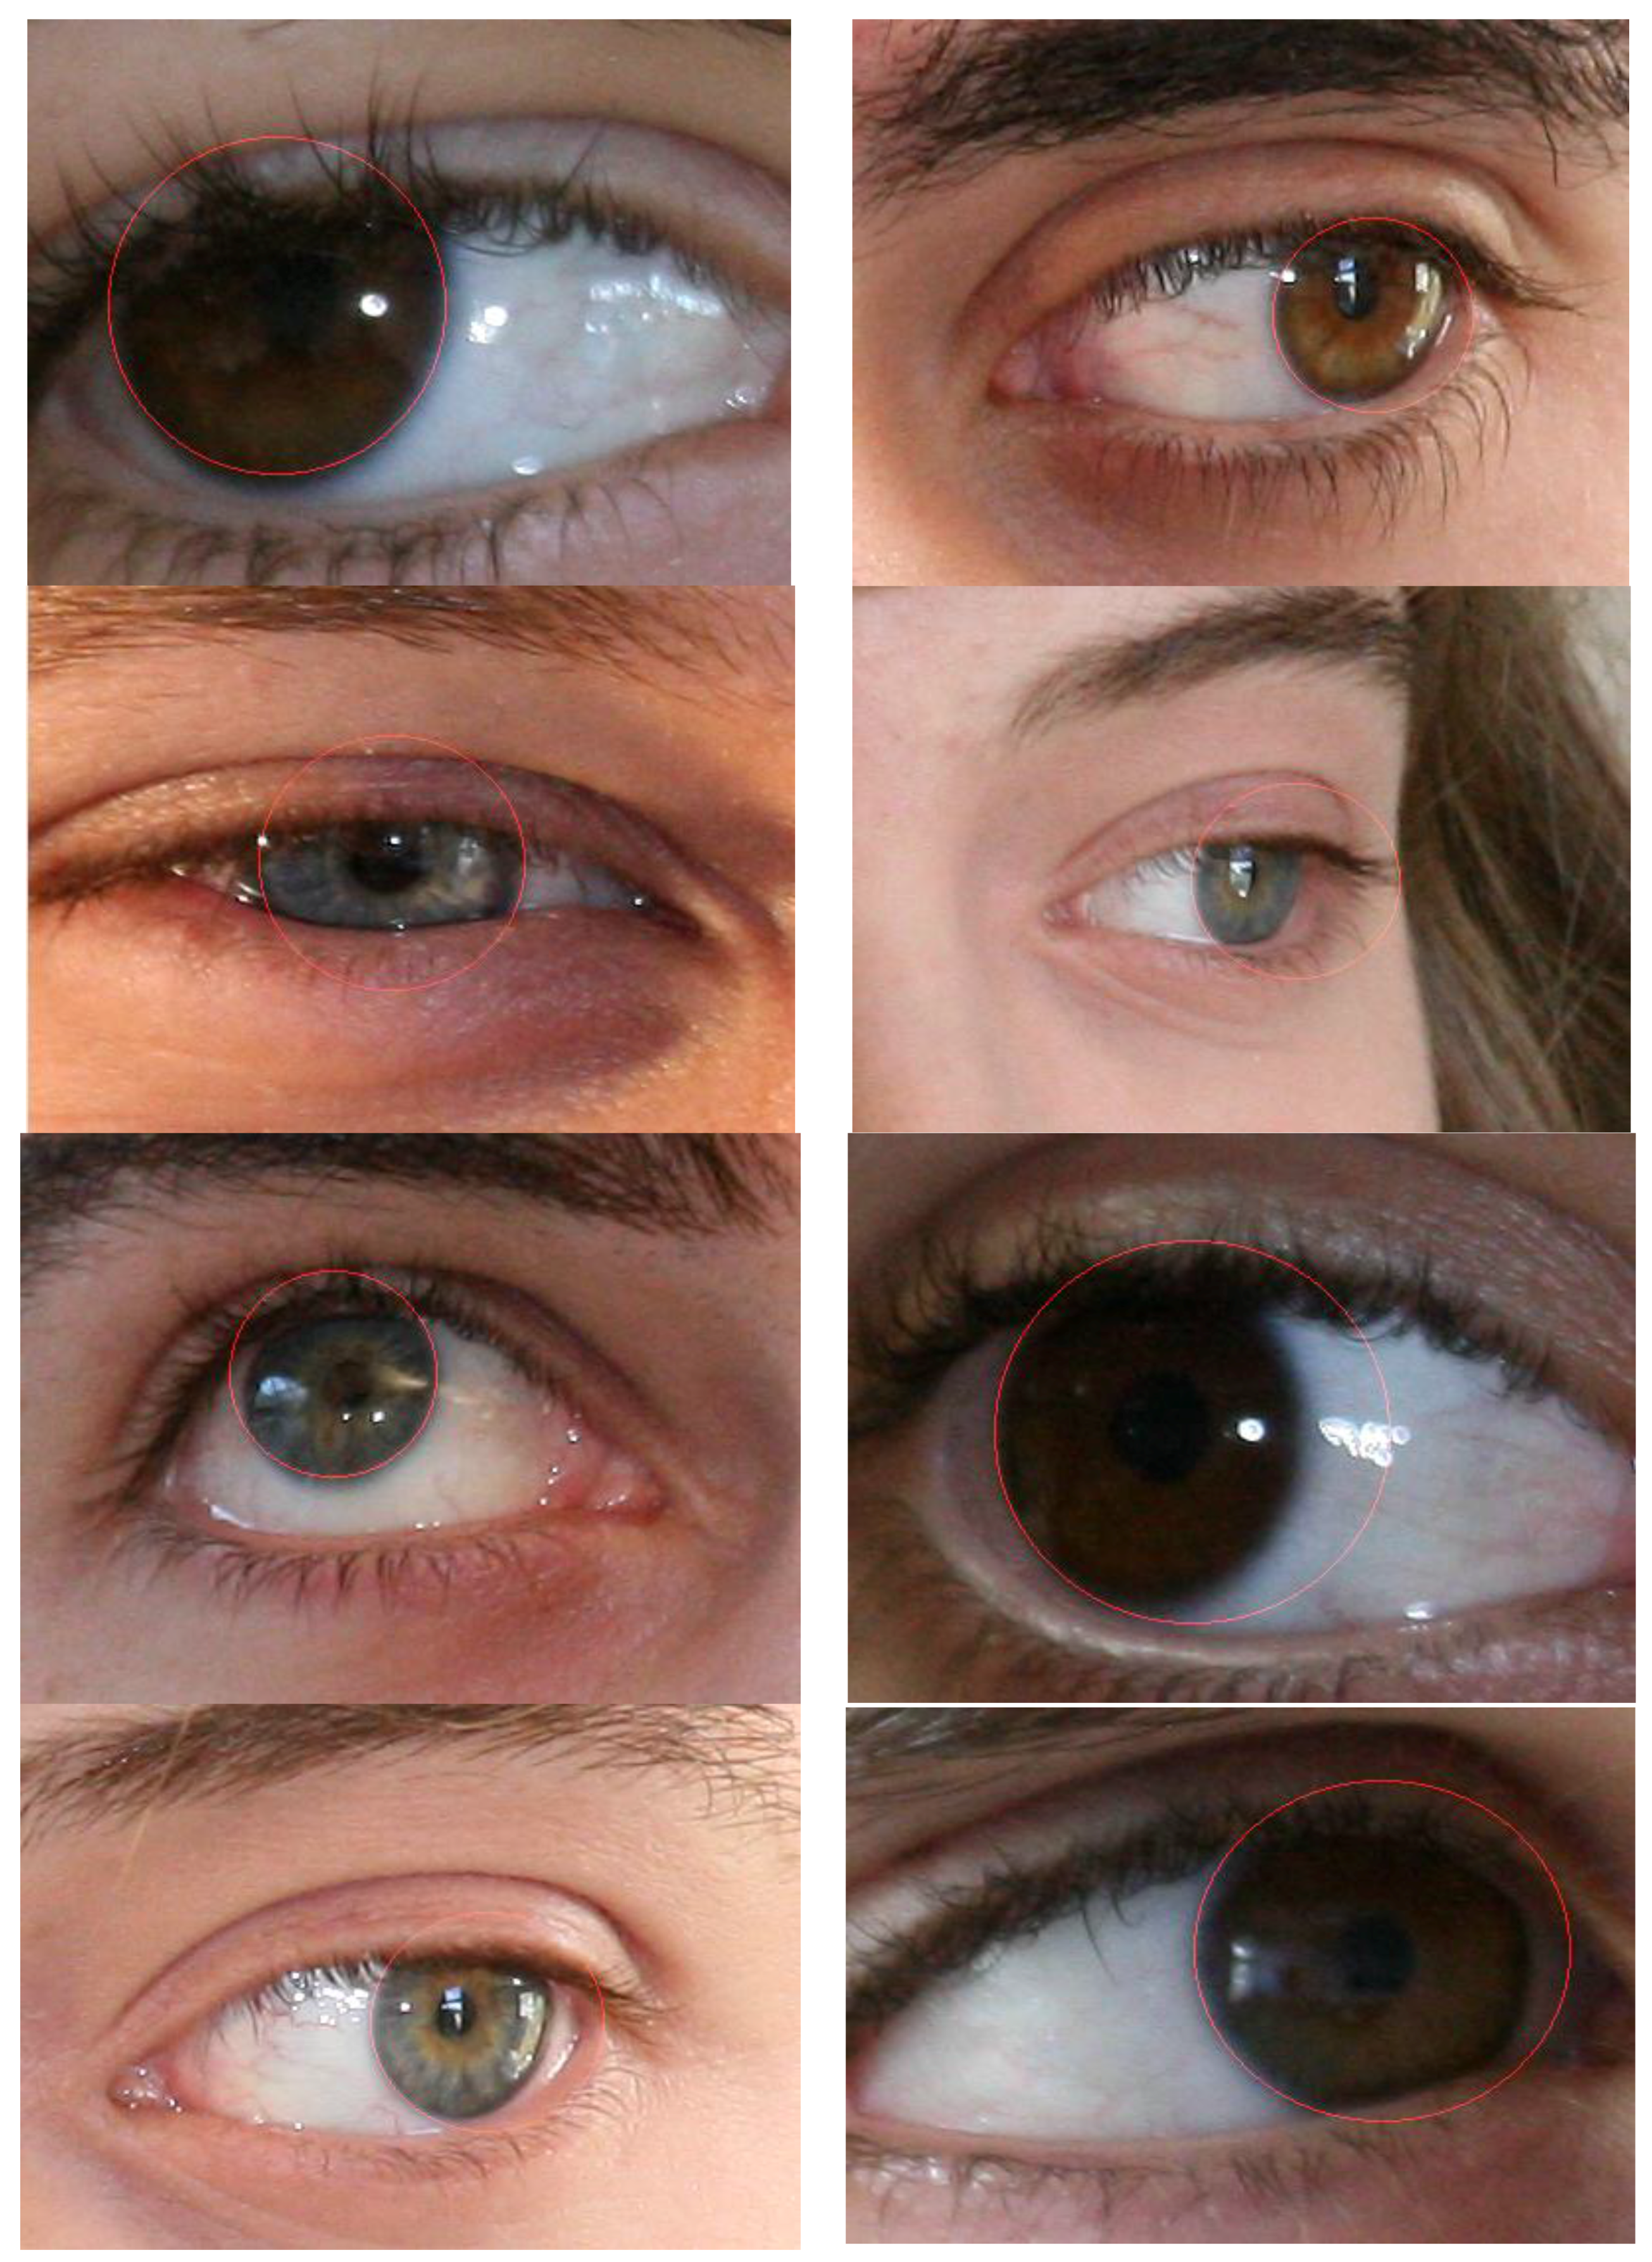
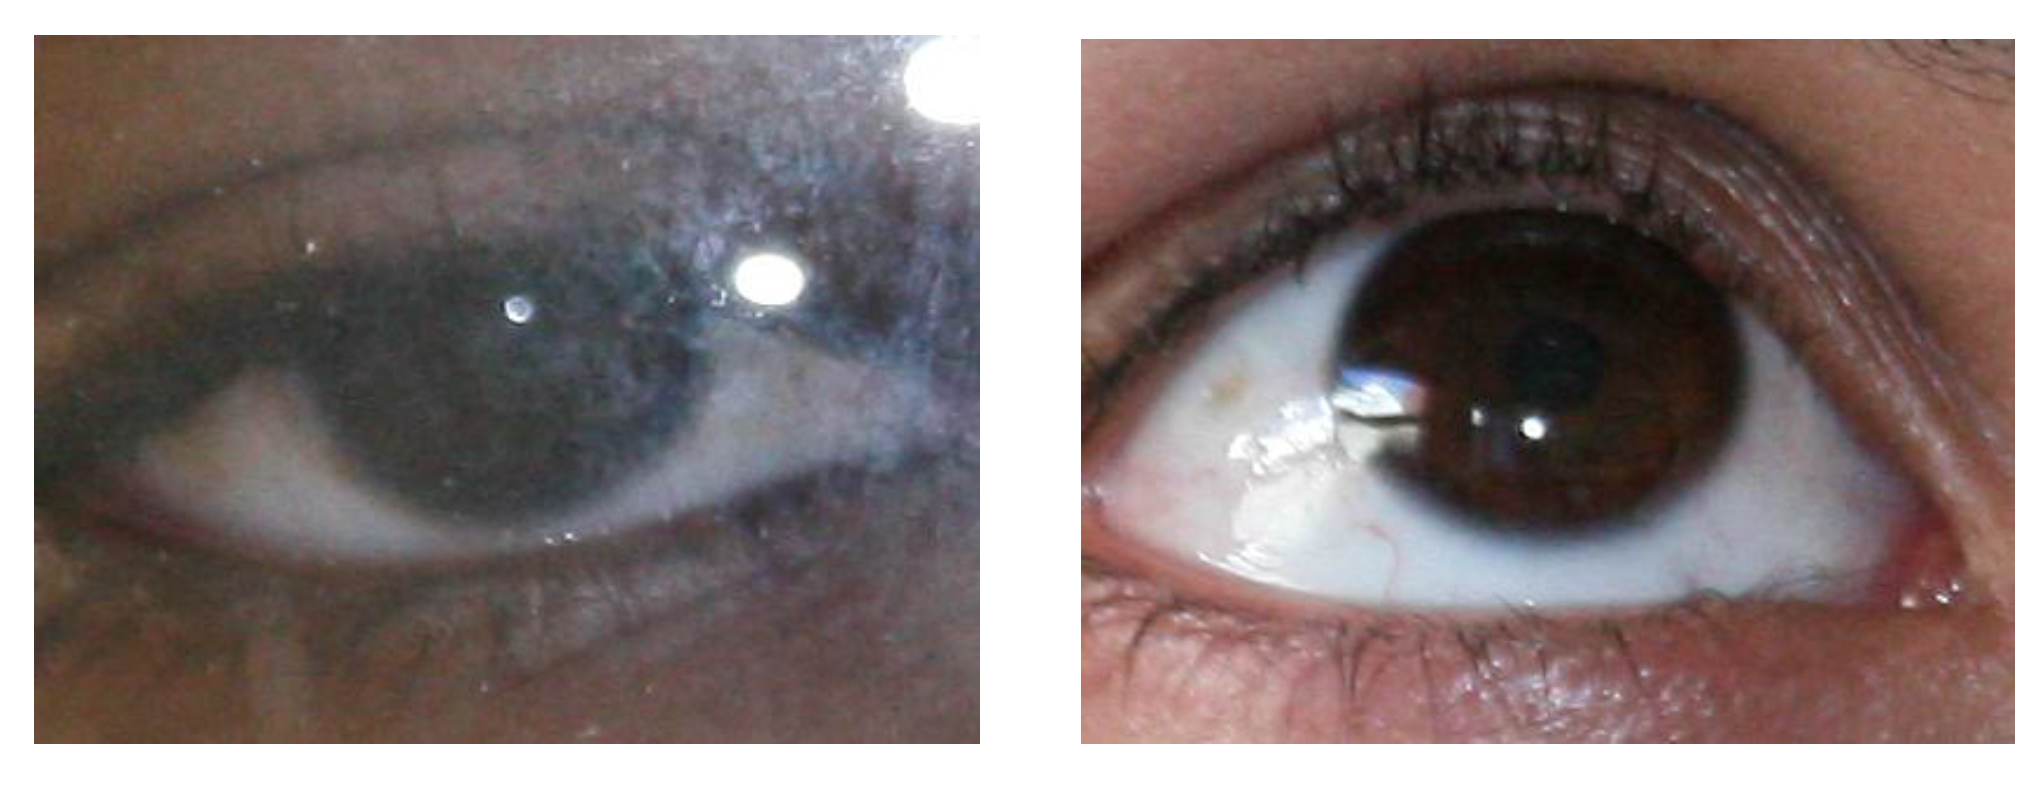
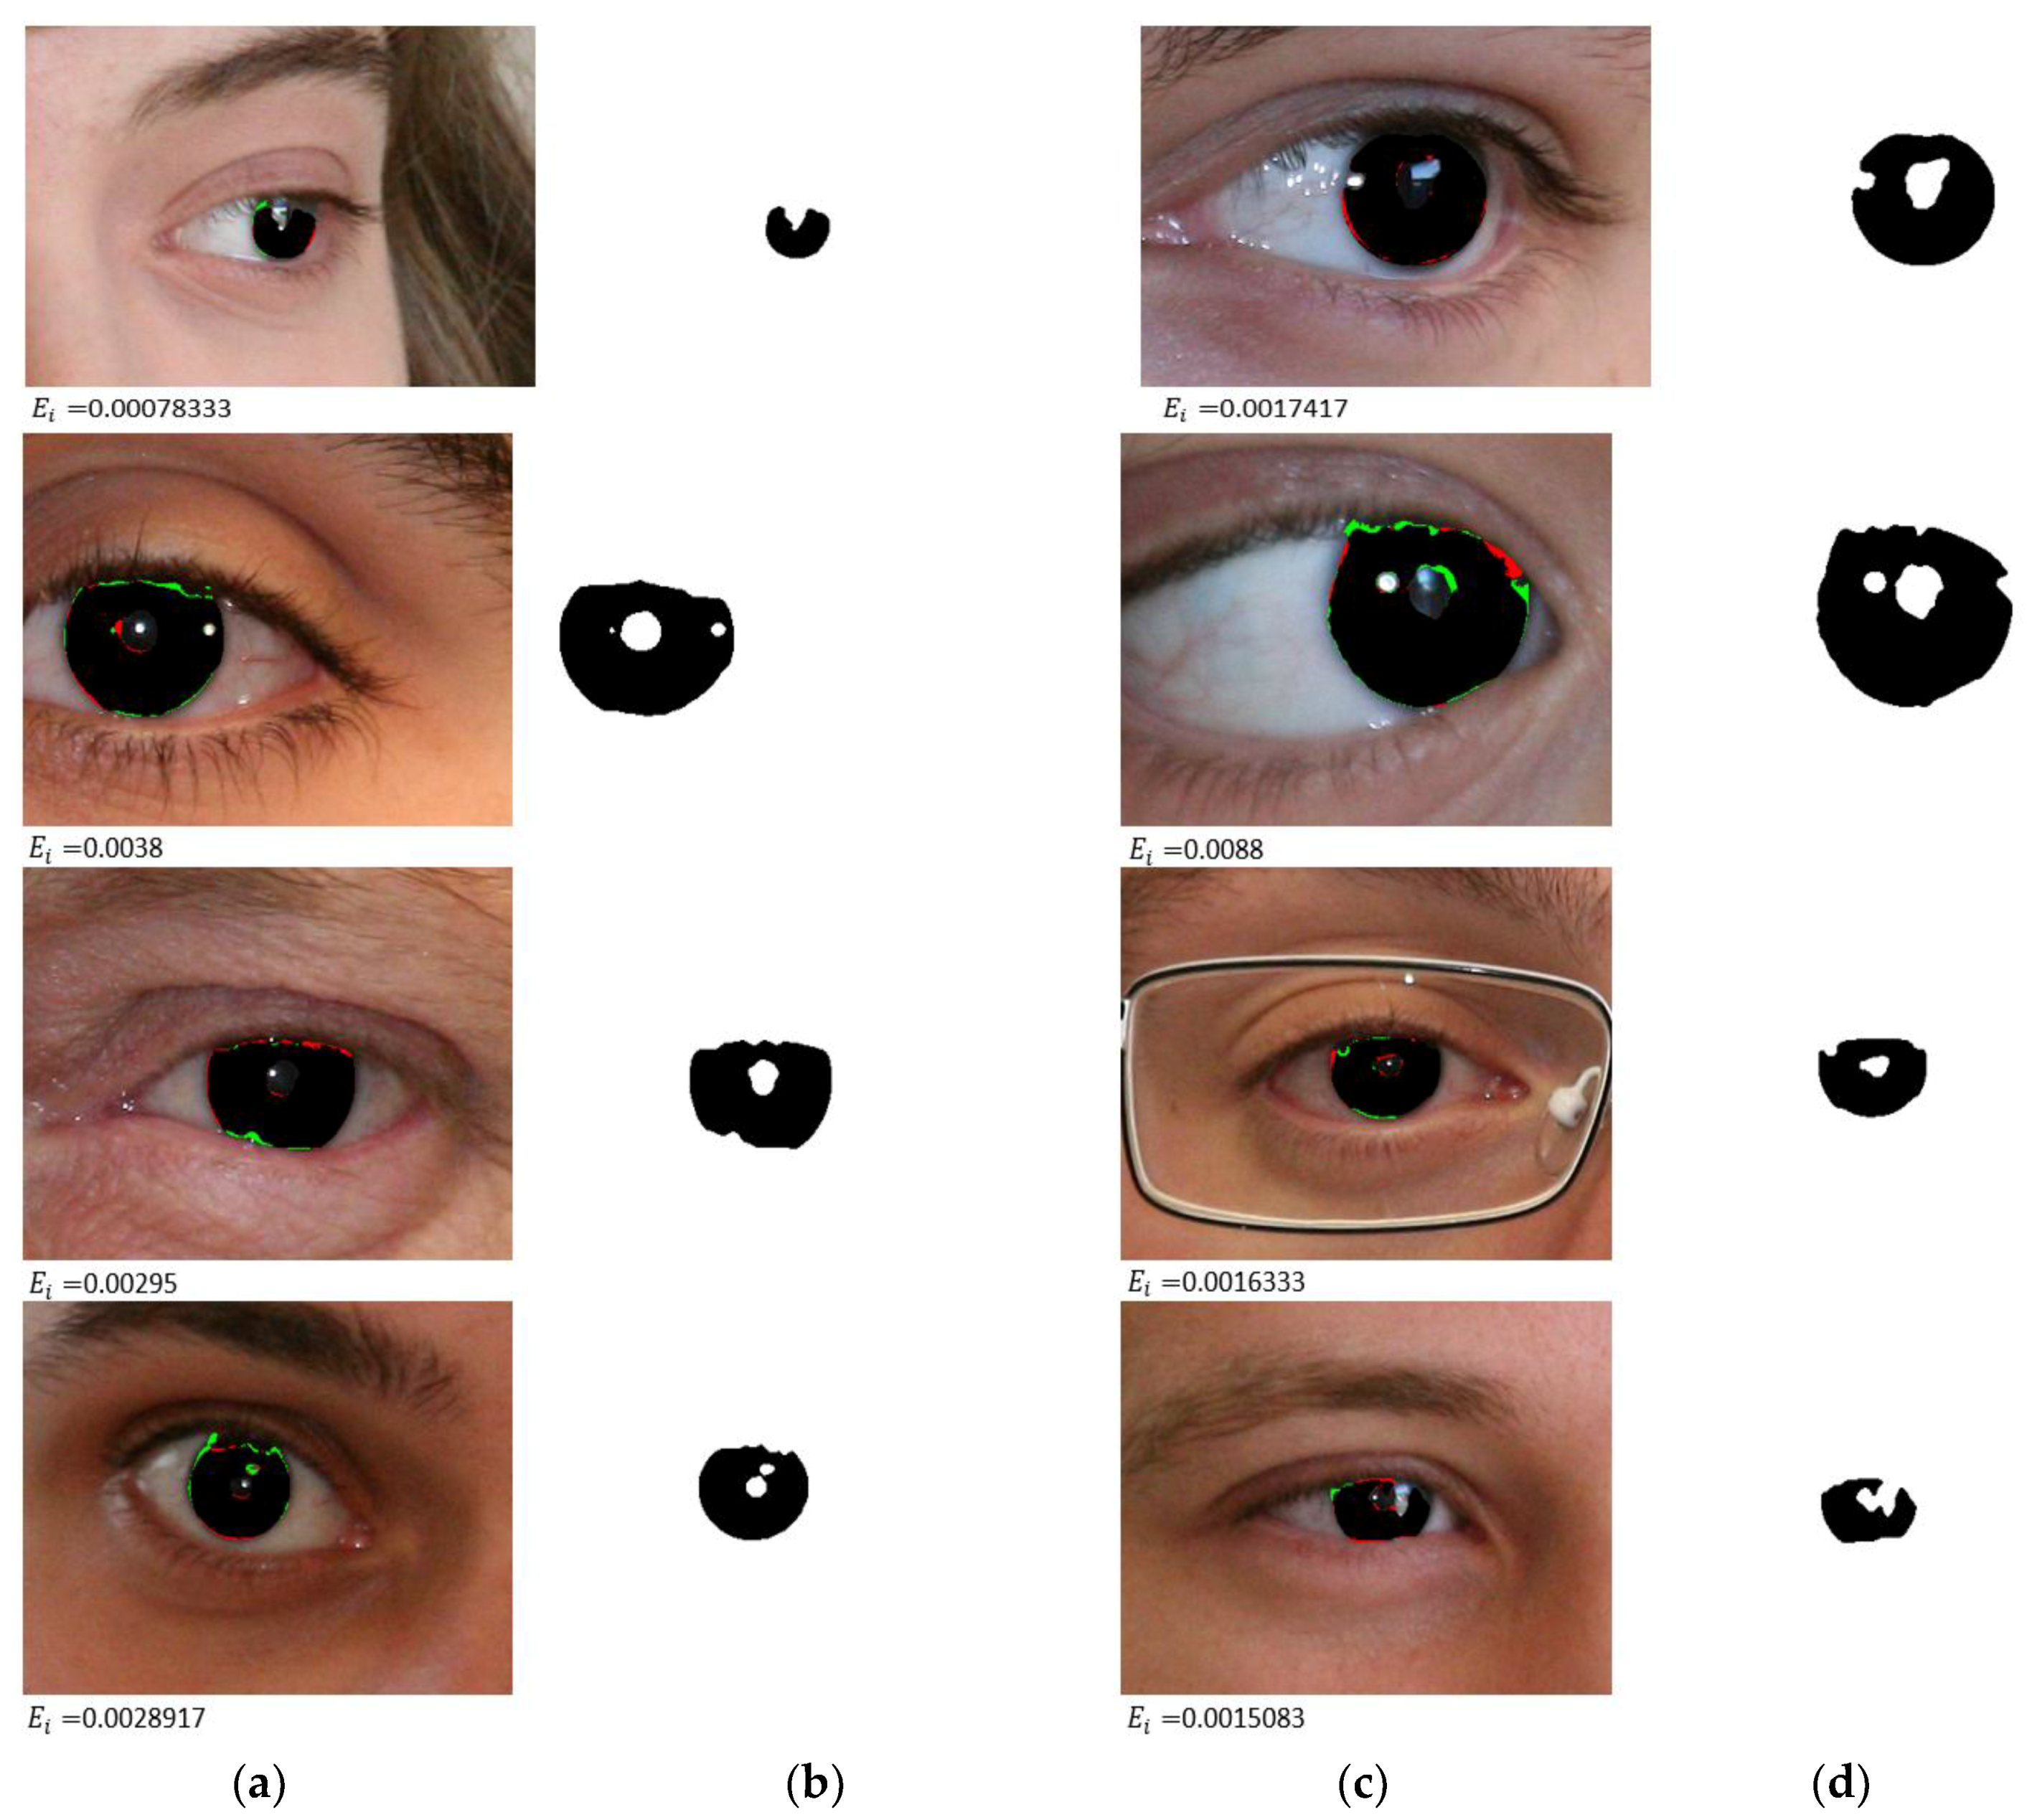
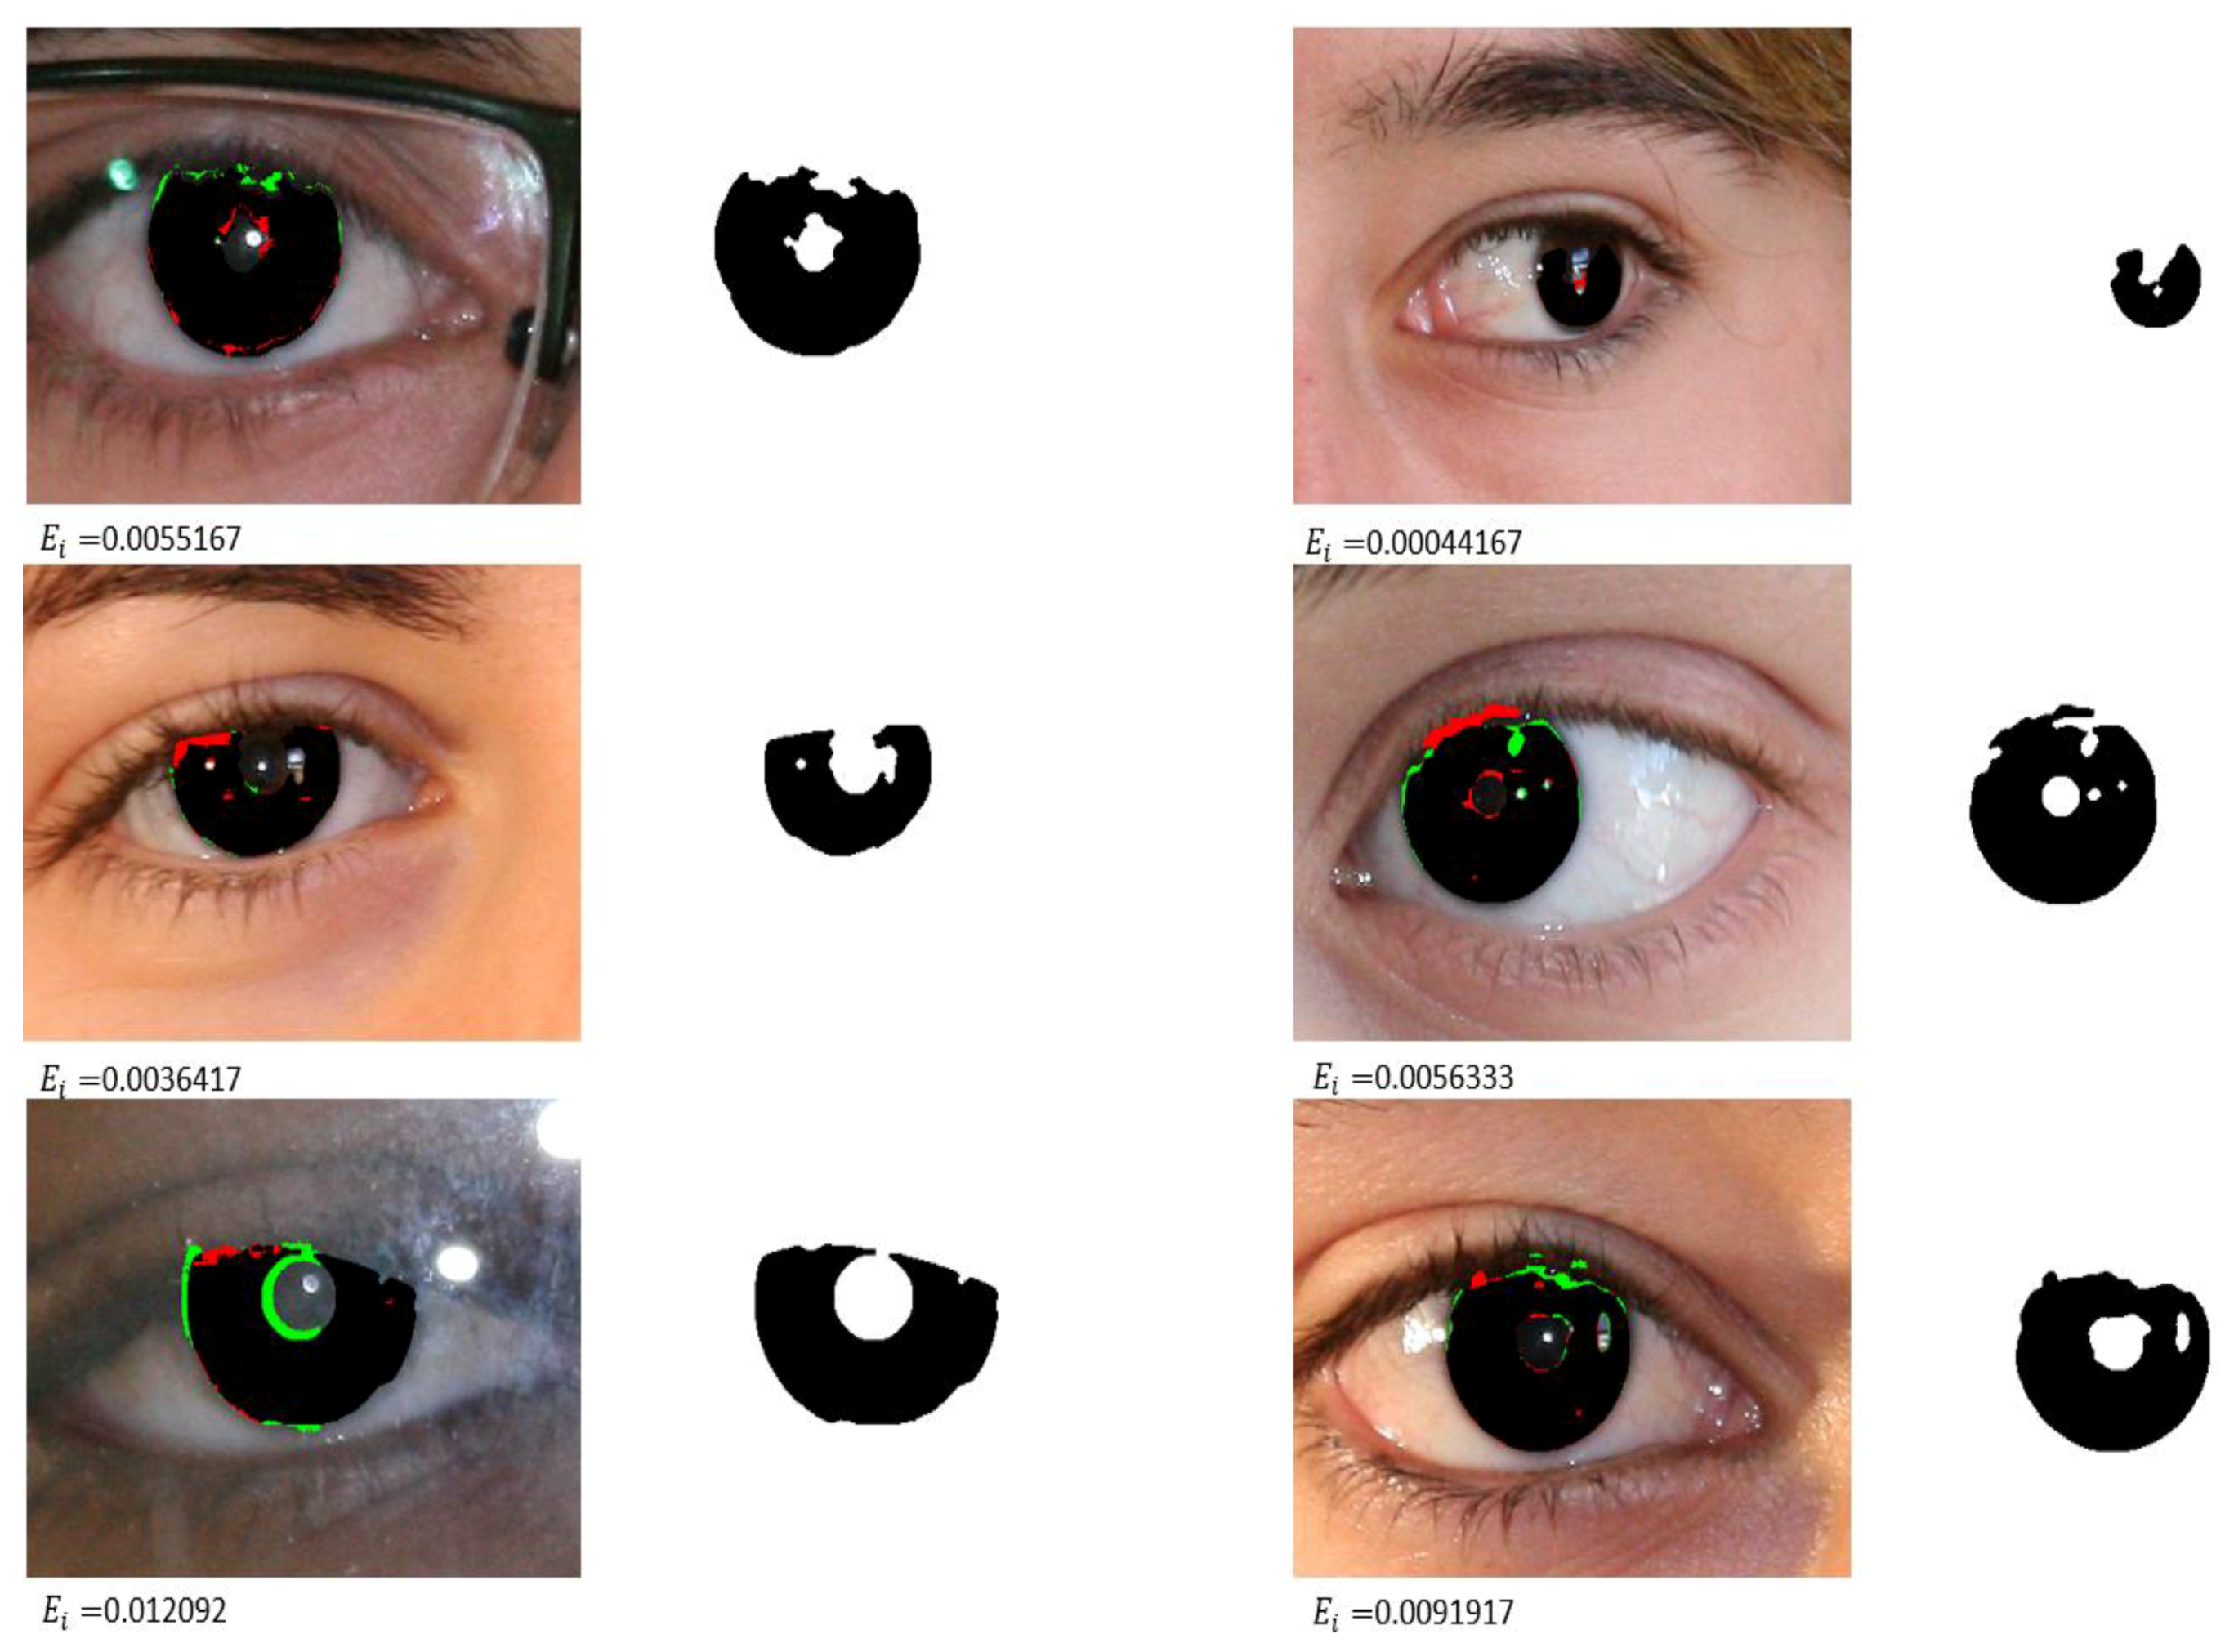
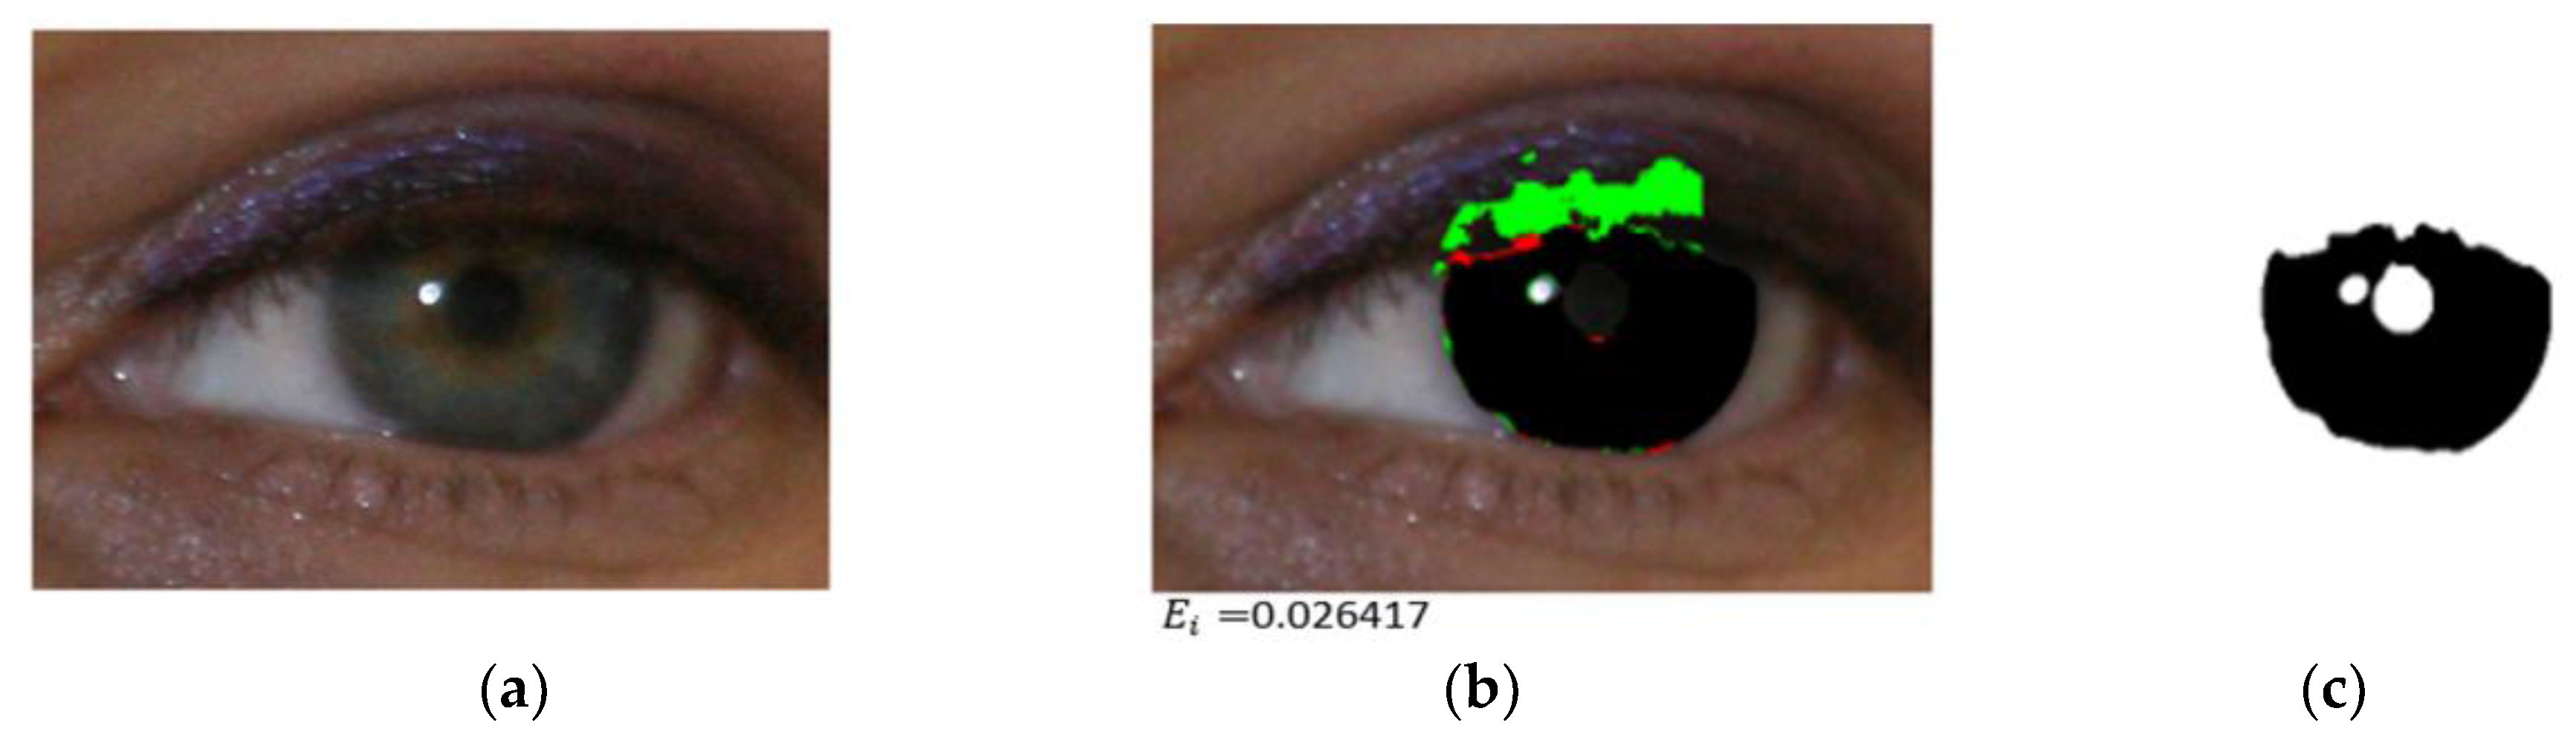
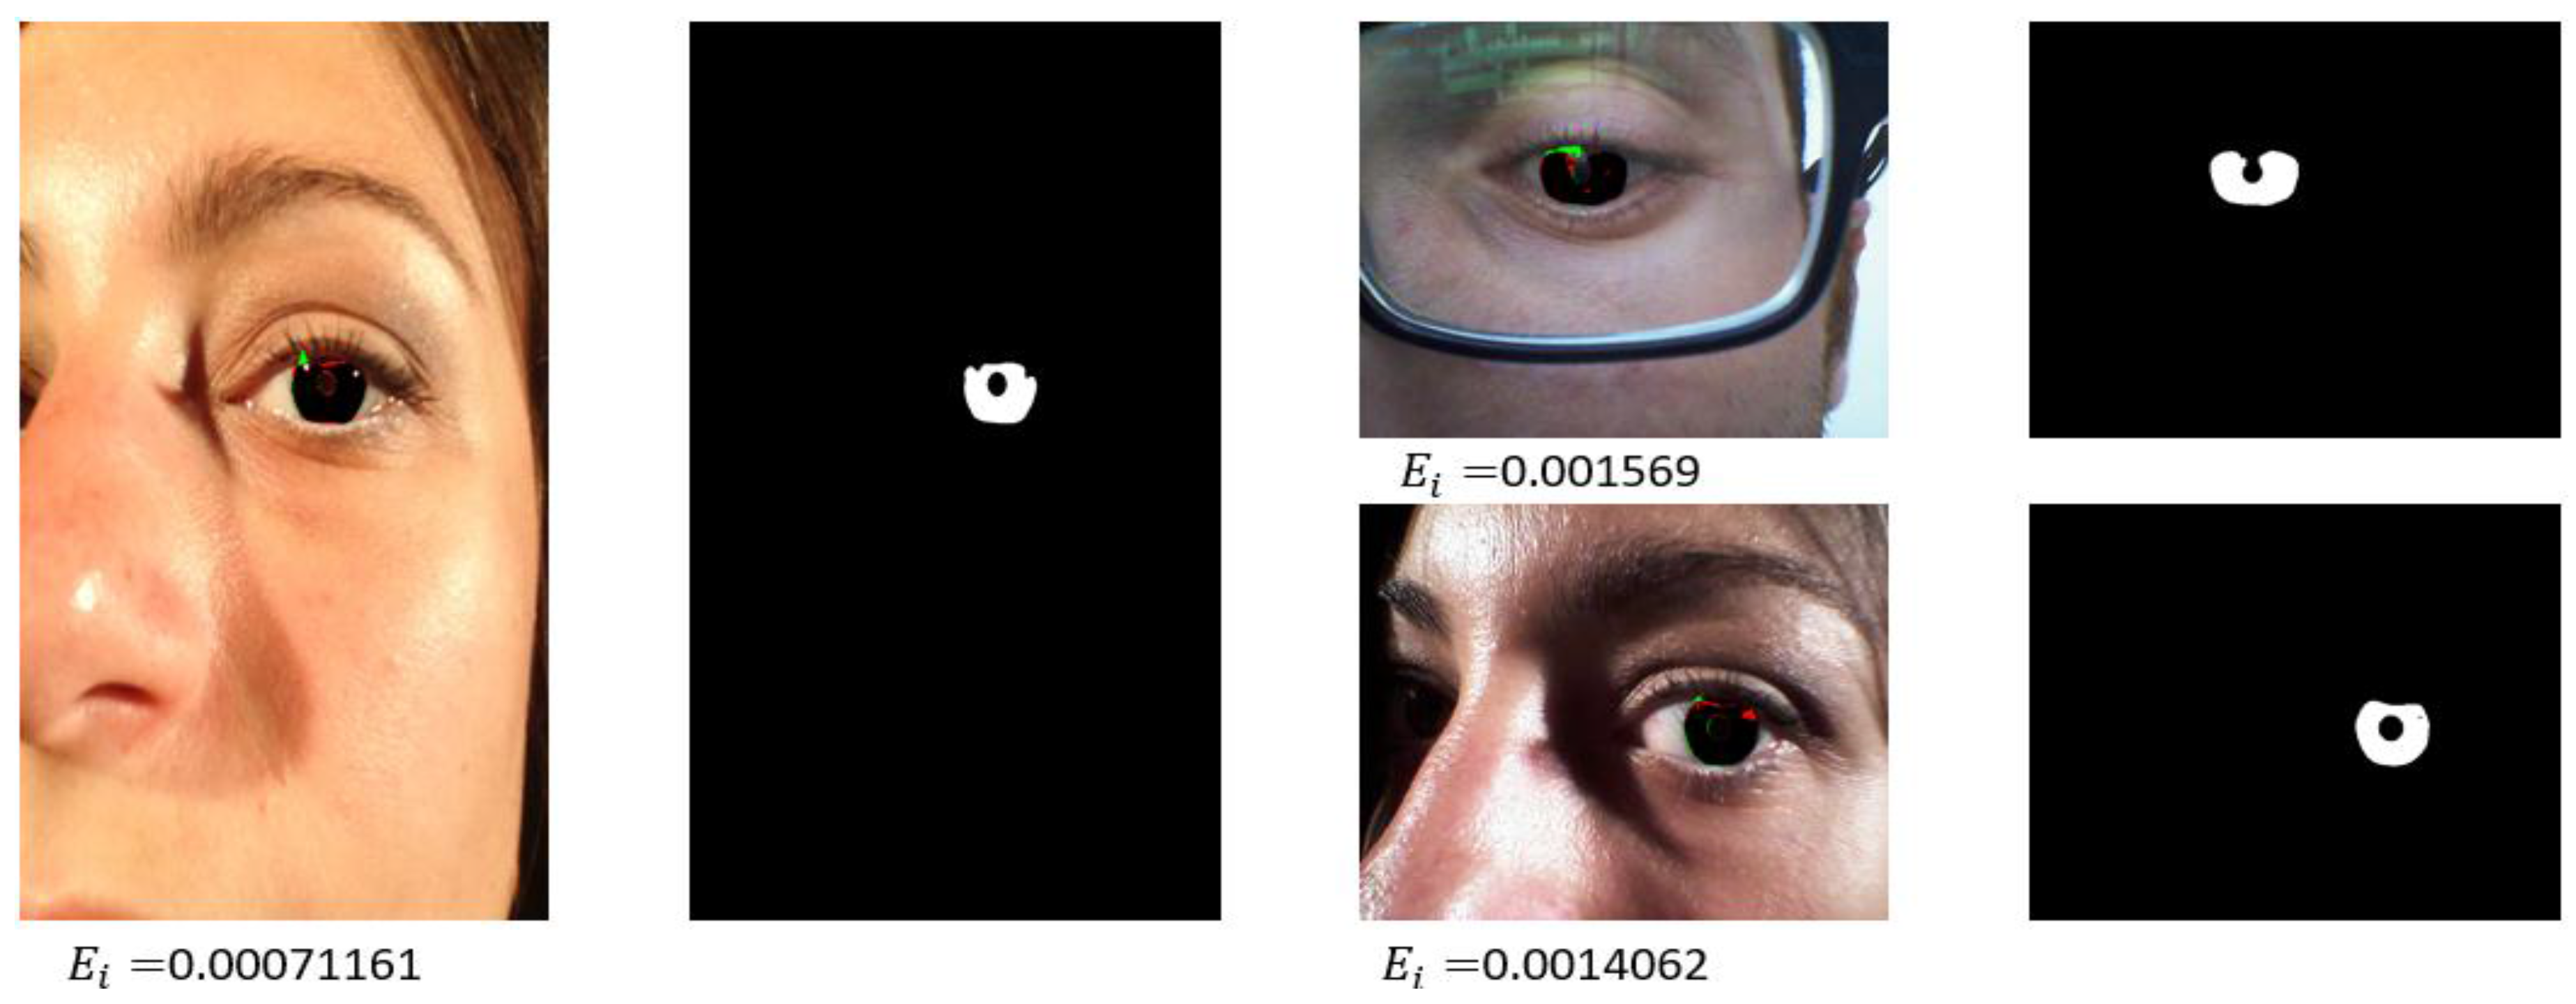
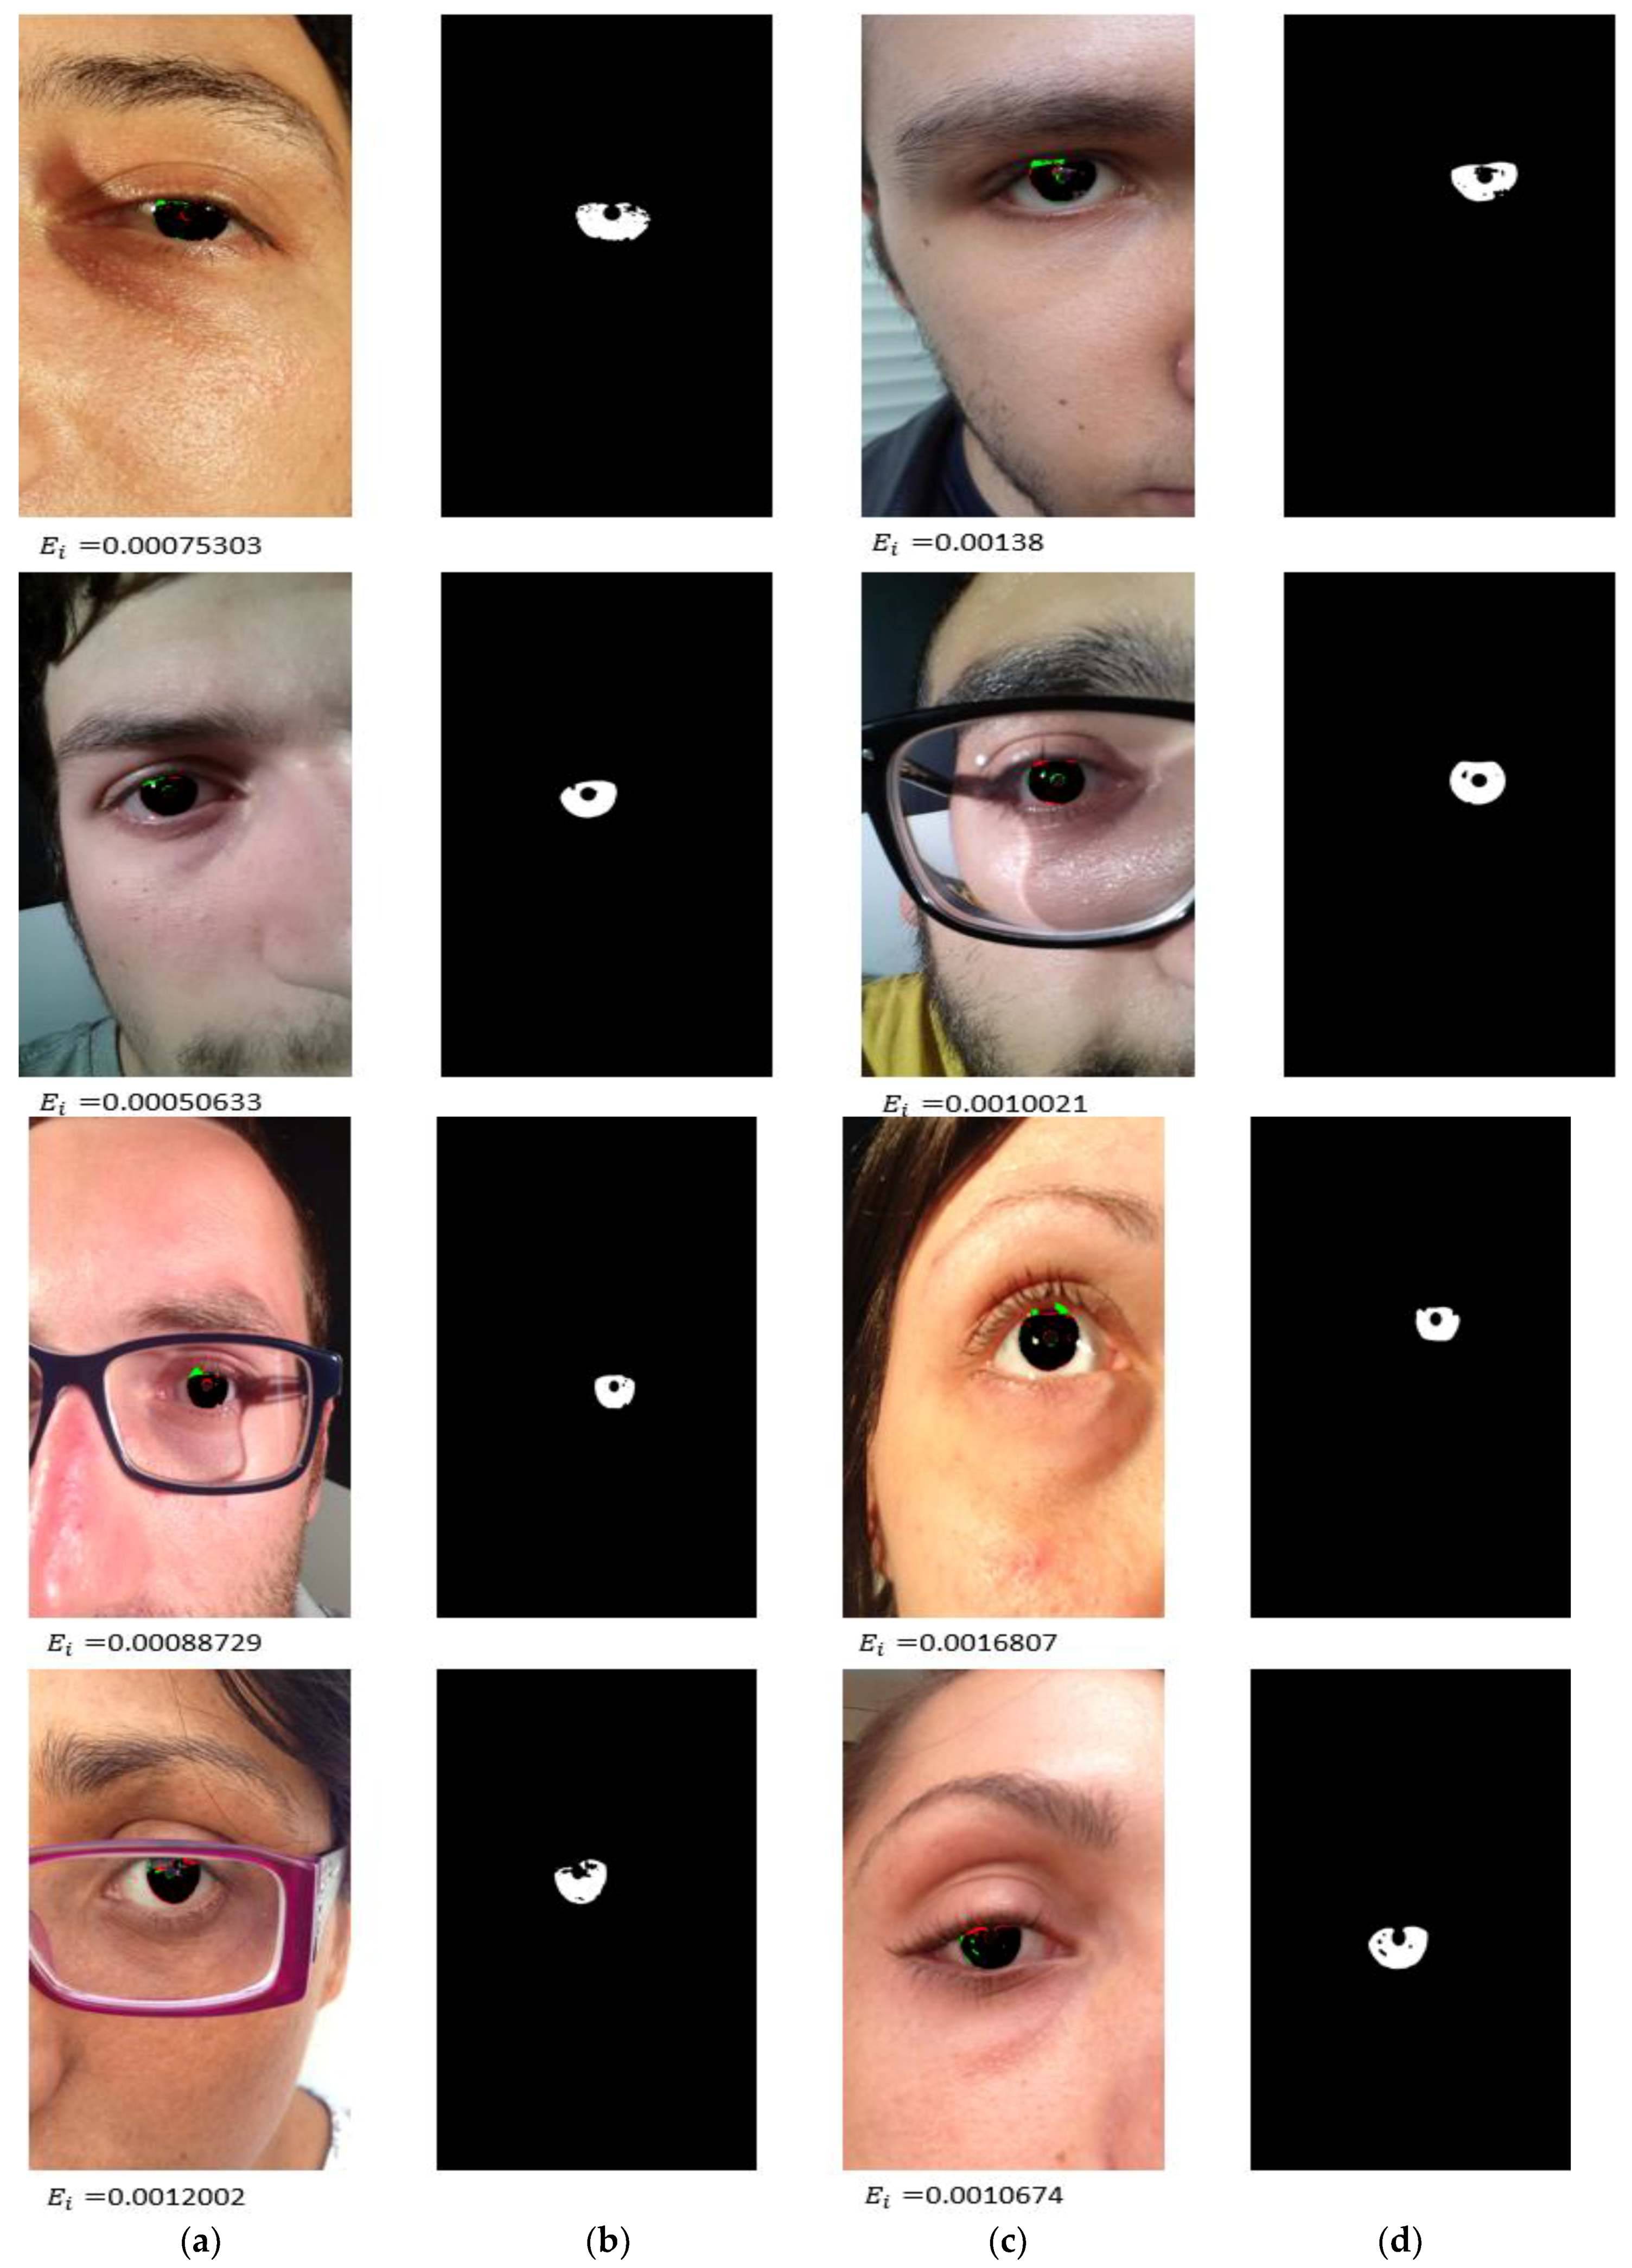
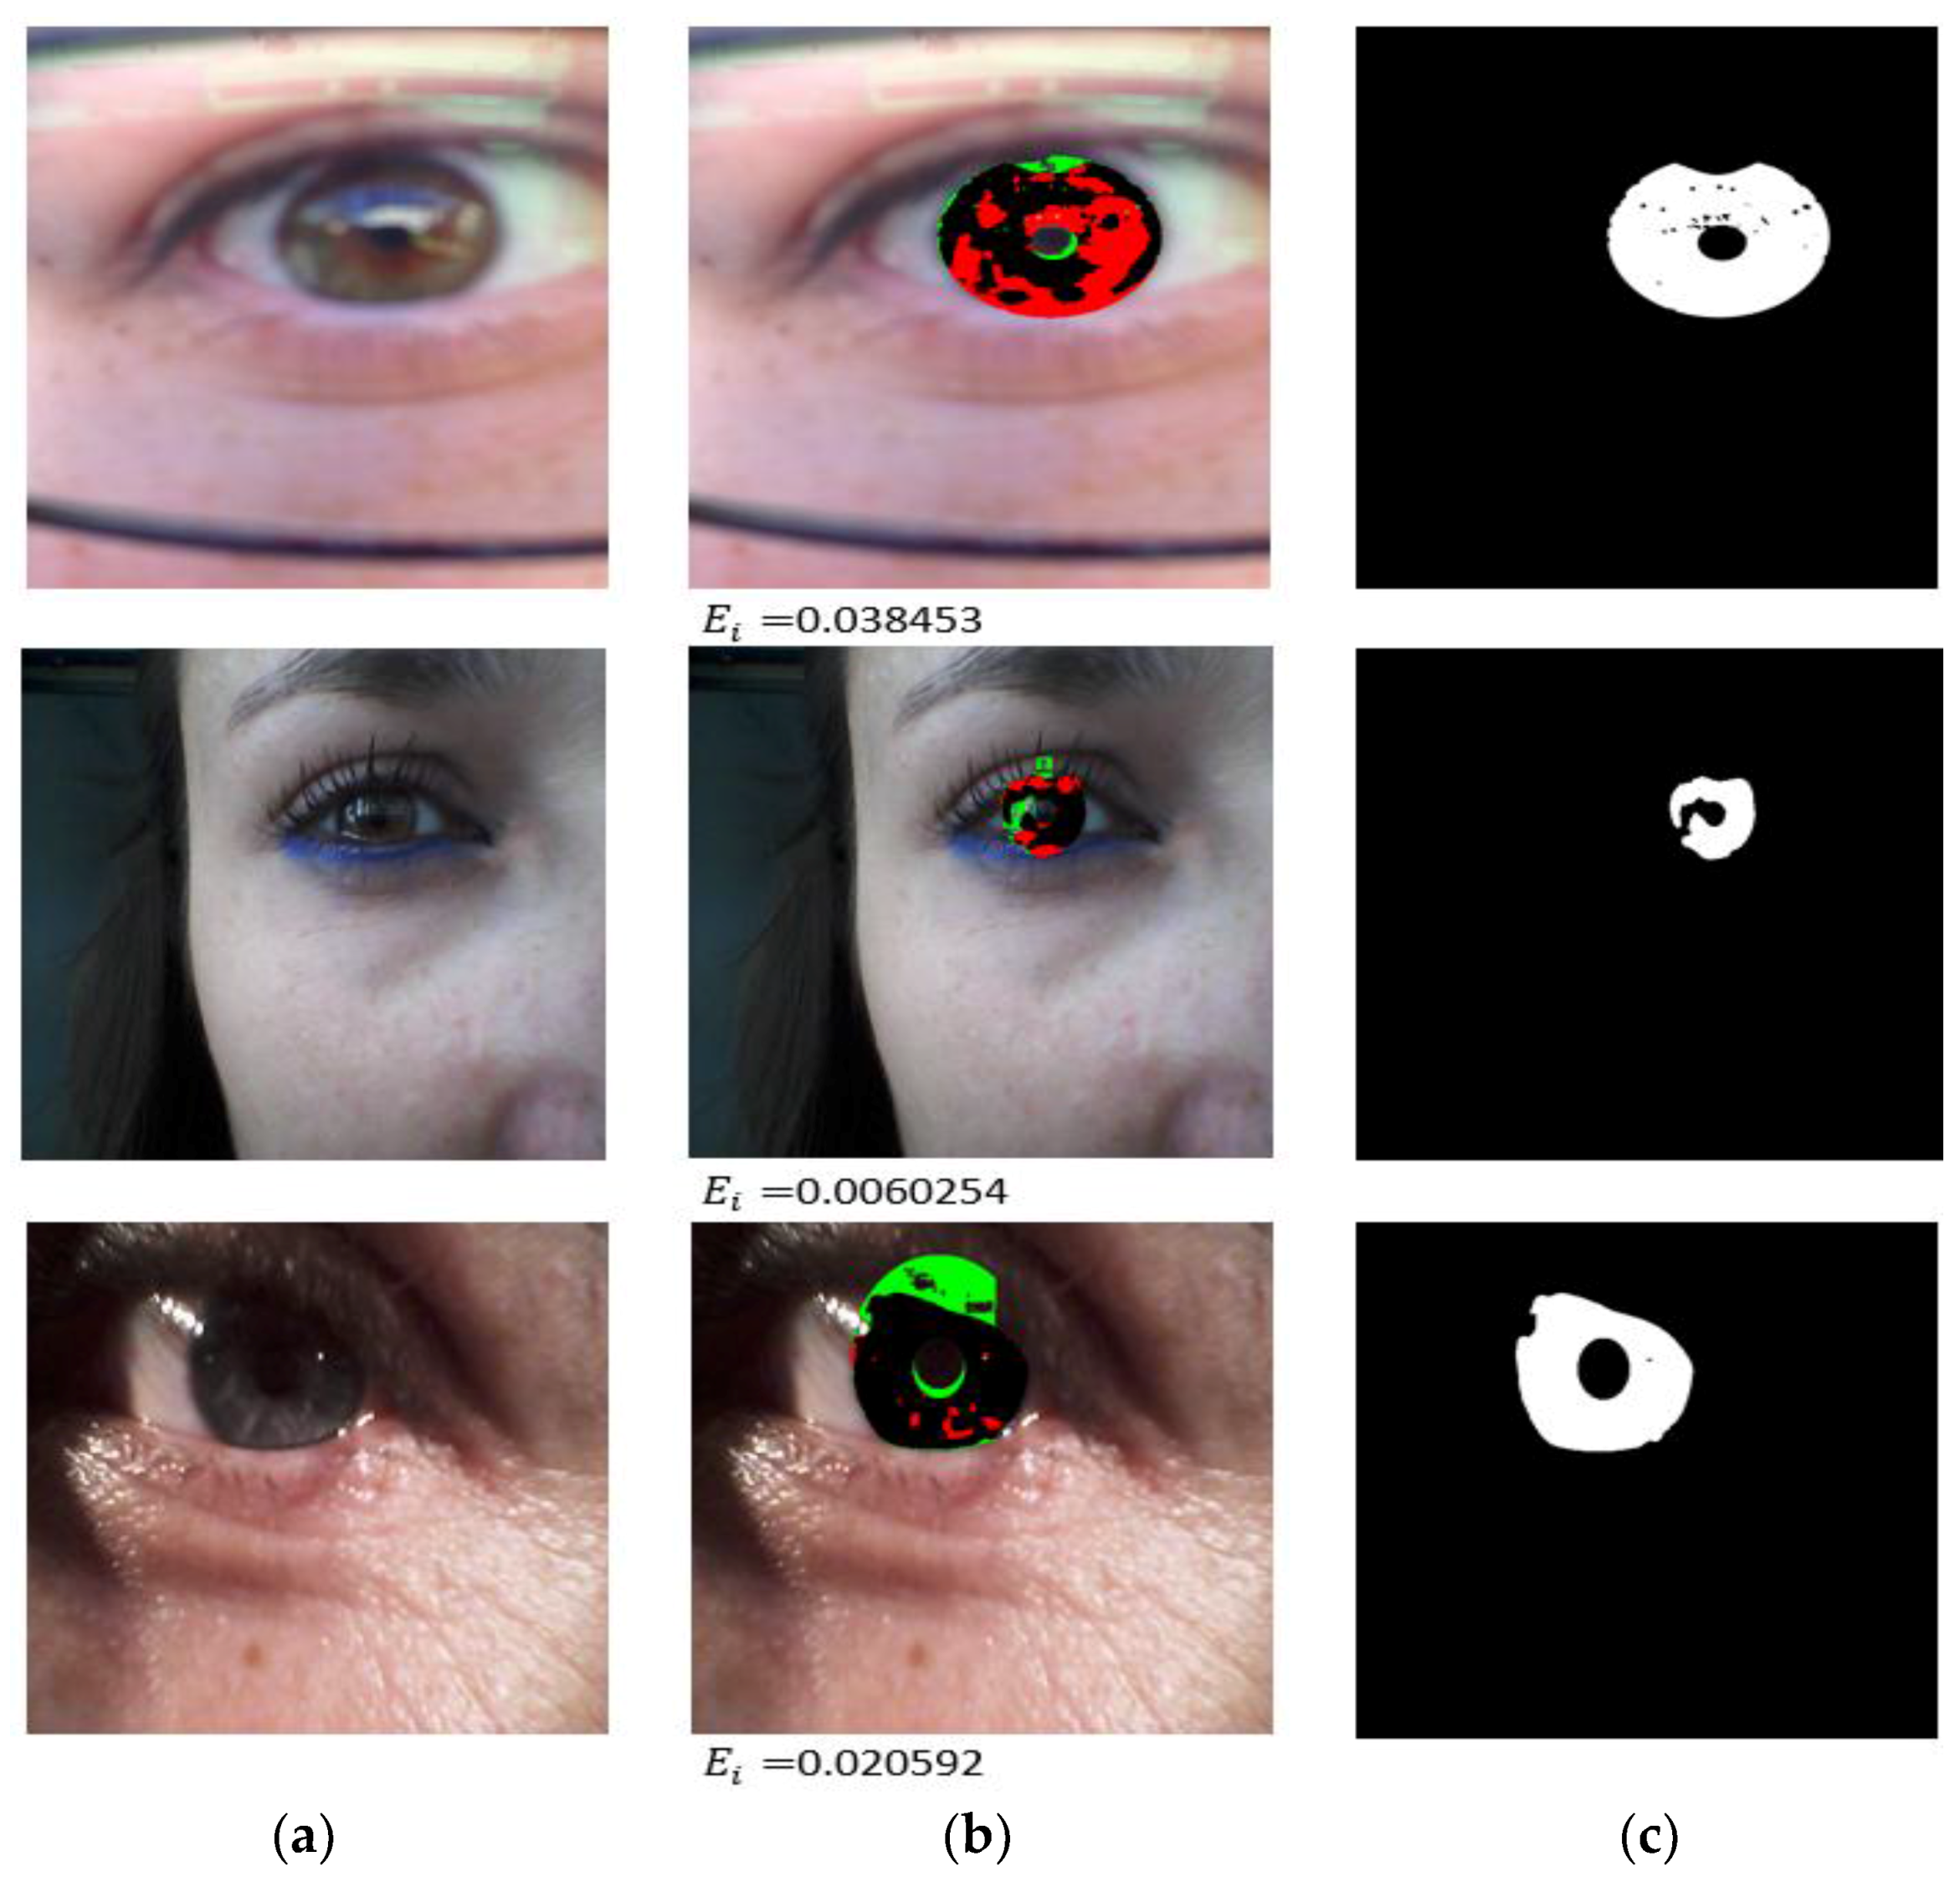
- The proposed method accurately identified the true boundary even in intense scenarios, such as glasses, off-angle eyes, rotated eyes, side view, and partially opened eyes.
- -
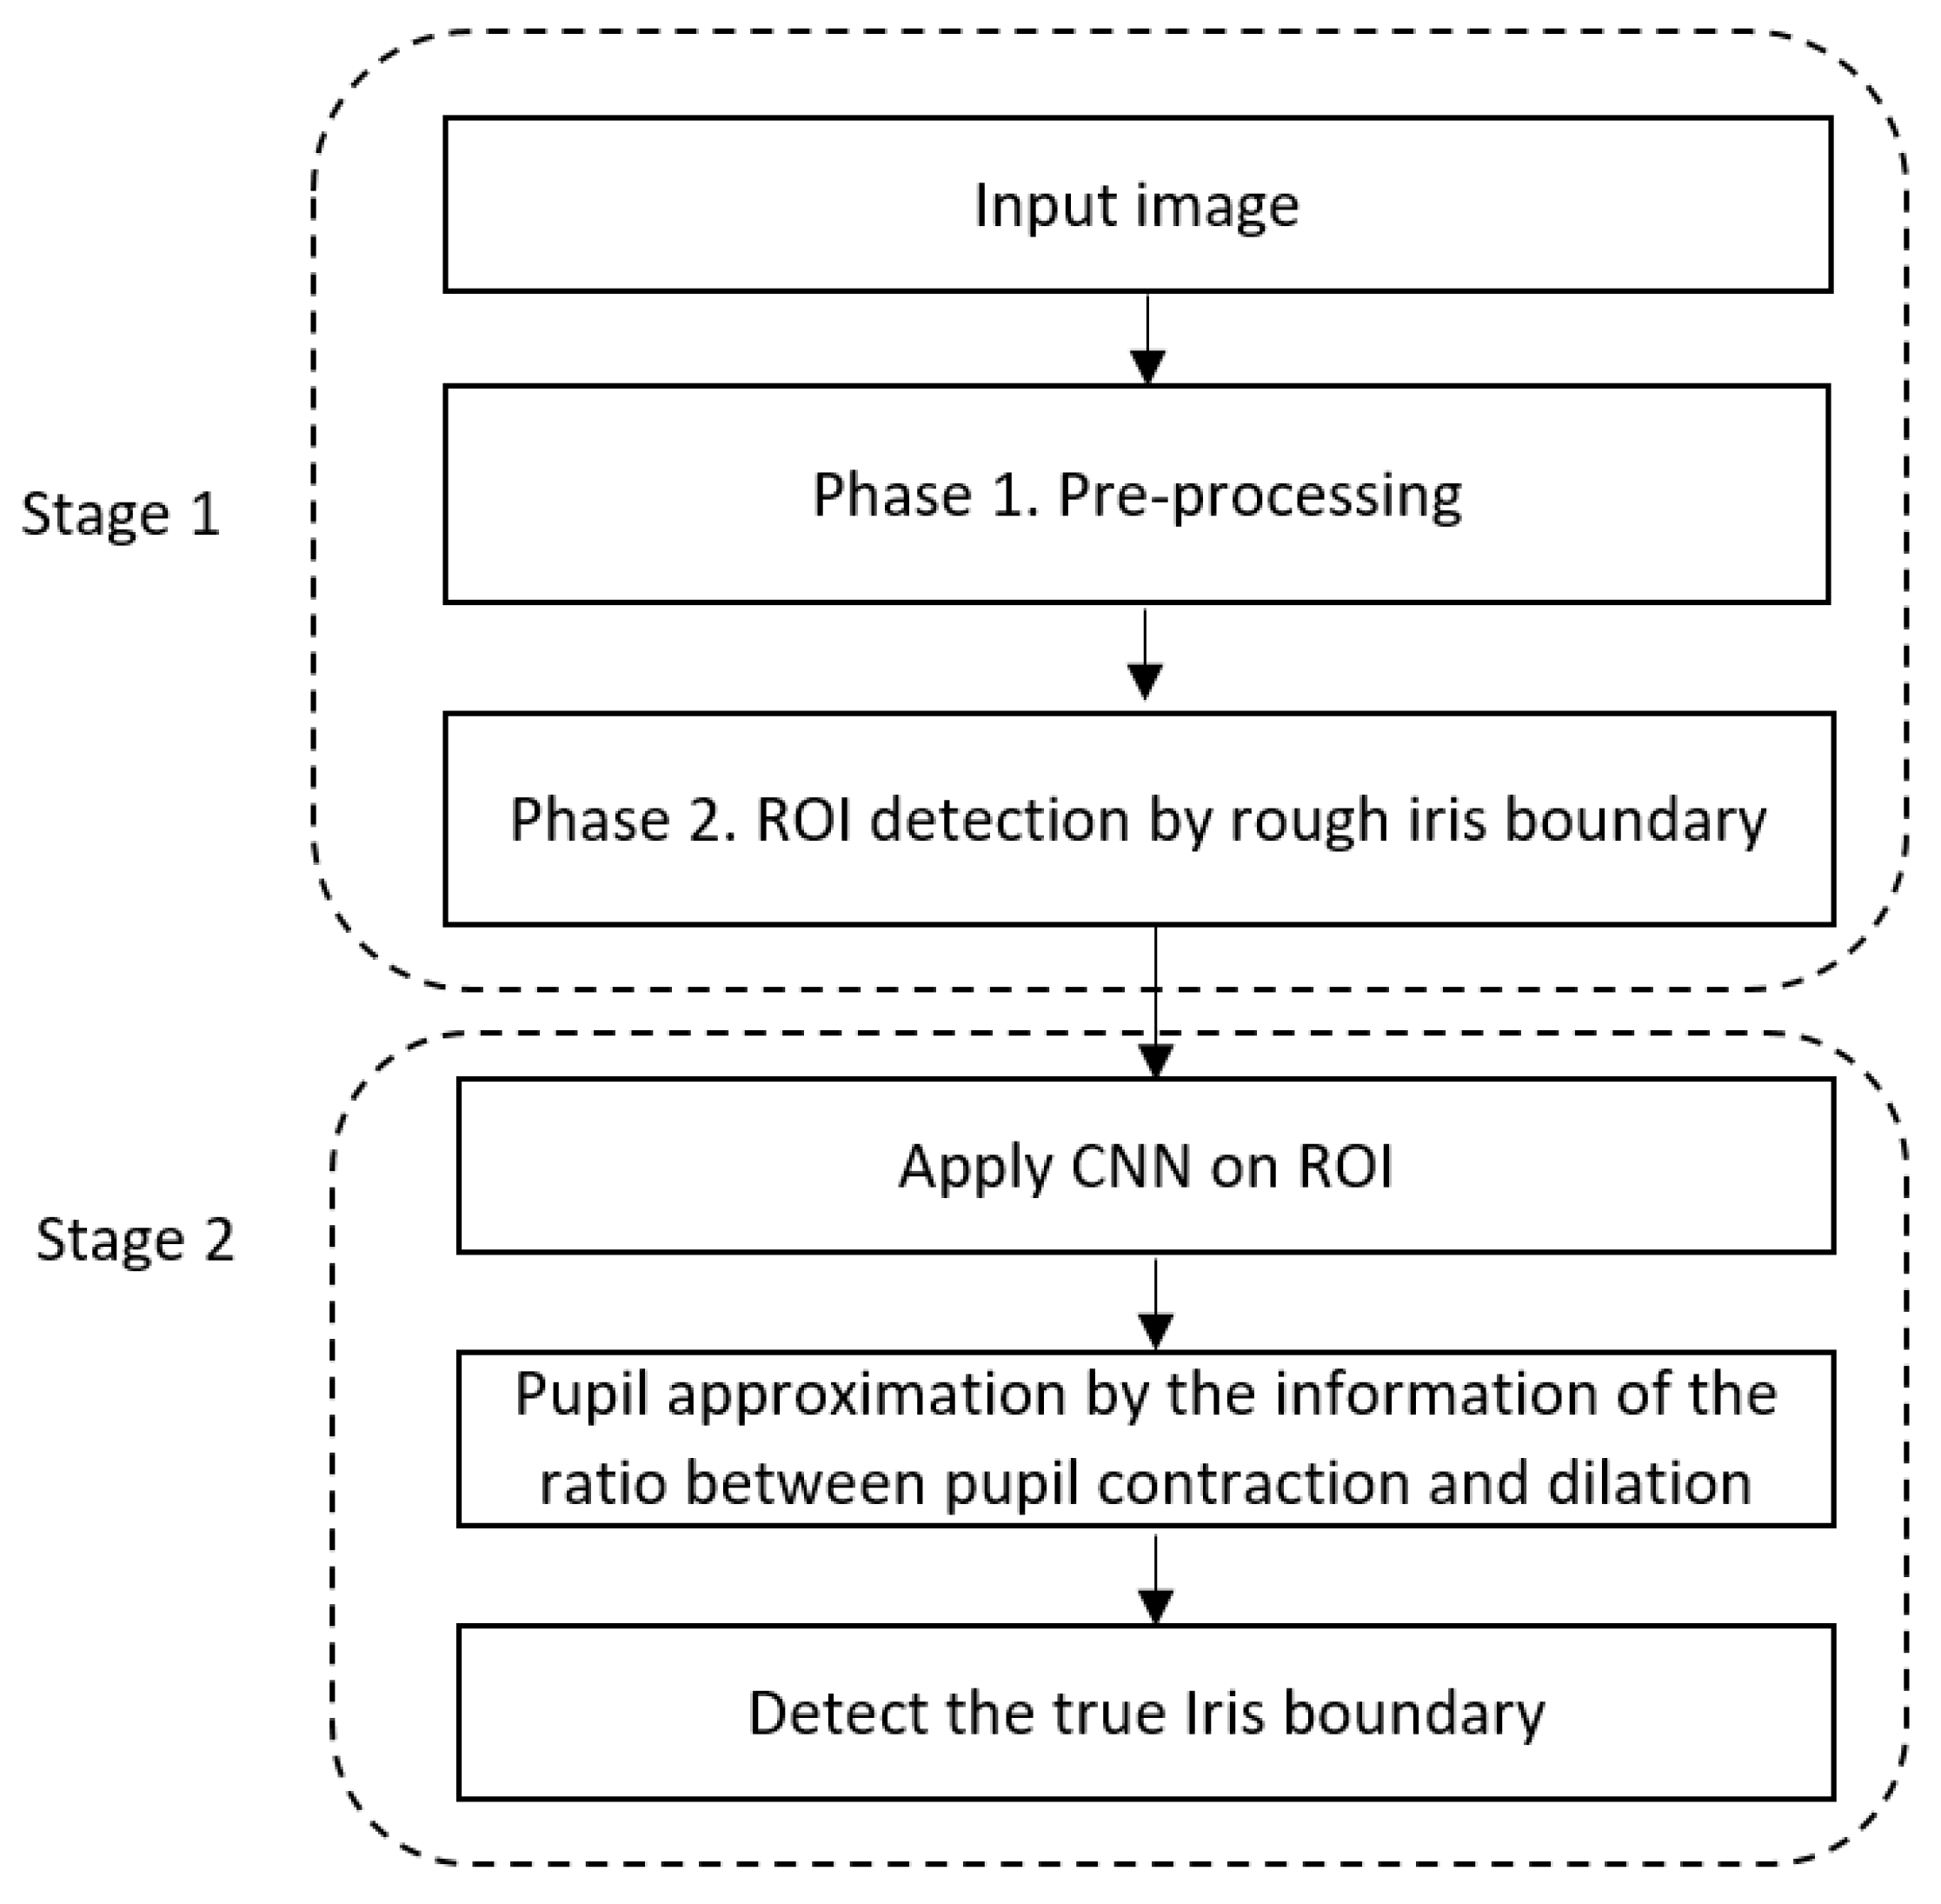
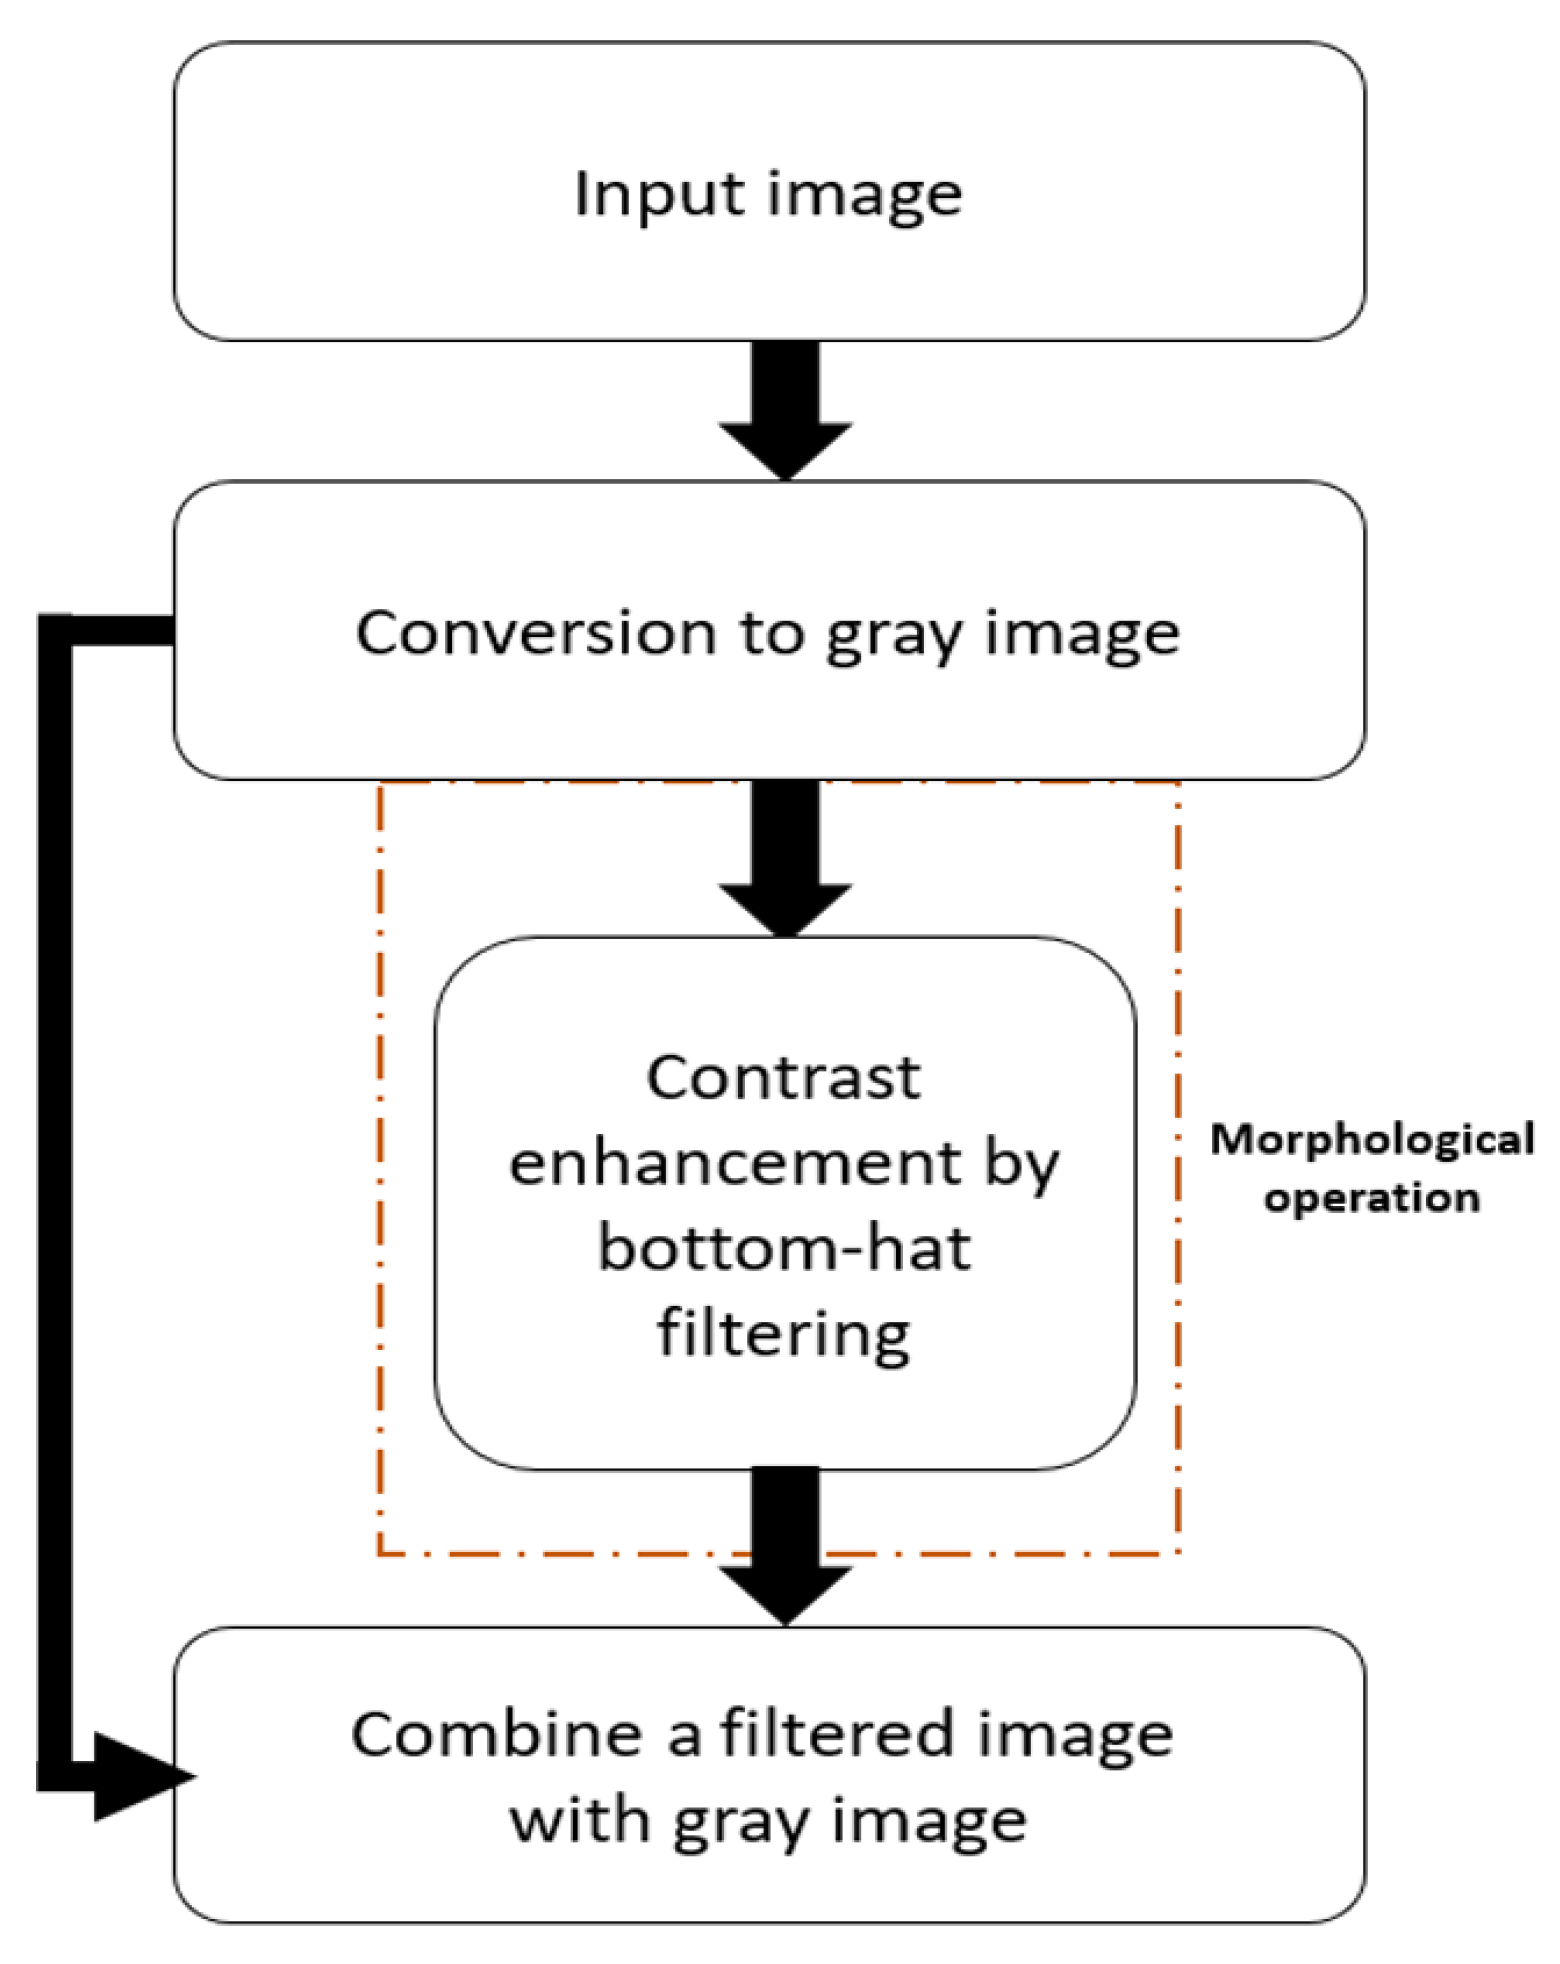
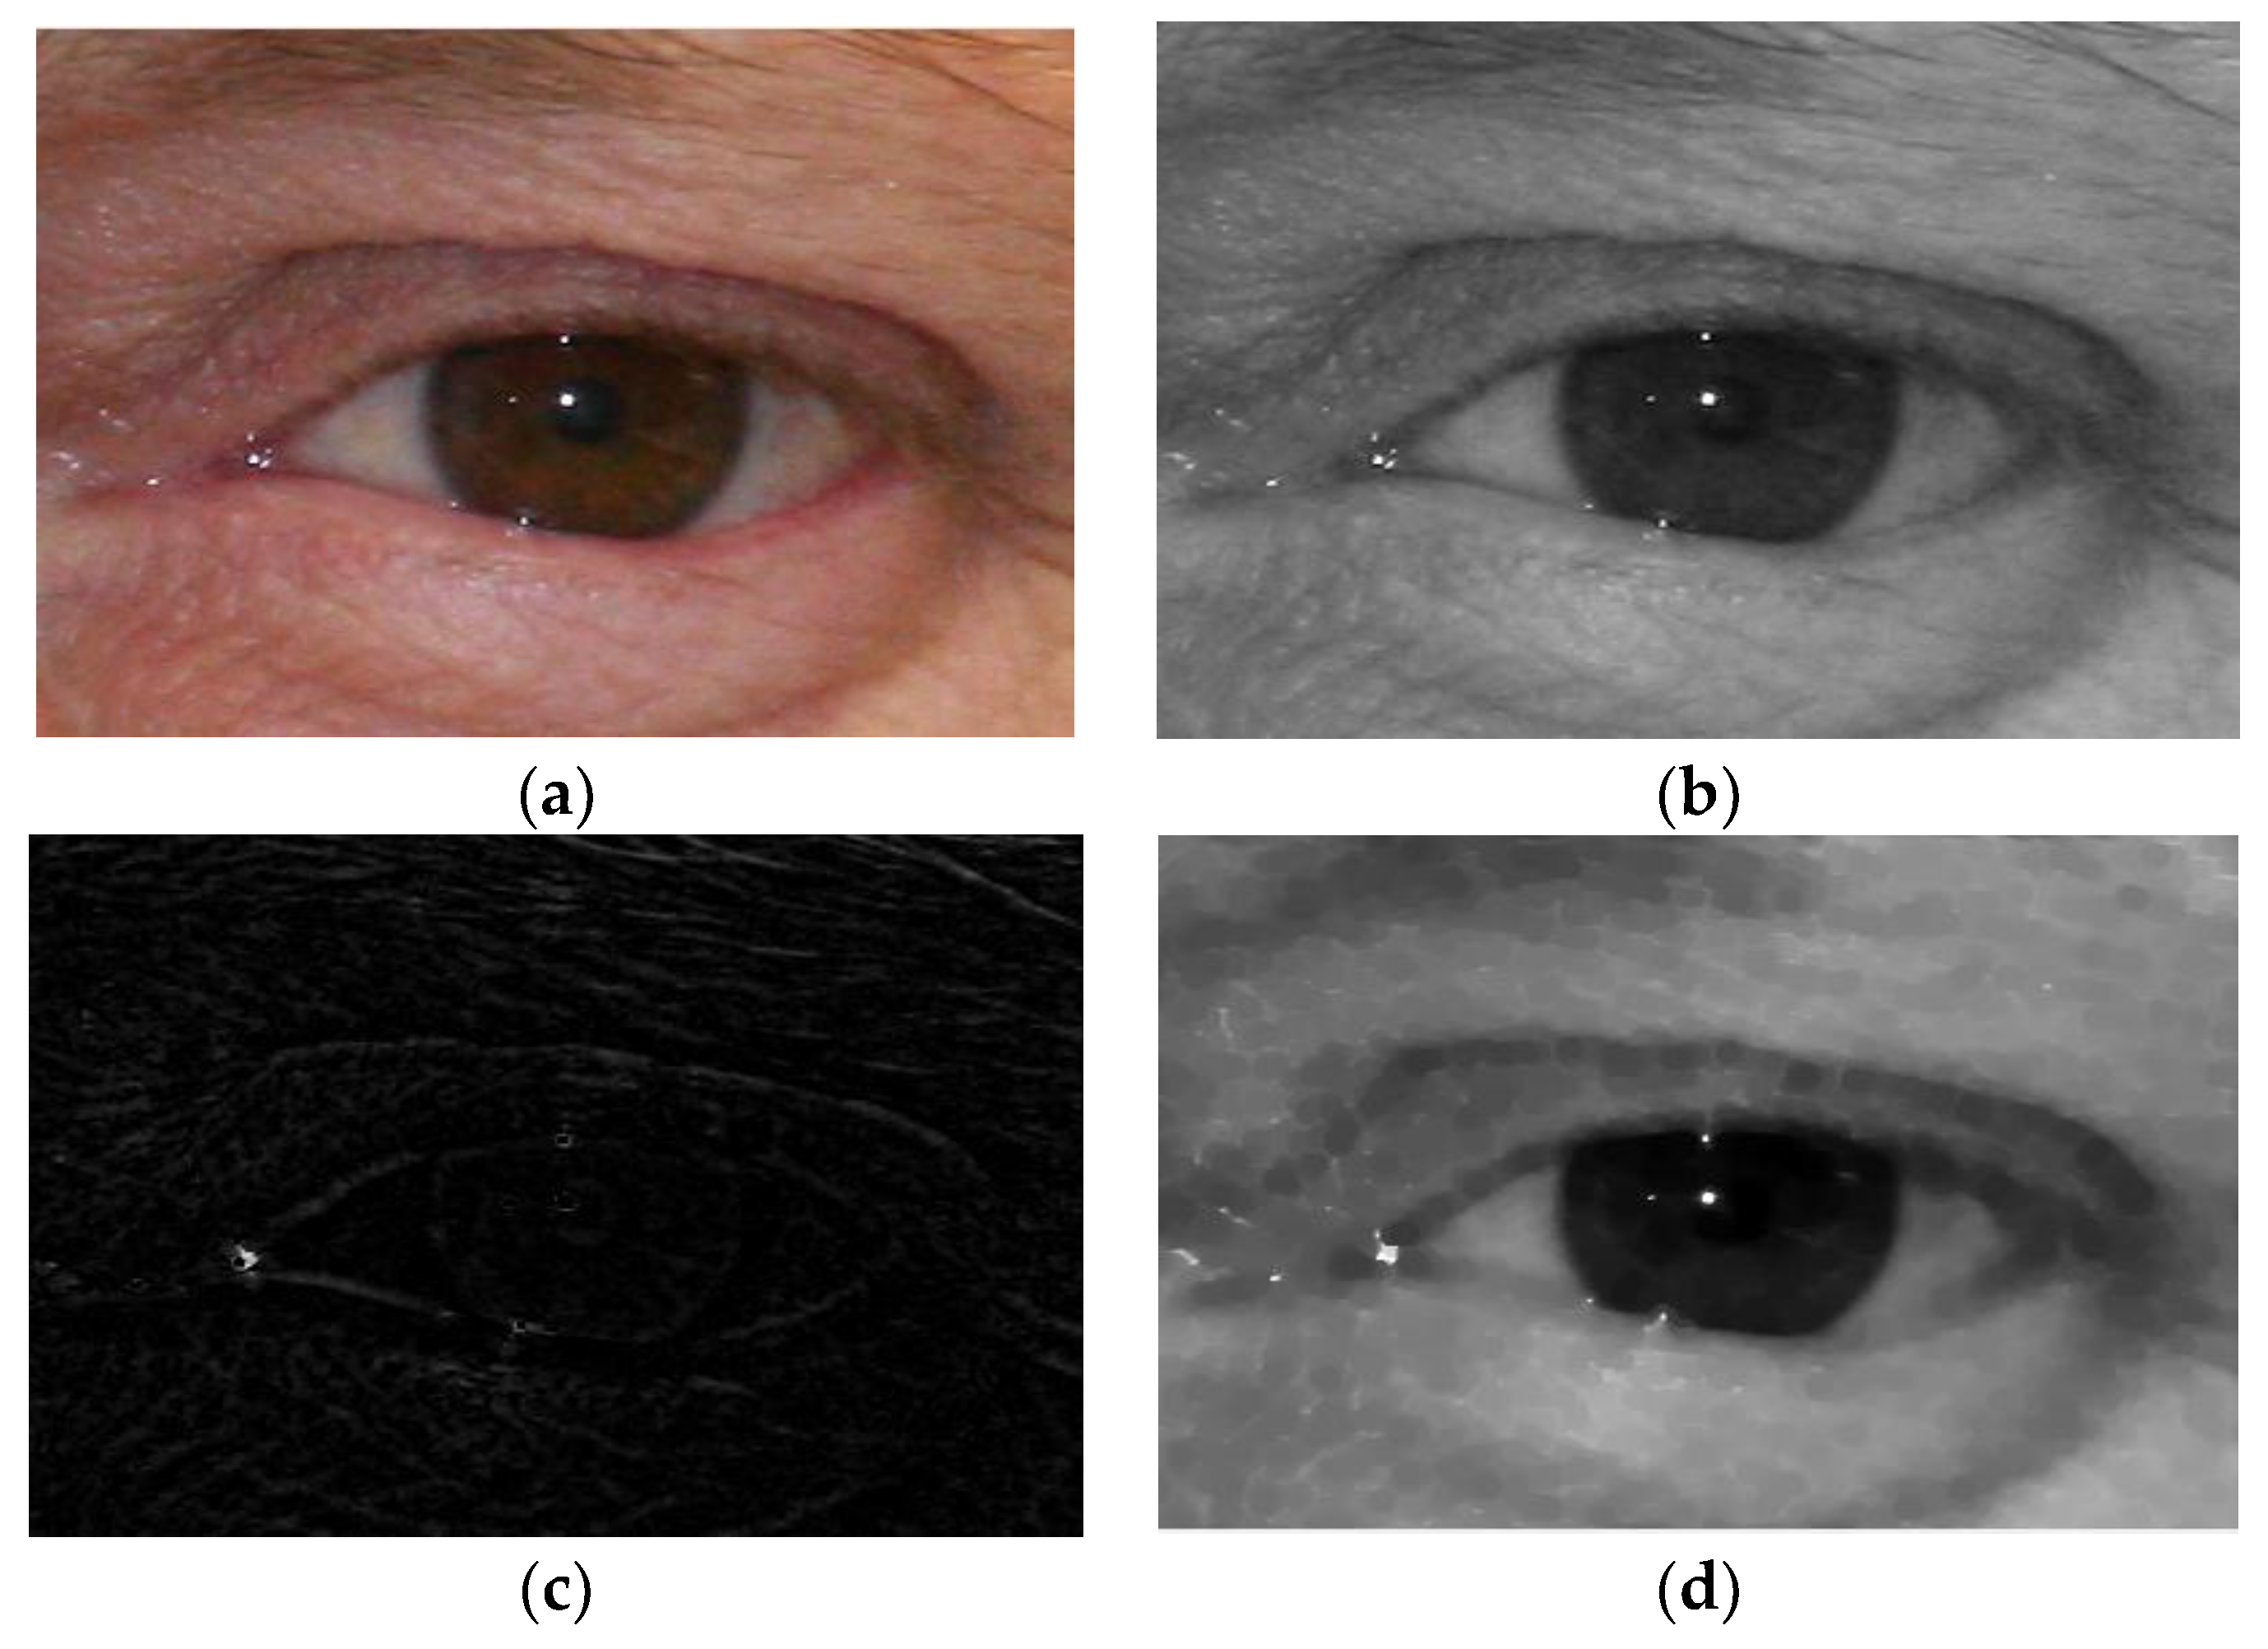
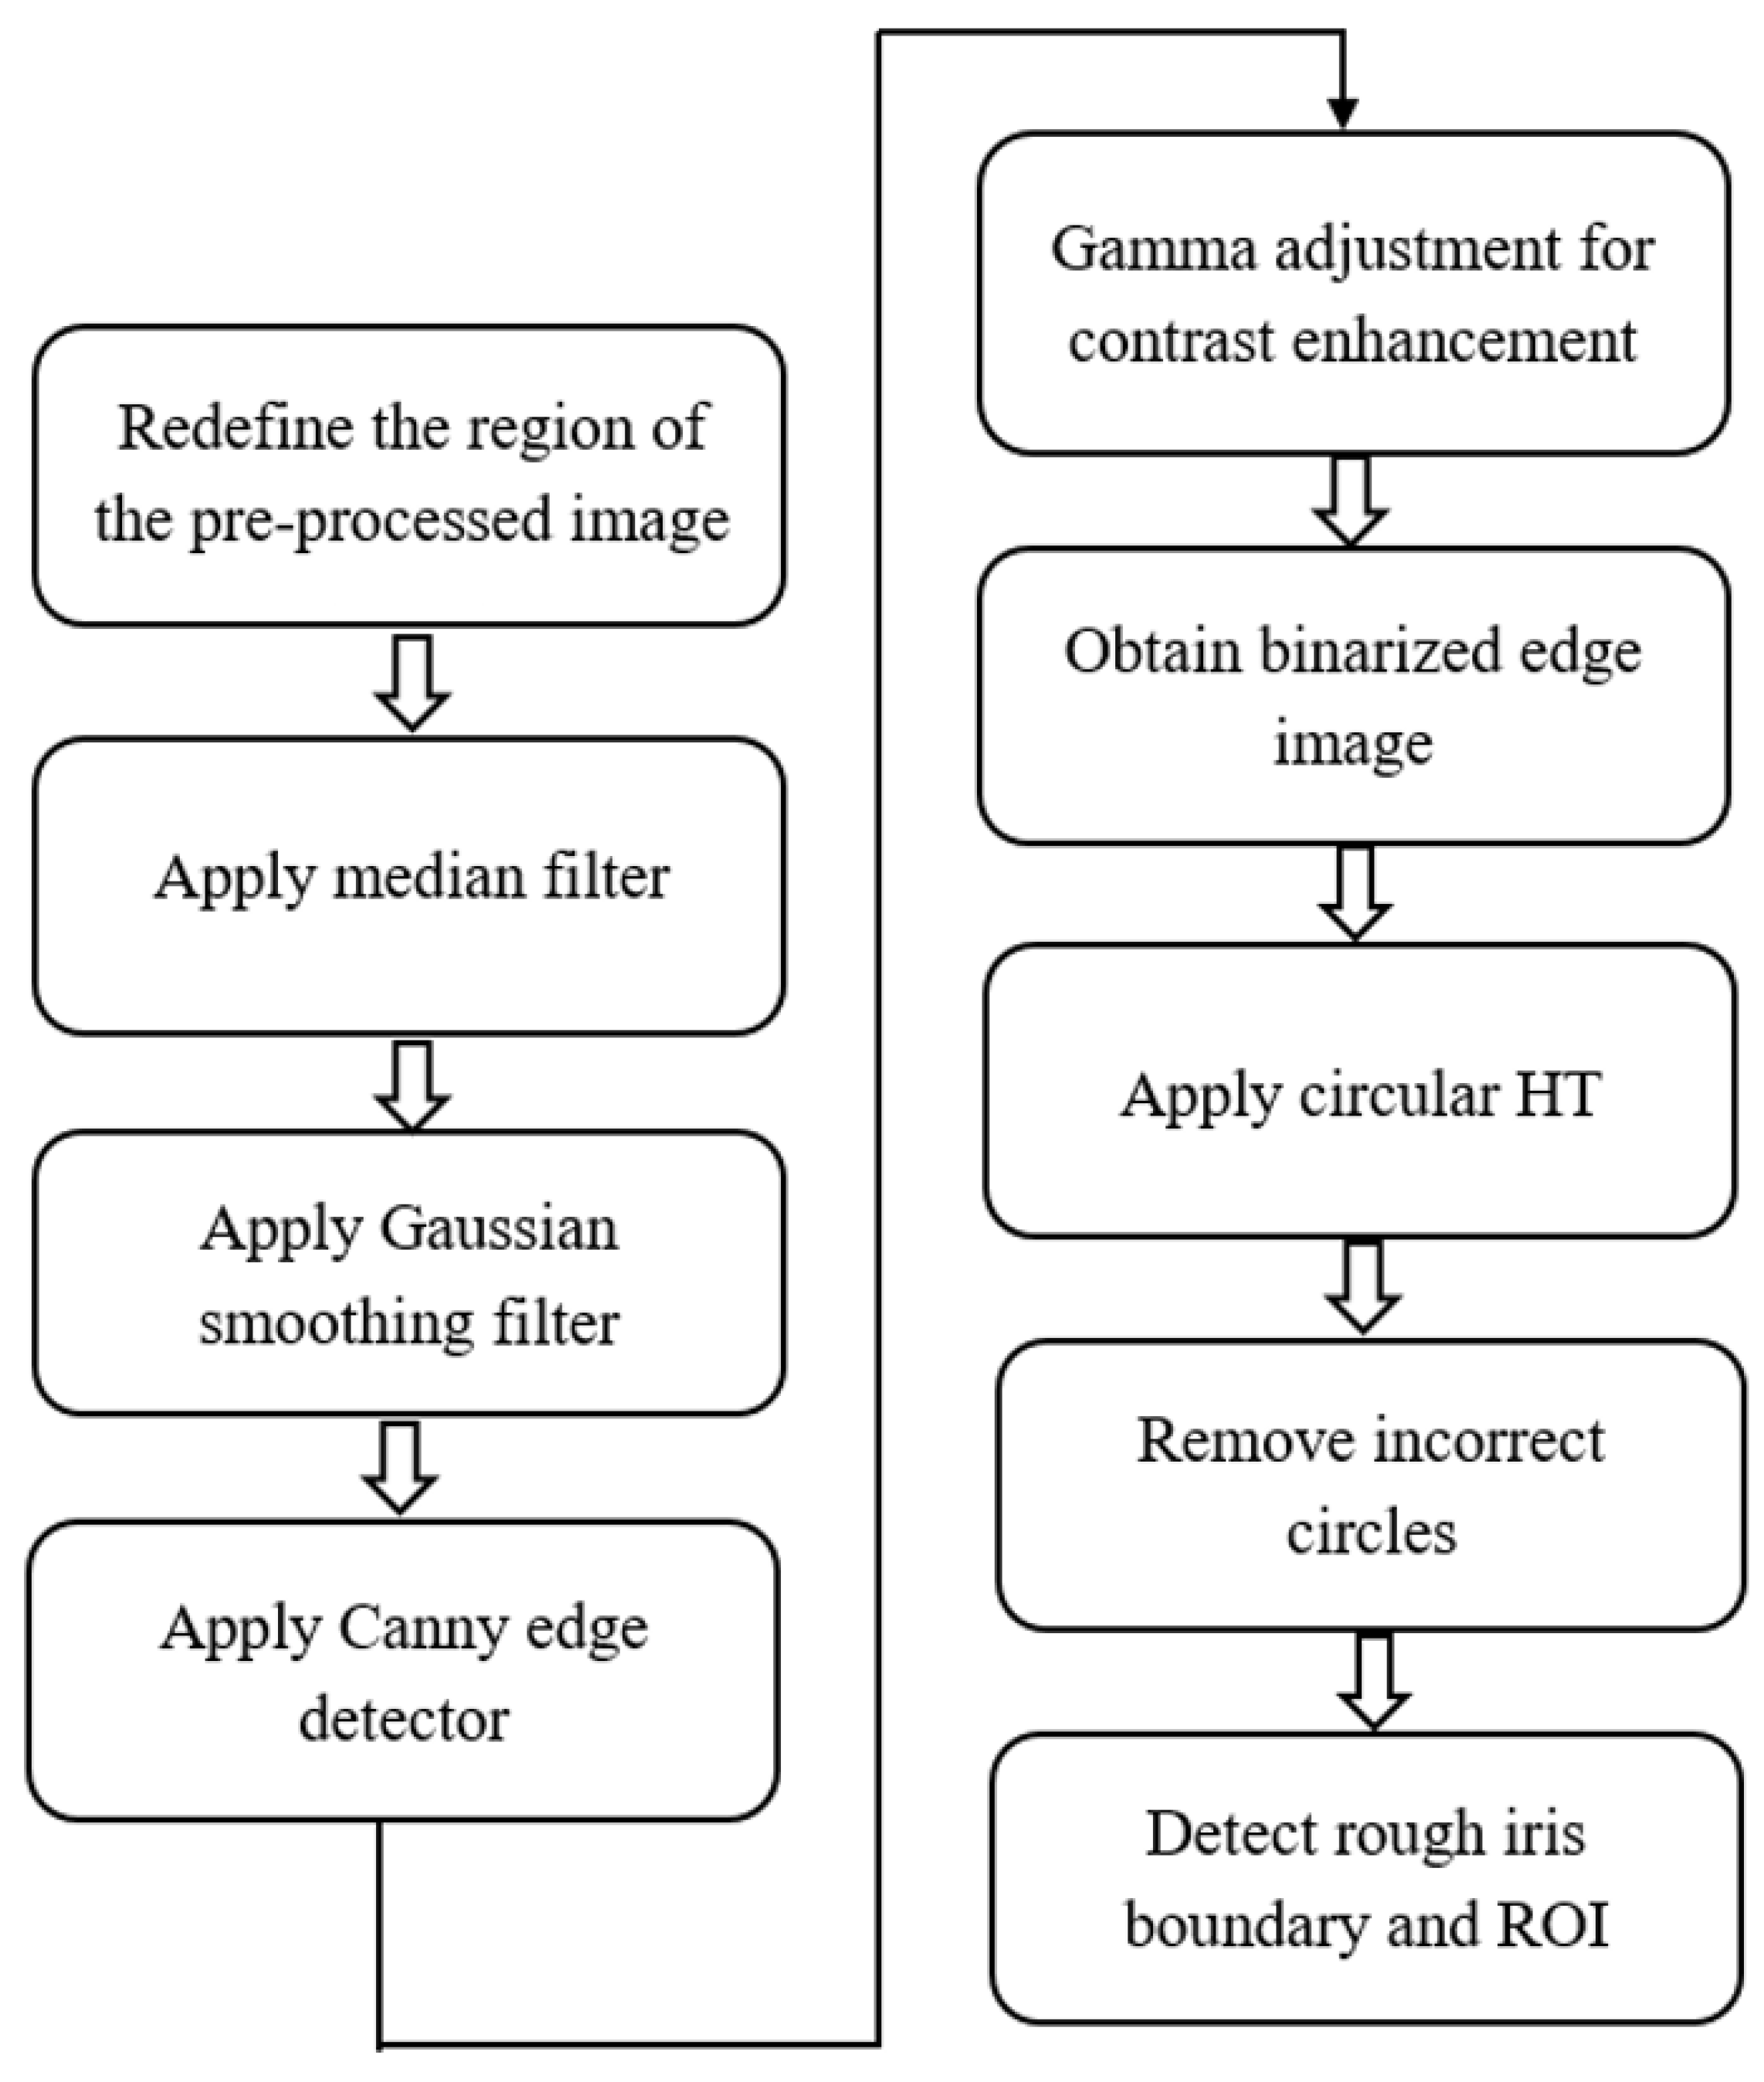
- The first stage includes bottom-hat filtering, noise removal, Canny edge detector, contrast enhancement, and modified HT to segment the approximate the iris boundary. In the second stage, deep CNN with the image input of 21 × 21 pixels is used to fit the true iris boundary. By applying the second stage segmentation only within the ROI defined by the approximate iris boundary detected in the first stage, we can reduce the processing time and error of iris segmentation.
- -
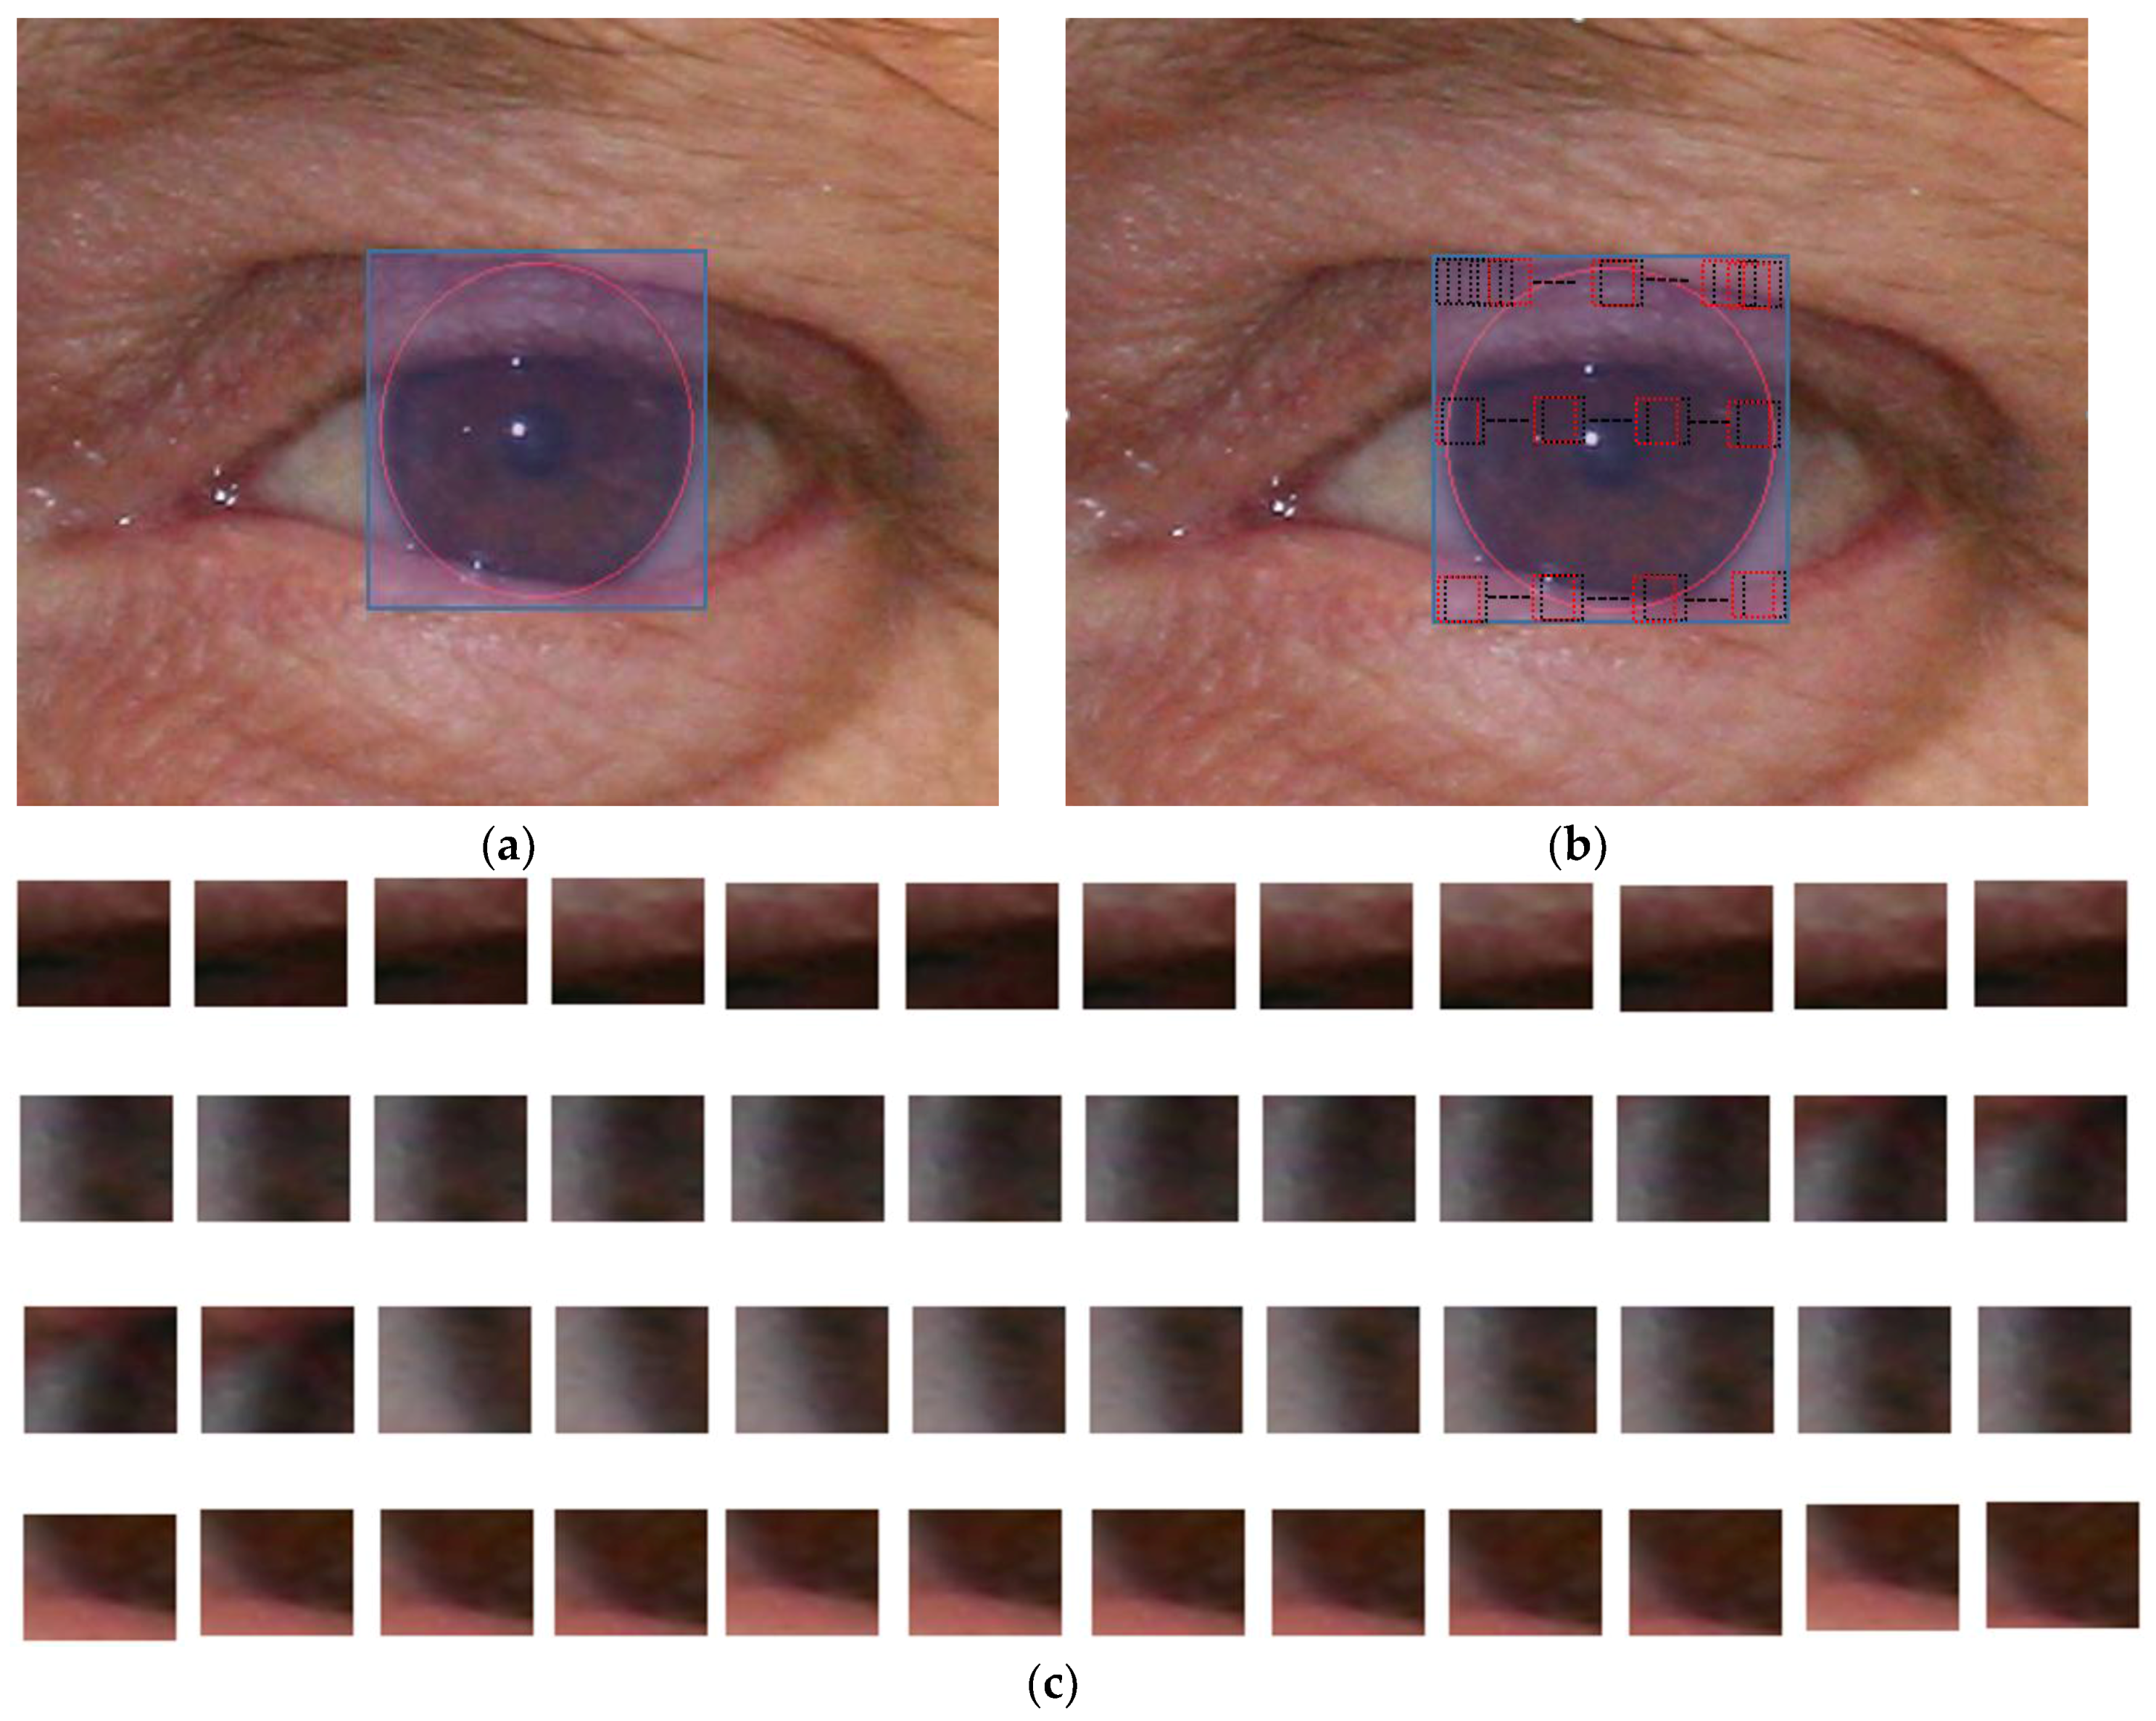
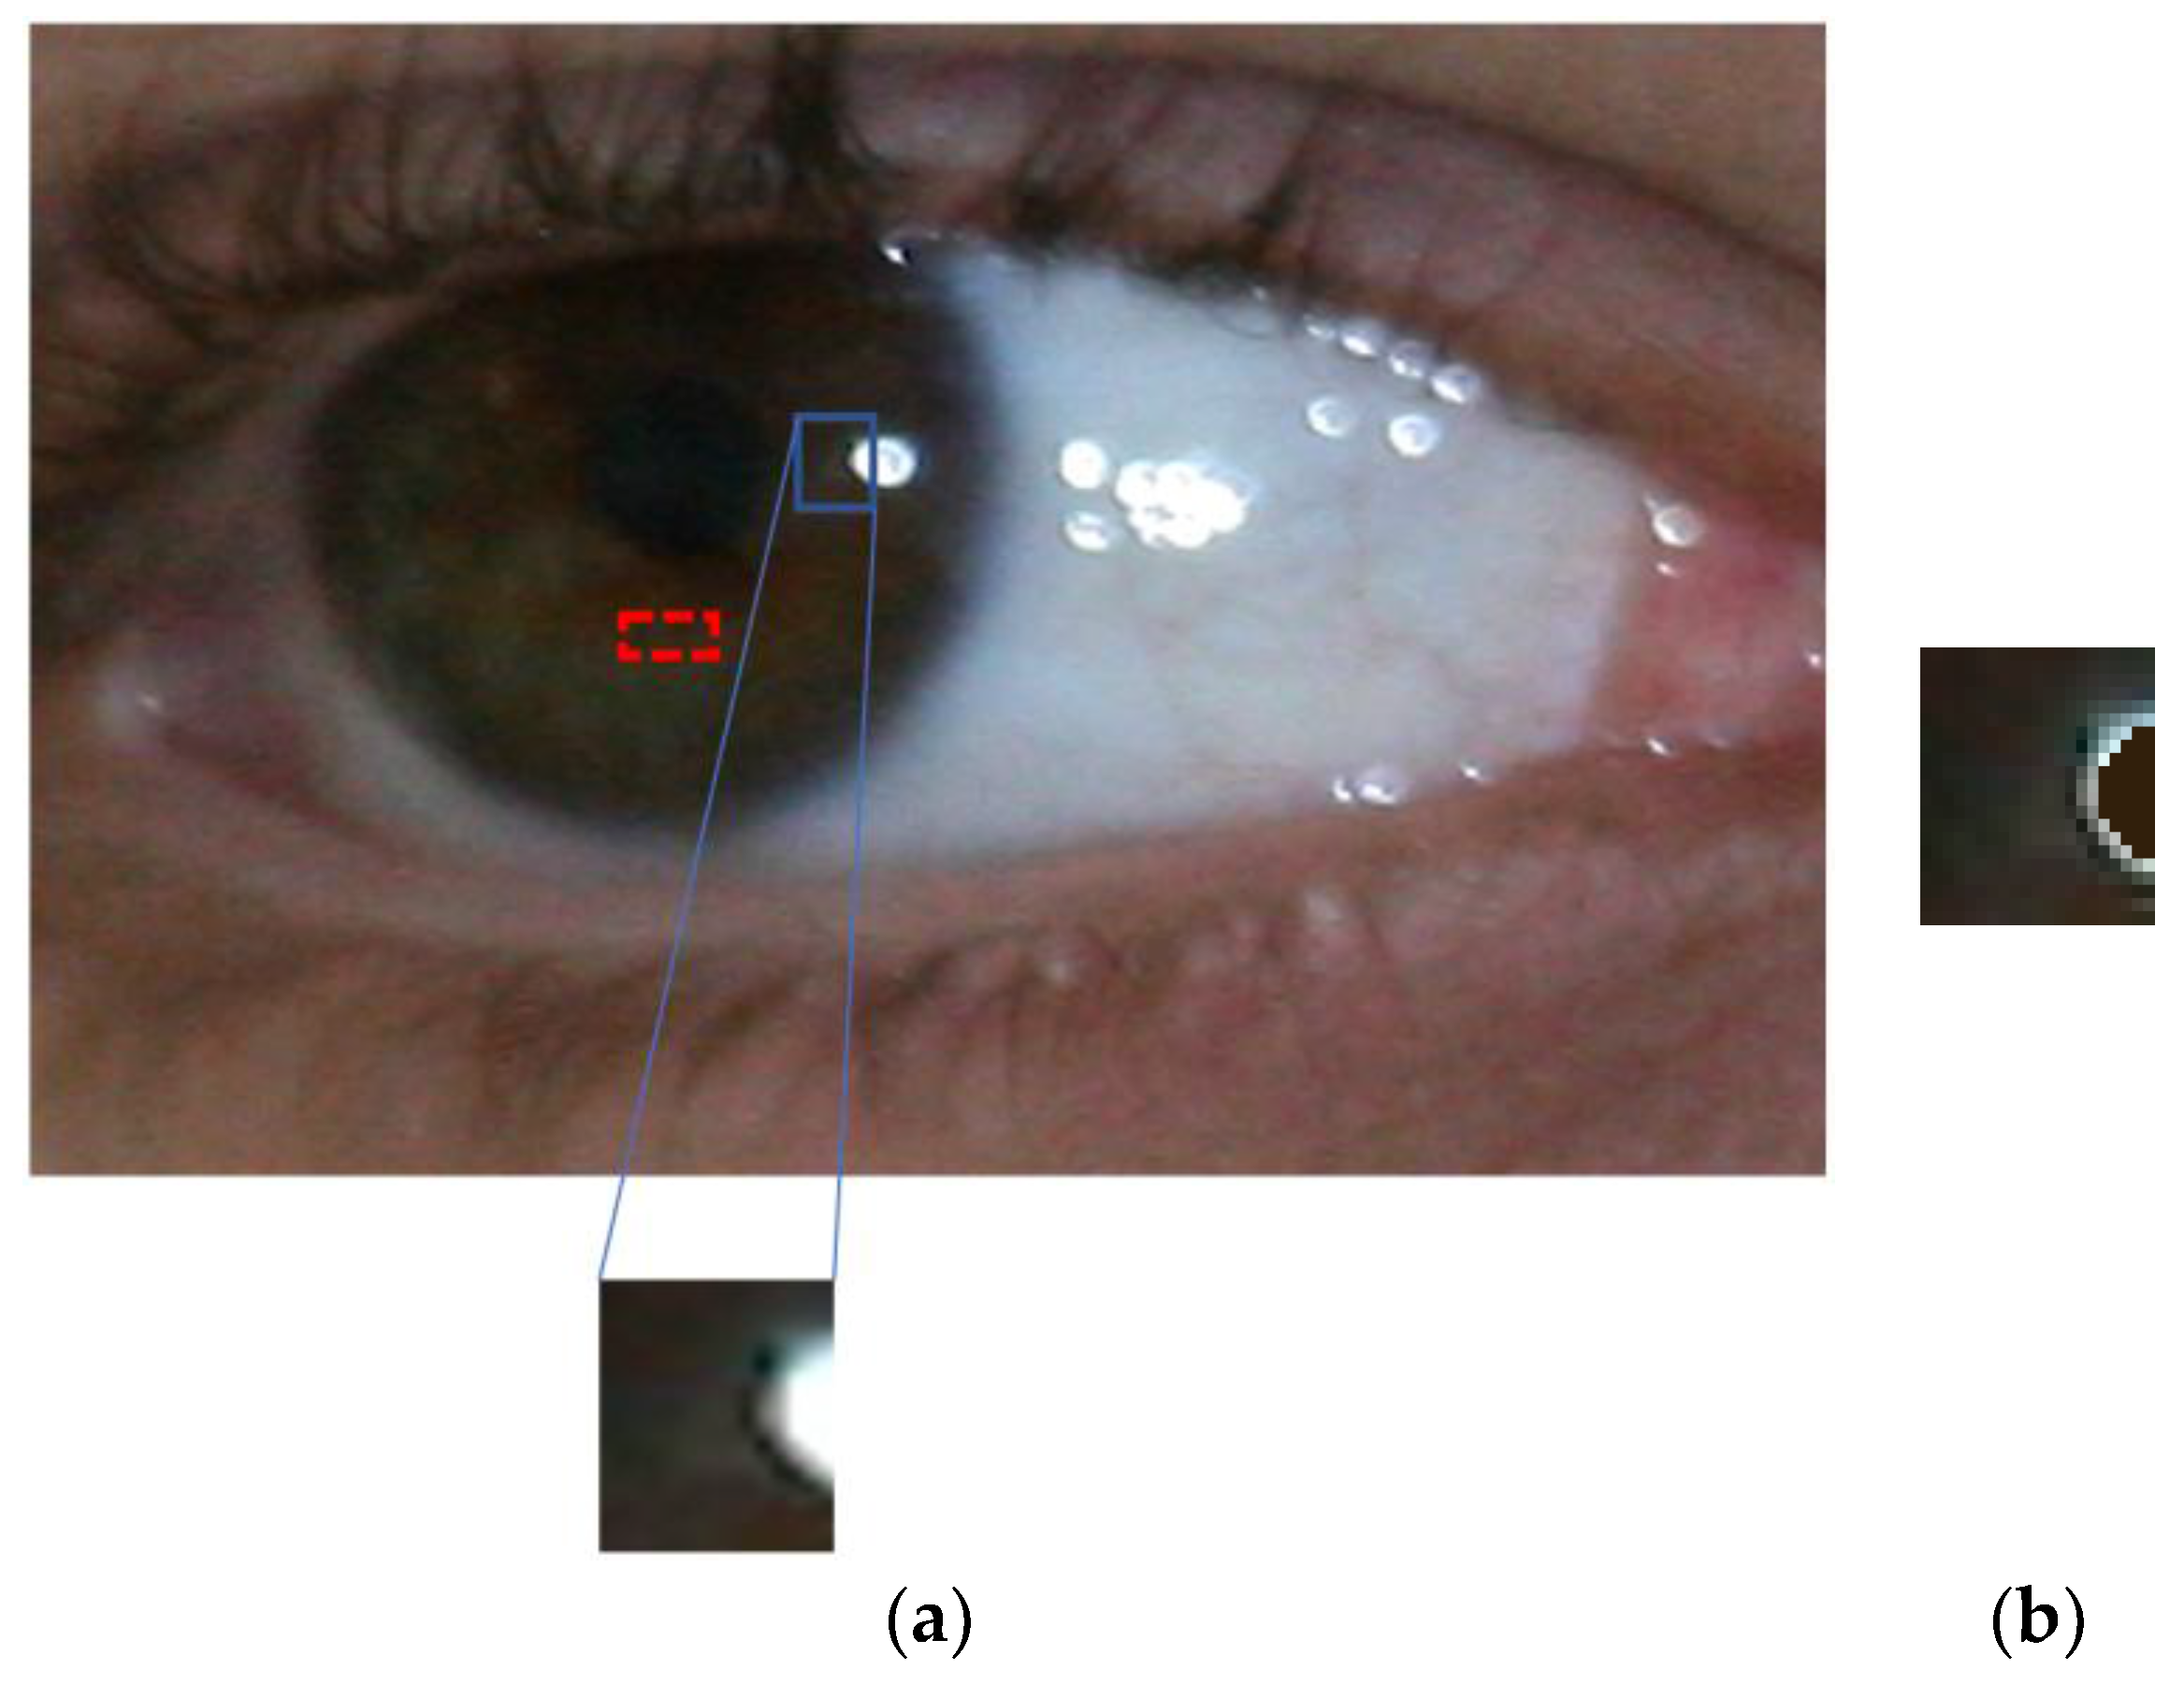
- To reduce the effect of bright SR in iris segmentation performance, the SR regions within the image input to CNN are normalized by the average RGB value of the iris region. Furthermore, our trained CNN models have been made publicly available through [33] to achieve fair comparisons by other researchers.
3. Proposed Method
3.1. Overview of the Proposed System
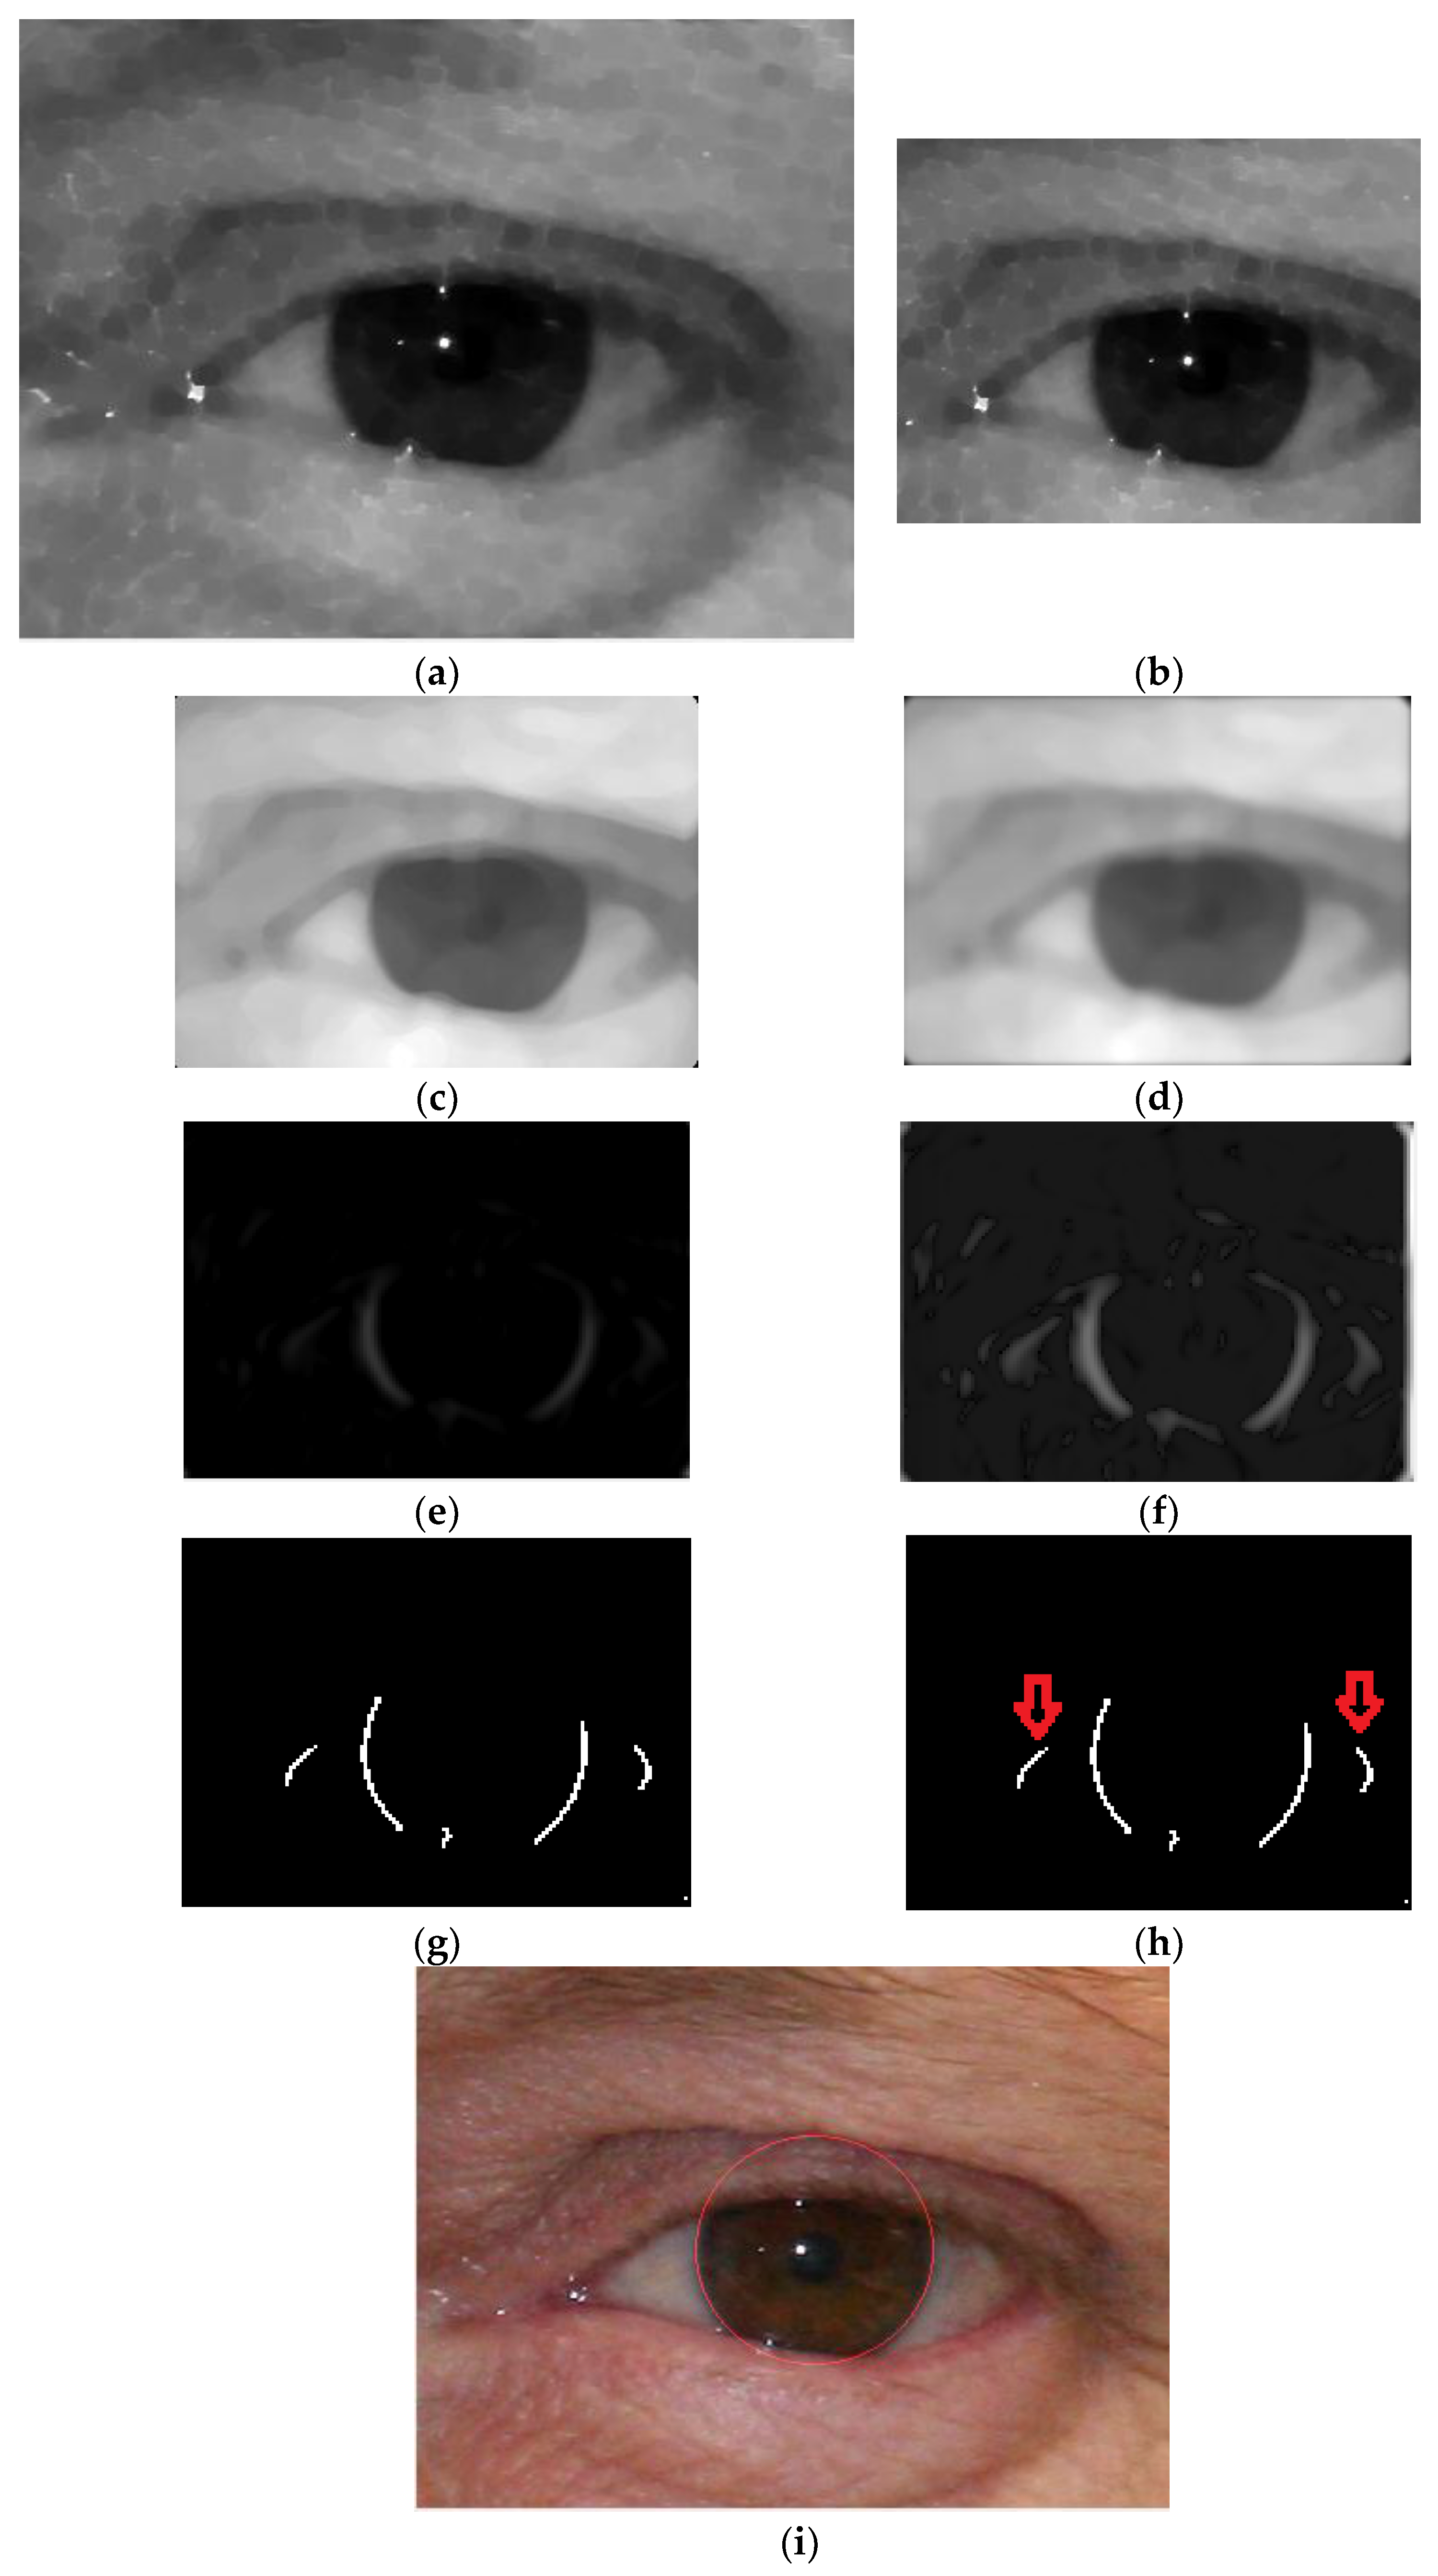
3.2. Stage 1. Detection of Rough Iris Boundary by Modified Circular HT
3.2.1. Phase 1. Pre-Processing
3.2.2. Phase 2. ROI Detection by Rough Iris Boundary
3.3. Iris Rough Boundary Analysis
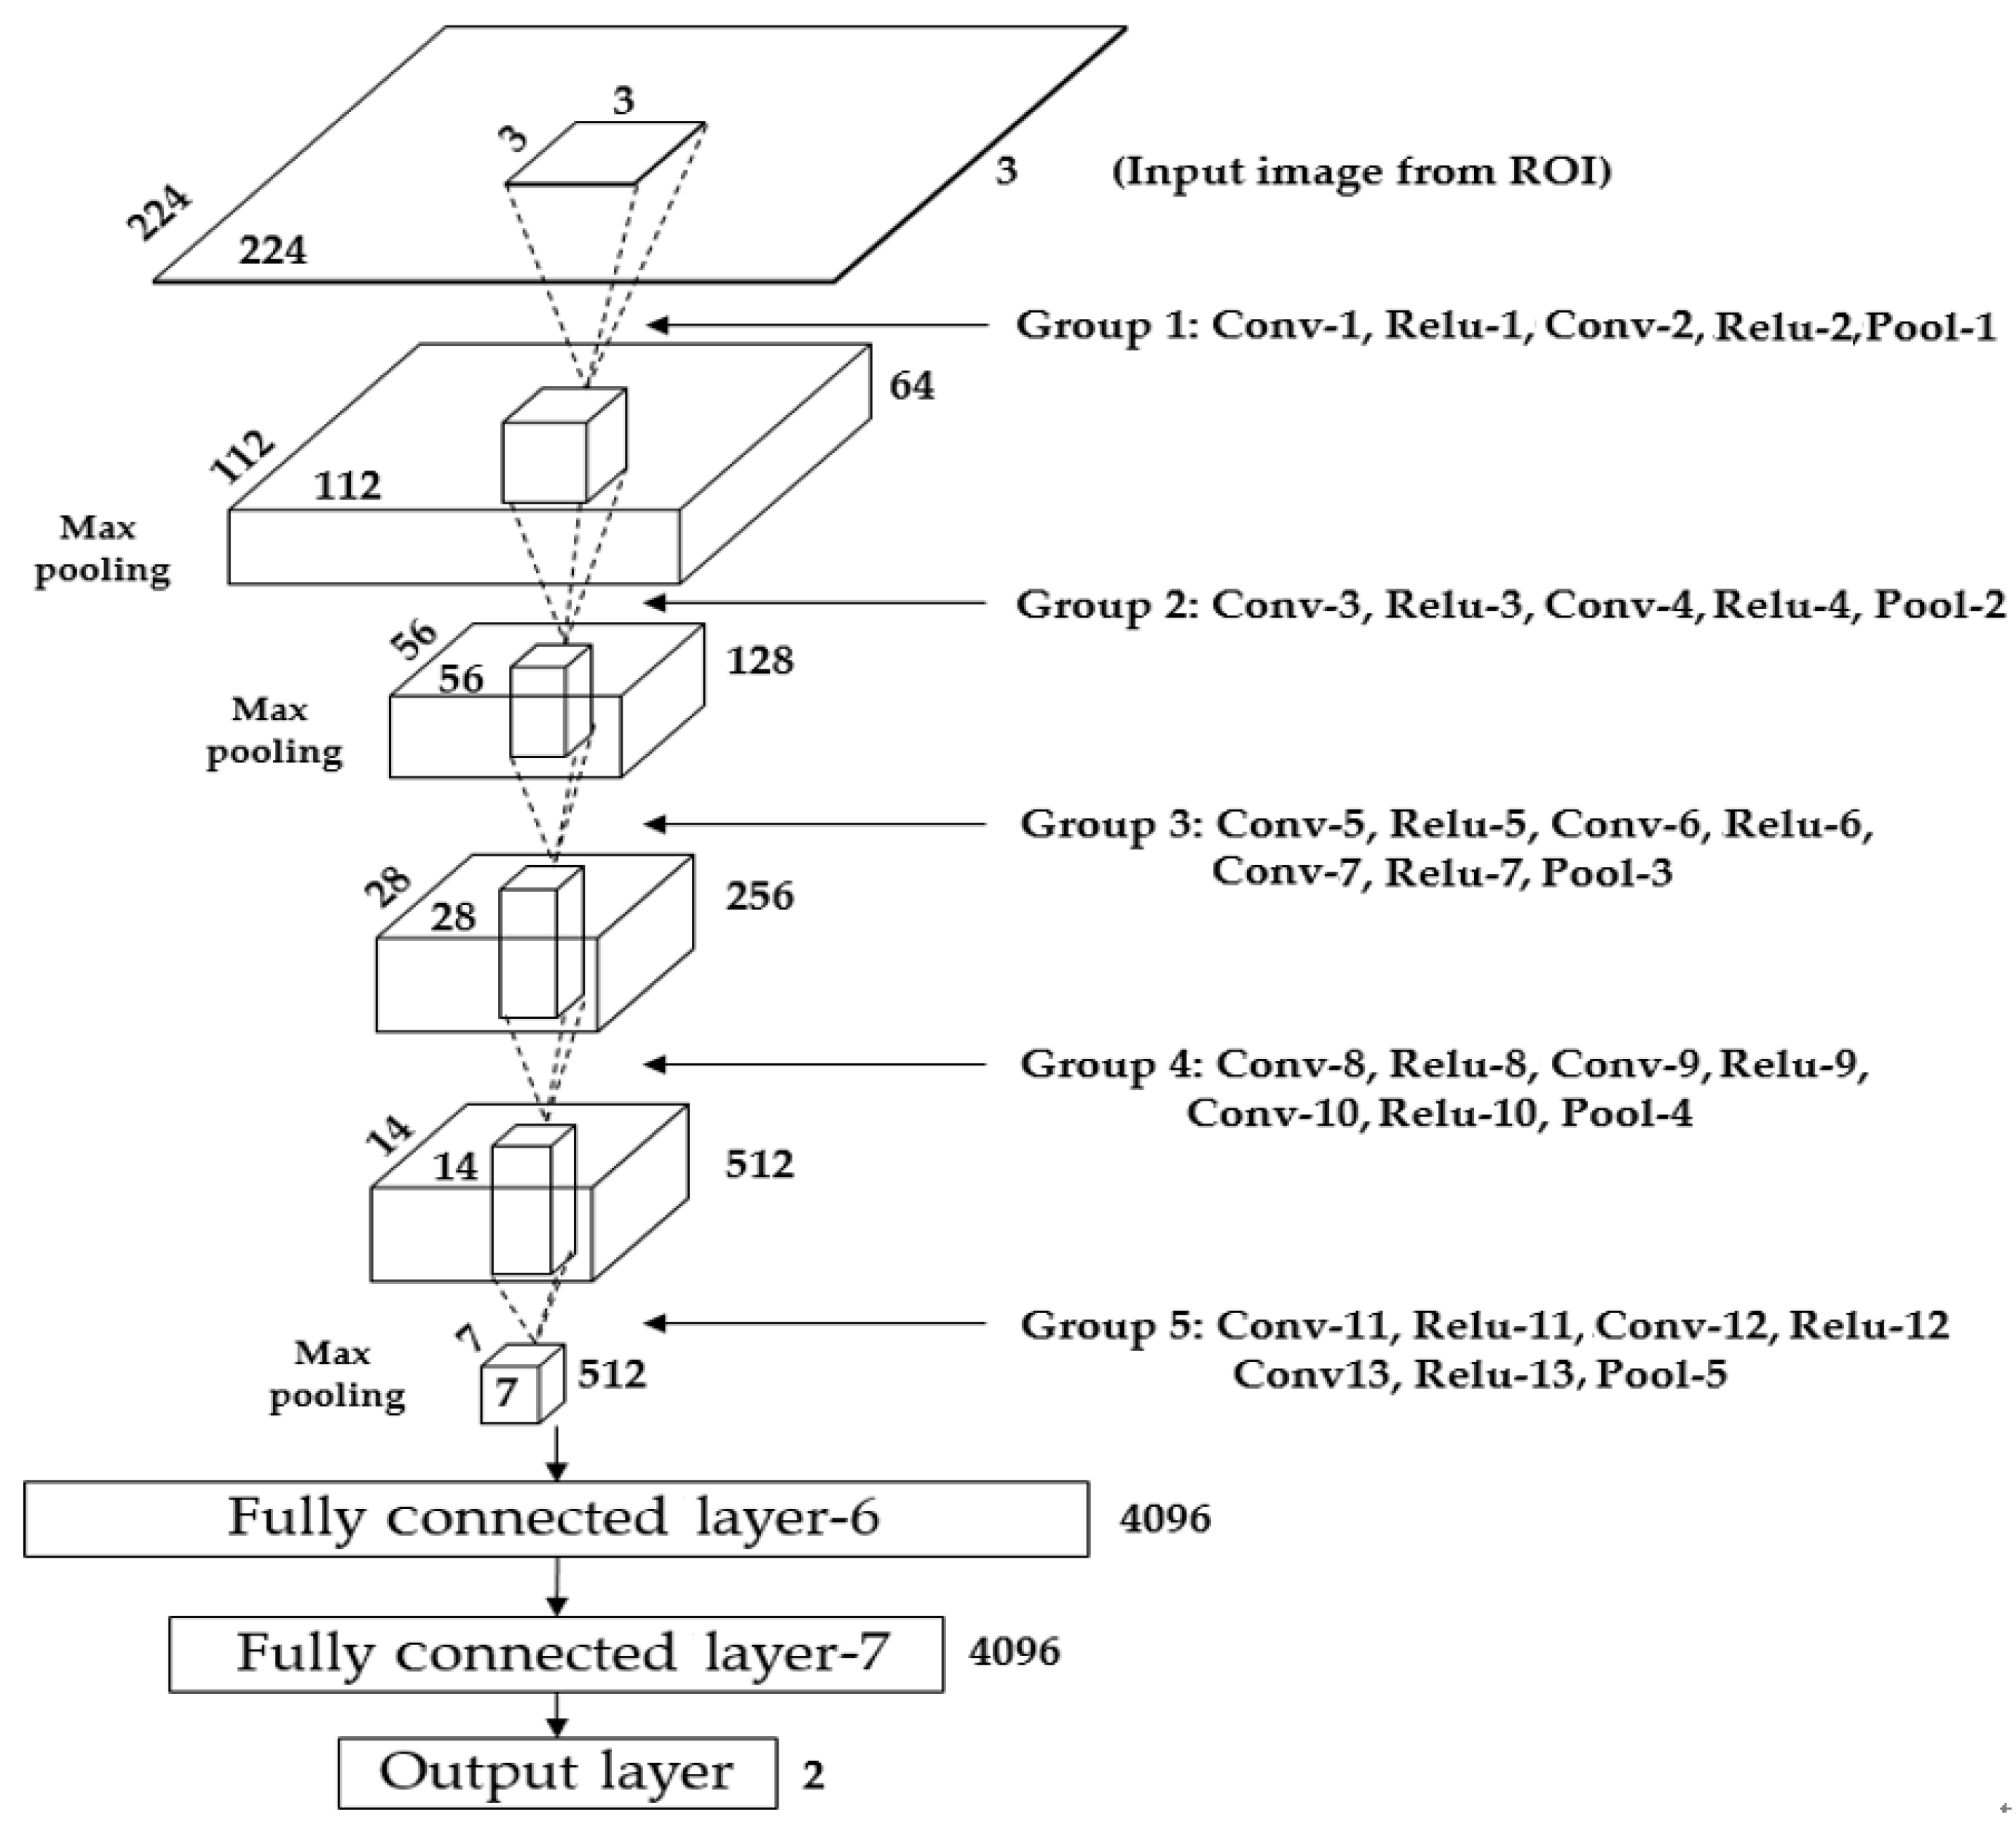
3.4. CNN-Based Detection of the Iris Region
3.4.1. Extracting the Mask for CNN Input
3.4.2. Iris Segmentation by CNN
3.5. Pupil Approximation by the Information of the Ratio of Pupil Contraction and Dilation
4. Experimental Results
4.1. Experimental Data and Environment
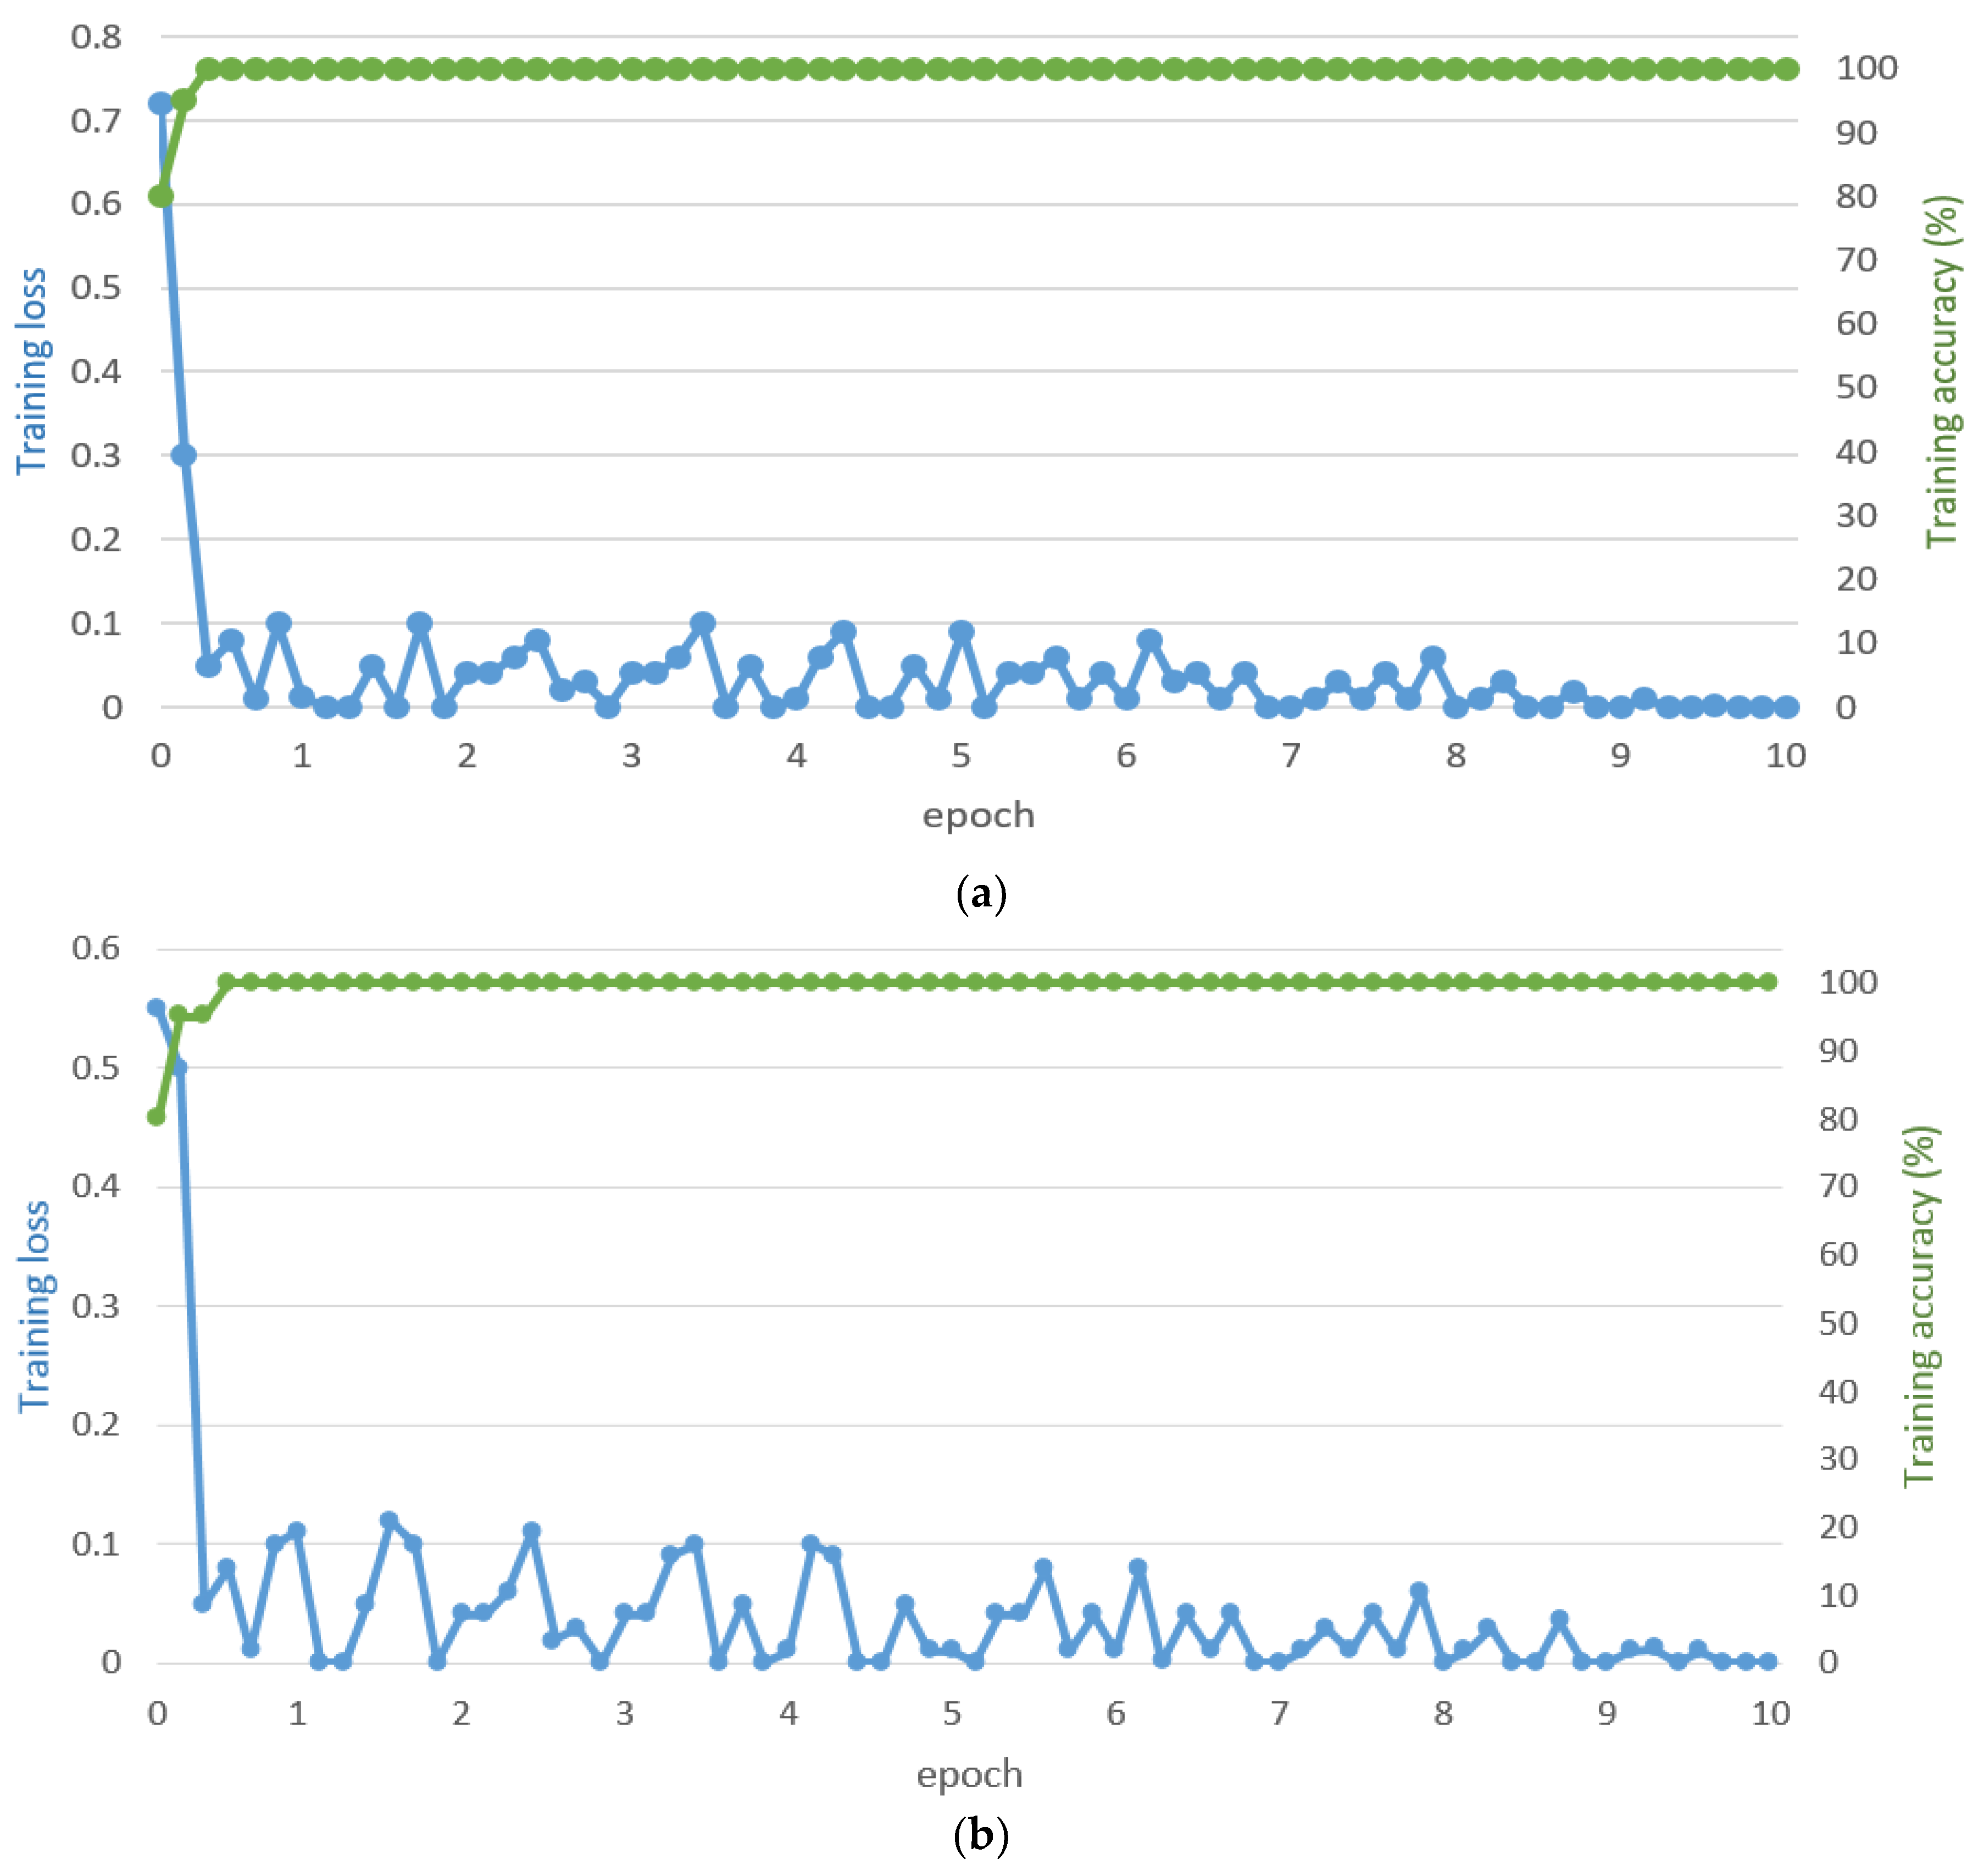
4.2. CNN Training
4.3. Testing of the Proposed CNN-Based Iris Segmentation
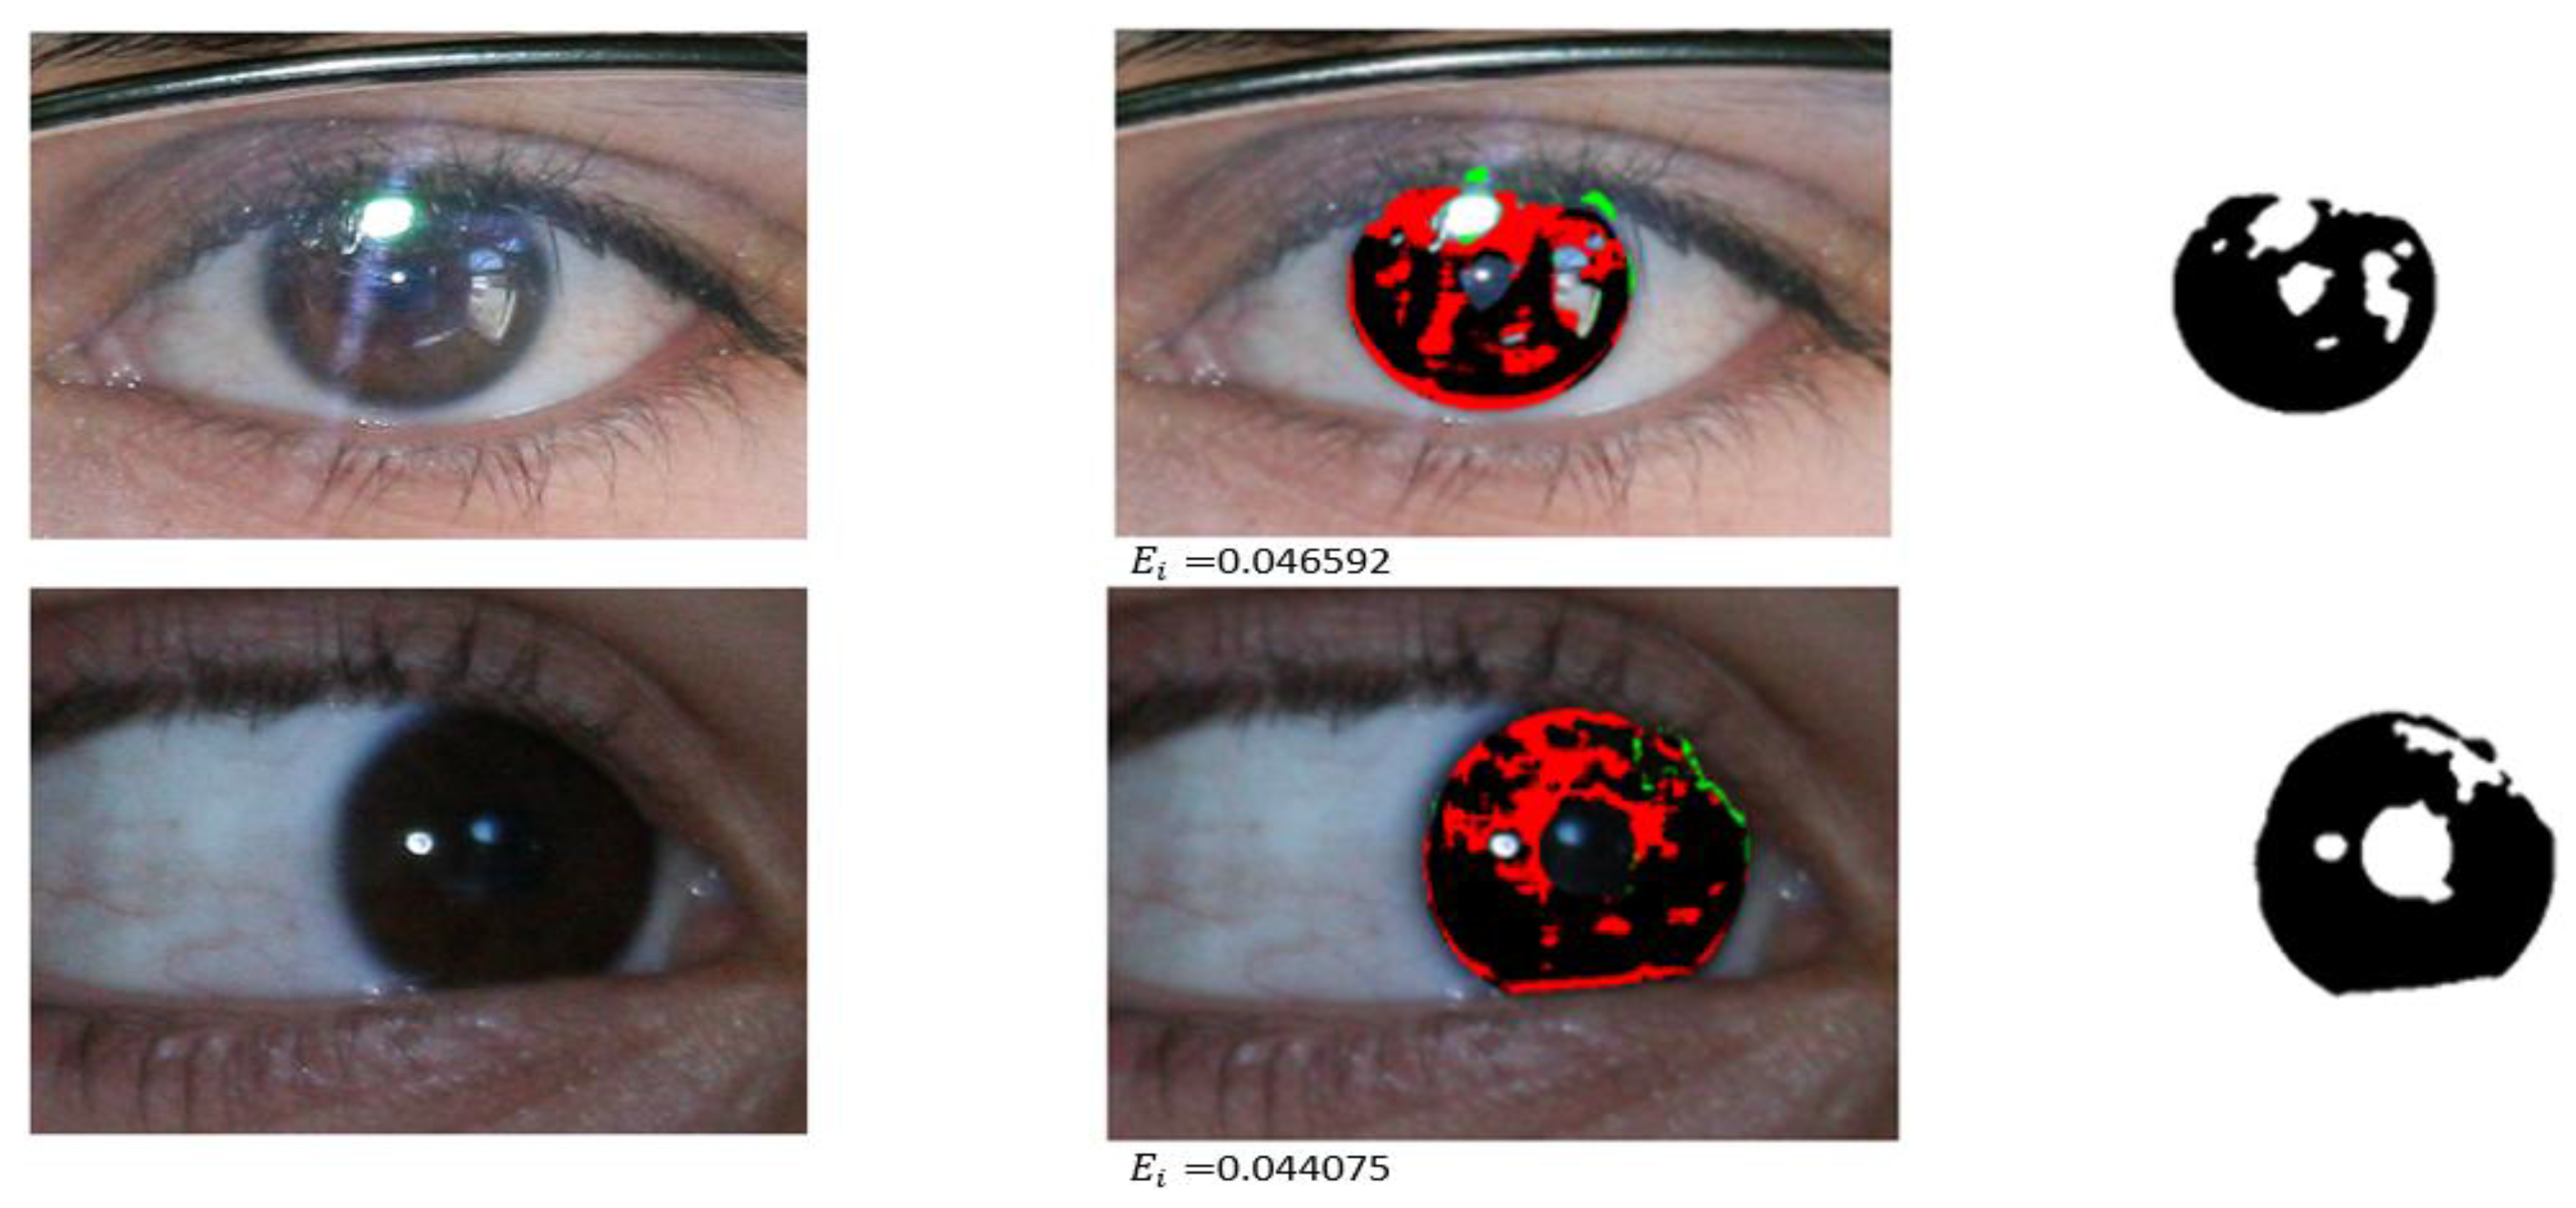
4.3.1. Iris Segmentation Results by the Proposed Method
4.3.2. Comparison of the Proposed Method with Previous Methods
4.3.3. Iris Segmentation Error with Another Open Database
5. Conclusions
Acknowledgments
Author Contributions
Conflicts of Interest
References
- Li, P.; Zhang, R. The evolution of biometrics. In Proceedings of the IEEE International Conference on Anti-Counterfeiting Security and Identification in Communication, Chengdu, China, 18–20 July 2010; pp. 253–256. [Google Scholar]
- Larrain, T.; Bernhard, J.S.; Mery, D.; Bowyer, K.W. Face recognition using sparse fingerprint classification algorithm. IEEE Trans. Inf. Forensics Secur. 2017, 12, 1646–1657. [Google Scholar] [CrossRef]
- Bonnen, K.; Klare, B.F.; Jain, A.K. Component-based representation in automated face recognition. IEEE Trans. Inf. Forensics Secur. 2013, 8, 239–253. [Google Scholar] [CrossRef]
- Daugman, J. How iris recognition works. IEEE Trans. Circuits Syst. Video Technol. 2004, 14, 21–30. [Google Scholar] [CrossRef]
- Viriri, S.; Tapamo, J.R. Integrating iris and signature traits for personal authentication using user-specific weighting. Sensors 2012, 12, 4324–4338. [Google Scholar] [CrossRef] [PubMed]
- Jain, A.K.; Arora, S.S.; Cao, K.; Best-Rowden, L.; Bhatnagar, A. Fingerprint recognition of young children. IEEE Trans. Inf. Forensic Secur. 2017, 12, 1501–1514. [Google Scholar] [CrossRef]
- Hong, H.G.; Lee, M.B.; Park, K.R. Convolutional neural network-based finger-vein recognition using NIR image sensors. Sensors 2017, 17, 1297. [Google Scholar] [CrossRef] [PubMed]
- Yaxin, Z.; Huanhuan, L.; Xuefei, G.; Lili, L. Palmprint recognition based on multi-feature integration. In Proceedings of the IEEE Advanced Information Management, Communicates, Electronic and Automation Control Conference, Xi’an, China, 3–5 October 2016; pp. 992–995. [Google Scholar]
- Daugman, J. Information theory and the IrisCode. IEEE Trans. Inf. Forensics Secur. 2016, 11, 400–409. [Google Scholar] [CrossRef]
- Hsieh, S.-H.; Li, Y.-H.; Tien, C.-H. Test of the practicality and feasibility of EDoF-empowered image sensors for long-range biometrics. Sensors 2016, 16, 1994. [Google Scholar] [CrossRef] [PubMed]
- He, Z.; Tan, T.; Sun, Z.; Qiu, X. Toward accurate and fast iris segmentation for iris biometrics. IEEE Trans. Pattern Anal. Mach. Intell. 2009, 31, 1670–1684. [Google Scholar] [PubMed]
- Li, Y.-H.; Savvides, M. An automatic iris occlusion estimation method based on high-dimensional density estimation. IEEE Trans. Pattern Anal. Mach. Intell. 2013, 35, 784–796. [Google Scholar] [CrossRef] [PubMed]
- Matey, J.R.; Naroditsky, O.; Hanna, K.; Kolczynski, R.; LoIacono, D.J.; Mangru, S.; Tinker, M.; Zappia, T.M.; Zhao, W.Y. Iris on the move: Acquisition of images for iris recognition in less constrained environments. Proc. IEEE 2006, 94, 1936–1947. [Google Scholar] [CrossRef]
- Wildes, R.P. Iris recognition: An emerging biometric technology. Proc. IEEE 1997, 85, 1348–1363. [Google Scholar] [CrossRef]
- Uhl, A.; Wild, P. Weighted adaptive hough and ellipsopolar transforms for real-time iris segmentation. In Proceedings of the 5th IEEE International Conference on Biometrics, New Delhi, India, 29 March–1 April 2012; pp. 283–290. [Google Scholar]
- Zhao, Z.; Kumar, A. An accurate iris segmentation framework under relaxed imaging constraints using total variation model. In Proceedings of the IEEE International Conference on Computer Vision, Santiago, Chile, 7–13 December 2015; pp. 3828–3836. [Google Scholar]
- Roy, D.A.; Soni, U.S. IRIS segmentation using Daughman’s method. In Proceedings of the IEEE International Conference on Electrical, Electronics, and Optimization Techniques, Chennai, India, 3–5 March 2016; pp. 2668–2676. [Google Scholar]
- Jeong, D.S.; Hwang, J.W.; Kang, B.J.; Park, K.R.; Won, C.S.; Park, D.-K.; Kim, J. A new iris segmentation method for non-ideal iris images. Image Vis. Comput. 2010, 28, 254–260. [Google Scholar] [CrossRef]
- Tan, T.; He, Z.; Sun, Z. Efficient and robust segmentation of noisy iris images for non-cooperative iris recognition. Image Vis. Comput. 2010, 28, 223–230. [Google Scholar] [CrossRef]
- Khan, T.M.; Khan, M.A.; Malik, S.A.; Khan, S.A.; Bashir, T.; Dar, A.H. Automatic localization of pupil using eccentricity and iris using gradient based method. Opt. Lasers Eng. 2011, 49, 177–187. [Google Scholar] [CrossRef]
- Parikh, Y.; Chaskar, U.; Khakole, H. Effective approach for iris localization in nonideal imaging conditions. In Proceedings of the IEEE Students’ Technology Symposium, Kharagpur, India, 28 February–2 March 2014; pp. 239–246. [Google Scholar]
- Shah, S.; Ross, A. Iris segmentation using geodesic active contours. IEEE Trans. Inf. Forensic Secur. 2009, 4, 824–836. [Google Scholar] [CrossRef]
- Abdullah, M.A.M.; Dlay, S.S.; Woo, W.L.; Chambers, J.A. Robust iris segmentation method based on a new active contour force with a noncircular normalization. IEEE Trans. Syst. Man Cybern. 2017, 1–14, in press. [Google Scholar] [CrossRef]
- Chai, T.-Y.; Goi, B.-M.; Tay, Y.H.; Chin, W.-K.; Lai, Y.-L. Local Chan-Vese segmentation for non-ideal visible wavelength iris images. In Proceedings of the IEEE Conference on Technologies and Applications of Artificial Intelligence, Tainan, Taiwan, 20–22 November 2015; pp. 506–511. [Google Scholar]
- Li, H.; Sun, Z.; Tan, T. Robust iris segmentation based on learned boundary detectors. In Proceedings of the International Conference on Biometrics, New Delhi, India, 29 March–1 April 2012; pp. 317–322. [Google Scholar]
- Vokhidov, H.; Hong, H.G.; Kang, J.K.; Hoang, T.M.; Park, K.R. Recognition of damaged arrow-road markings by visible light camera sensor based on convolutional neural network. Sensors 2016, 16, 2160. [Google Scholar] [CrossRef] [PubMed]
- Nguyen, D.T.; Kim, K.W.; Hong, H.G.; Koo, J.H.; Kim, M.C.; Park, K.R. Gender recognition from human-body images using visible-light and thermal camera videos based on a convolutional neural network for image feature extraction. Sensors 2017, 17, 637. [Google Scholar] [CrossRef] [PubMed]
- Kim, J.H.; Hong, H.G.; Park, K.R. Convolutional neural network-based human detection in nighttime images using visible light camera sensors. Sensors 2017, 17, 1–26. [Google Scholar]
- Pereira, S.; Pinto, A.; Alves, V.; Silva, C.A. Brain tumor segmentation using convolutional neural networks in MRI images. IEEE Trans. Med. Imaging 2016, 35, 1240–1251. [Google Scholar] [CrossRef] [PubMed]
- Liu, N.; Zhang, M.; Li, H.; Sun, Z.; Tan, T. DeepIris: Learning pairwise filter bank for heterogeneous iris verification. Pattern Recognit. Lett. 2016, 82, 154–161. [Google Scholar] [CrossRef]
- Gangwar, A.; Joshi, A. DeepIrisNet: Deep iris representation with applications in iris recognition and cross-sensor iris recognition. In Proceedings of the IEEE International Conference on Image Processing, Phoenix, USA, 25–28 September 2016; pp. 2301–2305. [Google Scholar]
- Liu, N.; Li, H.; Zhang, M.; Liu, J.; Sun, Z.; Tan, T. Accurate iris segmentation in non-cooperative environments using fully convolutional networks. In Proceedings of the IEEE International Conference on Biometrics, Halmstad, Sweden, 13–16 June 2016; pp. 1–8. [Google Scholar]
- Dongguk Visible Light Iris Segmentation CNN Model (DVLIS-CNN). Available online: http://dm.dgu.edu/link.html (accessed on 27 July 2017).
- Parkhi, O.M.; Vedaldi, A.; Zisserman, A. Deep face recognition. In Proceedings of the British Machine Vision Conference, Swansea, UK, 7–10 September 2015; pp. 1–12. [Google Scholar]
- CS231n Convolutional Neural Networks for Visual Recognition. Available online: http://cs231n.github.io/neural-networks-1/ (accessed on 26 July 2017).
- Glorot, X.; Bordes, A.; Bengio, Y. Deep sparse rectifier neural networks. In Proceedings of the 14th International Conference on Artificial Intelligence and Statistics, Fort Lauderdale, FL, USA, 11–13 April 2011; pp. 315–323. [Google Scholar]
- Nair, V.; Hinton, G.E. Rectified linear units improve restricted boltzmann machines. In Proceedings of the 27th International Conference onachine Learning, Haifa, Israel, 21–24 June 2010; pp. 807–814. [Google Scholar]
- Krizhevsky, A.; Sutskever, I.; Hinton, G.E. Imagenet classification with deep convolutional neural networks. In Advances in Neural Information Processing Systems 25; Curran Associates, Inc.: New York, NY, USA, 2012; pp. 1097–1105. [Google Scholar]
- Heaton, J. Artificial Intelligence for Humans. In Deep Learning and Neural Networks; Heaton Research, Inc.: St. Louis, USA, 2015; Volume 3. [Google Scholar]
- Srivastava, N.; Hinton, G.; Krizhevsky, A.; Sutskever, I.; Salakhutdinov, R. Dropout: A simple way to prevent neural networks from overfitting. J. Mach. Learn. Res. 2014, 15, 1929–1958. [Google Scholar]
- Wyatt, H.J. A ‘minimum-wear-and-tear‘ meshwork for the iris. Vision Res. 2000, 40, 2167–2176. [Google Scholar] [CrossRef]
- NICE.II. Noisy Iris Challenge Evaluation-Part II. Available online: http://nice2.di.ubi.pt/index.html (accessed on 26 July 2017).
- Proença, H.; Filipe, S.; Santos, R.; Oliveira, J.; Alexandre, L.A. The UBIRIS.v2: A database of visible wavelength iris images captured on-the-move and at-a-distance. IEEE Trans. Pattern Anal. Mach. Intell. 2010, 32, 1529–1535. [Google Scholar]
- Geforce GTX 1070. Available online: https://www.nvidia.com/en-us/geforce/products/10series/geforce-gtx-1070/ (accessed on 4 August 2017).
- Caffe. Available online: http://caffe.berkeleyvision.org (accessed on 4 August 2017).
- Stochastic Gradient Descent. Available online: https://en.wikipedia.org/wiki/Stochastic_gradient_descent (accessed on 26 July 2017).
- Caffe Solver Parameters. Available online: https://github.com/BVLC/caffe/wiki/Solver-Prototxt (accessed on 4 August 2017).
- NICE.I. Noisy Iris Challenge Evaluation-Part I. Available online: http://nice1.di.ubi.pt/ (accessed on 26 July 2017).
- Girshick, R. Fast R-CNN. In Proceedings of the International Conference on Computer Vision, Santiago, Chile, 11–18 December 2015; pp. 1440–1448. [Google Scholar]
- Ren, S.; He, K.; Girshick, R.; Sun, J. Faster R-CNN: Towards real-time object detection with region proposal networks. arXiv 2016, arXiv:1506.01497v3, 1–14. [Google Scholar] [CrossRef] [PubMed]
- Semantic Segmentation Using Deep Learning. Available online: https://kr.mathworks.com/help/vision/examples/semantic-segmentation-using-deep-learning.html (accessed on 23 October 2017).
- Badrinarayanan, V.; Kendall, A.; Cipolla, R. SegNet: A deep convolutional encoder-decoder architecture for image segmentation. arXiv 2015, arXiv:1511.00561, 1–14. [Google Scholar] [CrossRef] [PubMed]
- Luengo-Oroz, M.A.; Faure, E.; Angulo, J. Robust iris segmentation on uncalibrated noisy images using mathematical morphology. Image Vis. Comput. 2010, 28, 278–284. [Google Scholar] [CrossRef]
- Labati, R.D.; Scotti, F. Noisy iris segmentation with boundary regularization and reflections removal. Image Vis. Comput. 2010, 28, 270–277. [Google Scholar] [CrossRef]
- Chen, Y.; Adjouadi, M.; Han, C.; Wang, J.; Barreto, A.; Rishe, N.; Andrian, J. A highly accurate and computationally efficient approach for unconstrained iris segmentation. Image Vis. Comput. 2010, 28, 261–269. [Google Scholar] [CrossRef]
- Li, P.; Liu, X.; Xiao, L.; Song, Q. Robust and accurate iris segmentation in very noisy iris images. Image Vis. Comput. 2010, 28, 246–253. [Google Scholar] [CrossRef]
- Tan, C.-W.; Kumar, A. Unified framework for automated iris segmentation using distantly acquired face images. IEEE Trans. Image Process. 2012, 21, 4068–4079. [Google Scholar] [CrossRef] [PubMed]
- Proença, H. Iris recognition: on the segmentation of degraded images acquired in the visible wavelength. IEEE Trans. Pattern Anal. Mach. Intell. 2010, 32, 1502–1516. [Google Scholar] [CrossRef] [PubMed]
- De Almeida, P. A knowledge-based approach to the iris segmentation problem. Image Vis. Comput. 2010, 28, 238–245. [Google Scholar] [CrossRef]
- Tan, C.-W.; Kumar, A. Towards online iris and periocular recognition under relaxed imaging constraints. IEEE Trans. Image Process. 2013, 22, 3751–3765. [Google Scholar] [PubMed]
- Sankowski, W.; Grabowski, K.; Napieralska, M.; Zubert, M.; Napieralski, A. Reliable algorithm for iris segmentation in eye image. Image Vis. Comput. 2010, 28, 231–237. [Google Scholar] [CrossRef]
- Haindl, M.; Krupička, M. Unsupervised detection of non-iris occlusions. Pattern Recognit. Lett. 2015, 57, 60–65. [Google Scholar] [CrossRef]
- MICHE Dataset. Available online: http://biplab.unisa.it/MICHE/index_miche.htm (accessed on 4 August 2017).
- Marsico, M.; Nappi, M.; Ricco, D.; Wechsler, H. Mobile iris challenge evaluation (MICHE)-I, biometric iris dataset and protocols. Pattern Recognit. Lett. 2015, 57, 17–23. [Google Scholar] [CrossRef]
- Hu, Y.; Sirlantzis, K.; Howells, G. Improving colour iris segmentation using a model selection technique. Pattern Recognit. Lett. 2015, 57, 24–32. [Google Scholar] [CrossRef]


| Type | Methods | Strength | Weakness |
|---|---|---|---|
| Boundary-based methods | Integro-differential operator [17] | Fast processing speed using a simple technique. | These methods are less accurate for iris segmentation in non-ideal situations or visible light. |
| Iris localization by circular HT. Upper and lower eyelids detection by parabolic curves [14]. | As the first practical scheme, it can produce a good approximation of the iris region with image smoothness. | ||
| Using two-circular edge detector along with AdaBoost eye detector. In addition, eyelash and eyelid detection is performed [18]. | This method provides satisfactory results in non-ideal situation, and a closed eye can be detected as well. | This method fails in iris segmentation in case the RGB values of the eyelids are similar to the iris or pupil/eyelid detection error. | |
| Pixel-based methods | Drawing 2D profile line on the iris-sclera area and calculating the gradient to find the boundary points [20]. | A new way to estimate iris boundary from both side gradient. | The calculated gradient is affected by the eyelashes, and the true boundary of the iris is not found. |
| Initially approximating iris boundary by color clustering, and then fitting the boundary by two side curves [21]. | To reduce the error of iris segmentation, the upper and lower eyelids and the eyelashes are removed by average intensity analysis. | Some empirical threshold is set for eyelid and eyelash detection, but the limitations in detecting the true boundary of the iris still exist. | |
| Active contour and circle fitting-based methods | Iterative method by starting with mask, checking the gradient, and reaching the boundary [24]. | For non-ideal cases, it can segment the iris true boundary more accurately than those by boundary- and pixel-based methods. | These methods are better for detecting pupil boundary because they can be prevented by the iris texture considering the iris pattern as the boundary. |
| CNN-based methods | Using HCNNs and MFCNs based deep learning method [32]. | This approach has better accuracy relative to existing segmentation methods for non-ideal conditions. | As they use full image into the network, the eyelids, hairs, eyebrows, and glasses frames, which look similar to iris can be considered as iris points by the CNN model. |
| Two-stage iris segmentation method (Proposed method) | This approach simply finds the rough boundary of the iris and applies CNN just within the ROI defined based on the rough boundary. | A large amount of data is needed for CNN training. |
| Type of Layer | No. of Filter | Feature Map Size | Kernel Size | No. of Stride | No. of Padding | |
|---|---|---|---|---|---|---|
| Image input layer | 224 × 224 × 3 (height × width × channel) | |||||
| Group 1 | Conv-1 (1st convolutional layer) | 64 | 224 × 224 × 64 | 3 × 3 | 1 × 1 | 1 × 1 |
| Relu-1 | 224 × 224 × 64 | |||||
| Conv-2 (2nd convolutional layer) | 64 | 224 × 224 × 64 | 3 × 3 | 1 × 1 | 1 × 1 | |
| Relu-2 | 224 × 224 × 64 | |||||
| Pool-1 | 1 | 112 × 112 × 64 | 2 × 2 | 2 × 2 | 0 × 0 | |
| Group 2 | Conv-3 (3rd convolutional layer) | 128 | 112 × 112 × 128 | 3 × 3 | 1 × 1 | 1 × 1 |
| Relu-3 | 112 × 112 × 128 | |||||
| Conv-4 (4th convolutional layer) | 128 | 112 × 112 × 128 | 3 × 3 | 1 × 1 | 1 × 1 | |
| Relu-4 | 112 × 112 × 128 | |||||
| Pool-2 | 1 | 56 × 56 × 128 | 2 × 2 | 2 × 2 | 0 × 0 | |
| Group 3 | Conv-5 (5th convolutional layer) | 256 | 56 × 56 × 256 | 3 × 3 | 1 × 1 | 1 × 1 |
| Relu-5 | 56 × 56 × 256 | |||||
| Conv-6 (6th convolutional layer) | 256 | 56 × 56 × 256 | 3 × 3 | 1 × 1 | 1 × 1 | |
| Relu-6 | 56 × 56 × 256 | |||||
| Conv-7 (7th convolutional layer) | 256 | 56 × 56 × 256 | 3 × 3 | 1 × 1 | 1 × 1 | |
| Relu-7 | 56 × 56 × 256 | |||||
| Pool-3 | 1 | 28 × 28 × 256 | 2 × 2 | 2 × 2 | 0 × 0 | |
| Group 4 | Conv-8 (8th convolutional layer) | 512 | 28 × 28 × 512 | 3 × 3 | 1 × 1 | 1 × 1 |
| Relu-8 | 28 × 28 × 512 | |||||
| Conv-9 (9th convolutional layer) | 512 | 28 × 28 × 512 | 3 × 3 | 1 × 1 | 1 × 1 | |
| Relu-9 | 28 × 28 × 512 | |||||
| Conv-10 (10th convolutional layer) | 512 | 28 × 28 × 512 | 3 × 3 | 1×1 | 1 × 1 | |
| Relu-10 | 28 × 28 × 512 | |||||
| Pool-4 | 1 | 14 × 14 × 512 | 2 × 2 | 2 × 2 | 0 × 0 | |
| Group 5 | Conv-11 (11th convolutional layer) | 512 | 14 × 14 × 512 | 3 × 3 | 1 × 1 | 1 × 1 |
| Relu-11 | 14 × 14 × 512 | |||||
| Conv-12 (12th convolutional layer) | 512 | 14 × 14 × 512 | 3 × 3 | 1 × 1 | 1 × 1 | |
| Relu-12 | 14 × 14 × 512 | |||||
| Conv-13 (13th convolutional layer) | 512 | 14 × 14 × 512 | 3 × 3 | 1 × 1 | 1 × 1 | |
| Relu-13 | 14 × 14 × 512 | |||||
| Pool-5 | 1 | 7 × 7 × 512 | 2 × 2 | 2 × 2 | 0 × 0 | |
| Fully connected layer-6 (1st FCL) | 4096 × 1 | |||||
| Relu-6 | 4096 × 1 | |||||
| Dropout-6 | 4096 × 1 | |||||
| Fully connected layer-7 (2nd FCL) | 4096 × 1 | |||||
| Relu-7 | 4096 × 1 | |||||
| Dropout-7 | 4096 × 1 | |||||
| Fully connected layer-8 (3rd FCL) | 2 × 1 | |||||
| Softmax layer | 2 × 1 | |||||
| Output layer | 2 × 1 | |||||
| Method | E1 |
|---|---|
| Luengo-Oroz et al. [53] (8th rank in NICE-I competition) | 0.0305 |
| Labati et al. [54] (7th rank in NICE-I competition) | 0.0301 |
| Chen et al. [55] (6th rank in NICE-I competition) | 0.029 |
| Jeong et al. [18] (5th rank in NICE-I competition) | 0.028 |
| Peihua et al. [56] (4th rank in NICE-I competition) | 0.022 |
| Tan et al. [57] | 0.019 |
| Proença [58] | 0.0187 |
| de Almeida [59] (3rd rank in NICE-I competition) | 0.0180 |
| Tan et al. [60] | 0.0172 |
| Sankowski et al. [61] (2nd rank in NICE-I competition) | 0.016 |
| Tan et al. [19] (1st rank in NICE-I competition) | 0.0131 |
| Haindl et al [62] | 0.0124 |
| Zhao et al. [16] | 0.0121 |
| SSN-based method [51,52] | 0.02816 |
| Proposed method (Using SVM for the stage 2 of Figure 1) | 0.03852 |
| Proposed method (Using CNN for the stage 2 of Figure 1) | 0.0082 |
| Method | E1 | ||
|---|---|---|---|
| Hu et al. [65] | Sub-dataset by iPhone 5 | 0.0193 | 0.0193 |
| Sub-dataset by Galaxy Samsung IV | 0.0192 | ||
| Proposed method | Sub-dataset by iPhone 5 | 0.00368 | 0.00345 |
| Sub-dataset by Galaxy Samsung IV | 0.00297 | ||
| Sub-dataset by Galaxy Tablet II | 0.00352 | ||
© 2017 by the authors. Licensee MDPI, Basel, Switzerland. This article is an open access article distributed under the terms and conditions of the Creative Commons Attribution (CC BY) license (http://creativecommons.org/licenses/by/4.0/).
Share and Cite
Arsalan, M.; Hong, H.G.; Naqvi, R.A.; Lee, M.B.; Kim, M.C.; Kim, D.S.; Kim, C.S.; Park, K.R. Deep Learning-Based Iris Segmentation for Iris Recognition in Visible Light Environment. Symmetry 2017, 9, 263. https://doi.org/10.3390/sym9110263
Arsalan M, Hong HG, Naqvi RA, Lee MB, Kim MC, Kim DS, Kim CS, Park KR. Deep Learning-Based Iris Segmentation for Iris Recognition in Visible Light Environment. Symmetry. 2017; 9(11):263. https://doi.org/10.3390/sym9110263
Chicago/Turabian StyleArsalan, Muhammad, Hyung Gil Hong, Rizwan Ali Naqvi, Min Beom Lee, Min Cheol Kim, Dong Seop Kim, Chan Sik Kim, and Kang Ryoung Park. 2017. "Deep Learning-Based Iris Segmentation for Iris Recognition in Visible Light Environment" Symmetry 9, no. 11: 263. https://doi.org/10.3390/sym9110263
APA StyleArsalan, M., Hong, H. G., Naqvi, R. A., Lee, M. B., Kim, M. C., Kim, D. S., Kim, C. S., & Park, K. R. (2017). Deep Learning-Based Iris Segmentation for Iris Recognition in Visible Light Environment. Symmetry, 9(11), 263. https://doi.org/10.3390/sym9110263