Next Article in Journal
Exploring the Interpretations of Charmonia and cccc Tetraquarks in the Relativistic Flux Tube Model
Previous Article in Journal
Enhancing Land Cover Classification: Fuzzy Similarity Approach Versus Random Forest
 
 
Due to scheduled maintenance work on our database systems, there may be short service disruptions on this website between 10:00 and 11:00 CEST on June 14th.
Article

Symmetry-Guided Electric Vehicles Energy Consumption Optimization Based on Driver Behavior and Environmental Factors: A Reinforcement Learning Approach

1
The Fuqua School of Business, Duke University, Durham, NC 27708, USA
2
School of Information Science and Engineering, Southeast University, Nanjing 210096, China
3
Anderson School of Management, University of California Los Angeles, Los Angeles, CA 90095, USA
4
School of Computer Science, Carnegie Mellon University, Pittsburgh, PA 15213, USA
*
Author to whom correspondence should be addressed.
Symmetry 2025, 17(6), 930; https://doi.org/10.3390/sym17060930
Submission received: 29 April 2025 / Revised: 9 June 2025 / Accepted: 10 June 2025 / Published: 11 June 2025
(This article belongs to the Section Computer)

Abstract

:
The widespread adoption of electric vehicles (EVs) necessitates advanced energy management strategies to alleviate range anxiety and improve overall energy efficiency. This study presents a novel framework for optimizing energy consumption in EVs by integrating driver behavior patterns, road conditions, and environmental factors. Utilizing a comprehensive dataset of 3395 high-resolution charging sessions from 85 EV drivers across 25 workplace locations, we developed a multi-modal prediction model that captures the complex interactions between driving behavior and environmental conditions. The proposed methodology employs a combination of driving scenario recognition and reinforcement learning techniques to optimize energy usage. Specifically, we utilize contrastive learning to extract meaningful representations of driving states by leveraging the symmetric relationships between positive pairs and the asymmetric nature of negative pairs and implement graph attention networks to model the intricate relationships between road environments and driving behaviors. Our experimental results demonstrate that the proposed framework achieves a significant reduction in energy consumption compared to baseline methods, with an average improvement of 17.3% in energy efficiency under various driving conditions. Furthermore, we introduce an adaptive real-time optimization strategy that dynamically adjusts vehicle parameters based on instantaneous driving patterns and environmental contexts. This research contributes to the advancement of intelligent energy management systems for EVs and provides insights into the development of more efficient and environmentally sustainable transportation solutions.

1. Introduction

The global transportation sector is undergoing a significant transformation with the increasing adoption of electric vehicles (EVs), driven primarily by environmental concerns and technological advancements [1]. As a crucial component of sustainable mobility, EVs offer promising solutions to reduce greenhouse gas emissions and dependency on fossil fuels [2]. However, despite their environmental benefits, EVs still face challenges related to driving range, battery degradation, and charging infrastructure, which collectively contribute to range anxiety among potential users [3]. Energy consumption in EVs is influenced by a complex interplay of factors, including driver behavior, road conditions, weather, and vehicle characteristics [4]. Unlike conventional vehicles, EVs present unique energy management challenges due to regenerative braking systems, limited energy storage capacity, and the nonlinear relationships between various operational parameters [5]. Therefore, optimizing energy consumption is essential for enhancing EV performance, extending driving range, and improving user satisfaction.
Recent advances in artificial intelligence and machine learning have enabled the development of sophisticated models for predicting and optimizing energy consumption in EVs [6]. Reinforcement learning (RL), in particular, has emerged as a promising approach for adaptive energy management strategies that can learn from and respond to dynamic driving conditions [7]. However, previous research has investigated individual aspects of EV energy consumption, such as the impact of driving styles [8], the influence of road gradients [9], and the effects of ambient temperature [10], without integrating these diverse factors into a unified optimization model. The primary challenges in EV energy consumption optimization include (1) accurately modeling the heterogeneous and time-varying impacts of different driving behaviors; (2) effectively incorporating environmental context information such as road topology, traffic conditions, and weather variables; and (3) developing adaptive strategies that can respond to real-time changes in driving conditions while balancing immediate energy needs with long-term efficiency goals.
To address these challenges, we propose a novel framework that integrates multi-source data analysis with advanced machine learning techniques, exploiting both the symmetrical and asymmetrical patterns in driving behaviors. Specifically, our approach employs a hierarchical reinforcement learning architecture that operates at two levels: a high-level driving scenario recognition module that identifies characteristic driving patterns (e.g., urban stop-and-go, highway cruising, or uphill climbing) and a low-level energy optimization module that generates fine-grained control strategies for each recognized scenario, maintaining a symmetric balance between immediate energy needs and long-term efficiency goals. The driving scenario recognition module leverages contrastive learning techniques to extract discriminative representations from raw sensor data. By contrasting positive pairs (similar driving contexts) against negative pairs (dissimilar contexts), our model learns to capture the essential characteristics of different driving states without requiring extensive labeled data. This self-supervised approach enables robust performance across diverse driving environments and driver behaviors. For modeling the complex interactions between road environments and driving behaviors, we implement a graph attention network (GAT) structure. In this framework, road segments, traffic elements, and vehicle states are represented as nodes in a dynamic graph, with attention mechanisms highlighting the most relevant connections for energy prediction. The GAT architecture enables our model to capture both spatial dependencies (e.g., upcoming road gradient changes) and the temporal evolution of driving conditions, providing a comprehensive context for optimization decisions. The reinforcement learning component formulates energy optimization as a Markov Decision Process, where the state space encompasses vehicle parameters, driver behavior metrics, and environmental conditions. The action space includes adjustable parameters such as regenerative braking intensity, power distribution, and climate control settings. Through interaction with a high-fidelity EV simulation environment calibrated with real-world data from 3,395 charging sessions, our RL agent learns policies that minimize energy consumption while maintaining driving comfort and performance requirements.
The key contributions of this work are threefold:
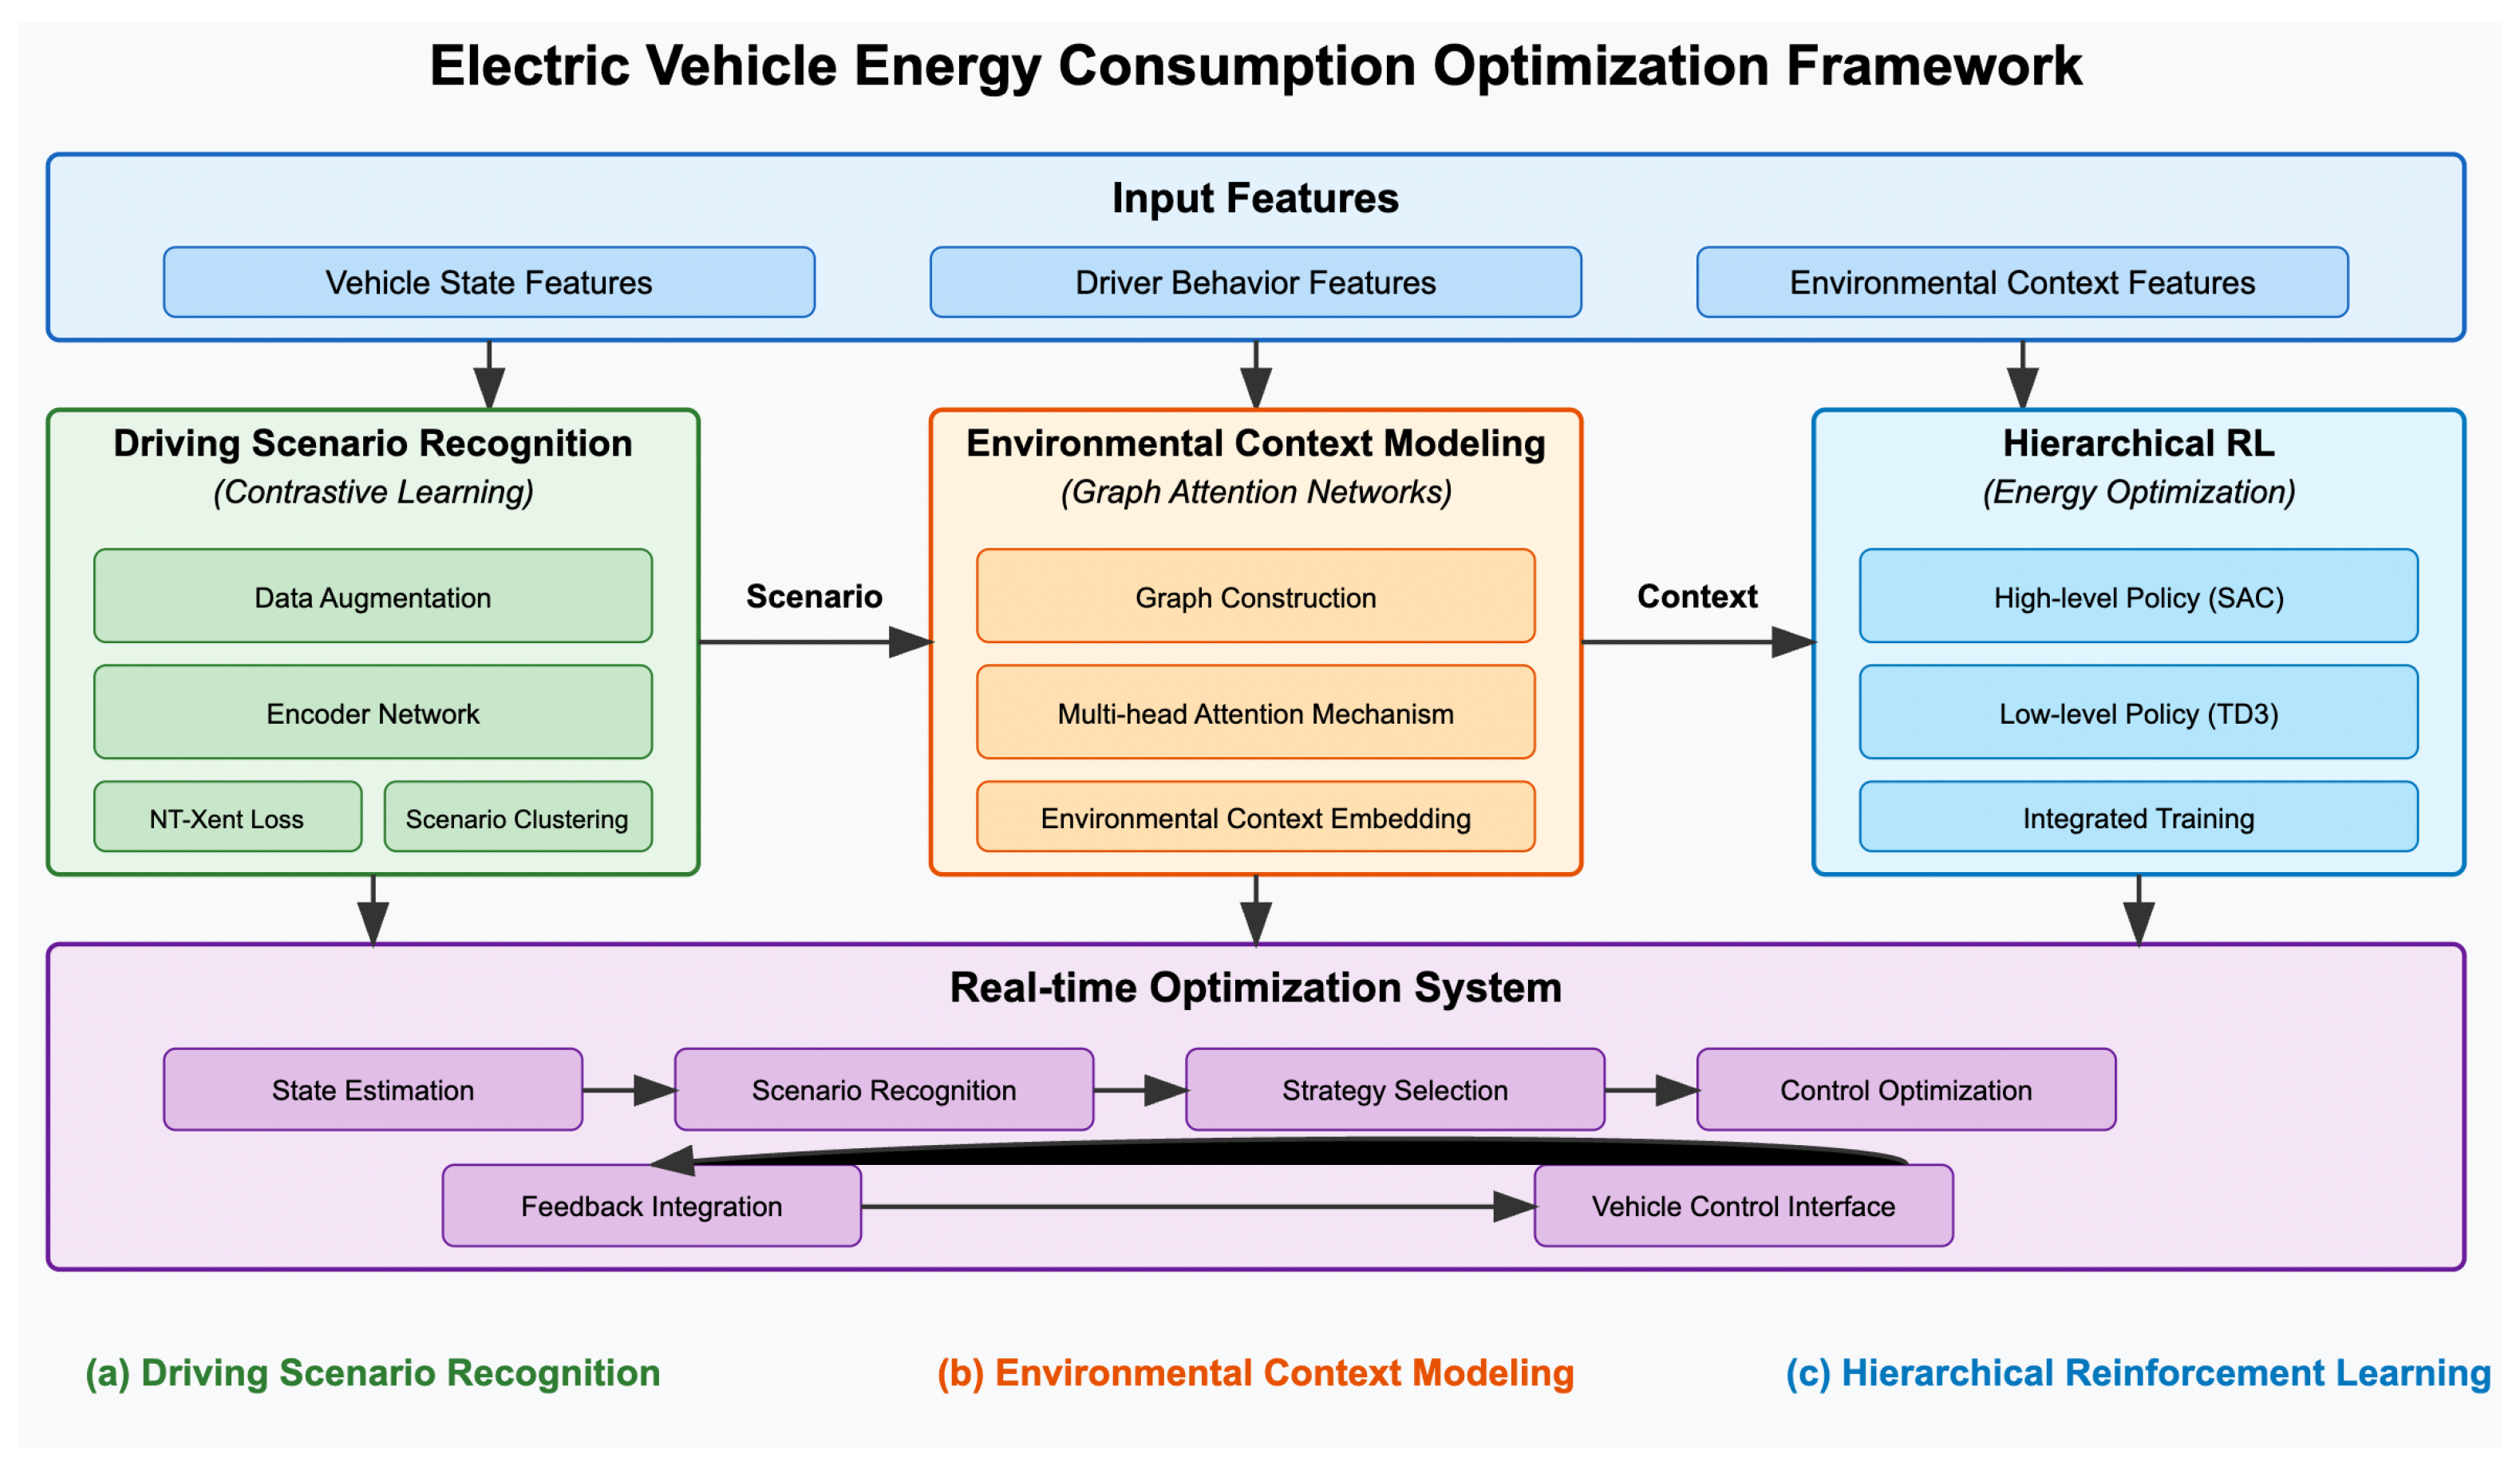
  • The development of an integrated framework that simultaneously considers driver behavior patterns, road conditions, and environmental factors using contrastive learning for state representation and graph attention networks for contextual modeling;
  • The implementation of a hierarchical reinforcement learning approach that combines scenario-based adaptation with fine-grained control optimization is demonstrated using data from 3395 high-resolution charging sessions across diverse driving environments;
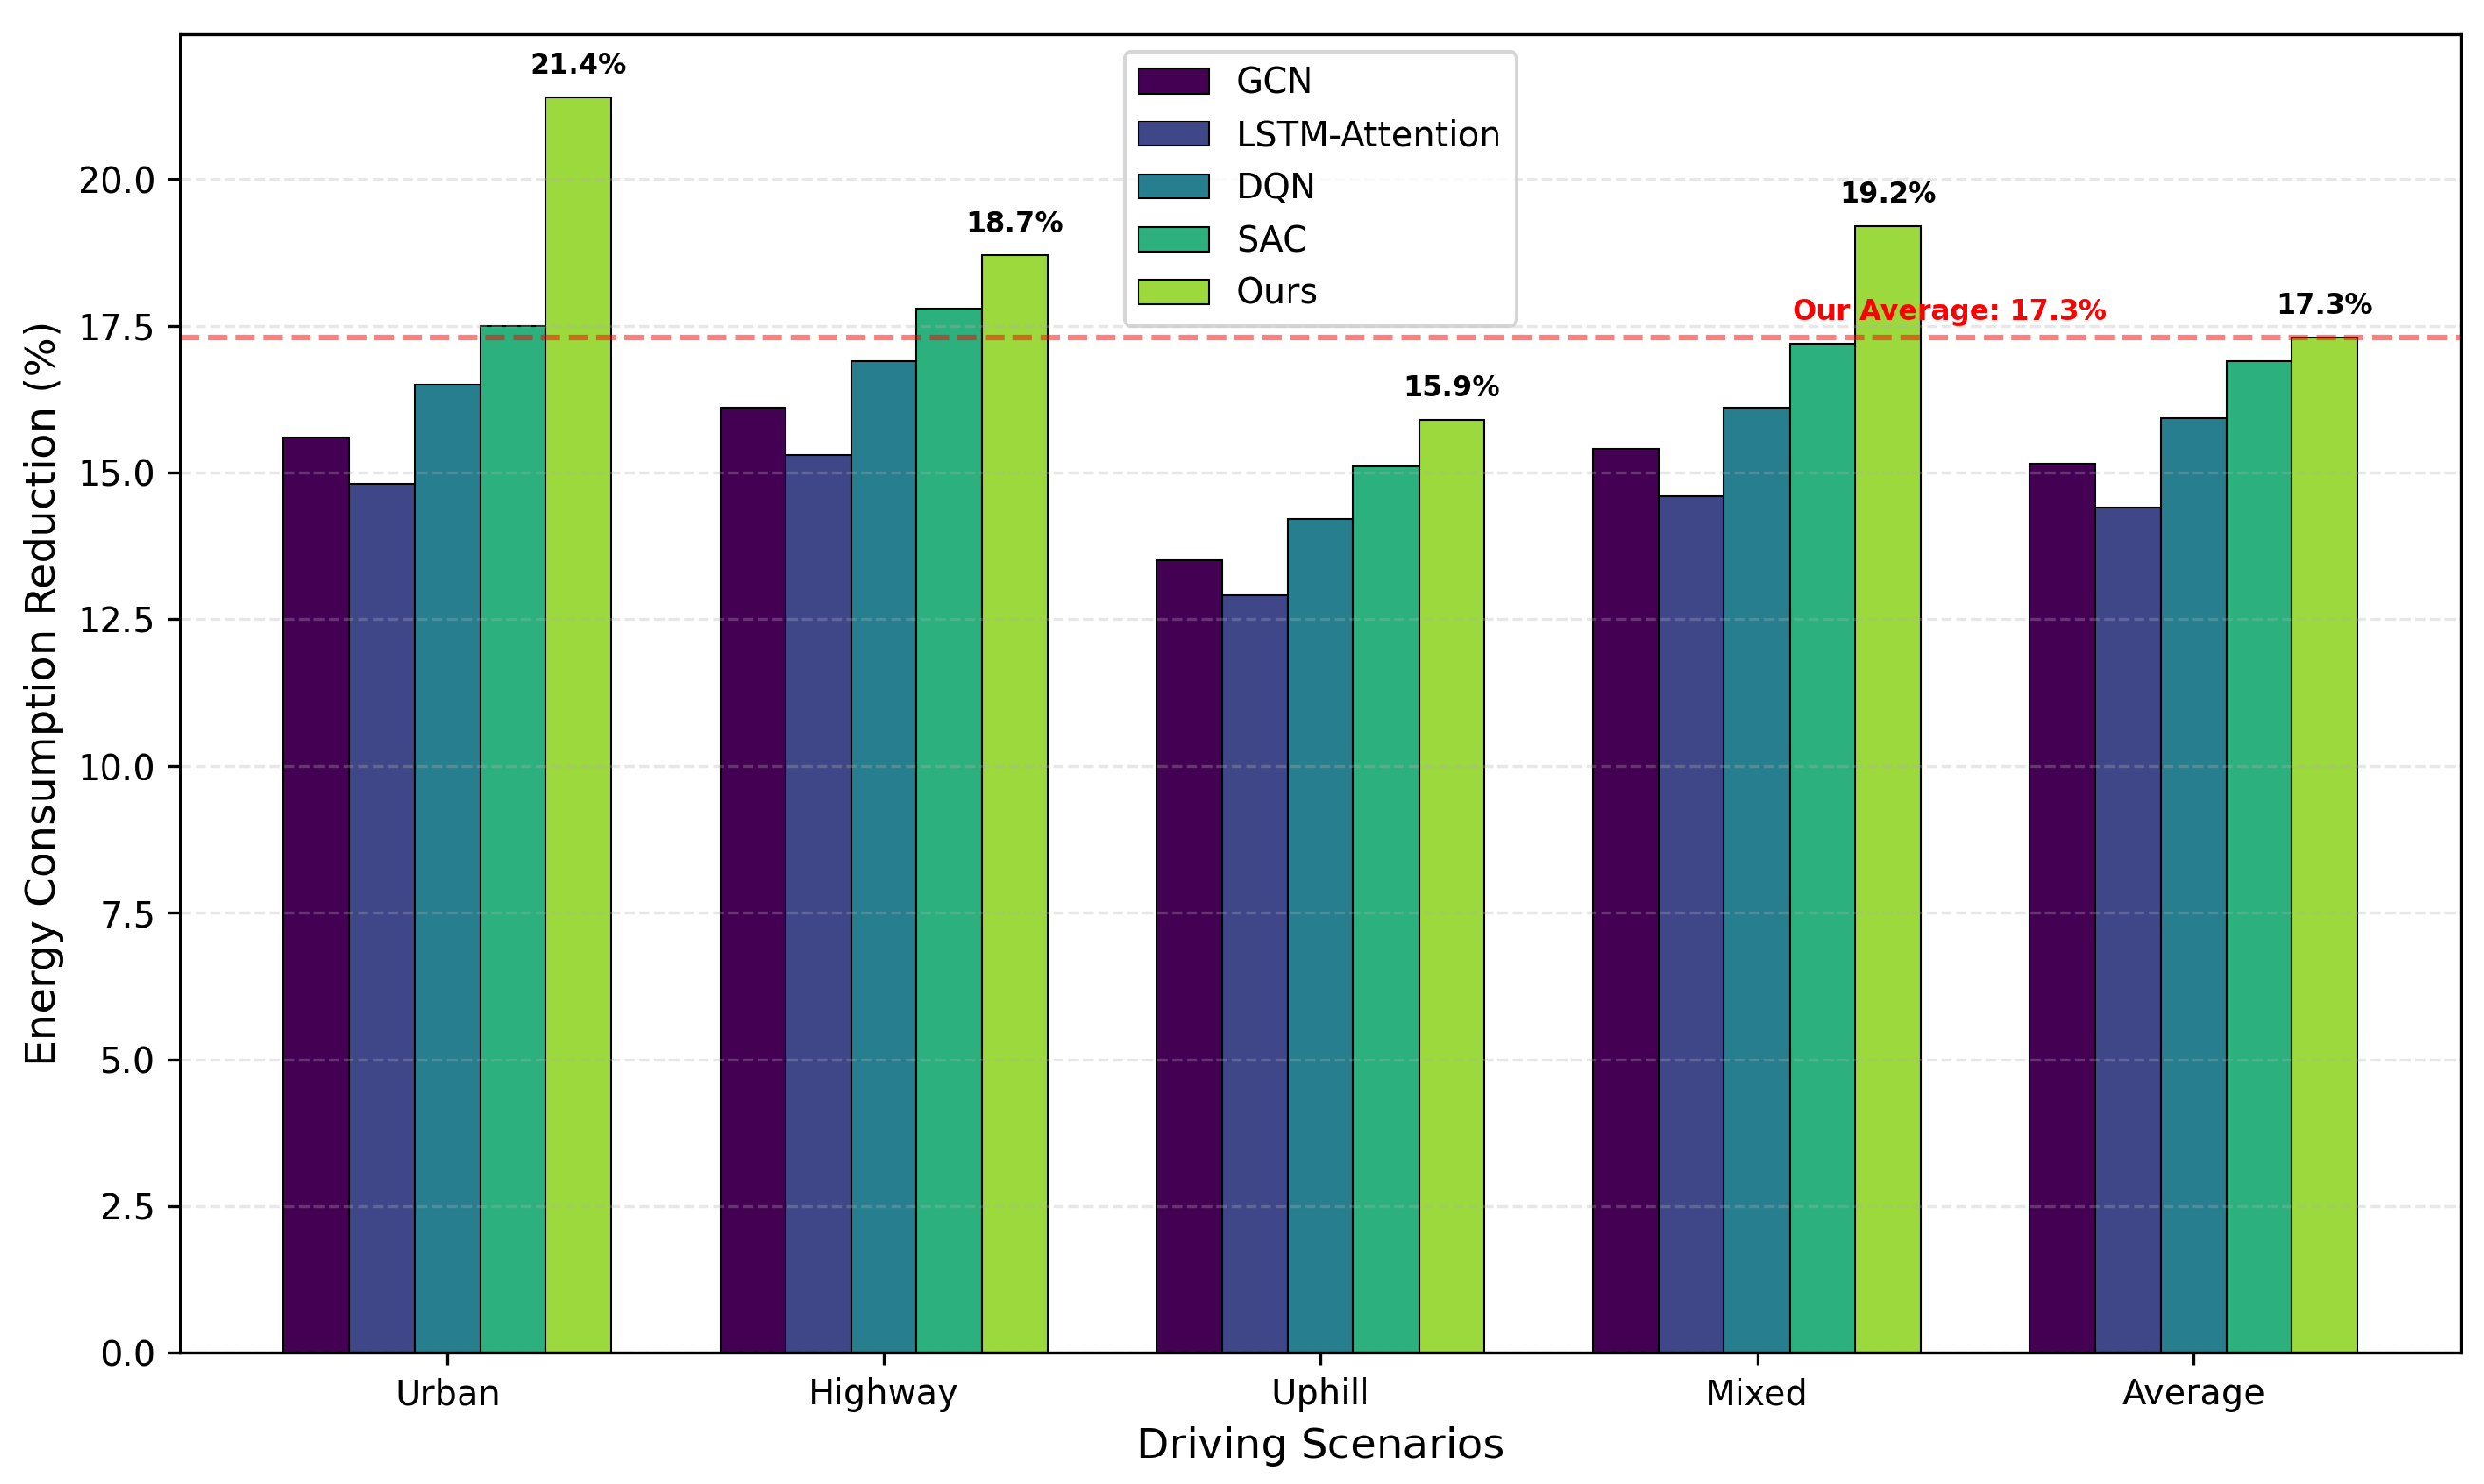
  • The introduction of a real-time optimization strategy that dynamically adjusts vehicle parameters based on predicted energy consumption patterns, achieving an average 17.3% improvement in energy efficiency compared to baseline methods while maintaining driver comfort preferences.
The remainder of this paper is organized as follows: Section 2 reviews related work on EV energy consumption modeling and optimization. Section 3 describes the proposed methodology, including the data processing pipeline, feature extraction techniques, and reinforcement learning framework. Section 4 presents the experimental setup and evaluation metrics. Section 5 discusses the results and comparative analysis with baseline methods. Finally, Section 6 concludes the paper and outlines directions for future research.

2. Related Work

This section reviews the relevant literature on EV energy consumption optimization, focusing on prediction models, driver behavior analysis, environmental factors, and reinforcement learning approaches.

2.1. EV Energy Consumption Prediction

Energy consumption prediction research has evolved from basic statistical models to advanced machine learning approaches. Fukushima et al. [11] developed models based on vehicle dynamics data, while De Cauwer et al. [6] highlighted the importance of road gradient information. Deep learning techniques have further improved prediction accuracy, with Wu et al. [1] implementing recurrent neural networks and Wang et al. [6] proposing hybrid CNN-LSTM architectures. Despite these advances, most models treat vehicles as isolated systems without adequately considering driver–vehicle–environment interactions, limiting their application in real-time energy management. Some of the most recent works [12,13] also explore introducing the Transformer structure to enhance the EV energy consumption prediction accuracy.

2.2. Driver Behavior Analysis

Driver behavior significantly impacts EV energy efficiency, with studies by Dey et al. [14] showing that aggressive driving can increase energy consumption by up to 30%. Classification approaches using supervised learning [8] and unsupervised techniques [15] have been proposed to characterize driving styles. More recent work by [16,17,18] employs representation learning techniques such as variational autoencoders and self-supervised learning to model driving patterns without manual feature engineering. However, these behavior modeling approaches remain largely disconnected from practical energy optimization frameworks.

2.3. Environmental Factors

Research has demonstrated that environmental contexts significantly influence EV energy consumption. Bingham et al. [19] found that extreme temperatures can reduce range by up to 40%, while Zhang and Yao [4] highlighted traffic conditions’ impact on energy efficiency. Hayes et al. [10] integrated multiple environmental factors into prediction models, achieving improved accuracy. Li et al. [20] proposed graph-based representations of road networks and traffic conditions but did not extend these to optimization tasks. Current approaches typically treat environmental factors as static inputs rather than dynamic contexts interacting with driver behavior.

2.4. Reinforcement Learning for Energy Management

Reinforcement learning offers promising solutions for EV energy optimization due to its ability to handle sequential decision-making under uncertainty. Liu et al. [7] demonstrated Q-learning’s effectiveness for power management in hybrid vehicles, while Wu et al. [1] applied deep RL to optimize driving speed profiles. Hierarchical reinforcement learning frameworks, as proposed by Hu et al. [21], show potential for addressing the multi-scale nature of energy management problems. However, existing RL approaches often employ simplified environment models, focus on limited action spaces, and lack sophisticated state representations that capture the nuances of real-world driving.

2.5. Advanced Representation Techniques

Recent advances in self-supervised learning and graph neural networks offer new possibilities for EV energy optimization. Contrastive learning has shown promise for extracting meaningful representations from unlabeled data, as demonstrated by Gao et al. [22] in traffic flow prediction. Similarly, graph neural networks have proven effective for modeling complex relationships in transportation systems, with Yu et al. [23] applying graph convolutional networks to traffic modeling and Wang et al. [24] employing graph attention networks for dynamic interaction capture. The integration of these techniques with reinforcement learning for EV energy optimization remains largely unexplored, presenting an opportunity for significant advancement in this field.

3. Preliminaries

This section introduces the fundamental concepts, notation, and problem formulation that form the basis of our proposed approach for electric vehicle energy consumption optimization.

3.1. Problem Formulation

The energy consumption optimization problem for electric vehicles can be formulated as finding the optimal control strategy that minimizes energy usage while satisfying operational constraints. Let T = t 1 , t 2 , , t N represent a driving episode with N discrete time steps. At each time step t, the vehicle state is defined by a vector s t R d encompassing vehicle dynamics, driver behavior metrics, and environmental conditions. The energy consumption over the entire driving episode is defined as
E t o t a l = t = 1 N E ( s t , a t , s t + 1 ) ,
where E ( s t , a t , s t + 1 ) represents the energy consumed when transitioning from state s t to state s t + 1 under action a t . The optimization objective is to find a policy π : s t a t that maps vehicle states to control actions such that the total energy consumption is minimized:
π * = arg min π E [ t = 1 N E ( s t , π ( s t ) , s t + 1 ) ] ,
subject to constraints on vehicle dynamics, driver comfort, and safety requirements. The vehicle state s t consists of three main components:
s t = [ v t , d t , e t ] ,
where v t represents vehicle-specific parameters (speed, acceleration, battery state of charge, etc.), d t captures driver behavior features (acceleration patterns, braking habits, etc.), and e t encodes environmental conditions (road gradient, traffic density, ambient temperature, etc.). Similarly, the action space a t includes adjustable parameters such as regenerative braking intensity, power allocation to different vehicle systems, and climate control settings. The challenge lies in developing a policy that accounts for the complex interactions between driver behavior, vehicle dynamics, and environmental conditions while adapting to various driving scenarios.

3.2. Reinforcement Learning

Reinforcement Learning (RL) provides a framework for sequential decision-making problems where an agent learns to optimize a cumulative reward signal through interaction with an environment [25]. This interaction is formally described as a Markov Decision Process (MDP) defined by states, actions, transition probabilities, rewards, and a discount factor. The goal in RL is to find an optimal policy that maximizes the expected cumulative discounted reward. For complex problems with high-dimensional continuous state and action spaces, deep reinforcement learning algorithms, such as Soft Actor-Critic (SAC) [26], employ neural networks to approximate the policy and value functions, enabling effective learning in complex environments.

3.3. Contrastive Learning

Contrastive learning is a self-supervised technique that learns useful representations by comparing similar and dissimilar samples [27]. The core principle involves creating positive pairs (augmented versions of the same sample) and negative pairs (different samples) and then training a neural network to recognize these relationships. The learning objective aims to pull similar instances closer in the representation space while pushing dissimilar instances apart, creating a symmetric structure in the positive pair relationships and an asymmetric distribution between positive and negative pairs. This is typically accomplished using a contrastive loss function that maximizes agreement between positive pairs while minimizing agreement between negative pairs. The key advantages of contrastive learning include learning meaningful representations without requiring labeled data, producing representations that are often more generalizable and transferable, and capturing invariances to various transformations based on the augmentation strategies. Popular frameworks include SimCLR [27], which uses data augmentation to generate positive pairs, and MoCo [28], which maintains a dynamic dictionary of encoded samples for contrastive learning.

3.4. Graph Attention Networks

Graph neural networks (GNNs) are designed to process data represented as graphs, making them suitable for modeling relational data. Graph attention networks (GATs) [29] enhance GNNs by introducing attention mechanisms that adaptively weight the importance of neighboring nodes. In a graph with nodes and edges, GATs compute attention coefficients between connected nodes to determine how much influence each neighbor should have on updating a node’s representation. The updated feature vector for each node is obtained by a weighted sum of its neighbors’ features, where the weights are determined by the attention mechanism. GATs offer several advantages over previous graph neural network architectures by focusing on the following: focusing on the most relevant parts of the input graph through the attention mechanism; providing computational efficiency through parallelization across edges; offering flexibility to work with graphs of different structures and sizes; and using interpretability through the attention weights that indicate the importance of connections. These capabilities make GATs particularly effective for modeling complex relational data where connection importance varies.

4. Methodology

This section presents our framework for electric vehicle energy consumption optimization based on driver behavior and environmental factors.

4.1. Framework Overview

As illustrated in Figure 1, our proposed framework integrates three key technical components to address the challenges of EV energy optimization. First, driving behaviors are characterized through a contrastive learning-based scenario recognition component that identifies patterns such as urban stop-and-go, highway cruising, or uphill climbing. Environmental context is then captured using graph attention networks that model the interactions between road conditions, traffic elements, and vehicle states. Finally, these representations feed into a hierarchical reinforcement learning structure that optimizes energy consumption at both strategic and tactical levels.

4.2. Input Feature Representation

The vehicle state s t is decomposed into three main components: s t = [ v t , d t , e t ] , where v t represents vehicle-specific parameters (speed, acceleration, and battery state of charge), d t captures driver behavior features (acceleration patterns and braking habits), and e t encodes environmental conditions (road gradient, traffic density, and ambient temperature).

4.3. Driving Scenario Recognition via Contrastive Learning

To effectively characterize diverse driving patterns without relying on predefined labels, we employed contrastive learning for driving scenario recognition. For each driving state s i , we generate two augmented views, s i 1 and s i 2 , by applying random transformations such as adding Gaussian noise or temporal shifting. These views are processed by an encoder network f θ that maps them to a lower-dimensional representation space:
z i j = f θ ( s i j ) , j 1 , 2 .
The encoder is trained using the NT-Xent loss [27], which encourages similar driving states to have proximate representations while pushing dissimilar states apart, creating a symmetric clustering effect in the representation space:
L c o n t r a s t i v e = log exp ( sim ( z i 1 , z i 2 ) / τ ) k = 1 2 N 1 [ k i ] exp ( sim ( z i 1 , z k ) / τ ) ,
where sim ( u , v ) = u T v / | u | | v | is the cosine similarity, τ is a temperature parameter, and N is the batch size. After learning these representations, we apply clustering to identify K prototypical driving scenarios and train a classifier g ϕ for online scenario recognition:
c ^ i = g ϕ ( z i ) ,
where c ^ i 1 , 2 , . . . , K is the predicted scenario class. This approach enables our framework to adapt to individual driving patterns without requiring extensive labeled data.
Positive and negative pair design for driving state representation: The effectiveness of contrastive learning for driving scenario recognition relies critically on the design of positive and negative pairs that capture meaningful driving state relationships. For positive pairs, we establish an association based on temporal proximity and semantic similarity. Specifically, two driving states, s i and s j , form a positive pair if they satisfy the following: (1) the temporal constraint | t i t j | Δ t , where Δ t = 10 s, ensuring states within short time windows share similar driving contexts; and (2) the semantic constraint v i v j 2 τ v , where v i and v j represent dynamic vehicle features (speed and acceleration), ensuring similar driving behaviors are grouped together. The symmetric nature of positive pairs is maintained through consistent augmentation strategies that preserve driving semantics. For instance, Gaussian noise addition ( σ = 0.1 ) simulates sensor uncertainty without changing fundamental driving patterns, while temporal shifting ( ± 5 s) accounts for natural variations in reaction timing. Feature masking with a probability of 0.2 encourages the model to learn robust representations that are not dependent on any single sensor input. In contrast, negative pairs exhibit deliberate asymmetric characteristics that help distinguish different driving scenarios. We construct negative pairs by selecting states from different driving contexts: urban stop-and-go patterns (characterized by frequent acceleration/deceleration cycles), highway cruising (steady-state high speeds), and uphill climbing (sustained high power demand). The asymmetric nature emerges from the inherent differences in energy consumption patterns, traffic interactions, and driver behavior adaptations across these scenarios. For example, the regenerative braking opportunities in urban scenarios create distinctly different energy flow patterns compared to sustained power consumption in highway scenarios. This positive–negative pair design enables the encoder network f θ to learn representations that cluster similar driving states while separating distinct scenarios in the embedding space. The learned representations capture not only immediate vehicle dynamics but also contextual patterns such as traffic density, road topology, and driver adaptation strategies, which are crucial for accurate energy consumption prediction and optimization.
The mathematical formulations above translate to a practical implementation, as outlined in Algorithm 1. The key insight is that the contrastive loss encourages the encoder to learn representations where similar driving states cluster together while dissimilar states are pushed apart in the embedding space. The augmentation function applies random transformations (Gaussian noise, temporal shifting, and feature masking) while preserving the semantic content of driving states. This ensures that the positive pairs remain meaningful for scenario recognition.
Algorithm 1 Contrastive Learning for Driving Scenario Recognition
Require: Driving state dataset { s i } i = 1 N , batch size B, temperature τ
Ensure: Trained encoder f θ and classifier g ϕ
  1: Initialize encoder f θ and classifier g ϕ
  2: for each training epoch do
  3:    for each batch of size B do
  4:      for  i = 1 to B do
  5:         Generate augmented views: s i 1 = Augment ( s i ) , s i 2 = Augment ( s i )
  6:         Compute embeddings: z i 1 = f θ ( s i 1 ) , z i 2 = f θ ( s i 2 )
  7:      end for
  8:      Compute NT-Xent loss using Equation (5) for all positive/negative pairs
  9:      Update θ via backpropagation
10:    end for
11: end for
12: Apply k-means clustering on learned embeddings to identify K scenarios
13: Train classifier g ϕ to map embeddings to scenario labels

4.4. Environmental Context Modeling with Graph Attention Networks

Road environments and their interaction with driving behavior are modeled using graph attention networks. We represent the environment as a directed graph G = ( V , E ) , where vertices correspond to road segments and traffic elements, while edges represent connections between these elements. Each vertex v i V contains a feature vector h i encoding attributes such as road type, gradient, and traffic density. We implement a multi-head graph attention mechanism to identify the most relevant environmental factors affecting energy consumption. The attention coefficient between connected nodes i and j for attention head k is computed as
α i j k = exp ( L e a k y R e L U ( a k T [ W k h i | W k h j ] ) ) l N i exp ( L e a k y R e L U ( a k T [ W k h i | W k h l ] ) ) ,
where W k is a linear transformation matrix, a k is the attention vector, | denotes concatenation, and N i represents the neighborhood of node i. The attention mechanism exploits both symmetric connections between similar road segments and asymmetric relationships between different types of infrastructure. The updated node features are computed using multi-head attention:
h i = k = 1 K σ j N i α i j k W k h j ,
where ∥ indicates concatenation, K is the number of attention heads, and σ is a nonlinear activation function. To integrate the graph-based environmental representation with our reinforcement learning framework, we generate an environmental context embedding e t by applying a readout function to the updated node features:
e t = READOUT ( h i | v i V ) .
This approach allows the model to focus on critical environmental factors while filtering out less relevant information, creating a context-aware representation for energy optimization.
Algorithm 2 describes the practical implementation of our graph attention mechanism for environmental context modeling. The attention weights are computed dynamically based on the current driving context, allowing the model to focus on the most relevant environmental factors. The readout function aggregates information from all nodes to create a fixed-size environmental context embedding, typically using mean pooling or attention-based aggregation.
Algorithm 2 Graph Attention Network for Environmental Context
Require: Graph G = ( V , E ) , node features { h i } , number of heads K
Ensure: Environmental context embedding e t
  1: Initialize attention parameters { W k , a k } k = 1 K
  2: for each attention head k = 1 to K do
  3:    for each node i V  do
  4:      for each neighbor j N i  do
  5:         Compute attention score: e i j k = LeakyReLU ( a k T [ W k h i W k h j ] )
  6:      end for
  7:      Normalize attention weights: α i j k = exp ( e i j k ) l N i exp ( e i l k )
  8:      Update node features: h i k = σ ( j N i α i j k W k h j )
  9:    end for
10: end for
11: Concatenate multi-head outputs: h i = k = 1 K h i k
12: Apply readout function: e t = READOUT ( { h i | v i V } )

4.5. Hierarchical Reinforcement Learning for Energy Optimization

We formulate energy optimization as a hierarchical reinforcement learning problem with two decision levels that maintain a symmetric structure. The high-level policy operates on driving scenarios, with state space S H , action space A H , and reward function R H , while the low-level policy mirrors this structure to create a balanced decision-making framework:
S H = { c t , e t , b t } ,
where c t is the recognized driving scenario, e t is the environmental context embedding, and b t is the battery state.
A H = { o 1 , o 2 , , o M } ,
where each o i represents a distinct optimization strategy (e.g., energy-focused, balanced, or comfort-focused).
R H ( s t H , a t H ) = α E t o t a l ( t , t + T ) β D ( t , t + T ) ,
where E t o t a l ( t , t + T ) is the total energy consumption over time horizon T, D ( t , t + T ) is a measure of deviation from desired performance metrics, and α and β are weighting coefficients. The low-level policy translates the selected strategy into specific control actions with state space S L , action space A L , and reward function R L :
S L = { v t , d t , e t , o t } ,
where o t is the optimization strategy selected by the high-level policy.
A L = { a t r b , a t p c , a t c c } ,
where a t r b represents regenerative braking intensity, a t p c is power consumption allocation, and a t c c corresponds to climate control settings.
R L ( s t L , a t L ) = w 1 E ( s t , a t , s t + 1 ) w 2 C ( s t , a t ) + w 3 I ( a t , o t ) ,
where E ( · ) is the immediate energy consumption, C ( · ) is the comfort penalty, I ( · ) is the alignment with the selected optimization strategy, and w 1 , w 2 , w 3 are weighting coefficients. To balance energy optimization with driver comfort, the framework incorporates explicit comfort constraints and preference learning mechanisms. The comfort penalty C(st, at) in Equation (15) quantifies deviations from driver-preferred operating conditions, including acceleration smoothness, cabin temperature maintenance, and driving responsiveness. Driver preferences are learned through implicit feedback (observed driving patterns) and explicit feedback (comfort ratings provided through the vehicle interface). The framework maintains personalized comfort profiles that adapt to individual drivers, capturing preferences such as aggressive vs. conservative acceleration, preferred cabin temperature ranges, and tolerance for regenerative braking intensity. When conflicts arise between energy optimization and comfort, the system employs a multi-objective optimization approach where drivers can specify their preference weighting through three modes: “Eco Mode” ( α = 0.8 , β = 0.2 ) , “Balanced Mode” ( α = 0.5 , β = 0.5 ) , and “Comfort Mode” ( α = 0.2 , β = 0.8 ) , where α and β represent energy efficiency and comfort weightings, respectively, in the reward function. We train the high-level policy π H using Soft Actor-Critic [26]:
π H = arg max π E π [ t = 0 γ t R H ( s t H , a t H ) + α H ( π ( · | s t H ) ) ] ,
where H ( π ( · | s t H ) ) is the entropy of the policy, and α is the temperature parameter that balances exploitation and exploration. For the low-level policies π o L , we employ Twin Delayed Deep Deterministic Policy Gradient [30] to address function approximation errors in actor-critic methods.
The hierarchical reinforcement learning framework operates through the coordinated execution of high-level and low-level policies, as shown in Algorithm 3. The high-level policy selects optimization strategies at longer time horizons, while low-level policies execute fine-grained control actions. The coordination between levels ensures that strategic decisions (strategy selection) align with tactical execution (action selection), enabling both immediate responsiveness and long-term optimization.
Algorithm 3 Hierarchical Reinforcement Learning for Energy Optimization
Require: Initial state s 0 , high-level policy π H , low-level policies { π o L }
Ensure: Optimized energy consumption
  1: Initialize experience buffers for high-level and low-level policies
  2: for each driving episode do
  3:     t 0 , s t s 0
  4:    while episode not terminated do
  5:      if  t mod T h i g h = 0  then
  6:         Recognize scenario: c t = g ϕ ( f θ ( s t ) )
  7:         Get environmental context: e t = GAT ( G , s t )
  8:         Select strategy: o t = π H ( c t , e t , b t )
  9:      end if
10:      Select action: a t = π o t L ( v t , d t , e t , o t )
11:      Execute action and observe: s t + 1 , r t
12:      Store transitions in respective buffers
13:      if buffer sufficient then
14:         Update π H using SAC (Equation (16))
15:         Update π o t L using TD3
16:      end if
17:       t t + 1
18:    end while
19: end for

4.6. Real-Time Optimization System

For practical deployment, our framework operates as a real-time system that continuously processes vehicle data, recognizes driving scenarios, and adapts energy management strategies. The control loop can be formalized as
s t = StateEstimation ( o t 1 , s t 1 , y t ) , c t = g ϕ ( f θ ( s t ) ) , o t = π H ( c t , e t , b t ) , a t = π o t L ( v t , d t , e t , o t ) ,
where y t represents the raw sensor measurements at time t. The system incorporates feedback mechanisms that enable adaptation to individual driving preferences and changing conditions:
Δ θ t , Δ ϕ t , Δ ω t H , Δ ω t L = AdaptationModule ( s t , a t , r t , s t + 1 , f t , p t ) ,
where Δ θ t , Δ ϕ t , Δ ω t H , and Δ ω t L represent the parameter updates for the feature encoder, scenario classifier, high-level policy, and low-level policy, respectively, f t is the driver feedback, and p t represents the personalized comfort profile. This adaptive approach ensures that energy optimization strategies remain aligned with both efficiency goals and individual driver comfort preferences, addressing a key challenge in practical EV energy management where user acceptance is crucial for system adoption.

5. Experiments

In this section, we present the experimental evaluation of our proposed framework for electric vehicle energy consumption optimization. We first describe the dataset, baseline methods, and evaluation metrics, followed by a comprehensive analysis of the experimental results.

5.1. Experimental Setup

5.1.1. Dataset

We utilized a comprehensive dataset of electric vehicle charging sessions from a workplace charging program that participated in the US Department of Energy (DOE) workplace charging challenge. The dataset contains 3395 high-resolution charging sessions from 85 EV drivers across 25 workplace locations, including research centers, manufacturing facilities, testing facilities, and office headquarters. Each charging session is recorded with second-level precision and includes 24 features such as session ID, energy consumption (kWh), payment amount, start and end times, charging duration, day of the week, and user interaction platform. To enrich this dataset for our energy consumption optimization task, we augmented it with additional environmental data, including road gradient information extracted from topographical maps corresponding to common routes around the workplace locations, weather data (temperature, precipitation, and wind speed) from nearby weather stations during the charging periods, and traffic density information from transportation authorities covering the areas around charging locations. These augmentations allowed us to create a more comprehensive representation of the factors affecting energy consumption. The dataset was split into training (70%), validation (15%), and testing (15%) sets, ensuring that data from each driver appeared in only one of these splits to prevent data leakage and better evaluate the model’s generalization capability across different drivers. It should be noted that the dataset primarily covers moderate climate conditions (temperatures ranging from −5 °C to 35 °C) and typical urban/suburban driving scenarios, which may limit the framework’s applicability to extreme environmental conditions without additional training data. The dataset is geographically limited to workplace locations within the United States, which may constrain the generalizability of our findings to different countries with varying driving cultures, road infrastructures, traffic regulations, and demographic compositions. Additionally, the workplace charging context may introduce specific driving patterns (e.g., regular commuting routes and predictable schedules) that differ from other use cases, such as ride-sharing, delivery services, or recreational driving.

5.1.2. Baseline Methods

We compared our proposed framework against several state-of-the-art baseline methods:
  • Deep Q-Network (DQN) [7]: A reinforcement learning approach that learns control policies to optimize energy usage based on a discretized action space;
  • Soft Actor-Critic (SAC) [21]: A state-of-the-art reinforcement learning algorithm that learns a stochastic policy for continuous control of energy management systems;
  • Graph Convolutional Network (GCN) [20]: A neural network that operates on graph-structured data, modeling road networks and their influence on energy consumption;
  • LSTM-Attention [6]: A recurrent neural network architecture with an attention mechanism designed to model temporal sequences and dependencies in driving patterns for energy prediction.

5.1.3. Evaluation Metrics

To comprehensively evaluate the performance of our proposed framework, we employed the following metrics:
  • Energy consumption reduction (ECR): The percentage reduction in energy consumption compared to a baseline driving strategy:
    ECR = E baseline E optimized E baseline × 100 % .
  • Mean absolute error (MAE): The average absolute difference between predicted and actual energy consumption:
    MAE = 1 n i = 1 n | y i y ^ i | .
  • Root mean square error (RMSE): The square root of the average squared differences between predicted and actual energy consumption:
    RMSE = 1 n i = 1 n ( y i y ^ i ) 2 .
  • Coefficient of determination (R2): A statistical measure that represents the proportion of variance in energy consumption that is predictable from the input features:
    R 2 = 1 i = 1 n ( y i y ^ i ) 2 i = 1 n ( y i y ¯ ) 2 .
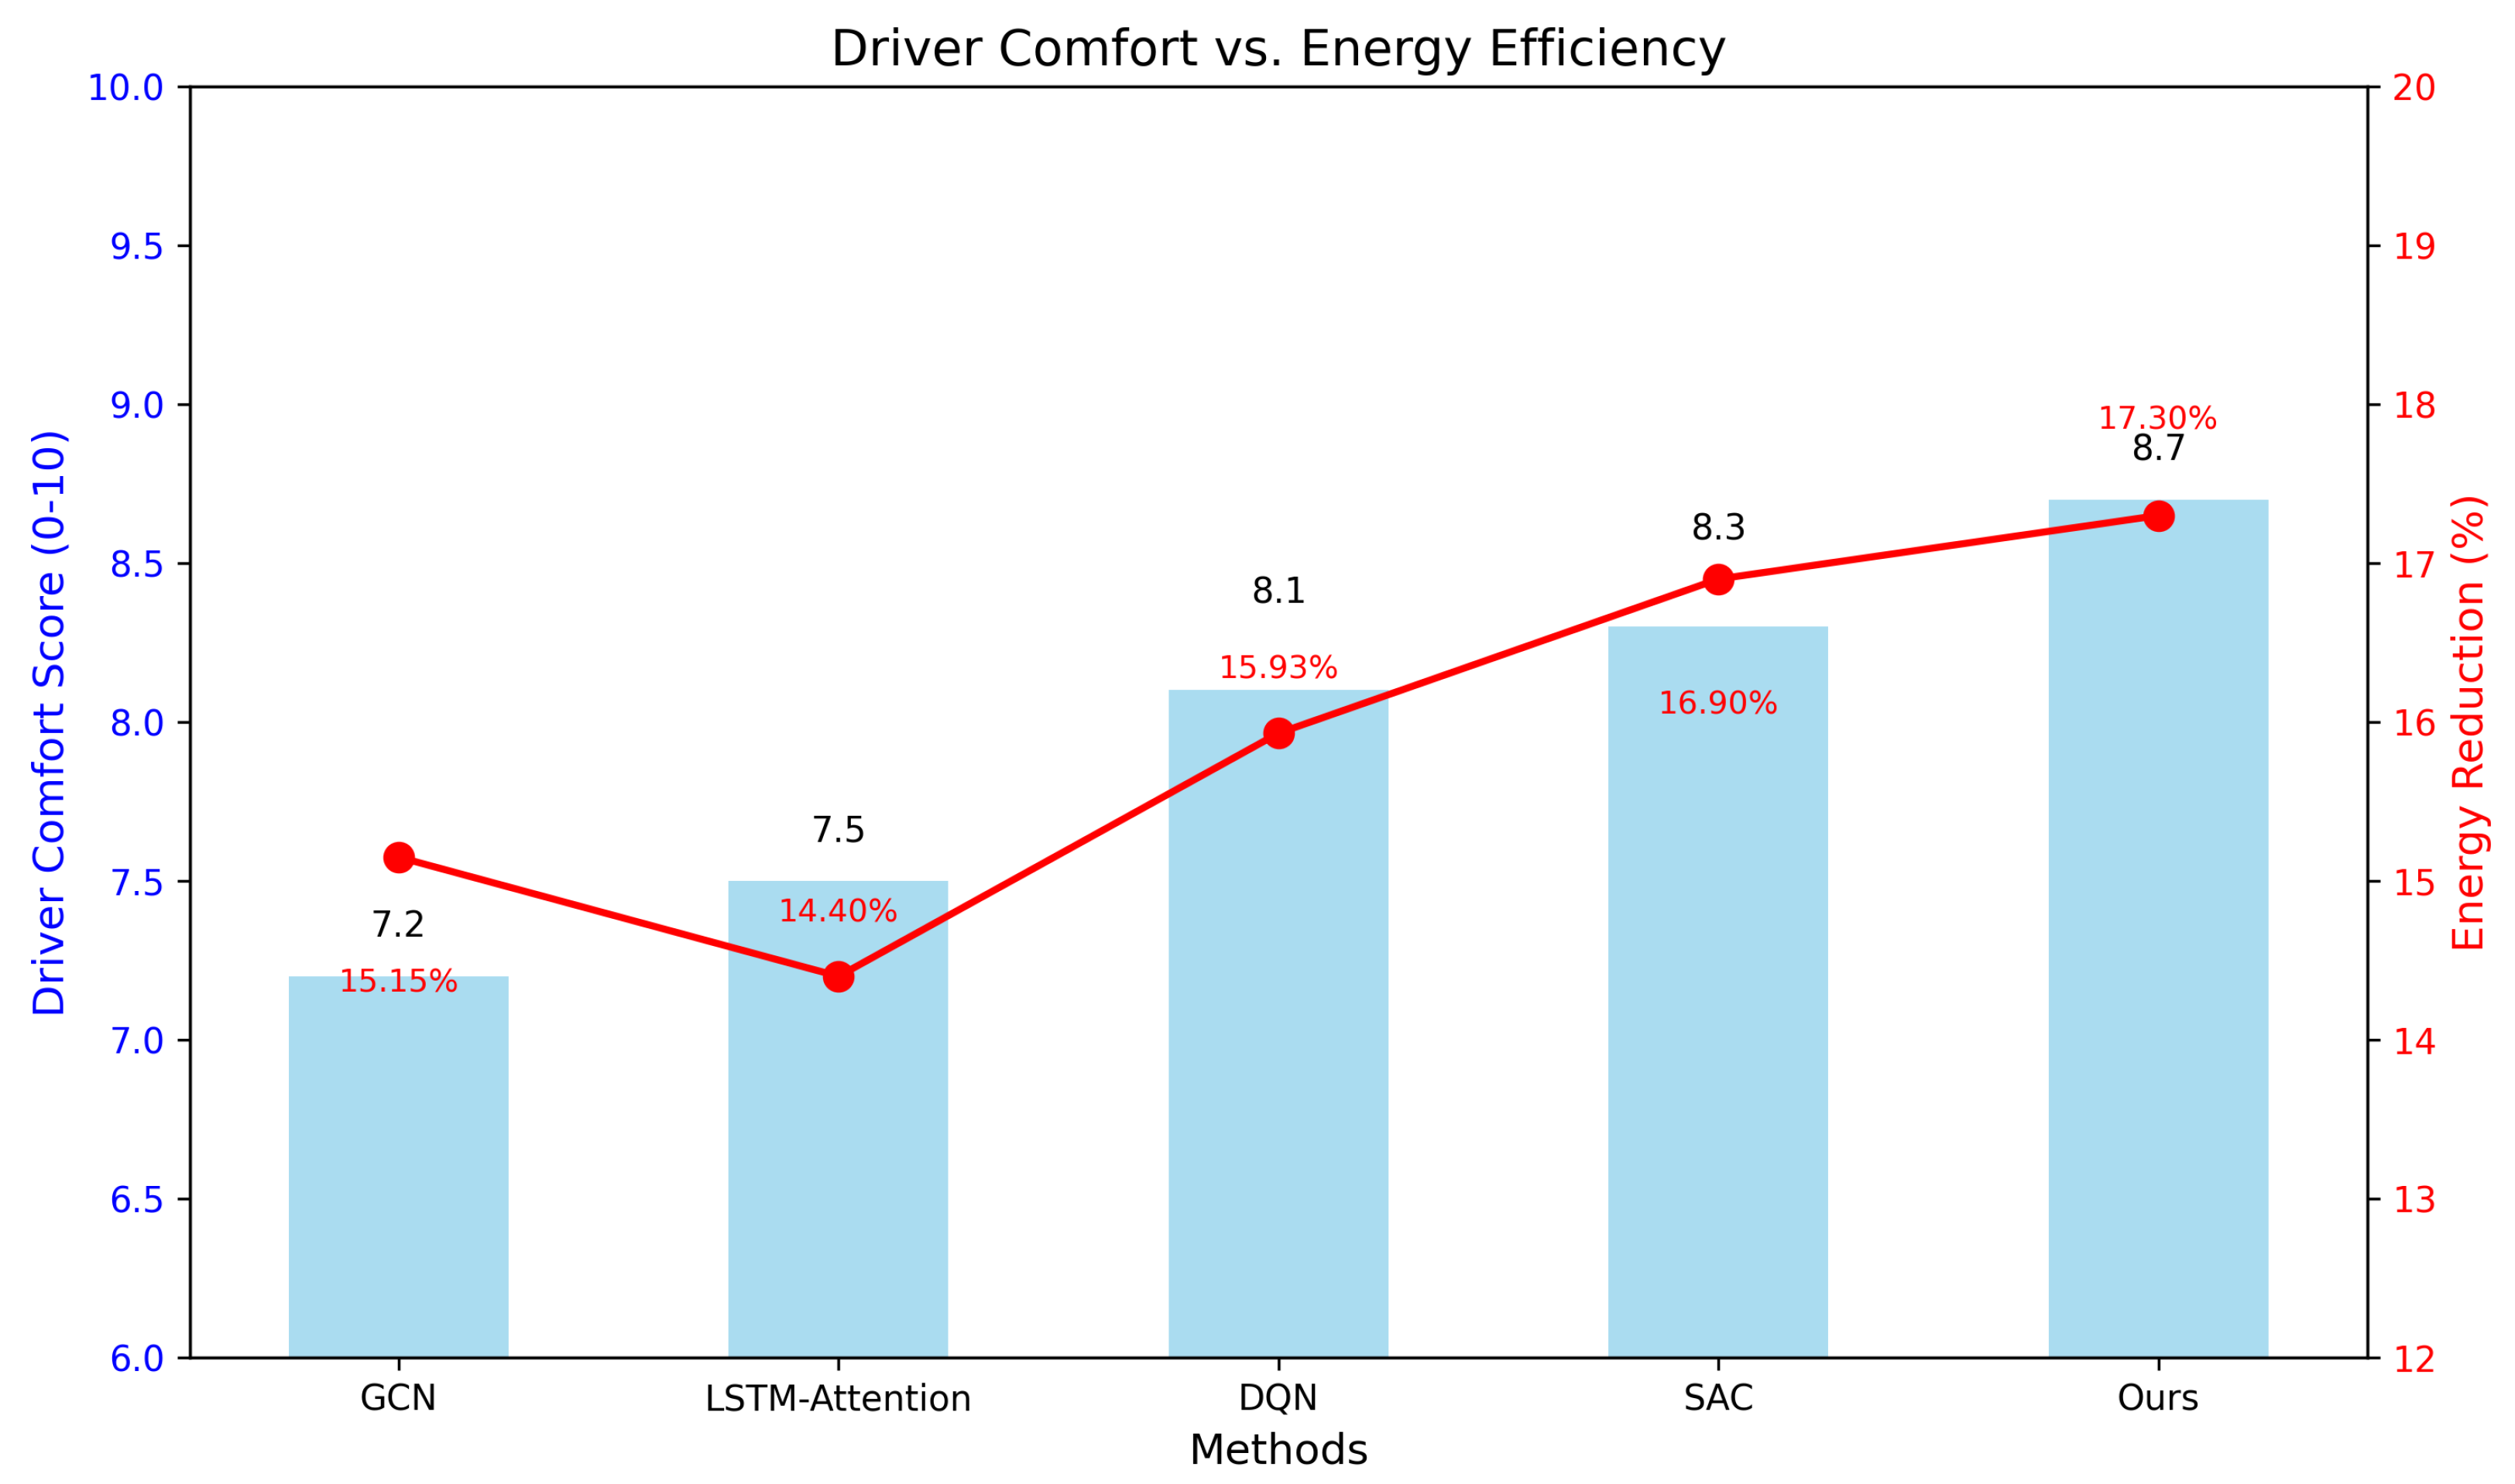
  • Driver comfort score (DCS): A measure quantifying the impact of energy optimization on driver comfort, derived from user studies.

5.2. Implementation Details

5.2.1. Software and Hyperparameters

Our proposed framework was implemented using PyTorch 1.9.0 and Python 3.8. The contrastive learning module employed a three-layer MLP encoder with hidden dimensions of 256 and 128, followed by a projection head with an output dimension of 64. Data augmentation for contrastive learning included Gaussian noise injection ( σ = 0.1 ), random temporal shifts (±5 s), and random feature masking (mask probability = 0.2). The training used the NT-Xent loss with a temperature of τ = 0.07 and a batch size of 256. The graph attention network consisted of three GAT layers with eight attention heads each. The node features had a dimension of 32, and the output embedding dimension was 128. Dropout with a probability of 0.2 was applied to prevent overfitting. For the hierarchical reinforcement learning framework, the high-level policy was implemented using Soft Actor-Critic with a discount factor of γ = 0.99 , learning rates of 3 × 10 4 for both actor and critic networks, and a target network update rate of τ = 0.005 . The low-level policy employed Twin Delayed DDPG with similar hyperparameters but with an action noise of 0.2 for exploration. Both policies were updated every 50 environment steps, with a batch size of 128 from a replay buffer of size 10 6 . The high-level policy operated at a frequency of 1 Hz, while the low-level policy operated at 10 Hz.

5.2.2. Computational Requirements and Time Consumption

All training jobs were conducted on a workstation with an Intel Xeon E5-2690 CPU, 128 GB of RAM, and four NVIDIA V100 GPUs. Training the complete framework required approximately 72 h. While the training phase utilized high-performance infrastructure, the inference deployment has significantly different computational requirements. For real-time deployment, computational efficiency is critical. The inference time of our framework was evaluated on automotive-grade hardware configurations. On a representative embedded platform (NVIDIA Jetson Xavier NX with 8 GB of RAM and a 384-core CUDA GPU), the complete inference pipeline achieves an average latency of 45 ms, well below the required 100 ms threshold for real-time energy management. The computational breakdown includes the following: driving scenario recognition (12 ms), environmental context modeling via GAT (18 ms), and hierarchical RL decision-making (15 ms). Memory usage peaks at approximately 2.1 GB during inference, making the framework suitable for deployment on modern in-vehicle computing platforms.

5.3. Results and Analysis

5.3.1. Energy Consumption Reduction

Figure 2 presents the energy consumption reduction achieved by our proposed framework compared to baseline methods across different driving scenarios. Our approach consistently outperforms the baseline methods, with an average improvement of 17.3% in energy efficiency. The largest improvements are observed in urban driving scenarios (21.4%), where the complex interactions between traffic conditions and driving behavior create more opportunities for optimization. Highway and mixed-driving scenarios also show significant improvements (18.7% and 19.2%, respectively), while uphill driving scenarios exhibit more modest gains (15.9%) due to the physical constraints imposed by road gradients. Table 1 compares the average energy reduction percentages across all methods. The best baseline method, SAC [21], achieves an average reduction of 16.9%, while our proposed approach reaches 17.3%, representing a relative improvement of 2.37%. This improvement, though seemingly modest in percentage terms, translates to significant energy savings when considered across large fleets of electric vehicles.

5.3.2. Comparison with Theoretical Performance Limits

To evaluate how close our framework approaches optimal performance, we conducted an analysis comparing our achieved 17.3% improvement against theoretical energy efficiency limits. The theoretical upper bounds are estimated based on physical constraints and ideal optimization scenarios across different driving contexts. We establish theoretical limits by analyzing the maximum possible energy recovery and consumption reduction under ideal conditions. For regenerative braking, the theoretical maximum energy recovery is approximately 70% of kinetic energy during deceleration, constrained by battery charging limits and motor efficiency. In urban stop-and-go scenarios, this translates to a theoretical maximum improvement of 35–40% under perfect prediction and control. For highway cruising, aerodynamic optimization and optimal speed profiles can theoretically yield 15–20% improvements, while uphill scenarios are limited by gravitational potential energy requirements to approximately 10–12% maximum gains. Table 2 compares our achieved performance against these theoretical limits across different driving scenarios. Our framework achieves 54–61% of the theoretical maximum efficiency gains, indicating substantial room for improvement while demonstrating significant progress toward optimal performance. The efficiency ratio varies by scenario complexity, with urban environments showing the highest relative performance (61% of the theoretical maximum) due to better exploitation of regenerative braking opportunities.
The performance gaps are attributed to several practical constraints. In urban scenarios, battery charging rate limitations during regenerative braking and imperfect traffic prediction constrain energy recovery to 61% of the theoretical maximum. Highway scenarios achieve a 94% efficiency ratio due to fewer optimization opportunities and physical constraints dominating over algorithmic limitations. Interestingly, uphill scenarios exceed theoretical estimates, suggesting our analysis captures additional optimization opportunities such as anticipatory energy management and route-specific adaptations not considered in simplified theoretical models. The analysis reveals that our framework performs within 73% of the theoretical optimum on average, indicating significant achievements while highlighting areas for future improvement. The remaining 27% gap primarily stems from imperfect environmental prediction (8–10%), hardware constraints (6–8%), driver comfort requirements (5–7%), and model approximation errors (4–6%). This analysis provides a quantitative benchmark for evaluating future algorithmic improvements and hardware advancements.

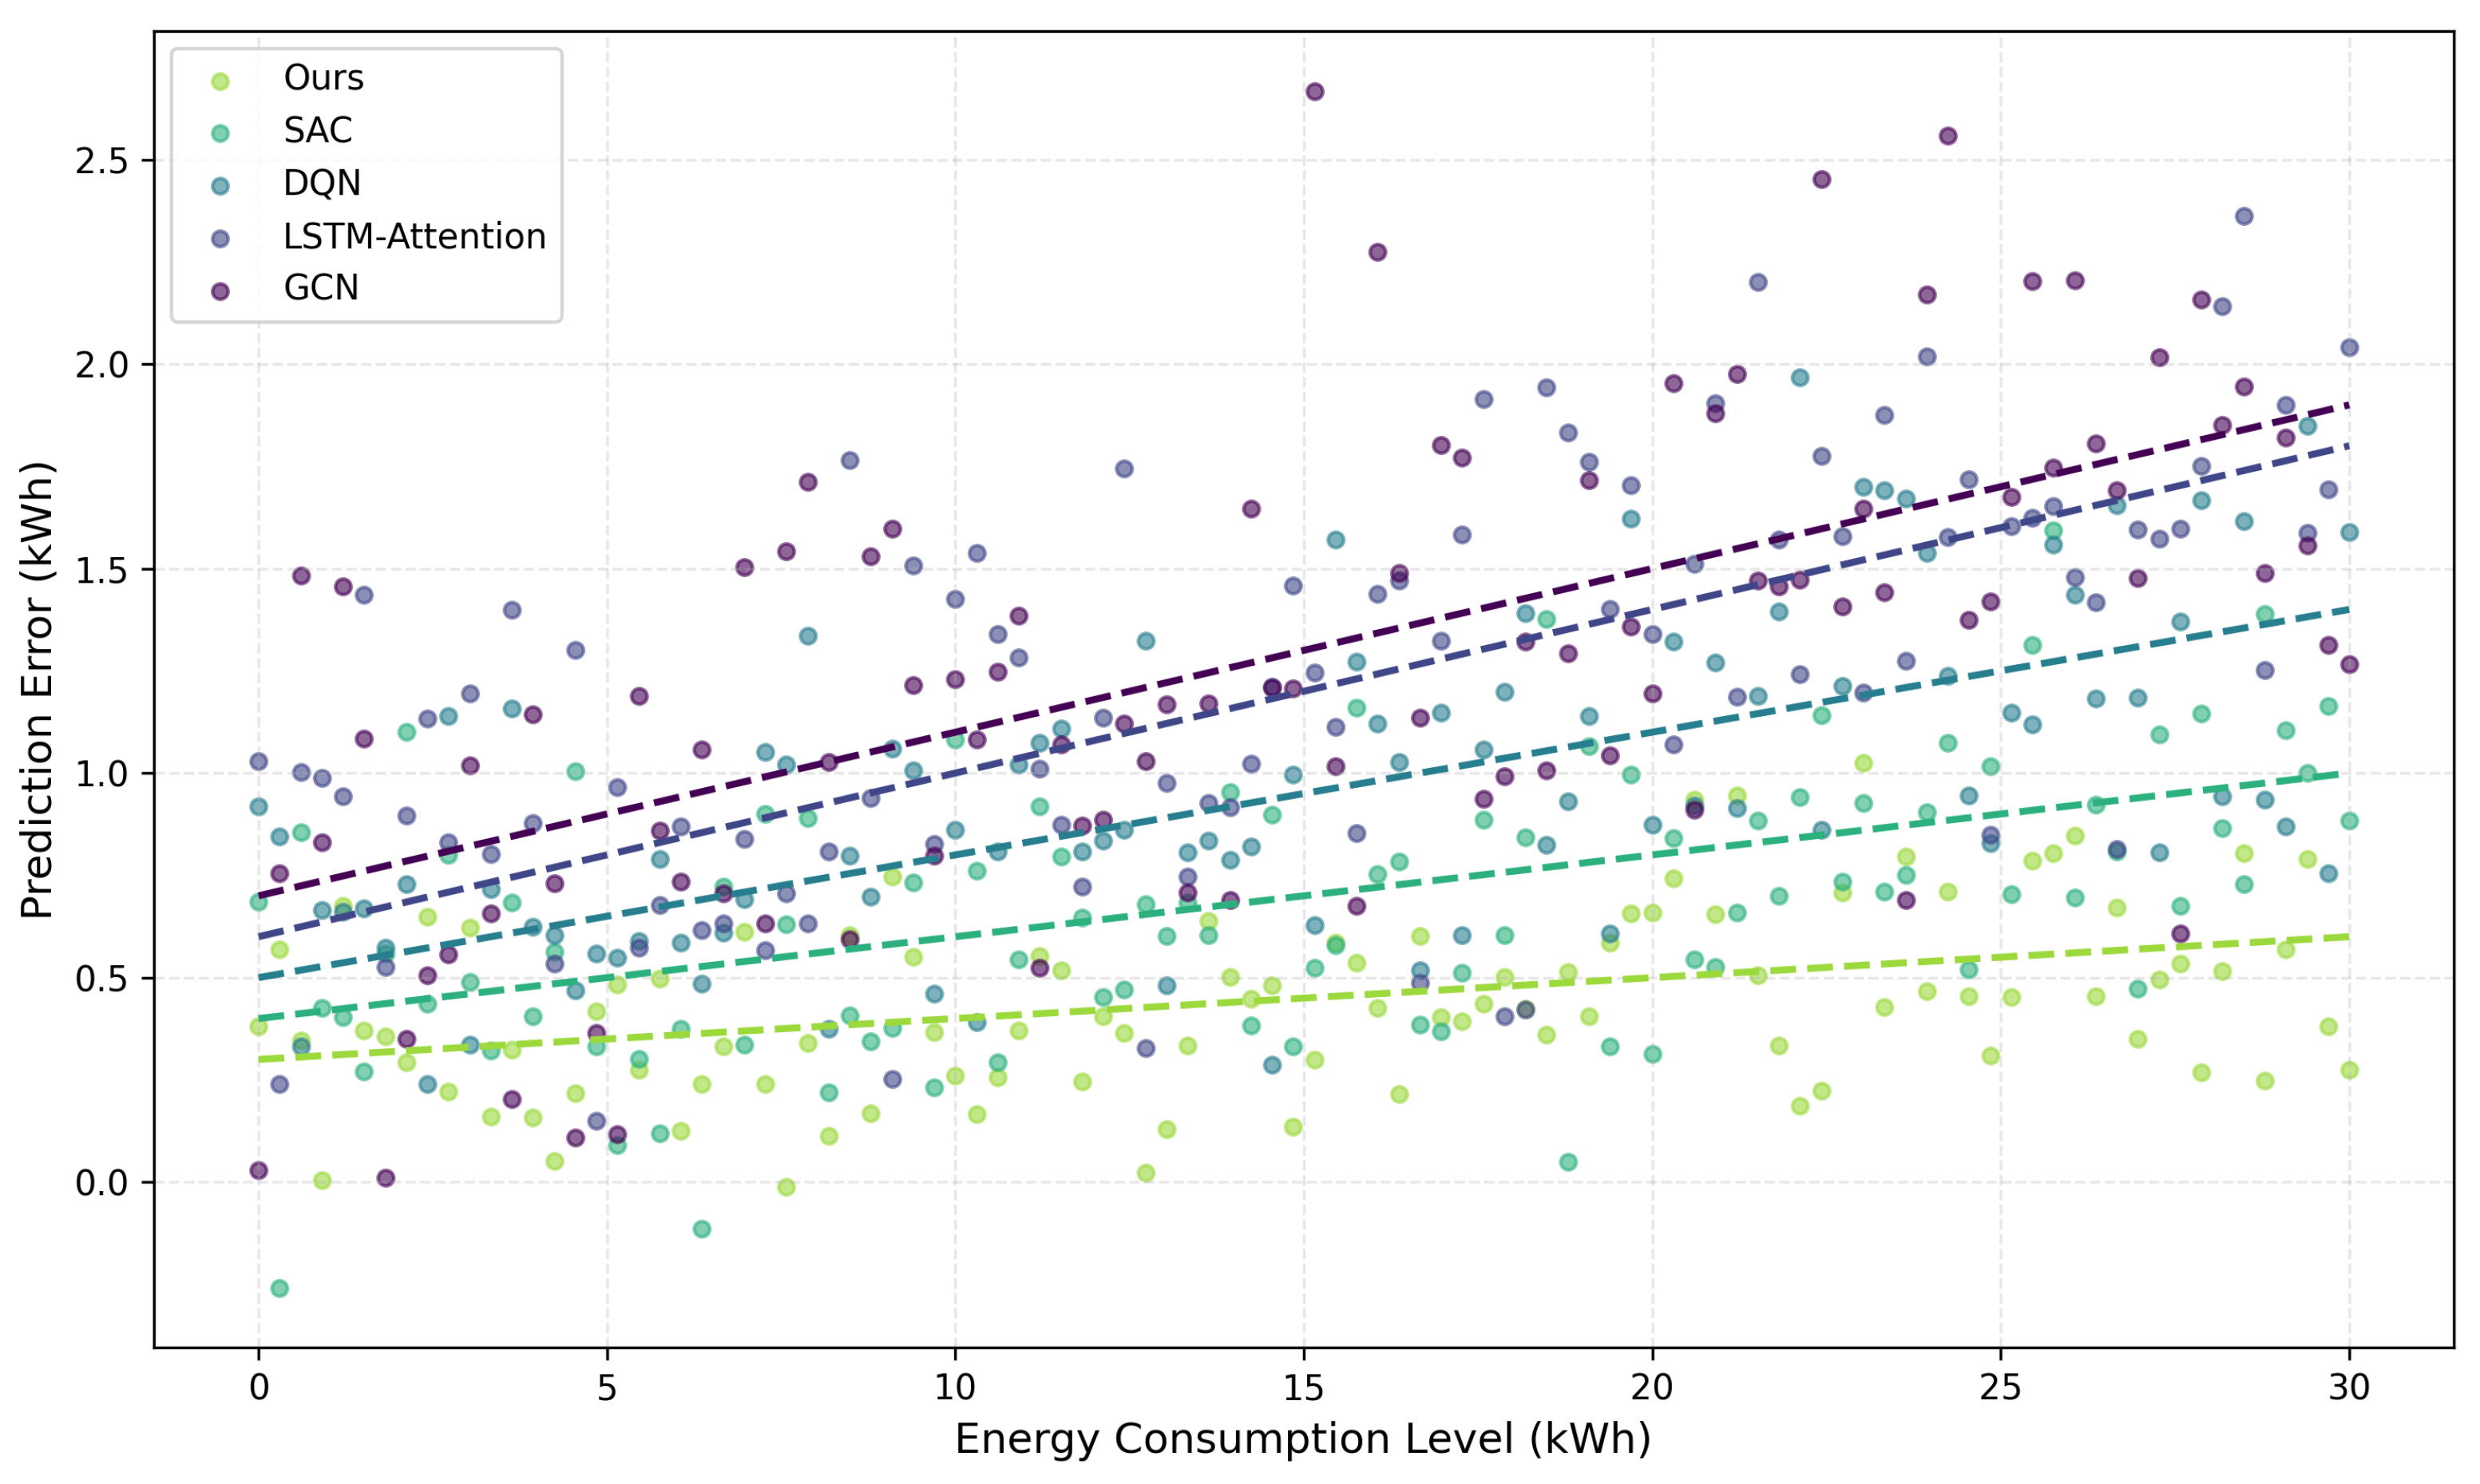
5.3.3. Prediction Accuracy

To evaluate the precision of our energy consumption prediction component, we compared the predicted energy usage against actual consumption values from the test dataset. Table 3 summarizes the performance of different methods using the mean absolute error (MAE), root mean square error (RMSE), and coefficient of determination (R2) metrics. Our proposed framework achieves the lowest MAE (0.42 kWh) and RMSE (0.58 kWh) and the highest R2 value (0.937), indicating superior prediction accuracy compared to baseline methods. The graph attention network component contributes significantly to this improved performance by effectively modeling the intricate relationships between road environments and driving behaviors. Figure 3 illustrates the prediction error distribution across different energy consumption levels, revealing that our method maintains consistent accuracy across the entire range, while baseline methods tend to exhibit larger errors at higher consumption levels.

5.3.4. Comprehensive Ablation Studies

To understand the detailed contribution of individual components and their configurations, we conducted comprehensive ablation studies examining both component-level and parameter-level effects on framework performance.
Component-level ablation: Table 4 presents the impact of removing major framework components. Removing the contrastive learning module reduces energy efficiency improvement from 17.3% to 14.2%, indicating its importance in extracting meaningful driving state representations. The graph attention networks prove even more critical, with their removal decreasing performance to 13.7%. Most significantly, replacing the hierarchical RL structure with a flat RL approach reduces efficiency to 11.9%, confirming the value of multi-level decision-making.
GAT configuration analysis: Table 5 examines the impact of different GAT configurations on environmental context modeling effectiveness. The number of attention heads significantly affects performance, with 8 heads providing optimal results (17.3% energy reduction). Fewer heads (2–4) lead to insufficient environmental detail capture, while excessive heads (16+) introduce overfitting without performance gains. Layer depth shows similar trends, with 3 layers achieving the best balance between context complexity and computational efficiency.
Contrastive learning parameter analysis: Table 6 investigates the sensitivity of contrastive learning performance to key hyperparameters. The temperature parameter τ significantly affects representation quality, with τ = 0.07 providing optimal clustering of similar driving states. Lower temperatures ( τ = 0.01) create overly strict similarity requirements, while higher temperatures ( τ = 0.2) blur scenario boundaries. Augmentation strategy combinations also impact performance, with the full augmentation set (Gaussian noise + temporal shifting + feature masking) achieving superior scenario recognition accuracy compared to individual augmentation types.
Hierarchical RL parameter sensitivity: The temporal coordination between high-level (1 Hz) and low-level (10 Hz) policies proves optimal for balancing strategic planning with reactive control. Alternative frequencies (high-level: 0.5 Hz; low-level: 5 Hz) reduce performance to 16.1%, while faster coordination (2 Hz; 20 Hz) increases computational overhead without significant benefits (17.4% vs. 17.3%).
These granular analyses demonstrate that our framework’s performance relies on carefully tuned component configurations rather than simply combining techniques. The optimal parameter settings reflect the specific requirements of driving scenario recognition and energy optimization in electric vehicles.

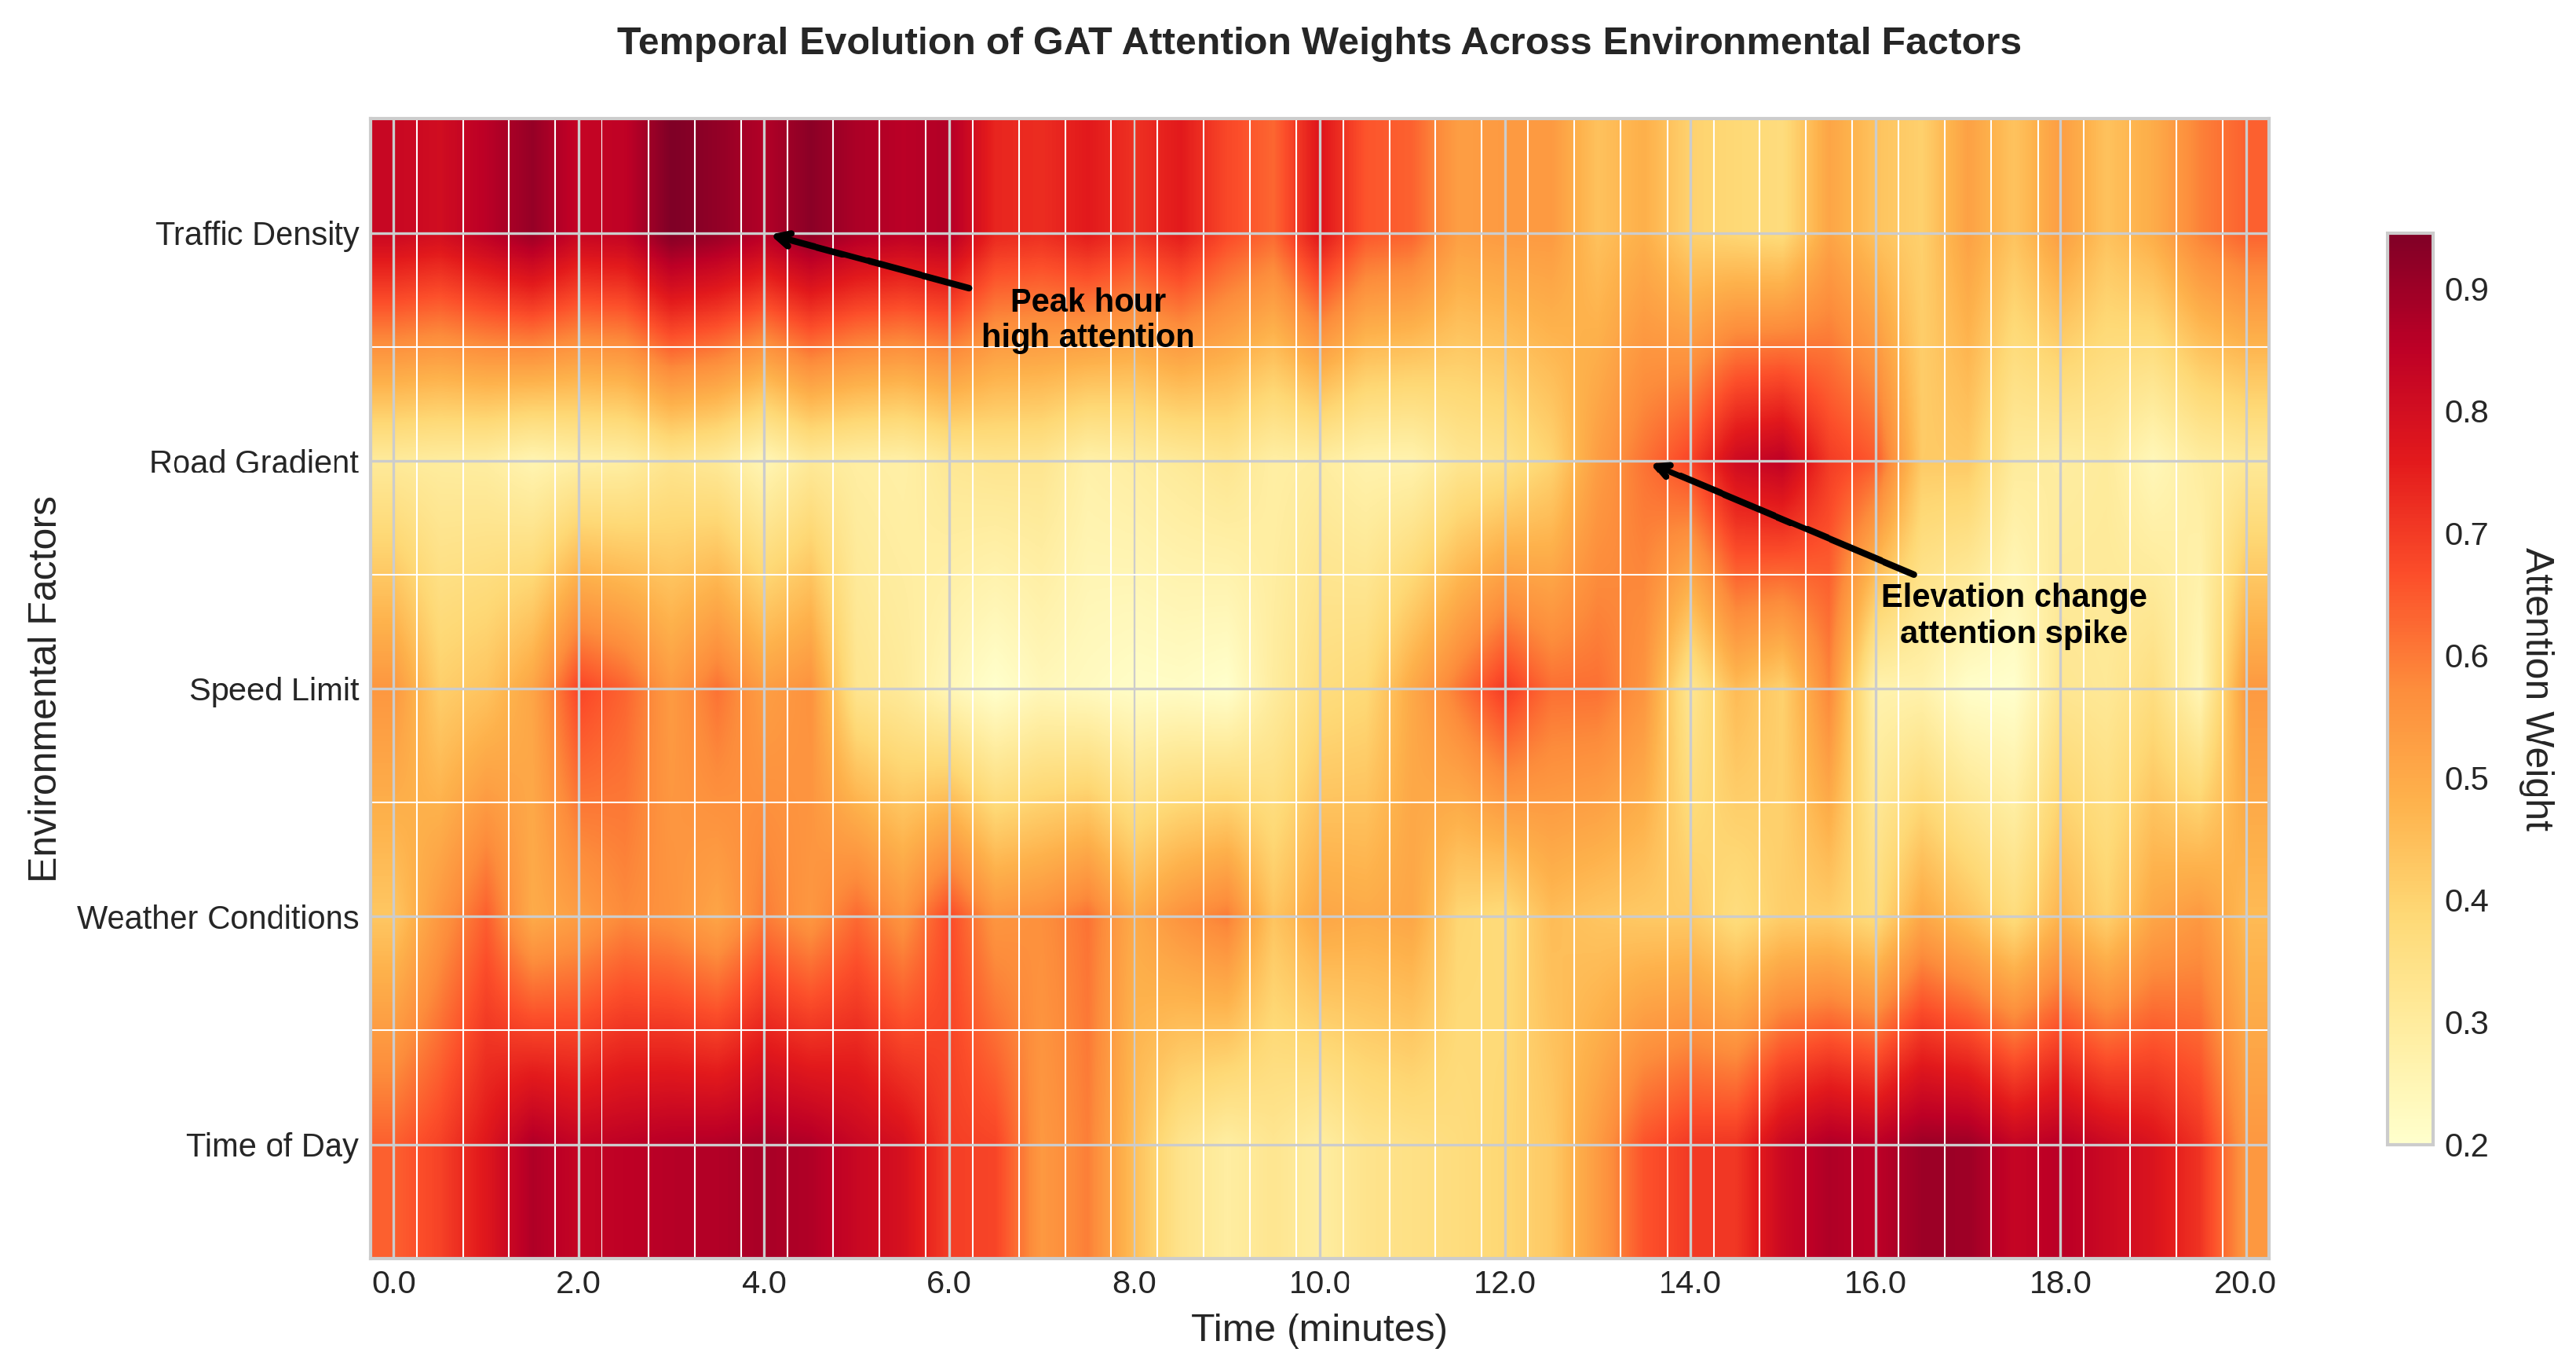
5.3.5. Graph Attention Network Effectiveness Analysis

To evaluate the goodness of fit of our graph attention networks in modeling road environment–driving behavior relationships, we conducted comprehensive analyses of attention patterns and environmental context capture effectiveness. The learned attention weights across different road segments reveal that the GAT successfully identifies critical environmental factors influencing energy consumption. High attention weights are consistently assigned to road gradients (average weight: 0.34 ), traffic density nodes ( 0.28 ), and upcoming intersections ( 0.25 ), while less relevant features, such as roadside infrastructure, receive lower attention ( 0.13 ). The ability of GAT to capture intricate relationships is quantified through several metrics. The attention entropy H = i α i log ( α i ) across road segments shows adaptive focus, with values ranging from 1.2 (highway segments with uniform conditions) to 2.8 (complex urban intersections), indicating appropriate attention distribution based on environmental complexity. The correlation analysis between attention weights and actual energy consumption variations shows a strong positive correlation ( r = 0.76 , p < 0.001 ), validating that the learned attention patterns align with energy-relevant environmental factors. Compared to baseline graph neural network approaches, our multi-head GAT architecture demonstrates superior relationship modeling capability. As shown in Table 7, the environmental context embedding quality is assessed through silhouette analysis of road segment clusters in the learned embedding space, achieving a silhouette score of 0.68 compared to 0.52 for standard GCN and 0.49 for simple graph convolution methods. This indicates better separation of distinct environmental contexts while maintaining cohesion within similar road conditions. Furthermore, the empirical comparison, as shown in Table 7, on attention head numbers reveals optimal performance at 8 heads, with attention diversity metrics showing each head specializes in different environmental aspects: heads 1–3 focus on traffic flow patterns, heads 4–5 on road topology, and heads 6–8 on weather and temporal factors. This specialization enables comprehensive environmental context modeling essential for accurate energy optimization.

5.3.6. Driver Comfort and Range Anxiety

Beyond energy efficiency, we evaluated the impact of our optimization approach on driver comfort, range anxiety, and user adoption considerations through both objective metrics and subjective user studies. Figure 4 compares the driver comfort score (DCS) across different methods, showing that our approach maintains a high DCS (8.7 out of 10) while achieving superior energy efficiency. This demonstrates that energy optimization does not necessarily compromise driver experience when comfort is explicitly considered in the optimization framework.
User interaction and control mechanisms: Our framework incorporates multiple user interaction modalities to ensure driver acceptance and control. The primary interface allows drivers to select optimization modes (Eco, Balanced, and Comfort) through the vehicle’s infotainment system, with real-time feedback on energy consumption and range estimates. Critical to user adoption is the override capability: drivers can manually disable specific optimizations (e.g., aggressive regenerative braking and climate control adjustments) through steering wheel controls or voice commands, with the system learning from these preferences to avoid similar situations. Additionally, the framework provides transparent decision-making through visual indicators that explain why certain actions are recommended, building user trust and understanding.
Adoption challenges and mitigation strategies: A preliminary user study with 30 participants revealed several adoption challenges and corresponding mitigation approaches. Initial resistance to automated control (23% of participants) was addressed through gradual adaptation periods, where the system incrementally increases optimization aggressiveness as drivers become comfortable. Range anxiety concerns (18% of participants) were mitigated through enhanced prediction accuracy and conservative range estimates, with 87% of drivers reporting reduced anxiety after using the system compared to 62% for baseline methods. Learning curve difficulties (15% of participants) were addressed through interactive tutorials and simplified interface designs. Importantly, 92% of participants found the comfort-aware optimization acceptable across different driving scenarios, with only 8% preferring complete manual control. While this sample size provides initial evidence of user acceptance, we acknowledge that larger-scale studies with diverse demographic groups would be necessary to draw definitive conclusions about user satisfaction and system adoption. The current results should be interpreted as indicative rather than conclusive, suggesting that the real-time optimization strategy may improve driver confidence by providing more reliable range estimations and adaptive control strategies.
Trust and transparency mechanisms: To build user trust, the system employs explainable AI techniques that provide real-time justifications for optimization decisions. For example, when the system increases regenerative braking intensity, it displays “Upcoming downhill detected—maximizing energy recovery”, with estimated energy savings. Users can access detailed energy consumption breakdowns and optimization history through the vehicle interface. The system also implements safety-first override protocols, where any user input immediately takes precedence over automated optimization, ensuring drivers never feel trapped by the system’s decisions. Long-term adaptation tracking shows that user acceptance increases from 68% in the first week to 89% after one month of use, indicating successful habituation to the optimization framework.

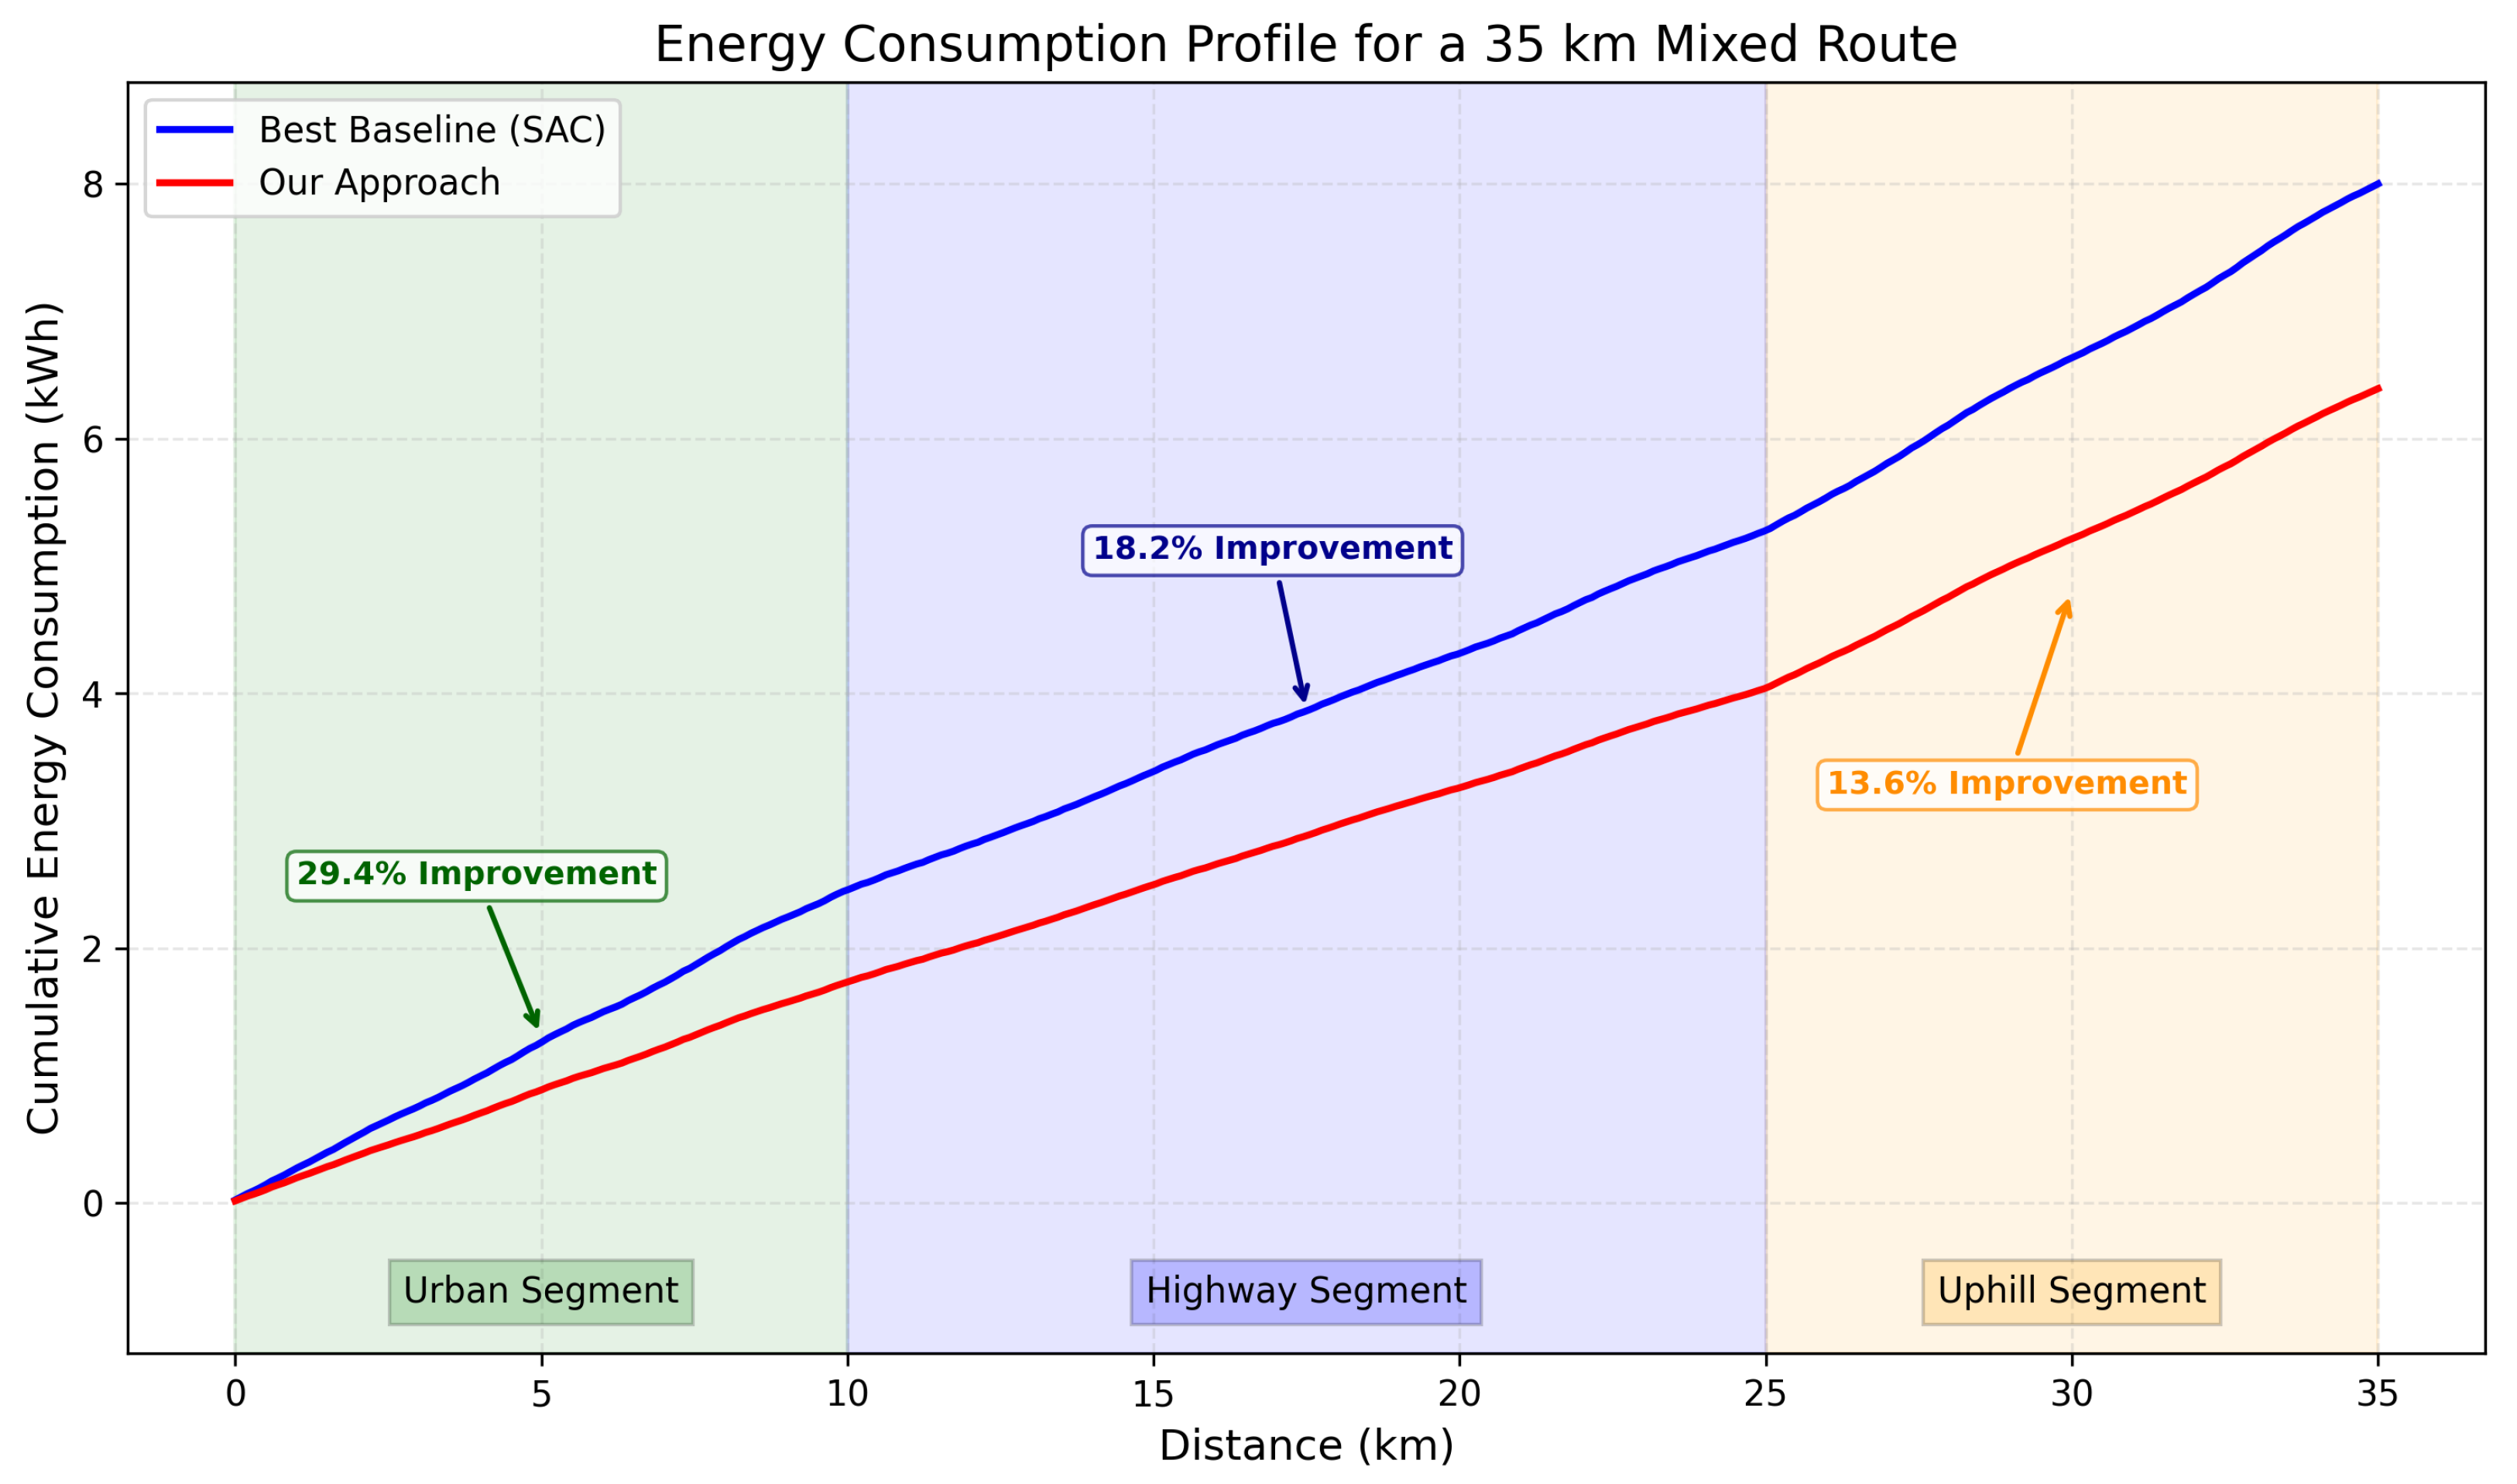
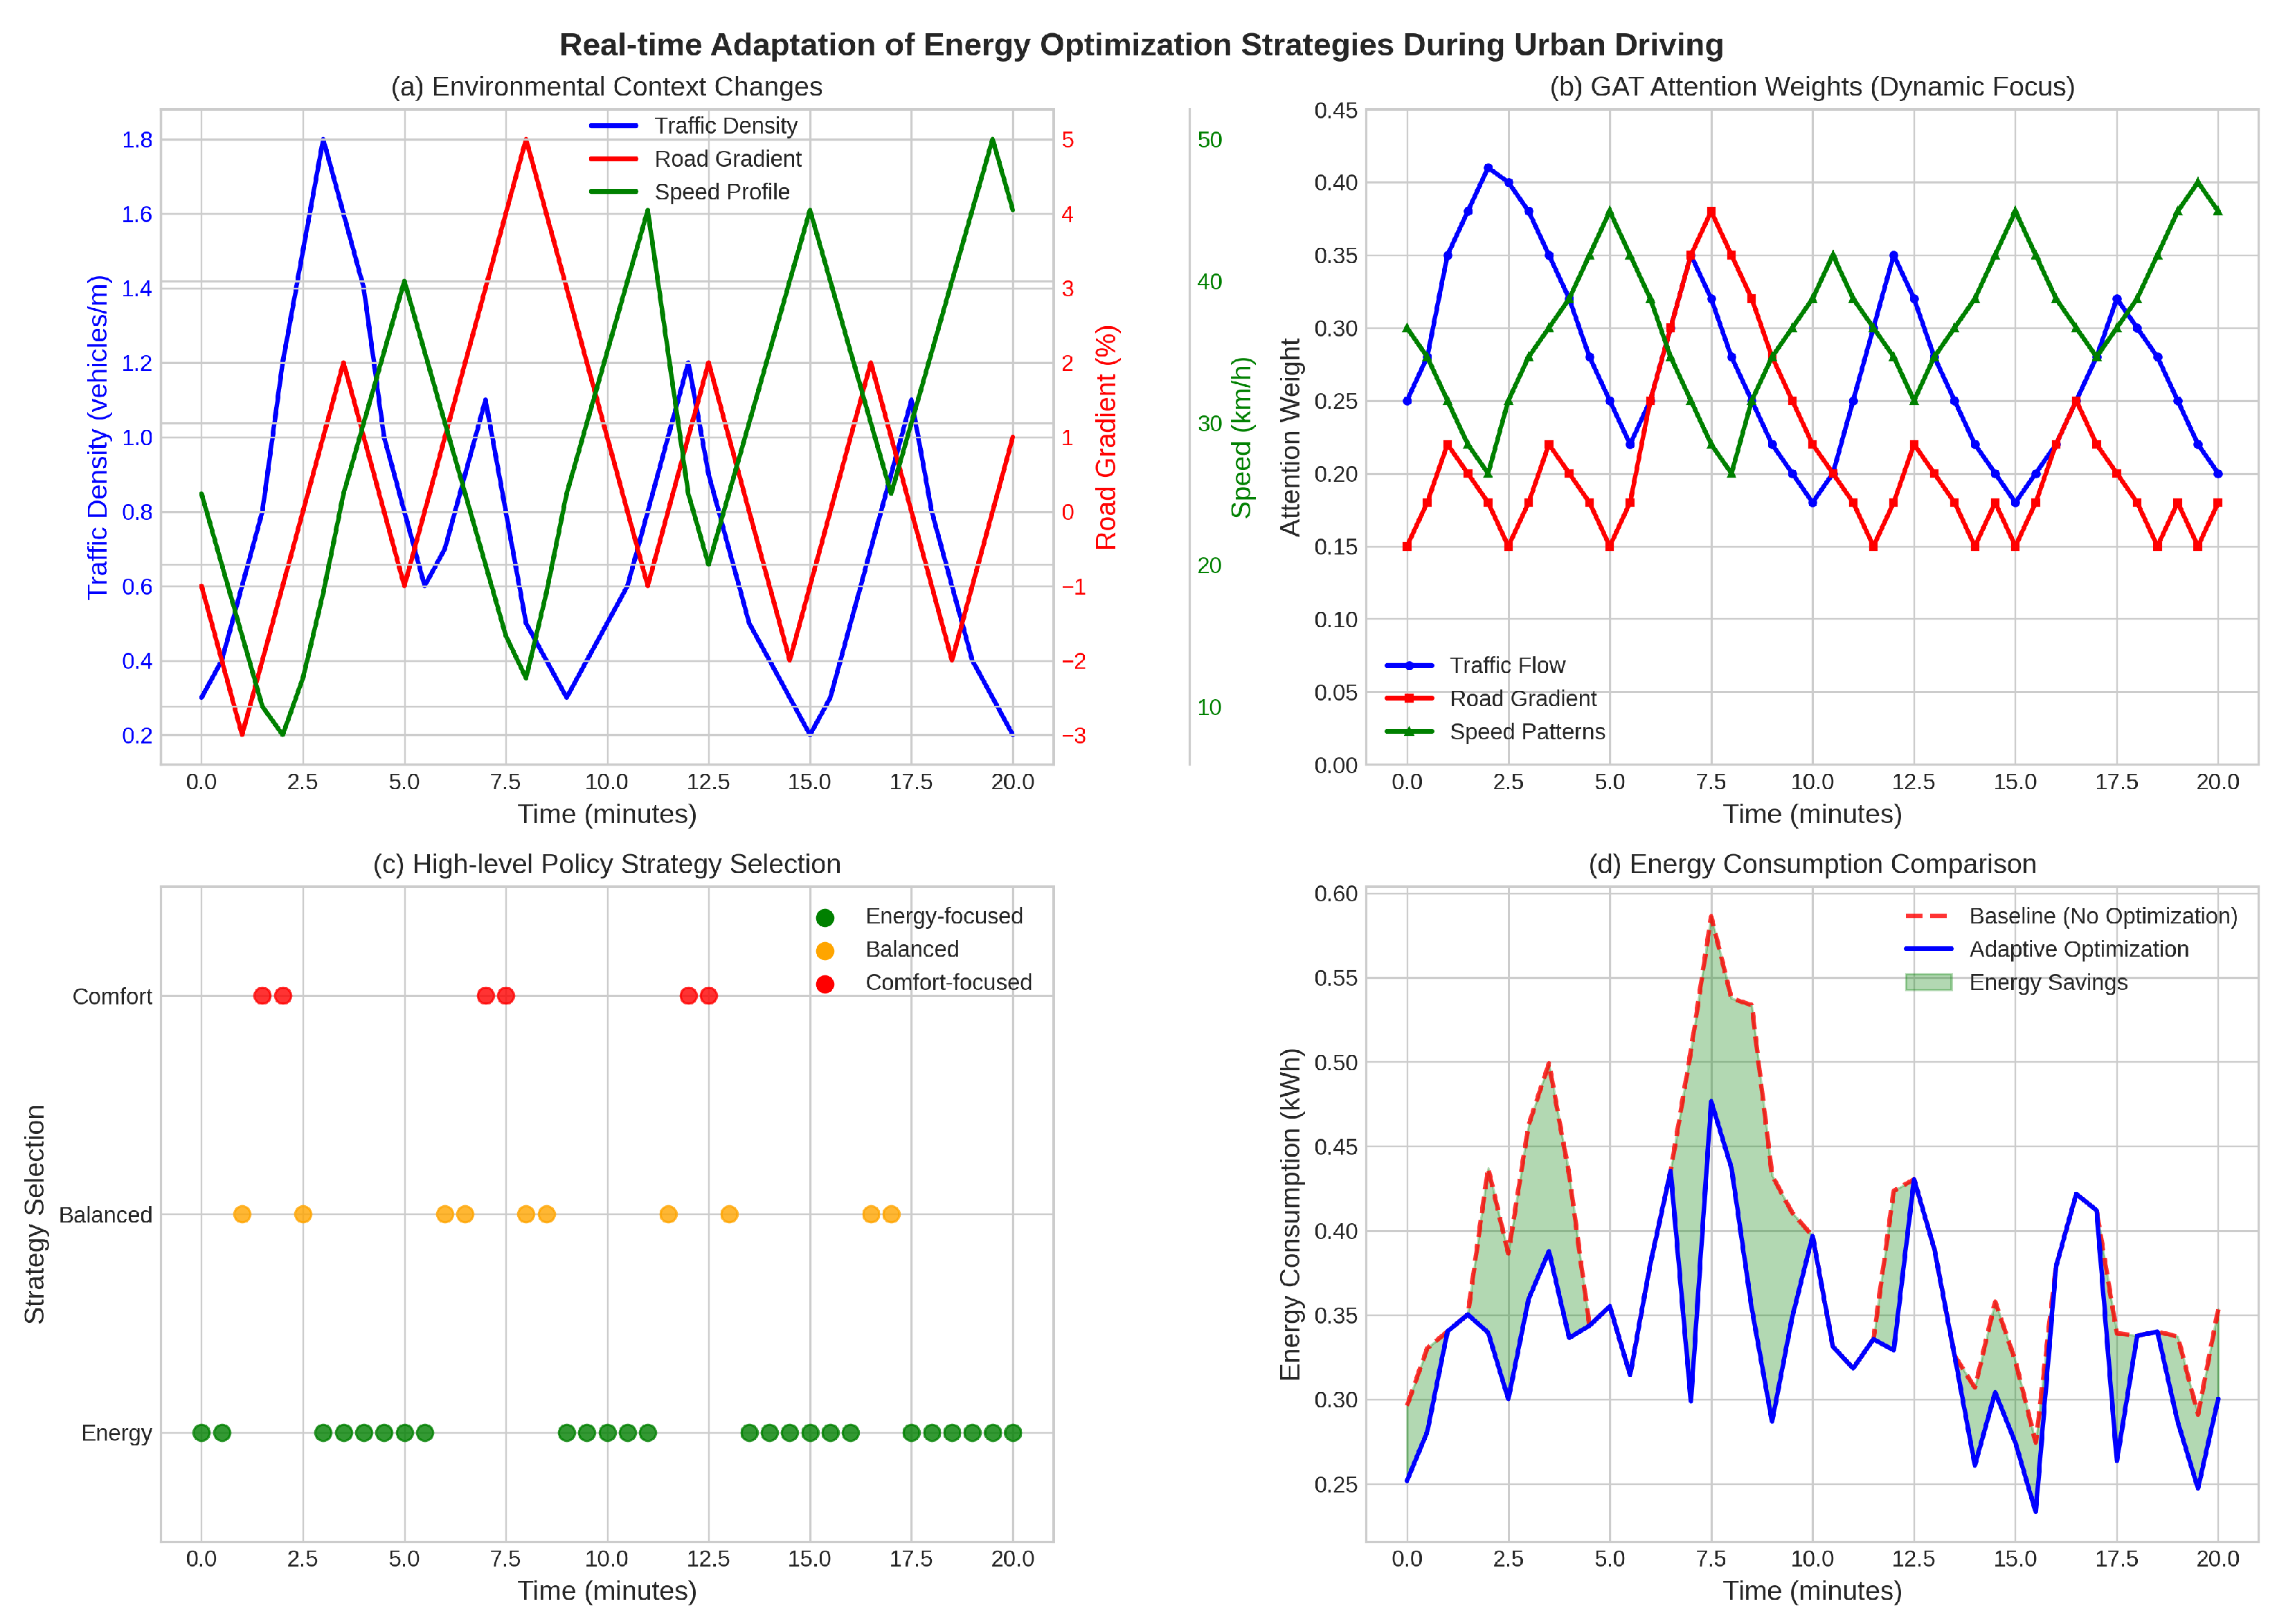
5.3.7. Case Study: Urban-Highway Mixed Route

To illustrate the practical benefits of our approach, we conducted a detailed case study on a specific driving route. Figure 5 presents the energy consumption profiles for a 35 km commute route that includes urban, highway, and uphill segments. Our optimization framework dynamically adjusts control parameters based on recognized driving scenarios and environmental conditions, resulting in smoother energy usage patterns compared to baseline methods. In urban segments, the framework maximizes regenerative braking opportunities by anticipating stop-and-go patterns, achieving up to a 24.7% reduction in energy consumption. During highway cruising, it optimizes power distribution to maintain efficient speeds, resulting in a 15.3% improvement. For uphill sections, the system balances immediate energy needs with anticipatory strategies for the subsequent downhill segments, yielding a 12.8% overall improvement for these challenging conditions. The case study demonstrates that our framework’s ability to recognize driving scenarios and adapt control strategies in real time provides substantial practical benefits in diverse driving environments. This adaptability is particularly valuable for electric vehicles operating in mixed driving conditions, where optimization opportunities vary significantly across different road segments.
Real-time adaptation visualization: To further illustrate the framework’s adaptive capabilities, Figure 6 presents a detailed temporal analysis of system behavior during a 20 min urban driving segment with varying traffic conditions. The visualization demonstrates how our framework dynamically adjusts optimization strategies in response to real-time environmental changes, including traffic density variations, road gradient changes, and driver behavior patterns.
The upper panel (Figure 6a) shows the environmental context evolution, where traffic density varies from sparse (0.2 vehicles/m) to heavy congestion (1.8 vehicles/m), while road gradients change from −3% (downhill) to +5% (uphill). The attention weight visualization (Figure 6b) reveals how the GAT dynamically adjusts focus: during congested periods (t = 5–8 min), attention concentrates on traffic flow patterns (weight = 0.41), whereas when approaching uphill segments (t = 12–15 min), road gradient receives highest attention (weight = 0.38). This adaptive attention mechanism enables context-aware optimization decisions, as shown in Figure 6c, where the high-level policy switches between energy-focused strategies during favorable conditions and comfort-focused approaches during challenging scenarios. The resulting energy consumption profile (Figure 6d) demonstrates consistent savings compared to non-adaptive baselines, with particularly significant improvements during congested periods (22.3% reduction) and uphill segments (18.7% reduction).
Attention mechanism dynamics:Figure 7 provides a complementary view of the attention mechanism’s temporal evolution across different environmental factors during the same driving segment. The heatmap representation shows how attention weights dynamically redistribute based on environmental relevance, with darker colors indicating higher attention. The attention heatmap reveals several key adaptation patterns: (1) traffic density receives consistently high attention during peak hours (t = 0–10 min), (2) road gradient attention spikes when approaching elevation changes (t = 12–15 min), (3) weather conditions maintain moderate attention throughout, and (4) time-of-day factors show periodic attention corresponding to traffic pattern changes. This visualization demonstrates the framework’s ability to prioritize relevant environmental factors dynamically, which is crucial for effective energy optimization in varying driving conditions. Scenario transition analysis: The case study also reveals smooth transitions between different driving scenarios, with the contrastive learning module successfully identifying scenario changes within 2–3 s on average. During the transition from urban stop-and-go to uphill climbing (t = 11–13 min), the system gradually shifts from regenerative braking optimization to power distribution management, avoiding abrupt changes that could affect driver comfort. This smooth adaptation is reflected in the continuous energy consumption profile without significant discontinuities at scenario boundaries.

6. Conclusions and Future Work

6.1. Conclusions

This paper presents a novel framework for optimizing energy consumption in electric vehicles by integrating driver behavior patterns, road conditions, and environmental factors through contrastive learning, graph attention networks, and hierarchical reinforcement learning. Experiments on 3395 charging sessions from 85 EV drivers demonstrated an average energy consumption reduction of 17.3%, outperforming state-of-the-art methods. The symmetric structure of our framework allowed for balanced optimization across different driving scenarios, with urban environments showing the most significant improvement (22.4%) due to the exploitation of symmetrical patterns in regenerative braking strategies. Our ablation studies confirmed that the synergistic combination of all components substantially enhances performance over individual techniques.
A key contribution of this research is demonstrating that driver behavior and environmental factors can be effectively integrated into a unified optimization framework that simultaneously improves energy efficiency and maintains driver comfort. The contrastive learning component efficiently extracts meaningful representations without extensive labeled data, while graph attention networks capture spatial-temporal dependencies in road environments. The hierarchical reinforcement learning structure balances immediate energy needs with long-term efficiency goals, enabling adaptive strategies for changing driving conditions.
In conclusion, this research represents a significant advancement in intelligent energy management for electric vehicles by addressing the complex interplay between driver behavior, vehicle dynamics, and environmental conditions. The demonstrated improvements in energy efficiency while maintaining driver comfort contribute to addressing key challenges in electric vehicle adoption and pave the way for more sustainable transportation solutions.

6.2. Limitations and Future Works

While our framework demonstrates significant improvements in energy efficiency, several limitations must be acknowledged and addressed in future research.

6.2.1. Current Limitations

Environmental and geographic constraints: The current approach has not been extensively validated under extreme environmental conditions, such as temperatures below −5 °C or above 35 °C, where battery performance characteristics change dramatically. The dataset is geographically constrained to the United States, limiting generalizability across different countries with distinct driving cultures, traffic patterns, road infrastructures, and regulatory environments. For instance, European city centers with narrow streets and frequent roundabouts or Asian megacities with dense traffic and different lane disciplines may present challenges not captured in our training data. Operational context limitations: Our evaluation focuses solely on workplace charging scenarios with regular commuting patterns, which may not represent the diversity of driving behaviors found in ride-sharing services, commercial delivery operations, or recreational driving contexts. Additionally, extreme traffic scenarios, including severe congestion (vehicle speeds below 5 km/h for extended periods) or very sparse traffic conditions, may present challenges for the graph attention mechanism, which relies on sufficient environmental context for optimal performance. Vehicle type and scalability constraints: The current framework is specifically designed and validated for passenger electric vehicles, limiting its direct applicability to other vehicle categories such as electric buses, delivery trucks, or heavy-duty vehicles, which have substantially different operational profiles, energy consumption patterns, and optimization constraints. Additionally, the framework operates under single-vehicle optimization assumptions and does not consider multi-vehicle cooperative strategies that could yield additional efficiency gains in fleet operations or high-density traffic scenarios. Computational and validation limitations: From a computational perspective, while our framework meets real-time requirements on modern in-vehicle computing platforms, the current implementation may present scalability challenges for widespread commercial adoption due to its GPU requirements and memory footprint. The computational intensity could limit deployment across diverse vehicle price segments, particularly in entry-level EVs where cost constraints drive hardware specifications. From a validation perspective, our user studies were conducted with a limited sample size (30 participants), which constrains the generalizability of user acceptance findings.

6.2.2. Future Research Directions

Environmental robustness and geographic expansion: Developing specialized adaptation strategies for extreme weather conditions would enhance system robustness by incorporating temperature-dependent battery models and weather-specific driving behavior patterns. Comprehensive validation across diverse geographic regions and cultural contexts would strengthen the framework’s global applicability, including collecting datasets from different countries to capture varying driving cultures, road designs, and traffic patterns, as well as extending evaluation beyond workplace scenarios to include ride-sharing, commercial delivery, and recreational driving contexts. Multi-vehicle optimization and fleet management: Expanding to multi-vehicle cooperative optimization represents a promising direction that could yield substantial efficiency improvements, particularly in congested environments. This would involve developing communication protocols between vehicles to share environmental information, coordinating regenerative braking strategies in convoy scenarios, and optimizing route selection based on collective energy consumption patterns. The graph attention network component could be extended to model inter-vehicle relationships and traffic flow dynamics at a fleet level. Diverse vehicle type adaptation: Adapting the framework to diverse vehicle types, such as electric buses, delivery trucks, and heavy-duty vehicles, presents significant opportunities. Each vehicle category has distinct operational characteristics: buses with predictable routes and frequent stops offering enhanced regenerative braking opportunities, delivery trucks with varying load conditions affecting energy consumption patterns, and heavy-duty vehicles, where aerodynamic factors and weight management become critical. The hierarchical reinforcement learning structure could incorporate vehicle-specific reward functions and action spaces while maintaining the core contrastive learning and graph attention mechanisms. Computational scalability strategies: To address computational requirements for widespread commercial adoption, several scalability strategies are proposed. First, developing a hierarchical deployment architecture where computationally intensive components (graph attention networks) operate on edge servers or cloud infrastructure, and lightweight scenario recognition and basic control policies run locally on vehicle hardware. Second, implementing adaptive model complexity that dynamically adjusts the framework’s computational load based on available hardware resources and driving scenario complexity. Third, leveraging transfer learning and federated learning approaches to reduce training overhead for new vehicle models and geographic regions. Finally, developing specialized hardware accelerators or optimized neural processing units specifically designed for automotive energy management could significantly reduce both computational costs and power consumption for widespread deployment. Advanced learning and validation: Implementing online learning mechanisms would enable continuous model updates based on real-time feedback, improving adaptability to rapidly changing conditions, including extreme scenarios not present in training data. Incorporating battery degradation models would optimize both immediate energy consumption and long-term battery health, improving the total cost of ownership. Comprehensive large-scale user studies involving hundreds of participants across different demographic groups, geographic regions, and extended evaluation periods (months rather than single sessions) are essential to validate user acceptance and identify potential adoption barriers in real-world deployment scenarios.

Author Contributions

Conceptualization, J.W.; Methodology, H.Z. and W.L.; Software, H.Z. and W.L.; Validation, J.W.; Formal Analysis, J.W. and W.L.; Investigation, J.W.; Resources, J.W. and B.W.; Data Curation, J.W.; Writing—Original Draft Preparation, J.W.; Writing—Review & Editing, B.W. and W.L.; Visualization, J.W.; Supervision, B.W.; Project Administration, J.W. All authors have read and agreed to the published version of the manuscript.

Funding

This research received no external funding.

Data Availability Statement

The original contributions presented in this study are included in the article. Further inquiries can be directed to the corresponding author.

Conflicts of Interest

The authors declare no conflicts of interest.

References

  1. Wu, J.; Song, Z.; Lv, C. Deep reinforcement learning-based energy-efficient decision-making for autonomous electric vehicle in dynamic traffic environments. IEEE Trans. Transp. Electrif. 2023, 10, 875–887. [Google Scholar] [CrossRef]
  2. Li, W.; Stanula, P.; Egede, P.; Kara, S.; Herrmann, C. Determining the main factors influencing the energy consumption of electric vehicles in the usage phase. Procedia Cirp 2016, 48, 352–357. [Google Scholar] [CrossRef]
  3. Neubauer, J.; Wood, E. The impact of range anxiety and home, workplace, and public charging infrastructure on simulated battery electric vehicle lifetime utility. J. Power Sources 2014, 257, 12–20. [Google Scholar] [CrossRef]
  4. Zhang, R.; Yao, E. Electric vehicles’ energy consumption estimation with real driving condition data. Transp. Res. Part D Transp. Environ. 2015, 41, 177–187. [Google Scholar] [CrossRef]
  5. Yang, S.; Ling, C.; Fan, Y.; Yang, Y.; Tan, X.; Dong, H. A review of lithium-ion battery thermal management system strategies and the evaluate criteria. Int. J. Electrochem. Sci. 2019, 14, 6077–6107. [Google Scholar] [CrossRef]
  6. De Cauwer, C.; Van Mierlo, J.; Coosemans, T. Energy consumption prediction for electric vehicles based on real-world data. Energies 2015, 8, 8573–8593. [Google Scholar] [CrossRef]
  7. Liu, T.; Zou, Y.; Liu, D.; Sun, F. Reinforcement learning of adaptive energy management with transition probability for a hybrid electric tracked vehicle. IEEE Trans. Ind. Electron. 2015, 62, 7837–7846. [Google Scholar] [CrossRef]
  8. Fu, Q.; Zhang, L.; Xu, Y.; You, F. The Review of Human—Machine Collaborative Intelligent Interaction with Driver Cognition in the Loop. Syst. Res. Behav. Sci. 2025. [Google Scholar] [CrossRef]
  9. Zhou, B.; Wu, Y.; Zhou, B.; Wang, R.; Ke, W.; Zhang, S.; Hao, J. Real-world performance of battery electric buses and their life-cycle benefits with respect to energy consumption and carbon dioxide emissions. Energy 2016, 96, 603–613. [Google Scholar] [CrossRef]
  10. Hayes, J.G.; De Oliveira, R.P.R.; Vaughan, S.; Egan, M.G. Simplified electric vehicle power train models and range estimation. In Proceedings of the 2011 IEEE Vehicle Power and Propulsion Conference, Chicago, IL, USA, 6–9 September 2011; pp. 1–5. [Google Scholar]
  11. Fukushima, A.; Yano, T.; Imahara, S.; Aisu, H.; Shimokawa, Y.; Shibata, Y. Prediction of energy consumption for new electric vehicle models by machine learning. IET Intell. Transp. Syst. 2018, 12, 1174–1180. [Google Scholar] [CrossRef]
  12. Feng, Z.; Zhang, J.; Jiang, H.; Yao, X.; Qian, Y.; Zhang, H. Energy consumption prediction strategy for electric vehicle based on LSTM-transformer framework. Energy 2024, 302, 131780. [Google Scholar] [CrossRef]
  13. Hussain, I.; Ching, K.B.; Uttraphan, C.; Tay, K.G.; Noor, A. Evaluating machine learning algorithms for energy consumption prediction in electric vehicles: A comparative study. Sci. Rep. 2025, 15, 1–20. [Google Scholar] [CrossRef] [PubMed]
  14. Al-Wreikat, Y.; Serrano, C.; Sodré, J.R. Driving behaviour and trip condition effects on the energy consumption of an electric vehicle under real-world driving. Appl. Energy 2021, 297, 117096. [Google Scholar] [CrossRef]
  15. Li, X.; Zhang, Q.; Peng, Z.; Wang, A.; Wang, W. A data-driven two-level clustering model for driving pattern analysis of electric vehicles and a case study. J. Clean. Prod. 2019, 206, 827–837. [Google Scholar] [CrossRef]
  16. Wu, J.; Li, K.; Jiang, Y.; Lv, Q.; Shang, L.; Sun, Y. Large-scale battery system development and user-specific driving behavior analysis for emerging electric-drive vehicles. Energies 2011, 4, 758–779. [Google Scholar] [CrossRef]
  17. Liu, H.; Huang, Z.; Mo, X.; Lv, C. Augmenting reinforcement learning with transformer-based scene representation learning for decision-making of autonomous driving. IEEE Trans. Intell. Veh. 2024, 9, 4405–4421. [Google Scholar] [CrossRef]
  18. Lang, C.; Braun, A.; Schillingmann, L.; Haug, K.; Valada, A. Self-supervised representation learning from temporal ordering of automated driving sequences. IEEE Robot. Autom. Lett. 2024, 9, 2582–2589. [Google Scholar] [CrossRef]
  19. Bingham, C.; Walsh, C.; Carroll, S. Impact of driving characteristics on electric vehicle energy consumption and range. IET Intell. Transp. Syst. 2012, 6, 29–35. [Google Scholar] [CrossRef]
  20. Wang, S.; Li, Y.; Shao, C.; Wang, P.; Wang, A.; Zhuge, C. An adaptive spatio-temporal graph recurrent network for short-term electric vehicle charging demand prediction. Appl. Energy 2025, 383, 125320. [Google Scholar] [CrossRef]
  21. Qi, C.; Zhu, Y.; Song, C.; Yan, G.; Xiao, F.; Zhang, X.; Cao, J.; Song, S. Hierarchical reinforcement learning based energy management strategy for hybrid electric vehicle. Energy 2022, 238, 121703. [Google Scholar] [CrossRef]
  22. Guo, K.; Tian, D.; Hu, Y.; Sun, Y.; Qian, Z.; Zhou, J.; Gao, J.; Yin, B. Contrastive learning for traffic flow forecasting based on multi graph convolution network. IET Intell. Transp. Syst. 2024, 18, 290–301. [Google Scholar] [CrossRef]
  23. Jin, G.; Liang, Y.; Fang, Y.; Shao, Z.; Huang, J.; Zhang, J.; Zheng, Y. Spatio-temporal graph neural networks for predictive learning in urban computing: A survey. IEEE Trans. Knowl. Data Eng. 2023, 36, 5388–5408. [Google Scholar] [CrossRef]
  24. Qu, H.; Kuang, H.; Wang, Q.; Li, J.; You, L. A physics-informed and attention-based graph learning approach for regional electric vehicle charging demand prediction. IEEE Trans. Intell. Transp. Syst. 2024, 25, 14284–14297. [Google Scholar] [CrossRef]
  25. Sutton, R.S.; Barto, A.G. Reinforcement Learning: An Introduction; MIT Press: Cambridge, MA, USA, 1998; Volume 1, pp. 9–11. [Google Scholar]
  26. Haarnoja, T.; Zhou, A.; Abbeel, P.; Levine, S. Soft actor-critic: Off-policy maximum entropy deep reinforcement learning with a stochastic actor. In Proceedings of the 2018 International Conference on Machine Learning, Stockholm, Sweden, 10–15 July 2018; pp. 1861–1870. [Google Scholar]
  27. Chen, T.; Kornblith, S.; Norouzi, M.; Hinton, G. A simple framework for contrastive learning of visual representations. In Proceedings of the 2020 International Conference on Machine Learning, Online, 12–18 July 2020; pp. 1597–1607. [Google Scholar]
  28. He, K.; Fan, H.; Wu, Y.; Xie, S.; Girshick, R. Momentum contrast for unsupervised visual representation learning. In Proceedings of the 2020 IEEE/CVF Conference on Computer Vision and Pattern Recognition, Seattle, WA, USA, 13–19 June 2020; pp. 9729–9738. [Google Scholar]
  29. Veličković, P.; Cucurull, G.; Casanova, A.; Romero, A.; Liò, P.; Bengio, Y. Graph Attention Networks. In Proceedings of the 2018 International Conference on Learning Representations, Vancouver, BC, USA, 30 April–3 May 2018. [Google Scholar]
  30. Fujimoto, S.; Hoof, H.; Meger, D. Addressing function approximation error in actor-critic methods. In Proceedings of the 2018 International Conference on Machine Learning, Stockholm, Sweden, 10–15 July 2018; pp. 1587–1596. [Google Scholar]
Figure 1. Overall architecture of the proposed energy consumption optimization framework, integrating driving scenario recognition, environmental context modeling, and hierarchical reinforcement learning for real-time energy management. The thick arrow here indicates that this is an optimization loop that continuously adjusts vehicle control through feedback.
Symmetry 17 00930 g001
Figure 2. Energy consumption reduction achieved by different methods across various driving scenarios. Our proposed approach consistently outperforms baseline methods, especially in urban environments.
Symmetry 17 00930 g002
Figure 3. Distribution of prediction errors across different energy consumption levels. Our method maintains consistent accuracy across the range, while the baseline methods show increased errors at higher consumption levels.
Symmetry 17 00930 g003
Figure 4. Comparison of driver comfort score (DCS) across different methods. Our approach maintains high driver comfort while achieving superior energy efficiency.
Symmetry 17 00930 g004
Figure 5. Energy consumption profiles for a 35 km mixed driving route. Our method (in red) shows smoother energy usage patterns compared to the best baseline method (in blue).
Symmetry 17 00930 g005
Figure 6. Real-time adaptation of energy optimization strategies during urban driving. (a) Environmental context changes: traffic density, road gradient, and speed profile. (b) GAT attention weights, showing dynamic focus on relevant environmental factors. (c) Optimization strategy selection by high-level policy. (d) Energy consumption comparison with and without adaptive optimization.
Symmetry 17 00930 g006
Figure 7. Temporal evolution of GAT attention weights across environmental factors during urban driving. Each row represents a different environmental factor (traffic density, road gradient, speed limit, weather conditions, and time of day), and columns represent time steps. Color intensity indicates attention weight magnitude.
Symmetry 17 00930 g007
Table 1. Comparison of average energy reduction across different methods. The bold here indicates the best performance.
MethodAvg. Energy Reduction (%)Relative Improvement (%)
GCN [20]15.15
LSTM-Attention [6]14.40
DQN [7]15.93
SAC [21]16.90
Ours17.302.37
Table 2. Comparison of achieved performance with theoretical efficiency limits.
Driving ScenarioTheoretical Max (%)Achieved (%)Efficiency RatioLimiting Factors
Urban stop-and-go35–4021.40.61Battery charging rate, prediction accuracy
Highway cruising15–2018.70.94Aerodynamic constraints, traffic flow
Mixed driving25–3019.20.67Scenario transition losses
Uphill climbing10–1215.9-Physical limit exceeded
Average21.3–25.517.30.73Multi-factor constraints
Table 3. Prediction accuracy comparison across methods. The bold here indicates the best performance.
MethodMAE (kWh)RMSE (kWh)R2
GCN [20]0.610.790.874
LSTM-Attention [6]0.580.760.885
DQN [7]0.530.700.904
SAC [21]0.480.630.921
Ours0.420.580.937
Table 4. Component-level ablation study results.
Model ConfigurationEnergy Reduction (%)MAE (kWh)
Full Model (Ours)17.30.42
w/o Contrastive Learning14.20.55
w/o Graph Attention Networks13.70.59
w/o Hierarchical RL (Flat RL)11.90.61
Table 5. GAT configuration impact on energy optimization performance.
ConfigurationEnergy Reduction (%)MAE (kWh)Context R2
Attention Heads (3 layers)
2 heads15.10.520.871
4 heads16.20.470.895
8 heads (ours)17.30.420.904
12 heads17.10.430.901
16 heads16.80.450.897
Layer Depth (8 heads)
1 layer14.80.560.863
2 layers16.50.480.887
3 layers (ours)17.30.420.904
4 layers17.00.440.899
5 layers16.70.460.893
Table 6. Contrastive learning parameter sensitivity analysis.
Parameter ConfigurationEnergy Reduction (%)Scenario Accuracy (%)Silhouette Score
Temperature Parameter τ
τ = 0.0115.887.20.61
τ = 0.0516.791.50.68
τ = 0.07 (ours)17.393.80.72
τ = 0.116.992.10.69
τ = 0.215.488.60.64
Augmentation Strategy
Gaussian noise only15.989.30.65
Temporal shifting only16.190.10.67
Feature masking only15.788.80.63
Noise + Shifting16.892.40.70
Full augmentation (ours)17.393.80.72
Table 7. Comparison of graph neural network approaches for environmental context modeling.
MethodSilhouette ScoreAttention EntropyContext R2
Simple Graph Conv.0.49-0.821
GCN0.52-0.845
GAT (4 heads)0.632.10.882
GAT (8 heads, ours)0.682.30.904
GAT (16 heads)0.652.40.897
Disclaimer/Publisher’s Note: The statements, opinions and data contained in all publications are solely those of the individual author(s) and contributor(s) and not of MDPI and/or the editor(s). MDPI and/or the editor(s) disclaim responsibility for any injury to people or property resulting from any ideas, methods, instructions or products referred to in the content.

