Abstract
Molecular property prediction, as one of the important tasks in cheminformatics, is attracting more and more attention. The structure of a molecule is closely related to its properties, and a symmetrical molecular structure may differ significantly from an asymmetrical structure in terms of properties, such as the melting point, boiling point, water solubility, and so on. However, a single molecular representation does not provide a better overall representation of the molecule. And, it is also a challenge to better use graph neural networks to aggregate the information of neighboring nodes in the molecular graph. So, in this paper, we constructed a novel graph neural network with additive attention (termed Add-GNN) for molecular property prediction, which fuses the molecular graph and molecular descriptors to jointly represent molecular features in order to make the molecular representations more comprehensive. Then, in the message-passing stage, we designed an additive attention mechanism that can effectively fuse the features of neighboring nodes and the features of edges to better capture the intrinsic information of molecules. In addition, we applied L2-norm to calculate the importance of each atom to the predicted results and visualized it, providing interpretability to the model. We validated the proposed model on public datasets and showed that the model outperforms graph-based baseline methods and some graph neural network variants, proving that our proposed method is feasible and competitive.
1. Introduction
In bioinformatics, chemoinformatics, and drug discovery, predicting molecular activity accurately, such as water solubility, is very meaningful work. However, the structure of molecules is often more complex, the types of molecules are very rich, and sometimes the sample size is more limited, so this task becomes very difficult. Drug research and discovery is a long cycle and high-cost process, and the marketing of new drugs often requires a large amount of human and material resources. Traditional methods are usually carried out in the laboratory, and although the experimental results are accurate, they are often time-consuming and costly. If the properties of molecules can be accurately predicted at the early stage, potential molecules can be screened out beforehand and unnecessary experiments can be reduced, which can save costs and improve efficiency [,,]. The symmetry of a molecule is closely related to the properties of the molecule, and in general, symmetrical molecules have lower solubility than molecules with a similar structure but lower symmetry. For example, benzene is a symmetrically structured molecule that is slightly soluble in water []. For example, if the water solubility of a compound molecule is found to be relatively poor at an early stage using a molecular property prediction model, we can conduct targeted experiments to validate these compounds. If it is indeed poor, then further research and development can be avoided, thus saving time and resources. Therefore, predicting the ADMET (absorption, distribution, metabolism, excretion, and toxicity) of drug molecules is crucial for drug discovery [].
The prediction of molecular properties helps us to analyze which structures in the molecule have an effect on activity and to study the relationships between the structures of the subsequent molecules and activity [,]. For example, in prediction, if it is found that a certain activity of a certain class of drug molecules is very strong, it can explore whether these drug molecules have similar structures and then design new compounds with higher activity. Conversely, if the predicted activity of the drug molecule is found to be less than ideal, it can be imagined that the key structure of the molecule can be modified with substituents to enhance its activity. The quantitative structure–activity relationship (QSAR) [] is a method for predicting molecular properties by establishing a quantitative mathematical model of a compound’s chemical structure between its biological activity or physicochemical properties. Based on extensive experimental data, it uses statistical and mathematical methods to reveal the intrinsic quantitative relationship between molecular structural characteristics and activity [,,]. QSAR methods have already been an essential tool in drug discovery to reliably evaluate the physicochemical and biological properties of compounds [].
The rapid development of artificial intelligence is accelerating the development of chemoinformatics. Machine learning and deep learning are commonly used QSAR modeling methods []. The early prediction of molecular properties generally relied on traditional machine learning algorithms (Support Vector Machine (SVM) [], K-Nearest Neighbor (KNN) [], Random Forest (RF) [], etc.), using molecular descriptors or molecular fingerprints to describe molecules, to establish the model between the characteristics and properties of molecules. However, molecular descriptors and fingerprints may not fully describe the complexity and diversity of molecular structures, resulting in poor predictive results of molecular properties. With the quick progression of artificial intelligence, deep learning has gradually become a powerful tool in molecular property prediction. Deep learning can automatically learn features from molecular data, avoiding the single feature representation of previous molecular descriptors [,,,]. Convolutional neural networks (CNNs) [] are excellent at processing data with a grid structure and are applied to the analysis of molecular images or crystal structures. Recurrent neural networks (RNNs) [] and their variants, such as long short-term memory (LSTM) networks [], and gated recurrent units (GRUs) [,], are capable of processing sequence data and are suitable for modeling sequence information about molecules.
The proposal of graph neural networks (GNNs) has brought a breakthrough in molecular property prediction and a wider application prospect [,], such as the Graph Convolutional Network (GCN) [], Graph Attention Network (GAT) [], message-passing neural network (MPNN) [], Graph Isomorphism Network (GIN) [], GraphSAGE [], and Directed MPNN (D-MPNN) []. Since the molecular structure itself is a graph structure, with atoms in the molecule as nodes and chemical bonds as edges, the GNN is able to process these data efficiently []. The GNN can automatically learn the hidden patterns and rules in the molecular structure. Through the message-passing mechanism, the GNN can easily capture the complex information in the molecule. Through the multi-layer graph neural network structure, the nodes constantly learn and update their feature representation to obtain the global feature vector that can represent the entire molecule, so as to accurately predict the molecular structure [].
Although the GNN has made a lot of achievements, there are still some problems that need to be further studied. Firstly, the representation of the molecular structure is a key problem, and how to describe the information of nodes and edges in molecules can be further studied. Second, graph-based molecular representations are obtained by the automatic learning of the GNN, but graph representations may fail to learn robust graph representations when faced with small datasets []. Therefore, it is necessary to consider various feature information comprehensively to increase the accuracy of prediction. Furthermore, the interpretability of the model is also an essential problem []. In practical applications, it is not enough just to give the prediction results but also to be able to explain how the model makes its decisions and which molecular structural features have an important impact on the prediction results. This is important for understanding the relationship between the molecular structure and properties and for guiding the design of experiments.
So, in this paper, we proposed a GNN model with additive attention (Add-GNN). Molecular graphs can effectively mine the structural information in molecules, while molecular descriptors can more comprehensively represent molecules in various aspects, such as the physical structure, chemical structure, and topological structure [,]. By combining them, we can represent the molecules more comprehensively and increase the accuracy of molecular property prediction. Second, in the message-passing phase, we designed an additive attention mechanism to better fuse the information of neighboring nodes and edges. We know that in a molecular graph, each node is connected to its neighbors through edges, so neighboring nodes and edges also carry a large amount of useful information. By fusing them, we can capture the hidden structural information in molecules more fully and strengthen the representation of molecules. Finally, we applied the L2-norm to calculate the importance of the predictions for each atom in each molecular graph and then defined different colors for visualization according to the importance level. In order to clarify how the model works, interpreting the model is also an important task. By using the L2-norm to calculate and visualize the contribution of each atom to the predicted results, we are able to clearly see which atoms play an essential role in influencing molecular properties. This interpretable approach is important for the practical application of molecular property prediction models. It can help chemists and drug developers to better understand model predictions, identify key molecular structures, and develop new drugs.
The contributions of this paper are as follows:
- A molecular property prediction model is proposed, and molecular graphs and molecular descriptors are fused to represent molecules.
- In the message-passing stage, an additive attention mechanism is designed, which can ideally fuse the features of neighboring nodes and edges.
- The L2-norm is applied to visualize the importance of each atom in a molecular graph.
2. Related Work
In this section, we provide a brief overview of the relevant literature based on existing molecular representation methods and then point out the superiority of our approach.
2.1. Descriptor-Based Prediction of Molecular Properties
In the early days, molecules were generally represented using molecular descriptors, which were combined with machine learning for molecular property prediction. A molecular descriptor is a numerical representation of a molecular structure, which serves to convert molecular structure information into easily computed information [], such as RDKit (https://www.rdkit.org/, accessed on 14 September 2024) descriptors, Mordred descriptors [], PaDEL Descriptors [], MACCS fingerprints [], ECFP fingerprints [], etc. Wang and Wang [] constructed a predictive model for predicting environmental toxicity using the PaDEL-Descriptor-based KNN model, which evaluates the environmental risk through the acute toxicity of compounds to the fathead minnow. They also discussed the evaluation methods, application domains, and mechanistic explanations of the model. Tang et al. [] used the PaDEL-Descriptor software to generate 12 fingerprints of chemical structures, combined with a machine learning algorithm to build a QSAR model for distinguishing between chemicals capable of inhibiting mitochondrial fusion and fission, respectively. Liu et al. [] utilized a machine learning algorithm and molecular fingerprints to predict the Blood–Brain Barrier (BBB) from 1757 chemicals. The results show that the Random Forest algorithm based on MACCS fingerprints achieves the best prediction performance and shows good performance in external validation. Choi et al. [] employed the SVM based on FCFP fingerprints for the prediction of early hERG channel activity.
2.2. SMILES-Based Prediction of Molecular Properties
The Simplified Molecular Input Line Entry System (SMILES) [], a method for representing molecular structures by means of character strings, is commonly utilized in the fields of chemoinformatics due to its advantages of simplicity and ease of computer processing. Since the SMILES is relatively similar to natural language, some natural language processing (NLP) models have been able to encode useful features of molecules from the complex structure of SMILES strings for molecular property prediction [,,,]. Jiang et al. [] proposed the TranGRU approach, which used SMILES as the input to obtain embedding through a series of operations, and then inputted embedding into the original transformer encoder of the integrated bi-directional gated recurrent unit (BiGRU) and combined it with a self-attention mechanism. Lin et al. [] proposed a Smi2Vec-BiGRU method for learning atoms and solving single-task and multi-task binary classification problems in drug discovery. The experimental results show that compared to the state-of-the-art graph-structured methods, their method can achieve competitive performance. Hou et al. [] proposed a deep learning architecture, which exploits the advantages of the long short-term memory network (LSTM) in sequence processing and uses the Bayesian optimization method to further improve the model.
2.3. Graph-Based Prediction of Molecular Properties
Graphs are a more straightforward structure that can store and represent most structural information []. Xiong et al. [] presented a new graph neural network architecture for molecular representation called Attentive FP, which uses graph attention mechanisms to learn from relevant drug discovery datasets. Zhu et al. [] proposed an elaborate framework of hierarchical information graph neural networks (called HiGNNs) to predict molecular properties by learning and back-synthesizing chemically synthesizable breaks in interesting chemical substructure fragments by utilizing synergistic representations of molecular graphs. Liu et al. [] proposed an atom-bond transformer-based message-passing neural network (ABT-MPNN) for improving the molecular representation embedding process for molecular property prediction. Zheng et al. [] proposed the new EMPPNet method, which utilizes cross-modal information flow to capture molecular features at different granularities. The model combined a hierarchical attention mechanism for complete interactive multimodal information encoding.
Although a great deal of work has been conducted in the above literature, there is still some work that needs to be further researched. For example, how to better fuse the features of neighboring nodes and edges in the message-passing process of graph neural networks can be further investigated. Our approach fuses the features of both well through the attention mechanism to better represent molecules. In addition, we fuse and RDKit molecular descriptors for a more comprehensive representation of molecules. In addition, for model interpretation, we apply the L2-norm, which, to the best of our knowledge, has little application in the molecular property prediction task.
3. Materials and Methodology
3.1. Problem Statement
A molecule can be represented quite intuitively as a molecular graph, where each atom represents a node and each edge represents a chemical bond between atoms. A molecular graph can be formally defined as G = (V, E), where V is the set of nodes v and E is the set of edges e. An edge is defined as e = (v, w), where v and w are neighboring nodes and w belongs to N(v) []. The core idea of a graph neural network is to learn a mapping function, →, mapping is the process of representing the various pieces of information in a molecule and translating them into a language that a computer can process, which aggregates a node v’s own features with those of all of its neighbors to learn a representation vector for node v [].
The message-passing neural network (MPNN) was proposed by Gilmer et al. [], where the authors state that a model that can be applied to the task of molecular property prediction can learn the features of a molecule directly from the molecular graph and is not affected by graph isomorphism. The forward pass has two phases, a message-passing phase and a readout phase. In the message-passing process, the message function is defined as M and the vertex update function is defined as U; they are calculated by Equations (1) and (2).
where t is the time step of the run, is the hidden state of node v at time step t; at the beginning, is the initial feature of node v, and is the bond features. is the message at time step , and is the neighbor of node v in the graph.
The readout phase computes the feature vectors of the whole graph through the function R, defined as Equation (3).
3.2. Add-GNN for Molecular Graph Encoding
3.2.1. Additive Attention
In this subsection, we construct a novel MPNN inspired by Zhu et al. [], and we redefine and implement the mathematical model of the message-passing phase []. In the message function M, we design an additive attention mechanism to better aggregate the features of neighboring nodes and edges as shown in Equations (4)–(6).
where W is a learnable weight matrix and , d is the number of output channels, and is the number of heads. and are the activation function, and is the element-by-element maxima for neighbor node features and edge features. Then, and are dimensionally split according to heads to obtain and . Finally, they are multiplied element by element to obtain , is the result of applying additive attention to aggregate neighboring nodes and edges.
3.2.2. Message-Passing Phase and Readout Phase
As described in the above subsection, by aggregating the features of neighboring nodes and edges, after an activation function, we obtain an attention weight. After a series of transformations, it is multiplied with the value to obtain the message . And, our message function M is defined as Equation (7).
where is the generated message, after generating the message, the neighbor node information is aggregated by adding the aggregator function.
After the message function and the aggregation function, we apply to update them and obtain the updated messages. The message update function U is defined as Equation (8).
where is the activation function.
In the readout phase, we use summation as the final readout function, inputting the final representation of each node after T time steps to obtain a representation of the molecule. The readout function is defined as Equation (9).
where denotes the feature representation of the whole graph G obtained by the readout operation. is the feature vector of node v in the graph G, which combines the initial features of the node itself and the information passed from the neighboring nodes. is a Multi-Layer Perceptron consisting of multiple linear layers and . And, we finally performed the summation operation on all nodes in the graph G.
3.3. Atomic and Bond Features
The inputs to the graph neural network are features of atoms and features of edges, so we first define them. We define 34 features of atoms and 10 features of edges, most of which are encoded in a one-hot approach. Table 1 shows the atomic features, partially collected from Zhu et al. []. Table 2 shows the features of the bond, collected from Xiong et al. []. The features defined above are used in all the comparative models in the later sections.

Table 1.
Atomic features in Add-GNN.
Table 2.
Bond features in Add-GNN.
3.4. Molecular Descriptors
In order to make the representation of the graph more comprehensive, we introduce molecular descriptors and calculated RDKit molecular descriptors using the RDKit []. After the descriptors are calculated, due to their distribution being uneven and fluctuating greatly, in order to improve the generalization ability and convergence speed of the model, inspired by the literature Wu et al. [], we use Z-score to normalize the descriptors, the specific operation is as follows. First, the mean of all descriptors is calculated as shown in Equation (10), where the number of descriptors is H, and is the descriptor. Next, the standard deviation is calculated using Equation (11), and finally, the Z-score normalized descriptor is obtained using Equation (12).
In the model, we concatenate the graph representation , and RDKit descriptors jointly represent the molecule. The final molecular representation is defined as Equation (13).
3.5. Loss Function
The loss function is very important and it can effectively help in training and optimizing the model. Given the final prediction and the true value y, the training objective is to minimize the loss function. In our GNN model for molecular property prediction, we use the mean squared error (MSE) as the loss function, it is defined as Equation (14).
For the classification task, we use the binary cross entropy (BCE) loss to evaluate the difference between predicted and true values, it is defined as Equation (15).
where J is the batch size.
3.6. Overview of Add-GNN Network
Figure 1 shows the structure of Add-GNN, from which it can be seen that for the input molecules, there are two channels. The first channel computes molecular descriptors for it, then normalizes, and finally obtains the descriptor features. The second channel is to input the information of the molecular map into the Add-GNN layer, including the message passing and readout phases. In the message-passing phase, additive attention is applied to better fuse the features of neighboring nodes and edges. After obtaining the molecular representations of the two channels, we concatenate them to obtain the final molecular representation , which is inputted into the fully connected layer to obtain the final prediction. Algorithm 1 is the pseudo-code for the Add-GNN framework. In Algorithm 1, we explain it in two passages: the first one is the molecular graph representation method, the second one is the molecular descriptor representation method, and finally, the two representation methods are fused.
| Algorithm 1: The pseudo-code of the proposed Add-GNN |
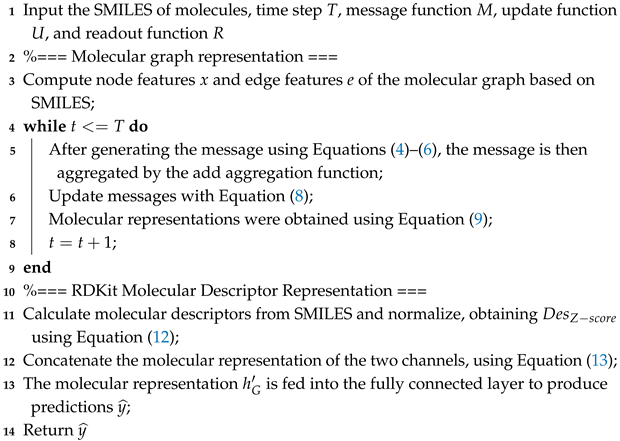 |
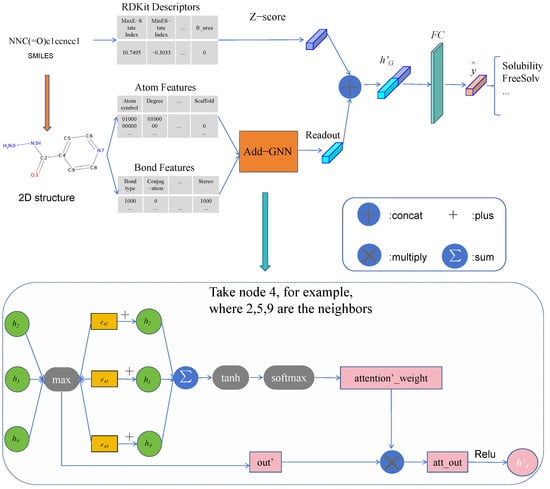
Figure 1.
Architecture of Add-GNN.
4. Experiments
4.1. Benchmark Datasets
To more comprehensively evaluate the performance of Add-GNN, we collected 10 datasets from MoleculeNet [], ADMENT (drug-discovery-related datasets) [], and cell-based phenotypic screening datasets []. Table 3 is the summary of 10 benchmark datasets in this work. There are classification problems and regression problems in these datasets. The datasets used are small datasets with a minimum data size of 168, this is because in actual drug development, sometimes the amount of data tends to be limited and it is costly to obtain a large amount of data, using a small sample of data is more in line with the actual situation.
Table 3.
Summary of 10 benchmark datasets in this work.
4.2. Hyperparameter Optimization
In this study, we implement Add-GNN with PyTorch [] and the PyTorch geometric library [], the Hyperopt Python package [] was used to conduct the Bayesian optimization of the hyperparameters. The hyperparameters we want to optimize are the number of heads in the additive attention mechanism, the number of Add-GNN layers, the dropout rate of the GNN, the learning rate of the model, the weight decay factor, the number of channels in the hidden layer, and the batch size during training. Table 4 shows the summary of the hyperparameters used in the Add-GNN model.
Table 4.
Summary of hyperparameters used in the Add-GNN model.
4.3. Performance of the Add-GNN Network Architecture
As can be seen in Table 3, our dataset is divided into classification and regression problems. For classification problems, we use the area under the receiver operating characteristic curve (ROC-AUC) to evaluate the performance of the model, and for regression problems, we use the root-mean-square error (RMSE) to evaluate the performance of the model. We compare a graph-based baseline approach (GCN [], GAT [], and GIN []) and two state-of-the-art methods (Meta-MGNN [] and TrimNet []) to validate the performance of Add-GNN. In our experiments, all the datasets are randomly split into training, validation, and test sets with a split ratio of 8:1:1. We evaluate Add-GNN with five different random seeds and use the average of the five results as the final result, all results are after hyperparameter optimization.
Table 5 shows the results of all the models on the ten datasets, with the mean and standard deviation of the five random seeds used to represent the final results. The smaller the standard deviation, the better the stability of the model and the better the ranking, when the mean of both models is the same. From the table, we can see that Add-GNN performs well on most of the datasets, such as BACE, ESOL, and PDBbind-C, and on the other datasets, although it is not ranked first, it still achieves a top ranking, which shows the good performance of Add-GNN. We can also see from the table that Add-GNN performs better on the regression dataset, which is due to the fact that we added molecular descriptor features, and performs averagely on the classification dataset, probably because molecular descriptors are more suitable for regression problems, and we will investigate Add-GNN fusing molecular fingerprinting features to deal with classification problems in the future step. Despite this, Add-GNN still achieved first place in the overall ranking.
Table 5.
Predictive performance results of all models on 10 public datasets.
To show the results of the models more clearly, in Figure 2, we plot the heatmaps of all models on the classification dataset. The darker the color of the square corresponding to each model, the better the performance of the model, as can be seen from the figure, Add-GNN achieves better performance on most of the datasets.
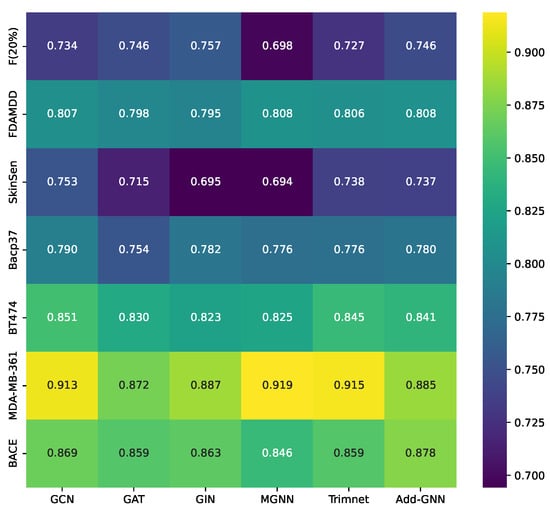
Figure 2.
Performance of all models on classification datasets.
Figure 3a–c are boxplots of the performance of all models on the regression dataset. It is clear from the figure that the median of Add-GNN is smaller, indicating better performance of Add-GNN. In addition, the smaller box length of Add-GNN indicates that the number distribution is more uniform and there are no outliers, which further indicates the excellent performance of Add-GNN. Figure 3d is a radar plot of all model rankings, from which it can be seen that the Add-GNN enclosure has the smallest area, indicating that Add-GNN is competitively ranked on almost all datasets.
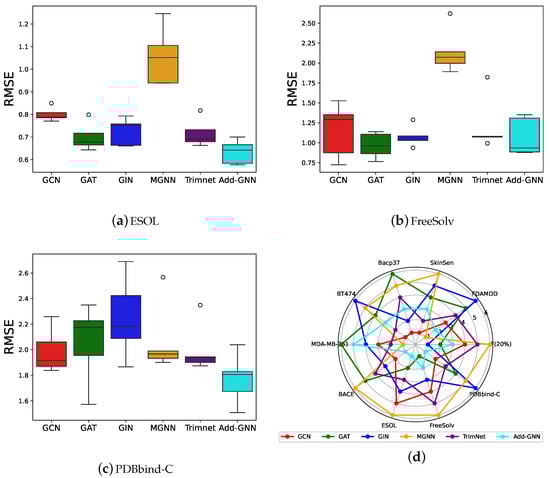
Figure 3.
(a–c): Boxplots of all comparison algorithms on the regression dataset. (d): Radar plot of all model rankings.
Figure 4 shows the histogram results for all models on the classification and regression datasets, respectively. As can be seen from the figure, Add-GNN performs well on most of the datasets, especially on the regression dataset, where the excellent performance of Add-GNN can be clearly seen, indicating that Add-GNN has a better performance in dealing with regression problems.
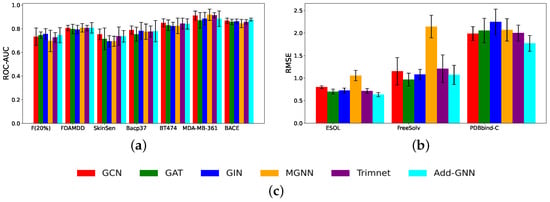
Figure 4.
(a) The performance results for seven classification datasets; (b) the performance results for three regression datasets; (c) legend.
4.4. Ablation Experiment
Since Add-GNN achieved a better ranking on the regression problem, in order to verify whether it is the molecular descriptor representation that plays a key role, experiments on the ablation of molecular descriptors on the regression dataset are performed in this section. A single molecular graph representation method may not be able to fully represent a molecule, and molecular descriptors contain many global features in a molecule. In order to validate the effect of molecular descriptors on Add-GNN, we validated it on three regression datasets, and the results are shown in Table 6, for the same dataset, the Add-GNN model with and without descriptors uses the same parameters. As in the previous subsection, five random seeds are used and the average of the final results is taken. As can be seen from the table, the performance of the model is greatly improved with the addition of descriptors, which can illustrate the impact of descriptors.
Table 6.
The effect of molecular descriptors on the Add-GNN on three regression datasets.
Figure 5 demonstrates the effect of adding molecular descriptors on model performance. As can be seen from Figure 5a–c, the median of the violin plots is smaller and the width is narrower after the addition of the molecular descriptor, indicating that descriptors significantly improve model performance. From Figure 5d, it can be seen more clearly that the root-mean-square error of the model ground is smaller after the addition of the molecular descriptor, which again shows that the molecular descriptor is crucial to the performance improvement of the model.
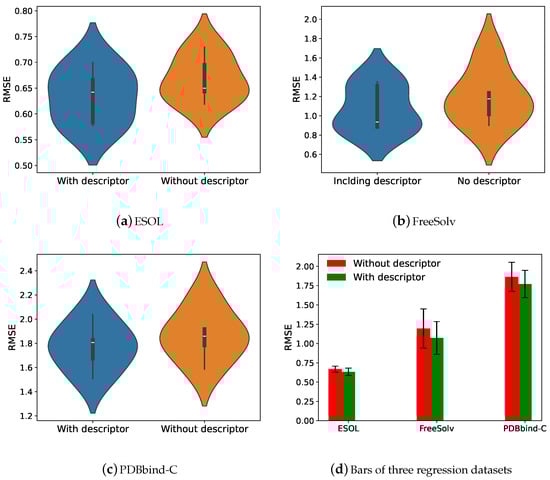
Figure 5.
(a–c): The violin plots of Add-GNN (without descriptor and with descriptor) on three regression datasets. (d): Comparison of Add-GNN with and without descriptors on three regression datasets.
4.5. Interpretation of Add-GNN
The performance of the model is important, and also the interpretability of the model is equally important. Deep learning models are often viewed as a black box, and in practice, we need to know not only the predictions of the model but also which structures in the molecule have influenced the model’s results []. In this paper, inspired by Zhang et al. [], we compute the L2-norm of each atomic feature as an importance score. We used the ESOL water solubility dataset to analyze the interpretability of Add-GNN.
As shown in Figure 6, the darker-colored atoms in the molecule indicate a greater contribution to the predicted results. Figure 6a,b are two kinds of compounds that are easily soluble in water. For Figure 6a, the molecule contains an amide structure consisting of a carbonyl group (C=O) and a nitrogen atom, which gives the molecule a certain polarity, but its polarity is relatively not particularly strong, and the amide structure can form a certain hydrogen bonding interaction with water molecules [], so the substance has a certain degree of water solubility. Figure 6b contains hydrophilic groups such as hydroxyl (-OH) [], so it has better water solubility, and hydroxyl (-OH) can be seen as a darker color in the figure, showing that it plays a key role in water solubility.
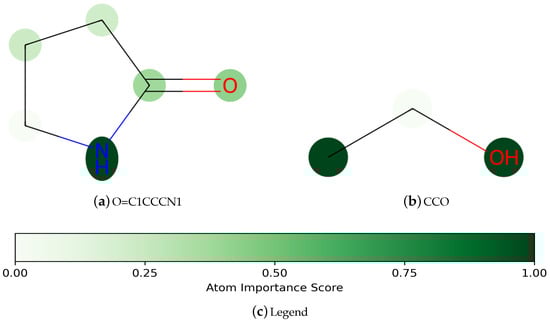
Figure 6.
Visualization of the importance of atoms in a molecule for prediction.
5. Conclusions and Future Work
In this paper, we proposed a dual-representation fusion molecular property prediction method called Add-GNN, which fuses the molecular graph and the molecular descriptor features for a more complete representation of molecules. In the molecular graph representation, we designed a graph neural network with additive attention, which can well fuse the features of neighboring nodes and edge nodes. In ten publicly available datasets, our model outperforms some graph-based baseline methods and some state-of-the-art models. Despite the small size of the datasets, Add-GNN demonstrated strong performance in learning the molecular representation using limited data, perfectly solving the molecular property prediction problem. In the ablation experiments, we verified the effect of molecular descriptors on the model, and it can be seen that the descriptors are helpful to the performance of the model. In addition, to explore how the model works, we investigated the interpretability of the model and analyzed the atoms in the model that had a significant impact on the predicted results.
In the future, we will explore more methods of molecular representation and explore multimodal approaches to molecular representation. In the graph neural network design, we will further study the more efficient message-passing mechanism. In terms of model interpretation, we will investigate the importance of edges in molecules in property prediction.
Author Contributions
R.Z.: methodology, investigation, data curation, software, and writing—original draft. Y.Z.: methodology, resources, formal analysis, and supervision. K.H.: methodology and software. H.L.: formal analysis and resources. All authors have read and agreed to the published version of this manuscript.
Funding
This research received no funding.
Data Availability Statement
The data will be made available on request from corresponding author.
Conflicts of Interest
The authors declare that they have no conflicts of interest.
References
- Liu, C.; Sun, Y.; Davis, R.; Cardona, S.T.; Hu, P. ABT-MPNN: An atom-bond transformer-based message-passing neural network for molecular property prediction. J. Cheminform. 2023, 15, 29. [Google Scholar] [CrossRef] [PubMed]
- Stokes, J.M.; Yang, K.; Swanson, K.; Jin, W.; Cubillos-Ruiz, A.; Donghia, N.M.; MacNair, C.R.; French, S.; Carfrae, L.A.; Bloom-Ackermann, Z.; et al. A deep learning approach to antibiotic discovery. Cell 2020, 180, 688–702. [Google Scholar] [CrossRef] [PubMed]
- Mak, K.K.; Pichika, M.R. Artificial intelligence in drug development: Present status and future prospects. Drug Discov. Today 2019, 24, 773–780. [Google Scholar] [CrossRef] [PubMed]
- Pinal, R. Effect of molecular symmetry on melting temperature and solubility. Org. Biomol. Chem. 2004, 2, 2692–2699. [Google Scholar] [CrossRef]
- Cai, H.; Zhang, H.; Zhao, D.; Wu, J.; Wang, L. FP-GNN: A versatile deep learning architecture for enhanced molecular property prediction. Briefings Bioinform. 2022, 23, bbac408. [Google Scholar] [CrossRef]
- Iqbal, J.; Vogt, M.; Bajorath, J. Learning functional group chemistry from molecular images leads to accurate prediction of activity cliffs. Artif. Intell. Life Sci. 2021, 1, 100022. [Google Scholar] [CrossRef]
- Assad, H.; Kumar, A. Understanding functional group effect on corrosion inhibition efficiency of selected organic compounds. J. Mol. Liq. 2021, 344, 117755. [Google Scholar] [CrossRef]
- Hansch, C.; Fujita, T. p-σ-π Analysis. A Method for the Correlation of Biological Activity and Chemical Structure. J. Am. Chem. Soc. 1964, 86, 1616–1626. [Google Scholar] [CrossRef]
- Cherkasov, A.; Muratov, E.N.; Fourches, D.; Varnek, A.; Baskin, I.I.; Cronin, M.; Dearden, J.; Gramatica, P.; Martin, Y.C.; Todeschini, R.; et al. QSAR modeling: Where have you been? Where are you going to? J. Med. Chem. 2014, 57, 4977–5010. [Google Scholar] [CrossRef]
- Muratov, E.N.; Bajorath, J.; Sheridan, R.P.; Tetko, I.V.; Filimonov, D.; Poroikov, V.; Oprea, T.I.; Baskin, I.I.; Varnek, A.; Roitberg, A.; et al. QSAR without borders. Chem. Soc. Rev. 2020, 49, 3525–3564. [Google Scholar] [CrossRef]
- Wang, Y.; Chen, X. A joint optimization QSAR model of fathead minnow acute toxicity based on a radial basis function neural network and its consensus modeling. RSC Adv. 2020, 10, 21292–21308. [Google Scholar] [CrossRef] [PubMed]
- Wu, Z.; Jiang, D.; Hsieh, C.Y.; Chen, G.; Liao, B.; Cao, D.; Hou, T. Hyperbolic relational graph convolution networks plus: A simple but highly efficient QSAR-modeling method. Briefings Bioinform. 2021, 22, bbab112. [Google Scholar] [CrossRef] [PubMed]
- Li, B.; Lin, M.; Chen, T.; Wang, L. FG-BERT: A generalized and self-supervised functional group-based molecular representation learning framework for properties prediction. Briefings Bioinform. 2023, 24, bbad398. [Google Scholar] [CrossRef] [PubMed]
- Cortes, C.; Vapnik, V. Support-vector networks. Mach. Learn. 1995, 20, 273–297. [Google Scholar] [CrossRef]
- Guo, G.; Wang, H.; Bell, D.; Bi, Y.; Greer, K. KNN model-based approach in classification. In Proceedings of the On The Move to Meaningful Internet Systems 2003: CoopIS, DOA, and ODBASE: OTM Confederated International Conferences, CoopIS, DOA, and ODBASE 2003, Catania, Sicily, Italy, 3–7 November 2003; pp. 986–996. [Google Scholar]
- Breiman, L. Random forests. Mach. Learn. 2001, 45, 5–32. [Google Scholar] [CrossRef]
- Li, Z.; Jiang, M.; Wang, S.; Zhang, S. Deep learning methods for molecular representation and property prediction. Drug Discov. Today 2022, 27, 103373. [Google Scholar] [CrossRef]
- Walters, W.P.; Barzilay, R. Applications of deep learning in molecule generation and molecular property prediction. Accounts Chem. Res. 2020, 54, 263–270. [Google Scholar] [CrossRef]
- Wu, C.K.; Zhang, X.C.; Yang, Z.J.; Lu, A.P.; Hou, T.J.; Cao, D.S. Learning to SMILES: BAN-based strategies to improve latent representation learning from molecules. Briefings Bioinform. 2021, 22, bbab327. [Google Scholar] [CrossRef]
- Jiang, J.; Zhang, R.; Ma, J.; Liu, Y.; Yang, E.; Du, S.; Zhao, Z.; Yuan, Y. TranGRU: Focusing on both the local and global information of molecules for molecular property prediction. Appl. Intell. 2023, 53, 15246–15260. [Google Scholar] [CrossRef]
- Alzubaidi, L.; Zhang, J.; Humaidi, A.J.; Al-Dujaili, A.; Duan, Y.; Al-Shamma, O.; Santamaría, J.; Fadhel, M.A.; Al-Amidie, M.; Farhan, L. Review of deep learning: Concepts, CNN architectures, challenges, applications, future directions. J. Big Data 2021, 8, 53. [Google Scholar] [CrossRef]
- Dhruv, P.; Naskar, S. Image classification using convolutional neural network (CNN) and recurrent neural network (RNN): A review. In Machine Learning and Information Processing: Proceedings of ICMLIP 2019; Springer: Singapore, 2020; pp. 367–381. [Google Scholar]
- Sherstinsky, A. Fundamentals of recurrent neural network (RNN) and long short-term memory (LSTM) network. Phys. D Nonlinear Phenom. 2020, 404, 132306. [Google Scholar] [CrossRef]
- Lin, X.; Quan, Z.; Wang, Z.J.; Huang, H.; Zeng, X. A novel molecular representation with BiGRU neural networks for learning atom. Briefings Bioinform. 2020, 21, 2099–2111. [Google Scholar] [CrossRef] [PubMed]
- Wang, S.; Li, Z.; Zhang, S.; Jiang, M.; Wang, X.; Wei, Z. Molecular property prediction based on a multichannel substructure graph. IEEE Access 2020, 8, 18601–18614. [Google Scholar] [CrossRef]
- Rathi, P.C.; Ludlow, R.F.; Verdonk, M.L. Practical high-quality electrostatic potential surfaces for drug discovery using a graph-convolutional deep neural network. J. Med. Chem. 2019, 63, 8778–8790. [Google Scholar] [CrossRef]
- Withnall, M.; Lindelöf, E.; Engkvist, O.; Chen, H. Building attention and edge message passing neural networks for bioactivity and physical–chemical property prediction. J. Cheminform. 2020, 12, 1. [Google Scholar] [CrossRef]
- Kipf, T.N.; Welling, M. Semi-supervised classification with graph convolutional networks. arXiv 2016, arXiv:1609.02907. [Google Scholar]
- Veličković, P.; Cucurull, G.; Casanova, A.; Romero, A.; Lio, P.; Bengio, Y. Graph attention networks. arXiv 2017, arXiv:1710.10903. [Google Scholar]
- Gilmer, J.; Schoenholz, S.S.; Riley, P.F.; Vinyals, O.; Dahl, G.E. Neural message passing for quantum chemistry. In Proceedings of the International Conference on Machine Learning, Sydney, Australia, 6–11 August 2017; PMLR: New York, NY, USA, 2017; pp. 1263–1272. [Google Scholar]
- Xu, K.; Hu, W.; Leskovec, J.; Jegelka, S. How powerful are graph neural networks? arXiv 2018, arXiv:1810.00826. [Google Scholar]
- Hamilton, W.; Ying, Z.; Leskovec, J. Inductive representation learning on large graphs. Adv. Neural Inf. Process. Syst. 2017, 30. [Google Scholar]
- Yang, K.; Swanson, K.; Jin, W.; Coley, C.; Eiden, P.; Gao, H.; Guzman-Perez, A.; Hopper, T.; Kelley, B.; Mathea, M.; et al. Analyzing learned molecular representations for property prediction. J. Chem. Inf. Model. 2019, 59, 3370–3388. [Google Scholar] [CrossRef]
- Torres, L.H.; Ribeiro, B.; Arrais, J.P. Few-shot learning with transformers via graph embeddings for molecular property prediction. Expert Syst. Appl. 2023, 225, 120005. [Google Scholar] [CrossRef]
- Kearnes, S.; McCloskey, K.; Berndl, M.; Pande, V.; Riley, P. Molecular graph convolutions: Moving beyond fingerprints. J. Comput.-Aided Mol. Des. 2016, 30, 595–608. [Google Scholar] [CrossRef] [PubMed]
- Harren, T.; Matter, H.; Hessler, G.; Rarey, M.; Grebner, C. Interpretation of structure–activity relationships in real-world drug design data sets using explainable artificial intelligence. J. Chem. Inf. Model. 2022, 62, 447–462. [Google Scholar] [CrossRef] [PubMed]
- Mauri, A. alvaDesc: A tool to calculate and analyze molecular descriptors and fingerprints. In Ecotoxicological QSARs; Humana: New York, NY, USA, 2020; pp. 801–820. [Google Scholar]
- Consonni, V.; Todeschini, R. Molecular descriptors. In Recent Advances in QSAR Studies: Methods and Applications; Springer: Dordrecht, The Netherlands, 2010; pp. 29–102. [Google Scholar]
- Danishuddin; Khan, A.U. Descriptors and their selection methods in QSAR analysis: Paradigm for drug design. Drug Discov. Today 2016, 21, 1291–1302. [Google Scholar]
- Moriwaki, H.; Tian, Y.S.; Kawashita, N.; Takagi, T. Mordred: A molecular descriptor calculator. J. Cheminform. 2018, 10, 4. [Google Scholar] [CrossRef]
- Yap, C.W. PaDEL-descriptor: An open source software to calculate molecular descriptors and fingerprints. J. Comput. Chem. 2011, 32, 1466–1474. [Google Scholar] [CrossRef]
- Gao, K.; Nguyen, D.D.; Sresht, V.; Mathiowetz, A.M.; Tu, M.; Wei, G.W. Are 2D fingerprints still valuable for drug discovery? Phys. Chem. Chem. Phys. 2020, 22, 8373–8390. [Google Scholar] [CrossRef]
- Rogers, D.; Hahn, M. Extended-connectivity fingerprints. J. Chem. Inf. Model. 2010, 50, 742–754. [Google Scholar] [CrossRef]
- Wang, J.; Wang, Y. Multi-strategy enhanced snake optimizer for quantitative structure-activity relationship modeling. Appl. Math. Model. 2024, 132, 531–560. [Google Scholar] [CrossRef]
- Tang, W.; Chen, J.; Hong, H. Development of classification models for predicting inhibition of mitochondrial fusion and fission using machine learning methods. Chemosphere 2021, 273, 128567. [Google Scholar] [CrossRef]
- Liu, L.; Zhang, L.; Feng, H.; Li, S.; Liu, M.; Zhao, J.; Liu, H. Prediction of the blood–brain barrier (BBB) permeability of chemicals based on machine-learning and ensemble methods. Chem. Res. Toxicol. 2021, 34, 1456–1467. [Google Scholar] [CrossRef]
- Choi, K.E.; Balupuri, A.; Kang, N.S. The study on the hERG blocker prediction using chemical fingerprint analysis. Molecules 2020, 25, 2615. [Google Scholar] [CrossRef] [PubMed]
- Weininger, D.; Weininger, A.; Weininger, J.L. SMILES. 2. Algorithm for generation of unique SMILES notation. J. Chem. Inf. Comput. Sci. 1989, 29, 97–101. [Google Scholar] [CrossRef]
- Zhang, X.; Wang, S.; Zhu, F.; Xu, Z.; Wang, Y.; Huang, J. Seq3seq fingerprint: Towards end-to-end semi-supervised deep drug discovery. In Proceedings of the 2018 ACM International Conference on Bioinformatics, Computational Biology, and Health Informatics, Washington, DC, USA, 29 August–1 September 2018; pp. 404–413. [Google Scholar]
- Winter, R.; Montanari, F.; Noé, F.; Clevert, D.A. Learning continuous and data-driven molecular descriptors by translating equivalent chemical representations. Chem. Sci. 2019, 10, 1692–1701. [Google Scholar] [CrossRef] [PubMed]
- Xu, Z.; Wang, S.; Zhu, F.; Huang, J. Seq2seq fingerprint: An unsupervised deep molecular embedding for drug discovery. In Proceedings of the 8th ACM International Conference on Bioinformatics, Computational Biology, and Health Informatics, Boston, MA, USA, 20–23 August 2017; pp. 285–294. [Google Scholar]
- Wang, S.; Guo, Y.; Wang, Y.; Sun, H.; Huang, J. Smiles-bert: Large scale unsupervised pre-training for molecular property prediction. In Proceedings of the 10th ACM International Conference on Bioinformatics, Computational Biology and Health Informatics, Niagara Falls, NY, USA, 7–10 September 2019; pp. 429–436. [Google Scholar]
- Hou, Y.; Wang, S.; Bai, B.; Chan, H.S.; Yuan, S. Accurate physical property predictions via deep learning. Molecules 2022, 27, 1668. [Google Scholar] [CrossRef]
- Xiong, Z.; Wang, D.; Liu, X.; Zhong, F.; Wan, X.; Li, X.; Li, Z.; Luo, X.; Chen, K.; Jiang, H.; et al. Pushing the boundaries of molecular representation for drug discovery with the graph attention mechanism. J. Med. Chem. 2019, 63, 8749–8760. [Google Scholar] [CrossRef]
- Zhu, W.; Zhang, Y.; Zhao, D.; Xu, J.; Wang, L. HiGNN: A hierarchical informative graph neural network for molecular property prediction equipped with feature-wise attention. J. Chem. Inf. Model. 2022, 63, 43–55. [Google Scholar] [CrossRef]
- Zheng, Z.; Wang, H.; Tan, Y.; Liang, C.; Sun, Y. EMPPNet: Enhancing Molecular Property Prediction via Cross-modal Information Flow and Hierarchical Attention. Expert Syst. Appl. 2023, 234, 121016. [Google Scholar] [CrossRef]
- Goyal, P.; Ferrara, E. Graph embedding techniques, applications, and performance: A survey. Knowl.-Based Syst. 2018, 151, 78–94. [Google Scholar] [CrossRef]
- Fey, M.; Lenssen, J.E. Fast graph representation learning with PyTorch Geometric. arXiv 2019, arXiv:1903.02428. [Google Scholar]
- Landrum, G. RDKit: A software suite for cheminformatics, computational chemistry, and predictive modeling. Greg Landrum 2013, 8, 5281. [Google Scholar]
- Wu, Z.; Ramsundar, B.; Feinberg, E.N.; Gomes, J.; Geniesse, C.; Pappu, A.S.; Leswing, K.; Pande, V. MoleculeNet: A benchmark for molecular machine learning. Chem. Sci. 2018, 9, 513–530. [Google Scholar] [CrossRef] [PubMed]
- Wu, Z.; Jiang, D.; Wang, J.; Zhang, X.; Du, H.; Pan, L.; Hsieh, C.Y.; Cao, D.; Hou, T. Knowledge-based BERT: A method to extract molecular features like computational chemists. Briefings Bioinform. 2022, 23, bbac131. [Google Scholar] [CrossRef] [PubMed]
- Paszke, A.; Gross, S.; Massa, F.; Lerer, A.; Bradbury, J.; Chanan, G.; Killeen, T.; Lin, Z.; Gimelshein, N.; Antiga, L.; et al. Pytorch: An imperative style, high-performance deep learning library. Adv. Neural Inf. Process. Syst. 2019, 32. [Google Scholar]
- Bergstra, J.; Komer, B.; Eliasmith, C.; Yamins, D.; Cox, D.D. Hyperopt: A python library for model selection and hyperparameter optimization. Comput. Sci. Discov. 2015, 8, 014008. [Google Scholar] [CrossRef]
- Guo, Z.; Zhang, C.; Yu, W.; Herr, J.; Wiest, O.; Jiang, M.; Chawla, N.V. Few-shot graph learning for molecular property prediction. In Proceedings of the Web Conference 2021, Ljubljana, Slovenia, 19–23 April 2021; pp. 2559–2567. [Google Scholar]
- Li, P.; Li, Y.; Hsieh, C.Y.; Zhang, S.; Liu, X.; Liu, H.; Song, S.; Yao, X. TrimNet: Learning molecular representation from triplet messages for biomedicine. Briefings Bioinform. 2021, 22, bbaa266. [Google Scholar] [CrossRef]
- Zhang, M.; Wang, X.; Jin, L.; Song, M.; Li, Z. A new approach for evaluating node importance in complex networks via deep learning methods. Neurocomputing 2022, 497, 13–27. [Google Scholar] [CrossRef]
- Eberhardt, E.S.; Raines, R.T. Amide-amide and amide-water hydrogen bonds: Implications for protein folding and stability. J. Am. Chem. Soc. 1994, 116, 2149–2150. [Google Scholar] [CrossRef]
- Ma, X.S.; Wang, D.H.; Cui, Y.Z.; Tao, F.R.; Wang, Y.T.; Li, T.D. A novel hydrophilic conjugated polymer containing hydroxyl groups: Syntheses and sensing performance for NACs in aqueous solution. Sens. Actuators B Chem. 2017, 251, 851–857. [Google Scholar] [CrossRef]
Disclaimer/Publisher’s Note: The statements, opinions and data contained in all publications are solely those of the individual author(s) and contributor(s) and not of MDPI and/or the editor(s). MDPI and/or the editor(s) disclaim responsibility for any injury to people or property resulting from any ideas, methods, instructions or products referred to in the content. |
© 2025 by the authors. Licensee MDPI, Basel, Switzerland. This article is an open access article distributed under the terms and conditions of the Creative Commons Attribution (CC BY) license (https://creativecommons.org/licenses/by/4.0/).