
A New Log-Transform Histogram Equalization Technique for Deep Learning-Based Document Forgery Detection


Abstract
1. Introduction
2. Related Work
2.1. Document Image Forgery Techniques
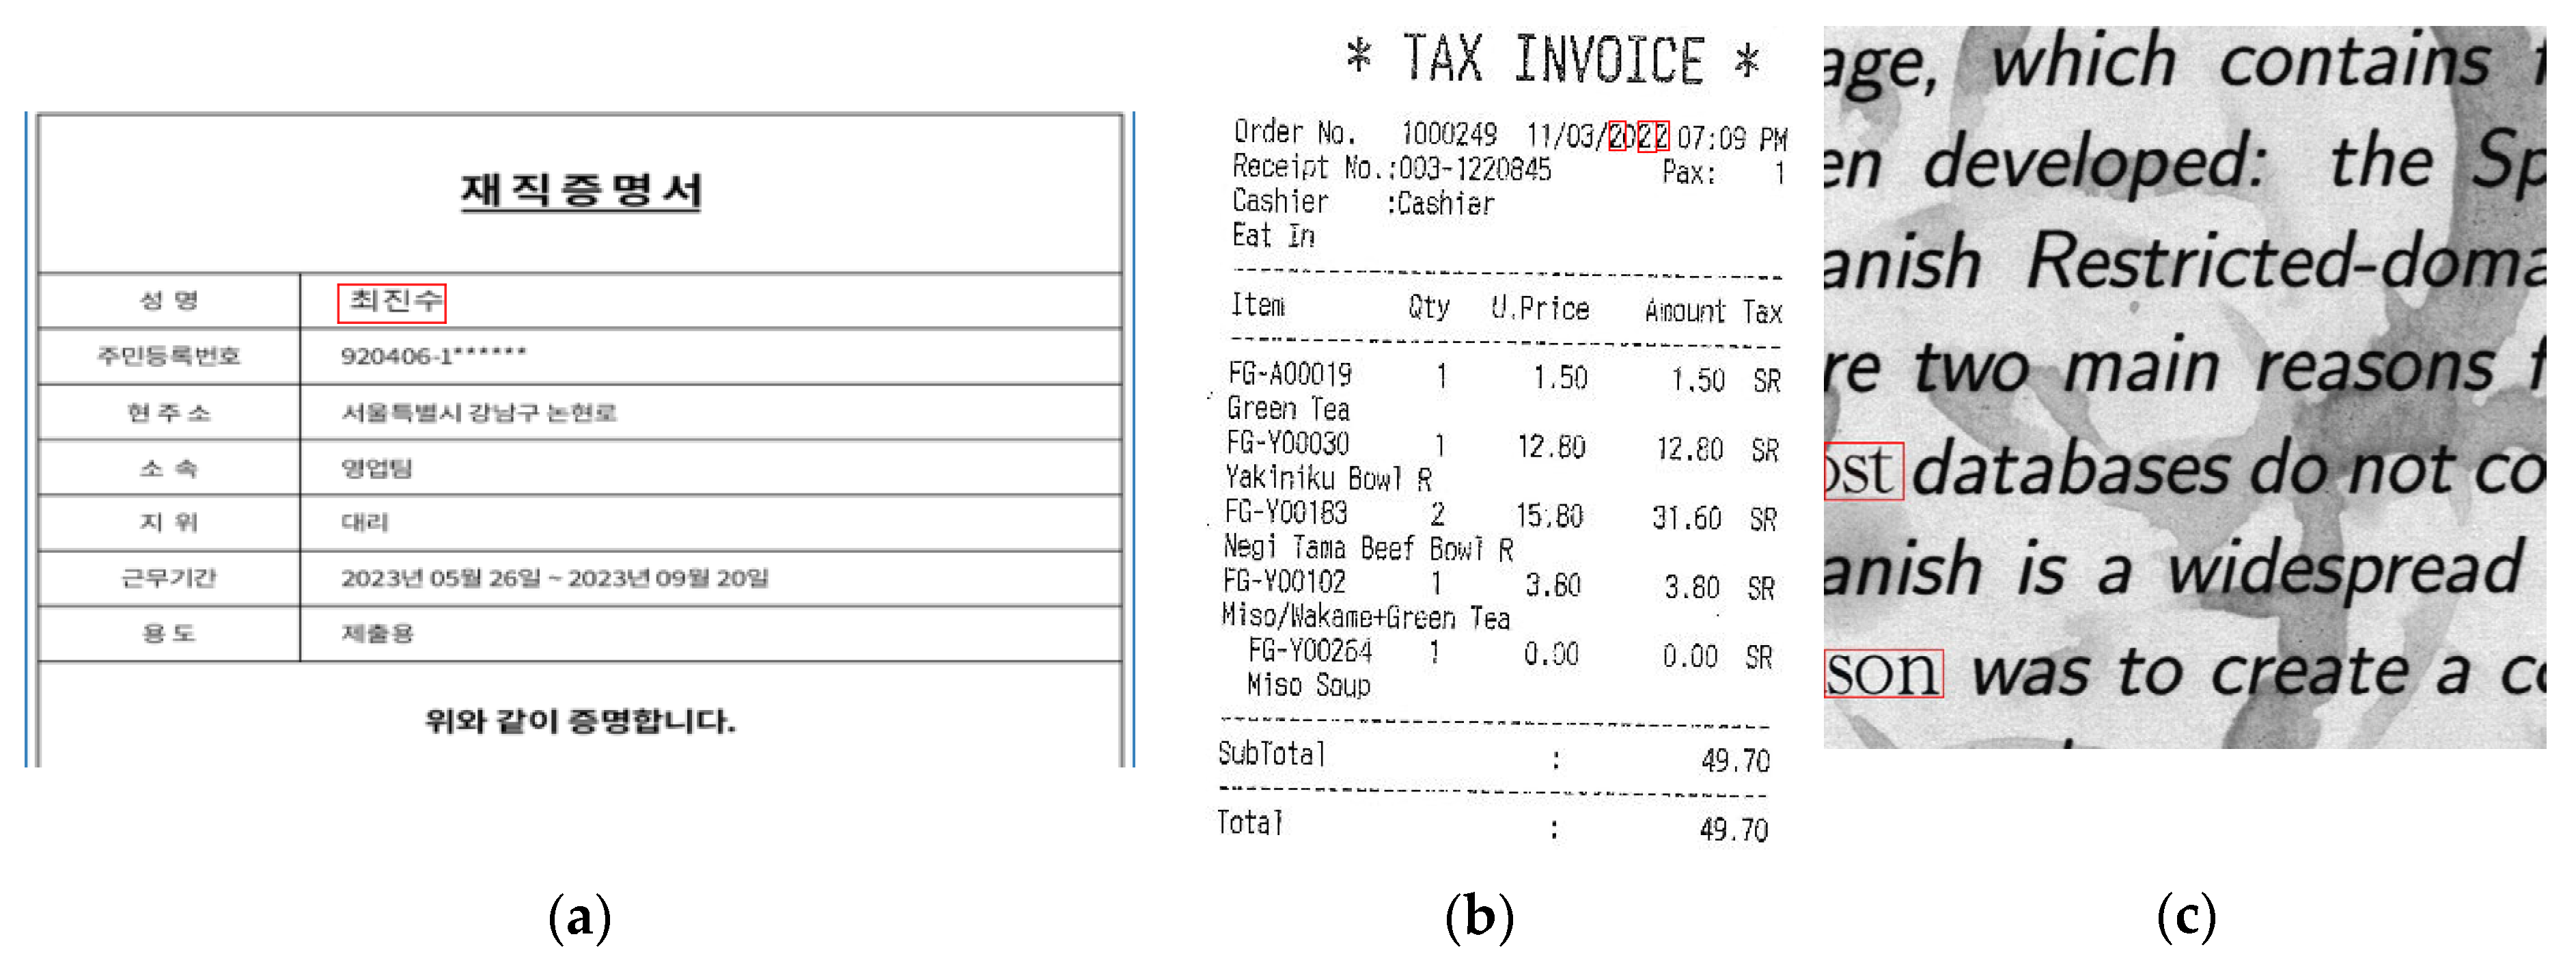
- Copy-move: Copy-move forgeries are performed by copying one or more regions of an image and pasting them in the same image in different locations [9]. The goal is often to duplicate or cover certain content in the document, making it appear as if the manipulated section is an original part of the image.
- Splicing: Splicing forgeries copy and paste parts of one image onto another, merging the two to create a new image [10]. In the context of document forgery, this involves inserting text, signatures, or other elements from one document into another, creating a falsified document that appears legitimate.
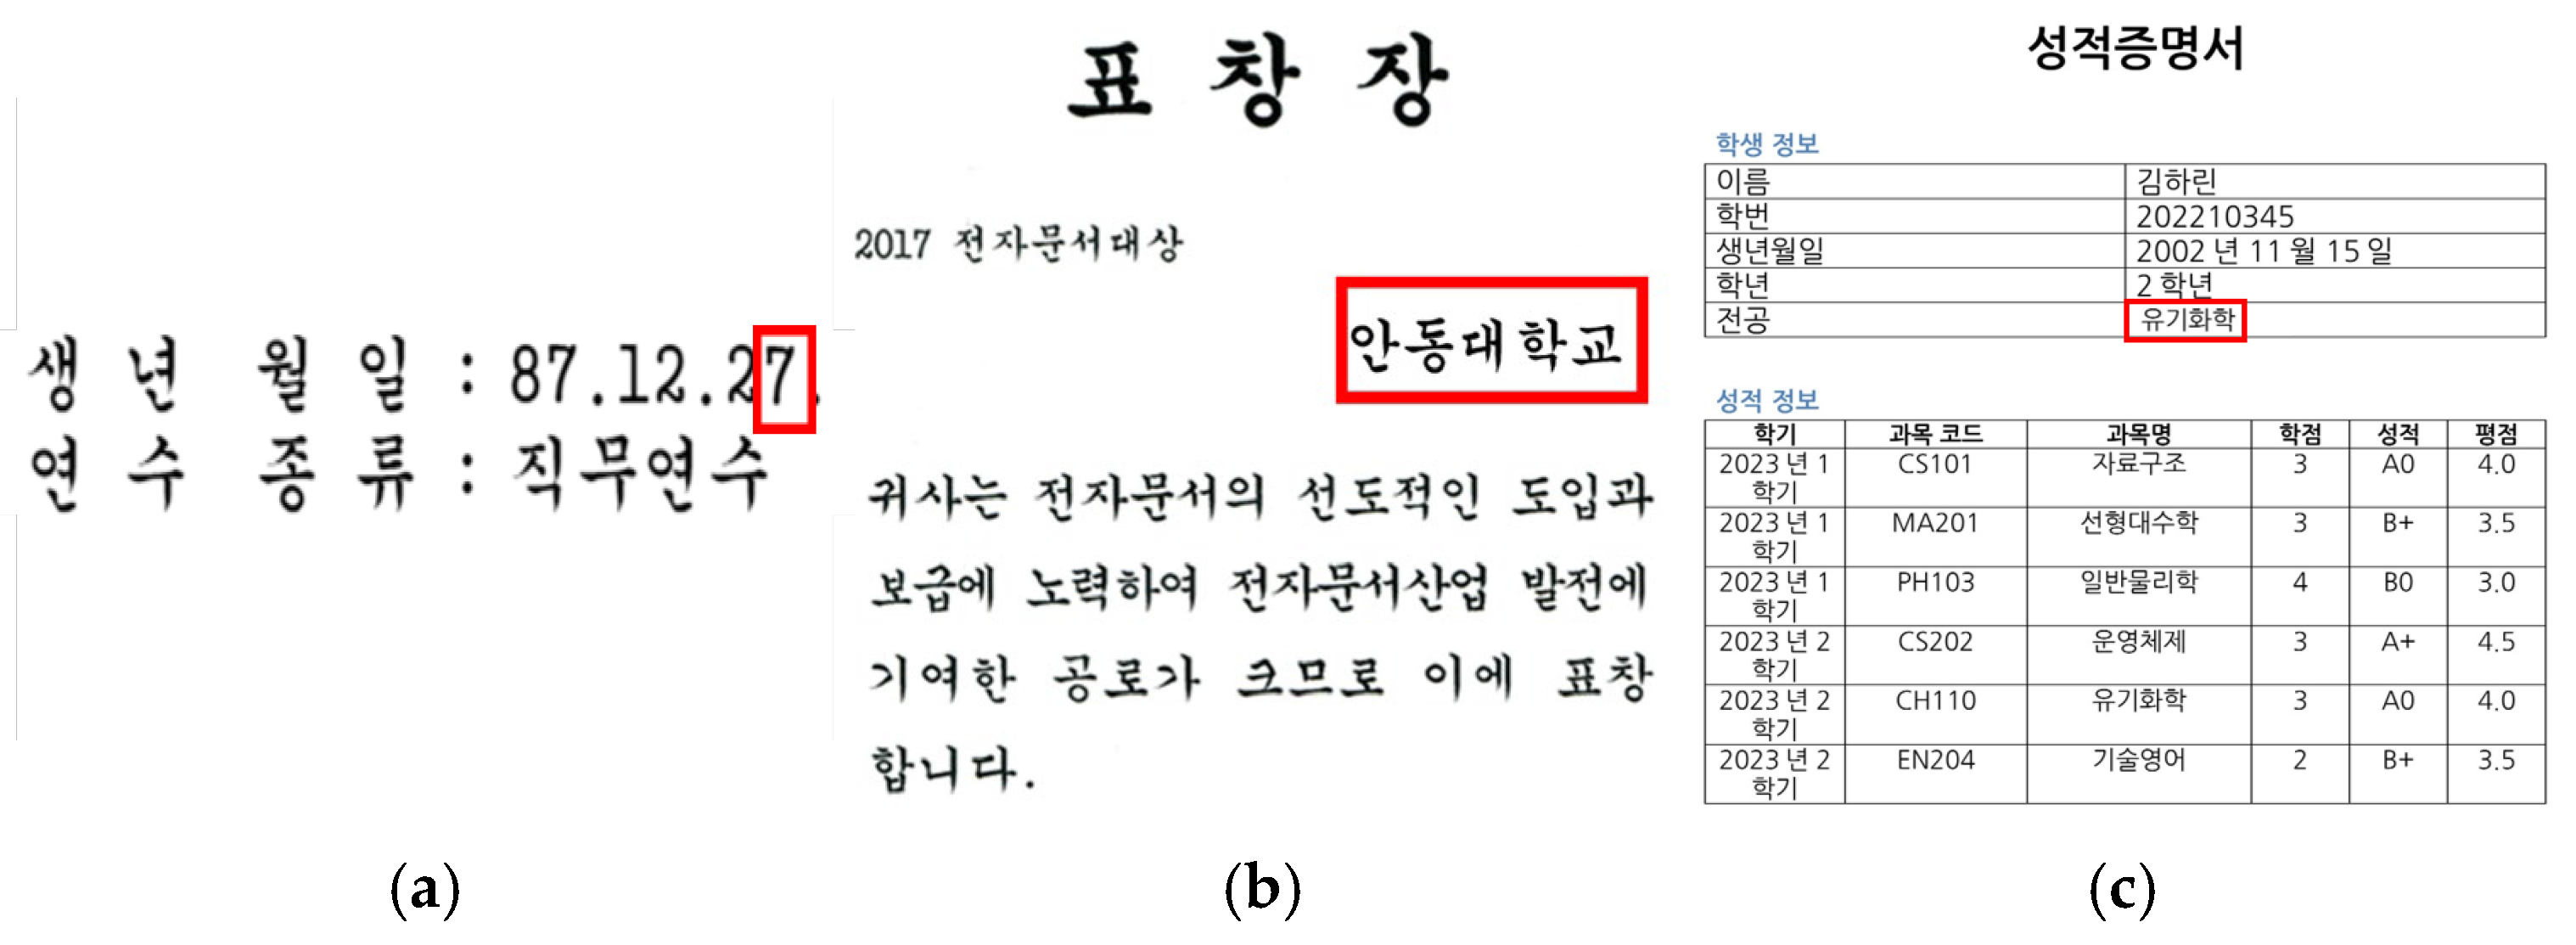
- Insertion: Words are altered using software tools to add characters in the appropriate places, according to the forger’s needs [11]. This technique is often used in cases where it is difficult to find the required characters within the document, such as in languages like Korean, which have a large variety of characters.
2.2. Optical Character Recognition (OCR)
2.3. Image Processing Methods
2.3.1. DCT
2.3.2. CLAHE
2.3.3. ELA
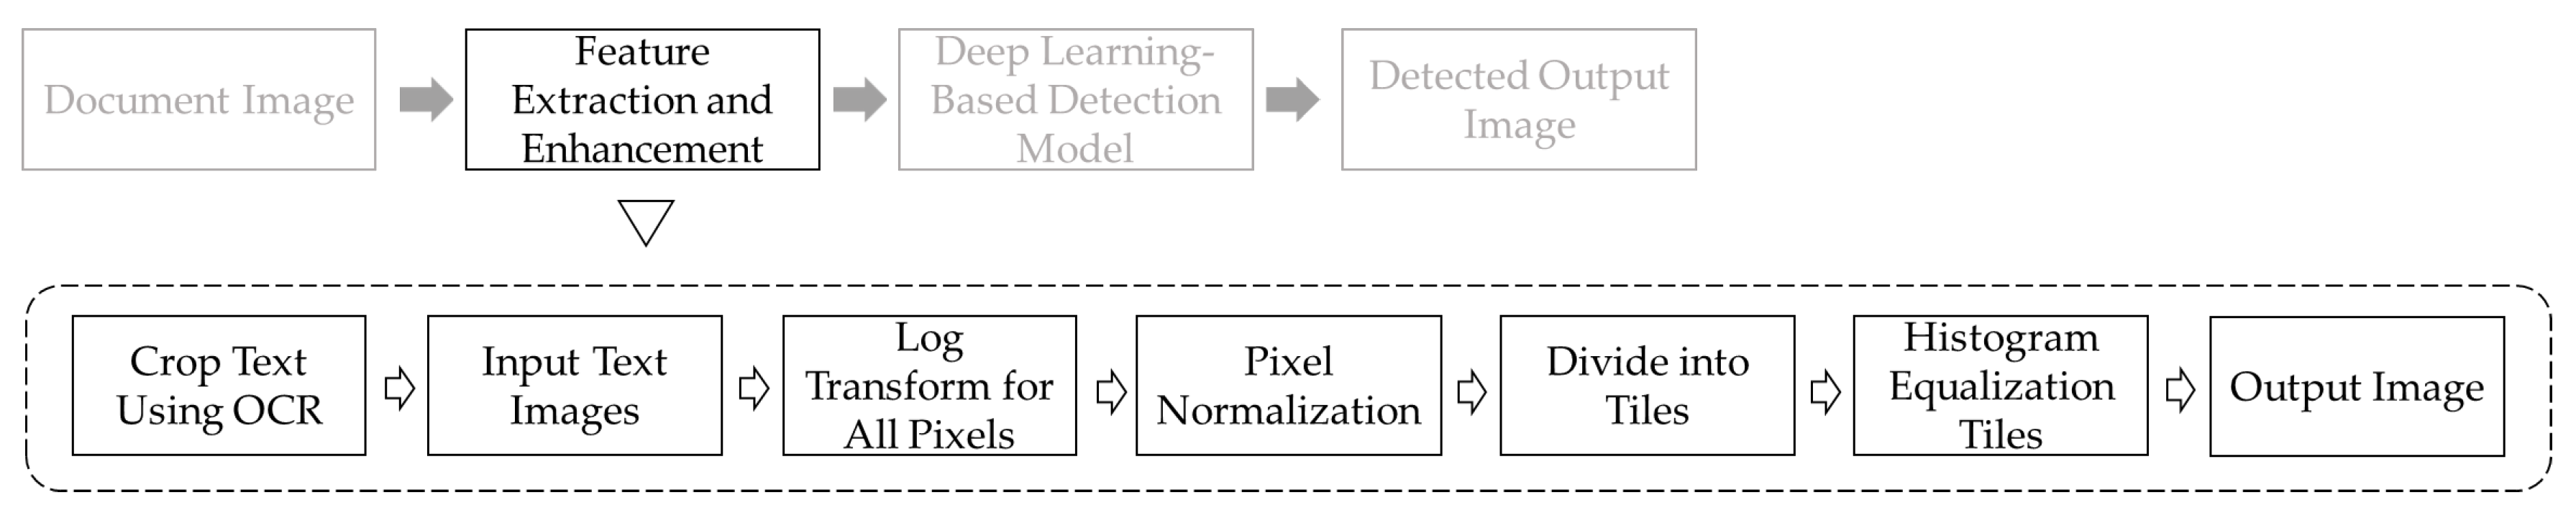
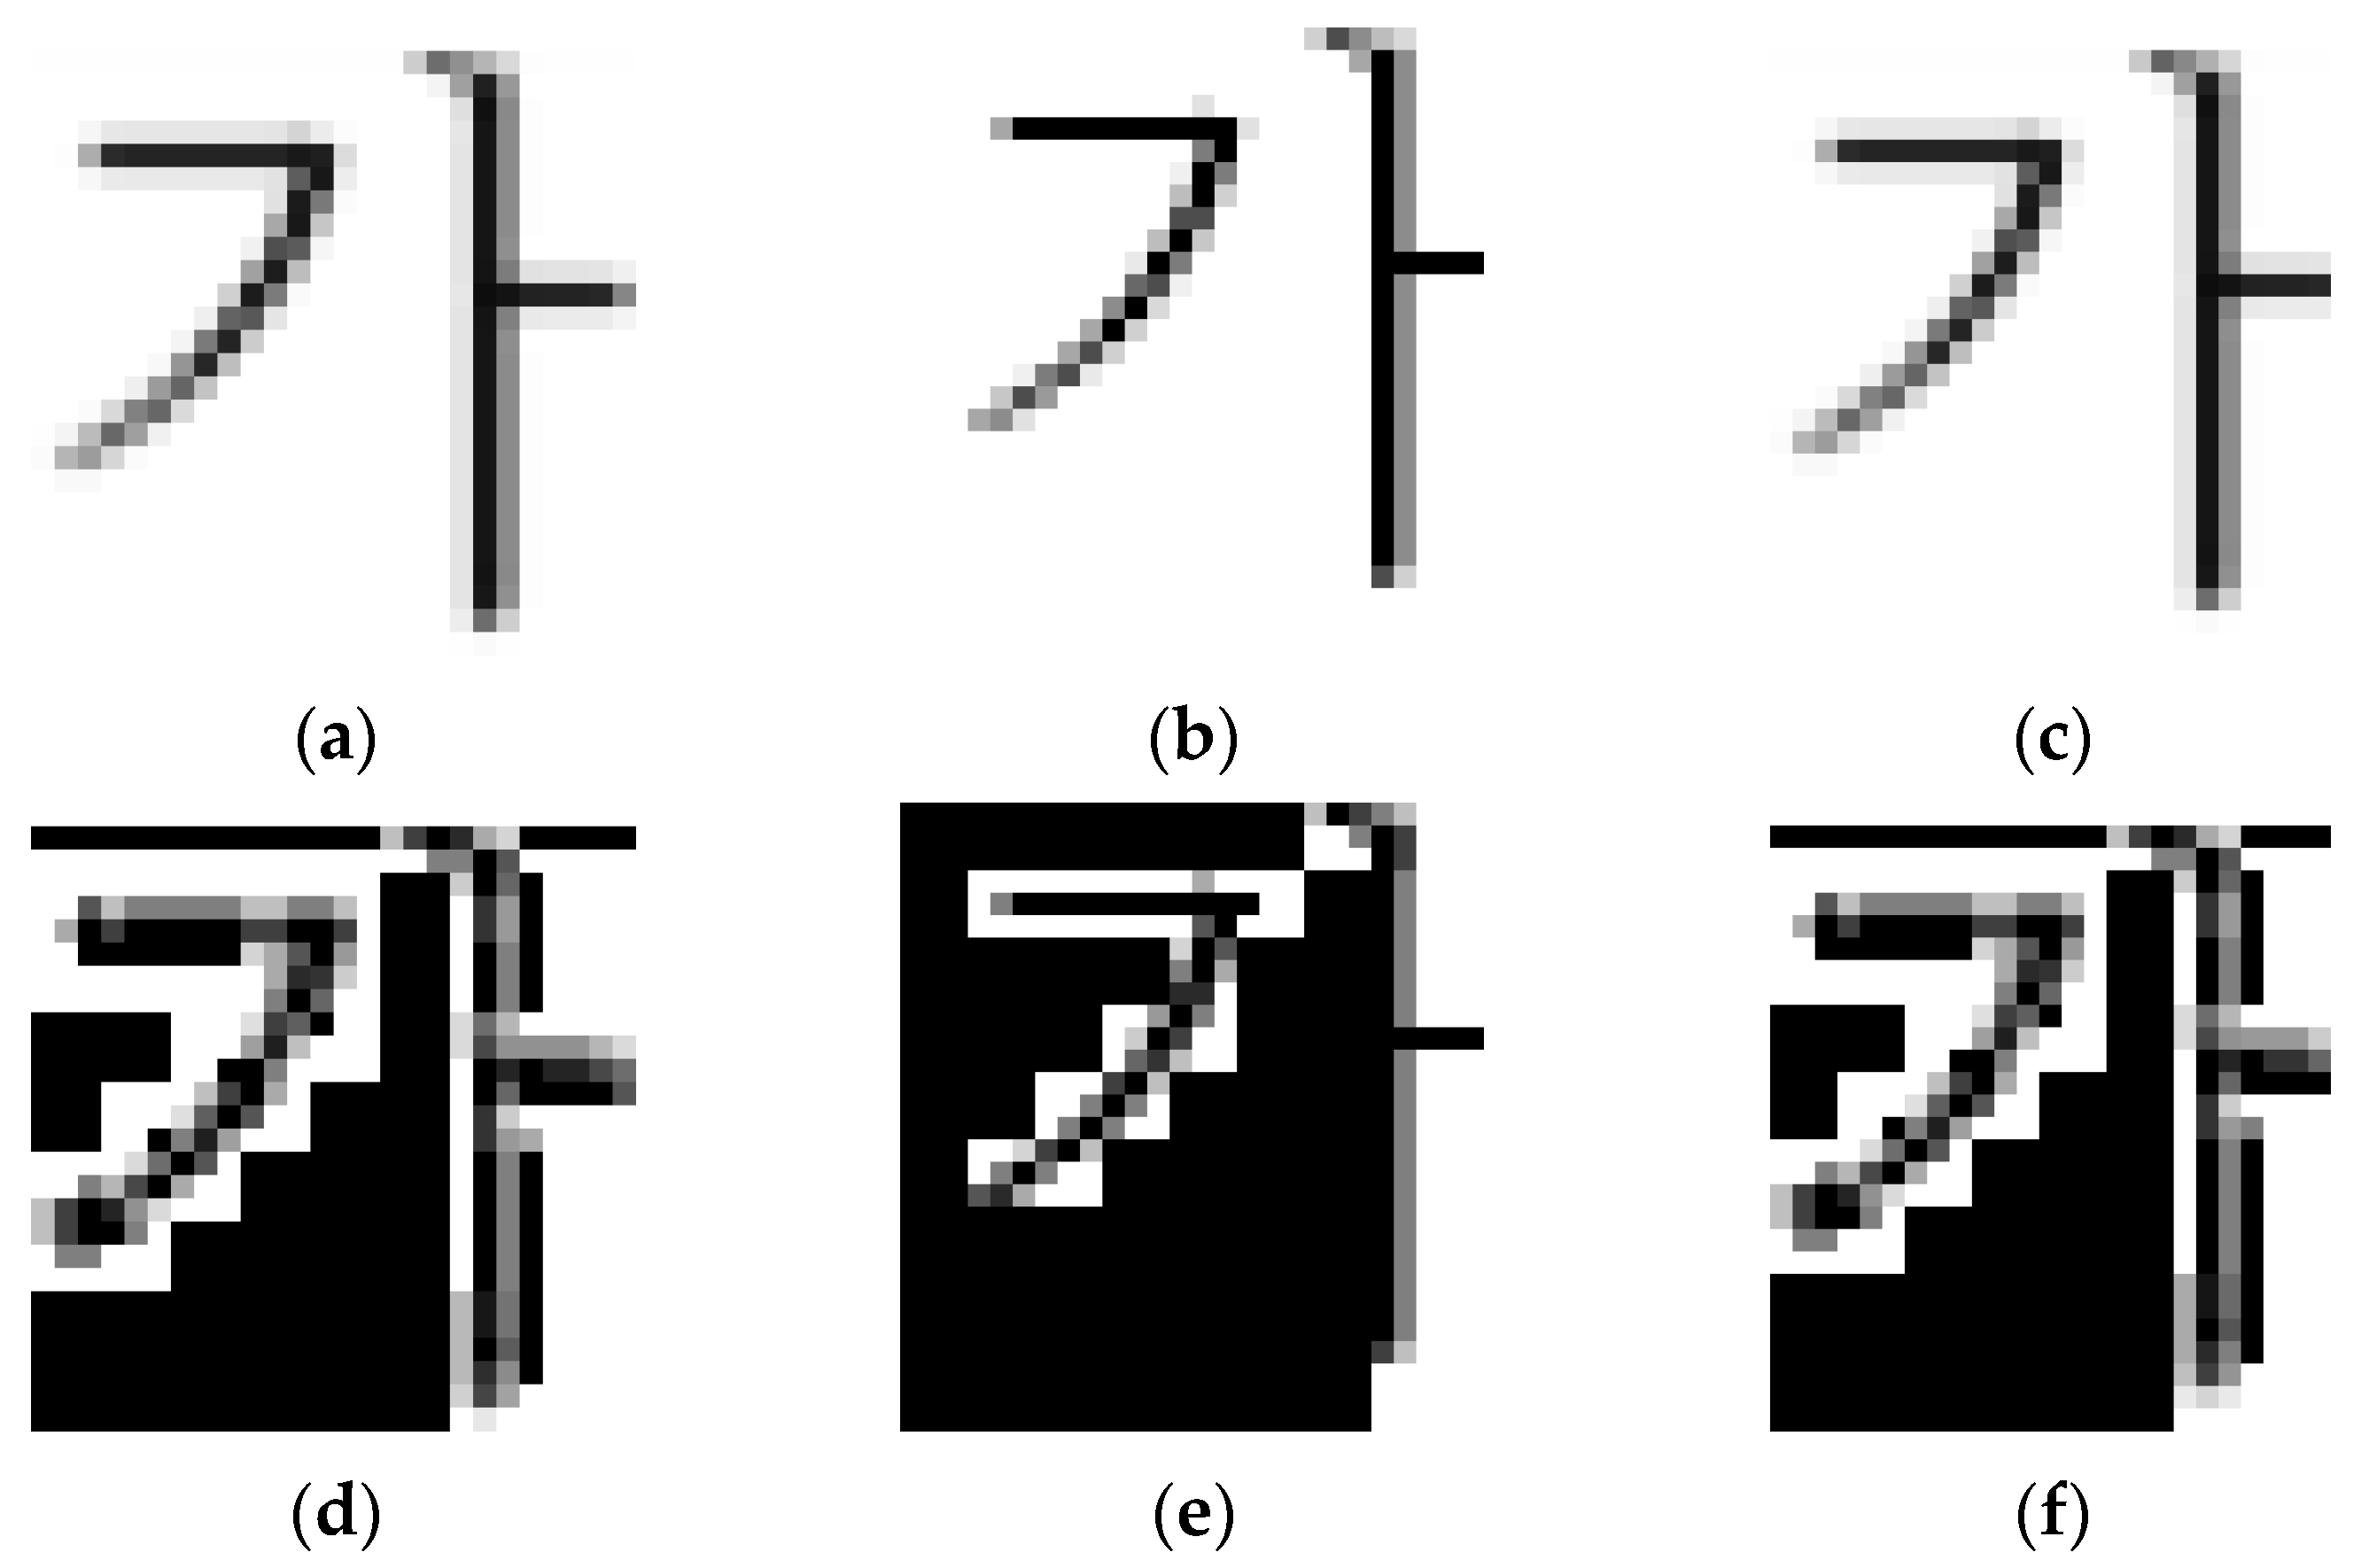
3. Log-Transform Histogram Equalization
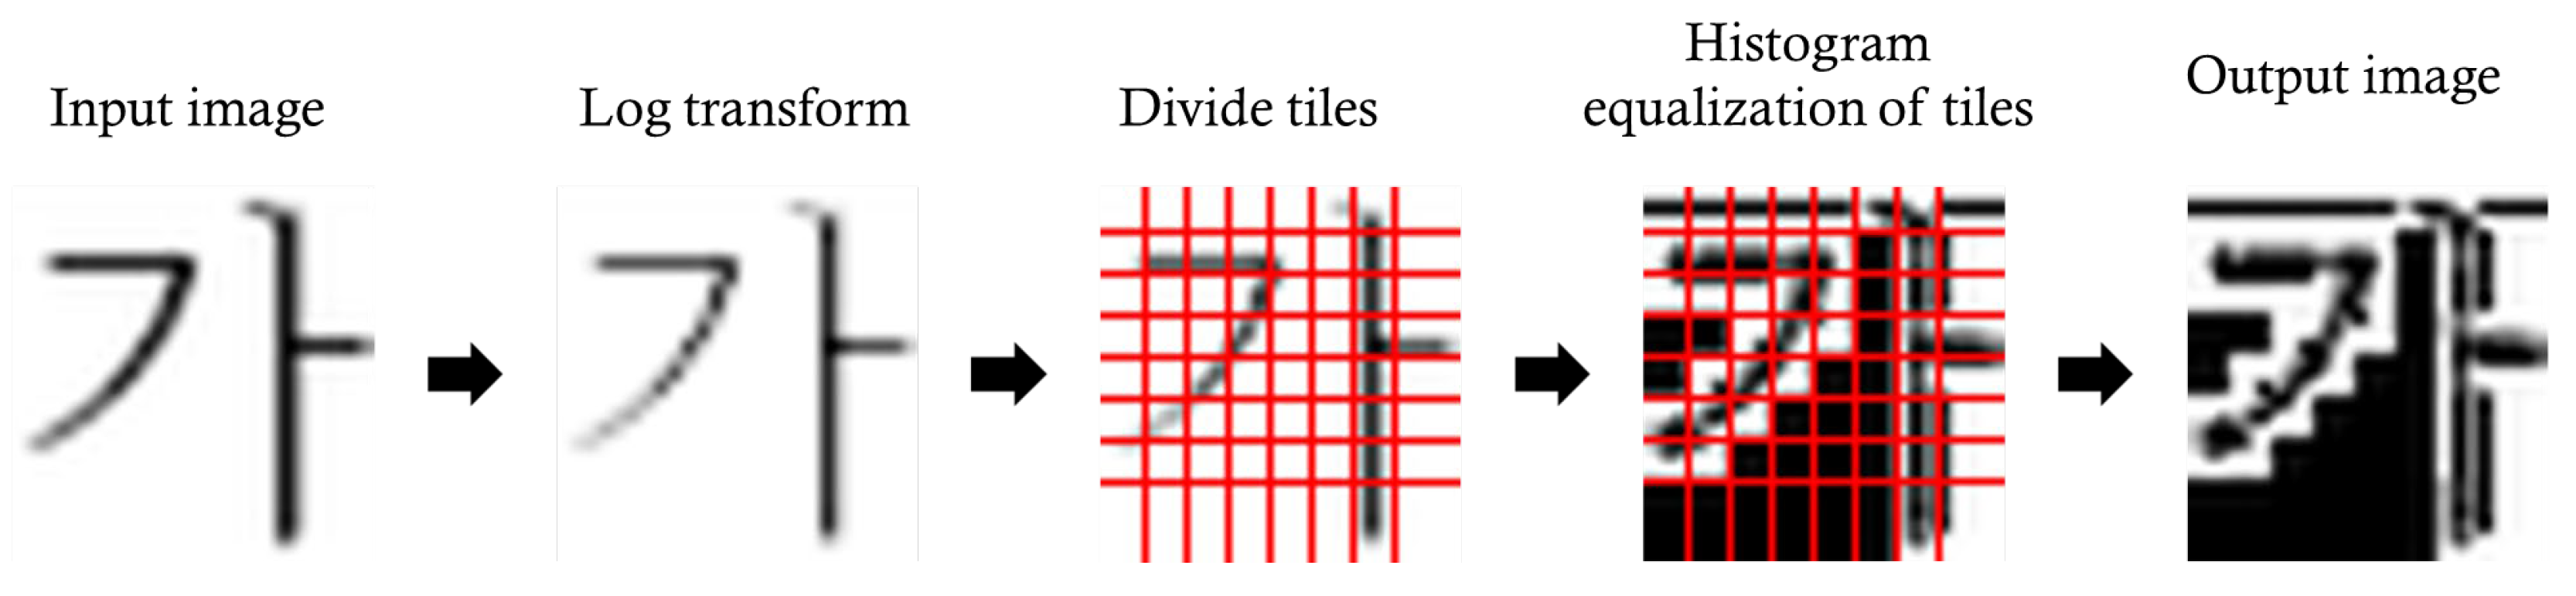
3.1. Log Transform
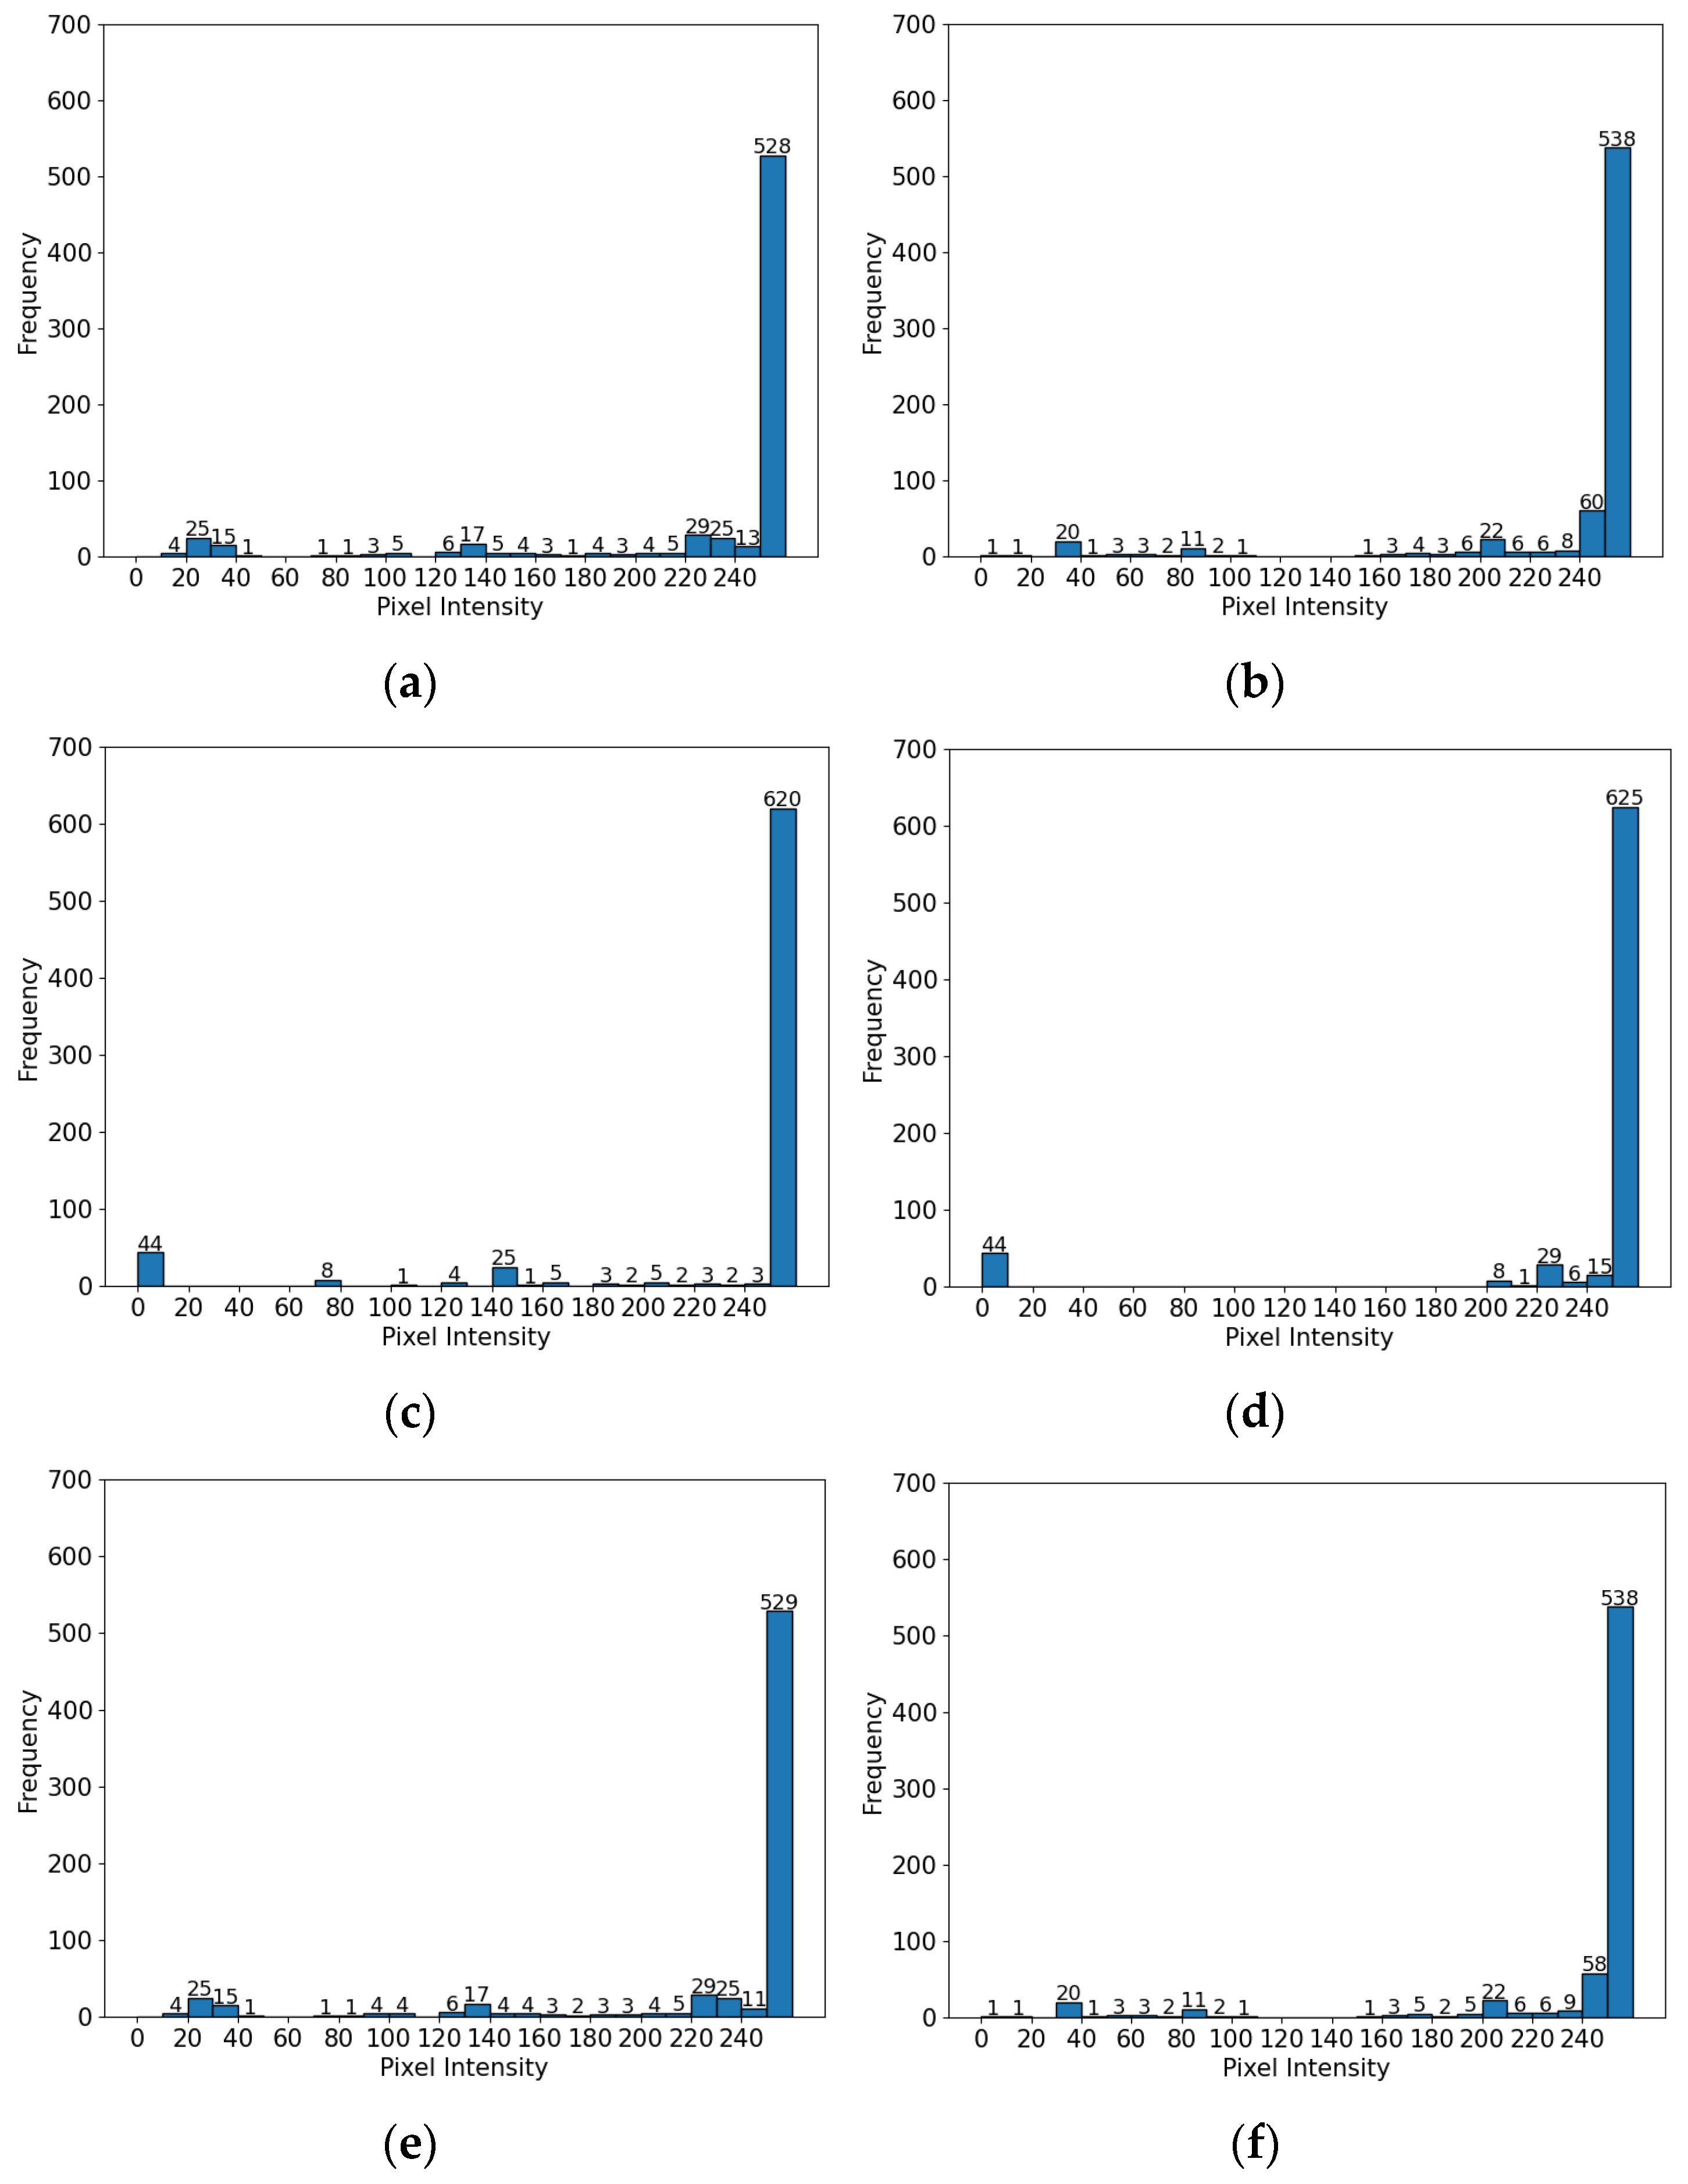
3.2. Histogram Equalization
4. Experimental Results
5. Conclusions
Author Contributions
Funding
Data Availability Statement
Acknowledgments
Conflicts of Interest
References
- Wang, W.; Dong, J.; Tan, T. Exploring DCT coefficient Quantization Effect for Image Tampering Localization. In Proceedings of the 2011 IEEE International Workshop on Information Forensics and Security, Iguacu Falls, Brazil, 29 November–2 December 2011; pp. 1–6. [Google Scholar]
- Luo, D.; Liu, Y.; Yang, R.; Liu, X.; Zeng, J.; Zhou, Y.; Bai, X. Toward real text manipulation detection: New dataset and new solution. Pattern Recognit. 2025, 157, 110828. [Google Scholar] [CrossRef]
- Qu, C.; Liu, J.; Zhang, H.; Chen, Y.; Wu, Y.; Li, X.; Yang, F. Towards Robust Tampered Text Detection in Document Image: New Dataset and New Solution. In Proceedings of the 2023 IEEE/CVF Conference on Computer Vision and Pattern Recognition (CVPR), Vancouver, BC, Canada, 17–24 June 2023; pp. 5937–5946. [Google Scholar]
- Nandanwar, L.; Shivakumara, P.; Pal, U. A New Method for Detecting Altered Text in Document Images. In Pattern Recognition and Artificial Intelligence; Springer: Cham, Switzerland, 2020; Volume 12068. [Google Scholar]
- Balabantaray, B.; Gnaneshwar, C.; Yadav, S.; Singh, M. Analysis of Image Forgery Detection using Convolutional Neural Network. Int. J. Appl. Syst. Stud. 2022, 9, 240–260. [Google Scholar] [CrossRef]
- Huang, G.; Liu, Z.; van der Maaten, L.; Weinberger, K.Q. Densely Connected Convolutional Networks. In Proceedings of the 2017 IEEE Conference on Computer Vision and Pattern Recognition (CVPR), Honolulu, HI, USA; 2017; pp. 2261–2269. [Google Scholar]
- He, K.; Zhang, X.; Ren, S.; Sun, J. Deep Residual Learning for Image Recognition. In Proceedings of the 2016 IEEE Conference on Computer Vision and Pattern Recognition (CVPR), Las Vegas, NV, USA, 27–30 June 2016; pp. 770–778. [Google Scholar]
- Tan, M.; Le, Q.V. EfficientNet: Rethinking Model Scaling for Convolutional Neural Networks. arXiv 2019, arXiv:1905.11946. [Google Scholar]
- Zanardelli, M.; Guerrini, F.; Leonardi, R.; Adami, N. Image Forgery Detection: A Survey of Recent Deep-Learning Approaches. Multimed. Tools Appl. 2022, 82, 17521–17566. [Google Scholar] [CrossRef]
- Bi, X.; Wei, Y.; Xiao, B.; Li, W. RRU-Net: The Ringed Residual U-Net for Image Splicing Forgery Detection. In Proceedings of the 2019 IEEE/CVF Conference on Computer Vision and Pattern Recognition Workshops (CVPRW), Long Beach, CA, USA, 16–17 June 2019; pp. 30–39. [Google Scholar]
- Gornale, S.S.; Patil, G.; Benne, R. Document Image Forgery Detection Using RGB Color Channel. Trans. Eng. Comput. Sci. 2022, 10, 1–14. [Google Scholar] [CrossRef]
- Singh, A.; Bacchuwar, K.; Bhasin, A. A Survey of OCR Applications. Int. J. Mach. Learn. Comput. 2012, 2, 314–318. [Google Scholar] [CrossRef]
- Khayam, S.A. The Discrete Cosine Transform (DCT): Theory and Application. Course Notes Dep. Electr. Comput. Eng. 2003. Available online: https://api.semanticscholar.org/CorpusID:2593654 (accessed on 7 December 2024).
- Yadav, G.; Maheshwari, S.; Agarwal, A. Contrast Limited Adaptive Histogram Equalization Based Enhancement for Real Time Video System. In Proceedings of the 2014 International Conference on Advances in Computing, Communications and Informatics (ICACCI), Delhi, India, 24–27 September 2014; pp. 2392–2397. [Google Scholar]
- Tahaoglu, G.; Ulutaş, G.; Ustubioglu, B.; Nabiyev, V.V. Improved Copy Move Forgery Detection Method via L*a*b* Color Space and Enhanced Localization Technique. Multimed. Tools Appl. 2021, 80, 23419–23456. [Google Scholar] [CrossRef]
- Pakala, S.; Mantri, M.B.P.; Kumar, M.N. Forgery Detection in Medical Image and Enhancement Using Modified CLAHE Method. J. Surv. Fish. Sci. 2023, 10, 1930–1937. [Google Scholar]

| Original Image | Forged Image (Insertion) | Forged Image (Copy-Move) | |
|---|---|---|---|
| ELA |  |  |  |
| Canny |  |  |  |
| DCT (positive) |  | . |  |
| DCT (negative) |  |  |  |
| Histogram equalization |  |  |  |
| Sauvola |  |  |  |
| CLAHE |  |  |  |
| LTHE |  |  |  |
| Non-processed |  |  |  |
| DenseNet121 | ResNet50 | EfficientNetB0 | ||||
|---|---|---|---|---|---|---|
| Accuracy | F1 | Accuracy | F1 | Accuracy | F1 | |
| LTHE | 0.645 | 0.639 | 0.638 | 0.636 | 0.648 | 0.645 |
| CLAHE | 0.553 | 0.474 | 0.644 | 0.615 | 0.598 | 0.606 |
| Sauvola | 0.353 | 0.278 | 0.366 | 0.273 | 0.297 | 0.238 |
| ELA | 0.519 | 0.450 | 0.347 | 0.255 | 0.545 | 0.550 |
| Canny | 0.316 | 0.281 | 0.294 | 0.243 | 0.353 | 0.321 |
| DCT (positive) | 0.343 | 0.304 | 0.328 | 0.277 | 0.345 | 0.297 |
| DCT (negative) | 0.338 | 0.285 | 0.332 | 0.262 | 0.323 | 0.287 |
| Histogram equalization | 0.595 | 0.595 | 0.433 | 0.433 | 0.488 | 0.491 |
| DenseNet121 | ResNet50 | EfficientNetB0 | ||||
|---|---|---|---|---|---|---|
| Accuracy | F1 | Accuracy | F1 | Accuracy | F1 | |
| LTHE | 0.560 | 0.684 | 0.598 | 0.696 | 0.560 | 0.694 |
| CLAHE | 0.515 | 0.673 | 0.537 | 0.644 | 0.537 | 0.667 |
| Sauvola | 0.515 | 0.656 | 0.485 | 0.457 | 0.500 | 0.630 |
| ELA | 0.478 | 0.628 | 0.478 | 0.624 | 0.522 | 0.562 |
| Canny | 0.478 | 0.521 | 0.515 | 0.591 | 0.485 | 0.531 |
| DCT (positive) | 0.545 | 0.626 | 0.530 | 0.670 | 0.552 | 0.670 |
| DCT (negative) | 0.522 | 0.467 | 0.545 | 0.667 | 0.470 | 0.548 |
| Histogram equalization | 0.448 | 0.570 | 0.590 | 0.545 | 0.515 | 0.652 |
| DenseNet121 | ResNet50 | EfficientNetB0 | ||||
|---|---|---|---|---|---|---|
| Accuracy | F1 | Accuracy | F1 | Accuracy | F1 | |
| LTHE | 0.636 | 0.632 | 0.527 | 0.416 | 0.529 | 0.345 |
| CLAHE | 0.518 | 0.440 | 0.509 | 0.381 | 0.500 | 0.333 |
| Sauvola | 0.582 | 0.531 | 0.500 | 0.333 | 0.482 | 0.325 |
| ELA | 0.564 | 0.545 | 0.500 | 0.333 | 0.500 | 0.333 |
| Canny | 0.582 | 0.573 | 0.491 | 0.329 | 0.500 | 0.333 |
| DCT (positive) | 0.642 | 0.593 | 0.505 | 0.335 | 0.505 | 0.335 |
| DCT (negative) | 0.514 | 0.370 | 0.505 | 0.335 | 0.505 | 0.335 |
| Histogram equalization | 0.609 | 0.605 | 0.500 | 0.333 | 0.500 | 0.333 |
| LTHE | CLAHE | Sauvola | ELA | Canny | DCT (Positive) | DCT (Negative) | Histogram Equalization | |
|---|---|---|---|---|---|---|---|---|
| Time Cost (ms) | 11.046 | 0.059 | 0.167 | 5.149 | 0.815 | 0.046 | 0.012 | 0.019 |
| Memory Cost (KB) | 0.826 | 2.552 | 1.095 | 2.041 | 7.274 | 1.179 | 1.179 | 0.102 |
Disclaimer/Publisher’s Note: The statements, opinions and data contained in all publications are solely those of the individual author(s) and contributor(s) and not of MDPI and/or the editor(s). MDPI and/or the editor(s) disclaim responsibility for any injury to people or property resulting from any ideas, methods, instructions or products referred to in the content. |
© 2025 by the authors. Licensee MDPI, Basel, Switzerland. This article is an open access article distributed under the terms and conditions of the Creative Commons Attribution (CC BY) license (https://creativecommons.org/licenses/by/4.0/).
Share and Cite
Bae, Y.-Y.; Cho, D.-J.; Jung, K.-H. A New Log-Transform Histogram Equalization Technique for Deep Learning-Based Document Forgery Detection. Symmetry 2025, 17, 395. https://doi.org/10.3390/sym17030395
Bae Y-Y, Cho D-J, Jung K-H. A New Log-Transform Histogram Equalization Technique for Deep Learning-Based Document Forgery Detection. Symmetry. 2025; 17(3):395. https://doi.org/10.3390/sym17030395
Chicago/Turabian StyleBae, Yong-Yeol, Dae-Jea Cho, and Ki-Hyun Jung. 2025. "A New Log-Transform Histogram Equalization Technique for Deep Learning-Based Document Forgery Detection" Symmetry 17, no. 3: 395. https://doi.org/10.3390/sym17030395
APA StyleBae, Y.-Y., Cho, D.-J., & Jung, K.-H. (2025). A New Log-Transform Histogram Equalization Technique for Deep Learning-Based Document Forgery Detection. Symmetry, 17(3), 395. https://doi.org/10.3390/sym17030395