1. Introductory
In the field of marine science and technology, underwater target recognition occupies a pivotal position [
1] and serves as an indispensable component in safeguarding maritime security and defense strategies. Underwater gliders, renowned for their low power consumption, extended endurance, and superior stealth capabilities, have emerged as vital observation platforms in marine environments. They are extensively utilized in critical tasks such as oceanographic monitoring and military reconnaissance. However, during the signal acquisition process, underwater gliders are prone to contamination of target signals by inherent mechanical noise from the platform, including motor noise and pump noise. This contamination significantly degrades the accuracy and reliability of target feature extraction, particularly in environments characterized by non-stationary signals and low signal-to-noise ratios (SNR), where noise variability is pronounced. Traditional signal denoising methods exhibit limited effectiveness under such conditions [
2], often resulting in suboptimal denoising performance or excessive noise suppression. These limitations directly impair the efficacy of target feature extraction, thereby adversely affecting the recognition rate of underwater targets and making it challenging to achieve the desired levels of precision and stability in recognition outcomes.
Therefore, reducing the inherent noise during the acquisition of target signal features by underwater gliders is of paramount importance and holds substantial practical significance in engineering applications. Among various denoising techniques, the CEEMDAN-SVD (Complete Ensemble Empirical Mode Decomposition with Adaptive Noise—Singular Value Decomposition) method has garnered considerable attention due to its effectiveness in processing non-stationary signals. In this context, this paper proposes a CEEMDAN-SVD-based signal denoising method tailored to the noise characteristics of underwater gliders. This method serves as a preprocessing step for underwater target recognition by underwater gliders, aiming to enhance the recognition rate of target features. Empirical Mode Decomposition (EMD) [
3] is an adaptive signal time-frequency processing method that adaptively decomposes a nonlinear multimodal complex signal into a finite number of Intrinsic Mode Function (IMF) components and residual signal residuals. EMD has the advantage of not requiring a priori signals as inputs, but also has the following disadvantages: firstly, when there are components with similar frequencies or overlapping each other in the signal, the EMD decomposition may suffer from the phenomenon of modal aliasing [
4], i.e., a single modal component contains several components with different frequencies; secondly, in the absence of a signal delay at the endpoints, it is prone to large distortion and aberration in the vicinity of the endpoints. distortion and aberration, which makes it difficult to restore the real signal. Based on the above problems, researchers have proposed Ensemble Empirical Modal Decomposition (EEMD), EEMD is mainly based on the EMD algorithm by adding different white noise and EMD decomposition repeatedly for many times, and finally averaging the decomposition results to eliminate the noise in order to obtain more stable results than the EMD algorithm. The necessary conditions for the existence of IMF in EMD are [
5]: (1) The number of extreme points and the number of zero-crossing points of the subsequence can only be matched exactly or differ at most by 1. (2) All the local extreme points are connected to form a set of upper and lower envelopes, and the mean value of upper and lower envelopes must be 0. The EEMD algorithm alleviates the phenomenon of modal aliasing to a certain extent, but the added white noise cannot be removed completely after several times of averaging. However, the white noise cannot be completely removed after multiple averaging, and there exists a certain noise residual, which will lead to the decomposition results with errors. Although the error can be further reduced by increasing the number of reconstructions, it will lead to a significant increase in computation.
Based on the above problems, researchers have successively proposed Complete Ensemble Empirical Modal Decomposition (CEEMD) [
6], and Complete Ensemble Empirical Modal Decomposition with adaptive noise (CEEMD with adaptive noise, CEEMDAN), CEEMDAN adds Gaussian white noise several times on the basis of EMD to make use of its uniform frequency distribution to compensate for the shortcomings of modal discontinuity, which alleviates the phenomenon of modal aliasing to a large extent.
Many scholars have proposed a variety of noise reduction methods on this basis. Lei Y [
7] used the CEEMDAN algorithm to extract weak features from signals for fault identification of rolling bearings, and the diagnostic effect is better than that of the EEMD algorithm. S Zhang [
8] proposed a CEEMDAN algorithm based on optimisation of the non-local mean (NLM) algorithm, and proposed a composite filtering method based on sample entropy, probability density and Mahalanobis distance composite screening method, which largely overcomes the shortcomings of the previous traditional threshold denoising. Yi et al. [
9] proposed a method combining empirical modal decomposition (EMD) and principal component analysis (PCA), which is able to inhibit the common modal aliasing in the traditional EMD to a certain extent. However, the disadvantage is that it is prone to over-noise reduction for complex noises with low signal-to-noise ratios. DONG [
10] et al. proposed a method that combines LMD with SVD for microseismic signals. Tang [
11] In combining the ensemble empirical modal decomposition (EEMD) with the singular value decomposition (SVD), a method that introduces the Teager energy operator (TEO) [
12] to achieve the identification of weak faulty modules. Li G et al. [
13] proposed a denoising algorithm based on the composite multiscale dispersion entropy algorithm with wavelet soft thresholding. Li Y et al. [
14] combined CEEMDAN with energy entropy, and the energy entropy of the IMF was used as the basis for identifying faults.
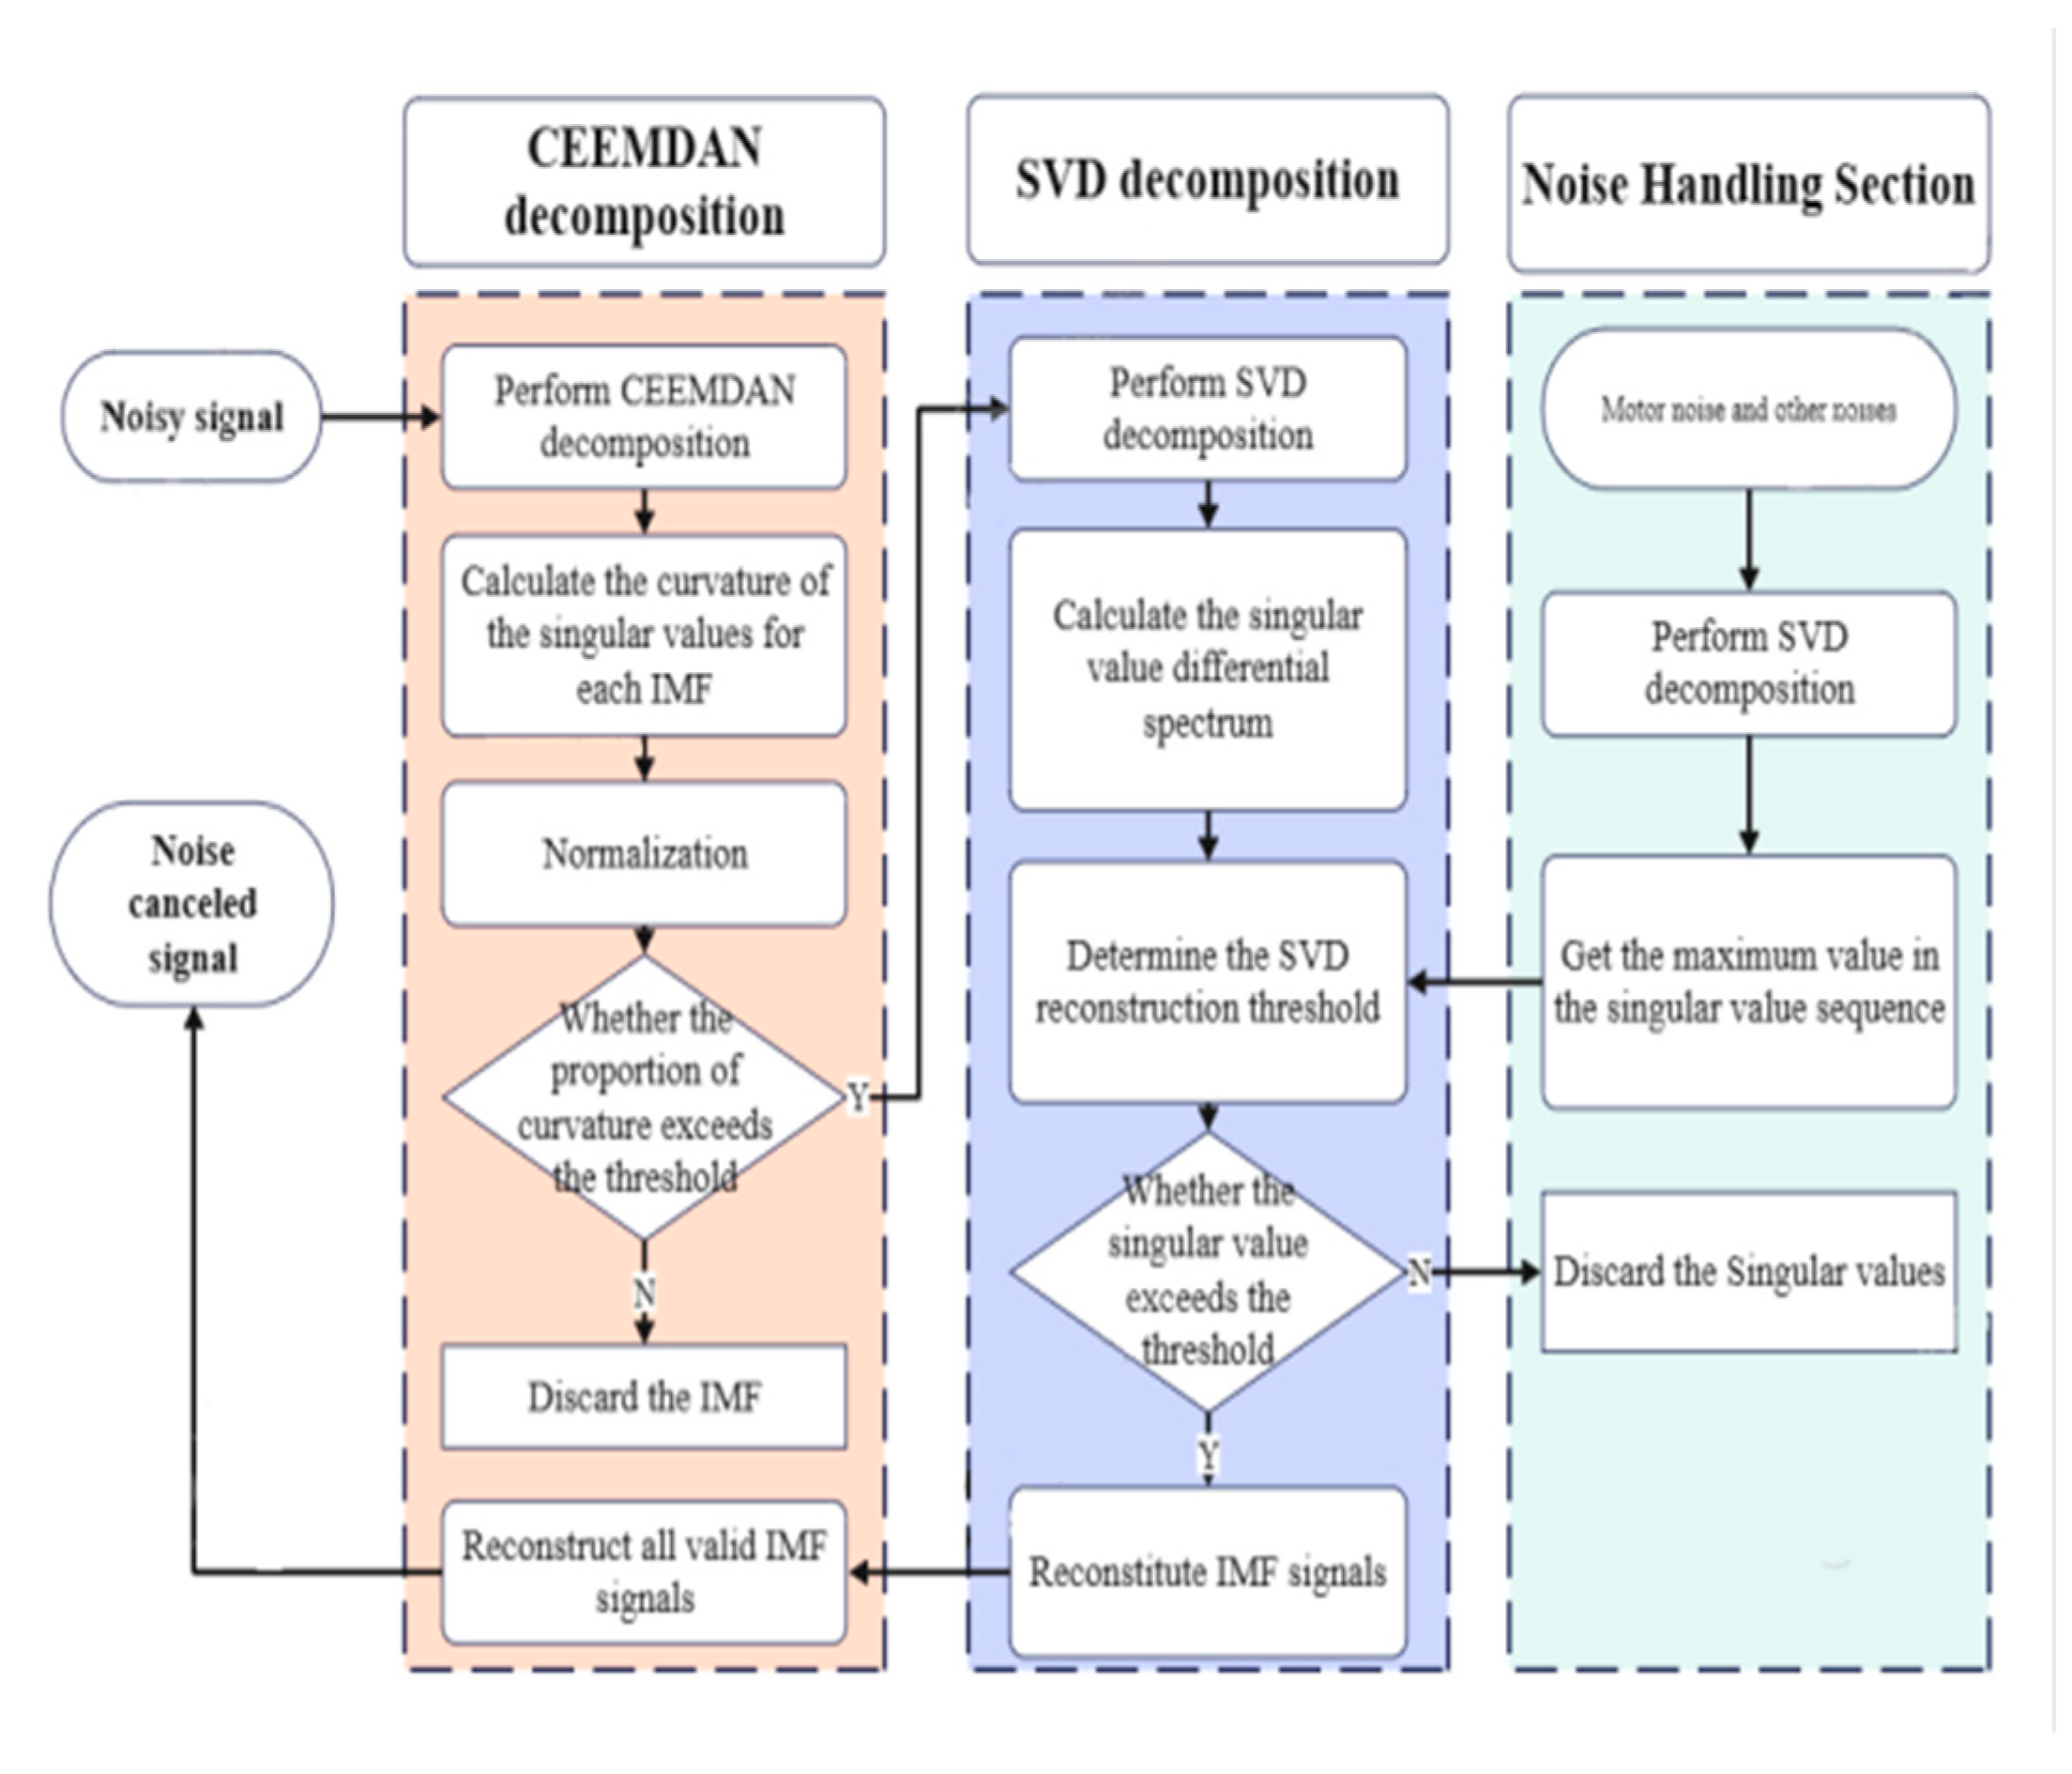
This paper proposes an improved algorithm based on CEEMDAN-SVD. First, the noisy signal is decomposed into multiple IMFs (Intrinsic Mode Functions) using CEEMDAN (Complete Ensemble Empirical Mode Decomposition with Adaptive Noise). The validity of each IMF is then determined based on the curvature spectrum of its singular values [
15], which serves as a threshold criterion. Subsequently, Hankel transformation and SVD (Singular Value Decomposition) are applied separately to the noise [
16] and the valid IMF signals to obtain the maximum singular value of marine noise. The maximum singular value of motor noise and the differential sequence of singular values are then used as the basis for determining the reconstruction positions. Finally, the singular value matrix is reconstructed into a Hankel matrix, which is transformed back into a one-dimensional IMF vector through inverse Hankel [
17] transformation. The valid IMFs are superimposed to obtain the denoised original matrix.
Simulation experiments and sea trial results demonstrate that the proposed improved method significantly outperforms traditional CEEMDAN-SVD algorithms, Kalman filtering, and wavelet transform denoising methods in terms of noise reduction performance. For sea trial data, the improved CEEMDAN-SVD algorithm proposed in this paper effectively suppresses mechanical noise generated by underwater gliders. Additionally, owing to the adaptive nature of the method, it also exhibits excellent noise reduction performance for non-stationary components across the full frequency band of marine environmental noise. This improvement provides high-quality preprocessed data for subsequent underwater acoustic target recognition tasks, significantly enhancing the reliability and accuracy of recognition algorithms.
In summary, the proposed method not only addresses the limitations of traditional denoising techniques but also demonstrates superior performance in practical applications, making it a valuable contribution to the field of underwater signal processing and target recognition.
2. Basic Principles
2.1. CEEMDAN
The CEEMDAN algorithm is an innovation on the idea of adding white noise to EEMD, which adds an adaptive white noise to each residual term and then performs EMD decomposition. The algorithm can basically reduce the reconstruction error to 0, and well overcome the problem of modal aliasing [
18], the reconstructed signal is basically the same as the original signal even under a smaller number of reconstructions, and largely improves the ability to deal with non-smooth signals. The disadvantage is that there is still no good solution for the endpoint effect. The following are the computational steps of the CEEMDAN algorithm:
(1) Gaussian white noise
is superimposed on the original noise-containing signal
,
forms the signal to be disassembled,
is the ith signal-to-noise ratio coefficient.
(2) The first decomposition was performed using EMD decomposition to obtain the first-order modal component
with residual
.
(3) Decomposition
, The second-order modal component
with residual
is obtained.
In the above equation is the operator of .
(4) Similarly, the above steps (2) and (3) are repeated for
to obtain the kth order modal component
with residual
. Until the residuals are less than a set threshold or the maximum number of iterations is reached, the order modal components and residuals are subsequently obtained.
(5) until the termination condition is satisfied, whereby the original signal
is decomposed into:
2.2. SVD
Singular value decomposition is used as a classical orthogonalized decomposition for noise reduction. For the hydroacoustic signal x. The SVD decomposition of the matrix is of the form:
where
and
are standard orthogonal matrices,
,
) is a non-negative diagonal matrix with decreasing elements,
. The first i singular values represent the information in the signal, which is the signal subspace, and the rest of the singular values represent the noise, which is the noise subspace, and then the singular values representing the noise can be obtained through the SVD inverse operation after the noise reduction matrix
by taking the zero, so how to determine the value of i determines the effect of the noise reduction is good or bad, and for the value of the i strategy can directly affect the results of the noise reduction is good or bad.
2.3. Singular Value Curvature Spectrum
There is a discrete signal
,
, based on this signal the Hankel [
18] matrix can be constructed as follows:
In the above equation . Hankel matrix essentially decomposes the original signal into a series of component signals of the simplicity of the summation, the biggest feature of the matrix is that the vector of the next row lags behind the previous row by only one data point, so for the original signal, the two rows have a strong correlation, which is specifically manifested in the first K singular values are larger, the singular value with the increase of K and become smaller, and there will be a clear trend of change. As for the noise signal, the two neighboring rows are not correlated, as shown in the singular value from the first item is almost equal to 0, and the image is presented as a straight line close to the X-axis. Therefore, the curvature of the singular value can be used to determine the magnitude of the change in the singular value, and ultimately determine whether the signal is a noise signal or a valid signal containing the original signal.
The formula for calculating the singular value curvature is as follows:
The singular value curve is composed of a sequence of singular values of the original signal, denoted
, which can be replaced by the difference, whose second order derivative is given by:
Its first order derivative is given by:
3. Improved Methods
The main flow of this improved method is shown in
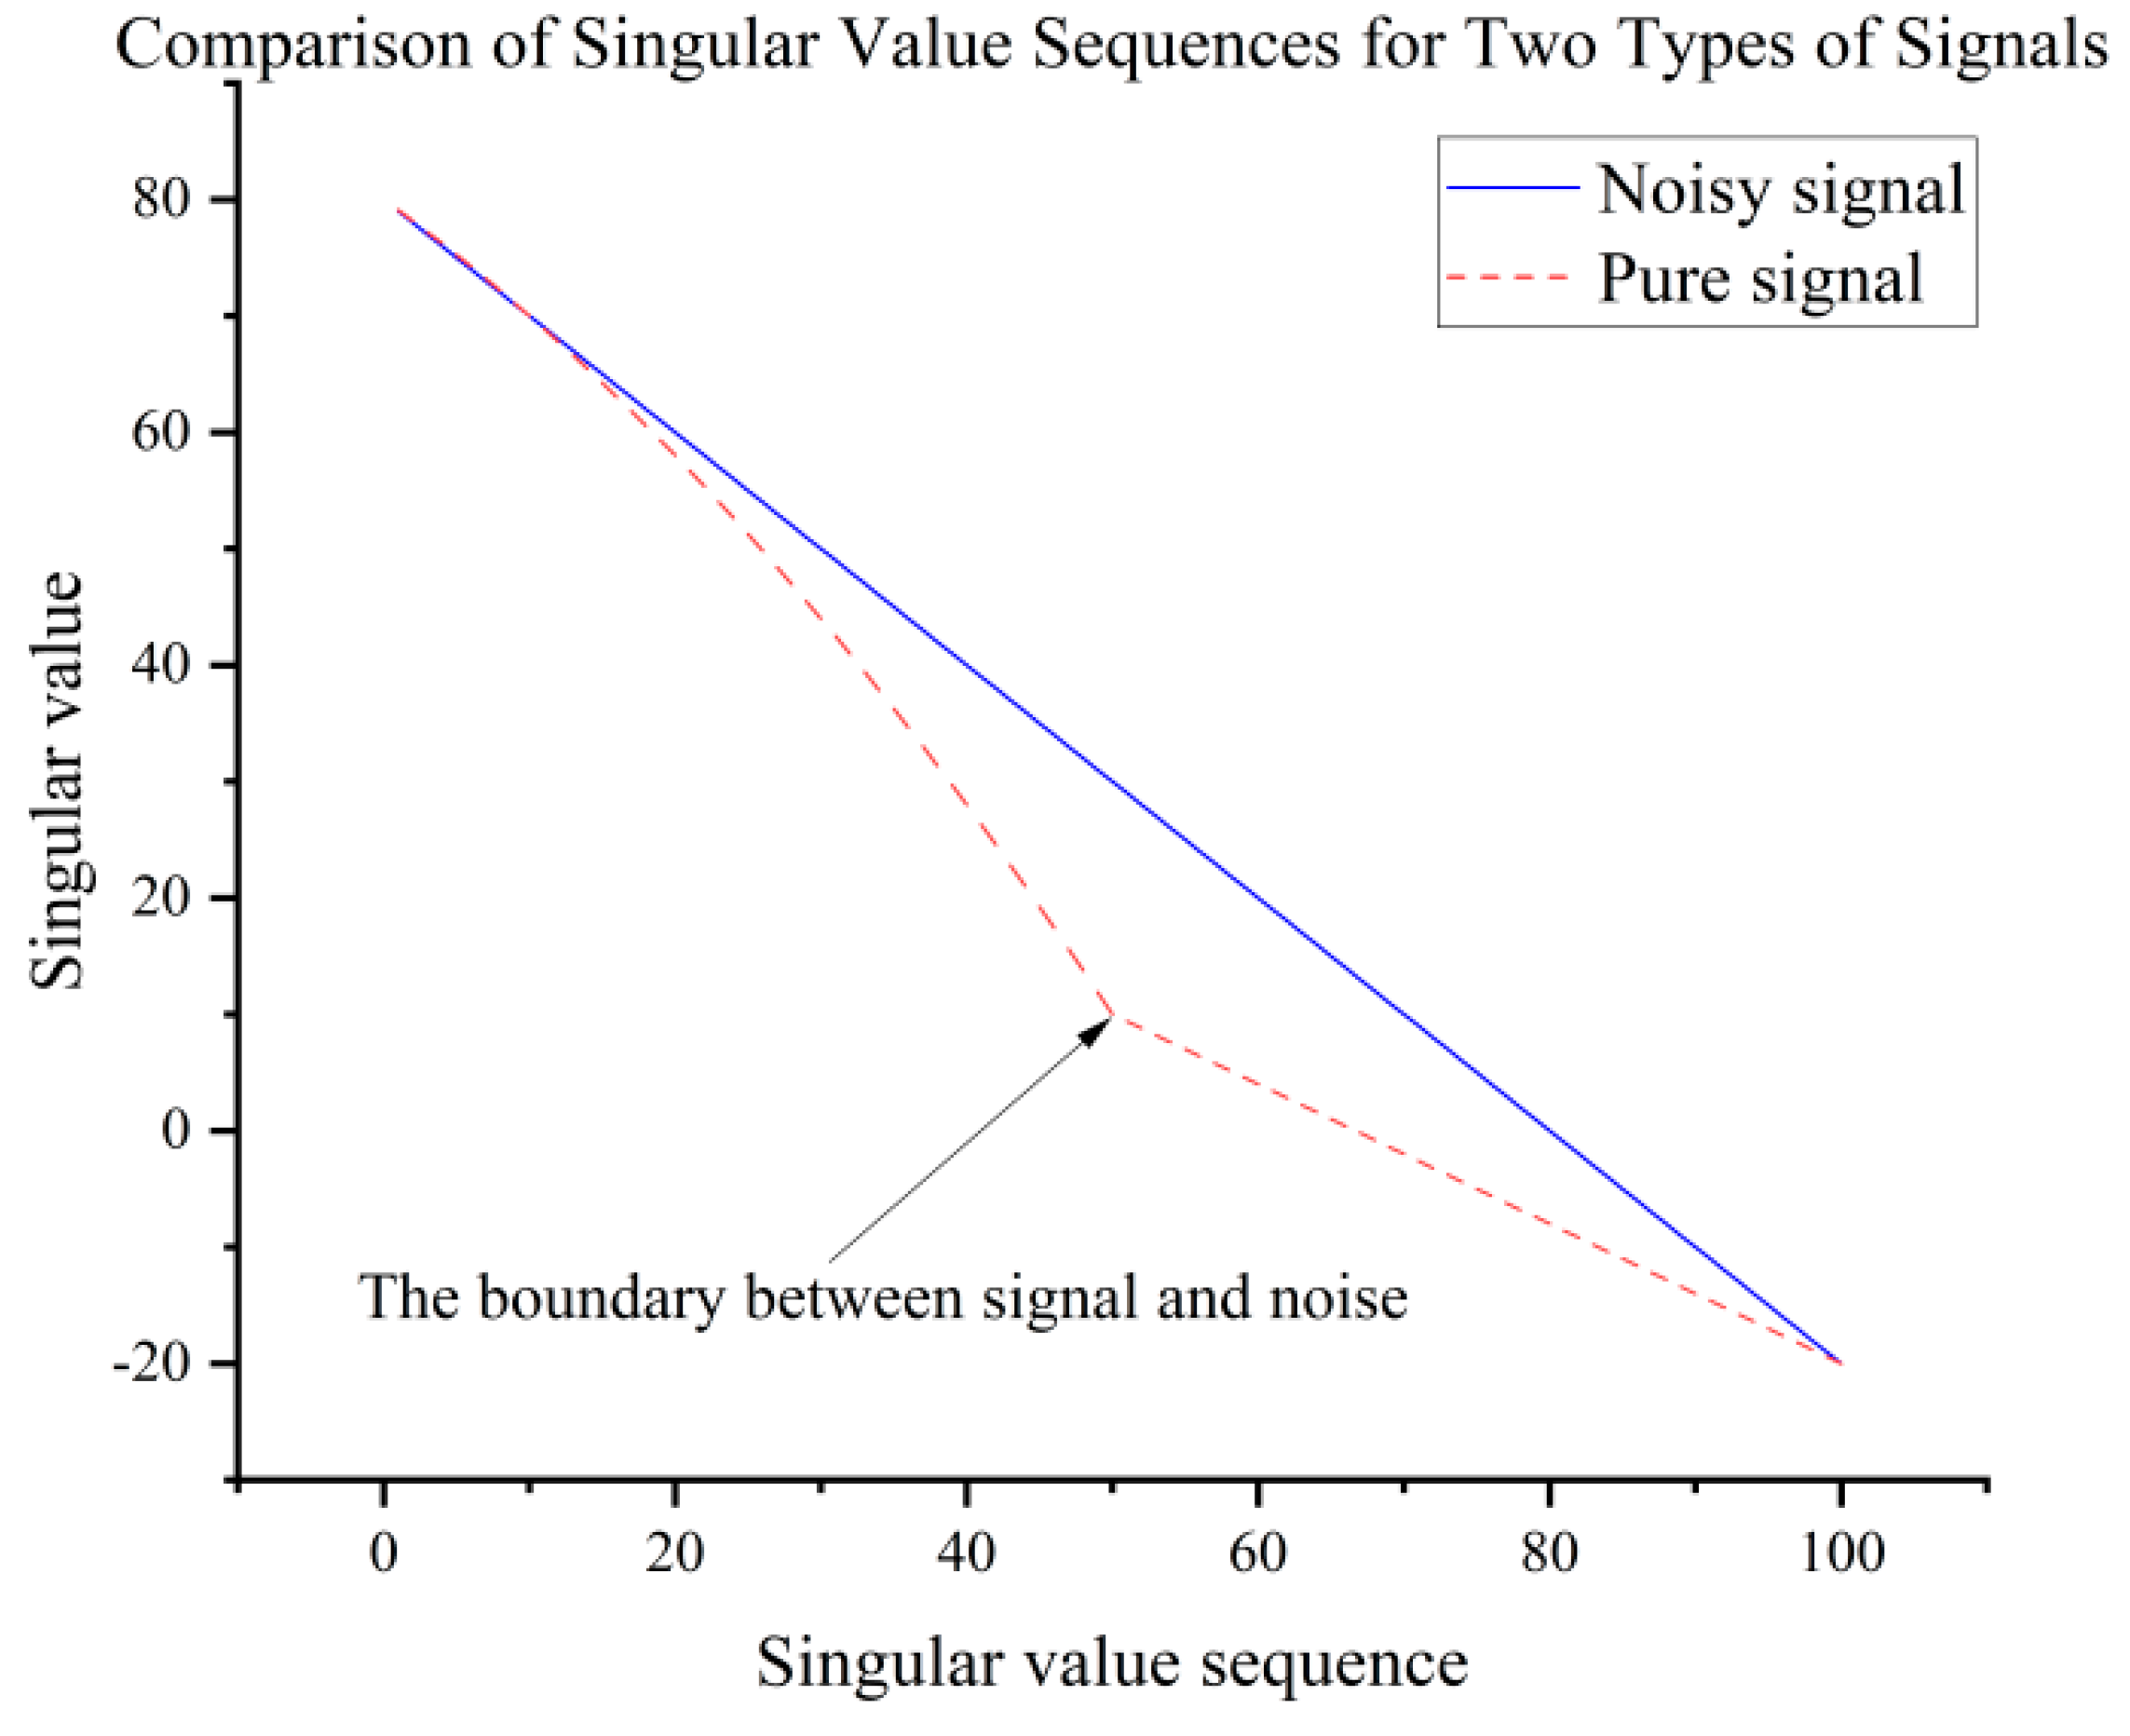
Figure 1, which is mainly divided into three parts: the CEEMDAN part, the SVD part and the pre-processing of noise. In the CEEMDAN method, in order to better distinguish the spurious IMF caused by overdecomposition and other noise components, this paper introduces the singular value curvature spectrum as an evaluation tool. The singular value curvature spectrum, as a quantitative expression of the degree of curvature of the singular value sequence, can intuitively reflect the rate of change characteristics of the singular value sequence. In the field of signal processing, there is a significant difference between the performance of pure signals and noise-containing signals on the singular value series. Specifically, the singular value series corresponding to an ideal pure signal usually shows a smooth trend, similar to a straight line, which indicates that the noise level is very low and there is no significant signal-to-noise transition point. For noisy signals, on the other hand, there is a sharp drop in the singularity at a certain point, and the inflection point shown in
Figure 2 below usually represents the demarcation point between the signal characteristics and the noise characteristics.
Since signals decomposed by CEEMDAN (Complete Ensemble Empirical Mode Decomposition with Adaptive Noise) are theoretically considered to be single-modal signals [
19], this paper utilizes the sum of the singular value curvature spectrum (Q
sum) as an indicator to measure the proportion of the original signal in each IMF (Intrinsic Mode Function), thereby assessing the validity of the IMF. Typically, a threshold for Q
sum is set as a criterion for judgment. If the Q
sum value of an IMF is below this threshold, it indicates that the original signal contained in that IMF component is minimal and can be neglected, and the entire IMF can be regarded as noise. Conversely, if the Q
sum value exceeds the threshold, the IMF is considered to be a valid signal. Furthermore, based on the characteristics of empirical mode decomposition, it is practically impossible for a pure signal to constitute an IMF alone. Therefore, it is generally assumed that IMFs with higher Q
sum values contain more information from the original signal, while those with lower Q
sum values contain more noise. By analyzing the singular value curvature spectrum, it is possible to more accurately identify and retain IMF components that contain significant features while discarding IMF components with higher noise content, thereby optimizing the signal processing outcome. In summary, the proposed method leverages the singular value curvature spectrum to distinguish between noise-dominant and signal-dominant IMFs, ensuring that the signal reconstruction process retains the most relevant information while effectively suppressing noise. This approach enhances the precision and reliability of signal decomposition, providing a robust foundation for subsequent signal analysis and processing tasks.
The proposed improved method, to some extent, circumvents or mitigates the inherent limitations of CEEMDAN. Firstly, although CEEMDAN suffers from poor real-time performance due to its high computational complexity, in the application scenario of underwater gliders, data processing is typically conducted post-sea trials, with only a portion of simple computations being performed in real-time on the DSP (Digital Signal Processor) floating-point arithmetic unit. The denoising process is primarily executed offline in a laboratory setting, and thus, the issue of computational complexity does not pose a significant obstacle in practical applications. Secondly, while CEEMDAN effectively alleviates the mode mixing problem present in traditional EMD through its iterative strategy, the endpoint effect remains inadequately addressed. To tackle this issue, the improved method proposes the use of traditional endpoint extension techniques combined with a strategy of discarding signal intervals near the endpoints. This approach aims to minimize signal distortion to the greatest extent, thereby enhancing the precision of signal processing. Although this method increases computational load to some degree, the improvement in signal fidelity is of significant importance.
In the SVD denoising method, the selection of the threshold for reconstructing singular values plays a decisive role in the effectiveness of noise reduction. However, many existing denoising methods do not place sufficient emphasis on threshold selection, making it difficult to accurately distinguish between the noise subspace and the signal subspace. This issue can lead to two potential consequences: on one hand, weak but meaningful signal components may be misclassified as noise and discarded; on the other hand, some noise may be erroneously retained and included in the signal reconstruction, thereby compromising the denoising performance. To address this problem, this paper proposes an SVD threshold truncation strategy based on noise characteristics and the differential spectrum of singular values. The aim is to achieve more precise separation of noise and signal through improved threshold selection, thereby enhancing the accuracy and reliability of denoising.
Firstly, within the eigenvalue sequence of the IMFs, the eigenvalue closest to the maximum noise eigenvalue is identified as the reference point pp. Subsequently, within a certain range around point p, the maximum point k in the differential sequence of singular values Ci(t) is located. Singular values preceding point k are considered to contain valid information from the original signal and are thus retained, while singular values following point k are regarded as noise and set to zero. The maximum eigenvalue of noise encapsulates its primary components and characteristics; however, directly applying SVD to the original signal and utilizing the maximum noise eigenvalue for denoising yields suboptimal results. Through CEEMDAN decomposition, the obtained IMF components are single-component signals that satisfy specific conditions. Among these, valid IMFs contain components of motor background noise similar to the original signal. Therefore, utilizing the maximum singular value of the noise itself as the denoising benchmark offers significant advantages. Simultaneously, the differential spectrum of singular values is employed to precisely delineate the boundary between signal and noise, thereby determining the optimal threshold to achieve the best possible denoising effect.
4. Simulation Analysis Study
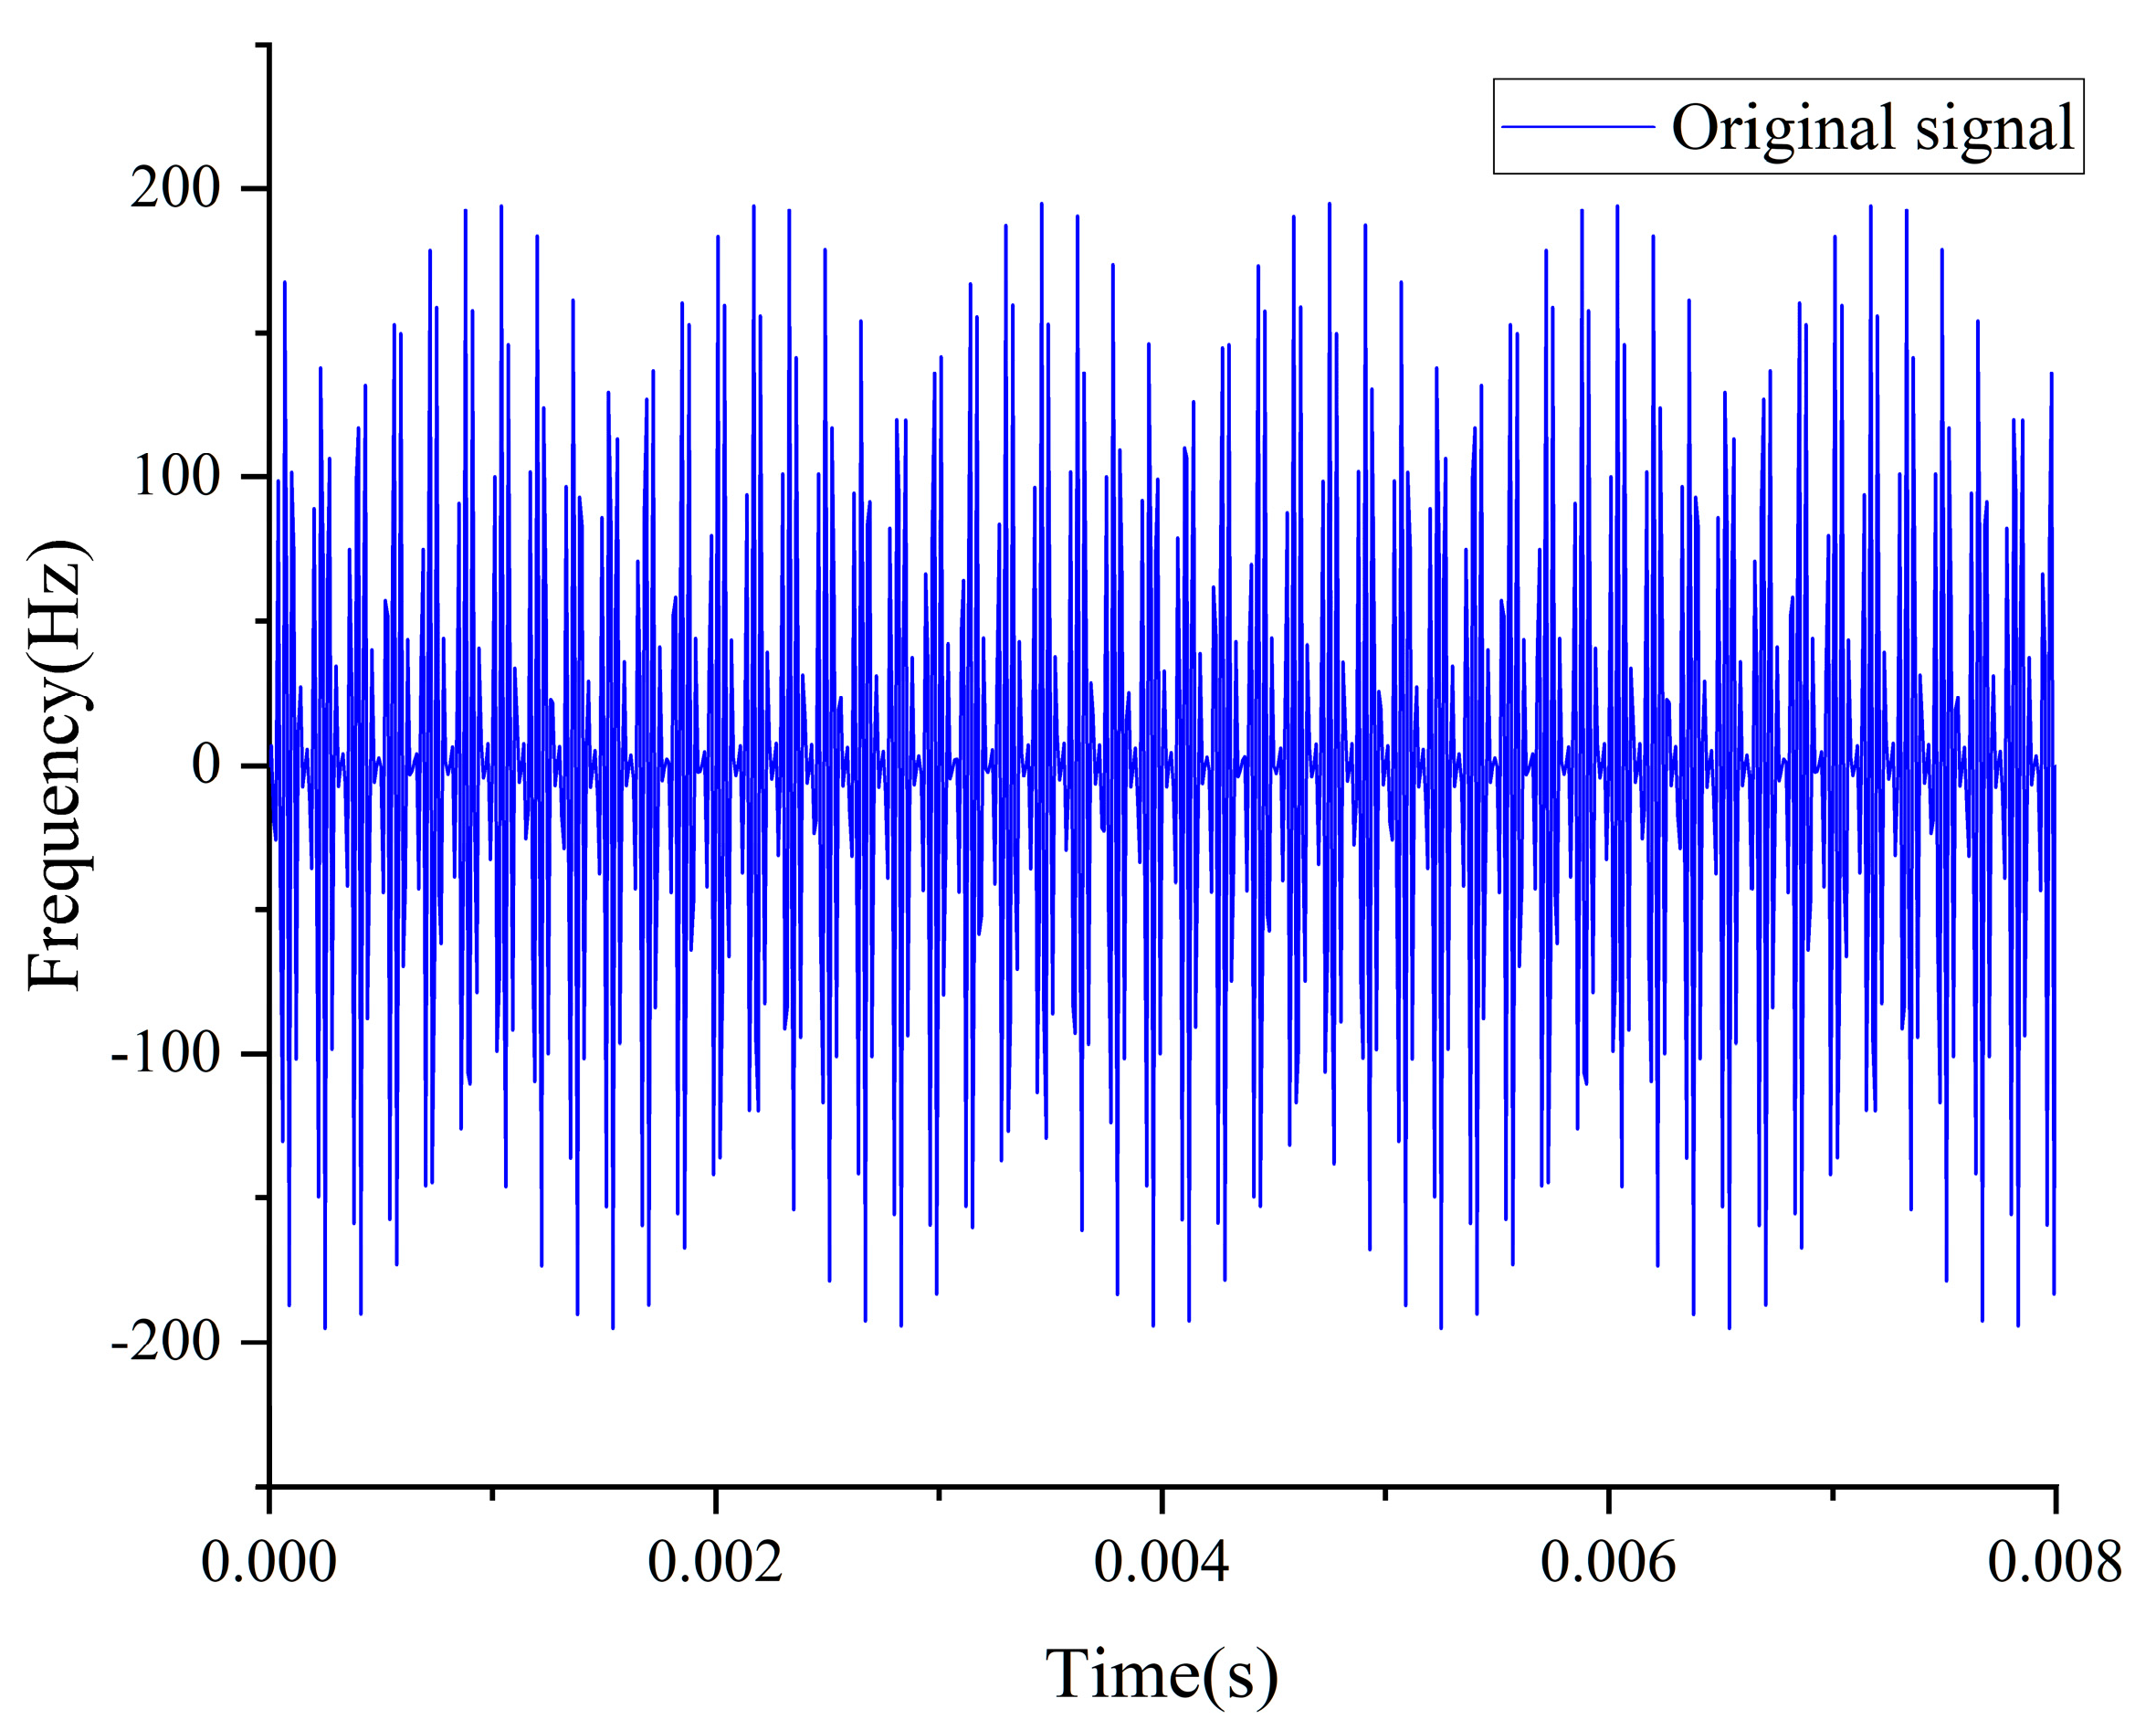
Set the original signal as
x(
t), to simulate the signal received by a single scalar hydrophone in the acquisition process of the underwater glider, the number of iterations of CEEMDAN is uniformly set to 1000, and the standard deviation multiplier of the white signal is set to 0.2 after a number of experiments to make sure that it will not appear modal aliasing, which is used as a parameter to conduct the experiments as in
Figure 3 below;
White noise with mean 0 and variance 2500 is added to the original signal to simulate the motor noise in operation, and the signal-to-noise ratio of the noise-containing signal is about 5 dB, and the mirror extension [
20] with the same length is performed at each end respectively to reduce the influence of the endpoint effect [
21] on this comparison experiment. The noise-containing signal is subjected to CEEMDAN decomposition, and then
is ranked in descending order according to the energy of each IMF, and N is the number of IMFs decomposed by CEEMDAN, as shown in
Figure 4.
The original signal CEEMDAN decomposition operation will be performed to obtain the IMF
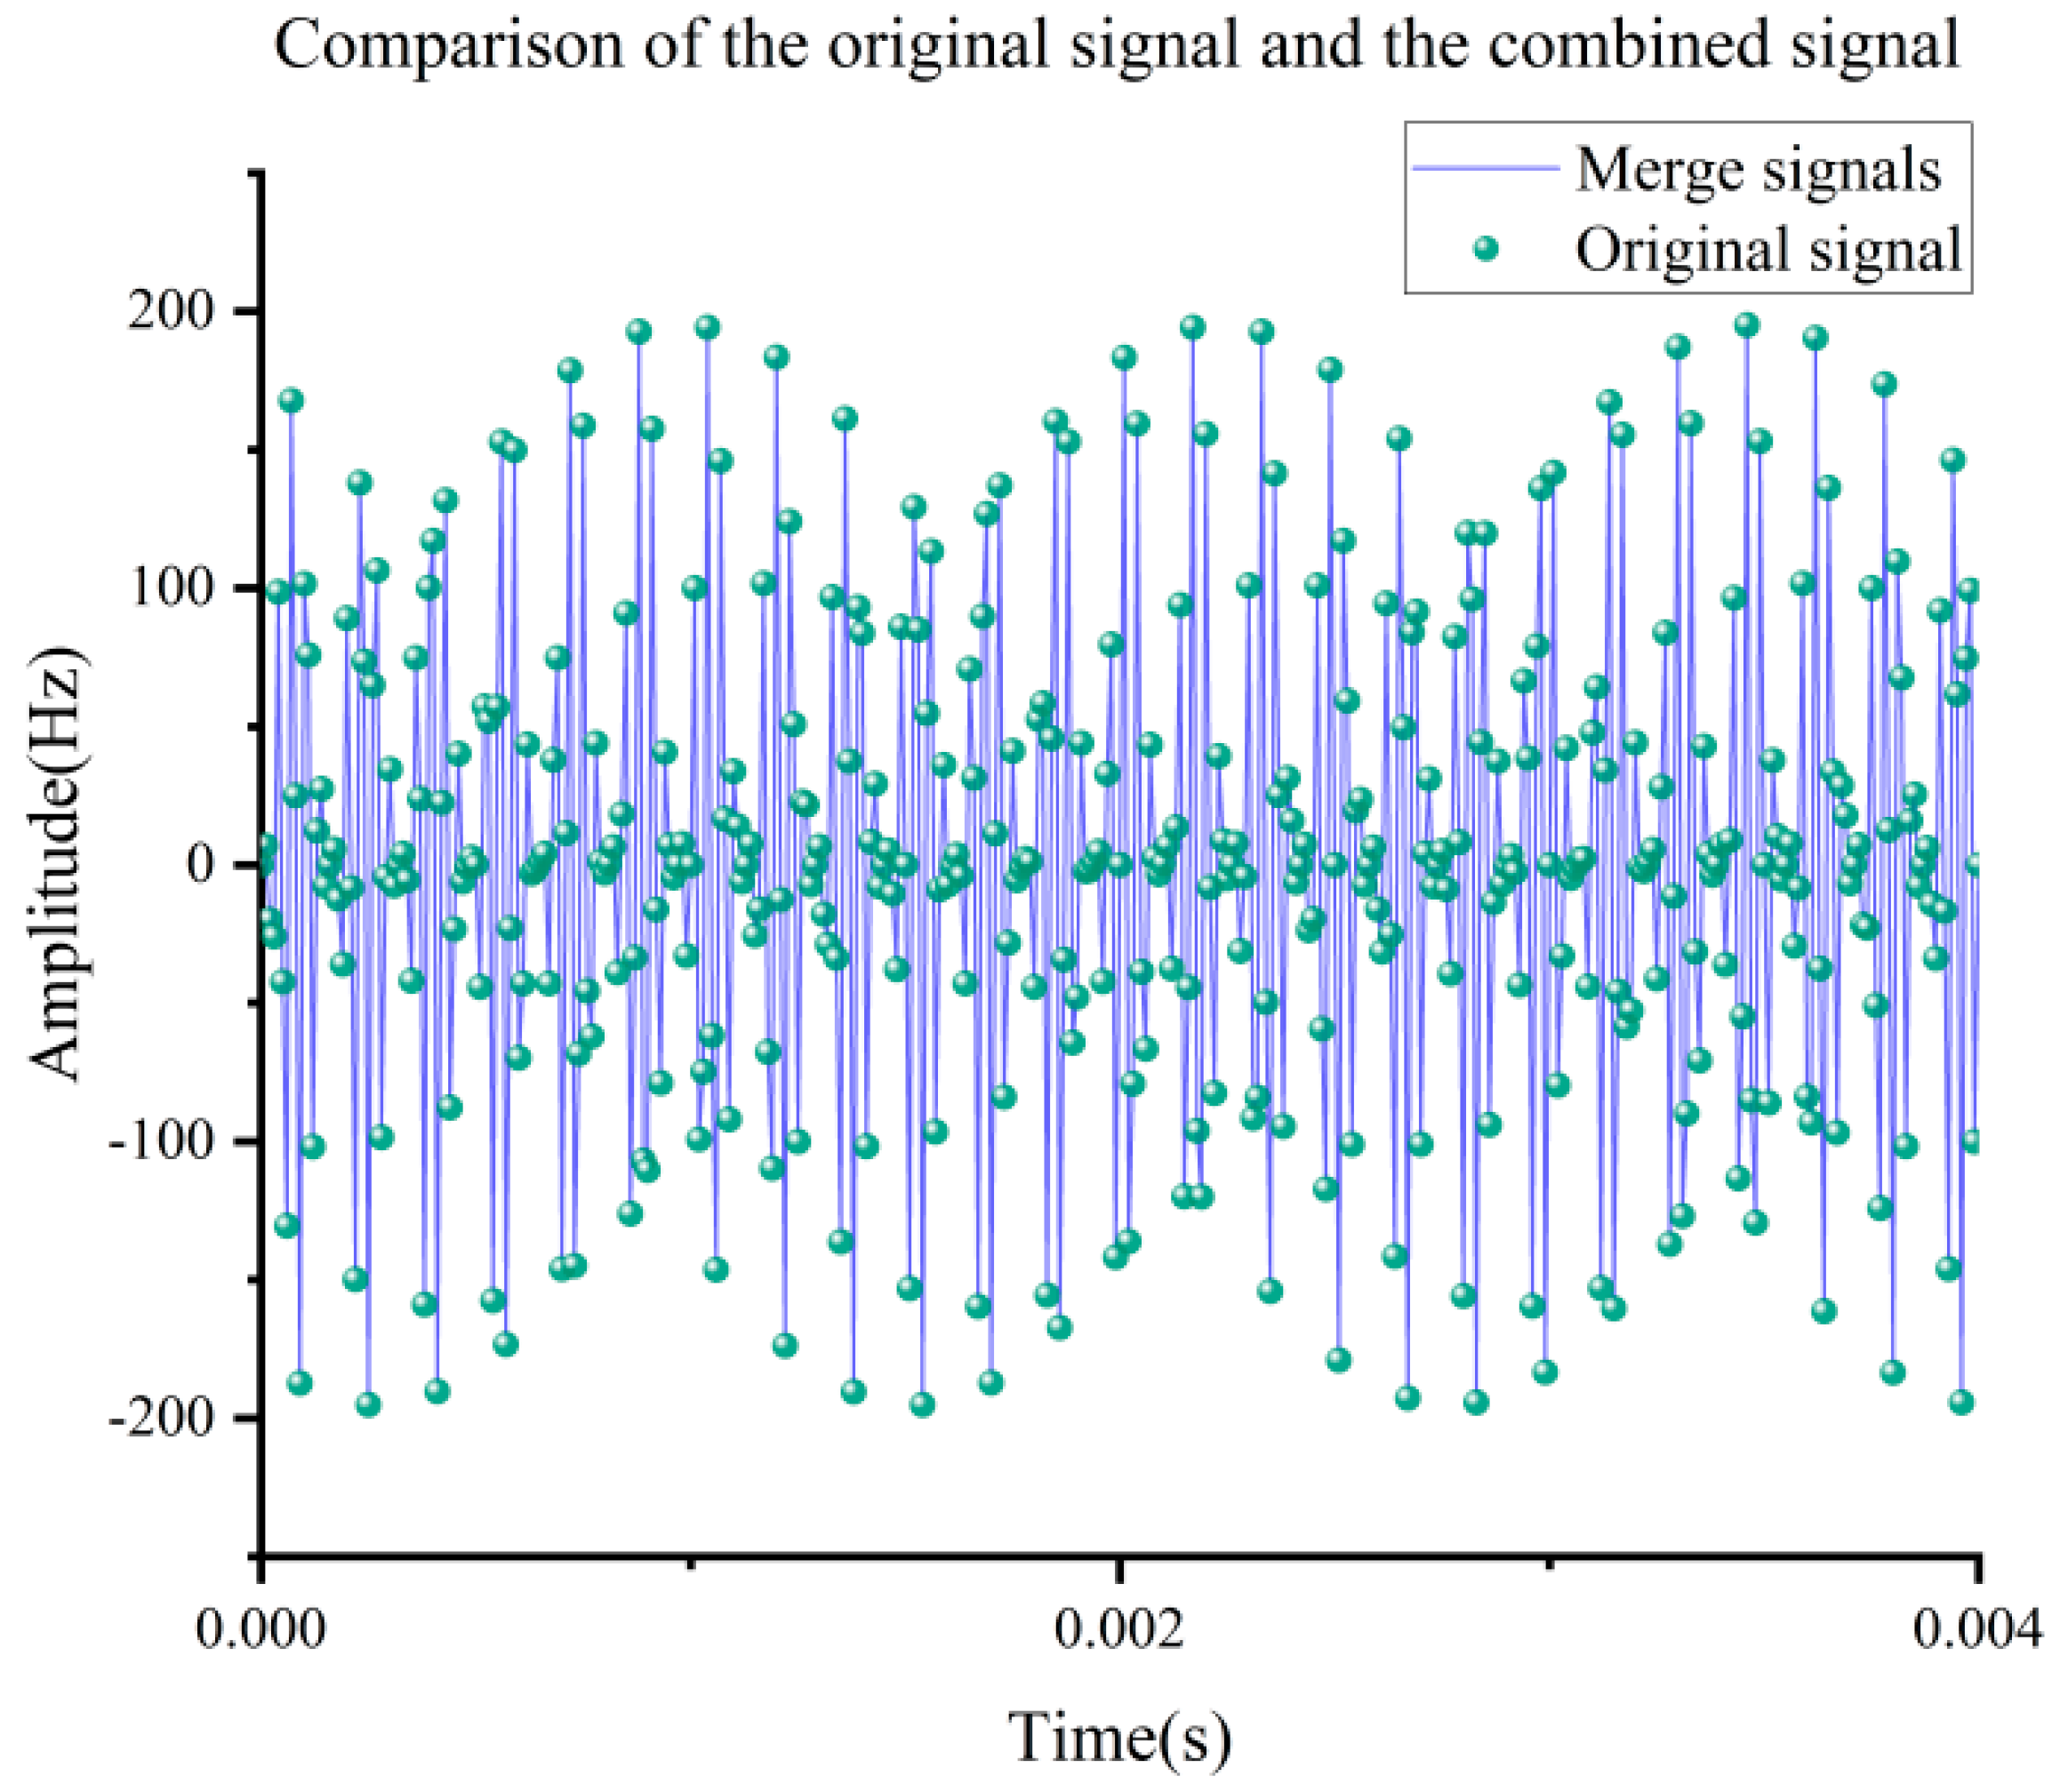
1-8 as well as the residual Res, where it can be seen that the decomposed IMF is essentially free of aliasing. The original signal CEEMDAN decomposition operation will be performed, and the decomposed sub-signals will be recombined to obtain
Figure 5. It can be seen from the figure that the folds and scatters are almost completely overlapped, which illustrates the excellent performance of CEEMDAN in noise processing, and there is almost no signal distortion or modal aliasing. After obtaining the IMF components, the validity of each IMF component needs to be determined to ensure the accuracy of the subsequent analysis. Here, this paper adopts the singular value curvature spectrum CEEMDAN noise reduction method based on singular values. The specific steps are as follows:
Singular value decomposition: the SVD decomposition is computed for the background noise and each IMF to obtain the maximum singular value of the noise, maxnoise, and the corresponding sequence of singular values of IMF(i), Si(t), respectively.
Singular value curvature calculation: based on the singular value sequence Si(t) obtained by SVD, the singular value curvature of each IMF is calculated to obtain its singular value curvature sequence Qi(t).
Normalization Calculation: Normalize the singular value curvature sequence Qi(t) and compute the proportion of curvature contributed by each IMF component.
Proportion Calculation: Further calculate the standard deviation of the Qi(t) sequence to quantify its fluctuation. The computed standard deviation is denoted as σ.
Validity threshold setting: based on the proportion of IMF singular value curvature, set a threshold to distinguish the validity of the IMF, which is based on a large number of experiments, generally
[
22], here set to
, this value allows more IMF components to pass the screening, which makes the recovered signals more accurate, but it also makes it more difficult to follow up the SVD processing, this parameter integrally takes into account the relationship between the noise and the signal.
The sum of the singular value curvature spectra in each IMF can be used as a measure of how much of the original signal components are in the IMF component. An IMF component that exceeds a threshold is a valid signal, i.e., the IMF component contains a sufficient number of components of the original signal, and vice versa is regarded as an invalid noise signal. Through the above steps, the method can not only effectively assess the validity of each IMF component, but also exclude invalid noise signals in the subsequent signal processing and analysis, and improve the accuracy and reliability of the analysis.
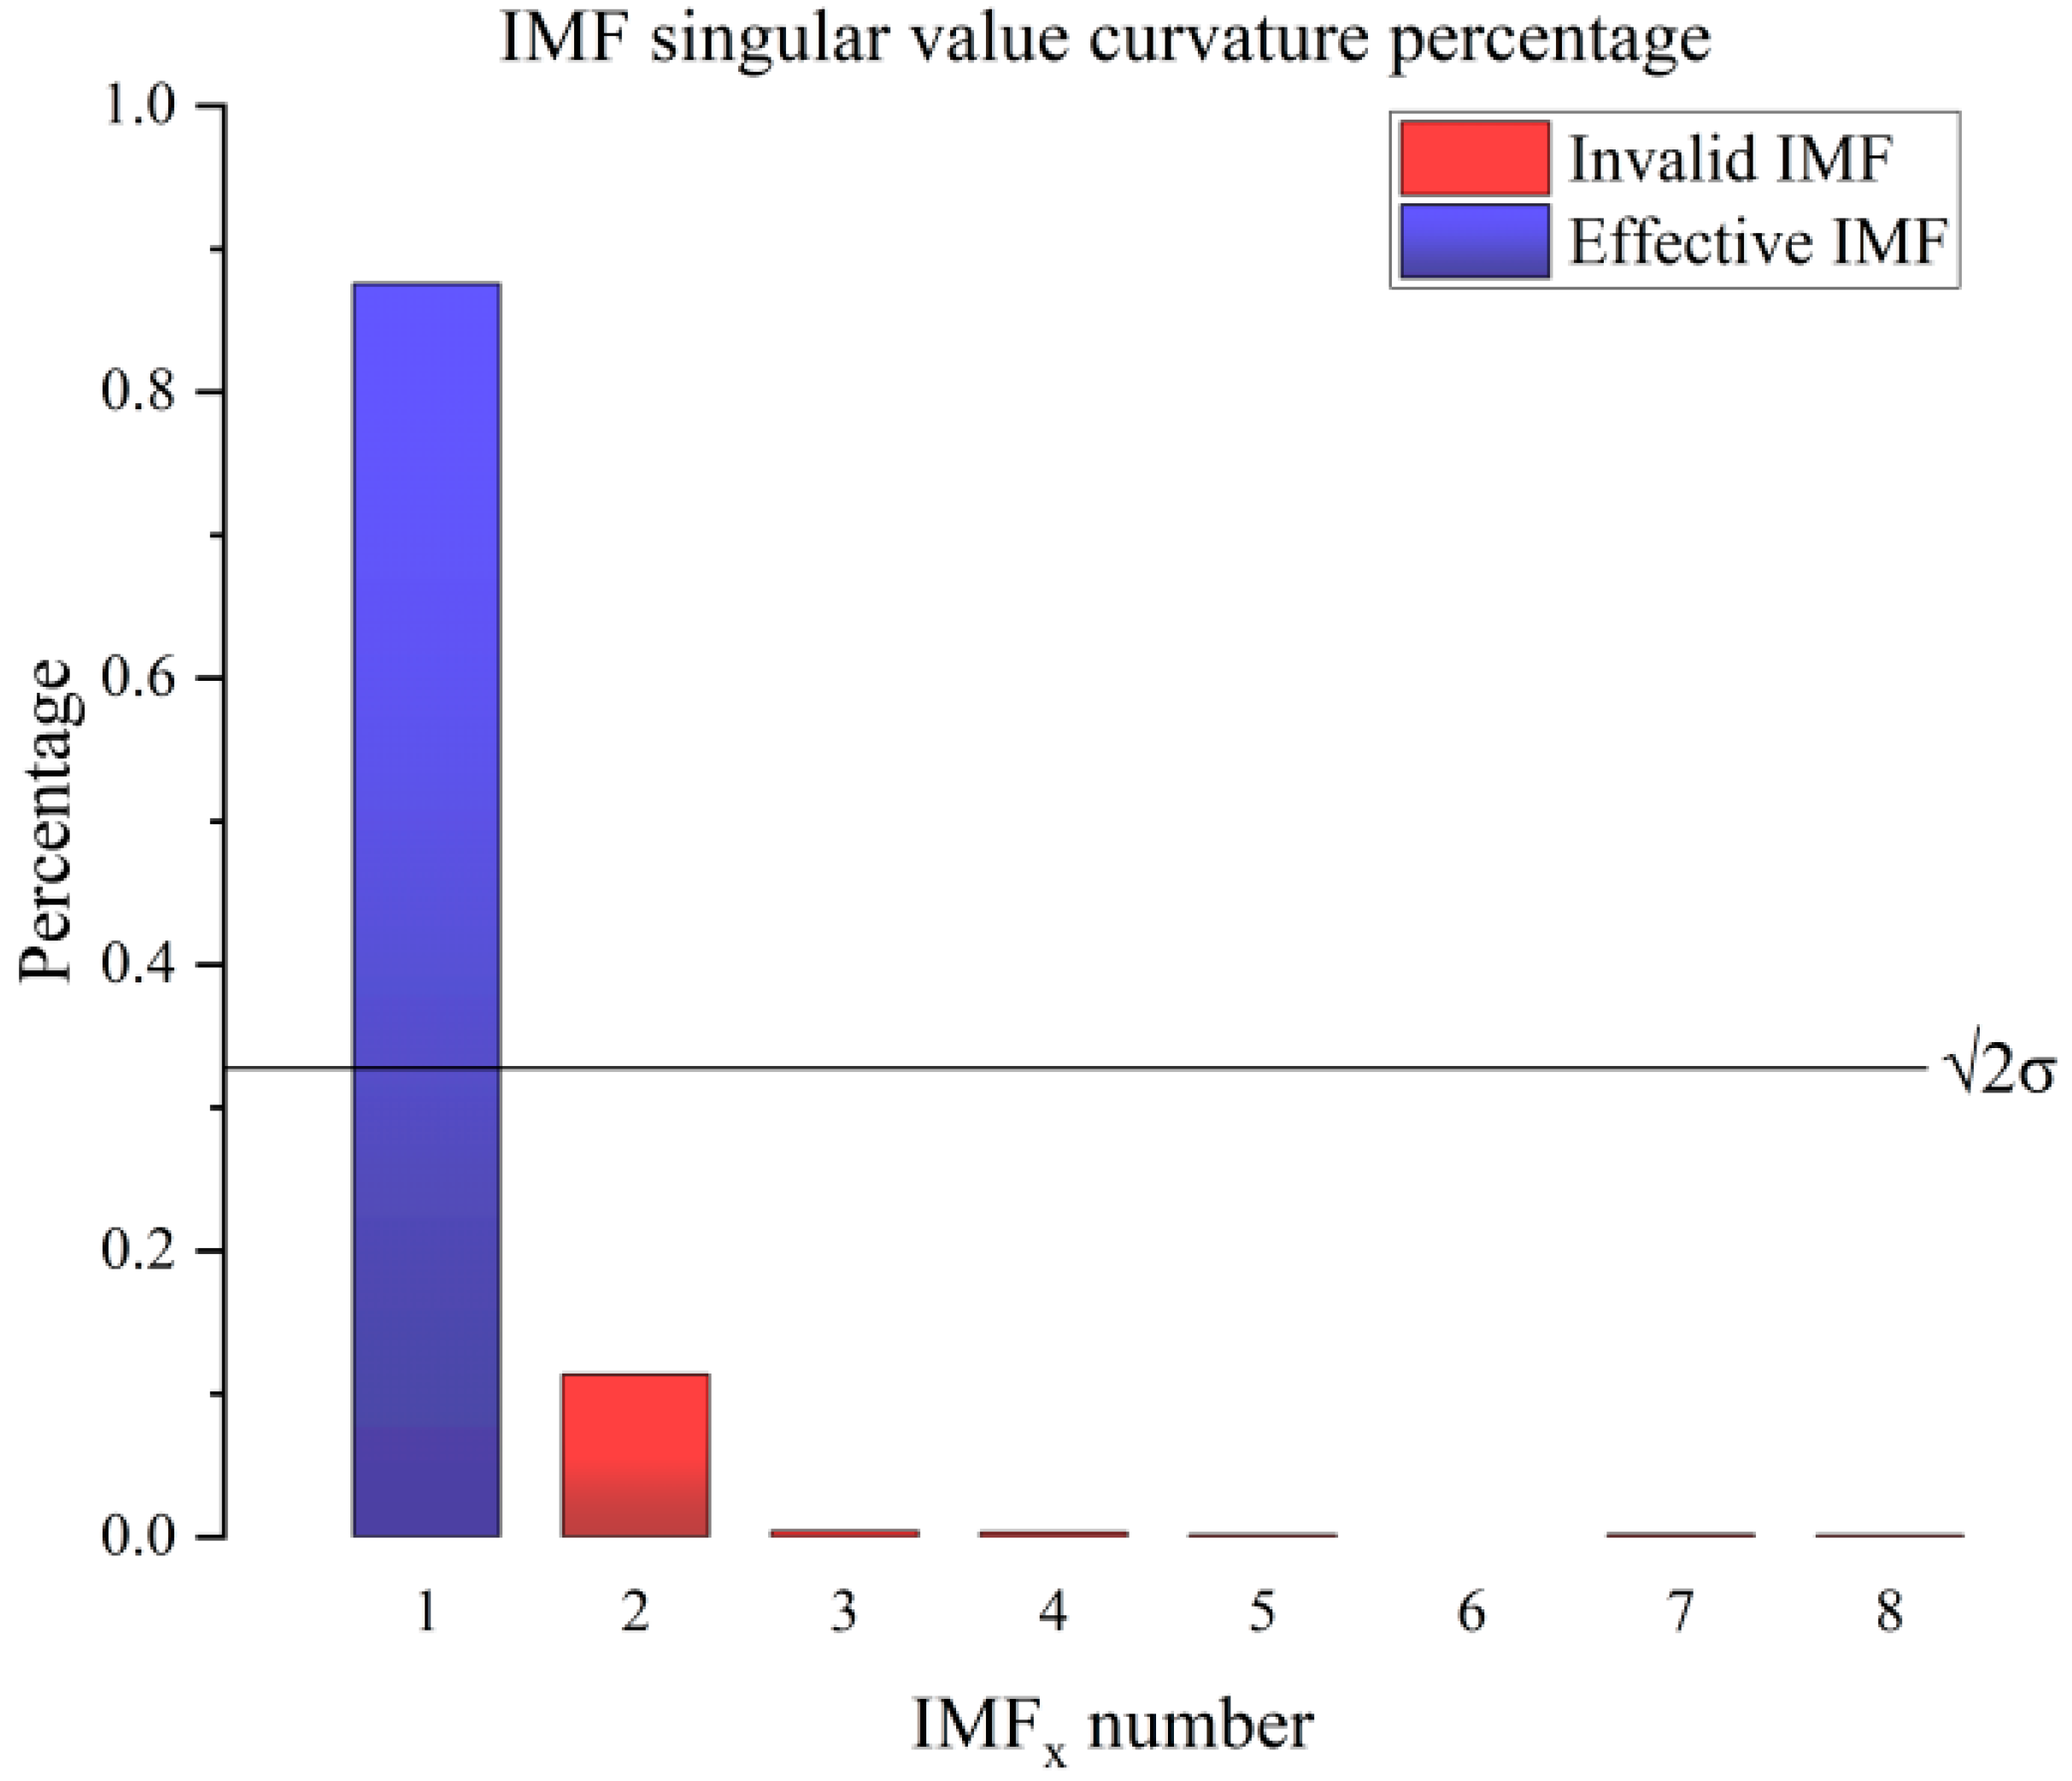
First, the valid IMFs are screened by setting a threshold value to remove IMFs 2~IMFs 8 according to the threshold value, as shown in
Figure 6. That is, the valid signal is considered to exist only in IMF1. At this time there is still some noise in IMF1, so the valid signal IMF1 is then subjected to SVD noise reduction.
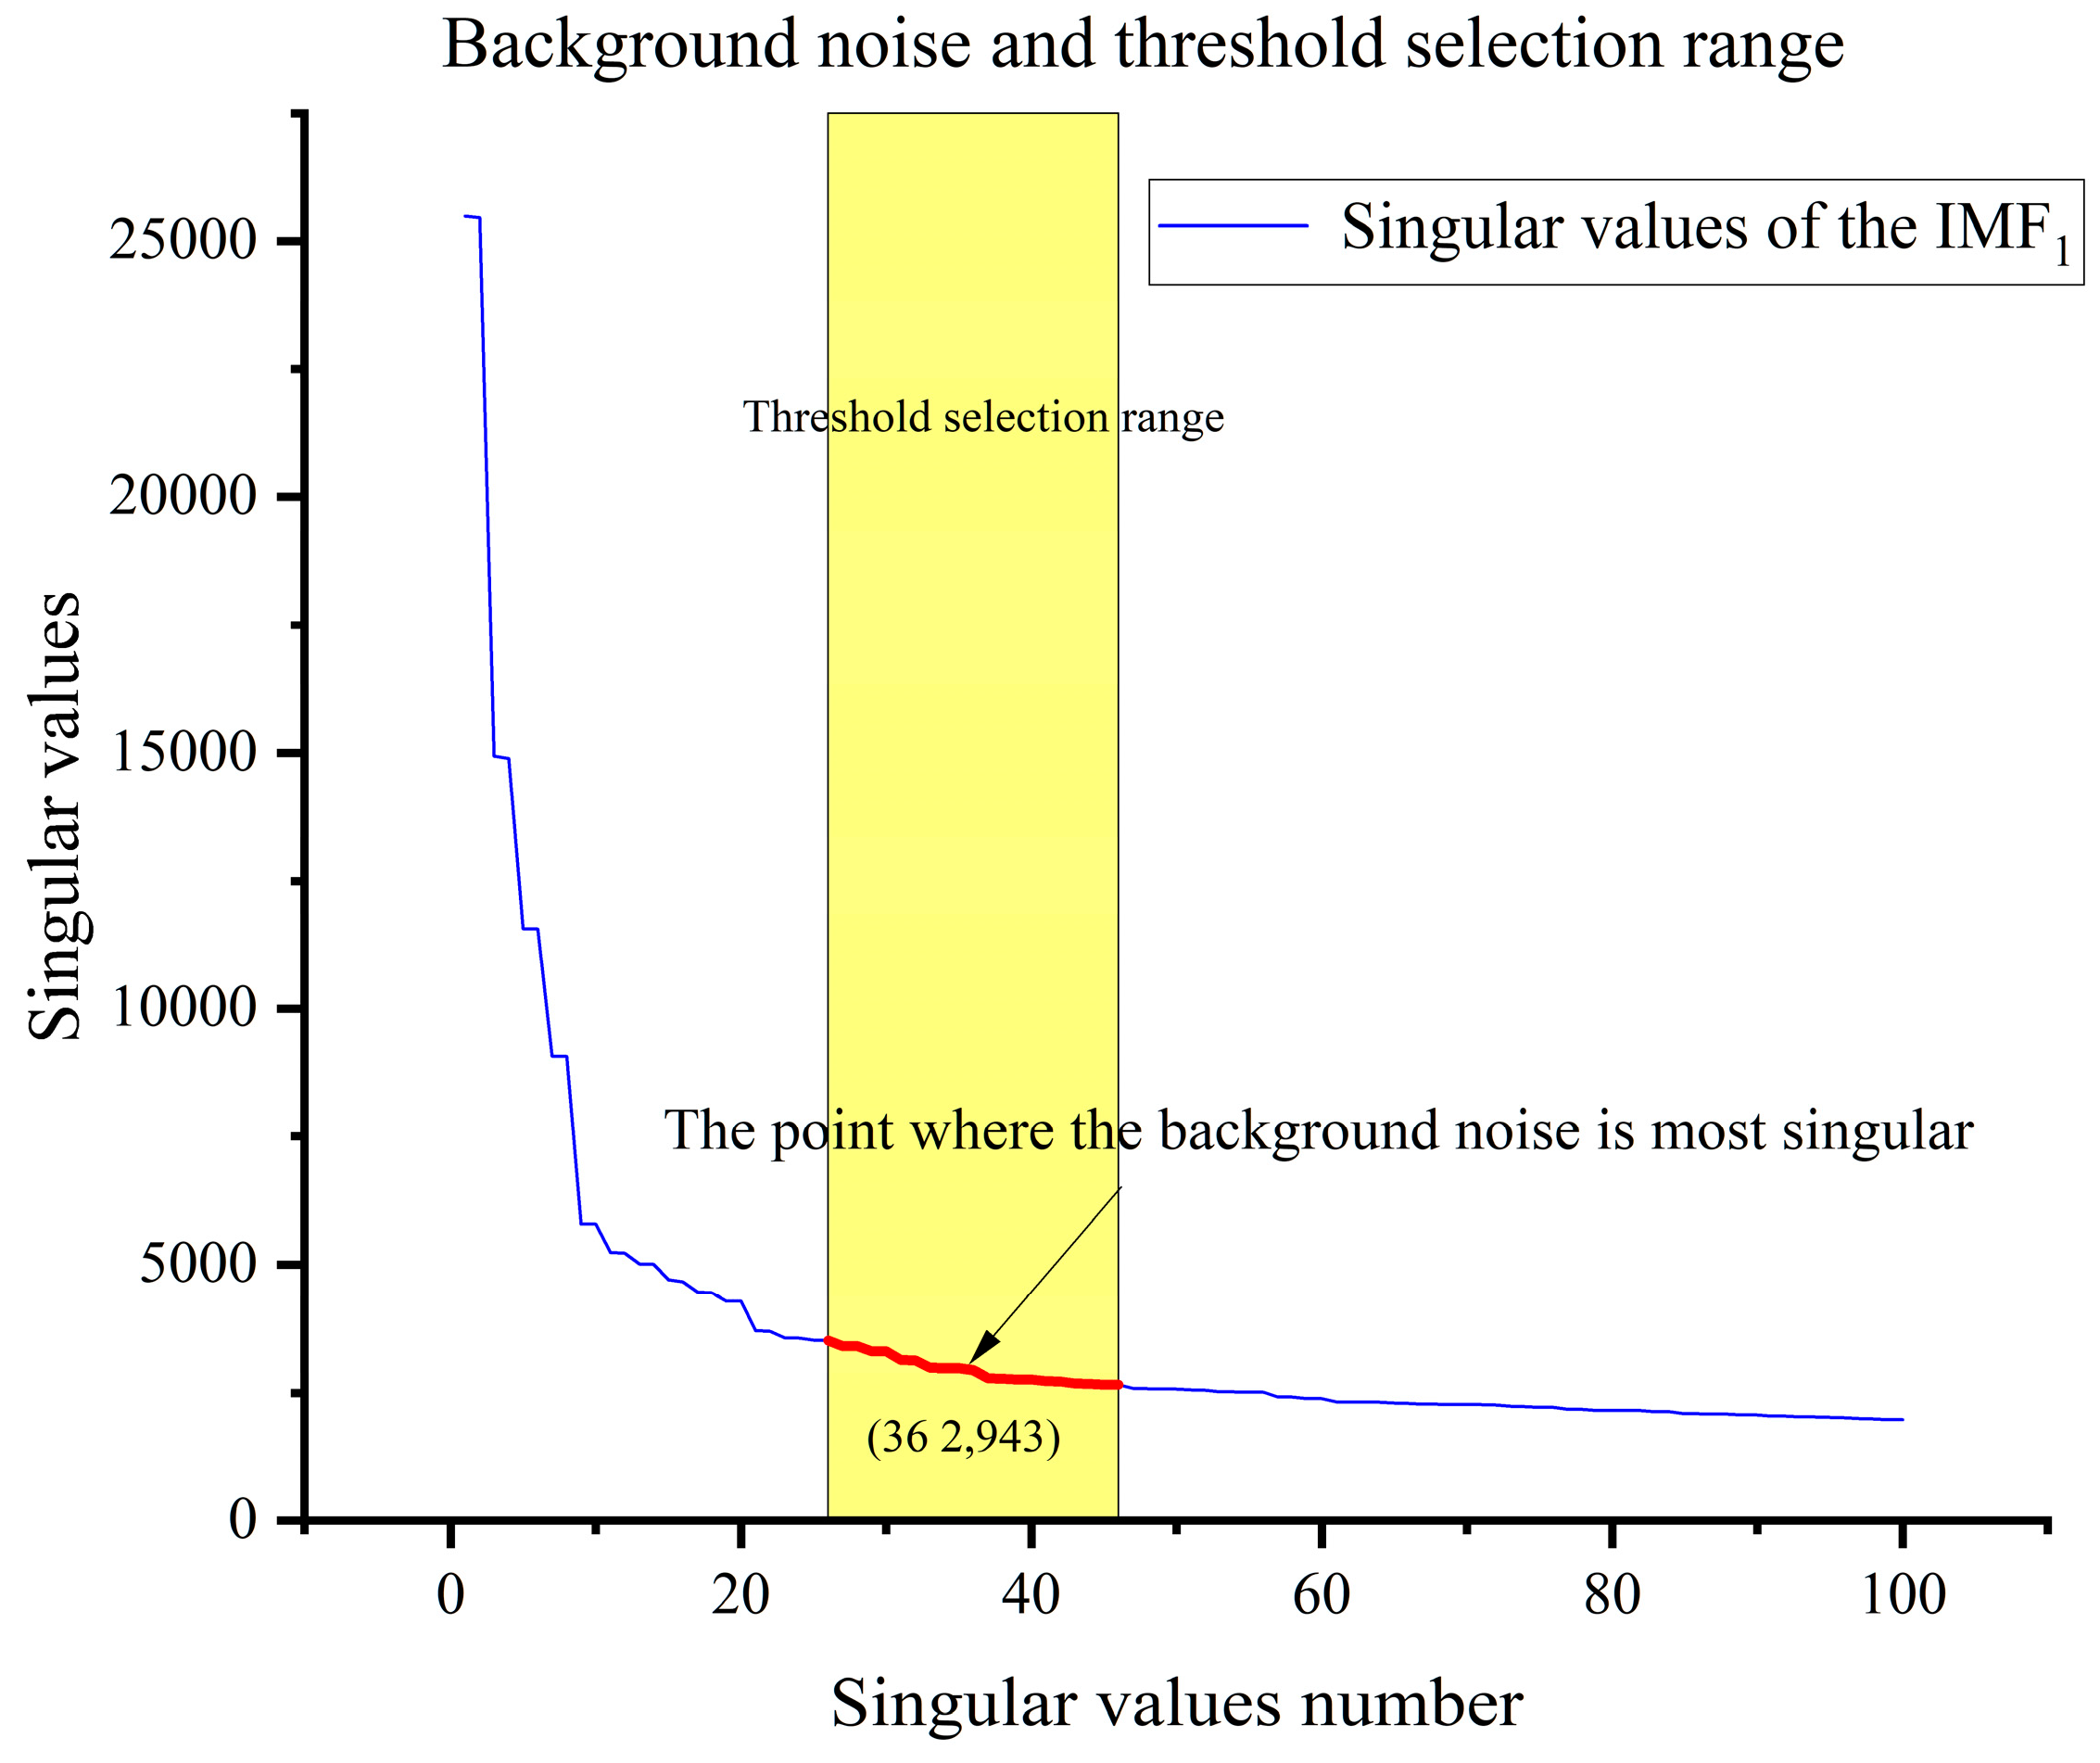
To better distinguish the signal from the noise, the singular value location Sk closest to the maximum singular value of the noise, maxnoise, is searched for in the singular value matrix of the effective IMF. At the same time, since the signal-noise divide generally occurs at a sharp decrease in the singular value (i.e., at the extreme value of the difference sequence), the extreme value of the singular value difference sequence Ci(t) near k is searched for. The position of the maximum singularity not more than 10 away from the maximum singularity of the noise is set as the possible threshold range for singularity reconstruction, as shown in
Figure 7 below, and then the maximum value in the singularity difference spectrum is selected as the cut-off point for SVD reconstruction in the possible threshold range, as shown in
Figure 8 below, because the singularity theory considers that singularity after point k is caused by noise after SVD decomposition of the real noisy signals, and so it should be cleared to zero. Finally, the signal which was originally lengthened by mirror extension is truncated at the beginning and the end of the length of the previous extension, and is restored to the original one-dimensional signal, i.e., the signal after noise reduction.
In order to eliminate the influence of random noise on the noise reduction effect, in this study, as shown in
Table 1, aboveunder the same parameter conditions, two different methods, the traditional CEEMDAN-SVD and the improved CEEMDAN-SVD, are used to perform simulations under the same parameters, and the average of the MSEs of the seven simulation results is taken as the criterion for the final judgement of the noise reduction effect.
In the traditional SVD noise reduction methods, many choose the location of the largest gradient drop in the singular value as the demarcation point between the signal and the noise, and this method has significant limitations when the signal-to-noise ratio is too low, and it is often difficult to accurately determine the demarcation point, which leads to the instability of the noise reduction effect. The SVD noise reduction method based on maximum singular value noise reduction and singular value difference of background noise can limit the range of singular value to a suitable range through a priori information, which significantly improves the stability of the noise reduction effect.
In order to comprehensively assess the noise reduction effect, this study used the mean square error (MSE) [
23], the absolute and maximum values of the skewness as a measure. The mean square error represents the degree of deviation of the signal after noise reduction from the original signal, the smaller it is, the closer it is to the original signal, and vice versa, the larger the deviation is. Skewness is a measure of the direction and degree of skewness, when the skewness is 0, it represents the overall normal distribution, with symmetrical tail lengths on both sides, while the skewness of the original signal is negative fifteen orders of magnitude, which can be almost regarded as zero, and the smaller the absolute value of skewness represents the more symmetrical before and after the noise-canceled signal and vice versa, which is more skewed, and this measure can show the overall smoothness of the signal after the noise-canceled signal [
24]. The maximum value represents the deviation of the extreme point, and the maximum value of the original signal is about 195.7, so the closer the maximum value is to 195.7 means that the noise reduction method better preserves the amplitude characteristics of the original signal, and vice versa may mean that the signal is distorted.
As shown in
Table 2,The proposed CEEMDAN-SVD method based on noise characteristics achieves an average reduction of 17.9% in Mean Square Error (MSE). According to the simulation results, the improved CEEMDAN-SVD method demonstrates significantly superior denoising performance compared to the traditional CEEMDAN-SVD method, wavelet transform denoising, and Kalman adaptive filtering methods. This experiment primarily focuses on the denoising effectiveness under conditions of low signal-to-noise ratio (SNR) and strong interference, showcasing its performance limits in such challenging scenarios. Under conditions of high SNR and weak interference, the method is expected to exhibit even more pronounced and superior results. Through the aforementioned approach, this study successfully achieves effective denoising of hydroacoustic signals under low SNR and non-stationary signal conditions, providing a novel perspective and methodology for the field of hydroacoustic signal denoising.
5. Pilot Study
In July 2023 in a certain sea area in the South China Sea, we carried out an offshore experiment using an underwater glider. The maximum observation depth of the underwater glider used in this experiment was 1589.54 m, and the total working time was 360 h, and a total of 103 profiles were successfully collected, in which each profile movement can be divided into the surface waiting, submerging and gliding, oil draining, and surfacing phases, in which the oil draining phase is significantly manifested as a high-noise environment, which is used as the original signal of the experiment. The aim of this study is to effectively deal with the signal denoising problem in such complex environments through an improved algorithm. Among them, the oil discharge stage is significantly characterized as a high-noise environment, which is used as the original signal for the experiment. This study aims to effectively deal with the signal denoising problem in such complex environments through an improved algorithm.
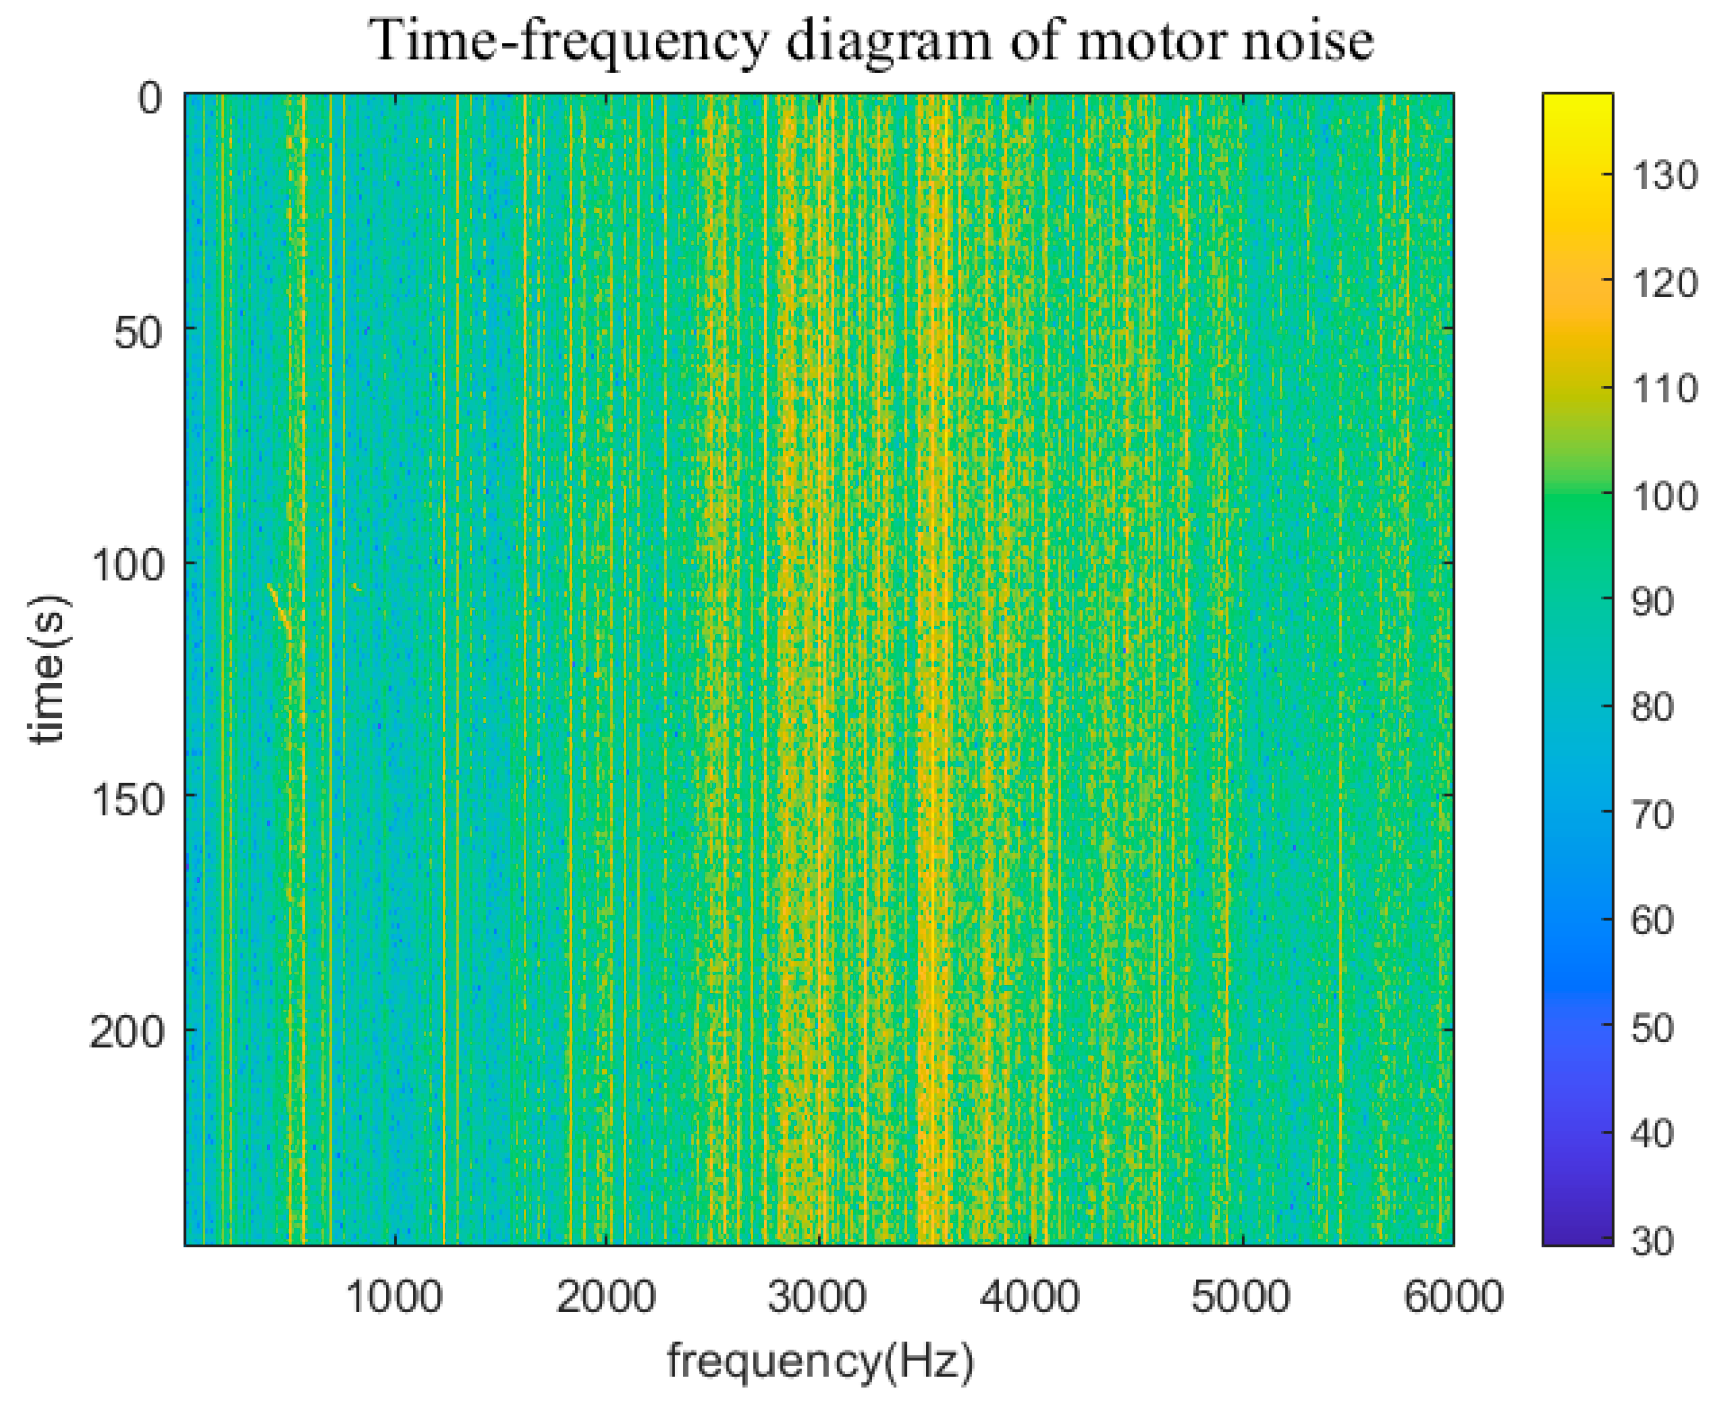
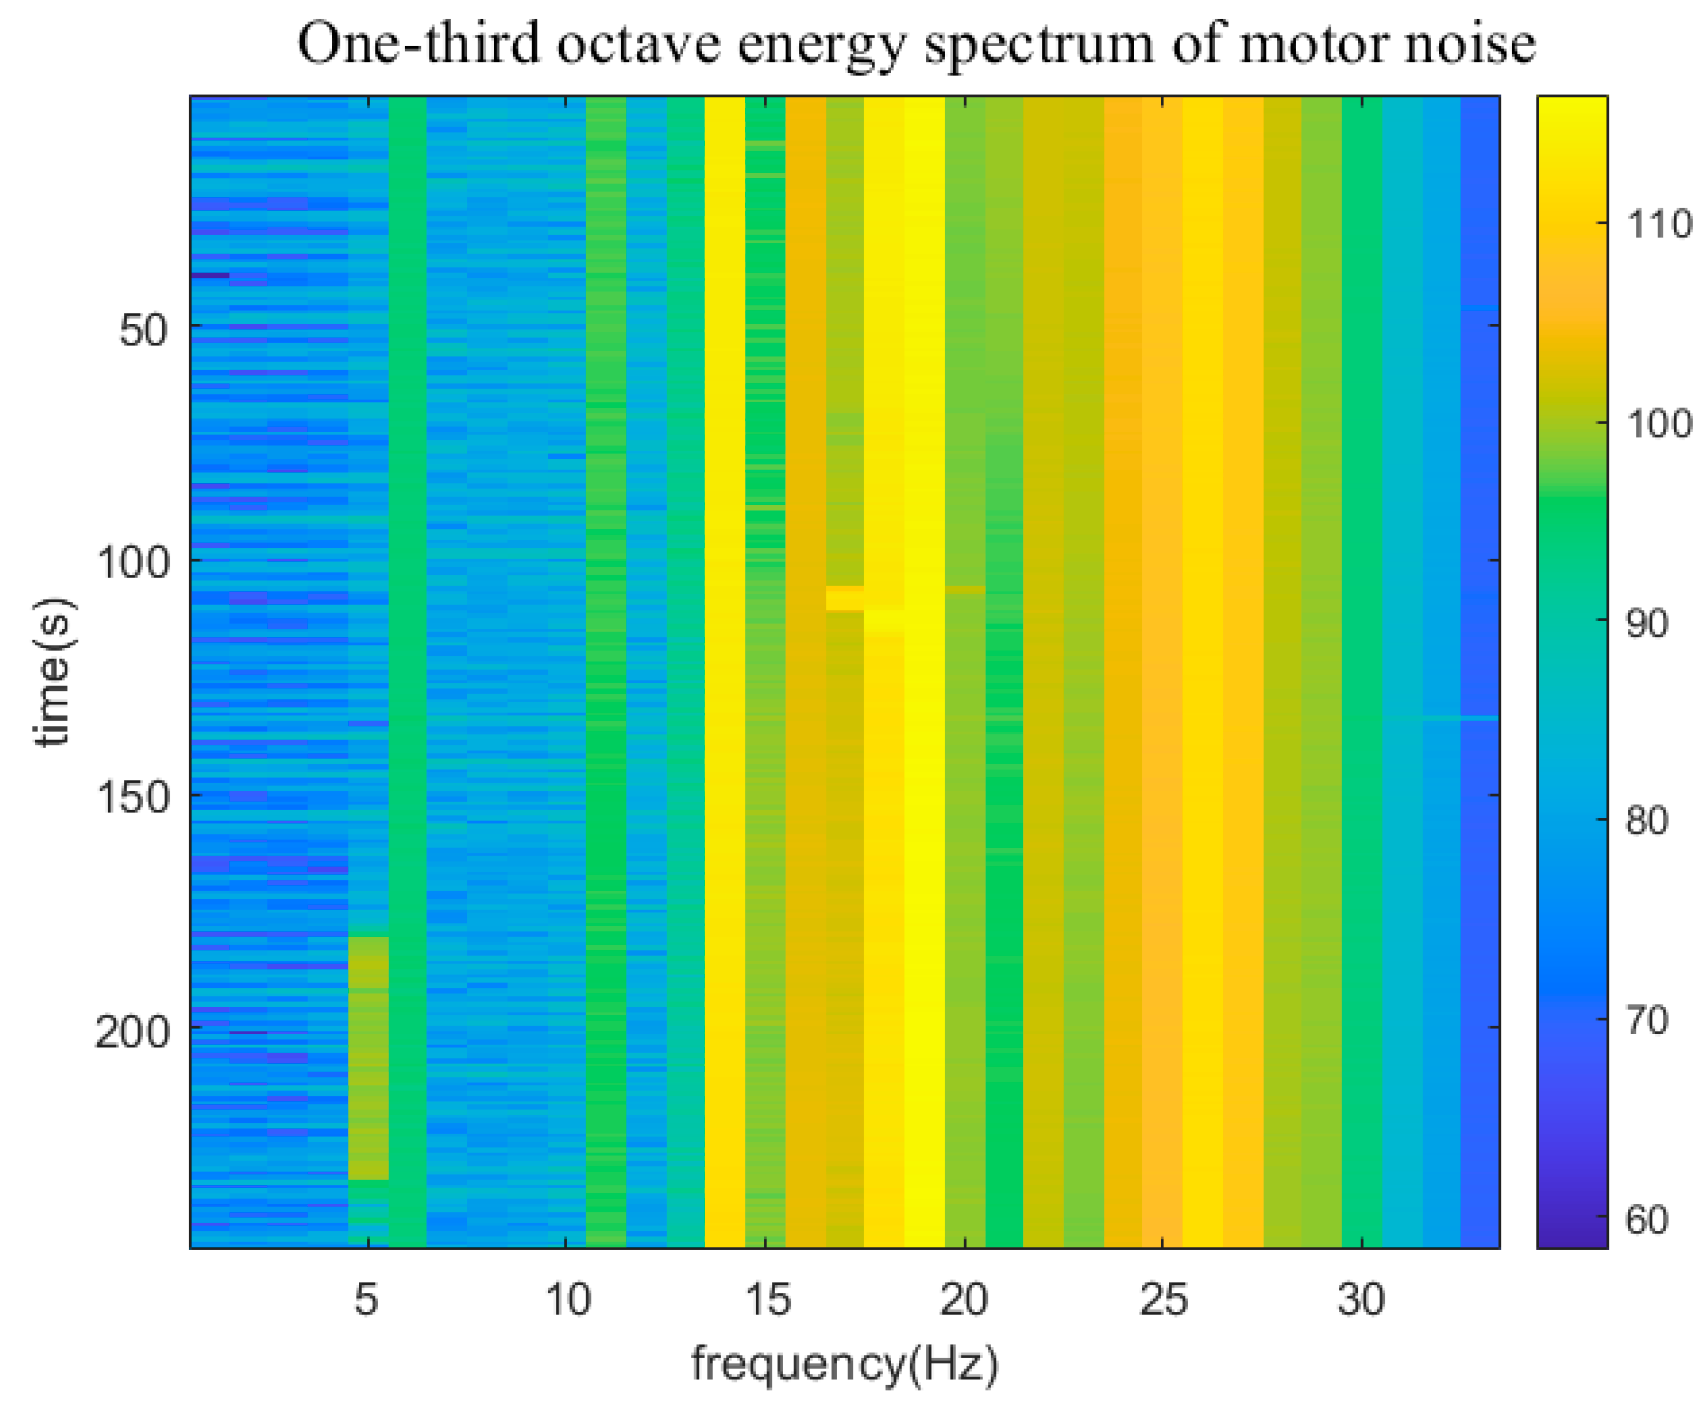
In addition to the unavoidable hydrodynamic noise, the noise during the operation of the underwater glider also includes two kinds of mechanical noise: motor noise and oil discharge pump noise. The motor noise mainly comes from the motor control attitude adjustment module to adjust the sailing attitude, which is based on the fine-tuning of the center of gravity, but it constitutes a significant interference to the highly sensitive hydrophone; while the oil discharge and return phase need to be discharged in the water to the external oil bladder, and need to be operated with high power in order to overcome the pressure of the deep water, so it will generate a large amount of high decibel pump noise, which has a great impact on the whole set of hydroacoustic system noise, so it is necessary to study an efficient method to effectively suppress these two mechanical noise sources. Therefore, there is an urgent need to develop an efficient method to effectively suppress these two mechanical noise sources.
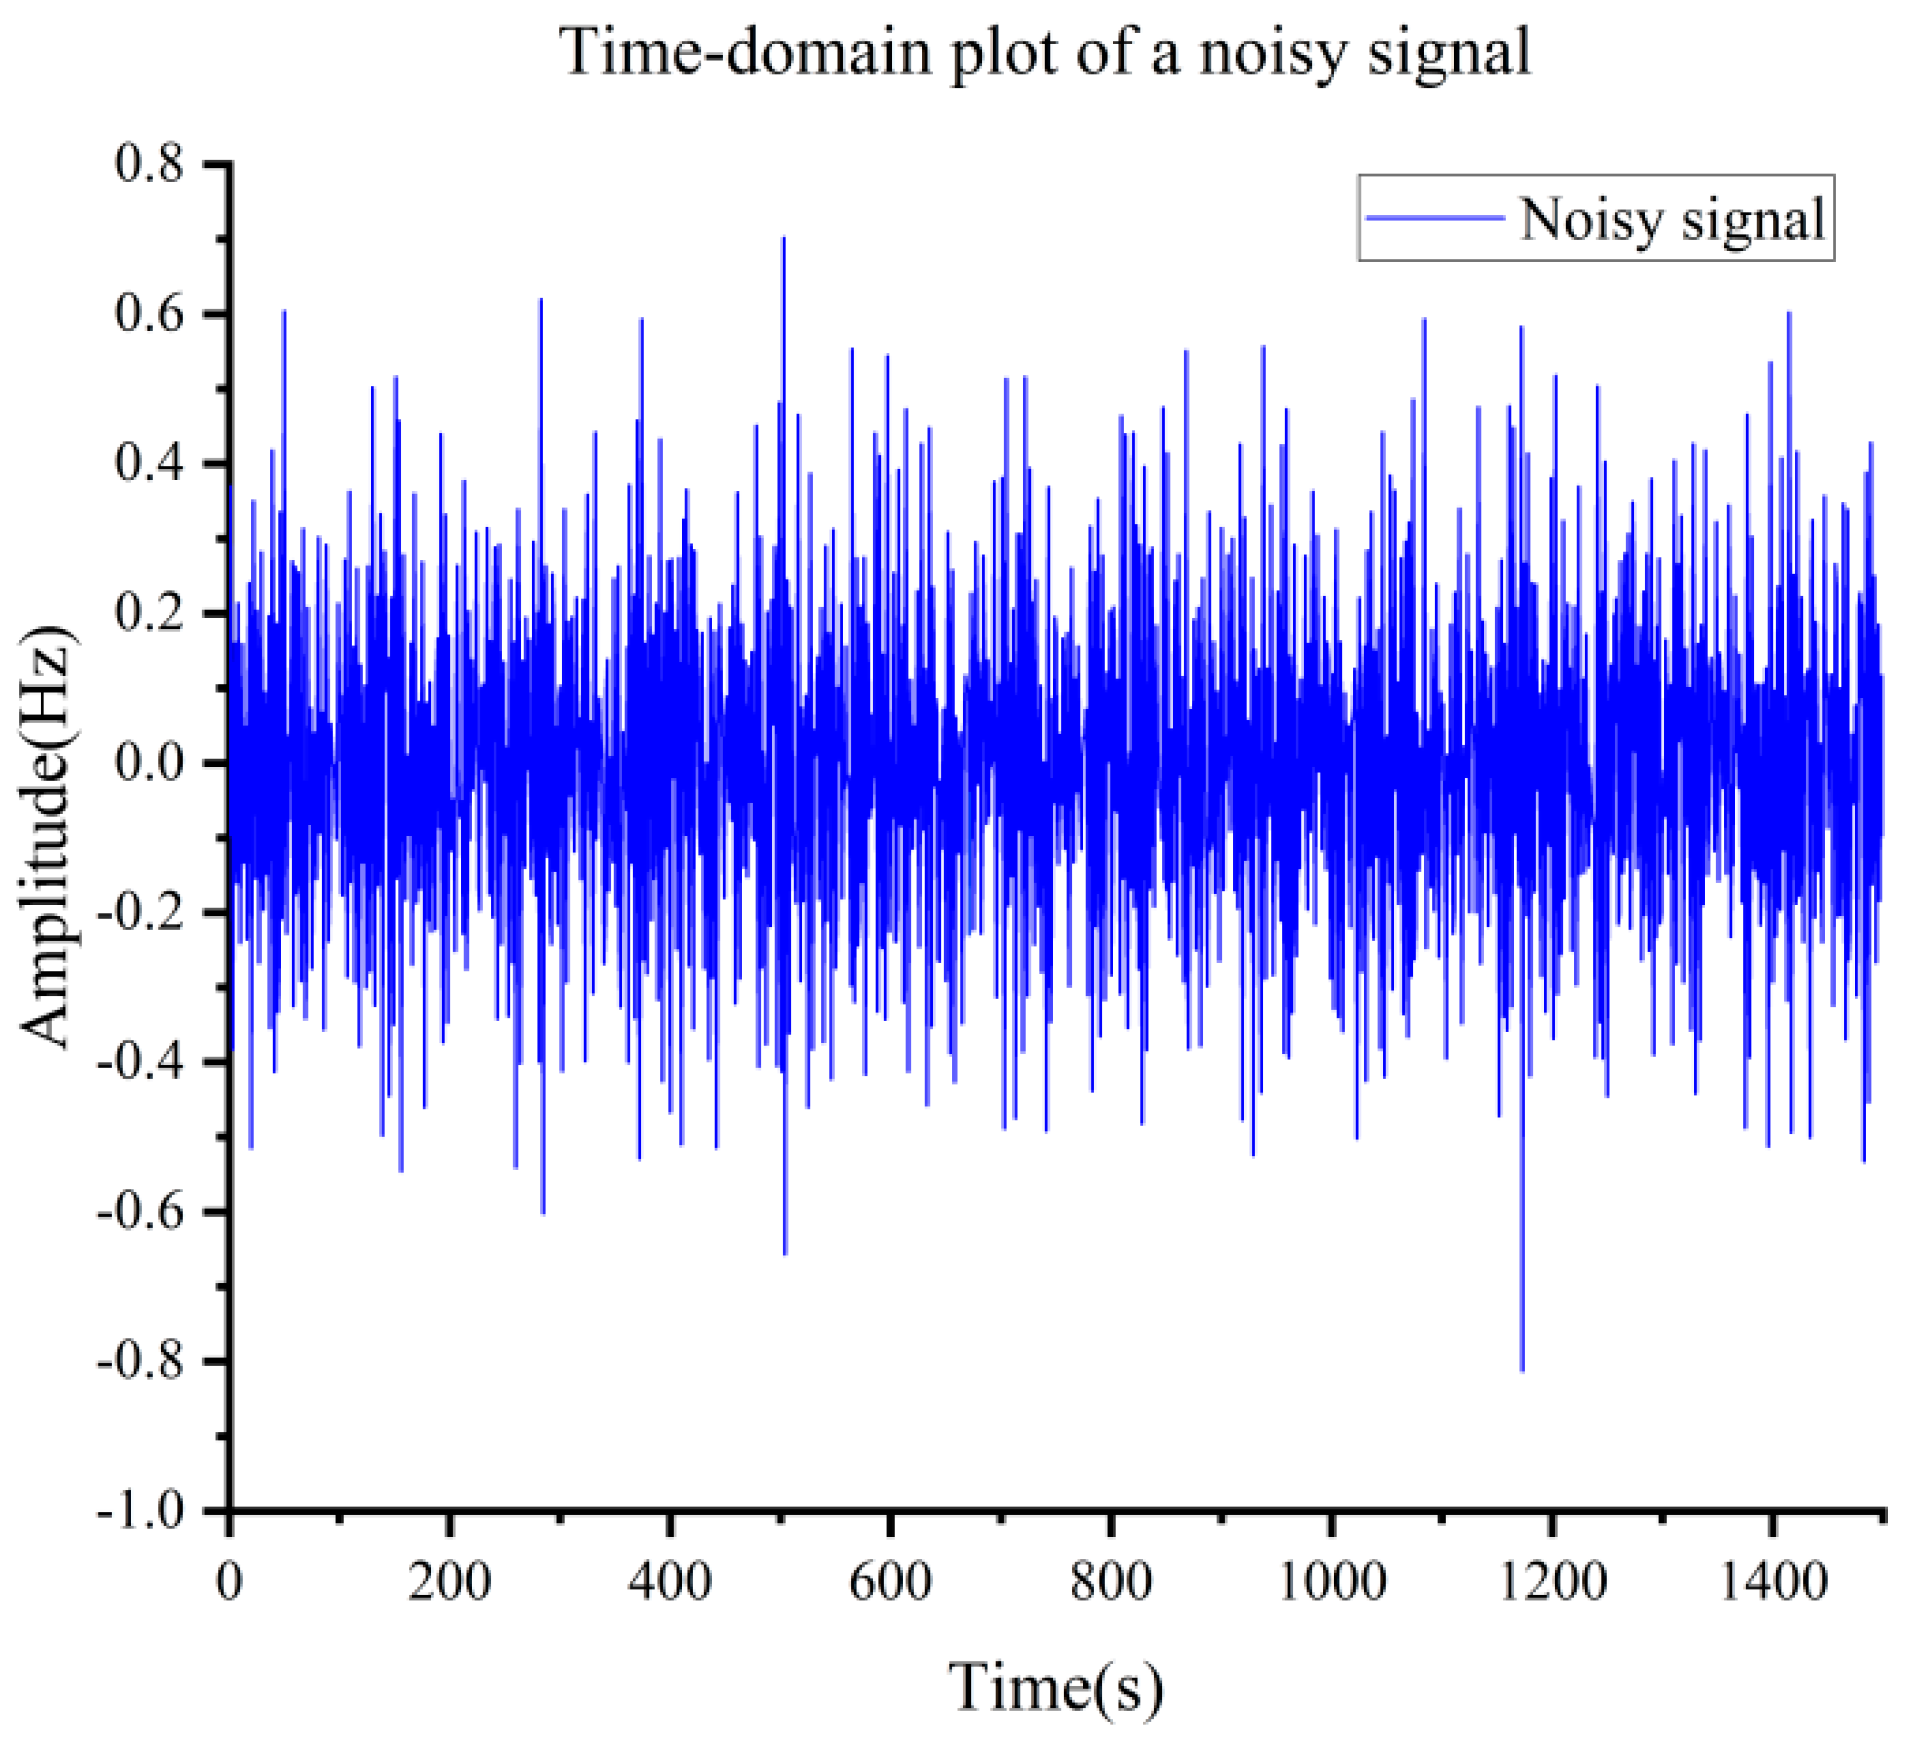
Given that the improved CEEMDAN-SVD method shows excellent denoising potential for multimodal superposition of unsteady signal noise theoretically, in order to validate its performance in extreme noise environments, this study focuses on the oil discharge phase, which has the highest noise intensity, as the experimental target signal for the noise reduction process. The time duration of each profile is about 6 h, and the profiles may be several hundred kilometers apart, which is a large span of time and space, and there is a strong randomness and independence, and the oil discharge phase of five profiles is randomly intercepted as the original signal for noise reduction in the sea trial, which is sufficient to illustrate its robustness, and is illustrated with profile 20 as an example. as shown in
Figure 9,
Figure 10 and
Figure 11 below.
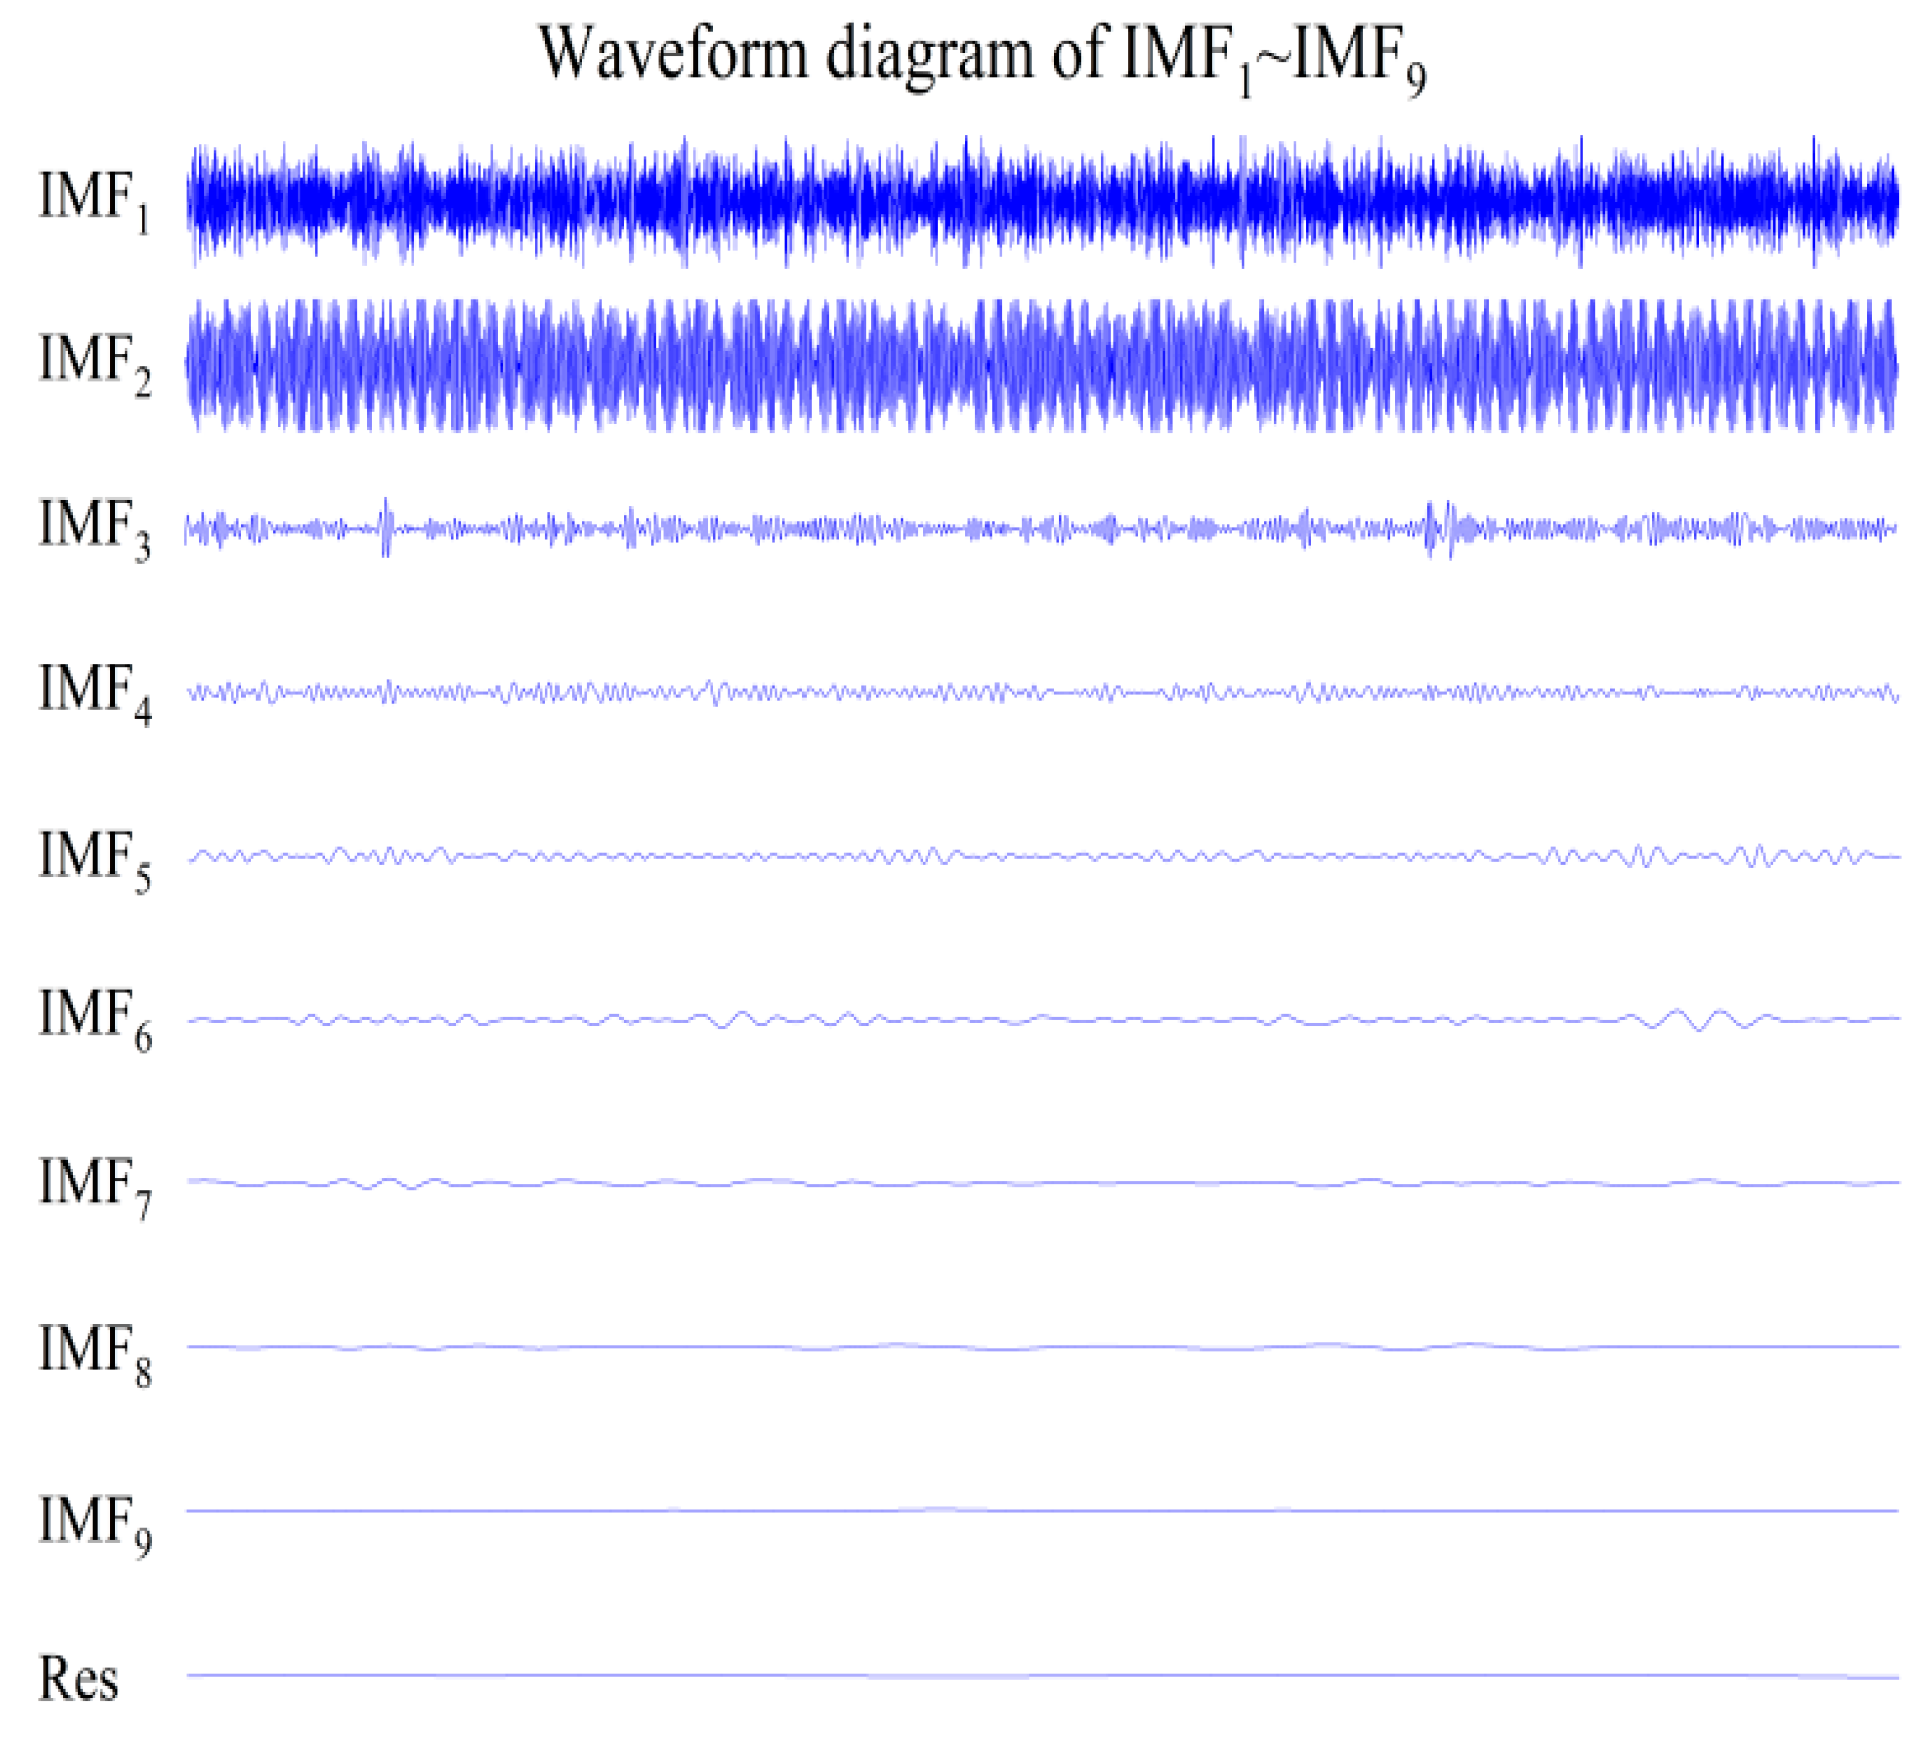
On this basis, CEEMDAN decomposition is carried out, and the error of CEEMDAN decomposition of the reshaped signal has been tested in the simulation stage, which will not be repeated here.
Figure 12 below shows the IMF
1~IMF
9 and the residual Res of the noise-containing signal after CEEMDAN decomposition, and there is basically no phenomenon of modal aliasing.
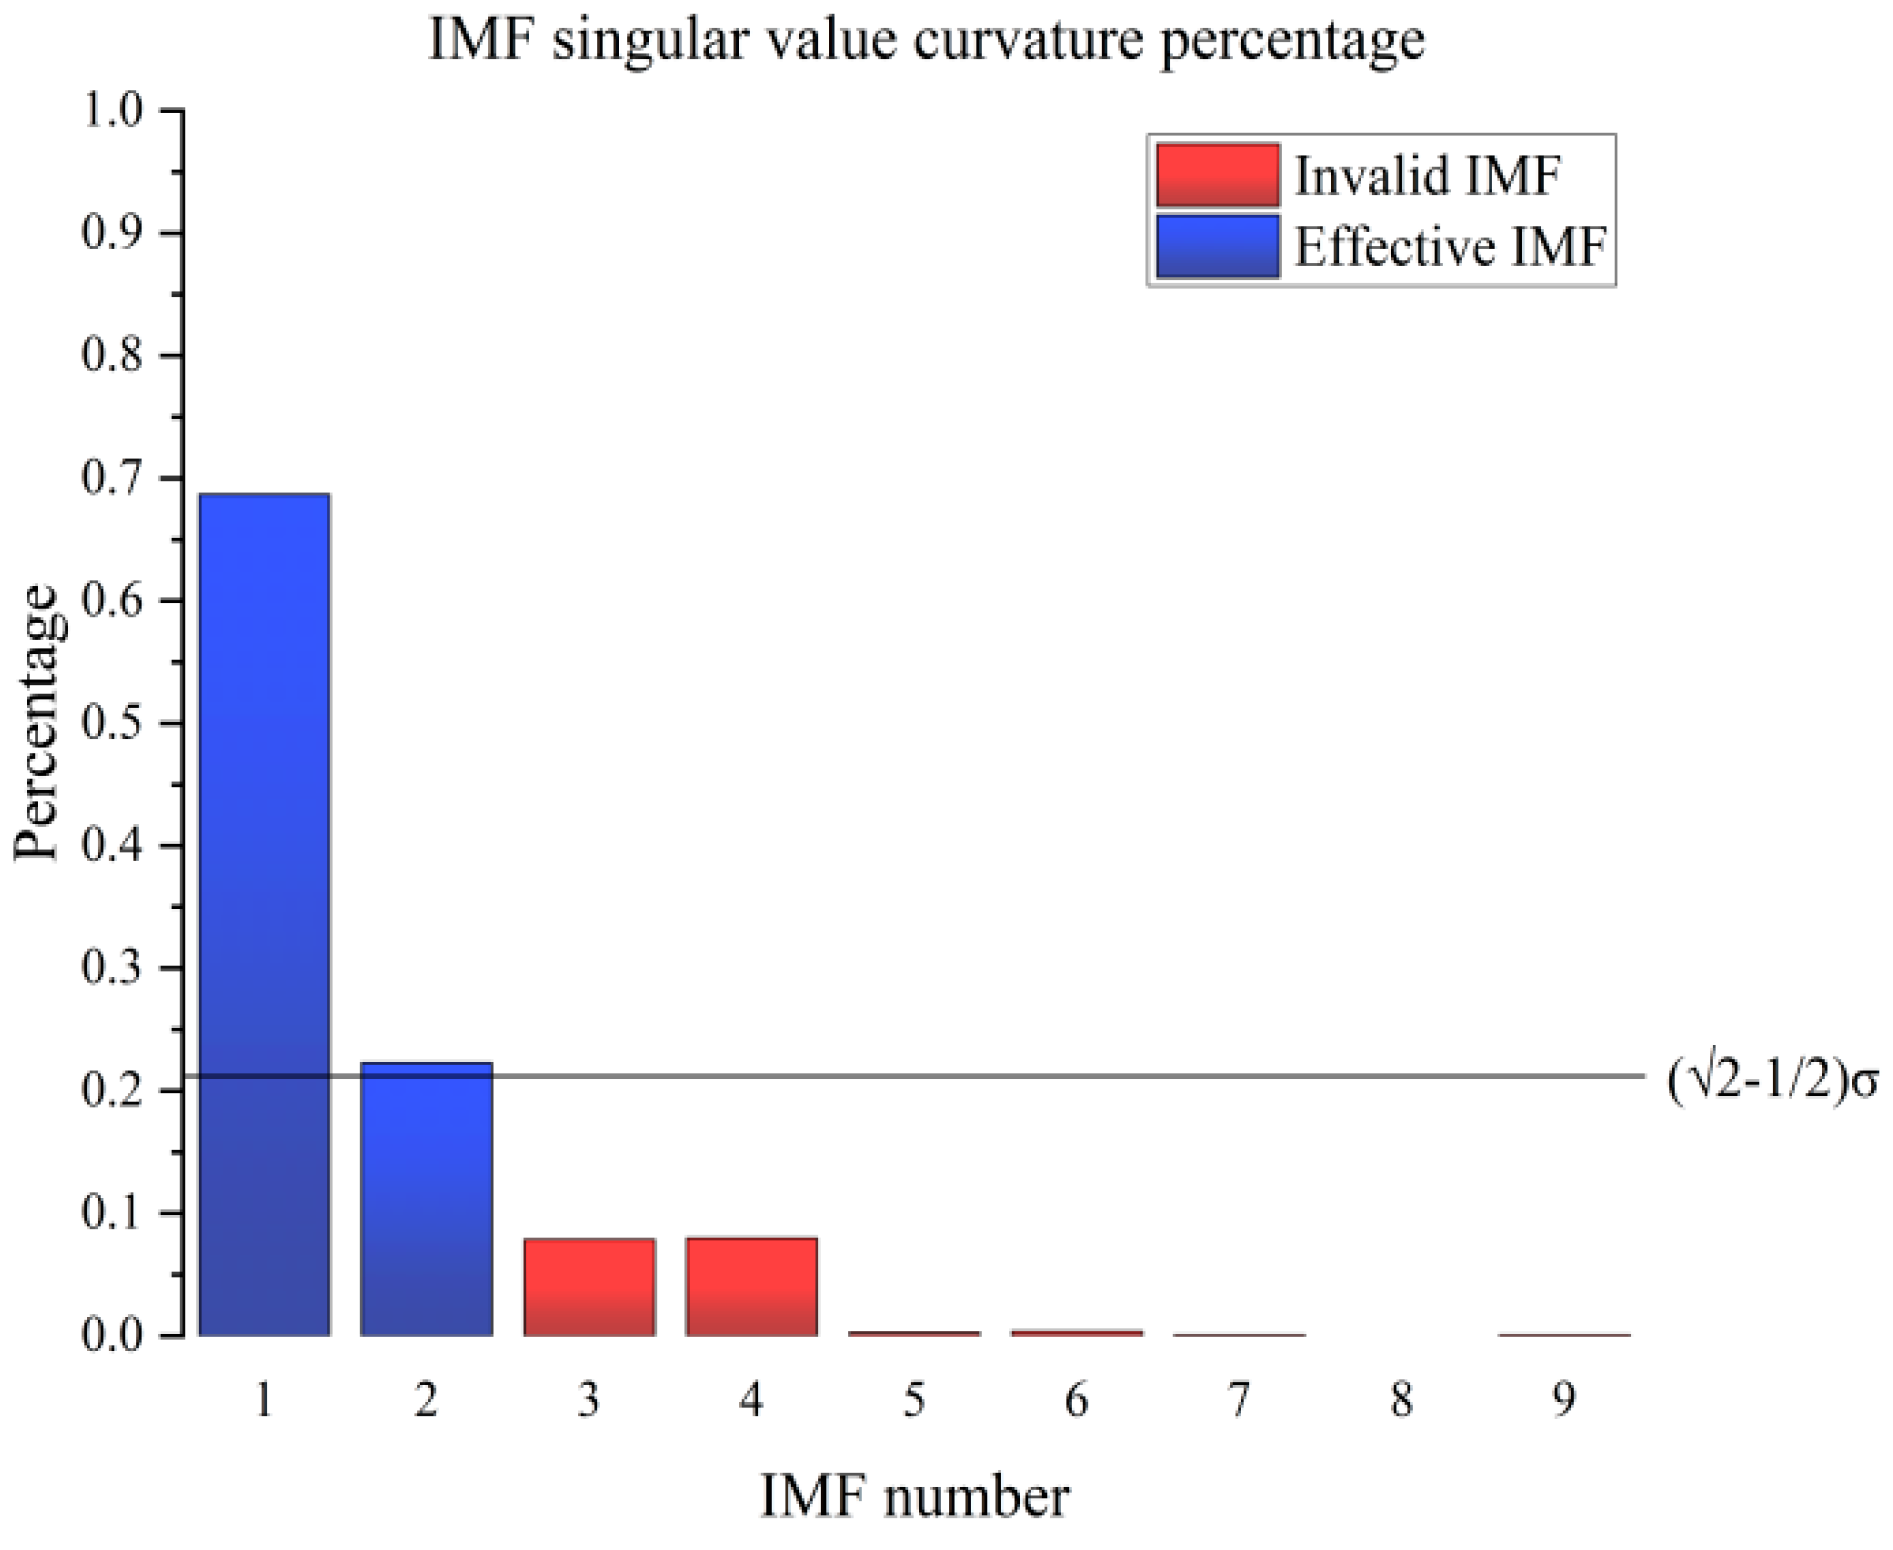
Next, the singular value curvature spectra of each IMF are calculated and normalized to obtain
Figure 13 below. because
is the threshold value [
25] is generally considered to be in the case of a low signal-to-noise ratio (10 dB), while the signal-to-noise ratio in this experiment is only 3 dB. Continuing to use a high threshold is more likely to result in an over-noise reduction for complex signals, so the threshold is appropriately lowered to
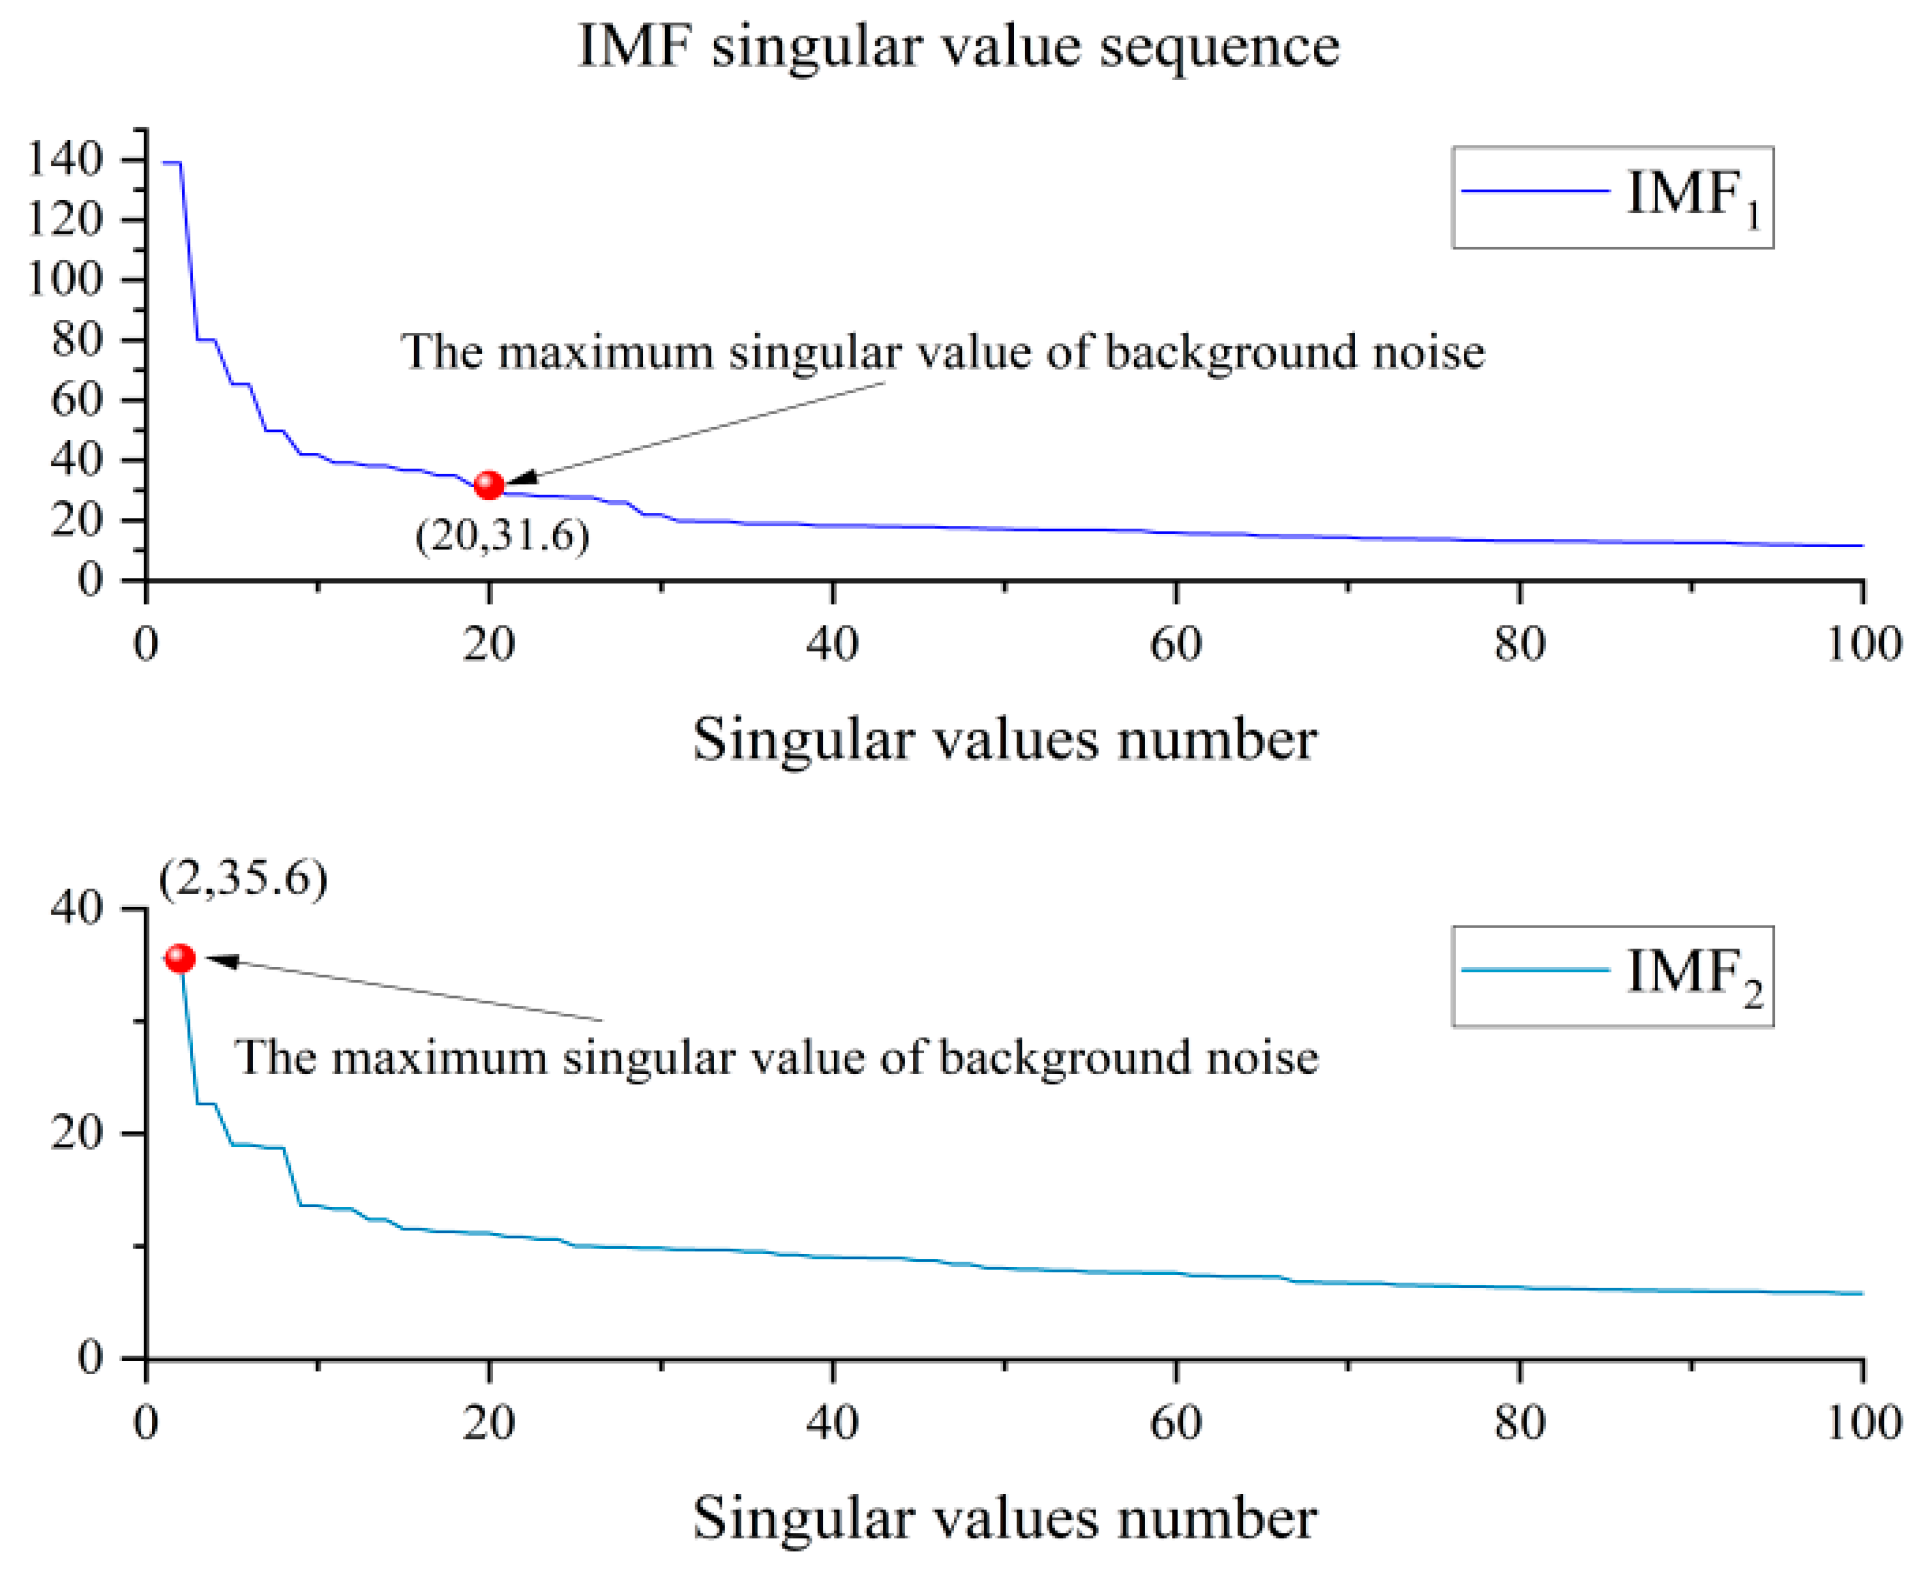
, which allows for a more likely signal to be passed and also passes more noise. This threshold allows more possible signals to pass, and also passes more noise, which can be filtered out by the subsequent SVD, while passing more valid signals can make the final result more accurate. As can be seen in
Figure 14 below, there are two valid eigenvalues in IMF
2, which, if directly rounded off, would lead to further error expansion.
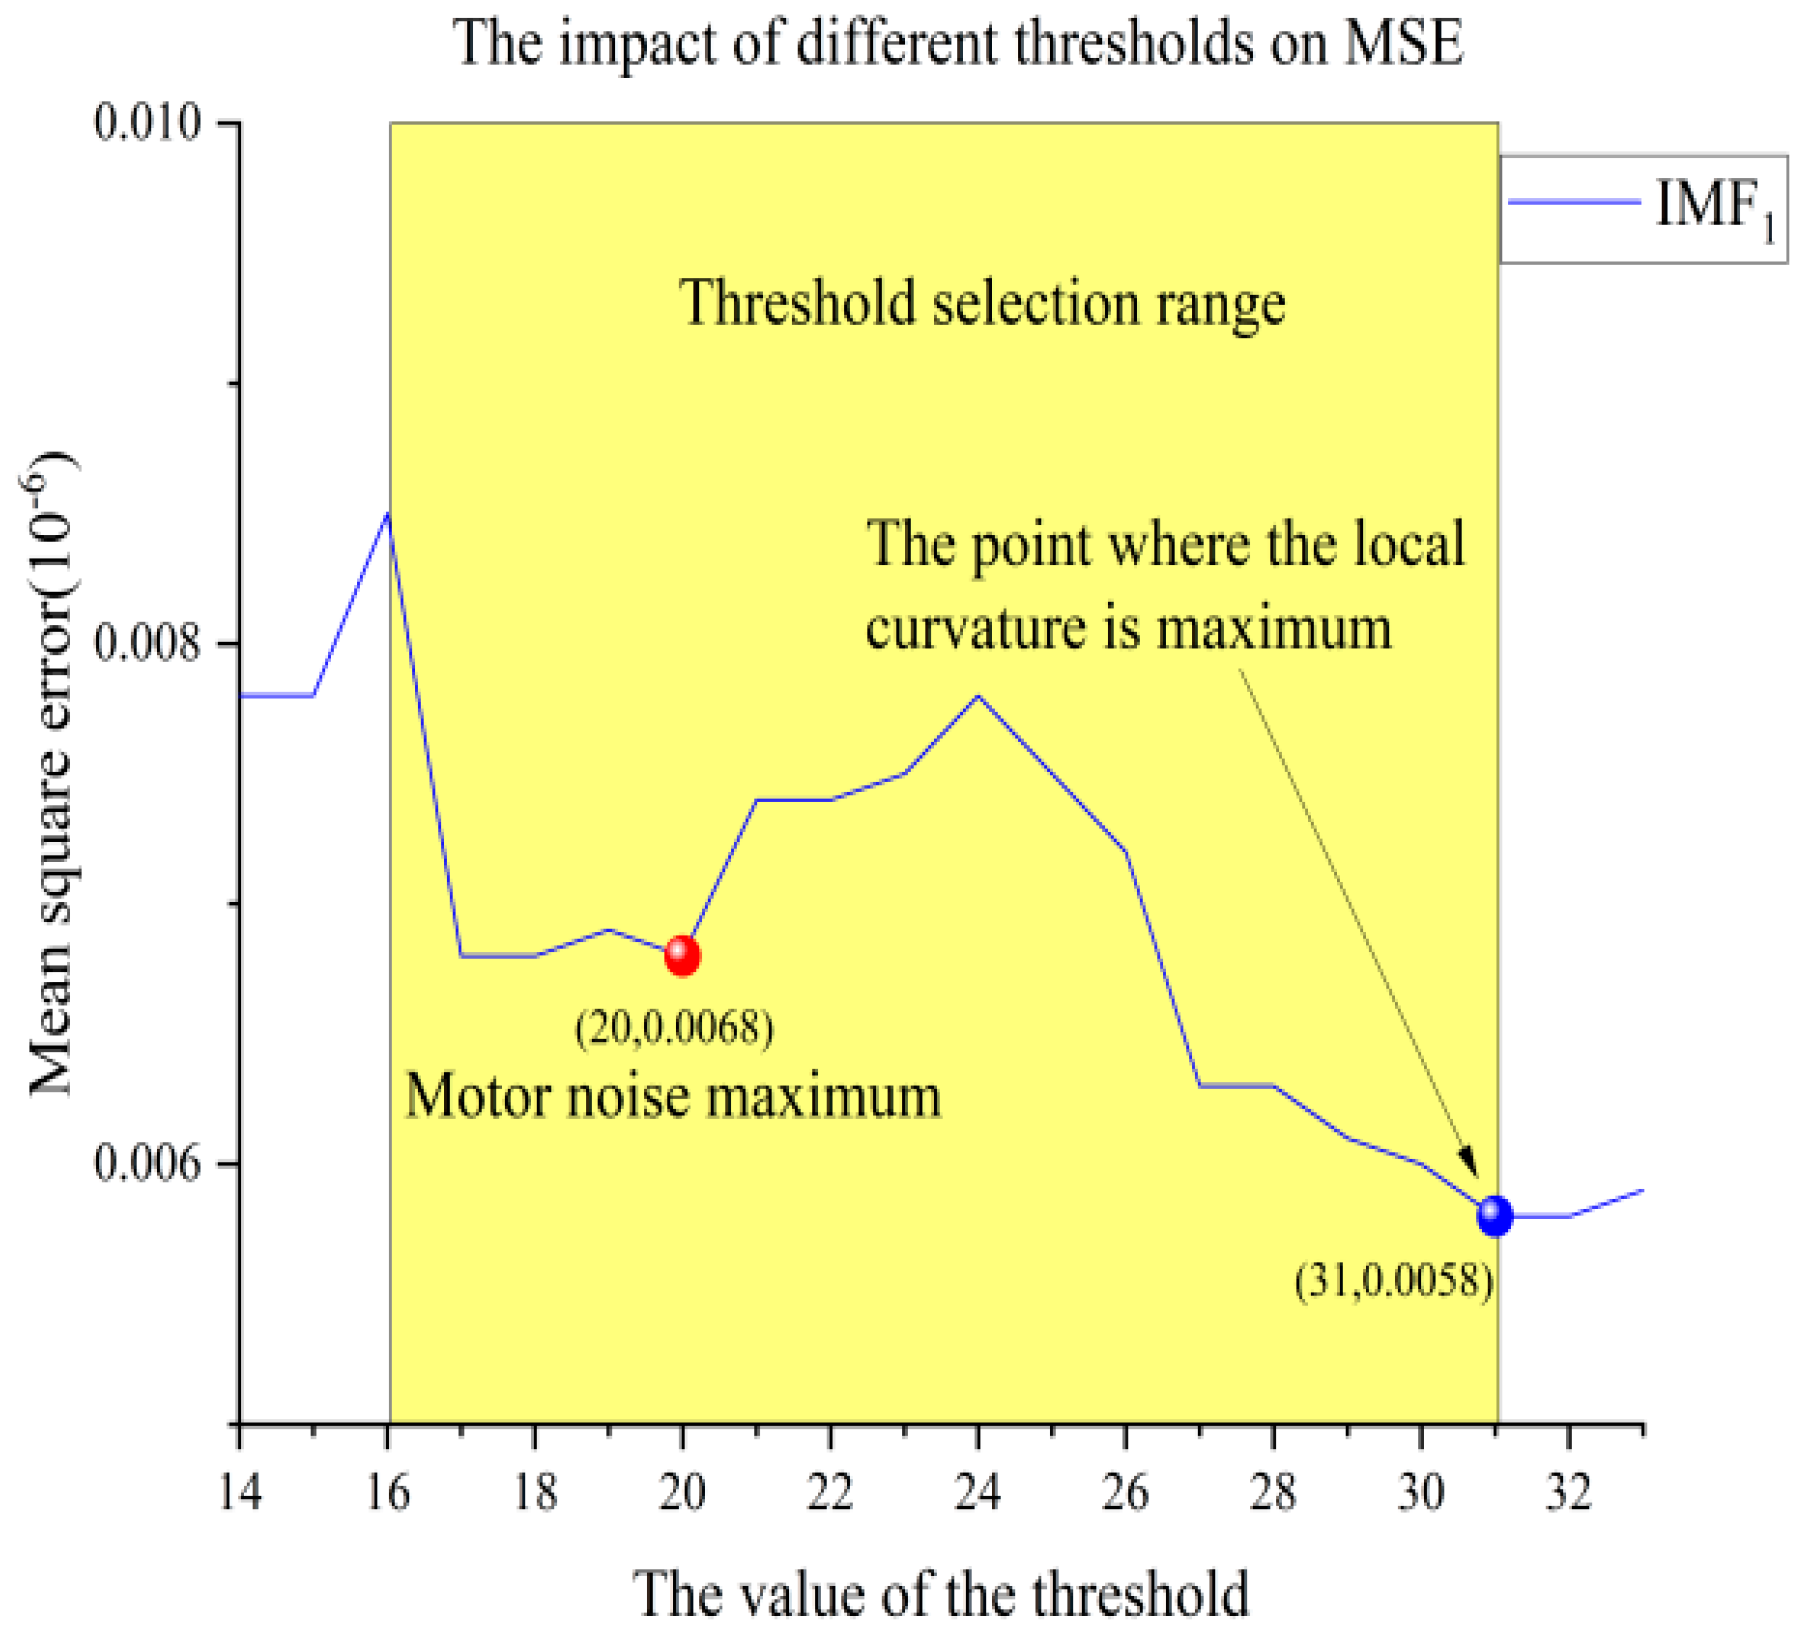
The experimental results indicate that the impact of the SVD reconstruction threshold selection on the Mean Square Error (MSE) does not exhibit a clear pattern within small intervals. This phenomenon arises because, under low signal-to-noise ratio (SNR) conditions, the boundary between the singular values of the pure signal and those of pure noise is highly ambiguous. The singular values encapsulate the primary characteristics of the noise-contaminated signal, which inherently include both signal and noise features, making it challenging to distinguish between them based solely on eigenvalues. In larger intervals, when the singular value chosen as the reconstruction threshold deviates from the maximum singular value of the noise by more than 15, the MSE value increases proportionally with the distance from the noise’s maximum singular value. This observation further corroborates the strong correlation between the maximum singular value of motor noise and the demarcation line separating the signal from the noise. Furthermore, as illustrated in
Figure 14,
Figure 15,
Figure 16 and
Figure 17, the fluctuations in the singular value difference spectrum and the MSE plot exhibit a high degree of consistency. In intervals where the singular value curvature is relatively smooth, the MSE values change more gradually. Conversely, in regions where the singular value curvature decreases rapidly, the MSE values tend to reach localized minima. In conclusion, by jointly considering the maximum eigenvalue of the noise and the point of maximum curvature decrease, the optimal SVD reconstruction threshold can be determined. This approach achieves the best possible denoising effect, balancing the trade-offs between noise suppression and signal preservation.
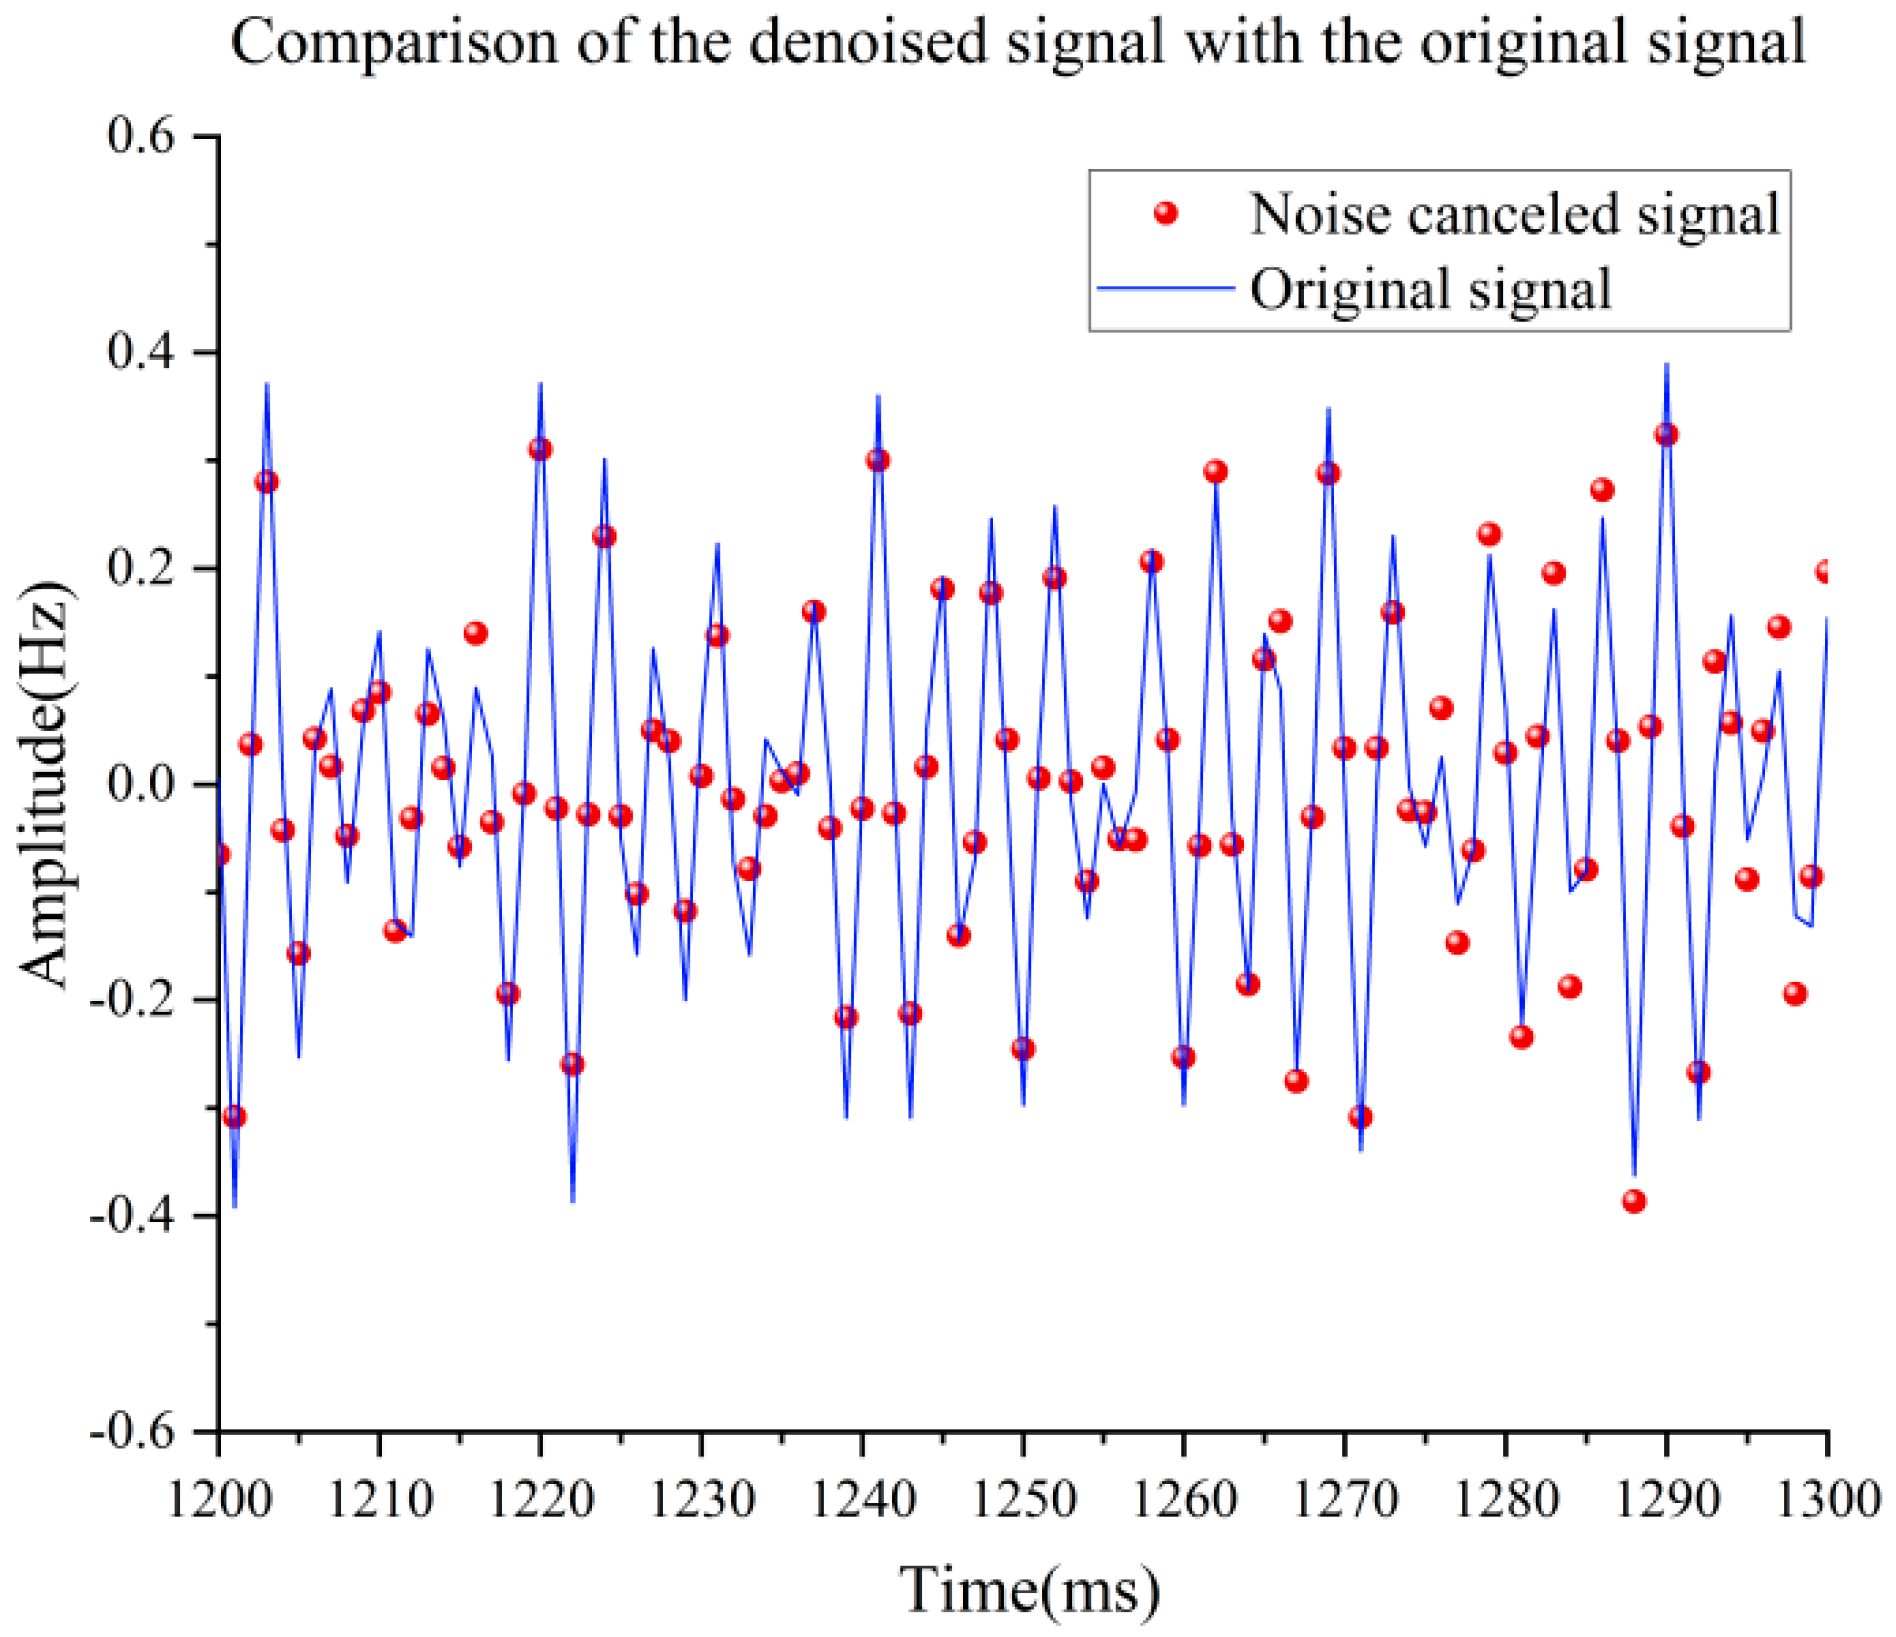
In this study, the performance of the traditional CEEMDAN-SVD method and the noise characterization-based CEEMDAN-SVD method in dealing with mechanical noise is compared, and the results are shown in
Table 3 and
Figure 18. By calculating the three key indexes of mean square error, skewness and maximum value of the two, and analyzing the noise reduction effect of the two methods in depth, the results show that the MSE of the CEEMDAN-SVD method based on noise features is reduced by an average of 22.8%, and this significant reduction proves the advantage of the new method in reducing the noise interference and improving the quality of the signal. According to the amplitude of the original signal of this experiment, the maximum value of CEEMDAN-SVD based on noise features will be closer to the maximum value of the original signal. The skewness, as a statistical measure of the direction and degree of skewness of the data distribution, is of great significance in evaluating the smoothness of the signal after noise reduction, and it is found that the CEEMDAN-SVD method based on the noise characteristics performs better in terms of skewness after comparison, which further verifies its superiority in terms of the noise reduction effect. According to the above three data comparisons, it shows that the noise characterization-based CEEMDAN-SVD method has better denoising effect on the mechanical noise (including pump noise and motor noise) of the underwater glider than the traditional method.
6. Conclusions
Aiming at the underwater glider target signal acquisition process by the glider’s own motor noise and pump noise interference, resulting in serious contamination of the target features, we propose a CEEMDAN-SVD noise reduction method, which can adjust the noise reduction strategy according to the noise characteristics, that is, according to the characteristics of the different noises to calculate the reconstruction thresholds for the noise, which can avoid the situation of insufficient noise reduction and over-noise reduction. This method solves the problem of underwater glider mechanical noise seriously affecting the performance of hydroacoustic signal acquisition system, especially in the case of low signal-to-noise ratio, compared with other algorithms, the method effectively reduces the strong motor noise in the process of oil discharge in the experiments, improves the quality of the signal, and ultimately improves the accuracy of underwater target identification. The results of the computer simulation study and the results of the sea test study show that our proposed noise reduction effect is better than the traditional method, which verifies the validity and feasibility of the method, which serves as an effective method to suppress the mechanical noise during the working process of the underwater glider. The results from computer simulations and sea trial experiments demonstrate that the proposed denoising method outperforms traditional methods by 22.8%, validating its effectiveness and feasibility. This method serves as an effective approach to suppress mechanical noise generated during the operation of underwater gliders.
Endpoint Distortion Issue: The problem of endpoint distortion remains unresolved. The current approach merely employs signal truncation to avoid the most severe endpoint distortion at the cost of increased computational load. In future work, neural networks could be utilized to predict the trend of the signal beyond its endpoints. Through continuous training, the most probable trend could be identified, thereby reducing the degree of endpoint distortion.
Computational Efficiency of CEEMDAN: The computational efficiency of the CEEMDAN method, which involves adding white noise and iterative calculations, is relatively low. Future research could focus on developing faster iterative algorithms to improve computational speed, facilitating the application of this method on platforms requiring real-time processing.
