Article

Simulation Study on the Navigation Resistance and Shape Optimization of a New Type of Amphibious Vehicle

1
Institute for Disaster Management and Reconstruction, Sichuan University-The Hong Kong Polytechnic University, Chengdu 610065, China
2
Sichuan Fire Research Institute of MEM, Chengdu 610036, China
3
Fire and Rescue Department of Sichuan Province, Chengdu 610036, China
4
Beijing Topsky Intelligent Equipment Group Co., Ltd., Beijing 101102, China
*
Author to whom correspondence should be addressed.
Symmetry 2025, 17(2), 193; https://doi.org/10.3390/sym17020193
Submission received: 23 November 2024 / Revised: 8 January 2025 / Accepted: 23 January 2025 / Published: 26 January 2025
(This article belongs to the Section Engineering and Materials)

Abstract

:
Amphibious vehicles are important equipment used by emergency rescue teams to quickly pass through water networks. A numerical model of amphibious vehicle underwater navigation in the lower shell was established in this study using computational fluid dynamics, the Reynolds-averaged Navier–Stokes model, and the volume-of-fluid method to investigate the navigation performance of a new all-terrain all-water amphibious emergency rescue vehicle. The navigation resistance was calculated at different speeds. The characteristics of the flow field around the vehicle body were analyzed, and optimization measures for drag reduction by installing a stern flap were proposed. The simulation results show that the existing vehicle body has a relatively high navigation resistance, and the flow field of the amphibious vehicle body is significantly improved after using stern flaps with larger angles and sizes. When the stern flap angle was 38°, the drag-reduction effect was 23%, which effectively improved the navigation performance of the amphibious vehicle.

1. Introduction

As special vehicles with the ability to move on both land and water, amphibious vehicles have gradually become important civilian and military equipment to respond to various natural disasters, emergencies, military missions, and so on [1]. Because of the complexity of the movement mechanism and control system of amphibious vehicles, many amphibious vehicles are designed to ensure land maneuverability while ignoring their water navigation performance. For example, subject to the land traveling limitations of the vehicles, discontinuous protruding or concave positions exist on the surface of amphibious vehicles, which complicates their hydrodynamic performance [2]. Generally speaking, amphibious vehicles belong to blunt body structures with poor streamlining, and there is a problem of high resistance when traveling in water [3]. The resistance of amphibious vehicles is the key factor determining their transportation efficiency and energy consumption. Lower resistance means higher maximum speed, better water mobility, and lower energy consumption. Therefore, studying the resistance characteristics of amphibious transport vehicles has important theoretical and engineering value.
Despite the absence of a well-established theoretical framework for predicting the resistance characteristics of amphibious vehicles, recent studies [4,5,6,7,8,9,10,11,12,13] have demonstrated that the walking mechanism design, shape optimization, and drag-reduction attachments can significantly improve resistance during navigation. For example, by employing a folding mechanism to elevate the wheels of an amphibious vehicle above the water surface, the hydrodynamic shape of the submerged part can be improved, thereby reducing navigational resistance [4]. However, such mechanisms are complex and unsuitable for larger amphibious vehicles, as they also compromise terrestrial performance [5]. A more direct approach to reducing drag involves altering the shape of the submerged part of the vehicle. This principle optimizes the pressure distribution over the surface of the vehicle, thereby reducing the form drag. Nakisa et al. [6] investigated three amphibious vehicle bow shapes: U-shaped, V-shaped, and flat. Yan et al. [7] drew inspiration from the shape characteristics of hammerhead sharks to design fairings for tracked amphibious vehicles and achieved a decrease of 22% in underwater drag. Liu et al. [8] proposed a curved wheel groove shape and expressed its superior hydrodynamic characteristics in terms of the pressure distribution, flow field, and vehicle posture.
Drag-reduction attachments are also a common measure for reducing resistance. Common attachments for amphibious vehicles include bow plates, stern flaps, side flanks, and so on, which improve the flow field and optimize the posture. These attachments are primarily based on the more mature drag-reduction theories or technologies found in ships. However, the hull lines of amphibious vehicles are significantly different from those of ships, with amphibious vehicles being shorter, having a smaller draft, and exhibiting more pronounced shape changes [1]. Therefore, the effectiveness of drag-reduction attachments on amphibious vehicles still requires further research. Installing a bow plate on a vehicle can effectively suppress the wave height at the bow, reducing wave resistance [9,10,11]. Installing side flanks in the flow field region with the most severe pressure accumulation can significantly alter the vehicle’s pressure distribution and turbulent flow field, thereby improving hydrodynamic characteristics [12]. Stern flaps can effectively improve navigation posture by reducing the volume and surface area of the submerged part, effectively reducing resistance [13]. Overall, these types of attachments have also achieved good results in reducing drag for amphibious vehicles. However, due to the significant differences in the appearance of different amphibious vehicles, it is necessary to conduct more extensive research in order to summarize more common patterns.
With the continuous development of computer technology and simulation methods, numerical simulation methods based on computational fluid dynamics (CFD) have become essential for analyzing the hydrodynamic performance of amphibious vehicles. Pena and Huang [14] reviewed the research progress of turbulence modeling strategies in ship hydrodynamic simulations. They introduced the main turbulence modeling methods and analyzed their applicability and limitations. The Reynolds-averaged Navier–Stokes (RANS) equations are highly accurate in predicting the resistance characteristics of ships. Guo et al. [15] conducted a multiobjective optimization design of a waterjet-propelled trimaran using the RANS method. This approach can accurately predict the hydrodynamic performance of a waterjet system and clearly highlight the flow-field details. Bakica et al. [16] focused on large container ships and cargo vessels, used RANS to conduct the self-propulsion numerical simulation of the propeller, and investigated the resistance during navigation. CFD has demonstrated good applicability in research on the navigation resistance of amphibious vehicles. More et al. [17] conducted stability and drag analyses of a wheeled amphibious combat vehicle using a combination of model testing and numerical computation methods. Kim and Tezdogan [18] used a full nonlinear unsteady RANS model to investigate the maneuverability of a benchmarking ship under irregular sea conditions. Villa and Brizzolara [19] studied the hydrodynamic performance of a hydrofoil-equipped vessel with installed flaps and interceptors using numerical simulations and established a relationship between the angle of the flap and the equivalent height of the interceptors. Liu et al. [20] evaluated the effects of stern flaps on the resistance and operational performance of an amphibious vehicle. Sun et al. [21] designed a wave-slicing plate on the stern of a tracked amphibious vehicle and analyzed the effects of different angles and lengths of the stern wave-slicing plate on the posture and resistance performance of the vehicles. Current research findings indicate that the integration of walking mechanism design, shape optimization, and drag-reduction attachments offers promising avenues for improving the hydrodynamic performance of amphibious vehicles. With the advancement of computational methods, CFD-based simulations continue to play a crucial role in clarifying and improving the resistance characteristics of vehicles.
This study investigates the navigational performance of a novel symmetric amphibious vehicle and conducts research on drag reduction. Firstly, a numerical model for the amphibious vehicle was established based on the Reynolds-Averaged Navier–Stokes (RANS) equations and the volume-of-fluid (VOF) method, analyzing the flow field characteristics and resistance performance at different speeds. Secondly, by installing large-angled and large-sized stern flaps, drag-reduction optimization effects of different stern shapes were examined. Finally, by comparing the characteristics of the wake flow field, the drag-reduction mechanism was analyzed, the optimal angle for the stern flaps to reduce drag was obtained, and the applicability of such optimization measures was explained. The research results can provide a reference for improving the navigational performance of similar amphibious vehicles.

2. Numerical Model and Calculation Method

2.1. CFD Modeling

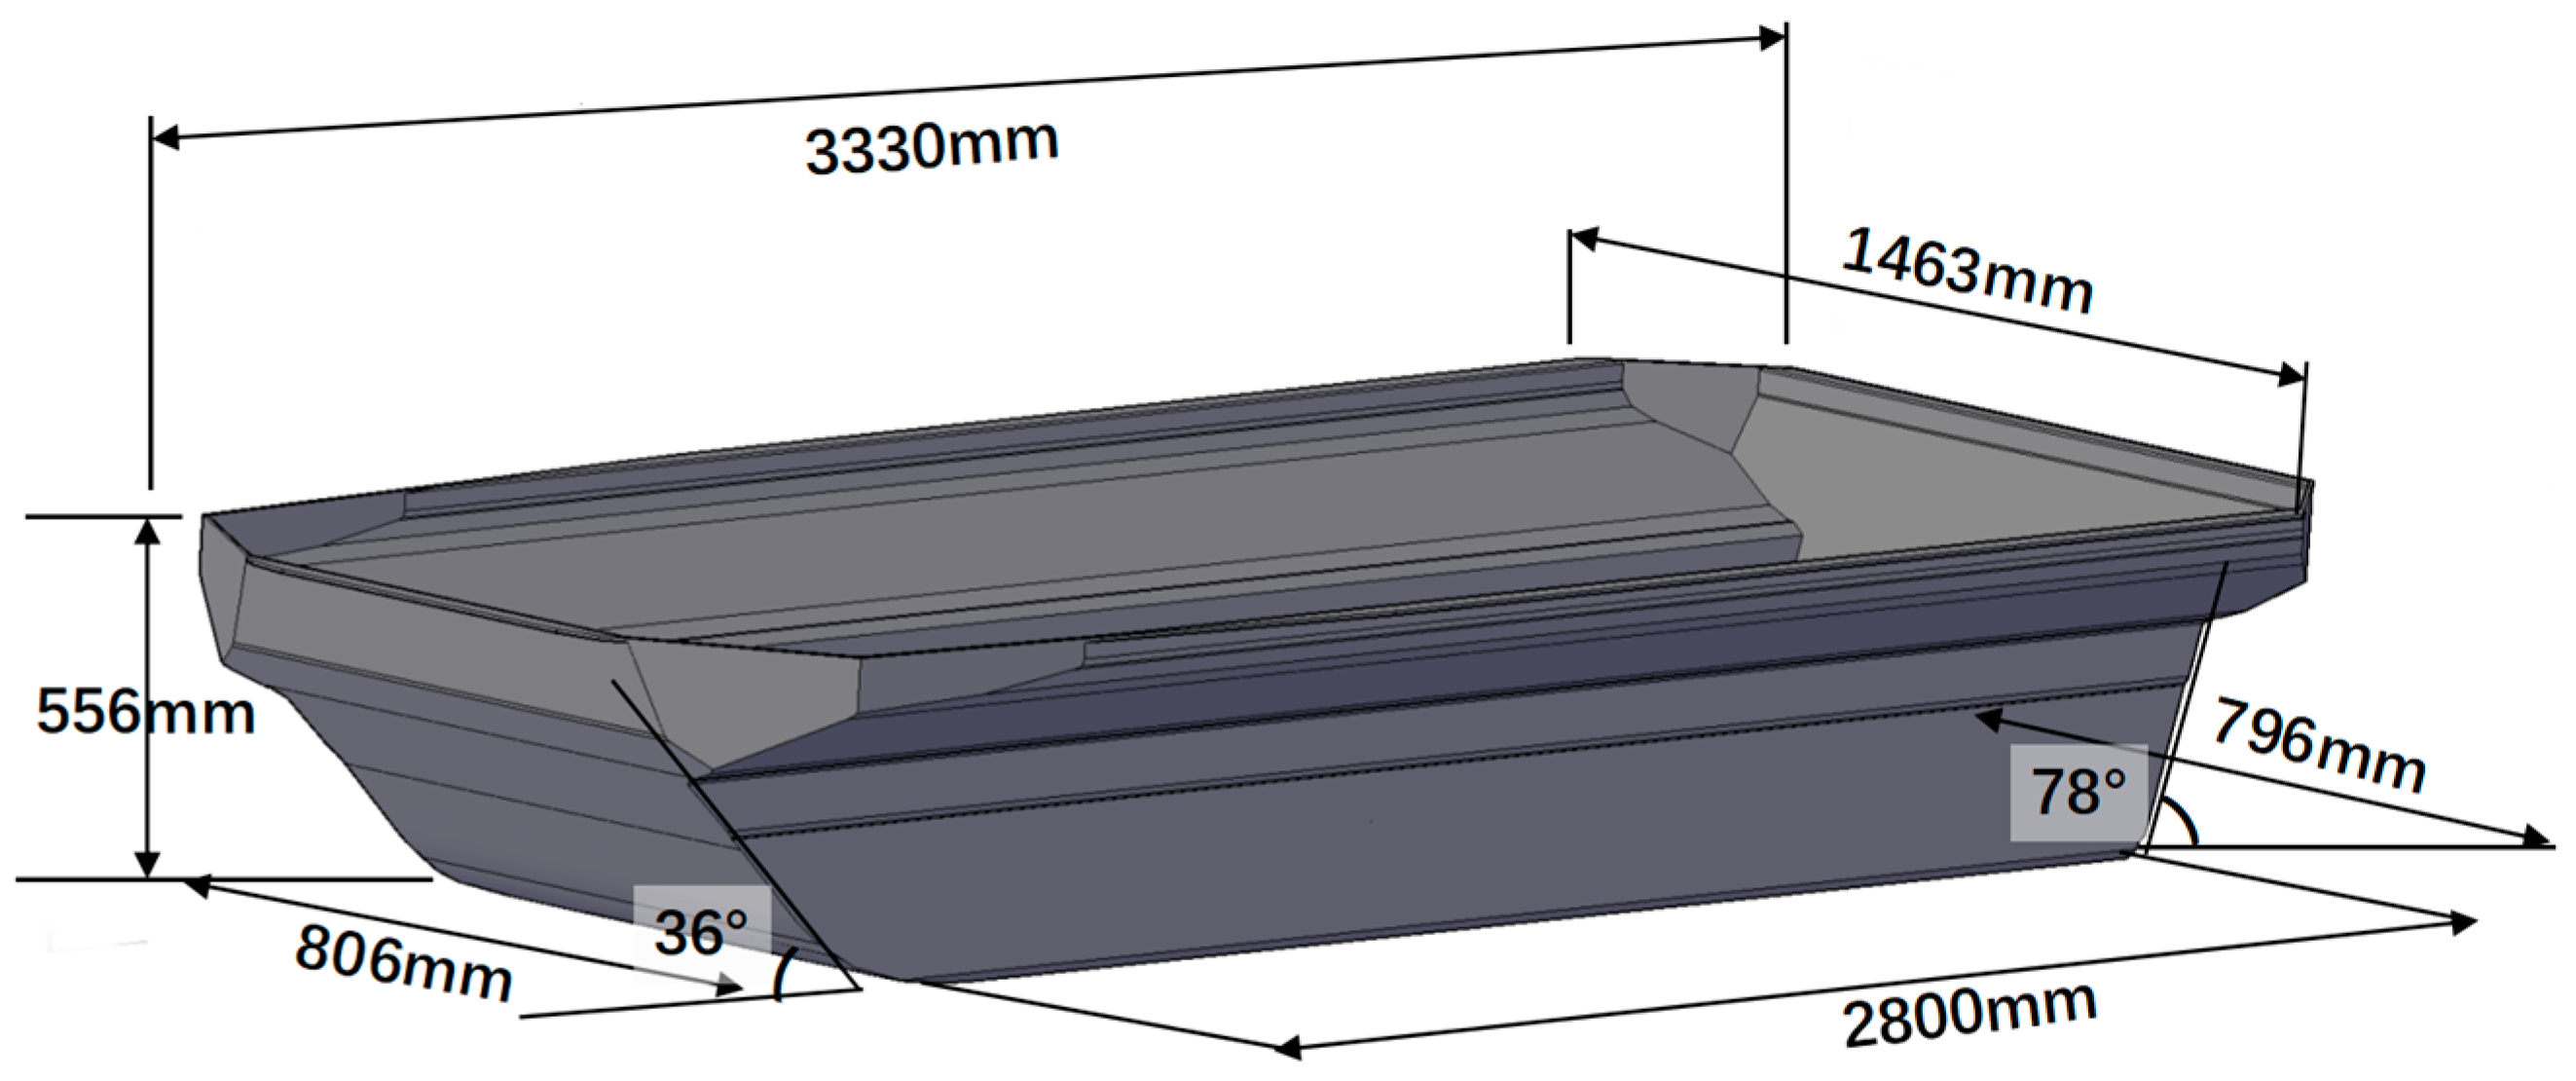
Figure 1 presents the design drawing of the new amphibious vehicle, which is basically divided into 3 parts: an upper shell, a lower shell, and 8 wheels. The main material of the upper and lower shells is stainless steel. When traveling in water, to reduce navigational resistance [4,5], the wheels are designed to be raised above the water surface through a transmission folding mechanism, ensuring that only the lower shell is submerged. Therefore, only the simplified lower shell with a 1:1 scale is modeled in this simulation, as shown in Figure 2. During the modeling process, the outer surface of the amphibious vehicle model was simplified without considering changes in its sailing attitude. The simulation was based on a rectangular computational domain. The total length of the computational domain was seven times the length of the amphibious vehicle to ensure the accuracy of the incoming and outgoing flows: the distance between the entrance of the computational domain and the bow of the amphibious vehicle was 1.5 L (where L is the length of the amphibious vehicle). The distance between the exit of the computational domain and the s of the amphibious vehicle was set to 4.5 L. In the width direction, the total width of the computational domain was 10 times the width of the amphibious vehicle, and the distances between the center and the left and right boundaries of the computational domain were both set to 4.5 L. The distances between the center of the amphibious vehicle and the left and right boundaries were set to 5 W (where W is the width of the amphibious vehicle). In the vertical direction, the total height of the computational domain was eight times the height of the amphibious vehicle. The distance between the center of the amphibious vehicle and the upper boundary of the computational domain was set to 2 H (where H is the height of the amphibious vehicle), and the distance between the center of the amphibious vehicle and the lower boundary of the computational domain was set to 5 H. The inlet boundary was the velocity inlet, and the values of the incoming velocity in this simulation were 1, 2, and 3 m/s. The outlet boundary was the free-pressure outlet. The left and right wall surfaces of the computational domain were set as symmetric boundary conditions, and the upper and lower wall surfaces, as well as the surface of the amphibious vehicle, were set as no-slip wall boundary conditions. The computational domain and boundary conditions of the amphibious vehicle simulations are shown in Figure 2. A fully structured mesh was used to discretize the fluid domain, as shown in Figure 3. The mesh of the near-wall region of the vehicle body was encrypted. A boundary layer was set to effectively capture the nonstationary flow details, with a total mesh size of 1.19 million and a y+ value approximately equal to 1, as shown in Figure 4.
The movement state of amphibious vehicles in water is related to their volume Froude number Frv.
F r v = v / g V 1 / 3
where v is cruising speed, V is displacement volume, and g is gravitational acceleration. Based on the size of the Frv, amphibious vehicles can be divided into three categories: low-speed floating state (Frv < 1), intermediate transition state (1 < Frv < 3), and high-speed gliding state (Frv > 3). The navigation resistance of amphibious vehicles generally consists of 70–80% viscous pressure resistance, 5–10% frictional resistance, and 15–20% wave-making resistance [1]. For amphibious vehicles in the low-speed floating state, the shape resistance accounts for a larger proportion, which is mainly related to the complexity of the surface. At high speeds, resistance is more dependent on the attitude [20].
Based on the current design of this vehicle, its maximum navigational speed is 10 km/h. This speed is not only affected by the resistance during navigation but also takes into account other technical issues. Therefore, we have chosen five navigational speeds: 1 m/s, 1.5 m/s, 2 m/s, 2.5 m/s, and 3 m/s, which cover the maximum navigational speed and ensure a certain interval between them in order to clarify the impact of speed on resistance. The speeds are the vehicle’s relative speed. With a draft of 300 mm and a maximum navigation speed of 3 m/s, the calculated Frv is 0.95, which is in the floating state. The forces acting on the amphibious vehicles are consistent with those in the static floating state, and the main source of resistance is viscous pressure resistance, which may account for over 80% [1]. Therefore, this paper temporarily does not consider the stability of amphibious vehicles and aims to reduce the viscous pressure resistance by shape appearance.
Additionally, to account for the impact of wave height on resistance performance at a maximum speed of 3 m/s, 5 different wave heights were considered, namely calm water, 0.1 wave height (Hw), 0.2 Hw, 0.3 Hw, and 0.4 Hw. Hw values are dimensionless ratios of the wave height to the vehicle height, and the wavelengths are all one times the vehicle length. Since the amphibious vehicle is in the low-speed floating state, the impact of wind speed is relatively small. Hence, the effect of wind speed was not considered, and the wind speed was set to be equal to the vehicle speed.

2.2. Numerical Calculation Methods

In this study, RANS equations were used to solve the computational problem of amphibious vehicle turbulence using the following governing equations.
x i ( ρ u ¯ i ) = 0
ρ u ¯ i t + ρ u ¯ j u ¯ i x j = ρ F ¯ i p ¯ x i + x j ( μ u ¯ i x j ρ u i u j ¯ )
Equation (1) is the mass equation, also known as the continuity equation, and Equation (2) is the momentum equation for the Reynolds averaging method. ui, uj (i, j = 1, 2, 3) are velocity components, ρ is the density, μ is the fluid viscosity coefficient, and the pulsating velocity-related term is the Reynolds stress. When solving the RANS control equations, the system of equations is not closed because of the Reynolds stress term and cannot be solved, which must be supplemented with reasonable turbulence-modeling equations. The SST k-ω turbulence model yields improved accuracy and stability in solving the drag problem of amphibious vehicles [12,20]. Hence, the SST k-ω turbulence model was used in this study to simulate the hydrodynamic performance of the amphibious vehicle.
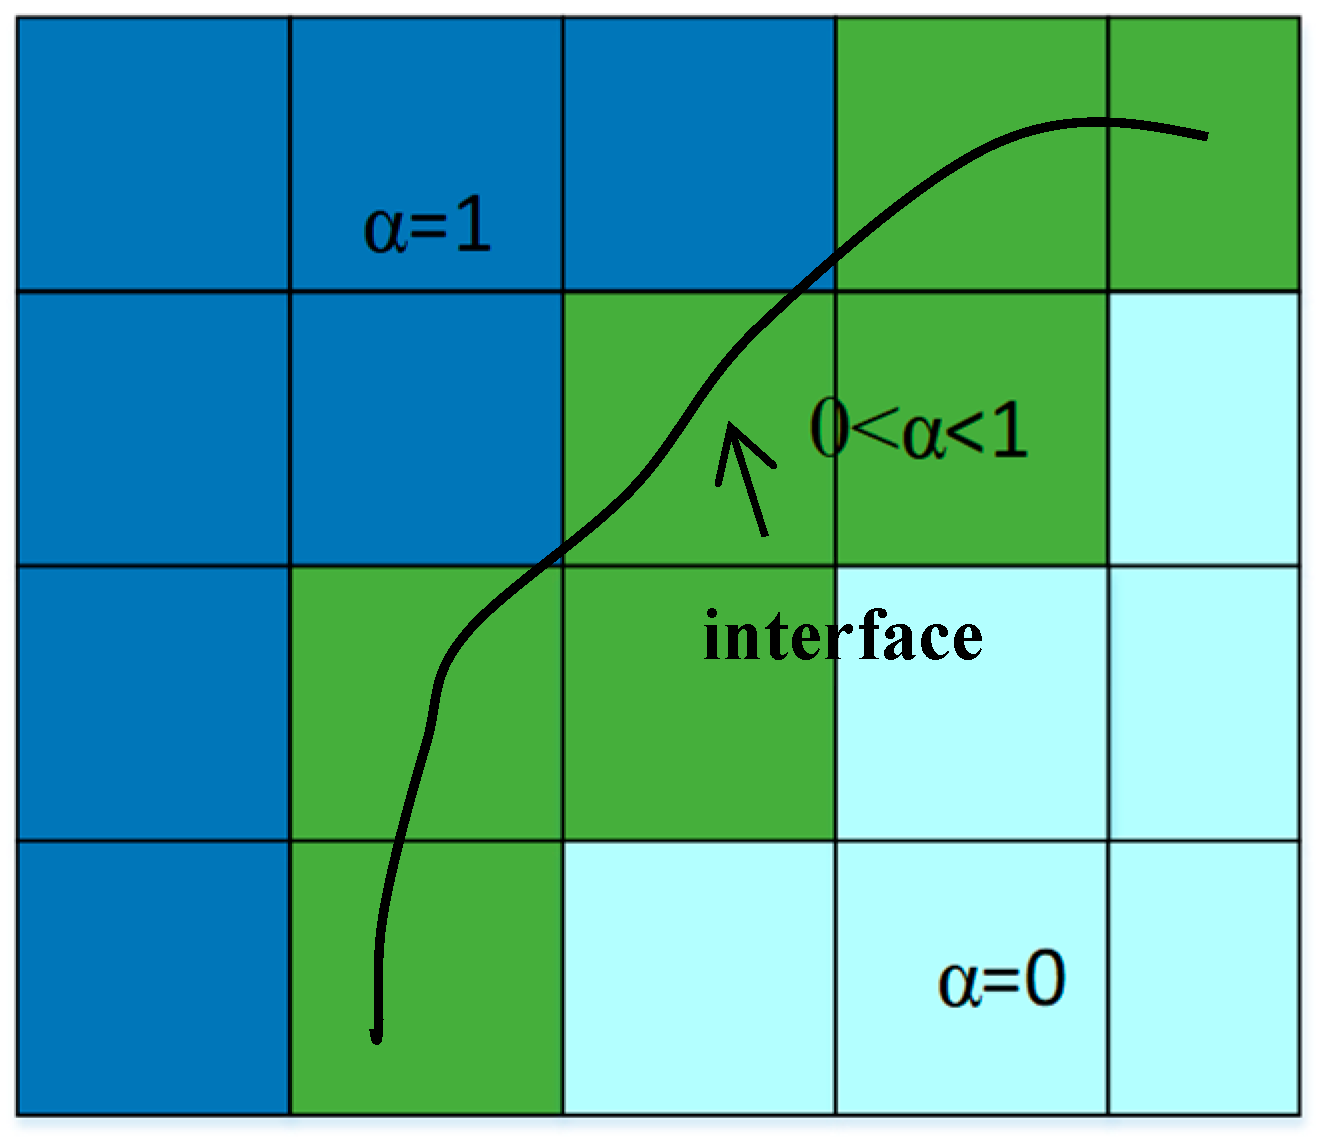
Unlike general flow field problems, amphibious vehicles navigate on the surface of water with a special boundary, that is, the free-fluid surface. The VOF method is a numerical computational method that captures the interface between free surfaces or immiscible fluids. The individual fluids in the VOF method are expressed in terms of the number of volume fractions α occupying the cell, and the sum of the volume fractions of the individual fluids in each control cell is equal to 1, where i indicates the i-phase fluid. In this study, two fluids (air and water) were selected for the calculations, and a subinterface existed between them, as illustrated in Figure 5. The white region α = 0 indicates that the cell is completely occupied by air. The blue region α = 1 indicates that the cell is completely occupied by water, and the green region 0 < α < 1 indicates that both water and air are in the region, which is a water–air interface.
The VOF was based on the momentum Equation (2), and the parameters of the equivalent flow field were obtained by solving the momentum equation based on the respective volume fractions of air and water. The density of the flow field at each point is equal to the weighted average of the density of each medium over the volume fractions:
ρ = α ρ w + ( 1 α ) ρ a
where a and w represent air and water, respectively, as the density of the entire flow field to solve the momentum Equation (2). After obtaining the velocity field, the new volume fraction field was solved using the migration equation:
α t + · α U + · α 1 α U r = 0
where Ur is the velocity corresponding to artificial compression at the interface. The same setup scheme was adopted in all numerical simulations, where the fluids were regarded as incompressible, the physical properties were kept constant, and the heat transfer was ignored. The influence of waves is not considered, so the VOF wave is set as a flat wave.

2.3. Verification of Time-Step Independence

In this study, an instantaneous calculation of the nonconstant flow problem of an amphibious vehicle was used, and the time-step irrelevance was verified. The working conditions for this validation were V = 3 m/s. Three time steps of Δt = 0.01, 0.05, and 0.1 s were selected to calculate the total resistance of the amphibious vehicle. The stabilized average resistance values are listed in Table 1. Δt = 0.01 s was adopted as the reference value, and the deviations of Δt = 0.05 and 0.1 s were 0.86% and 1.96%, respectively. This indicates that the calculation results were less sensitive to the time steps, the calculation results converged, and the calculation results were relatively accurate and reliable.

3. Calculation Results and Analysis

3.1. Drag Analysis of the Original Amphibious Vehicle Model

The drag coefficient of an amphibious vehicle is defined as follows:
C d = F d 1 2 ρ v 2 S
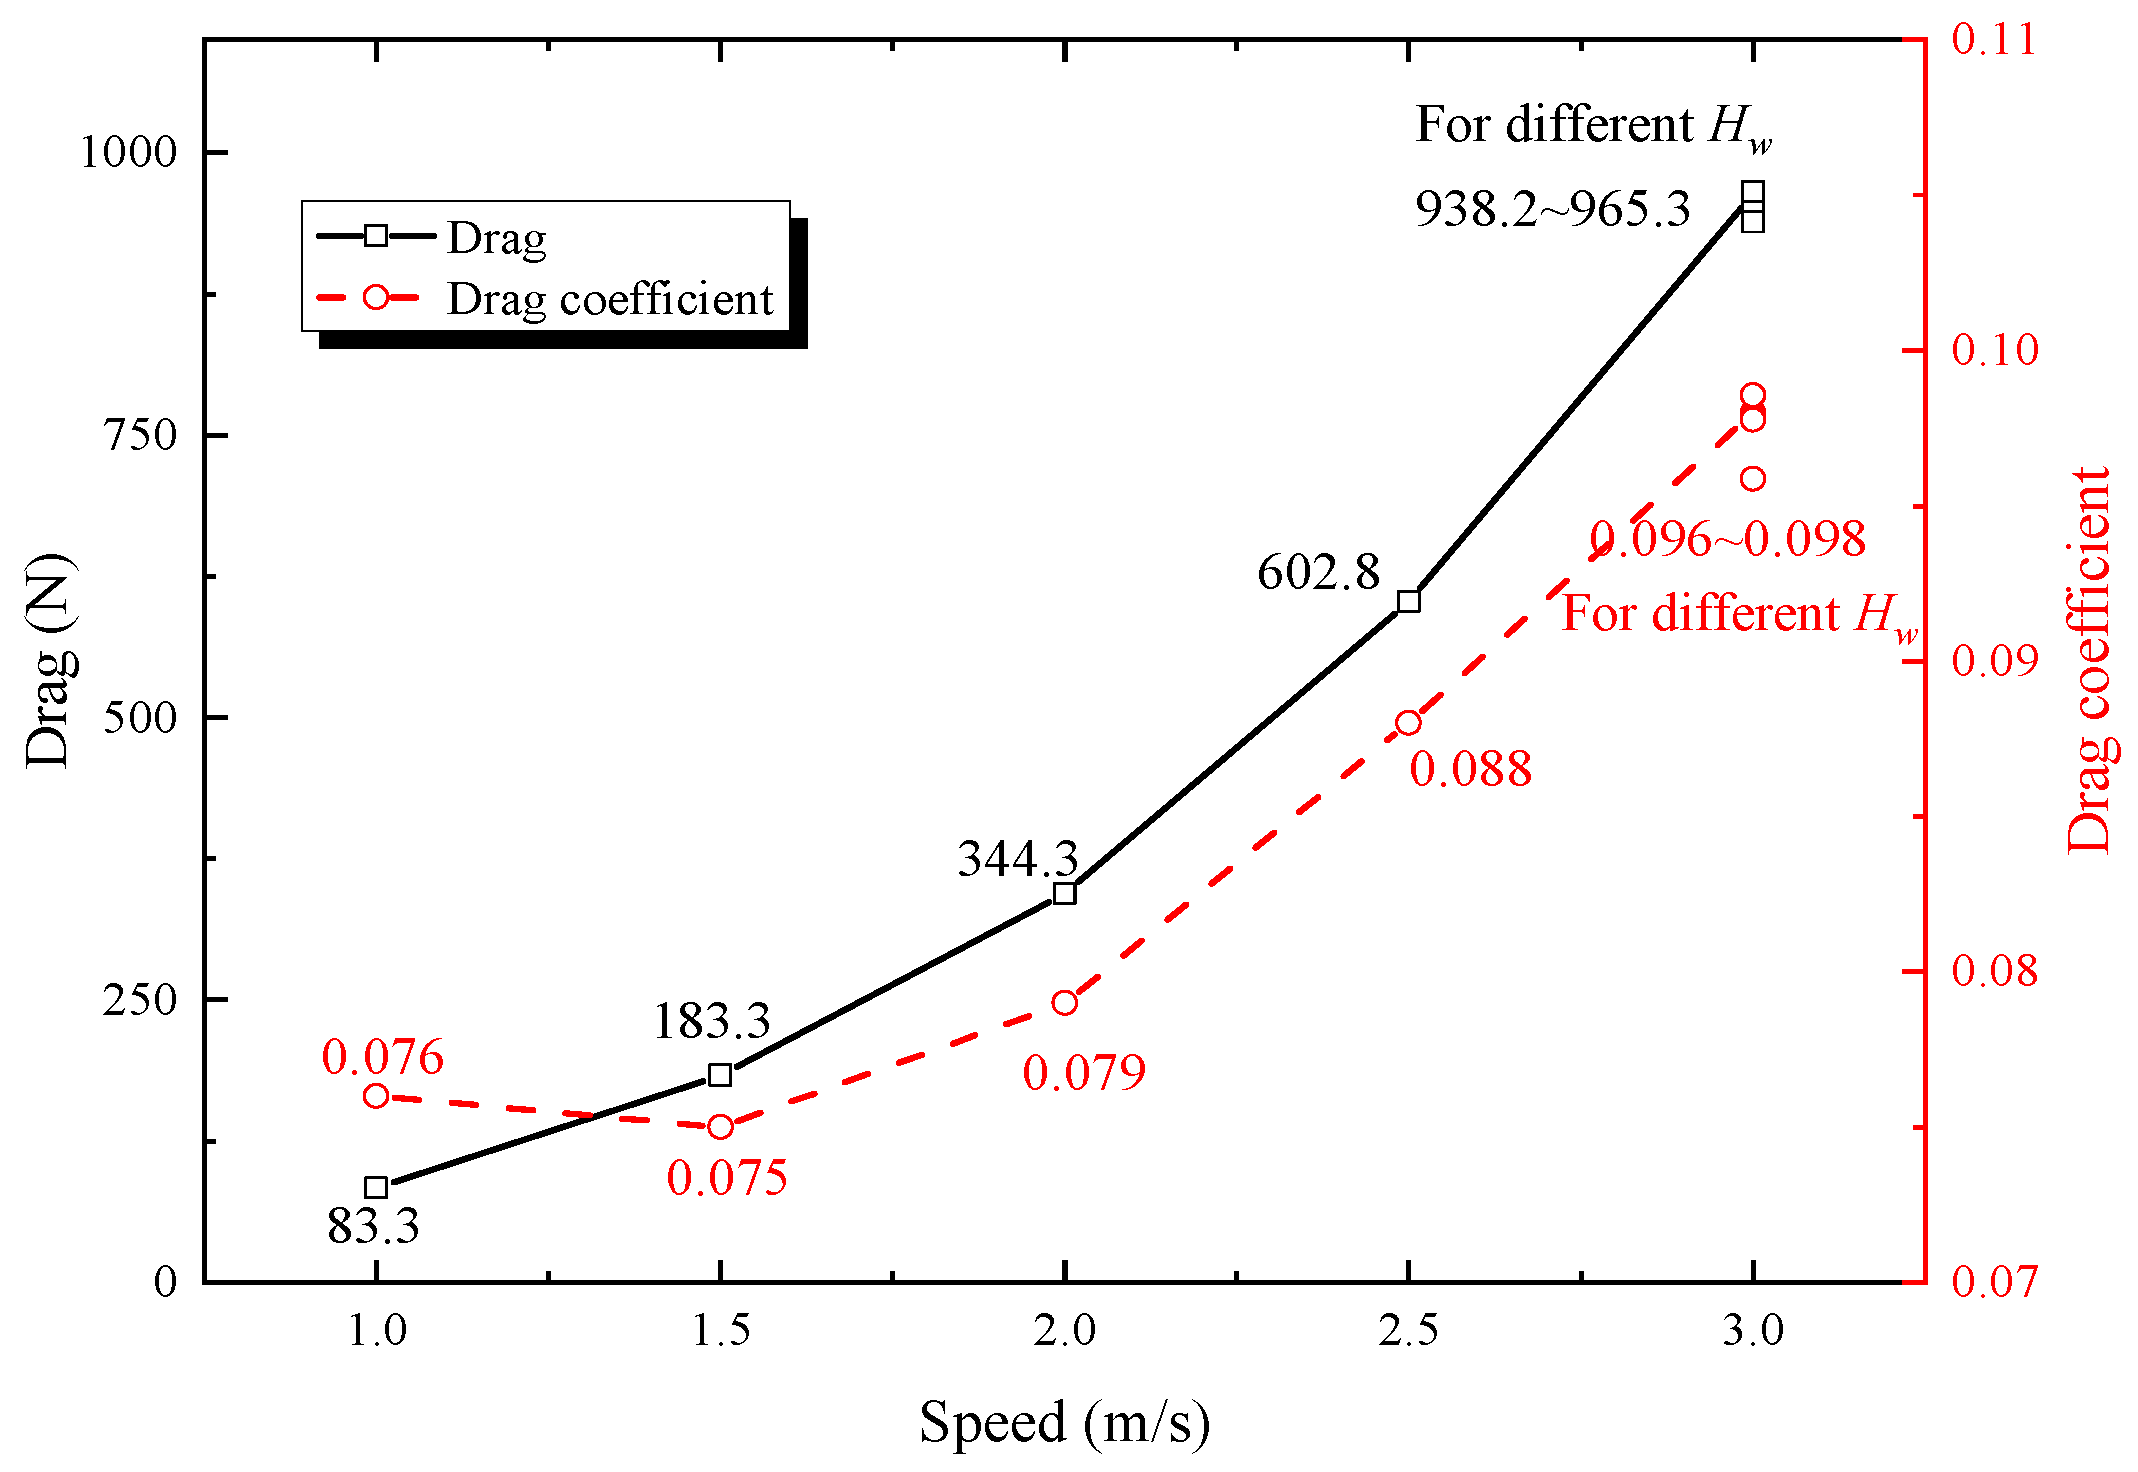
where Fd is the total drag of the amphibious vehicle and S is the wet surface area of the vehicle underwater. Figure 6 shows the simulation results of the drag characteristics of the original amphibious vehicle at different speeds. As the speed increases, the resistance of amphibious vehicles also increases. Under low-speed conditions (v < 2 m/s), the resistance basically increases slowly and linearly, and the resistance coefficient remains unchanged. When the speed is high (v > 2 m/s), the resistance increases significantly, and its resistance coefficient also shows a non-linear increase, which is basically consistent with the resistance changes of floating-state amphibious vehicles. At 3 m/s, the resistance and resistance coefficient at different wave heights are very close, with a difference of no more than 3%. Therefore, it can be roughly concluded that wave height has little effect on the results of this simulation. At the highest speed (3 m/s), the drag coefficient of the amphibious vehicle was higher when moving in water (0.098), and there was a large optimization space.
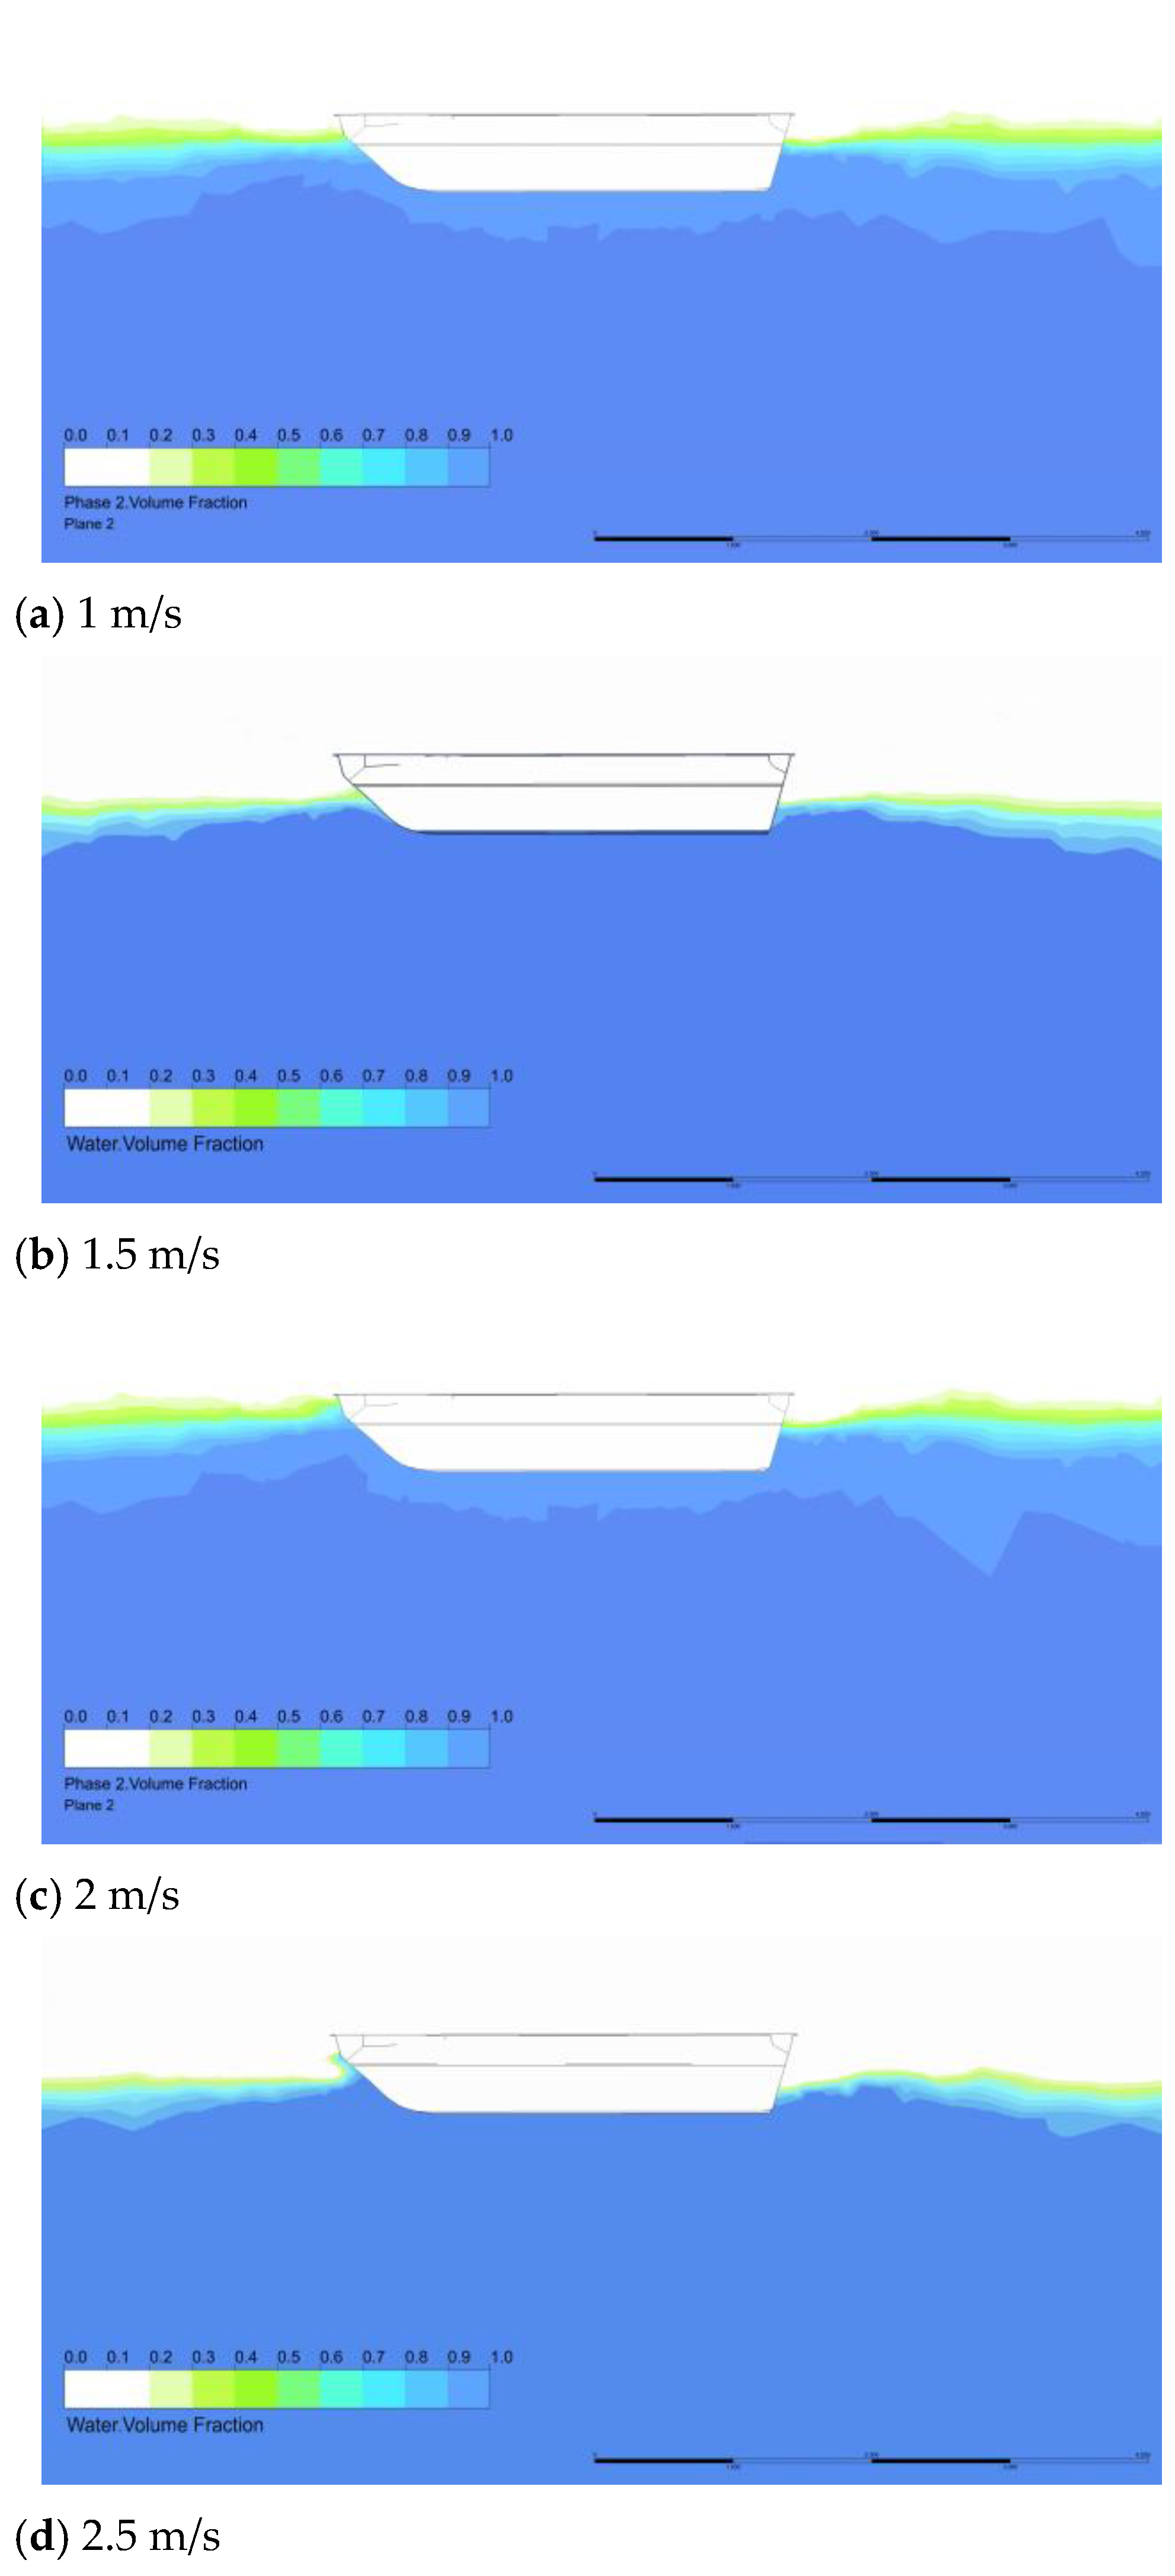
Figure 7 shows the two-phase cloud diagram of water and air after the amphibious vehicle achieved stable navigation in water under different speed conditions. The blue area is the water flow area, the white area is the air area, and the green area is the water–air interface area. At the speeds of 1 m/s and 1.5 m/s, the water–air interface between the bow and stern of the amphibious vehicle was relatively smooth, with no evident wave peaks at the bow and no apparent wave valleys at the stern. At 2 m/s, a low and gentle wave peak appeared at the bow, and a trough gradually formed at the stern. At 2.5 m/s, a noticeable vortex was clearly generated at the bow, and the water level at the stern also further decreased. At 3 m/s, the front of the vehicle formed an evident wave peak, the wave height covered the entire lower shell front of the amphibious vehicle, and tumbling wave breaking occurred. The stern of the vehicle exhibited a distinct wave trough, and the falling water surface increased the low-pressure area. This difference between the high pressure at the bow and the low pressure at the stern was one of the main sources of navigational drag.
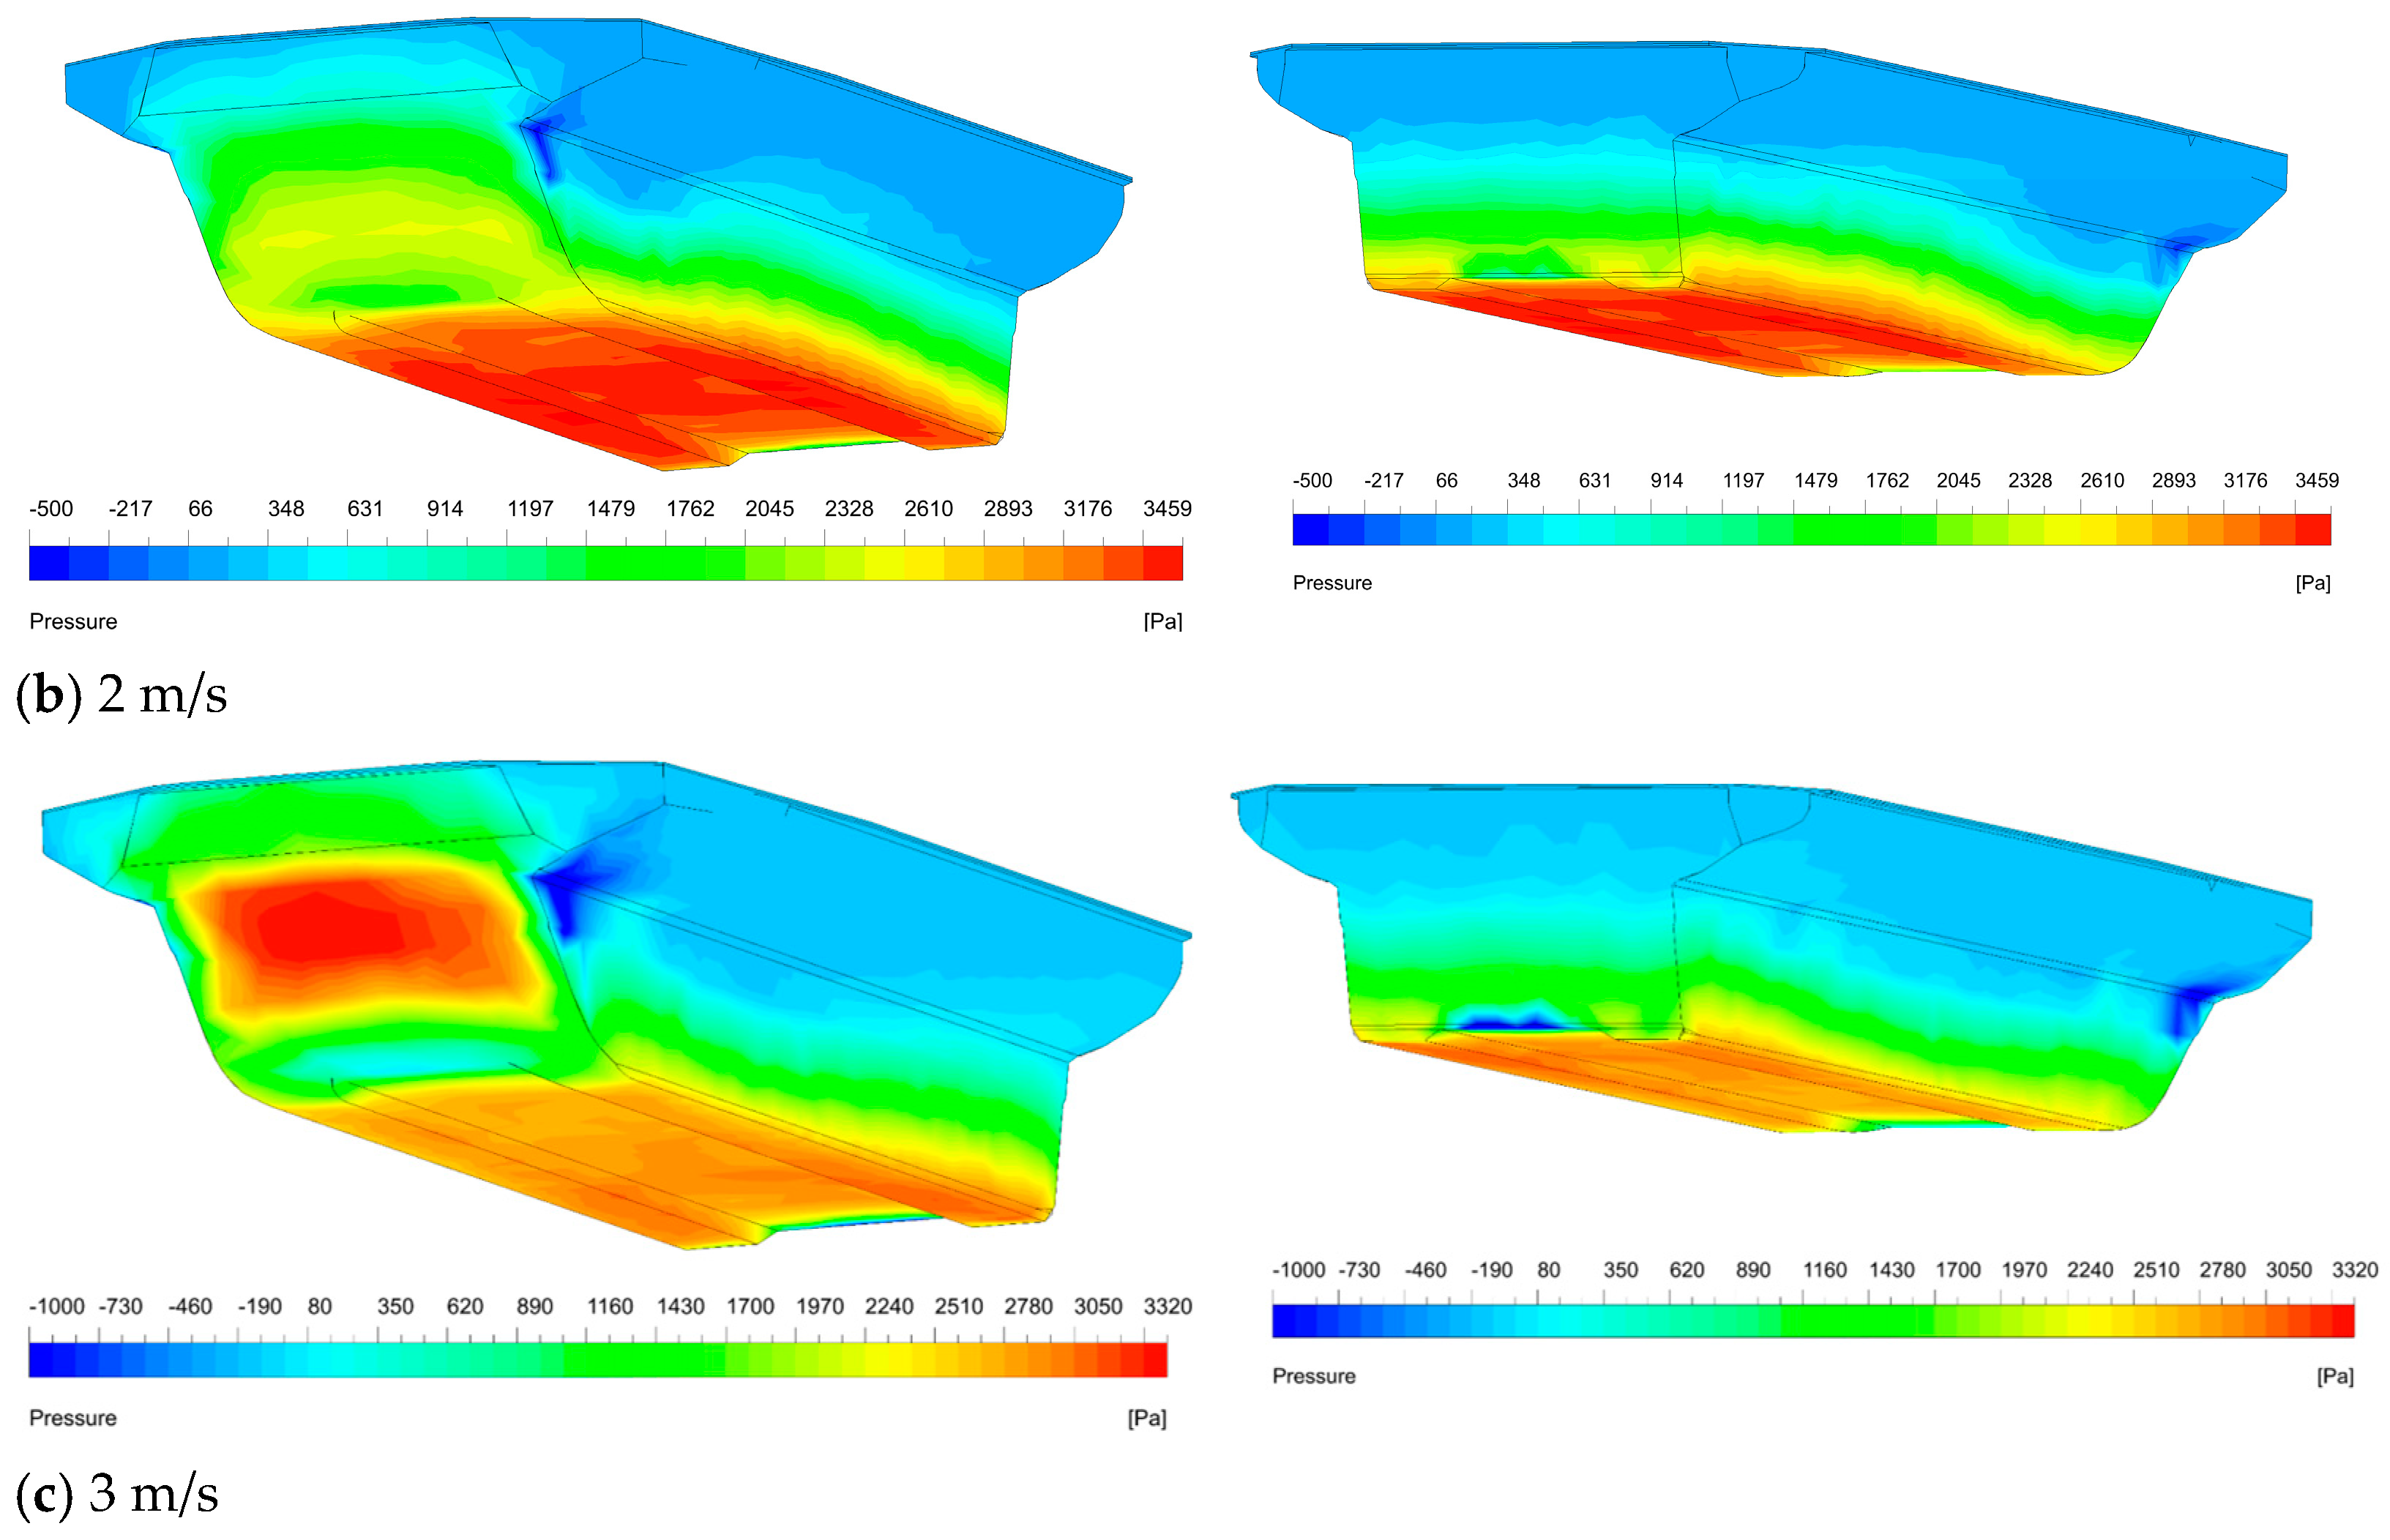
Figure 8 shows the distribution of pressure on the water surface of the amphibious vehicle at different velocities. The pressure around the body of the amphibious vehicle was a uniform step distribution at a speed of 1 m/s, which was caused by the water pressure at different depths. The maximum positive pressure occurred at the bottom of the amphibious vehicle, and the average value of the pressure in this region was approximately 3500 Pa. The pressure distributions at the front and rear of the vehicle were similar. This indicates no apparent flow separation and turbulence movement in the flow field, and the amphibious vehicle does not exhibit front and rear differential pressure resistance. Moreover, the resistance drag coefficient was low. At a speed of 2 m/s, a uniform step distribution of pressure existed around the body. However, a large high-pressure area began to appear at the bow, and the pressure in the high-pressure area was approximately 2500 Pa, which was generated by the impact from the wave crests directly impacting the bow of the body during the navigation of the amphibious vehicle. A nonuniform distribution was observed along the edge of the bottom of the rear end, indicating that at this time, the rear end of the vehicle had already appeared during the flow separation. This resulted in high-speed fluid and vortex movement in the separation area. At this time, the pressure distribution between the bow and the stern induced a pressure difference, and the drag coefficient increased slowly. When the speed reached 3 m/s, a high-pressure area was formed in the bow of the amphibious vehicle, and the pressure reached 3300 Pa owing to the impact of the high wave on the bow of the vehicle. At the same time, the high-pressure area at the speed of 3 m/s was larger in area, and the effect of the impact was more intense. The bottom of the rear of the vehicle also showed uneven pressure distribution; a significant low-pressure area was formed in the central position of the rear corner and spread upward along the rear of the vehicle, and the absolute value of the maximum negative-pressure area was obtained. Because of the significant high pressure at the front and relatively low pressure at the bottom of the rear, the pressure difference resistance of the amphibious vehicle in the longitudinal direction increased rapidly, and the drag coefficient increased sharply.
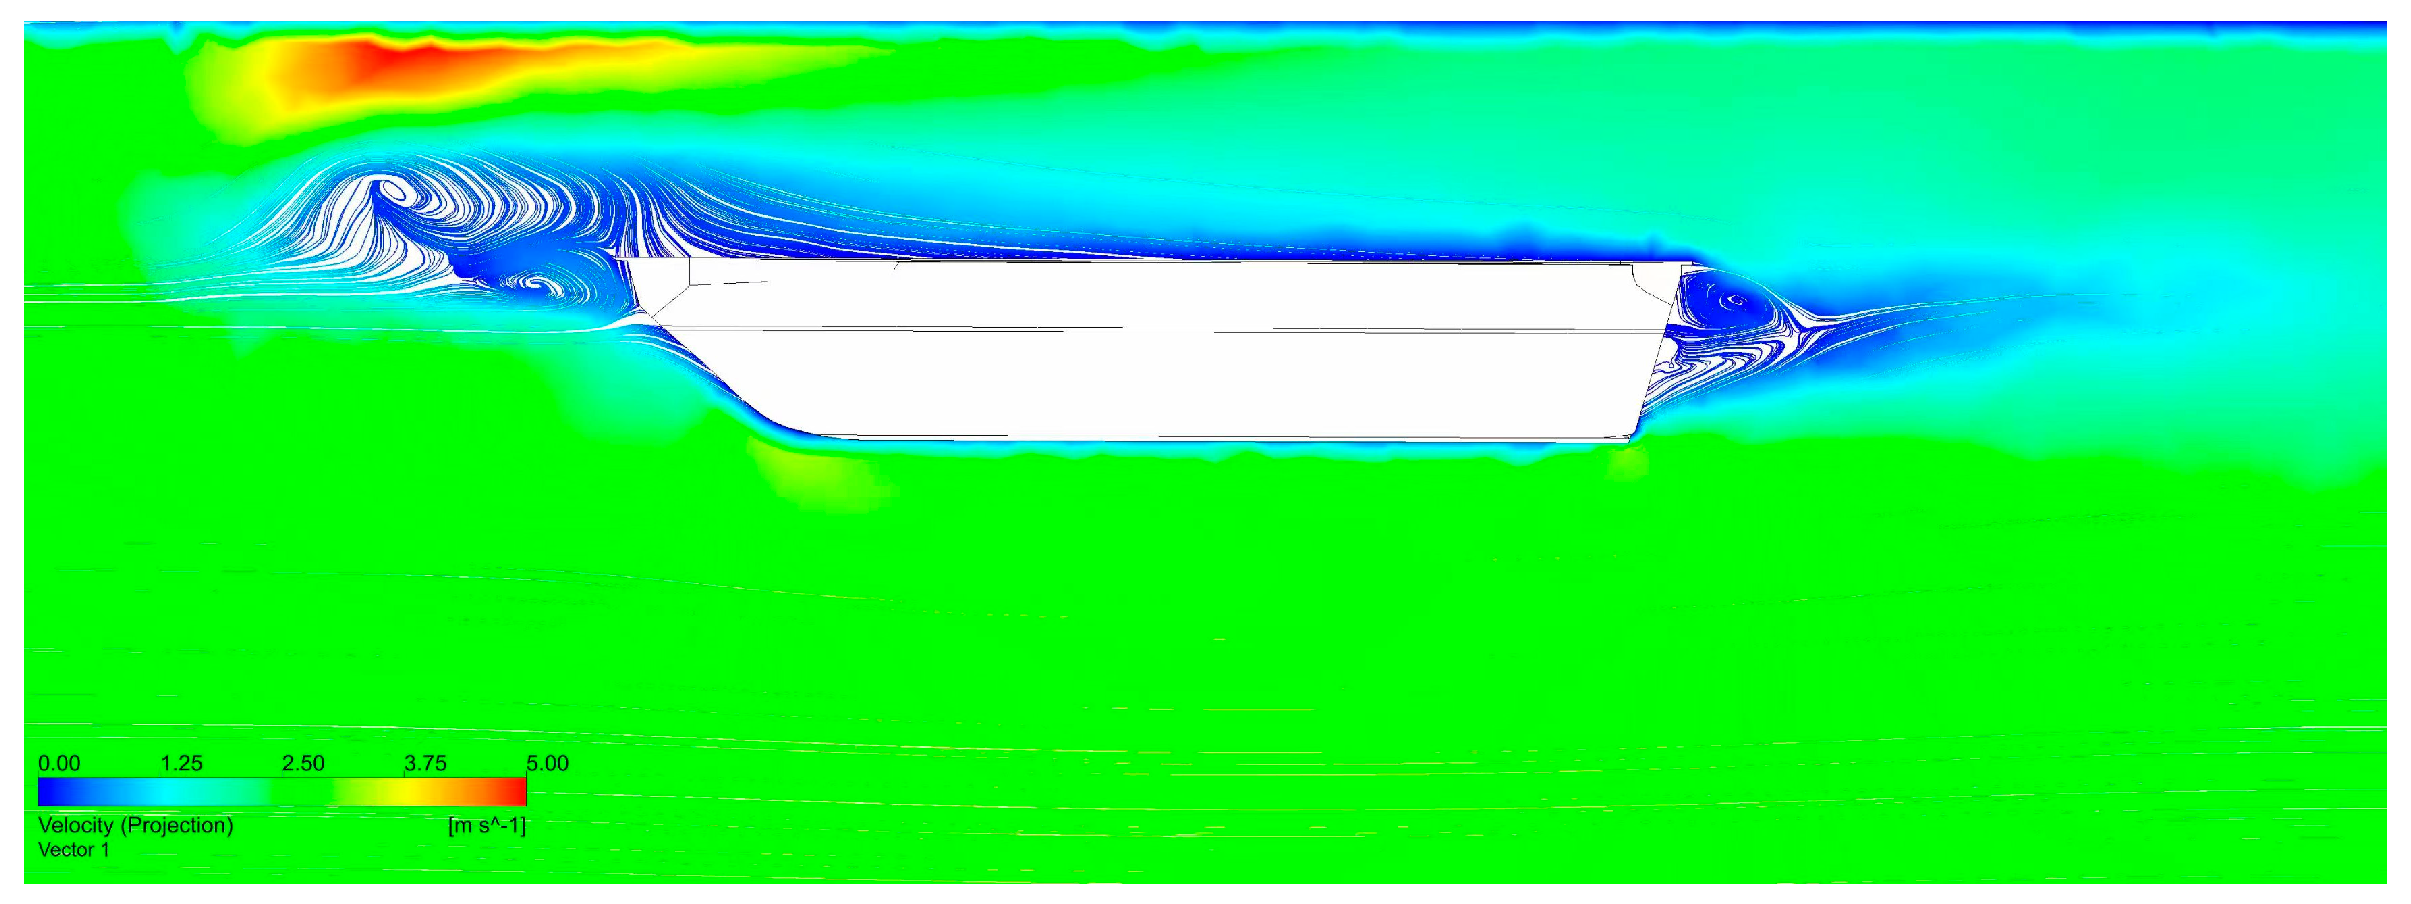
As mentioned in the previous section, the flow field and pressure distribution of the winding flow of the amphibious vehicle at a speed of 3 m/s changed significantly, and an increased drag was unfavorable for navigational performance. By analyzing the velocity field, the specifics of the amphibious vehicle wrap-around flow pattern can be obtained. Figure 9 shows the cross-sectional streamline diagram of the amphibious vehicle at a speed of 3 m/s. The bow of the vehicle caused a large obstruction to the incoming flow, and the fluid flow velocity gradually decreased to zero at the bow position of the amphibious vehicle, thereby forming a large, rotationally oriented, low-speed reflux vortex. According to Bernoulli’s law, a high-pressure stagnation zone was formed at the bow of the amphibious vehicle, and fluid flowed to the bottom and both sides of the amphibious vehicle under high pressure.
When the amphibious vehicle sailed in water, the fluid flowed along the bottom of the housing to the stern of the amphibious vehicle, where a stagnation zone was formed under the stern owing to the flow separation caused by the sudden change in stern shape (Figure 9). Simultaneously, the fluid from the left and right sides of the amphibious vehicle also followed the same pattern owing to a sharp change in the shape of the stern and returned to the stagnation area, generating a vortex under shear. At this point, the stern of the amphibious vehicle converged the fluids from the bottom, left, and right directions and generated increased-scale vortices under the effects of the velocity gradient and boundary perturbation. Large-scale vortices dissipated energy and broke up into small-scale vortices until they disappeared, and the energy was converted from mechanical to thermal and then dissipated. The pressure drop caused by the trailing vortex significantly increased the differential pressure drag, hindering the movement of the amphibious vehicle underwater.

3.2. Drag Reduction with Attachments

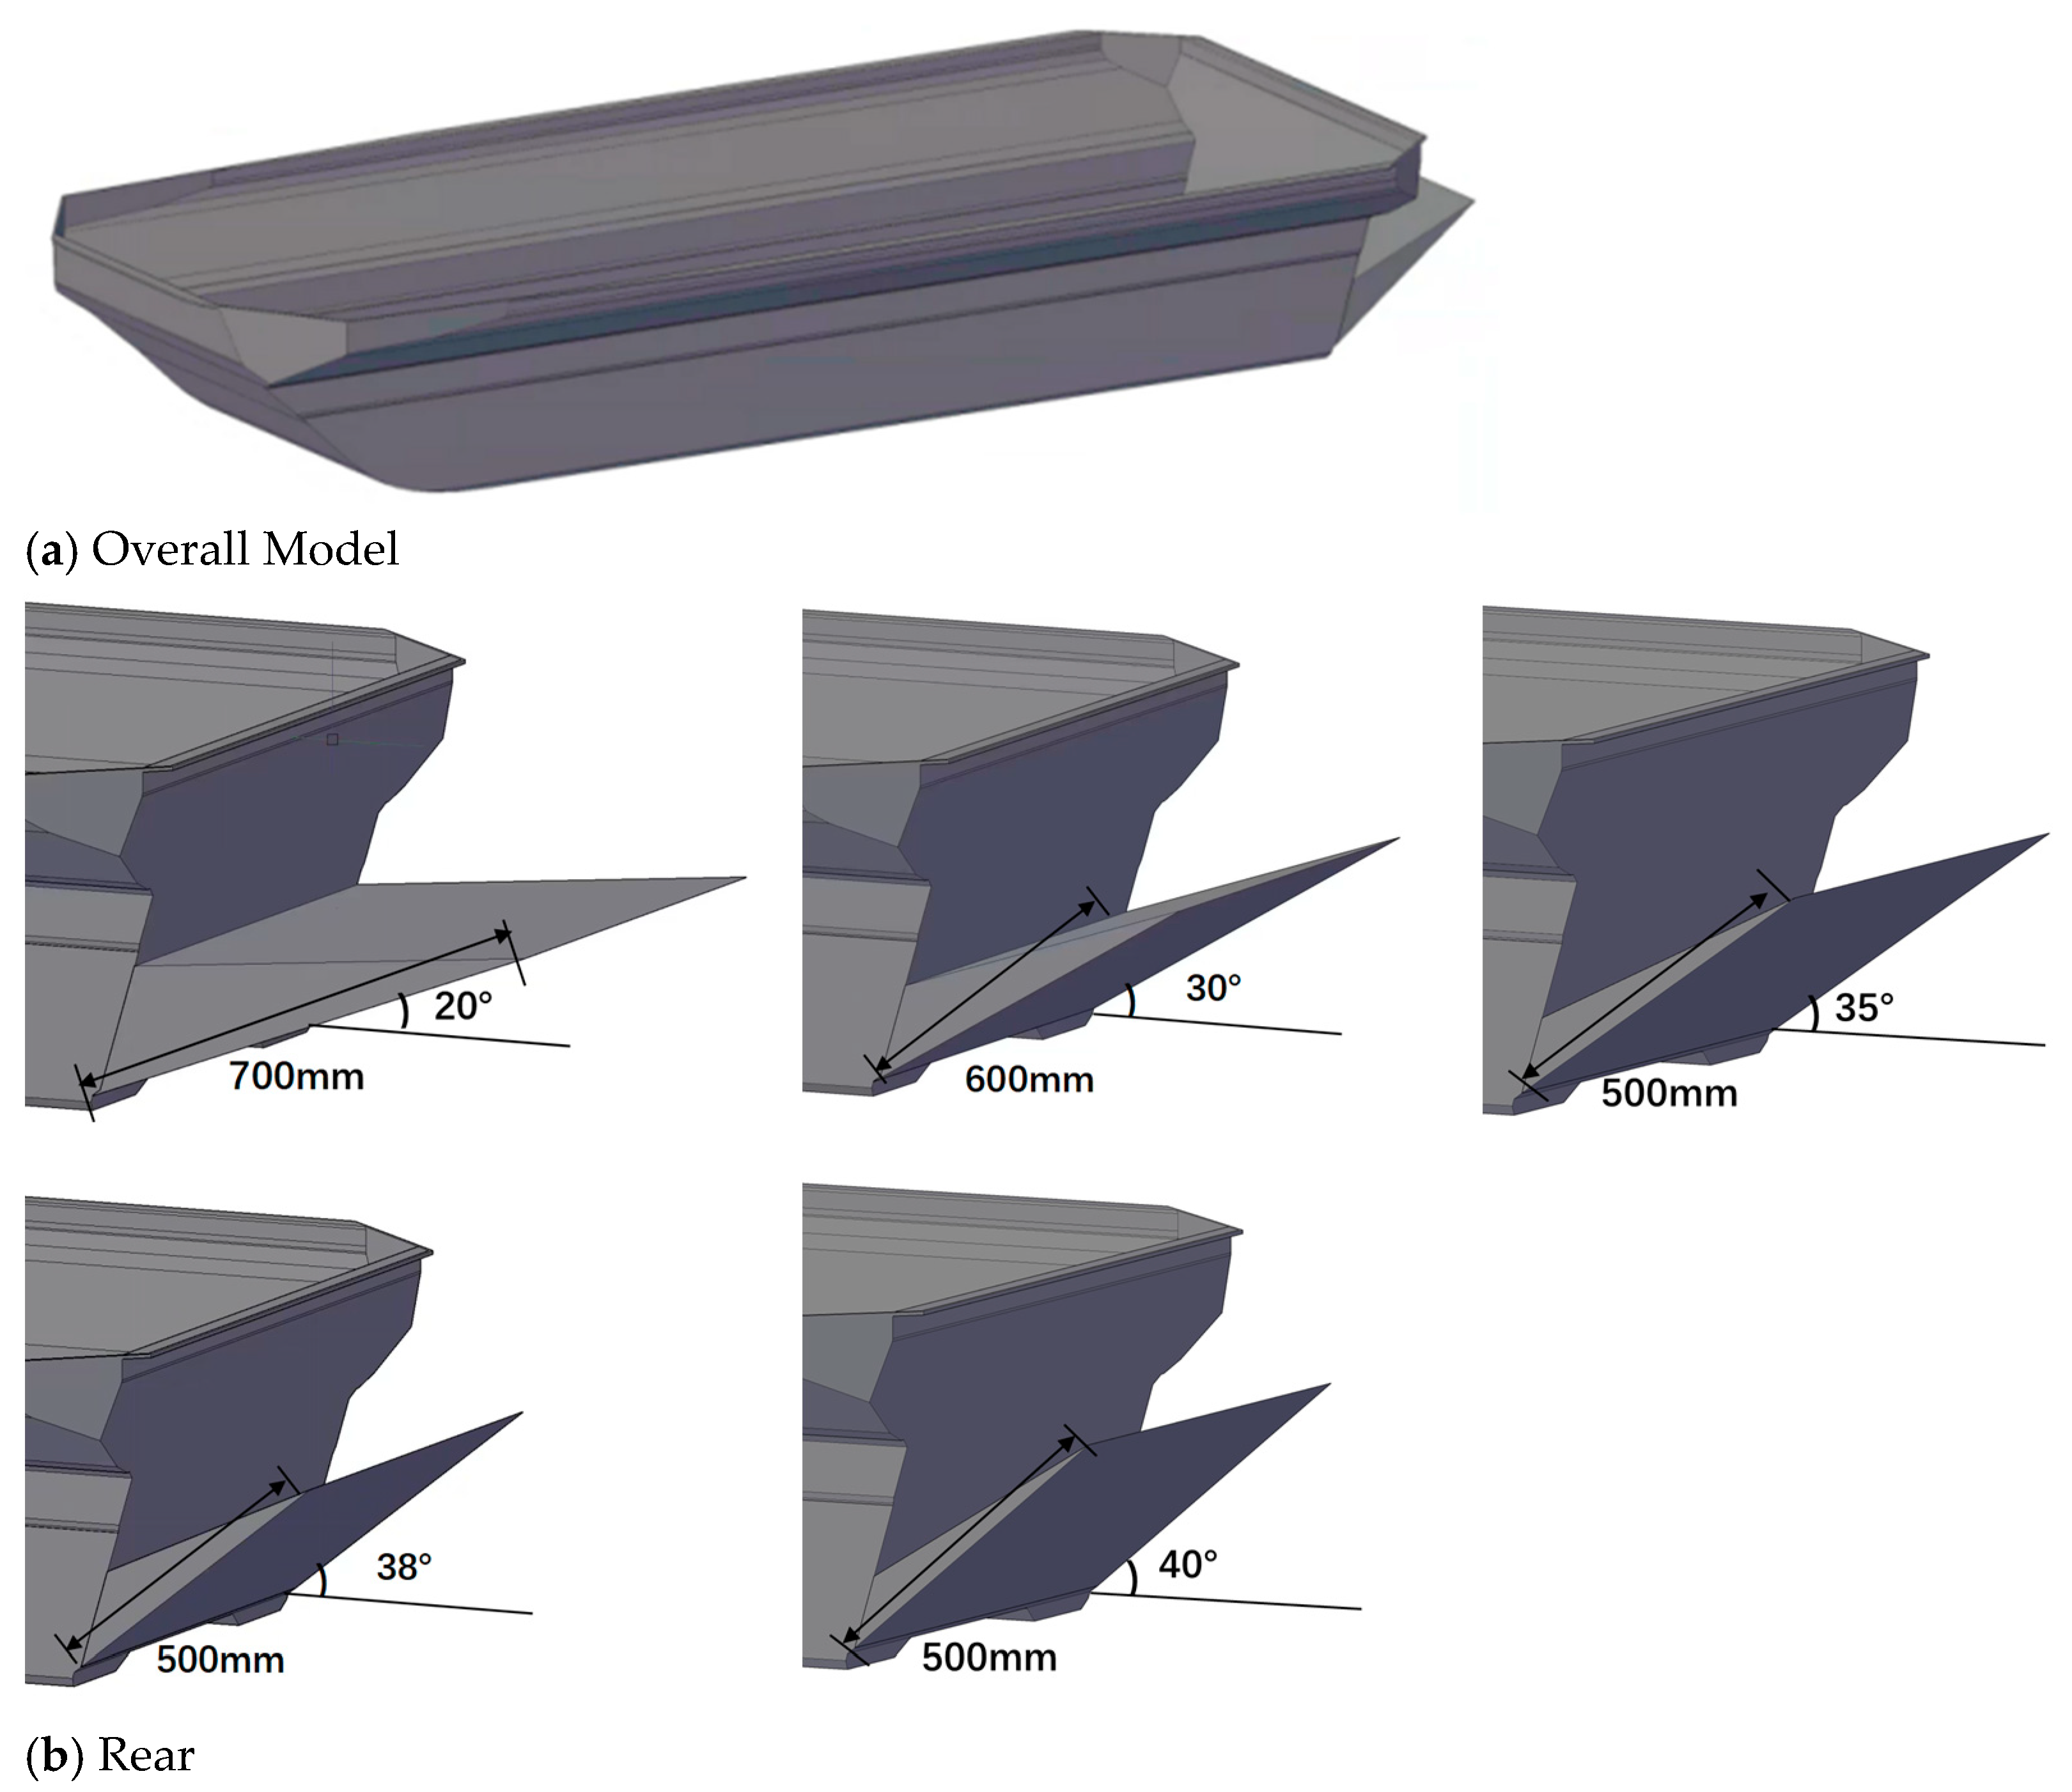
The analyses of the free liquid surface, surface pressure field, and velocity field of the amphibious vehicle showed that a vortex was generated in the bow and stern of the amphibious vehicle at a speed of 3 m/s. This is one of the main reasons for the significant increase in the sailing resistance of the amphibious vehicle. In particular, the stern angle of the amphibious vehicle was extremely large, and the sudden interruption of the stern structure triggered a strong flow separation, leading to a wide range of vortices. This increased the pressure difference between the front and rear of the amphibious vehicle and increased the drag. Stern flaps are commonly used drag-reduction attachments in ships and have also been studied and applied recently in amphibious vehicles [22,23]. Considering the design requirements of the amphibious vehicle and the limitations on attachments, the stern flap is selected as the primary optimization measure. Existing studies [22,23] have shown that small-angle, small-size stern flaps based on ship designs have demonstrated good drag-reduction efficiency. Moreover, attachments with larger angles and sizes are more convenient for design, installation, replacement, and control. Therefore, a larger range of angles and sizes has been chosen as the focus of this optimization study, in order to guide the flow of fluid in the stern, reduce the pressure in the low-pressure region of the stern, and then reduce the pressure difference between the front and rear ends of the amphibious vehicle. θ, denoting the angle between the stern flap and the horizontal plane, is selected as 20°, 30°, 35°, 38°, and 40°. The optimized structure is shown in Figure 10.
The drag coefficient and drag-reduction rate were used as evaluation indices to determine the drag-reduction performance of amphibious vehicles at different tailboard angles and to optimize the navigation drag of the amphibious vehicle. The drag-reduction rate is defined as follows:
η = C d 0 C d C d 0
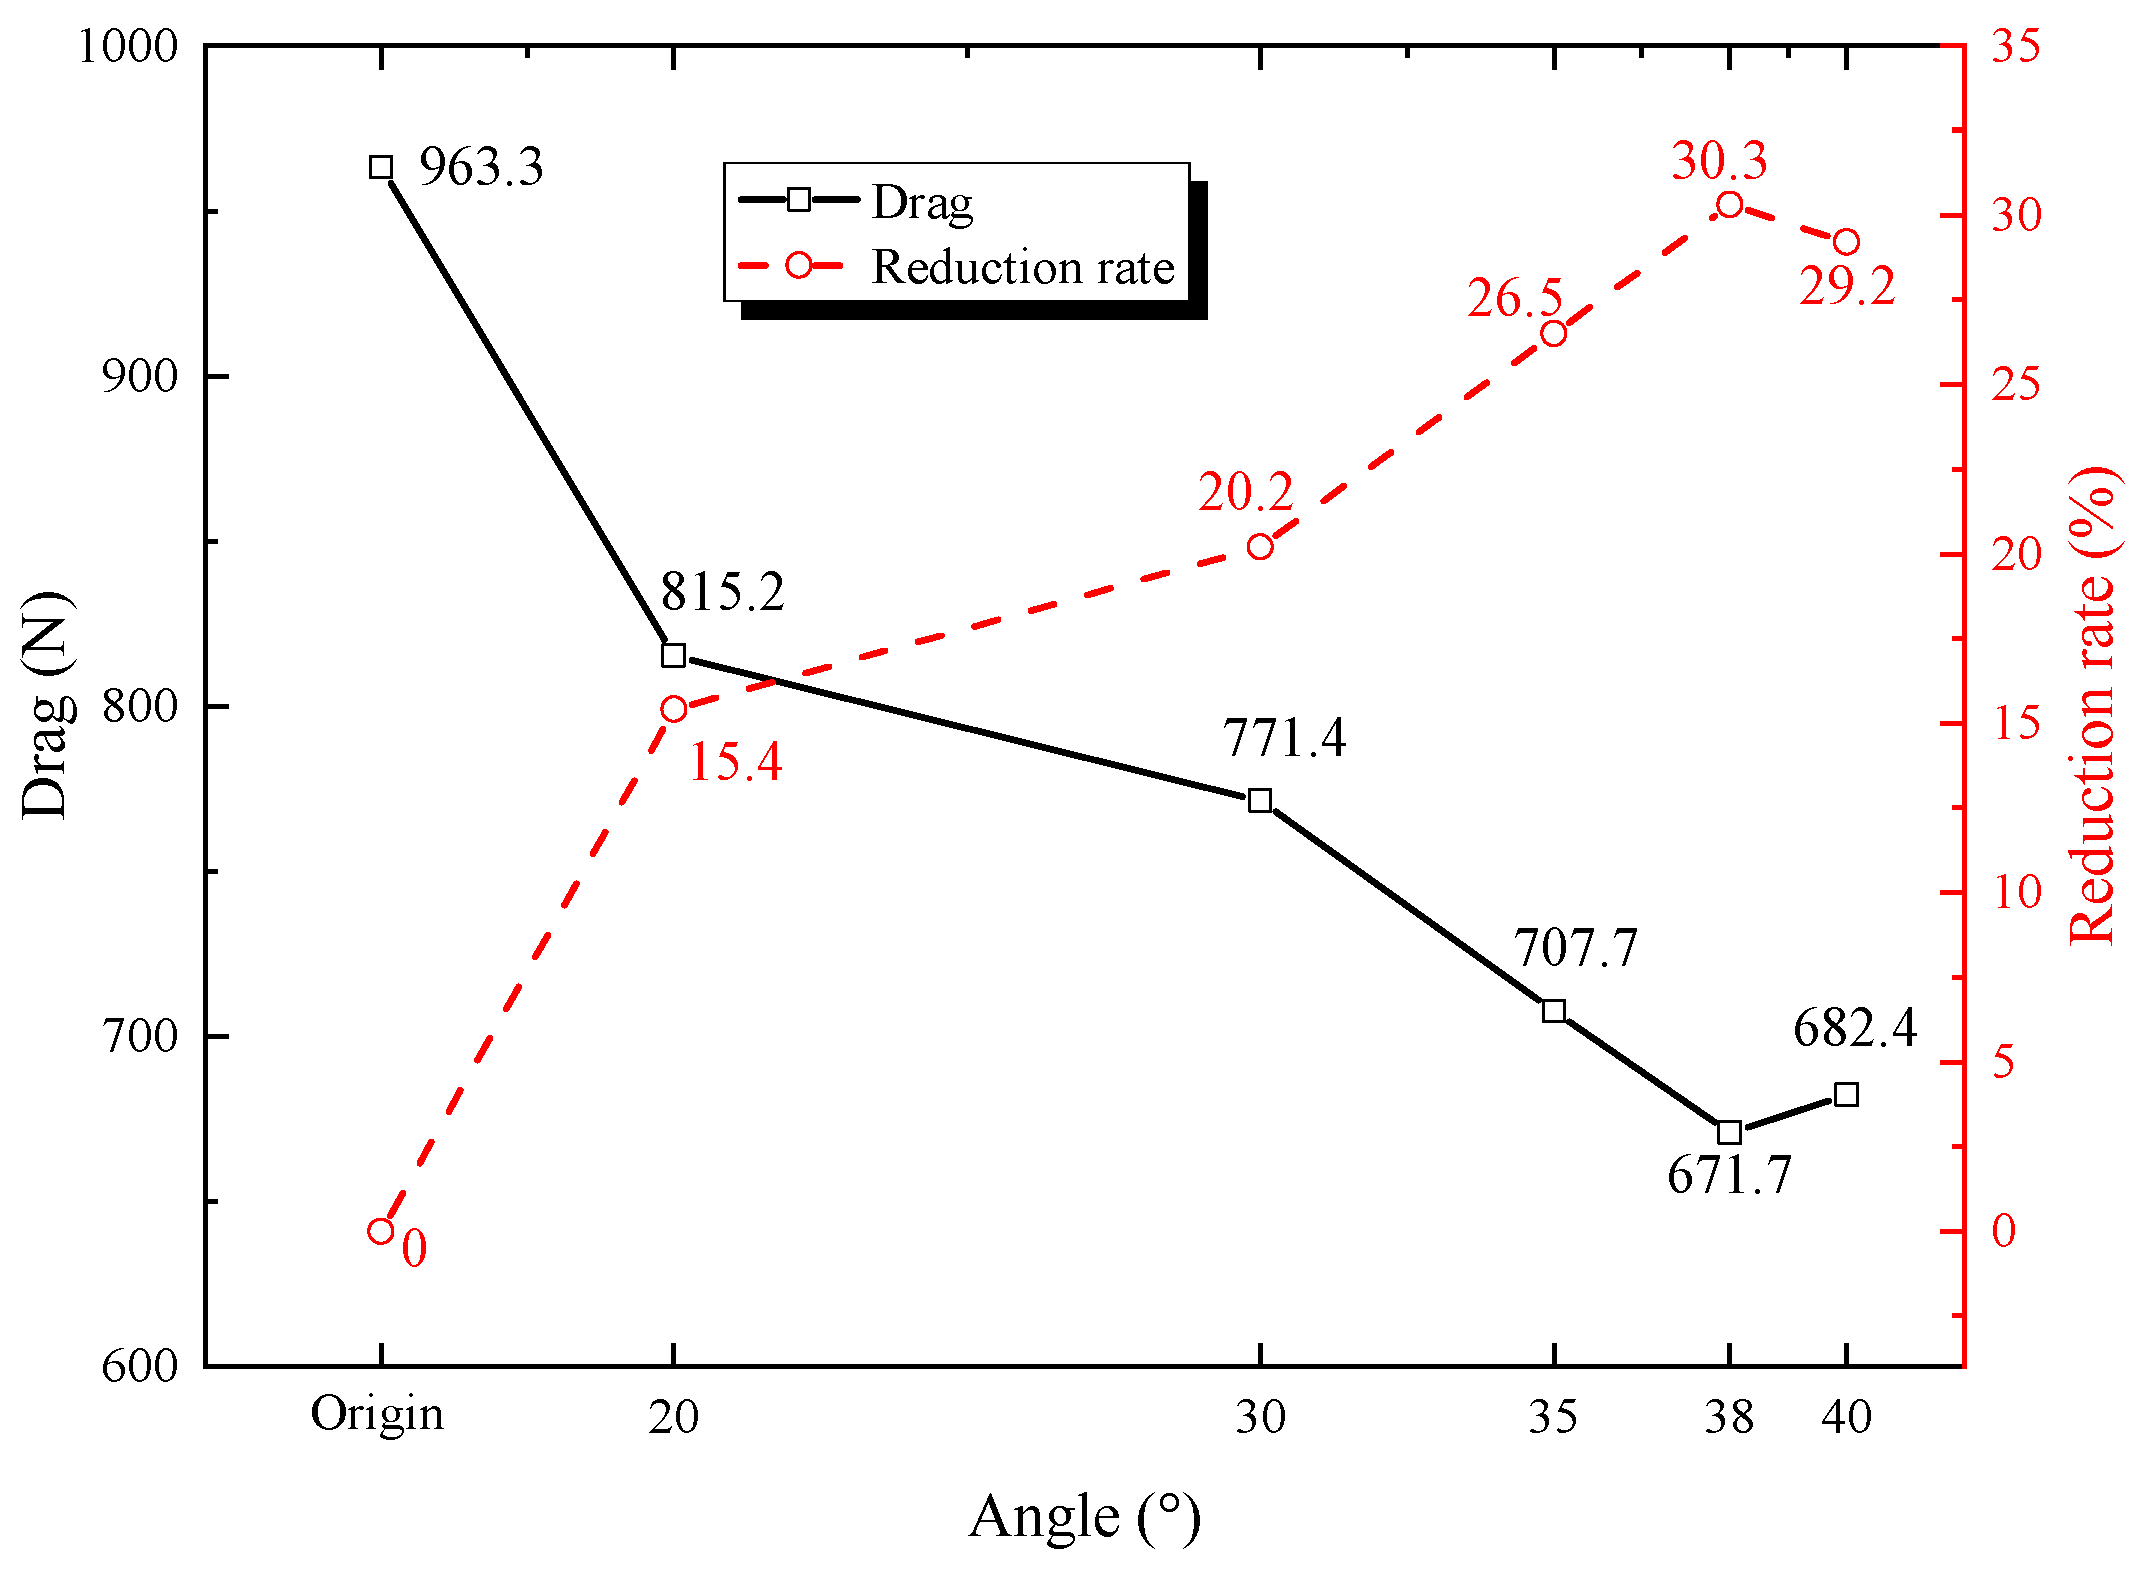
where Cd0 is the total drag coefficient under the original amphibious vehicle shape, and Cd is the drag coefficient of the amphibious vehicle after adopting the improved method. The computational domain was established according to the structural dimensions of the optimized model of the amphibious vehicle, and a numerical simulation of the optimized model was performed using the same grid scale and boundary parameter settings to analyze the effect of stern flap angle on the navigational drag of the amphibious vehicle. As shown in Table 2 and Figure 11, when θ is less than 38°, the drag-reduction rate increases approximately linearly. However, when θ exceeds 38°, the drag-reduction rate not only fails to increase but actually decreases. Therefore, the best drag-reduction effect was achieved at 38°, with a reduction rate of 30.3%.
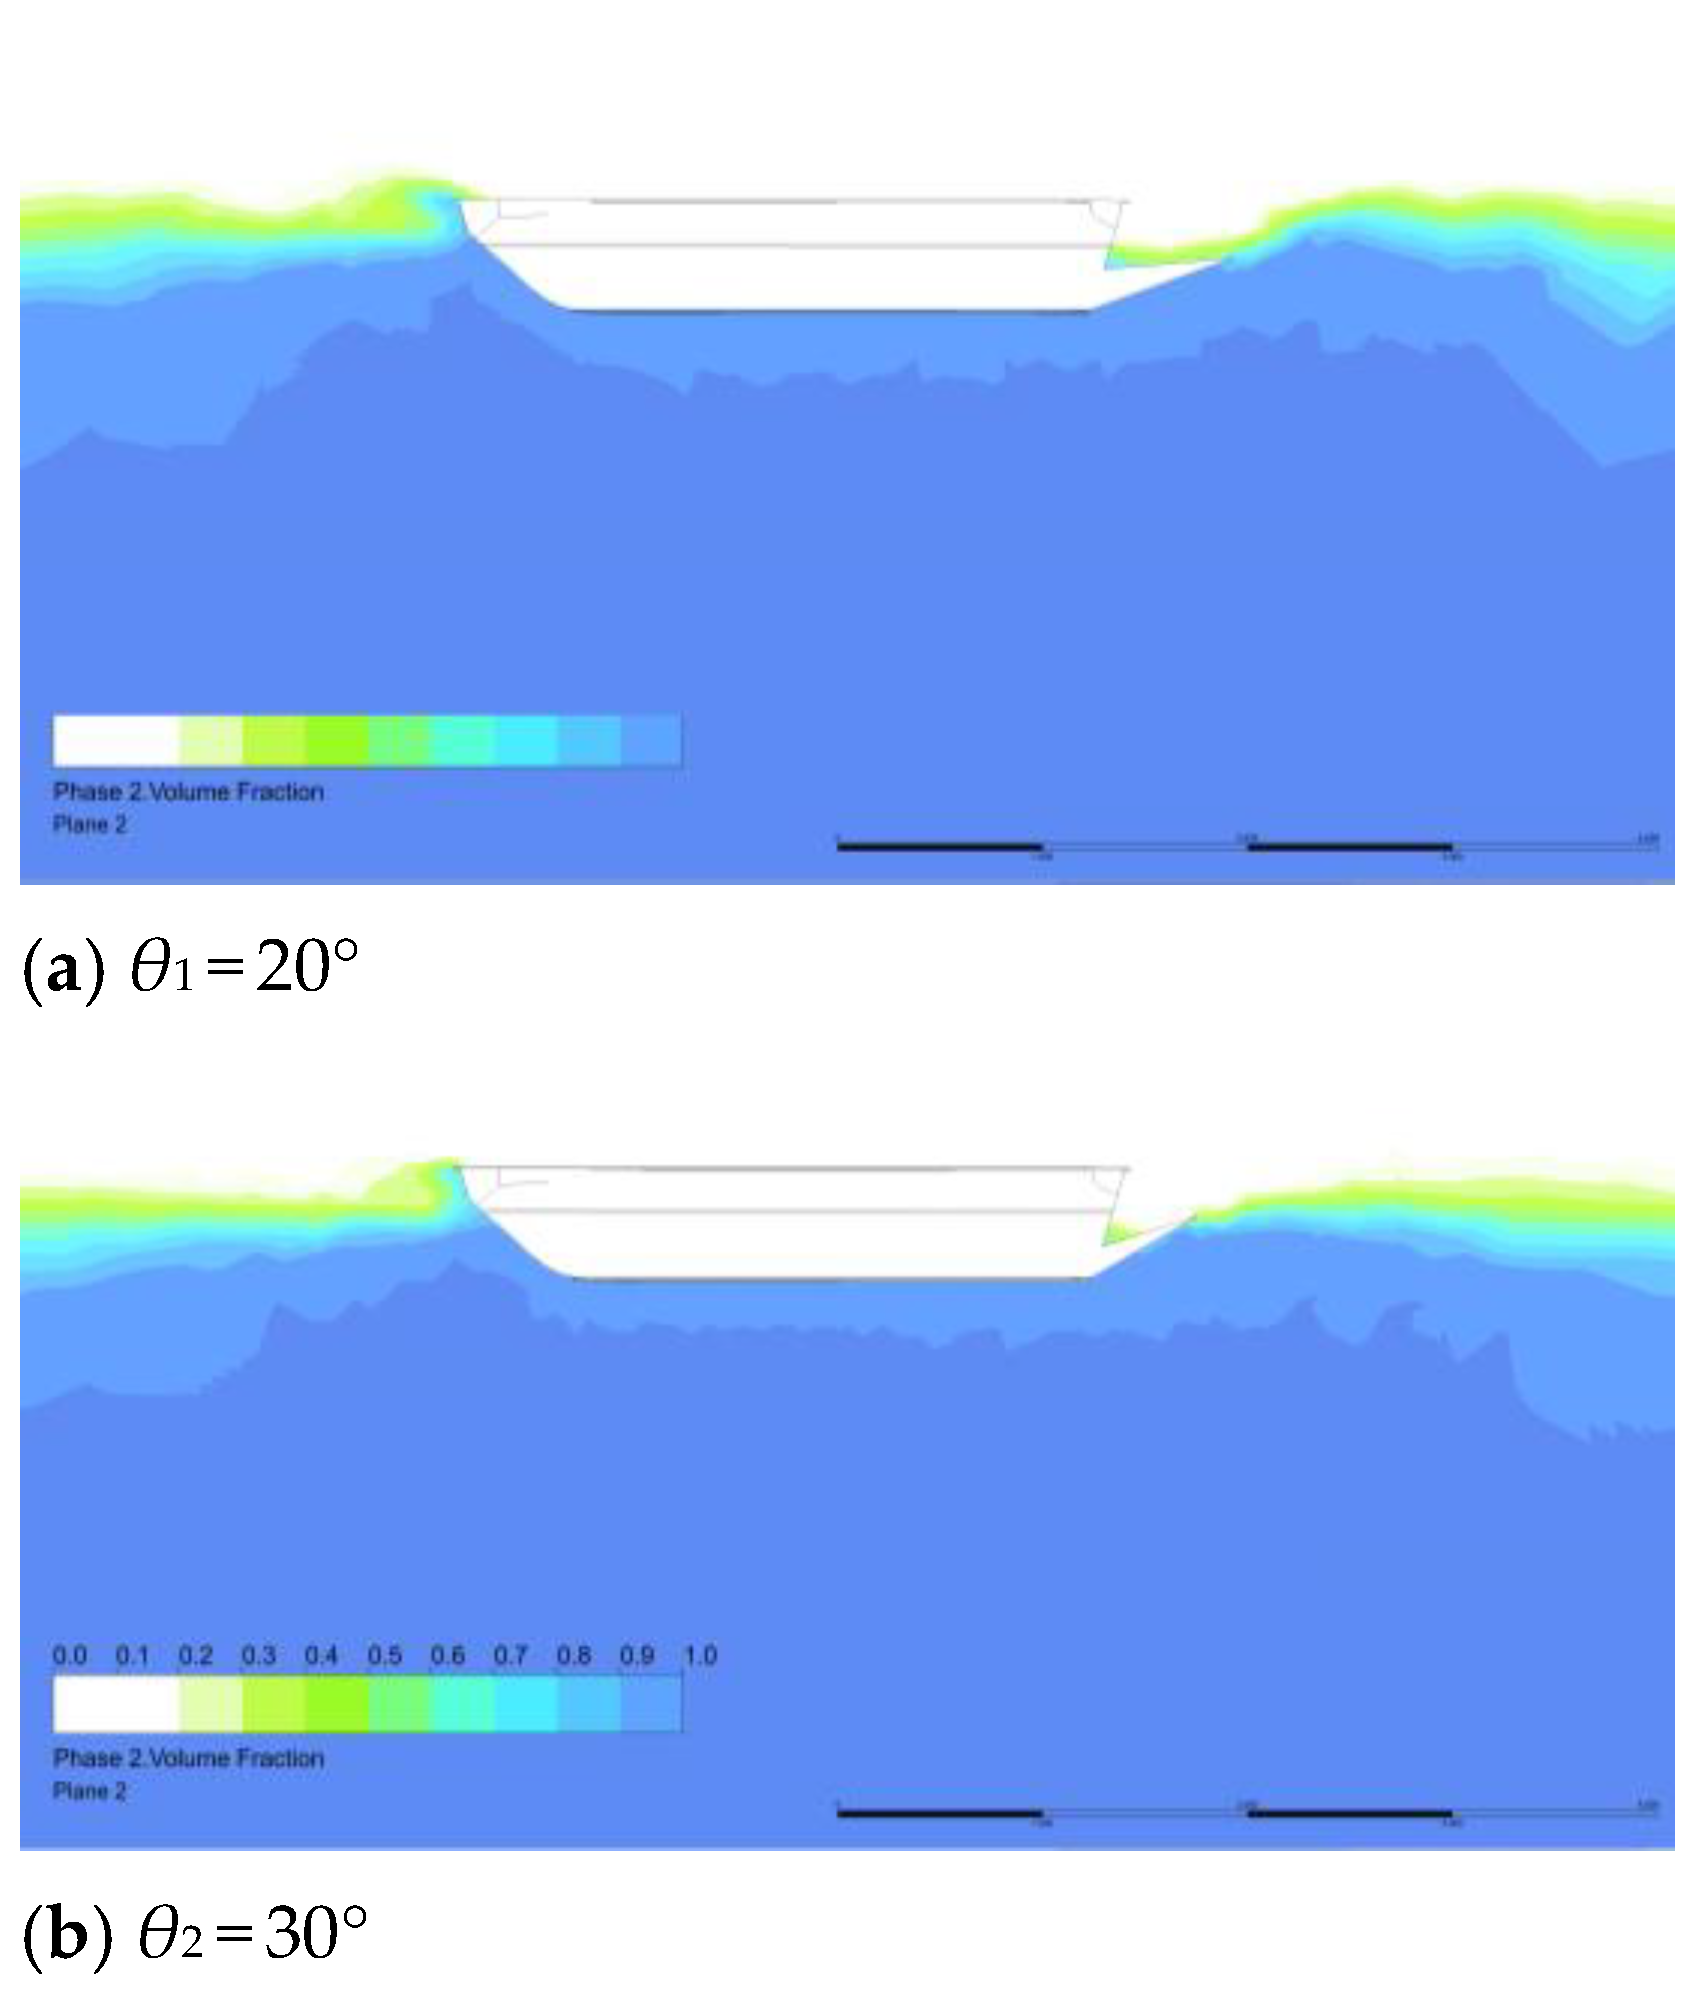
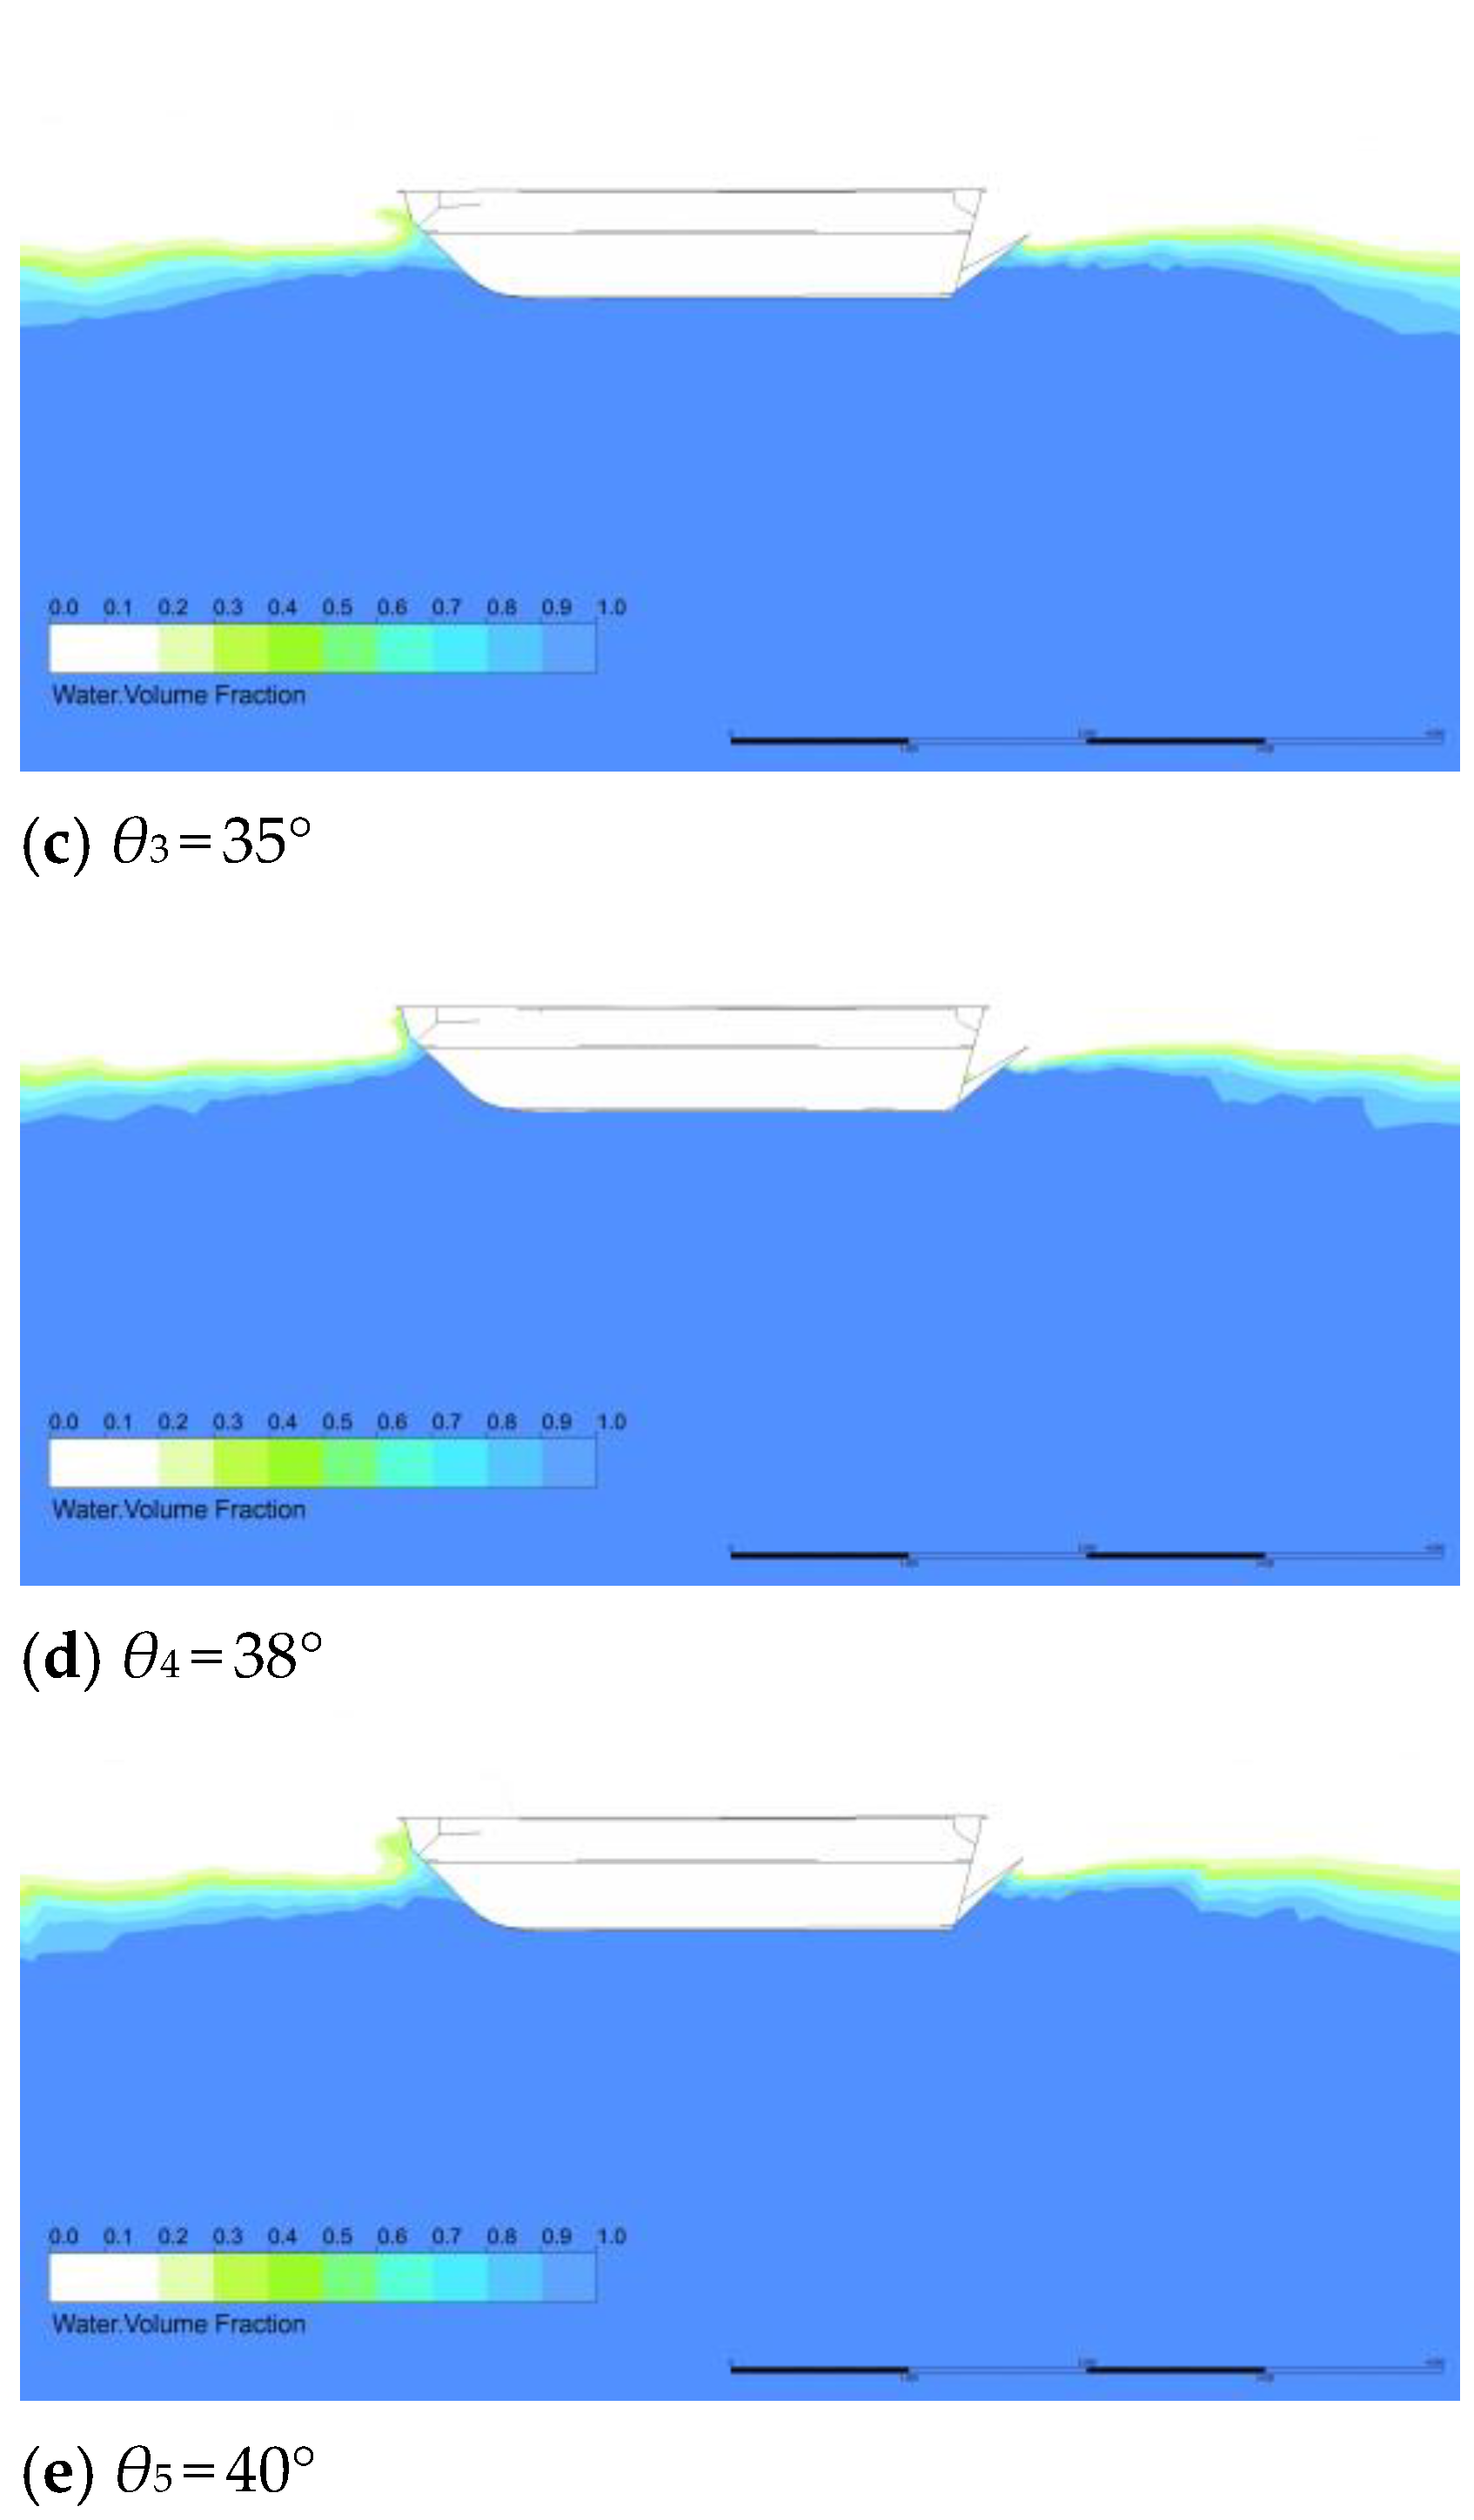
Figure 12 shows the water–air two-phase cloud diagrams of the optimized amphibious vehicle body with different angular airfoils at a speed of 3 m/s after reaching steady sailing. Compared with the original body in Figure 7c, an evident high wave appeared at the bow of the amphibious vehicle. At θ1 = 20° and θ2 = 30°, the height of the wave peak was still higher, and a more obvious trough was observed at the rear of the vehicle. At θ3 = 35°, θ4 = 38° and θ5 = 40°, the crest height decreased compared to the original body. The stern flaps provided better guidance for the flow, and the wave troughs had a clear tendency to slow the movement. The water surface fluctuation in the wake was also weakened, indicating that the optimized amphibious vehicle caused less flow field disturbance. Among them, the 38° stern plate has a better improvement effect on the bow wave height and stern trough.
Because the best drag-reduction effect was achieved at θ3 = 38°, a detailed analysis of the flow field was conducted for this angle (Table 2). Figure 13 shows a cross-sectional flow diagram of the optimized amphibious vehicle at a speed of 3 m/s. The low-speed return vortex caused by the obstruction of the incoming flow at the front of the optimized vehicle has a smaller range than that of Figure 9. The fluid motion at the rear of the vehicle changed, and the stern flap guided the fluid flow at the stern corner, alleviating the violent flow separation; at the same time, it changed the location of the generation of the stern vortex, which was reduced and flowed more smoothly.
The pressure distributions of the optimized surface bow and stern of the amphibious vehicle at a speed of 3 m/s are shown in Figure 14. Compared to the pressure distribution diagram of the original amphibious vehicle shown in Figure 8c, a high-pressure region still exists in the bow. This was the same as the case of the original amphibious vehicle at a speed of 3 m/s, which was caused by the high wave impact on the bow. However, the high-pressure area in the bow of the optimized vehicle was significantly decreased, indicating that the impact effect was mitigated at this time, and the positive pressure received by the front end of the vehicle was reduced. When fluid flowed along the body to the stern, a sudden change in the shape of the stern caused flow separation. Similar to the original amphibious vehicle wrap-around flow field, intense flow separation and large-scale vortices were generated, resulting in the formation of a significant low-pressure region at the bottom trailing edge. The negative-pressure region was primarily concentrated at the bottom corner, with a smaller longitudinal force along the amphibious vehicle, which minimally influenced the overall differential pressure resistance. Meanwhile, the positive pressure recovered more rapidly along the airfoil. Overall, the optimized amphibious vehicle reduced the positive pressure at the front end and recovered the pressure at the rear end faster, reducing the pressure difference between the front and rear of the amphibious vehicle.

4. Discussion

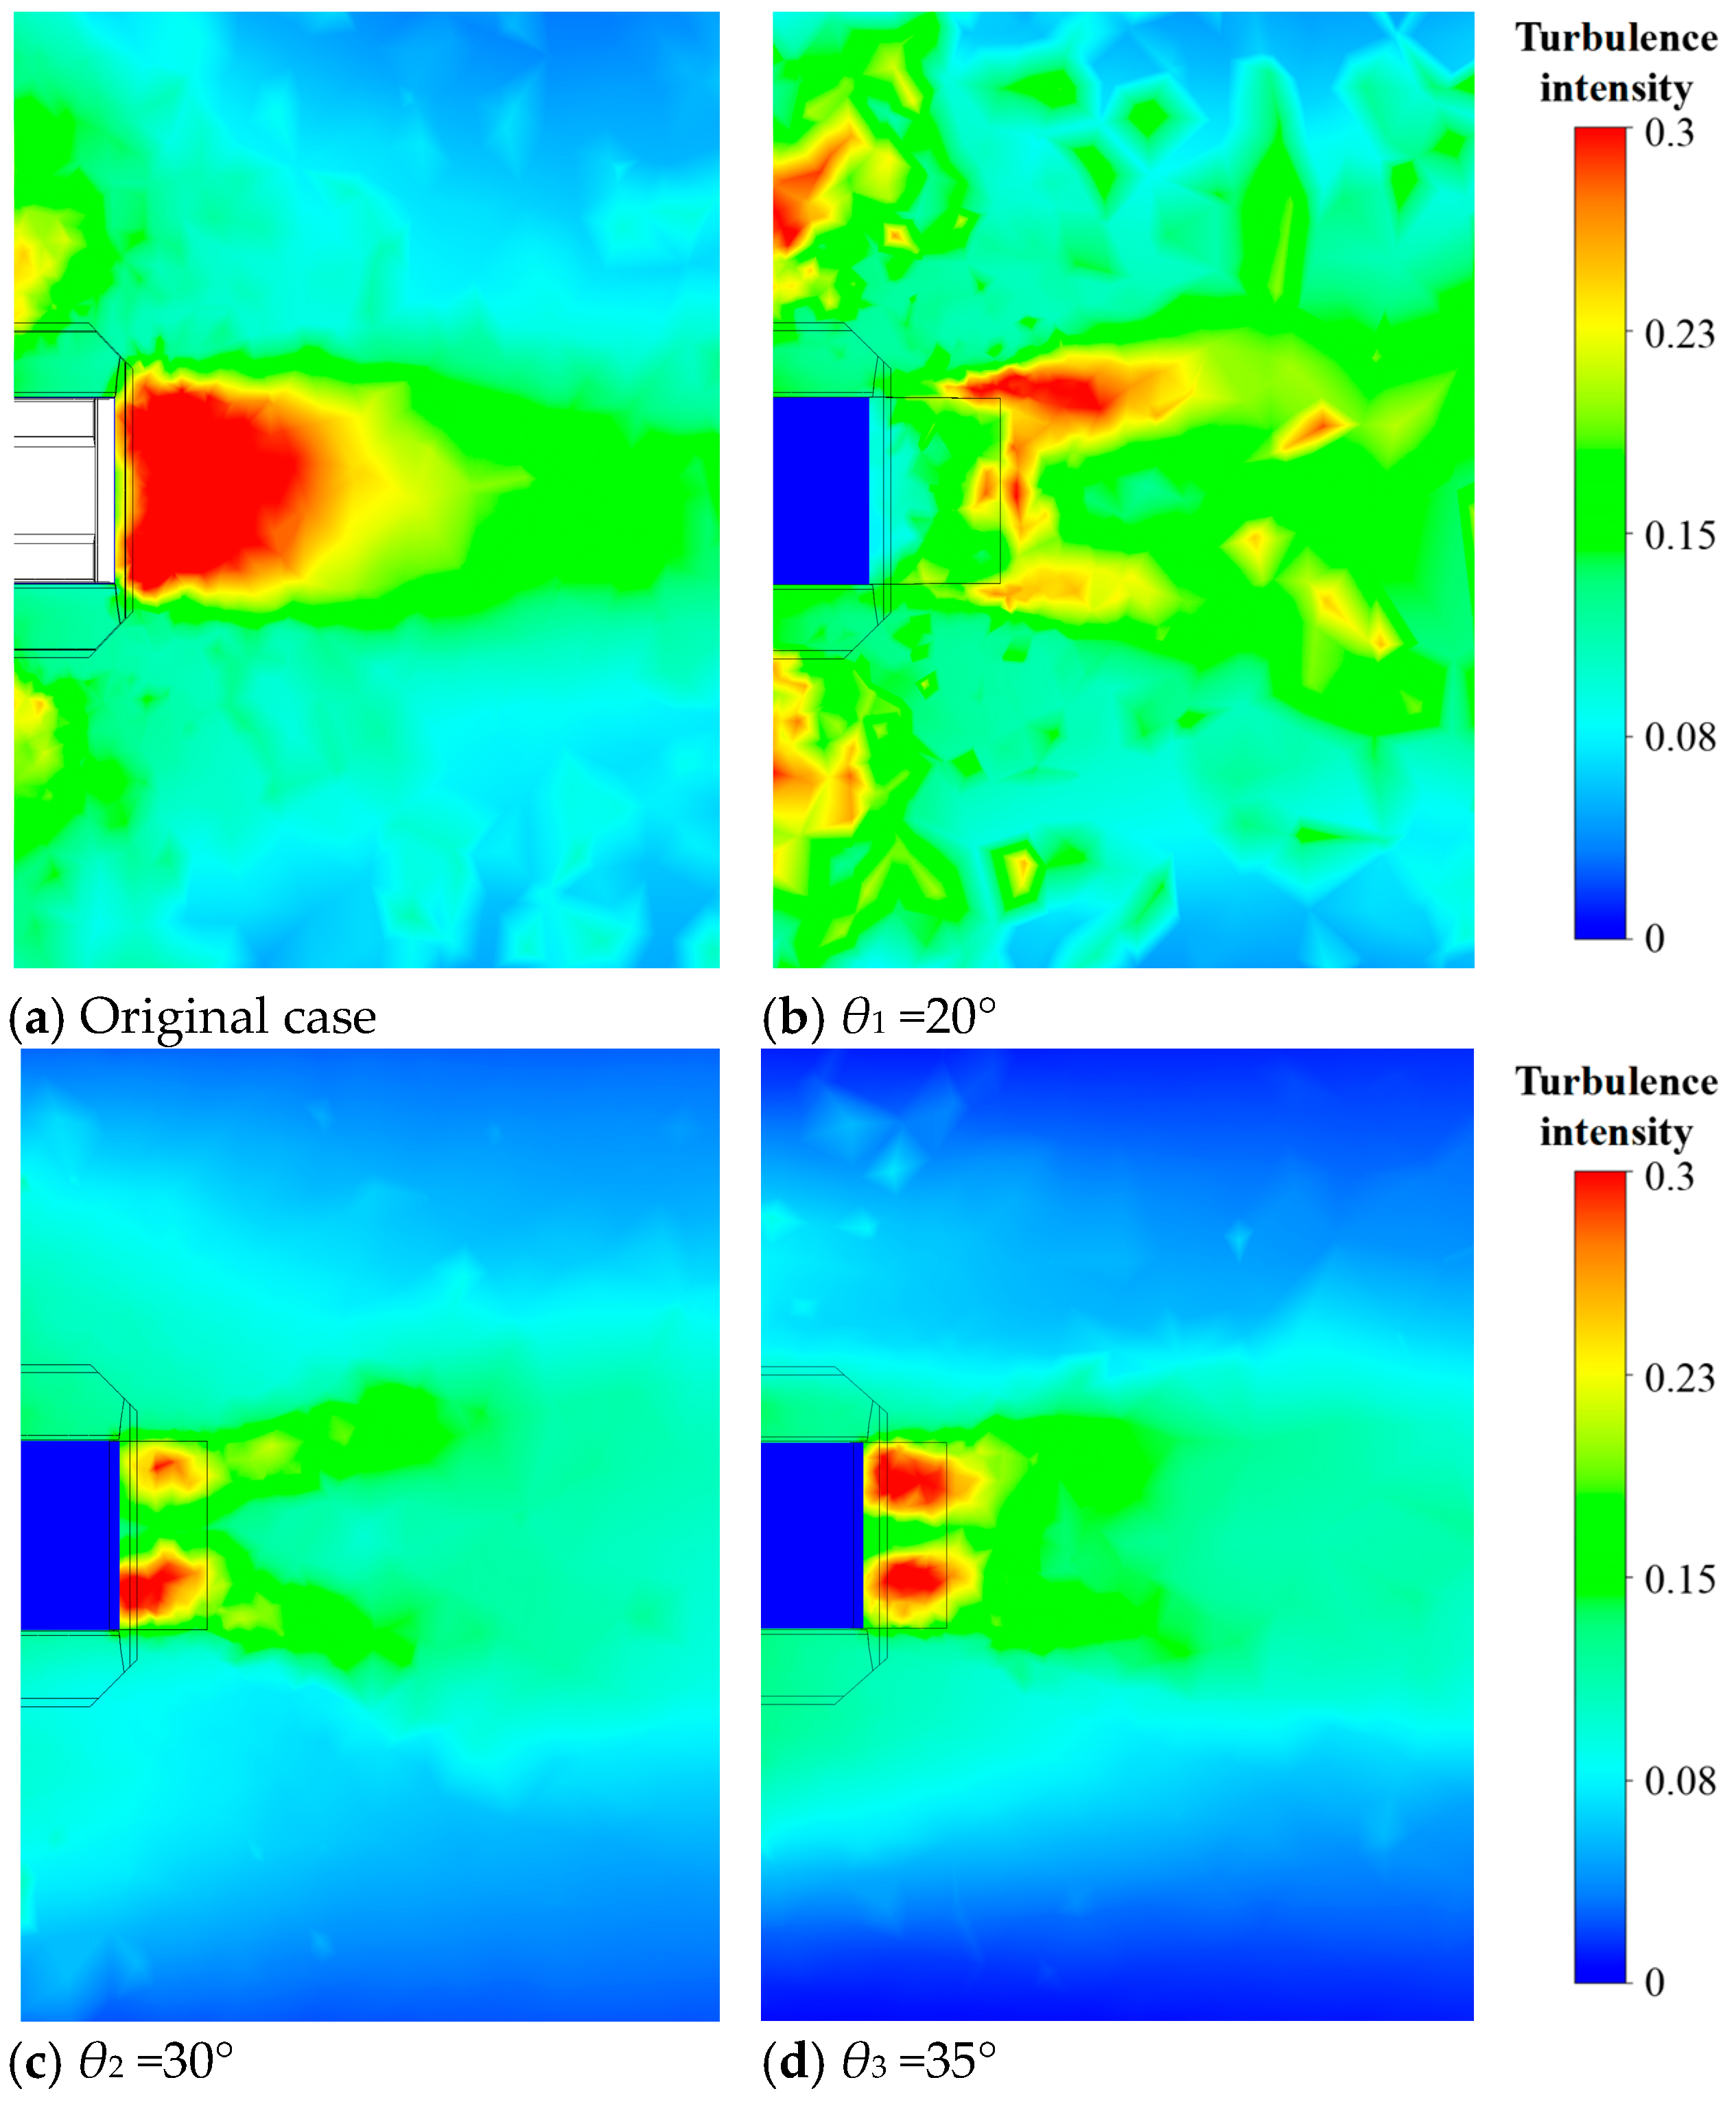
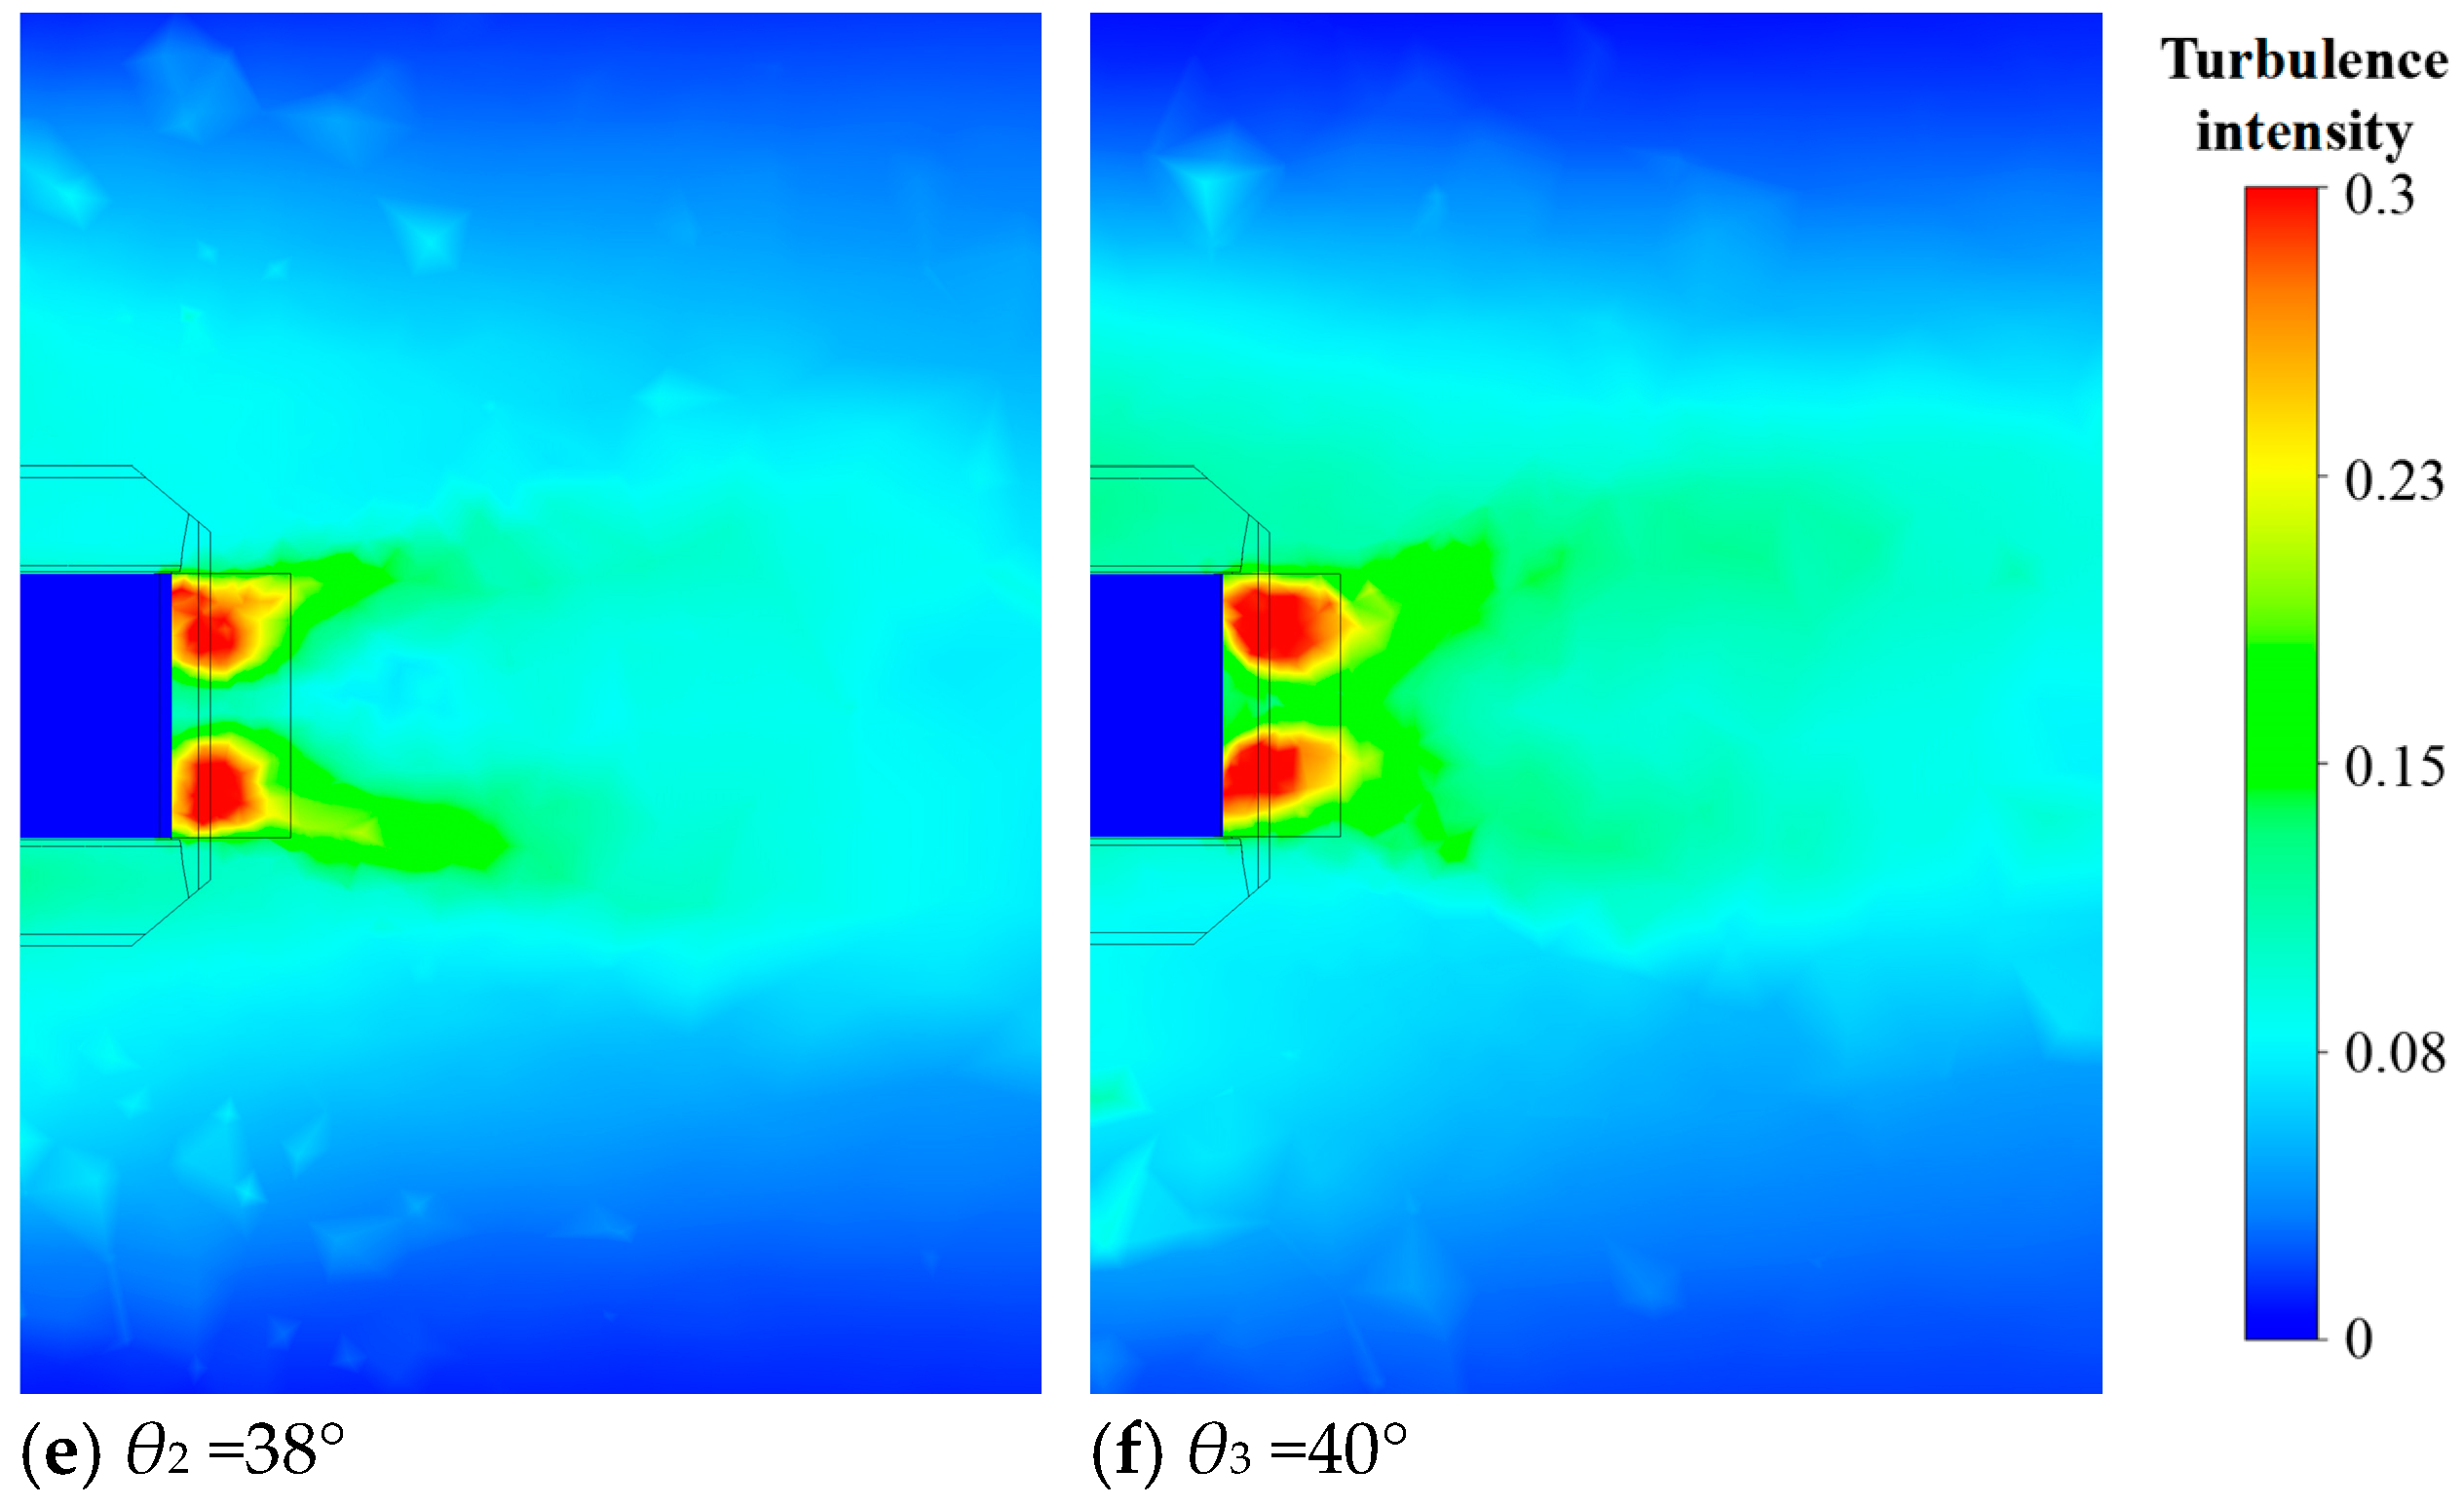
Based on the simulation results of the original model and models with different stern planes, it is evident that a stern flap at an appropriate angle helps to reduce navigational resistance, with significant improvements in both the high-pressure area at the bow and the low-pressure area at the stern. To further elucidate the mechanism of the stern flap, explanations are provided from the perspectives of flow field characteristics and energy dissipation. In turbulence, fluid layers interfere with each other, and fluid particles exhibit irregular, random motion, accompanied by energy loss and momentum loss, which directly leads to a decrease in the pressure at the stern. Figure 15 shows the turbulence intensity at the same horizontal cross-section under different conditions, with a distance of 0.2 m up from the bottom. It can be seen that under the original condition without a stern flap, there is a large area of high turbulence intensity at the stern, essentially covering the entire width of the stern. The source of this high turbulence is the abrupt change in the shape of the stern results in the flow separation and a wake stagnation zone. Inward fluid flow generates on both sides of the amphibious vehicle and upward deflected flow generates under the amphibious vehicle. The convergence of these flow parts and their interaction with the stagnation zone lead to intense turbulent motion, large-scale vortices and significant energy loss.
When a stern flap is installed, the large area of high turbulence is significantly reduced. At θ = 20°, there are two strip-shaped high-turbulence areas on both sides of the stern that slightly expand outward along the wake, with the decrease in the high-turbulence area in the middle of the stern. This indicates that there is still significant inward fluid flow, leading to flow separation and vortex structures on both sides of the stern. They diverge in a slender shape along the wake direction. However, the upward deflected flow from the bottom of the vehicle is well guided, reducing the high-turbulence area at the middle stern. At θ = 30~40°, there are also two strip-shaped high-turbulence areas expanding along the wake. When it is larger than 35, the high turbulence areas on both sides of the stern are inclined inward, meaning the turbulence influence on the inward flow is further reduced, and the high turbulence areas in the wake are reduced. Especially at θ = 38°, except for a small area near the stern and a short-strip expanding area of high turbulence, the turbulence intensity in most areas of the wake is less than 10%, indicating that the strong turbulence in the flow field has been well alleviated and the resistance can be restored faster.
Overall, after adding a stern flap, the turbulence intensity at the stern of the amphibious vehicle is reduced, and energy dissipation is decreased due to the good flow guidance of the stern flap, thereby reducing the navigational resistance of the amphibious vehicle. The optimal angle in this simulation is 38°. Under this condition, the high-turbulence region is mainly concentrated in both sides of the vehicle bottom and then rapidly decays. It can be inferred that the vortex scale caused by flow separation with the stern flap is smaller, and the interference on the wake is decreased.
Although the simultaneous use of wave boards and stern flaps can achieve excellent combined attachment effects, there are currently some studies that focus solely on flaps due to limitations in vehicle types and installation difficulties. Pan et al. [22] analyzed the resistance of a 0° flap installed at different heights at the stern of amphibious vehicles and the simulation results indicated that a stern flap can effectively reduce the resistance, with the optimal drag-reduction efficiency being 12.56%. Sun et al. [21] studied the resistance performance of a tracked amphibious vehicle and employed flaps at various angles (0–15°) and different lengths (116–176 mm). Their research pointed out that angles of 10° and 15° offered the best drag reduction at medium to high speeds but increased drag at low speeds. Therefore, the stern flap can be folded at low speeds and extended to an appropriate angle at medium to high speeds to reduce resistance. Different lengths of flaps also affect drag reduction, but the efficiency is greater than 20%, with a maximum resistance reduction of 34.31%. Actually, the commonly used flap angles are relatively small, and the drag-reduction effects vary significantly across different amphibious vehicle models. The flaps used in this work employed larger angles (20–35°) and lengths (greater than 500 mm) and under these optimized shapes still achieved a drag-reduction efficiency of over 15%, with an optimal of 30.3%, indicating that larger angles and lengths of flaps may also contribute to navigation drag reduction. Such stern flaps have a significant guiding effect on the flow field, reducing the areas of high turbulence intensity in the wake. In addition, as shown in Figure 15, the main function of the stern flap is to reduce the upward flow from the vehicle bottom, rather than the inward flow of both sides of the vehicle body. Therefore, it can be inferred that for amphibious vehicles of different sizes, more suitable stern flaps can be selected based on the actual draft or stern size to ensure the guidance of sufficient length of wake and the alleviation of areas with high-intensity turbulence.
In practical applications, the advantage of such large-angle, large-length flaps lies in their ease of manufacturing, installation, and more precise angle adjustment and flap operation. Amphibious vehicles are often used in military action and emergency rescue, where more urgent or severe application scenarios must be considered. Under these circumstances, these types of flaps can be more quickly changed by different shapes or adjusted to another angle, and even when damaged, they can be more easily replaced by items of similar shapes. Therefore, the design of such flap attachments can provide new ideas and reference value for drag reduction in similar amphibious vehicles. It should be noted that there are some limitations in this work. The simulation did not take into account the control performance and stability of the amphibious vehicle. At higher speeds and in more complex environments, the attitude of the amphibious vehicle could change significantly, affecting the composition of the navigational resistance and the drag-reduction effect of the stern flaps. Additionally, the simulation results of this paper require validation through experiments or actual measurements. In future work, the stability and operational performance of amphibious vehicles will be taken into account, and corresponding tests will also be conducted to verify the accuracy of the simulation.

5. Conclusions

Based on the k-ω model and the VOF method, the sailing resistance of an all-terrain all-water amphibious emergency rescue vehicle was simulated numerically. The results show that (1) with an increase in sailing speed, the differential pressure resistance and resistance coefficient exhibit nonlinear and large increasing trends. At a sailing speed of 3 m/s, the drag coefficient of amphibious vehicles is 0.098, which has a large optimization space. (2) With an increase in the sailing speed, the fluid in the stern of the amphibious vehicle causes a violent flow separation and large-scale vortex, and the fluid movement in the stern is more turbulent, which is the source of the differential pressure resistance of the amphibious vehicle. (3) The flow improvement and drag-reduction optimization of the amphibious vehicle are achieved by installing a stern flap. The stern flap can effectively guide the fluid in the stern. In particular, the high-intensity turbulence in the middle of the stern, which originates from the interaction between the bottom vehicle upward deflected flow and the recirculation zone caused by flow separation, is alleviated. Therefore, the navigational resistance of the amphibious vehicle is reduced. (4) The optimized drag-reduction rate is 30.3% when a stern flap angle of 38° is adopted, which achieves a good drag-reduction effect. (5) Compared to existing work, the angle and size of stern flaps in this work are larger, making it highly applicable in specific scenarios.

Author Contributions

Conceptualization, H.Z., Y.C. and C.J.; methodology, Y.C.; validation, Y.C., J.Y. and S.Z.; formal analysis, J.F. and Y.C.; investigation, J.F. and Y.C.; data curation, Y.C.; writing—original draft preparation, J.F., Y.C. and B.W.; writing—review and editing, Y.C. and B.W.; visualization, J.F.; supervision, Y.C.; funding acquisition, H.Z. and Y.C. All authors have read and agreed to the published version of the manuscript.

Funding

This research was funded by the National Natural Science Foundation of China (52308514) and the Sichuan Science and Technology Program (2023YFS0427).

Data Availability Statement

The data will be available on request.

Conflicts of Interest

Author Jian Ye and Shanhu Zhang were employed by Fire and Rescue Department of Sichuang Province. Author Changwei Jin was employed by the company Beijing Topsky Intelligent Equipment Group Co., Ltd. The remaining authors declare that the research was conducted in the absence of any commercial or financial relationships that could be construed as a potential conflict of interest.

References

  1. Pan, D.; Xu, X.; Liu, B.; Xu, H.; Wang, X. A review on drag reduction technology: Focusing on amphibious vehicles. Ocean Eng. 2023, 280, 114618. [Google Scholar] [CrossRef]
  2. Jang, J.Y.; Liu, T.L.; Pan, K.C.; Chu, T.-W. Numerical investigation on the hydrodynamic performance of amphibious wheeled armored vehicles. J. Chin. Inst. Eng. 2019, 42, 700–711. [Google Scholar] [CrossRef]
  3. Abdulov, S.; Trusevich, I.; Volkov, A. Ensuring the amphibious capabilities of the amphibious vehicle based on the hydrodynamic buoyancy principle. MATEC Web Conf. 2018, 224, 02030. [Google Scholar] [CrossRef]
  4. Behara, S.; Arnold, A.; Martin, J.E.; Harwood, C.M.; Carrica, P.M. Experimental and computational study of operation of an amphibious craft in calm water. Ocean Eng. 2020, 209, 107460. [Google Scholar] [CrossRef]
  5. Du, Z.; Mu, X.; Zhu, H.; Han, M. Identification of critical parameters influencing resistance performance of amphibious vehicles based on a SM-SA method. Ocean Eng. 2022, 258, 111770. [Google Scholar] [CrossRef]
  6. Nakisa, M.; Maimun, A.; Ahmed, Y.M.; Behrouzi, F.; Steen, S.; Tarmizi, A. Hydrodynamic resistance analysis of new hull design for multipurpose amphibious vehicle applying with finite volume method. J. Teknol. 2015, 74. [Google Scholar] [CrossRef]
  7. Yan, Z.; Li, M.; Du, Z.; Yang, X.; Luo, Y.; Chen, X.; Han, B. Study on a tracked amphibious robot bionic fairing for drag reduction. Ocean Eng. 2023, 267, 113223. [Google Scholar] [CrossRef]
  8. Liu, B.; Xu, X.; Pan, D. Drag reduction configuration analysis of the grooves on amphibious vehicles walking mechanism. Proc. Inst. Mech. Eng. Part C J. Mech. Eng. Sci. 2022, 236, 5994. [Google Scholar] [CrossRef]
  9. Helvacioglu, S.; Helvacioglu, I.H.; Tuncer, B. Improving the river crossing capability of an amphibious vehicle. Ocean Eng. 2011, 38, 2201–2207. [Google Scholar] [CrossRef]
  10. Latorre, J.; Arana, J. Reduction of amphibious vehicle resistance and bow swamping by fitting a wave cancellation bow plate. Naval Eng. J. 2011, 123, 81. [Google Scholar] [CrossRef]
  11. Seo, J.; Jeong, H.-S.; Rhee, S.H.; Chang, K. Towing tank model tests for propulsive performance analysis of a waterjet-propelled amphibious vehicle. J. Ship Res. 2022, 66, 91–107. [Google Scholar] [CrossRef]
  12. Pan, D.; Xu, X.; Liu, B. Influence of flanks on resistance performance of high-speed amphibious vehicle. J. Mar. Sci. Eng. 2021, 9, 1260. [Google Scholar] [CrossRef]
  13. Lee, S.-J.; Lee, T.-I.; Lee, J.-J.; Nam, W.; Suh, J.-C. Hydrodynamic characteristics of a hydrofoil-assisted amphibious vehicle. J. Ship Res. 2017, 61, 15. [Google Scholar] [CrossRef]
  14. Pena, B.; Huang, L. A review on the turbulence modelling strategy for ship hydrodynamic simulations. Ocean Eng. 2021, 241, 110082. [Google Scholar] [CrossRef]
  15. Guo, J.; Zhang, Y.; Chen, Z.; Feng, Y. CFD-based multi-objective optimization of a waterjet-propelled trimaran. Ocean Eng. 2020, 195, 106755. [Google Scholar] [CrossRef]
  16. Bakica, A.; Gatin, I.; Vukcevic, V.; Jasak, H.; Vladimir, N. Accurate assessment of ship-propulsion characteristics using CFD. Ocean Eng. 2019, 175, 149–162. [Google Scholar] [CrossRef]
  17. More, R.R.; Adhav, P.; Senthilkumar, K.; Trikande, M. Stability and drag analysis of wheeled amphibious vehicle using CFD and model testing techniques. Appl. Mech. Mater. 2014, 592–594, 1210–1219. [Google Scholar] [CrossRef]
  18. Kim, D.; Tezdogan, T. CFD-based hydrodynamic analyses of ship course keeping control and turning performance in irregular waves. Ocean Eng. 2022, 248, 110808. [Google Scholar] [CrossRef]
  19. Villa, D.; Brizzolara, S. A systematic analysis of flap/interceptors hydrodynamic performance. In Proceedings of the International Conference on Fast Sea Transportation FAST2009, Athens, Greece, 5–8 October 2009. [Google Scholar]
  20. Liu, B.; Pan, D.; Xu, X. Research on the resistance and maneuvering characteristics of an amphibious transport vehicle and the influence of stern hydrofoil. Ocean Eng. 2024, 293, 116592. [Google Scholar] [CrossRef]
  21. Sun, C.L.; Xu, X.J.; Wang, W.H.; Xu, H. Influence on stern flaps in resistance performance of a cerpillar track amphibious vehicle. IEEE Access 2020, 28, 1453–1456. [Google Scholar]
  22. Pan, D.; Xu, X.; Liu, B. Numerical analysis on hydrodynamic performance and hydrofoil optimization for amphibious vehicles. Phys. Fluids 2023, 35, 083330. [Google Scholar] [CrossRef]
  23. Xu, X.; Liu, B.; Pan, D.; Xu, H. Influence of towing position on hydrodynamic characteristics of an Amphibious Tractor. Ocean Eng. 2023, 272, 113932. [Google Scholar] [CrossRef]
Figure 1. Design drawing of the new amphibious vehicle.
Symmetry 17 00193 g001
Figure 2. Simplified simulation model of amphibious vehicle.
Symmetry 17 00193 g002
Figure 3. Simulation calculation domain and boundary conditions.
Symmetry 17 00193 g003
Figure 4. Grid division of computational domain.
Symmetry 17 00193 g004
Figure 5. Schematic diagram of calculation with the VOF method.
Symmetry 17 00193 g005
Figure 6. Resistance characteristics of the original amphibious vehicle model at different speeds.
Symmetry 17 00193 g006
Figure 7. Water–air two-phase diagram for amphibious vehicles at v, calm water.
Symmetry 17 00193 g007aSymmetry 17 00193 g007b
Figure 8. Map of the surface pressure distribution of amphibious vehicles at different speeds ((left): front; (right): rear).
Symmetry 17 00193 g008aSymmetry 17 00193 g008b
Figure 9. Longitudinal profile streamline diagram of amphibious vehicle at a speed of 3 m/s.
Symmetry 17 00193 g009
Figure 10. Simplified model of the optimized amphibious vehicle.
Symmetry 17 00193 g010
Figure 11. Resistance characteristics of primitive amphibious vehicles at different speeds.
Symmetry 17 00193 g011
Figure 12. Water–air two-phase diagram of optimized amphibious vehicle at a speed of 3 m/s.
Symmetry 17 00193 g012aSymmetry 17 00193 g012b
Figure 13. Longitudinal profile streamline of optimized amphibious vehicle; v = 3 m/s, θ3 = 38°.
Symmetry 17 00193 g013
Figure 14. Surface pressure distribution of optimized amphibious vehicles; v = 3 m/s, θ3 = 38° ((left) front; (right) rear).
Symmetry 17 00193 g014
Figure 15. Turbulence intensity at the same horizontal cross-section (0.2 m up from the bottom).
Symmetry 17 00193 g015aSymmetry 17 00193 g015b
Table 1. Numerical simulation results for total resistance of amphibious vehicles at different time steps.
Time step Δt0.010.050.1
Resistance (N) (N)963.3971.6982.2
Deviation (%)00.861.96
Table 2. Simulation results of resistance coefficient before and after optimization of the amphibious vehicle at a speed of 3 m/s.
CaseResistance (N)Drag CoefficientReduction Rate (%)
original (document, etc.)963.30.098--
θ1 = 20°815.20.08315.4%
θ2 = 30°771.40.07920.2%
θ3 = 35°707.70.07226.5%
θ4 = 38°671.70.06930.3%
θ5 = 40°682.40.07029.2%
Disclaimer/Publisher’s Note: The statements, opinions and data contained in all publications are solely those of the individual author(s) and contributor(s) and not of MDPI and/or the editor(s). MDPI and/or the editor(s) disclaim responsibility for any injury to people or property resulting from any ideas, methods, instructions or products referred to in the content.