Abstract
With the increasing number of satellites and rising user demands, the volume of satellite data transmissions is growing significantly. Existing scheduling systems suffer from unequal resource allocation and low transmission efficiency. Therefore, effectively addressing the large-scale multi-objective satellite data transmission scheduling problem (SDTSP) within a limited timeframe is crucial. Typically, swarm intelligence algorithms are used to address the SDTSP. While these methods perform well in simple task scenarios, they tend to become stuck in local optima when dealing with complex situations, failing to meet mission requirements. In this context, we propose an improved method based on the minimum angle particle swarm optimization (MAPSO) algorithm. The MAPSO algorithm is encoded as a discrete optimizer to solve discrete scheduling problems. The calculation equation of the sine function is improved according to the problem’s characteristics to deal with complex multi-objective problems. This algorithm employs a minimum angle strategy to select local and global optimal particles, enhancing solution efficiency and avoiding local optima. Additionally, the objective space and solution space exhibit symmetry, where the search within the solution space continuously improves the distribution of fitness values in the objective space. The evaluation of the objective space can guide the search within the solution space. This method can solve multi-objective SDTSPs, meeting the demands of complex scenarios, which our method significantly improves compared to the seven algorithms. Experimental results demonstrate that this algorithm effectively improves the allocation efficiency of satellite and ground station resources and shortens the transmission time of satellite data transmission tasks.
1. Introduction
The rapid development of the space industry has led to a significant increase in the number of satellites in orbit. However, ground station resources remain relatively fixed, resulting in brief communication windows and substantial data transmission demands, posing a global challenge. By the end of 2022, Europe had more than 50 imaging satellites. All types of satellites, including remote sensing, communication, and navigation satellites, rely on stable data transmission to maintain contact with their ground stations, which is essential for their functionality and value. The efficiency of data transmission between satellites and ground stations is a critical factor in the performance of satellite communication systems. Therefore, efficiently scheduling multi-objective satellite data transmission scheduling problems (SDTSPs) has become increasingly urgent [1].
Data transmission scheduling is an NP-hard problem [2]. Also, adding more ground stations cannot address the rapidly growing number of satellites. Research on the conflict between limited ground station resources and the growing number of satellites has been ongoing for over a decade. In the 1990s, Gooley [3] used a mixed-integer programming model to address the scheduling problem of the satellite control network (AFSCN) in the United States. Later, Barbulescu [4] employed heuristic algorithms for the same issue and summarized the evolution of the AFSCN problem. Since then, many scholars have applied various evolutionary algorithms to address these problems [5,6]. For complex SDTSPs, swarm intelligence algorithms have become a primary solution method [7,8,9]. In recent years, new technologies have emerged [10] to solve satellite data transmission issues.
Although early studies have achieved some success in exploring SDTSP, they have not fully considered the cyclical nature of resource competition, the unique aspects of large-scale data transmission missions (SDTT), and the multi-dimensional optimization objectives. For instance, Earth observation satellites operate in fixed orbits, and ground stations have relatively fixed antenna receiving areas. When satellites enter these areas, they periodically compete with ground stations for data transmission, especially during large-scale transmissions. Traditional heuristic algorithms, such as simulated annealing or genetic algorithms, often fail to handle large-scale data transmission problems due to their complexity and time-consuming global search processes. Furthermore, current scheduling algorithms frequently fall into the trap of locally optimal solutions, failing to use the available time window resources fully.
To tackle these challenges effectively, employing suitable algorithms for managing large-scale multi-objective SDTSPs [11] is essential. Multi-objective evolutionary algorithms (MOEAs) have been widely used due to their excellent performance in practical problems [12,13]. The core of these algorithms lies in decision-making methods, typically categorized into Pareto dominance-based [14], index-based [15], and decomposition-based approaches [16]. However, for large-scale multi-objective optimization problems like SDTSP, traditional MOEAs often perform poorly, and research on large-scale multi-objective optimization algorithms remains limited.
Based on the Pareto dominance method, this paper develops a multi-objective SDTSP model to maximize transmission efficiency while minimizing latency. In addition, we enhance the minimum angle selection strategy of the particle swarm optimization (PSO) algorithm. This improvement effectively identifies global and local optimal particles, mitigating the risk of local optima and enhancing the efficiency of solving the SDTSP. To assess the effectiveness of this method, we conducted simulation experiments on tasks of different sizes. The findings show that the proposed method displays robust generalization capabilities and substantially enhances the efficiency of satellite data transmission tasks.
The contributions of this manuscript are as follows:
- The SDTSP was modeled as an optimization problem with two objectives: minimizing the satellite transmission time and maximizing task gain simultaneously;
- We proposed a modified MAPSO algorithm to solve the multi-objective SDTS problem. The proposed algorithm was encoded as a discrete optimizer, and the strategies were modified to enhance its searchability.
Here is the organization of this paper: Section 2 introduces the satellite data transmission problem and establishes its mathematical model. Section 3 describes our MAPSO based on the problem’s key characteristics. Section 4 details the experimental design and evaluates the findings. Finally, Section 5 offers conclusions and suggestions for further research.
2. Problem Description
First, the data transmission problem in satellite communication can be considered a combinatorial optimization challenge. Second, the process includes assigning transmission resources from the ground station when each satellite is in view. This problem can be broken down into three key decision stages:
- Ensuring that the allocation order meets all constraints;
- Determining the order of time window allocation for each satellite;
- Minimizing the satellite transmission time and maximizing task gain.
2.1. Symbol Definition
The relevant symbols are described below:
represent the set of data transmission tasks where represents the collection of satellites where represents the set of ground stations where represents a collection of antennas, a set of antennas. The antennas at the ground station are with Each antenna is associated with a frequency band . For each task , the task symbols’ definitions are given in Table 1.

Table 1.
Symbol of task.
represent the set of visibility time windows between ground stations and satellites, where Definitions of visibility time window symbols are given in Table 2.

Table 2.
Symbol of visibility time window.
Since PSO is typically used for solving continuous problems, and this scheduling problem is discrete, we use a binary encoding method to represent each satellite’s selection state. Among them, we use binary encoding to represent the selection status of each satellite. Specifically, the selected satellites are denoted by 1, and the unselected satellites are denoted by 0. Based on this condition, the decision variables for the data transmission tasks are established. This decision variable ensures the data transmission between the satellite and the ground station matches.
indicates that satellite transmits data to ground station during the time window. indicates that satellite does not transmit data to ground station during the time window. indicates that ground station receives data from satellite while indicates that ground station does not receive data from the satellite.
2.2. Assumptions
In order to develop analyses and research quickly, we make the following assumptions:
- (1)
- Visibility of Satellites and Ground Stations: Each satellite will maintain visibility with at least one ground station during its orbital period, ensuring that data transmission can be completed within the planned time window.
- (2)
- Uninterrupted Data Transmission: Communication between satellites and ground stations is assumed to be free from interference or blockages, ensuring the stability and continuity of data transmission.
- (3)
- Stable Power Supply: All satellites and ground stations are assumed to have a stable power supply. Specifically, satellites are considered to have sufficient power from batteries and solar panels to support long-duration continuous transmission tasks.
- (4)
- Independence of Tasks: Each data transmission task is independent, with no dependencies between tasks.
- (5)
- Constant Transmission Rate: The data transmission rate between satellites and ground stations is assumed to be constant, unaffected by environmental changes or equipment performance fluctuations, ensuring the predictability of task planning and execution.
2.3. Constraints
The following constraints are established based on the symbols and assumptions:
Constraint (1) guarantees that each task is scheduled within its designated transmission window:
Constraint (2) ensures that each task is scheduled within the visibility time windows between ground stations and satellites:
Constraint (3) indicates that there should be a correspondence in the frequency bands between the satellite and ground station antenna:
Constraint (4) indicates that a single ground station antenna cannot handle multiple tasks concurrently:
Constraint (5) guarantees that each available task is allocated to no more than one ground station antenna:
Constraint (6) ensures that each task’s allocated transmission time slot meets the minimum transmission duration criteria:
Constraint (7) specifies that each task is scheduled at most once:
Constraint (8) guarantees that the interval between two tasks should be sufficient to accommodate the antenna transition time. is a constant:
Constraints (9) and (10) define the scope of values for the choice variables:
2.4. Optimization Objectives
Two objectives equations are based on the characteristics of the data transmission tasks. The objective function encompasses two objectives, and :
- Maximize task gain: The task gain is meant to maximize the product of ground station and satellite priorities, determined by the following Equation (11):
- Minimize transmission time: Reduce the total time needed to accomplish the data transmission tasks, as calculated by the following Equation (12):
The comprehensive objective function, denoted as , is formulated as shown in Equation (13):
The proposed model effectively simplifies the complexities of large-scale satellite data transmission scheduling constraints to ensure that the scheduling of satellite data transmissions is efficient.
3. Methodology
3.1. Minimum Angle Particle Swarm Optimization
In multi-objective evolutionary algorithms, the MAPSO algorithm was first proposed by Gong [17] in 2005 as one of the pioneering angle-based evolutionary algorithms. In 2021, Yang [18] improved upon this algorithm by using vector-based angles to select elite particles, addressing the rapid convergence issue of PSO algorithms and finding wide applications in various fields [19,20].
To address the high complexity and large scale of data transmission tasks, we employ and improve the MAPSO algorithm [18] to balance convergence and diversity in the external archive set. By utilizing the minimum angle strategy to select global guides, the algorithm effectively avoids local optima, thereby improving solution quality, reducing solution time, and enhancing the efficiency of satellite data transmission tasks.
3.2. General Framework
The flowchart of the MAPSO algorithm is illustrated in Figure 1. Initially, parameters such as the number of ground stations, satellites, and the population size are input. A set of uniformly distributed weight vectors [21] is then generated. The population is initialized by generating a group of randomly distributed particles in space with initial velocities (where ). An initial archive is established to store the non-dominated solutions of population , which is updated based on the clone strategy.
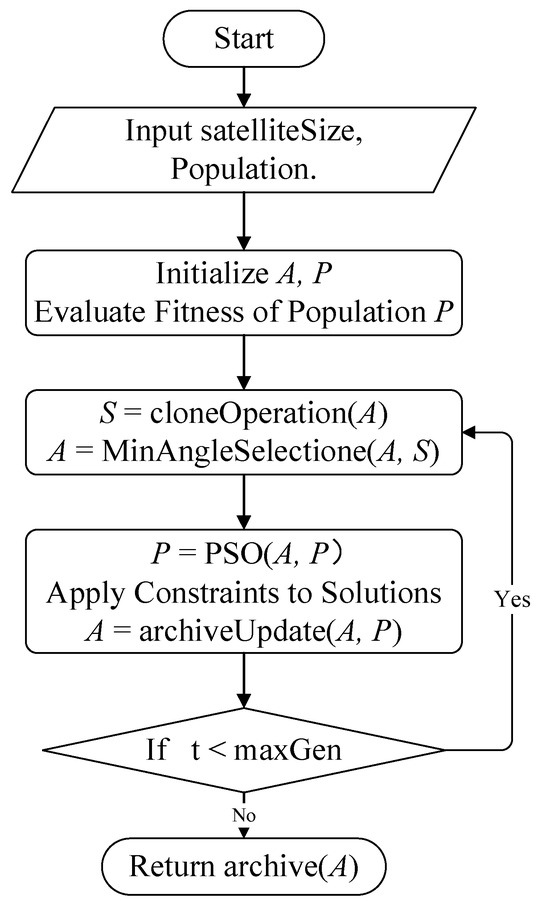
Figure 1.
Illustration of the MAPSO process for solving data transmission tasks.
After completing the population initialization, we employ the archive update strategy to update the external archive. At the start of each iteration, the contents of archive are copied to prevent the loss of solution sets. The PSO search strategy selects leaders from the archive to update the population. After updating the population, the archive update strategy is employed again to update the sets and . The procedure is repeated until the end condition is met. The algorithm comprises three key components: the clone, the PSO search process, and the archive update operation. The upcoming sections will offer a detailed introduction to these three components.
3.3. Clone
As shown in Algorithm 1, the clone steps aim to enhance the diversity and convergence of the external archive , thereby accelerating the PSO convergence speed, particularly for the parameter-independent MAPSO algorithm. The process involves the following steps: initialization, SDE distance calculation, selection and duplication, and generation of offspring population. The clone process is illustrated in Figure 2. Below are the detailed descriptions.
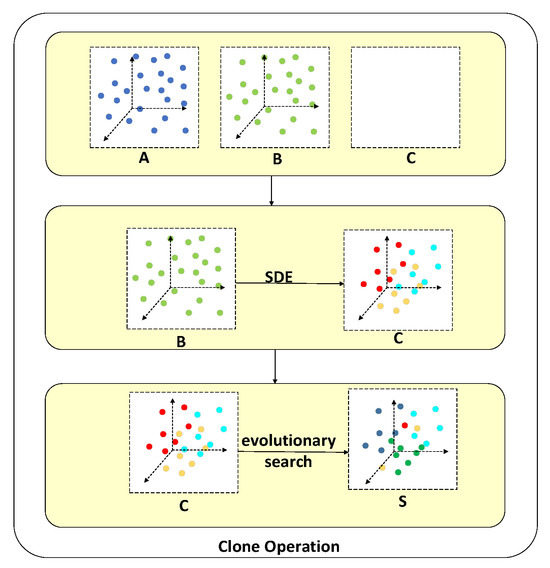
Figure 2.
Illustration of a clone.
Initialization: First, copy the external archive to a temporary archive and initialize a temporary archive as empty. Make sure that Archive remains intact in the following steps.
Shift-based density estimation (SDE) distance calculation: SDE is an improved density estimation strategy designed to address the challenges faced by Pareto-based evolutionary multi-objective optimization algorithms when handling multi-objective optimization problems. Traditional density estimation methods only reflect the distribution of individuals in the population, while SDE considers individuals’ distribution and convergence information. Calculate the SDE distance for each solution in The SDE distance measures the diversity of the solutions. Refer to the relevant literature for specific calculation steps and equations [22].
| Algorithm 1 Clone Process |
| Input: |
| Output: |
|
Selection and duplication: Next, select solutions from the temporary archive for duplication. The number of duplications for each solution is calculated using the following (14):
where presents the SDE distance of the solution , and is the total number of solutions to be duplicated. This step ensures that solutions with more considerable SDE distances obtain more duplication opportunities, thereby enhancing the diversity and convergence of the population.
Generation of offspring population: Each solution is duplicated times and added to the temporary archive , forming a new offspring population . This population then undergoes evolutionary search, applying operations such as crossover and mutation, resulting in a new offspring population . The clone selects superior solutions based on SDE distance, ensuring that the external archive maintains good diversity and convergence, effectively guiding the evolution of population in PSO and avoiding a local optimum. The evolutionary search strategy in MAPSO is implemented in the same manner as in NSGA-II [23].
The clone guarantees the population’s diversity and convergence and accelerates MAPSO convergence speed. Through these steps, the external archive exhibits excellent diversity and convergence, promoting the practical evolution of the MAPSO population , making the algorithm more efficient in handling multi-objective optimization problems.
3.4. Archive Update
The archive update step in Algorithm 2 determines which solutions will be added to archive . The performance of multi-objective algorithms is closely tied to selecting the external archive set. Therefore, choosing solutions that exhibit good convergence and diversity is crucial. The clone process is illustrated in Figure 3. Below are the detailed descriptions.
| Algorithm 2 Archive Update Process |
|
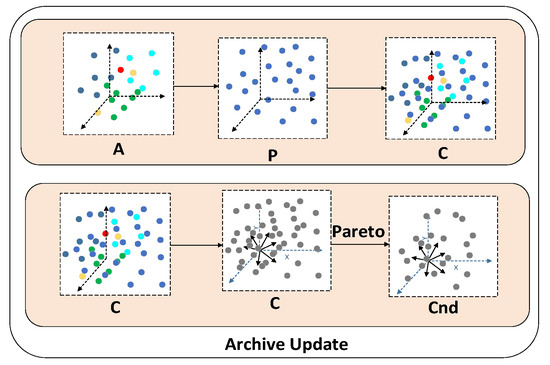
Figure 3.
Illustration of archive update.
The archive update operation updates the external archive A through the following steps:
- Merge archives: Combine archive with population , creating a joint population that includes both and .
- Normalization: Normalize each solution in the joint population , standardizing the objective values to a range between 0 and 1.
- Calculation fitness: Calculate the fitness value for each solution in using Equation (15):
- Non-dominated sorting: Pareto dominance filters out non-dominated solutions from C, forming the non-dominated solution set Cnd.
- If the number of solutions in Cnd exceeds the population size , use the minimum angle selection strategy to select solutions added to ;
- If the number of solutions in Cnd is less than or equal to N, directly add all solutions in Cnd to . Return updated archive: return the updated archive .
The is the fitness value of the solution in the joint population .
Fitness value serves as a standard for evaluating the convergence of the solutions. Subsequently, the non-dominated solution set is selected from -based Pareto dominance criteria.
Because in MAPSO, most solutions are non-dominated, the minimum angle selection strategy is adopted when the Pareto dominance criterion is no longer adequate. The steps of the minimum angle selection strategy, as detailed in Algorithm 3, can be divided into three main parts:
- Eliminate dominance-resistant solutions (DRS):
- First, remove DRS from the non-dominated solutions, Cnd. These solutions are highly inferior in at least one objective and difficult to dominate;
- Calculate the minimum vector angle for each solution in , representing the smallest angle between the solution and other solutions;
- Add m extreme solutions to archive . Extreme solutions are those in that have the smallest angle with the reference vectors (1, 0, …, 0), (0, 1, …, 0), …, (0, 0, …, 1).
- Remove minimum vector angle of solutions:
- Remove solutions with the smallest vector angles from Cnd until the number of solutions in reaches N-m;
- During the removal process, select solutions with lower fitness values, meaning those with fitness values lower than other solutions;
- Removed solutions are added to the removed solution set .
The angle calculation method directly affects particle distribution and search space exploration. This study uses the following (16) equation for calculating the angle between particles:
instead of (17):
The benefits of using Equation (16) (based on arcsin) are as follows:
- (1)
- Intuitive geometric interpretation and visualization: The range of arcsinX is closer to actual movement angles, making it easier to interpret and visualize particle movement paths. Due to its smaller range, arcsinX can better describe angle changes in physical systems, preventing significant angle jumps and facilitating fine-tuning.
Assume a satellite is orbiting along a circular path around the Earth. The angle between the satellite and a point on the Earth’s surface can be represented as θ = arcsin(d/h), where is the distance along the Earth’s surface from the point directly beneath the satellite to the point of interest, and is the altitude of the satellite.
| Algorithm 3 Minimum Angle Selection Process |
We compare it to a linear approximation of the actual movement angles to show that arcsinX provides a closer approximation. The linear approximation can be written as , which is only accurate for tiny angles ().
When we expand with the Taylor series, we can use the general form of the Taylor series using Equation (18).
For , we consider as Thus, the expansion becomes .
This expansion shows that for small values of , the linear approximation is reasonable. However, as increases, higher-order terms become significant, making the approximation of more accurate.
Figure 4 illustrates a comparison between the calculated actual movement angles using the function and a straightforward linear approximation. The plot demonstrates that the arcsin function (blue curve) closely follows the accurate movement angles, especially for larger values of d, illustrating its superior accuracy. In contrast, the linear approximation (red dashed line) deviates more as d increases, highlighting the effectiveness of the arcsin approach in accurately representing movement angles.
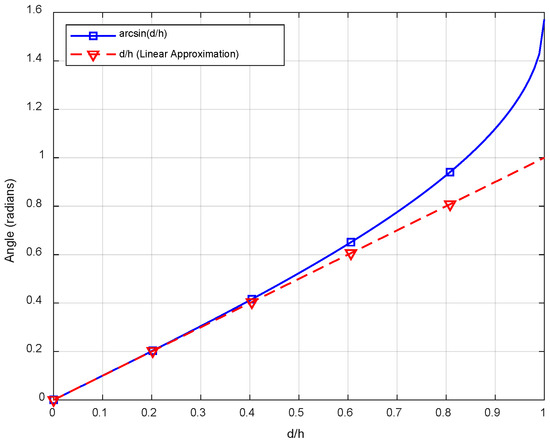
Figure 4.
Actual and approximate angles of movement in a simple linear approximation.
- (2)
- Numerical stability: varies more smoothly within its range, and its derivative does not tend to infinity, resulting in more stable numerical computations. In contrast, has larger derivative changes near boundary values, which can cause numerical instability.
- (3)
- Fine-grained search: For multi-objective optimization problems in satellite data transmission, optimizing transmission paths and resource allocation requires high precision and fine adjustments. offers finer search granularity, ensuring better solutions even under complex constraints. The smooth and gradual changes of lead to more uniform particle distribution and stable computations.
In summary, Equation (16) based on is more suitable for PSO algorithms dealing with complex multi-objective optimization problems, such as satellite data transmission systems, due to its intuitive geometric interpretation, numerical stability, and fine-grained search capability.
- 3.
- Add Solutions with Maximum Vector Angles:
The process of the minimum angle selection operation is illustrated in Figure 5. The triangular point (▲) represents solutions in R, while solid (•) belongs to . R represents the set of solutions that were removed in step (2). well-distributed solution is removed, indicating that some well-distributed solutions might be eliminated. MAPSO allows solutions removed from R to be re-added to if the number of solutions in is less than N−m. Find the solution in with the maximum vector angle relative to solutions in using the following (19):
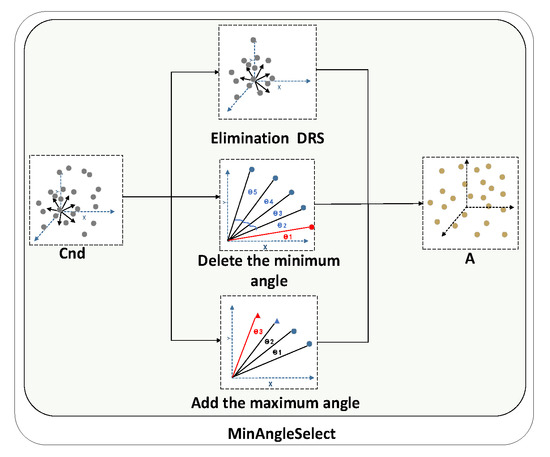
Figure 5.
The minimum angle selection diagram.
Add this solution to and remove it from . Repeat this process until the number of solutions in reaches . Merge and , removing solutions already in to form the new combined population . Return the updated archive .
3.5. PSO Search
The procedure for PSO is detailed in Algorithm 4. The PSO method is employed to update the population . Before updating the solutions’ position information, it is crucial to determine pbest and gbest. In multi-objective optimization problems, solutions cannot be directly compared using a single objective value; however, Pareto dominance can be utilized. In contrast, for many-objective optimization problems, most solutions are non-dominated, which complicates the selection of suitable solutions (pbest and gbest) for updating the population. Therefore, pbest and gbest are chosen based on the particle angle size. Similar to conventional PSO, this process includes selecting pbest and gbest and updating the velocity and position (lines 2–3 of Algorithm 4). The specific steps are as follows:
| Algorithm 4 PSO Algorithm |
|
Choosing pbest and gbest: penalty factor balances population diversity and convergence when choosing pbest and gbest. higher encourages diversity, while a lower favors convergence. The equation for calculating is given in Equation (20):
represents a scaling parameter, and denotes the vector angle between and , with N as the population size. This vector angle is normalized to range between 0° and 90°.
Figure 6 illustrates the selection of . The red lines represent the reference vectors and . smaller vector angle between and indicates that has good diversity. By using the equation above to calculate , a particle with a smaller angle can be chosen as pbest1 to guide rather than another particle with better diversity but worse convergence. Similarly, should be selected as gbest2 for its diversity rather than , which might have better convergence. For MAOP, there is no single optimal solution, so a solution close to from A is selected as to improve diversity. In Figure 6, and will be chosen as gbest1 and gbest2, respectively. Sometimes, and are equal, indicating that the solution can provide diversity and convergence directions.
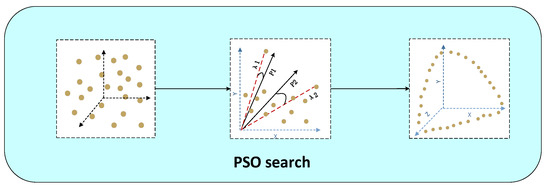
Figure 6.
The PSO search illustration.
Updating particle position and velocity: Once pbest and gbest have been identified, the particle’s velocity is determined using the following Equation (21):
where represents the position of the i-th solution in the population, and are evenly dispersed within the range of [0, 1], denotes the inertia weight, and c represents the learning factor. balances the search direction between pbesti and gbesti, calculated as Equation (22):
Based on Equation (22), the overall search direction is primarily influenced by pbesti and gbesti. The branch search direction of is governed by , which emphasizes diversity rather than convergence. If fitness is higher than it indicates that is closer to the Pareto front (PF) than . The search direction is from to otherwise, it is the opposite. Finally, the position is updated as follows (23):
If the position exceeds the boundaries in some dimensions, it is set to the boundary value, and the corresponding velocity is reset to zero.
4. Experimental Design and Results Analysis
To validate the effectiveness of the MAPSO algorithm, we created a simulation scenario in Systems Tool Kits. We generated test instances based on data transmission flows from Systems Tool Kits.
4.1. Scenario Design
In the Systems Tool Kits-designed simulation scenario, we selected four ground stations (Hainan, Kashgar, Yunnan, and Xi’an) and various numbers of satellites for data transmission experiments. We designed ten sun-synchronous orbits, each with nine satellites evenly distributed. This section shows 24 scenarios. Each scenario varies in the number of ground stations (one to four) and satellites (10 to 90), with a planning period of 24 h, from 1 March 2024 00:00:00 to 2 March 2024 00:00:00. The parameters are detailed in Table 3.

Table 3.
Experimental scenarios and parameters.
The essential attributes for the transmission tasks are as follows:
- Each satellite can only transmit data to one ground station;
- The transmission priority of each satellite is randomly assigned using a 1–10 scale, where 10 denotes the highest priority;
- The priorities for the ground stations are Hainan (seven), Kashgar (five), Xi’an (ten), and Yunnan (three);
- The transmission time window must fall within the planning period, and if the window is shorter than 7 min, it must equal the task’s minimum required transmission time;
- All tasks use a standard communication protocol between satellites and ground stations;
- The transmission frequency band of all tasks is set to be S-band.
This section evaluates MAPSO by comparing it with NSGA-II [24], MOEA/D [25], MOGA [26], DRSC-MOAGDE [27], DSC-MOPSO [28], and MO-Ring-PSO-SCD [29]. NSGA-II is Pareto-based, MOGA is indicator-based, and MOEA/D is decomposition-based. DRSC-MOAGDE has a competitive performance on practical MOP, DSC-MOPSO is a multi-objective PSO algorithm with dynamic-switching crowding, MO-Ring-PSO-SCD is a powerful PSO algorithm for solving multi-objective problems. We generated 24 test instances, as described in Section 4.1. Each test instance was run 30 times, and the average value was taken as the final result. Our algorithm was implemented using MATLAB R2022b and tested on a personal computer equipped with an AMD Ryzen 7 4800H CPU with Radeon Graphics (2.90 GHz).
4.2. Experimental Results and Performance Analysis
We tested 24 experimental scenarios recorded in Table 3 using MAPSO, NSGA-II, MOEA/D, and MOGA algorithms. The NSGA-II parameters were set as population size 100, maximum iterations 100, crossover probability 0.9, mutation probability 0.1, and roulette wheel selection method. The optimization parameters of MAPSO were population size 100, inertia weight 0.7, and learning factors c1 = c2 = 1.5. MOEA/D parameters were population size 100, neighborhood size 20, mutation probability 0.02, crossover probability 0.9, and maximum iterations 100. MOGA parameters were population size 100, crossover probability 0.9, mutation probability 0.02, maximum iterations 100, and roulette wheel selection.
Table 4 records the time consumed by each algorithm under different experimental scenarios, and Table 5 records the time each algorithm takes to schedule data transmission tasks in different scenarios. The MAPSO algorithm improved data transmission efficiency using the minimum angle method to select particles with the best fitness for gbest and pbest. The archive update operation also updated the archive set, making MAPSO the fastest in solving satellite data transmission problems across all scenarios.

Table 4.
Algorithm time consumption in different scenarios (s).

Table 5.
Algorithm planning time for data transmission tasks in different scenarios (s).
We selected the most complex scenarios from Table 1: C4 (one station, 40 satellites), C9 (two stations, 50 satellites), C15 (three stations, 60 satellites), and C24 (four stations, 90 satellites) to plot Pareto fronts. Figure 7 displays the Pareto fronts obtained by the four optimization algorithms under different scenarios. Scenarios C1 to C4 were not chosen because when there is only one ground station, satellites transmit data sequentially within the time window, resulting in fixed values for the shortest transmission time and maximum priority between satellites and ground stations, making it impossible to plot corresponding Pareto fronts. Compared to NSGA-II, MOEA/D, and MOGA, the MAPSO algorithm shows significantly better performance in terms of Pareto front diversity and uniformity.
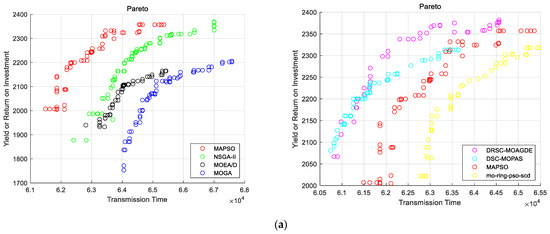
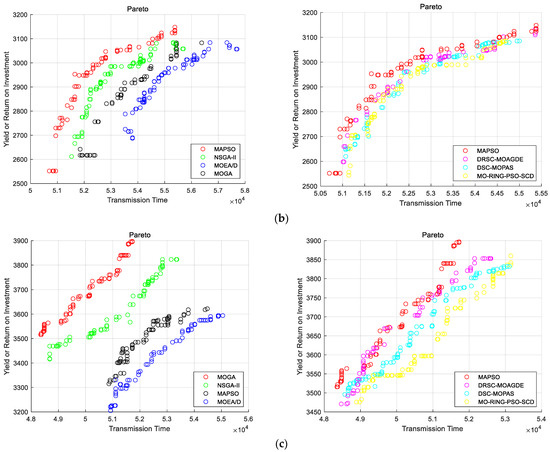
Figure 7.
(a) Description of Two stations, 50 satellites Pareto; (b) Description of Three stations, 60 satellites Pareto; (c) Description of Four stations, 90 satellites Pareto.
Figure 8 illustrates the final scheduling results for satellite data transmission tasks under different scenarios. The x-axis represents the scheduling time window, and the y-axis represents the ground stations. Satellites are recorded in the figure by sequence number. If a satellite is within the range of 1 on the y-axis, it indicates that the satellite is transmitting data to the first ground station, and so on. In Figure 8, we present a selected Pareto optimal scheduling result for different configurations of ground stations and satellites. Each subplot illustrates a scheduling outcome under varying conditions. The displayed scheduling result was chosen because it effectively demonstrates the balance between minimizing transmission time and maximizing resource utilization. While multiple Pareto optimal solutions exist, this result provides a representative and clear visualization of our algorithm’s performance. It highlights how our approach handles the complexities of large-scale multi-objective optimization in satellite data transmission scheduling. The results in Figure 8 show that the MAPSO algorithm provides a better scheduling plan for satellite data transmission tasks.
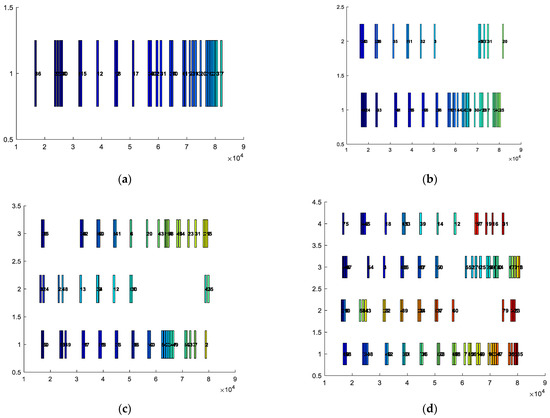
Figure 8.
(a) One station, 40 satellites; (b) Two stations, 50 satellites; (c) Three stations, 60 satellites, 90 satellites Pareto; (d) Four stations, 90 satellites.
The MAPSO algorithm enhances the efficiency of solving multi-objective SDTSPs, making it more suitable for handling satellite data transmission tasks across various scenarios. MAPSO enhances the system’s service capability, meeting diverse user needs. The scheduling results indicate an improved Pareto front, increasing the efficiency and accuracy of satellite data transmission tasks. The MAPSO algorithm employs a minimum angle particle selection strategy in dynamic scheduling, effectively selecting gbest and pbest particles. Combined with objective functions tailored to satellite data transmission characteristics, this increases the probability of generating better offspring during iterations, enhancing optimization performance.
4.3. Stability Analysis
BIG-O notation, typically employed to characterize the time complexity of algorithms, is not well suited for quantifying the computational complexity of evolutionary algorithms (EAs). This inadequacy stems from EAs not navigating within differentiable spaces but instead seeking global optima in complex, multimodal problem landscapes. Such landscapes often feature many local optima, which can entrap the algorithm and result in early convergence. In these contexts, the algorithm’s internal complexity is of lesser importance. As the search process defies straightforward optimization, the computational complexity, or search time, is potentially infinite. Consequently, assessing the computational complexity of the MAPSO algorithm necessitates stability analysis.
The stability analysis method quantifies evolutionary algorithms’ time taken and success rate in discovering feasible solutions within a controlled simulation environment [30]. For its innovative approach and effectiveness over other metrics, this research utilizes success rate (SR), mean fitness evaluations (MFE), and mean search time (MST) as the criteria for stability analysis. The collective performance of seven algorithms is evaluated by determining the values of SR, MFE, and MST.
The fundamental goal of the MAPSO algorithm is to identify feasible solutions for the SDTSP. Its success rate (SR) is computed using Equation (24), where signifies the count of independent trials that successfully yield a feasible solution, and denotes the overall number of trials conducted:
A further aspect of stability assessment involves monitoring the frequency of fitness evaluations executed by the algorithm. In detail, the fitness evaluation counter (FE) is incremented with every invocation of the objective function by the algorithm. The search concludes once the algorithm effectively locates a viable solution, at which point the FE counter’s tally is noted. Following this methodology, the mean number of fitness evaluations (MFE) across successful trials is computed using Equation (25):
Another critical aspect of stability analysis is examining the time required by the algorithm to find a feasible solution. Once a feasible solution is located, the search halts, and the search time (ST) is recorded. The average search time (MST) for successful runs is calculated using Equation (26):
The methods for calculating SR, MFE, and MST are based on the stability analysis described in [27], with detailed steps outlined in Algorithm 5. The statistical results for the SR, MFE, and MST of seven algorithms across 24 scenarios are presented in Table 6, Table 7 and Table 8.
| Algorithm 5 Stability Analysis |
|

Table 6.
SR performance of algorithms.

Table 7.
MST performance of algorithms.

Table 8.
MFE performance of algorithms.
Table 6 shows that the MAPSO algorithm achieves a high success rate across all scenarios, indicating its ability to find feasible solutions in every case. Table 6 demonstrates that MAPSO possesses strong robustness and reliability, effectively addressing satellite data transmission problems of varying scales and complexities. The DRSC-MOAGDE and DSC-MOPSO algorithms also achieve high success rates in smaller-scale scenarios, surpassing MAPSO. However, their success rates decline as the number of satellites and ground stations increases. Table 6 suggests these algorithms may struggle with more complex scenarios, potentially falling into local optima or exhibiting slower convergence. In contrast, the success rates of MO-Ring-PSO-SCD, NSGA-II, MOEA/D, and MOGA are generally low, particularly in large-scale scenarios. Table 6 implies that these algorithms are more prone to premature convergence or being trapped in local optima when handling complex problems.
As shown in Table 7, the MAPSO algorithm achieves relatively short average search times across all scenarios, indicating its ability to identify feasible solutions quickly. This efficiency is primarily attributed to the minimum angle particle selection strategy employed in MAPSO, which significantly enhances search performance. The DRSC-MOAGDE and DSC-MOPSO algorithms also exhibit relatively short average search times in smaller-scale scenarios. However, as the number of satellites and ground stations increases, their average search times slightly exceed those of MAPSO. Table 7 indicates that while these algorithms maintain relatively high search efficiency, they are still less effective than MAPSO.
In contrast, the average search times of MO-Ring-PSO-SCD, NSGA-II, MOEA/D, and MOGA are generally longer, particularly in large-scale scenarios. Table 7 suggests that these algorithms have lower search efficiency and require more time to find feasible solutions. As shown in Table 8, the MAPSO algorithm demonstrates relatively low average fitness evaluation counts across all scenarios, indicating its ability to find feasible solutions with fewer iterations. This efficiency is primarily attributed to the minimum angle particle selection strategy and the fitness function employed by MAPSO, which effectively enhance search performance and optimization results. Similarly, the DRSC-MOAGDE and DSC-MOPSO algorithms also exhibit low average fitness evaluation counts, though slightly higher than MAPSO in large-scale scenarios. This suggests that while these algorithms maintain relatively high optimization efficiency, they still fall short compared to MAPSO. In contrast, the MO-Ring-PSO-SCD, NSGA-II, MOEA/D, and MOGA algorithms have significantly higher average fitness evaluation counts, particularly in large-scale scenarios, indicating lower optimization efficiency and requiring more iterations to locate feasible solutions.
Based on the analysis of these three indicators, the following conclusions can be drawn: The MAPSO algorithm demonstrates superior stability in solving satellite data transmission problems. It consistently identifies feasible solutions, achieves shorter search times, and requires fewer fitness evaluations, highlighting its ability to address complex problems effectively and efficiently. While the DRSC-MOAGDE and DSC-MOPSO algorithms also exhibit high stability, they are slightly less effective than MAPSO. On the other hand, the MO-Ring-PSO-SCD, NSGA-II, MOEA/D, and MOGA algorithms show poor stability, often becoming trapped in local optima or suffering from premature convergence, making them unsuitable for solving large-scale or complex satellite data transmission problems.
4.4. Hypervolume and Friedman Evaluation Index
This study utilized the hypervolume (HV) and Friedman fraction metrics to evaluate the algorithm’s performance [31] and comprehensively analyze the diversity and convergence of the Pareto front generated by the algorithm. Each solution within the Pareto front corresponds to a scheduling plan that satisfies the dynamic scheduling demands of relay satellites under different preference scenarios. The HV metric is computed by summing the areas of the rectangles formed between each point in the non-dominated solution set and a reference point, typically the maximum individual in the objective space. A higher HV value signifies superior overall algorithm performance. The HV calculation is expressed by the following Formula (27):
In this context, and denote the first and second objective values of solution , respectively. Similarly, and are the respective coordinates of the reference point. represents the maximum value of the first objective function in all solutions . represents the maximum value of the second objective function in all solutions . Cases through lack a Pareto front, and as a result, they are not considered in the hypervolume (HV) assessment. Table 4 presents the HV values and the reference point coordinates for the 20 experimental scenarios. A normalization process has been implemented to avoid excessively high HV values. This process involves standardizing each objective value by dividing it by its maximum, which maintains uniform scaling among the objectives.
Table 9 presents the average HV values obtained by seven algorithms over 30 runs across all experimental scenarios. In solving satellite data transmission problems, the MAPSO algorithm demonstrates a significant advantage, particularly in scenarios 15 to 24, where its HV values are consistently higher than those of other algorithms. Table 9 indicates that MAPSO effectively balances solution diversity and convergence, achieving superior solution sets. In contrast, the HV values of the MOGA algorithm are noticeably lower across all scenarios, reflecting poor solution diversity and limited ability to explore the solution space effectively. The HV values of the DRSC-MOAGDE, DSC-MOPSO, MO-Ring-PSO-SCD, NSGA-II, and MOEA/D algorithms fall between those of MAPSO and MOGA, exhibiting varying performance levels.

Table 9.
Hypervolume value.
5. Conclusions
We have proposed a minimum angle particle swarm optimization (MAPSO) algorithm to solve multi-objective satellite data transmission scheduling problems. The proposed algorithm was encoded as a discrete optimizer, and the calculation equation of the sine function was modified to enhance the PSO algorithm’s ability to deal with complex multi-objective problems. The MAPSO method introduces this new minimum angle selection strategy into the design and effectively selects the global optimal solution by calculating the minimum angle between particles. MAPSO balances convergence and diversity by avoiding local extrema in the global search process.
In the experimental validation section, we tested the MAPSO method on 24-scale task instances, demonstrating its ability to solve multi-objective data transmission scheduling problems and improve data transmission efficiency and accuracy. The experimental results show that the MAPSO method has an advantage in solving data transmission problems and maintains high solution quality across different task scales, indicating its generalization capability and adaptability in practical applications. Future research can further optimize this method, combining it with other intelligent optimization techniques to enhance its application potential in more extensive and complex task environments, promoting the development of satellite communication technology.
Author Contributions
Data curation, Y.S., Z.W. and H.R.; writing—original draft, Z.Z.; writing—review and editing, S.C. and L.X.; supervision, L.X. All authors have read and agreed to the published version of the manuscript.
Funding
This work is partially supported by the National Natural Science Foundation of China (Grant No. 61806119), the Natural Science Basic Research Plan in Shaanxi Province of China (No. 2024JC-YBMS-516), and Fundamental Research Funds for the Central Universities (No. GK202201014).
Data Availability Statement
The data supporting the reported results can be found in the manuscript. Due to the nature of the research, no new datasets were created.
Acknowledgments
We would like to acknowledge the technical support provided by the School of Computer Science, Shaanxi Normal University and the School of Electronic Engineering, Xidian University. Thanks to the anonymous reviewers and editor from the journal.
Conflicts of Interest
The authors declare no conflicts of interest.
Abbreviations
The following abbreviations are used in this manuscript:
| MAPSO | minimum angle particle swarm optimization |
| AFSCN | address the scheduling problem of the satellite control network |
| SDTT | the unique aspects of large-scale data transmission missions |
| PSO | particle swarm optimization |
| MOEA | Multi-objective evolutionary algorithms |
References
- Zhang, J.; Xing, L.; Peng, G.; Yao, F.; Chen, C. A large-scale multi-objective satellite data transmission scheduling algorithm based on SVM+ NSGA-II. Swarm Evol. Comput. 2019, 50, 100560. [Google Scholar] [CrossRef]
- Vazquez, A.J.; Erwin, R.S. On the tractability of satellite range scheduling. Optim. Lett. 2015, 9, 311–327. [Google Scholar] [CrossRef]
- Gooley, T.; Borsi, J.; Moore, J. Automating Air Force Satellite Control Network (AFSCN) scheduling. Math. Comput. Model. 1996, 24, 91–101. [Google Scholar] [CrossRef]
- Barbulescu, L.; Howe, A.E.; Watson, J.P.; Whitley, L.D. Satellite range scheduling: A comparison of genetic, heuristic and local search. In Proceedings of the Parallel Problem Solving from Nature—PPSN VII: 7th International Conference, Granada, Spain, 7–11 September 2002; Proceedings 7. Springer: Berlin/Heidelberg, Germany, 2002; pp. 611–620. [Google Scholar]
- Xia, L.; Yu, N. Redundant and Relay Assistant Scheduling of Small Satellites. In Proceedings of the 2014 IEEE 28th International Conference on Advanced Information Networking and Applications, Victoria, BC, Canada, 13–16 May 2014; IEEE: Piscataway, NJ, USA, 2014; pp. 1017–1024. [Google Scholar]
- Liang, Q.; Fan, Y.; Yan, X. An algorithm based on differential evolution for satellite data transmission scheduling. Int. J. Comput. Sci. Eng. 2019, 18, 279–285. [Google Scholar] [CrossRef]
- Yong, D.; Feng, Y.; Xing, L.; He, L. The inter-satellite data transmission method in satellite networks is based on a hybrid evolutionary algorithm. Syst. Eng. Electron. 2023, 45, 2931–2940. [Google Scholar]
- Chen, X.; Gu, W.; Dai, G.; Xing, L.; Tian, T.; Luo, W.; Cheng, S.; Zhou, M. Data-Driven Collaborative Scheduling Method for Multi-Satellite Data-Transmission. Tsinghua Sci. Technol. 2024, 29, 1463–1480. [Google Scholar] [CrossRef]
- Zhang, J.; Xing, L. An improved genetic algorithm for the integrated satellite imaging and data transmission scheduling problem. Comput. Oper. Res. 2022, 139, 105626. [Google Scholar] [CrossRef]
- Chen, H.; Sun, G.; Peng, S.; Wu, J. Dynamic rescheduling method of measurement and control of data transmission resources based on multi-objective optimization. Syst. Eng. Electron. 2024, 46, 3744–3753. [Google Scholar]
- Maher, M.L. A model of co-evolutionary design. Eng. Comput. 2000, 16, 195–208. [Google Scholar] [CrossRef]
- Chauhan, S.; Vashishtha, G.; Zimroz, R.; Kumar, R. A crayfish optimized wavelet filter and its application to fault diagnosis of machine components. Int. J. Adv. Manuf. Technol. 2024, 135, 1825–1837. [Google Scholar] [CrossRef]
- Chauhan, S.; Vashishtha, G.; Zimroz, R. Analysing Recent Breakthroughs in Fault Diagnosis through Sensor: A Comprehensive Overview. Comput. Model. Eng. Sci. 2024, 141, 1983–2020. [Google Scholar] [CrossRef]
- Wang, T.; Luo, Q.; Zhou, L.; Wu, G. Space division and adaptive selection strategy based differential evolution algorithm for multi-objective satellite range scheduling problem. Swarm Evol. Comput. 2023, 83, 101396. [Google Scholar] [CrossRef]
- Song, Y.; Ou, J.; Pedrycz, W.; Suganthan, P.N.; Wang, X.; Xing, L. Generalized Model and Deep Reinforcement Learning-Based Evolutionary Method for Multitype Satellite Observation Scheduling. IEEE Trans. Syst. Man Cybern. Syst. 2024, 15, 271–276. [Google Scholar] [CrossRef]
- Mai, Y.; Shi, H.; Liao, Q.; Sheng, Z.; Zhao, S.; Ni, Q.; Zhang, W. Using the decomposition-based multi-objective evolutionary algorithm with adaptive neighborhood sizes and dynamic constraint strategies to retrieve atmospheric ducts. Sensors 2020, 20, 2230. [Google Scholar] [CrossRef]
- Gong, D.W.; Zhang, Y.; Zhang, J.H. Multi-objective particle swarm optimization based on minimal particle angle. In Proceedings of the International Conference on Intelligent Computing, Tianjin, China, 5–8 August 2024; Springer: Berlin/Heidelberg, Germany, 2005; pp. 571–580. [Google Scholar]
- Yang, L.; Hu, X.; Li, K. A vector angles-based many-objective particle swarm optimization algorithm using archive. Appl. Soft Comput. 2021, 106, 107299. [Google Scholar] [CrossRef]
- Cui, Y.; Meng, X.; Qiao, J. A multi-objective particle swarm optimization algorithm based on a two-archive mechanism. Appl. Soft Comput. 2022, 119, 108532. [Google Scholar] [CrossRef]
- Kang, L.; Liu, N.; Cao, W.; Chen, Y. Many-objective particle swarm optimization algorithm based on multi-elite opposition mutation mechanism in the Internet of things environment. Int. J. Grid Util. Comput. 2023, 14, 107–121. [Google Scholar] [CrossRef]
- Das, I.; Dennis, J.E. Normal-boundary intersection: A new method for generating the Pareto surface in nonlinear multicriteria optimization problems. SIAM J. Optim. 1998, 8, 631–657. [Google Scholar] [CrossRef]
- Li, M.; Yang, S.; Liu, X. Shift-based density estimation for Pareto-based algorithms in many-objective optimization. IEEE Trans. Evol. Comput. 2013, 18, 348–365. [Google Scholar] [CrossRef]
- Zhu, Q.; Lin, Q.; Chen, W.; Wong, K.-C.; Coello, C.A.C.; Li, J. An external archive-guided multi-objective particle swarm optimization algorithm. IEEE Trans. Cybern. 2017, 47, 2794–2808. [Google Scholar] [CrossRef]
- Deb, K.; Pratap, A.; Agarwal, S.; Meyarivan, T. A fast and elitist multi-objective genetic algorithm: NSGA-II. IEEE Trans. Evol. Comput. 2002, 6, 182–197. [Google Scholar] [CrossRef]
- Wang, Q.; Gu, Q.; Chen, L.; Meyarivan, T. A MOEA/D with global and local cooperative optimization for complicated bi-objective optimization problems. Appl. Soft Comput. 2023, 137, 110162. [Google Scholar] [CrossRef]
- Saha, S.; Zaman, P.B.; Tusar, I.H.; Dhar, N.R. Multi-objective genetic algorithm (MOGA) based optimization of high-pressure coolant assisted hard turning of 42CrMo4 steel. Int. J. Interact. Des. Manuf. (IJIDeM) 2022, 16, 1253–1272. [Google Scholar] [CrossRef]
- Akbel, M.; Kahraman, H.T.; Duman, S.; Temel, S. A clustering-based archive handling method and multi-objective optimization of the optimal power flow problem. Appl. Intell. 2024, 54, 11603–11648. [Google Scholar] [CrossRef]
- Bakır, H.; Kahraman, H.T.; Yılmaz, S.; Duman, S.; Guvenc, U. Dynamic switched crowding-based multi-objective particle swarm optimization algorithm for solving multi-objective AC-DC optimal power flow problem. Appl. Soft Comput. 2024, 166, 112155. [Google Scholar] [CrossRef]
- Yue, C.; Qu, B.; Liang, J. A multi-objective particle swarm optimizer using ring topology for solving multimodal multi-objective problems. IEEE Trans. Evol. Comput. 2017, 22, 805–817. [Google Scholar] [CrossRef]
- Kahraman, H.T.; Akbel, M.; Duman, S.; Kati, M.; Sayan, H.H. Unified space approach-based Dynamic Switched Crowding (DSC): A new method for designing Pareto-based multi/many-objective algorithms. Swarm Evol. Comput. 2022, 75, 101196. [Google Scholar] [CrossRef]
- Shang, K.; Ishibuchi, H. A new hypervolume-based evolutionary algorithm for many-objective optimization. IEEE Trans. Evol. Comput. 2020, 24, 839–852. [Google Scholar] [CrossRef]
Disclaimer/Publisher’s Note: The statements, opinions and data contained in all publications are solely those of the individual author(s) and contributor(s) and not of MDPI and/or the editor(s). MDPI and/or the editor(s) disclaim responsibility for any injury to people or property resulting from any ideas, methods, instructions or products referred to in the content. |
© 2024 by the authors. Licensee MDPI, Basel, Switzerland. This article is an open access article distributed under the terms and conditions of the Creative Commons Attribution (CC BY) license (https://creativecommons.org/licenses/by/4.0/).