1. Introduction
The deformation and failure of rock masses can be interpreted through the lens of thermodynamic theory. It is generally believed that the loading and unloading distortion and breakdown of rock formations is the result of continuous energy conversion between the rock and the testing machine [
1,
2]. It is believed that the external force applied to the rock generates mechanical energy, a portion of which is retained within the rock mass as strain energy. The remaining energy is dissipated through the development and expansion of internal defects in the rock mass. When the total external energy input surpasses the rock mass’s energy storage capacity, the rock mass deforms and destabilizes [
3]. To obtain the appropriate and more accurate deformation law of rock or rock-like material and devise a suitable treatment scheme for surrounding rock deformation in practical engineering, the most critical problem is how to construct a suitable constitutive model that can truly reflect the internal properties of rock or rock-like material [
4,
5]. In general, the material microstructure exhibits obvious non-linear strain characteristics under load. Therefore, the non-linear deformation caused by the microstructure must be considered when constructing a constitutive model. At the same time, because the non-linear strain of the material causes irreversible deformation, an internal variable is needed to describe the microscopic changes in the material deformation [
6]. Considering energy storage, the sudden release of residual elastic strain energy throughout the entire process of rock material failure is the main reason for the occurrence of underground engineering disasters. From the perspective of energy consumption, failure in rock materials must be accompanied by energy dissipation. The dissipated energy is the internal driving force of rock damage and progressive failure. Therefore, studying the energy evolution law of rock from the perspective of energy evolution and constructing an energy damage constitutive model can better reflect the compression failure process of rock. The research results can improve the understanding of the energy method in rock deformation and failure and provide a theoretical foundation for high-temperature rock engineering. In addition, the findings can be used to further improve and extend the rock mechanics research system based on energy.
The research results obtained by previous scholars can be categorized into the following three categories. (1) Based on the traditional mechanics of continuous medium, a constitutive model is established using mathematical means. Such models are limited by traditional mechanical theories and assumptions and cannot accurately reflect the stress–strain characteristics of sandstone [
7]. (2) It is necessary to define the basic elements describing the strain of each stage of rheology. A constitutive model describing the whole rheological stage is constructed using a combination method [
8]. (3) Sandstone is considered a damaged body, and a damage evolution model is developed [
9]. The advantages and disadvantages of the above three modeling theories are shown in
Table 1.
The fundamental cause of object failure is energy-driven state instability, where the loaded rock undergoes destruction and deformation during four processes: energy input, energy accumulation, energy dissipation, and energy release [
10]. Investigations into rock destruction and deformation from an energy perspective align more closely with the fundamental nature of failure than other approaches, thereby enhancing our understanding of the mechanics of external load rock. This approach can promote the understanding and research of rock mechanics problems, such as rock bursts, and can also help develop new solutions to related rock engineering problems. In recent years, various rock engineering problems have been identified and studied from the perspective of energy, including rock bursts, coal pillar instability, roadway support, and granular material vibration, and good results were achieved [
11,
12]. In order to enable its application to become more extensive and accurate, the energy evolution behavior of rock under various loading conditions needs to be clarified. This is also the basic condition of using the rock energy principle.
Researchers have examined the energy evolution behavior of rock masses and the factors affecting energy characteristics in detail. The factors affecting the energy evolution characteristics of rock mainly include stress, osmotic pressure, temperature, loading rate, confining pressure, weathering degree, and rock type. Zhao et al. [
13] assert that the existing failure criteria cannot accurately describe the stress relationship and strain characteristics of materials. Therefore, the authors improve the criteria through the addition of the principle of energy conservation, and an energy-based damage constitutive model is formulated. Zhou et al. [
14] combine the energy conversion law with the mechanical characteristics of rock and summarize the energy characteristics of materials during deformation. The concept of energy conversion and the establishment of mathematical expressions are proposed. The energy damage model is constructed by combining the existing mechanical theory. The findings suggest that the model more accurately outlines the strain characteristics and energy evolution behavior. Based on the transverse scale effect of rock, Yan et al. [
15] simulate the influence of multiple aspect ratios on rock mechanical properties and energy transformation characteristics by using the PFC2D software platform. A constitutive model for rock damage is developed, grounded in its energy characteristics. The findings indicate that the model incorporating friction energy parameters more accurately represents the stress-deformation behavior of rock. However, the rock stress-deformation model curve based on the boundary energy characteristics is quite different from the numerical curve. Numerous studies on energy calculation during rock deformation have been conducted by both domestic and international scholars, finding that the interference of external factors significantly impacts the energy evolution of rock. Numerous tests have been performed on the surrounding rock under varying conditions, and the underlying mechanism of the distortion and breakdown of loaded rock has been deeply analyzed, with fruitful results being obtained. There is also an increasing amount of research analyzing the failure dynamics of loaded rock mass from the viewpoint of energy evolution. Typically based on the entire process of uni-axial or triaxial compression testing, from initial loading to failure, the rock failure mechanism is analyzed from an energy viewpoint. However, there are relatively few studies on the establishment of models describing the stress–strain relationship from an energy perspective and the construction of models describing the energy–strain relationship.
The above constitutive models accurately represent the stress–strain curve of rock. However, the essence of object destruction is state instability, driven by energy. The distortion and breakdown of the loaded rock occur during the processes of energy input, energy accumulation, energy dissipation, and energy release. The principle of rock distortion and breakdown is studied from an energy viewpoint, which is closer to its failure essence than other angles. This perspective can provide better analysis and prediction of the principle of rock energy fluctuations and the stress–strain rule. The findings of this research offer theoretical support and practical approaches for investigating rock mass instability from an energy perspective. The release and accumulation of energy is always accompanied by the loading process, and energy theory provides a more effective explanation of the stress–strain interaction in rock. Therefore, energy theory expands the theory of the rock stress–strain model, and a new triaxial stress–strain model of rock is developed founded on the principle of function and momentum. On this basis, the function principle and the maximum energy release rate are applied to develop a model that describes the relationships between total energy and strain, elastic energy and strain, and dissipative energy and strain. This approach offers a novel perspective for the development of an energy–strain curve model and also lays a theoretical foundation for later numerical calculations.
2. Establishment of Rock Energy Constitutive Model Based on Function Principle
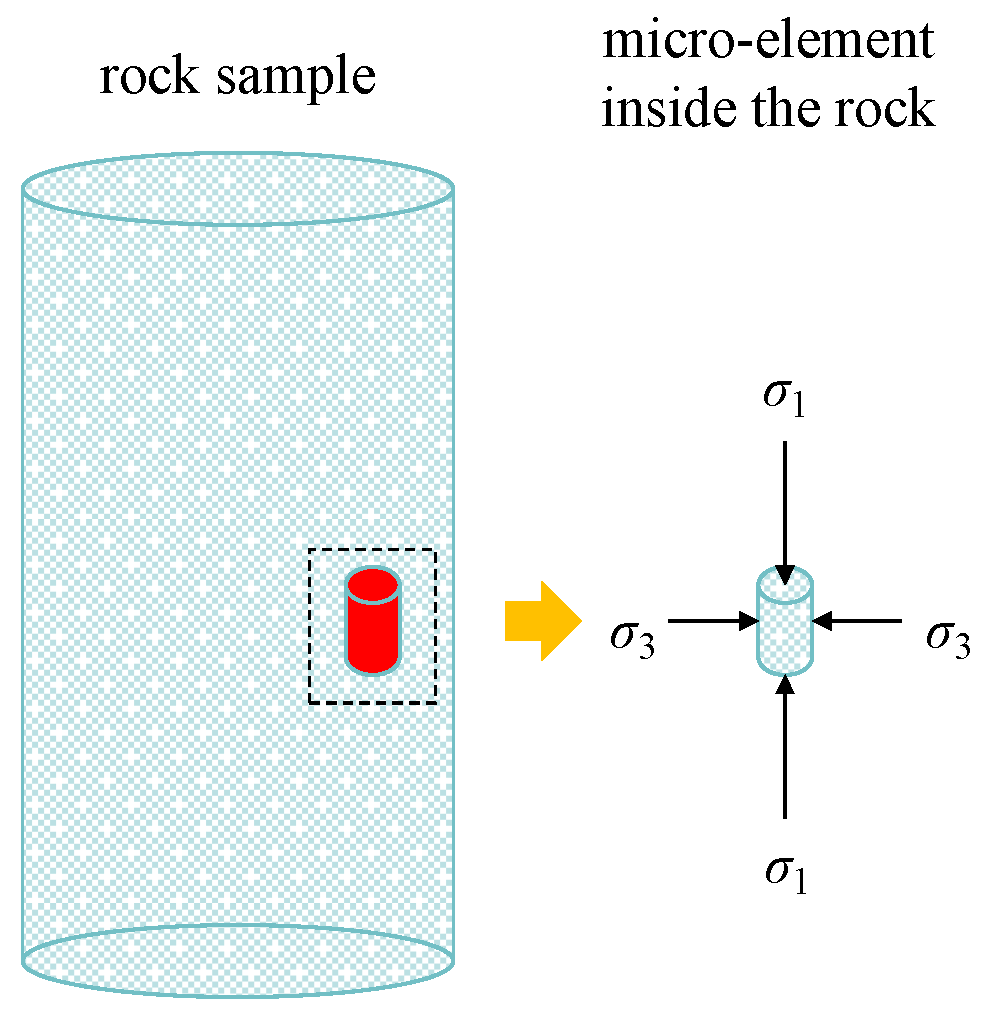
The stress characteristics of the rock micro-element are shown in
Figure 1.
It is apparent from
Figure 1 that the rock micro-element is subjected to axial stress and radial stress. The axial stress acts on the rock’s top and bottom ends. Radial stress acts on the surface around the rock. The stress along the axis and the stress in the radial direction are symmetrical.
A micro-element inside the rock is used as the subject of the study. During the loading process, the task Δ
W conducted by the test apparatus on the rock element can be formulated as follows [
16]:
where
σ1 is axial stress,
σ3 is radial stress, Δ
ε1 is the axial strain of the rock element, and Δ
ε3 is the radial strain of the rock element.
In the process of loading, the kinetic energy Δ
Ek produced by the rock micro-element under an external load is [
17]:
where Δ
m represents the mass of the rock micro-element, and Δ
v denotes the strain velocity of the rock micro-element.
Assuming that the energy dissipation in the rock micro-element changes to dynamic energy during the rock-loading process, the correction coefficient is introduced to correct the dynamic energy, and the corrected dynamic energy Δ
E′k is:
where
λ is the kinetic energy correction factor.
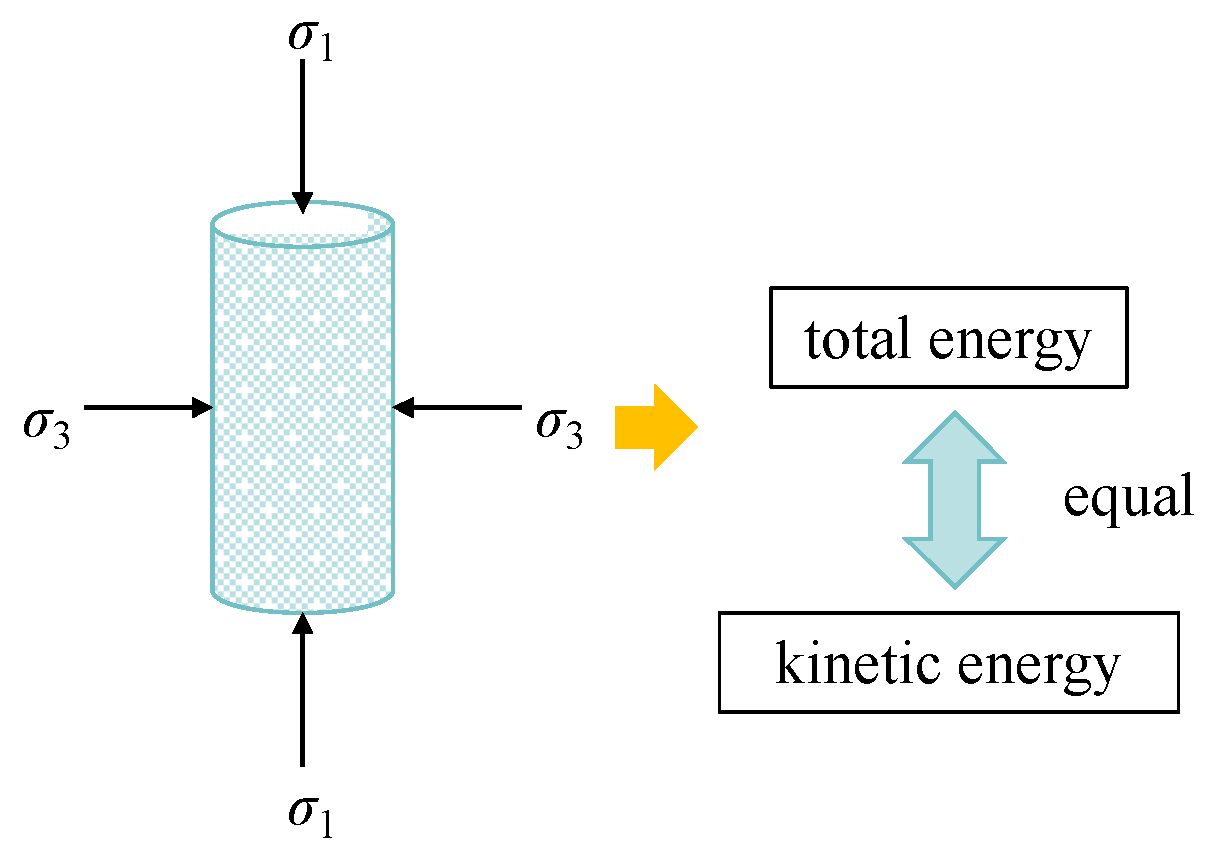
As stated by the function theorem, the total work carried out by the external load applied to the object matches the algebraic sum of the work carried out by the dissipated forces within the system [
18].
The relationship between the two is shown in
Figure 2.
By substituting Equations (1) and (3) into Equations (4) and (5), the following can be obtained:
According to the principle of momentum, the variation in the momentum of the rock element during the loading sequence matches the impulse of the external load.
where Δ
t is the amount of time change.
From Equation (6), the strain rate of the rock micro-element is obtained as
It is necessary to assume that the rock micro-element strain is proportional to time
t, and Equation (7) can be obtained.
where
K is the test loading parameter, which can be determined using the triaxial test. Under the loading path of the constant displacement rate, the axial strain of the rock sample is proportional to time [
19].
Through the substitution of Equation (8) into Equation (7), we can derive Equation (9).
The stress–strain interaction of rock is [
20]
where
E is the elastic modulus,
v is Poisson’s ratio,
ε1 is the axial strain, and
ε3 is the radial strain.
The substitution of Equation (9) into Equation (10) yields Equation (11):
The substitution of Equation (11) into Equation (5) obtains (12).
The relationship between axial strain and radial strain satisfies
where
μ is a parameter related to the stress state.
The substitution of Equation (13) into Equation (12) yields Equation (15).
Equation (16) can be obtained by integrating Equation (15).
where
C is the integral constant, and
A and
B are substitution parameters.
The relationship between the total energy and strain of the rock during loading is obtained by combining Equations (1), (5) and (9).
Equation (18) can be obtained by integrating Equation (17).
where
C1 is the integral constant.
Based on Xie Heping’s explanation of the overall failure criterion for rock masses, the complete failure of a rock unit adheres to the following relationship [
21]:
where
Gc is the material constant, which is the critical value of the maximum rate of energy dissipation of the element under various stress states and can be ascertained through a single-axis compression test,
G3 is the maximum energy release rate,
We is the elastic strain energy, and
K3 is the material constant.
The elastic strain energy
Wed of rock under uni-axial compression is
where
σc is the uni-axial peak strength.
By substituting Equation (19) into Equation (21), Equation (22) is obtained.
The substitution of Equation (16) into Equation (22) yields (23).
In accordance with the law of the conservation of energy, energy conversion and transformation satisfy the following relationship:
3. Rock Triaxial Compression Test under Rock-Loading Path
3.1. Test Scheme
The experimental data used are from Reference [
21]. The samples were taken from the neighboring rock of the roadway in Fuxin Hengda Coal Mine. The buried depth of the neighboring rock is approximately 800–1000 m. The rock mass was made into a standard cylinder with h = 100 mm and D = 50 mm. Samples showing significant visible defects were discarded. The diameter discrepancy in the remaining rock samples was within 0.3 mm, the height error was within 0.05 mm, and the highest deviation from the axis was less than 0.25°. Finally, the rock sample with the same wave velocity was taken as the sample object by the wave velocity tester. The maximum horizontal in situ stress can achieve approximately 30 MPa. The radial pressure value was 30 MPa. However, for the purpose of examining the influence of radial pressure on the mechanical properties of the rock, the radial pressure was 20, 25, 35, and 40 MPa.
The test equipment was the MTS815.02 sandstone test system imported from the United States. The system is equipped with three main systems: axial pressure, confining pressure, and seepage. The rigidity of the testing machine reached 1600 kN. The peak radial pressure can be administered up to 70 MPa. The displacement measurement range is ±4 mm, completely satisfying the test requirements.
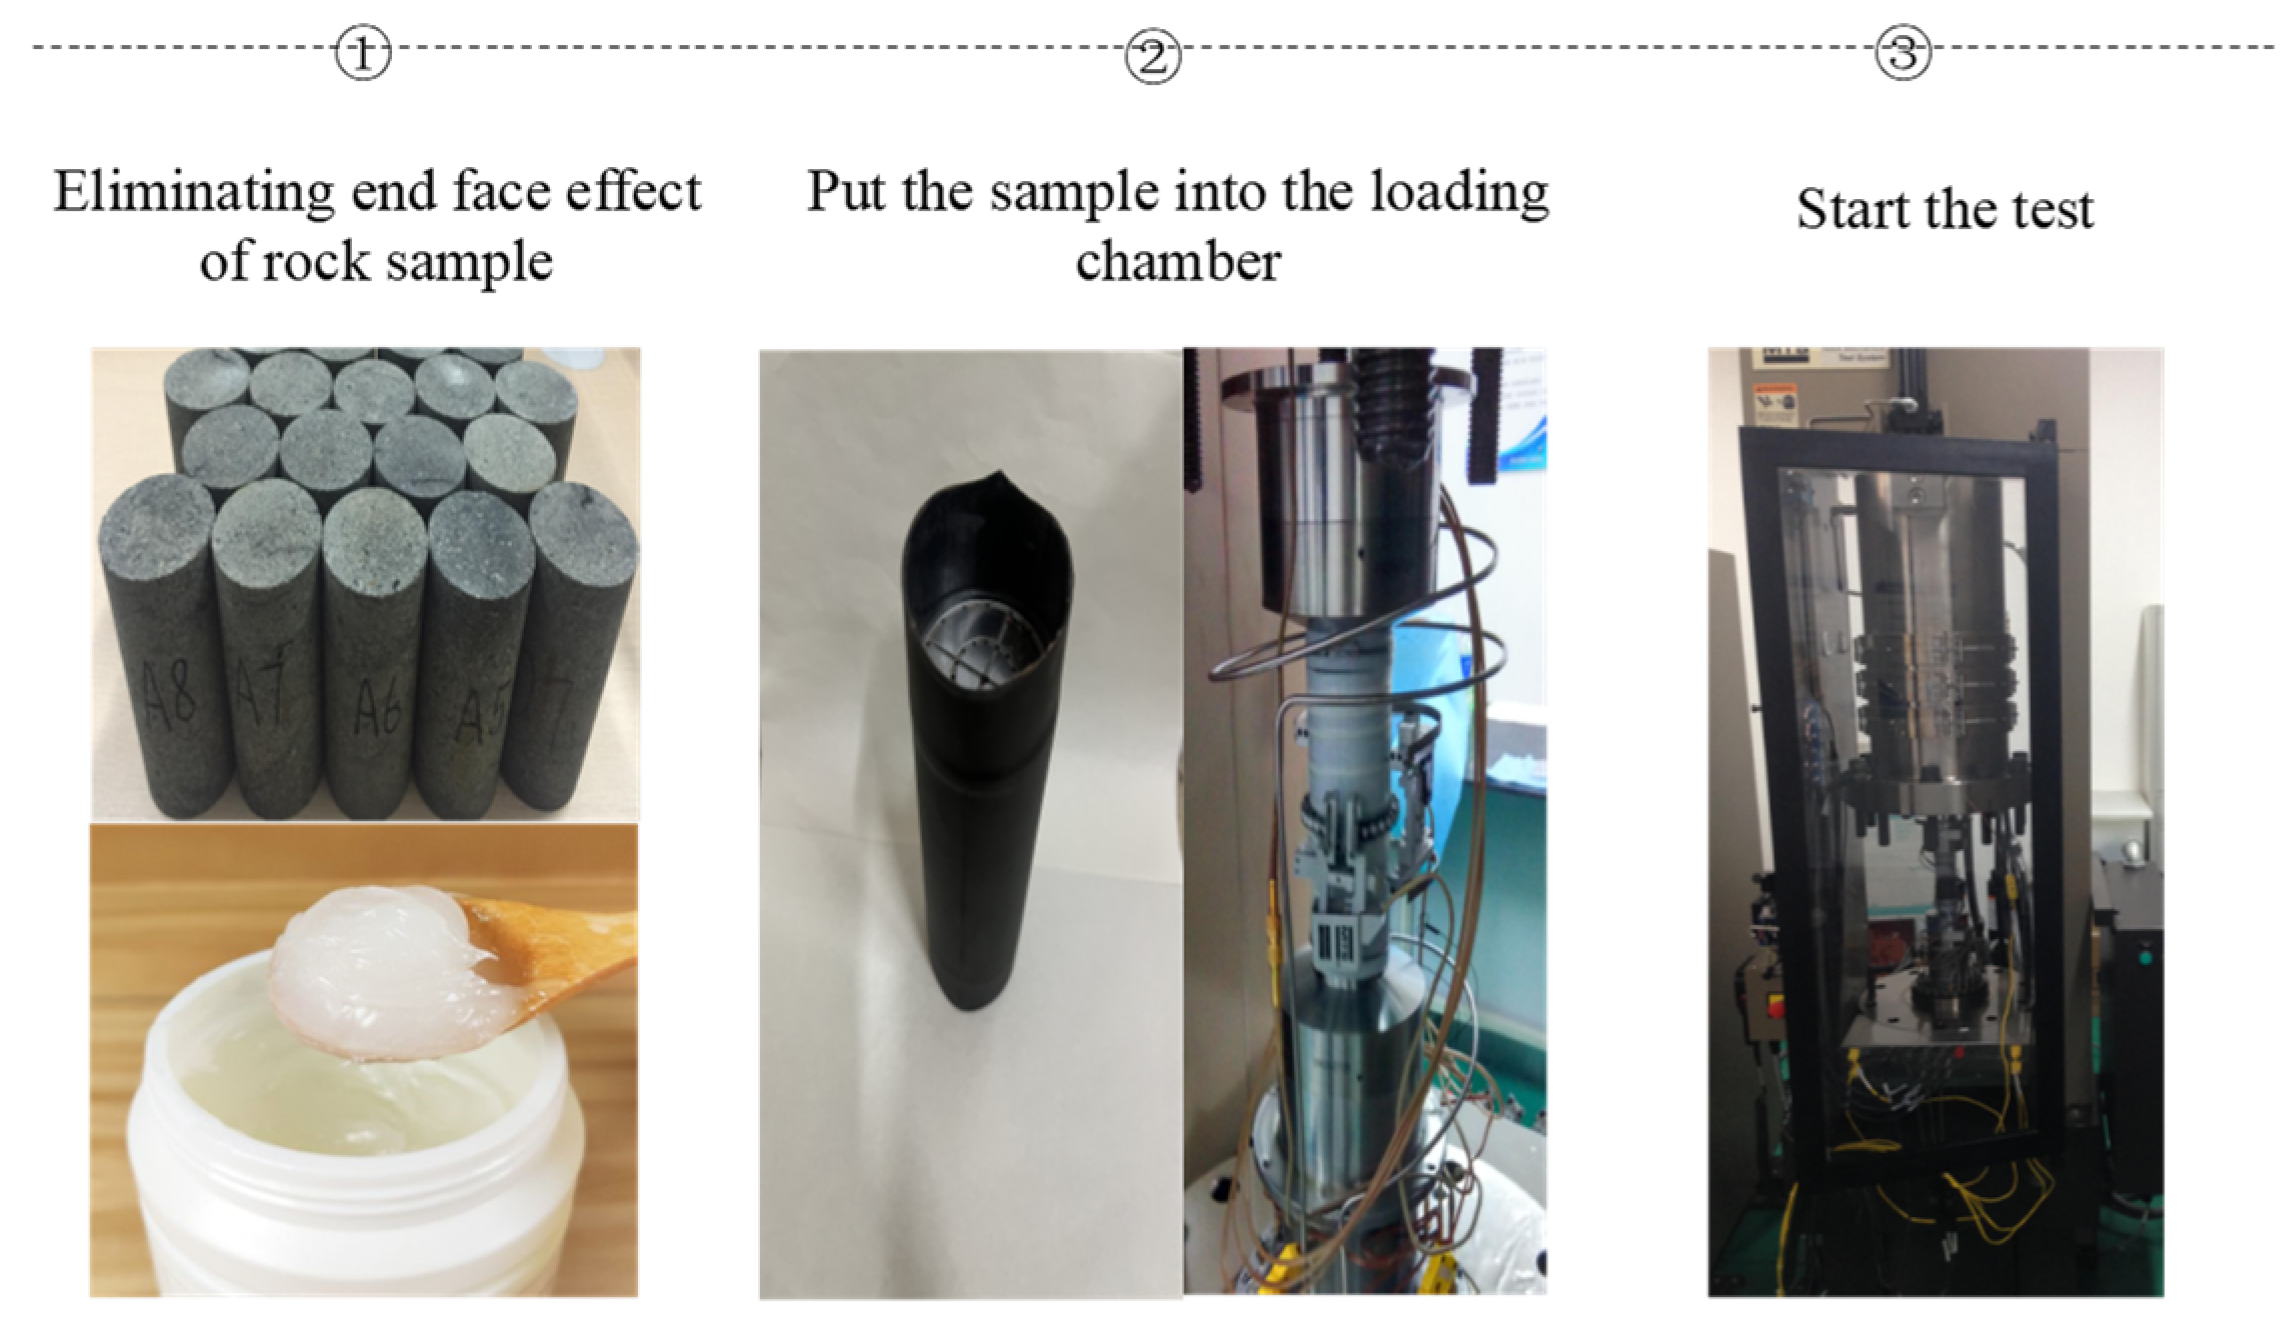
The detailed test procedures are as follows: (1) Applying an even layer of Vaseline to both ends of the rock sample is essential to prevent the end effect from influencing the accuracy of the measured test data. (2) The rock sample should be positioned at the midpoint of the testing platform, with a thermoplastic film wrapped around it to confirm that the membrane adheres tightly to the specimen. The sensors for measuring axial and radial displacement must be mounted on the surface of the specimen. The specimen and tester are positioned in the middle of the pressure vessel, after which the pressure cover is gradually reduced and hydraulic oil is introduced into the chamber. (3) The rate of confining pressure application is 0.5 mm/min. The confining pressure is applied to the predetermined value at this loading rate, and maintaining a consistent radial pressure throughout the test is essential. The confining pressure was selected as 20, 25, 30, 35, and 40 MPa. (4) After testing, the data needs to be saved.
The specific test steps are shown in
Figure 3.
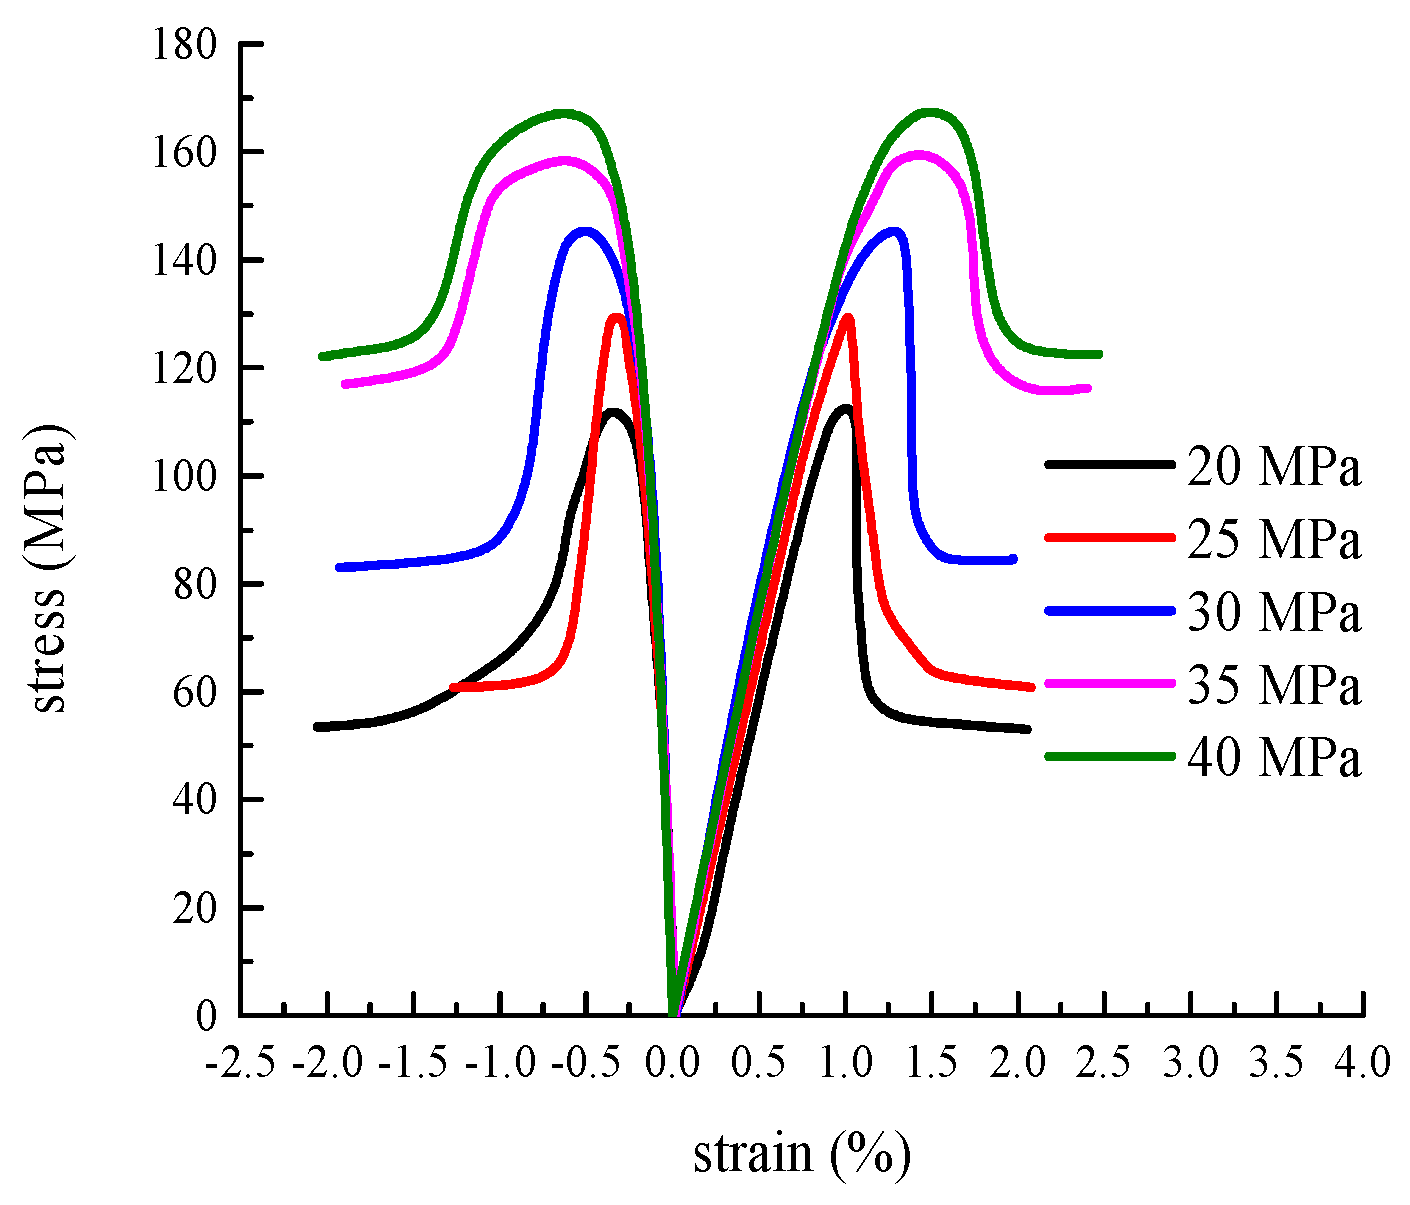
3.2. Analysis of Triaxial Compression Test Results
The data were obtained from Liu Wenbo’s doctoral dissertation [
21]. According to the above test steps, the three-axis strength test was conducted following the specified loading path, and the strain response curve was plotted using the test data, as illustrated in
Figure 4.
3.3. Analysis of Energy Evolution Law
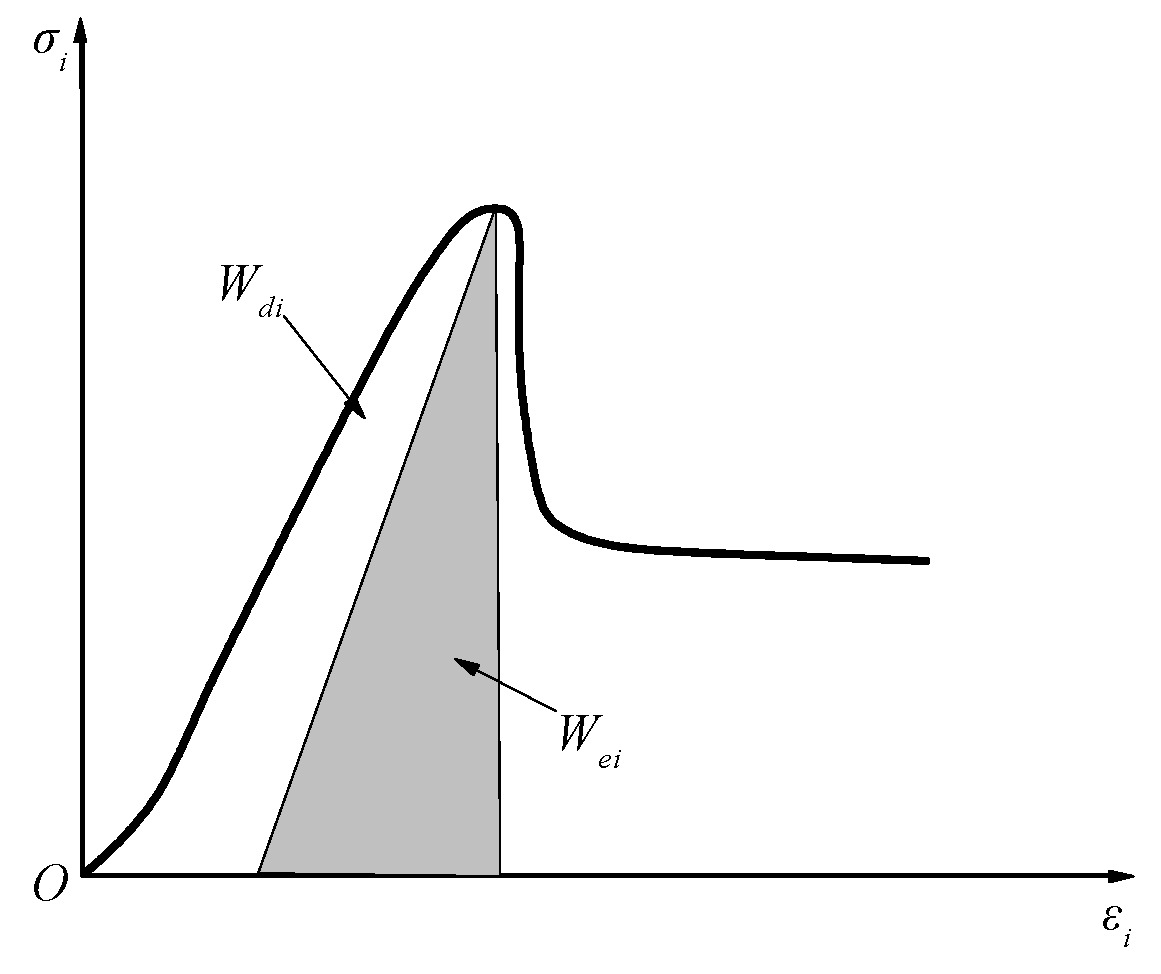
The total energy is illustrated through the region under the stress–strain curve and above the strain axis. After loading to peak stress, the rock was un-loaded, and an un-loading path curve was obtained. The region beneath the un-loading path curve and above the strain axis represents the elastic strain energy. Rock dissipation energy is the area between the stress–strain curve and the un-loading curve (the area of the shaded portion in
Figure 5). The specific calculation is shown in
Figure 5 [
22].
Therefore, according to
Figure 5, the energy of each part is calculated as follows:
where
W represents the total energy input value of the rock, we denote the releasable strain energy, and
Wd corresponds to the dissipation energy.
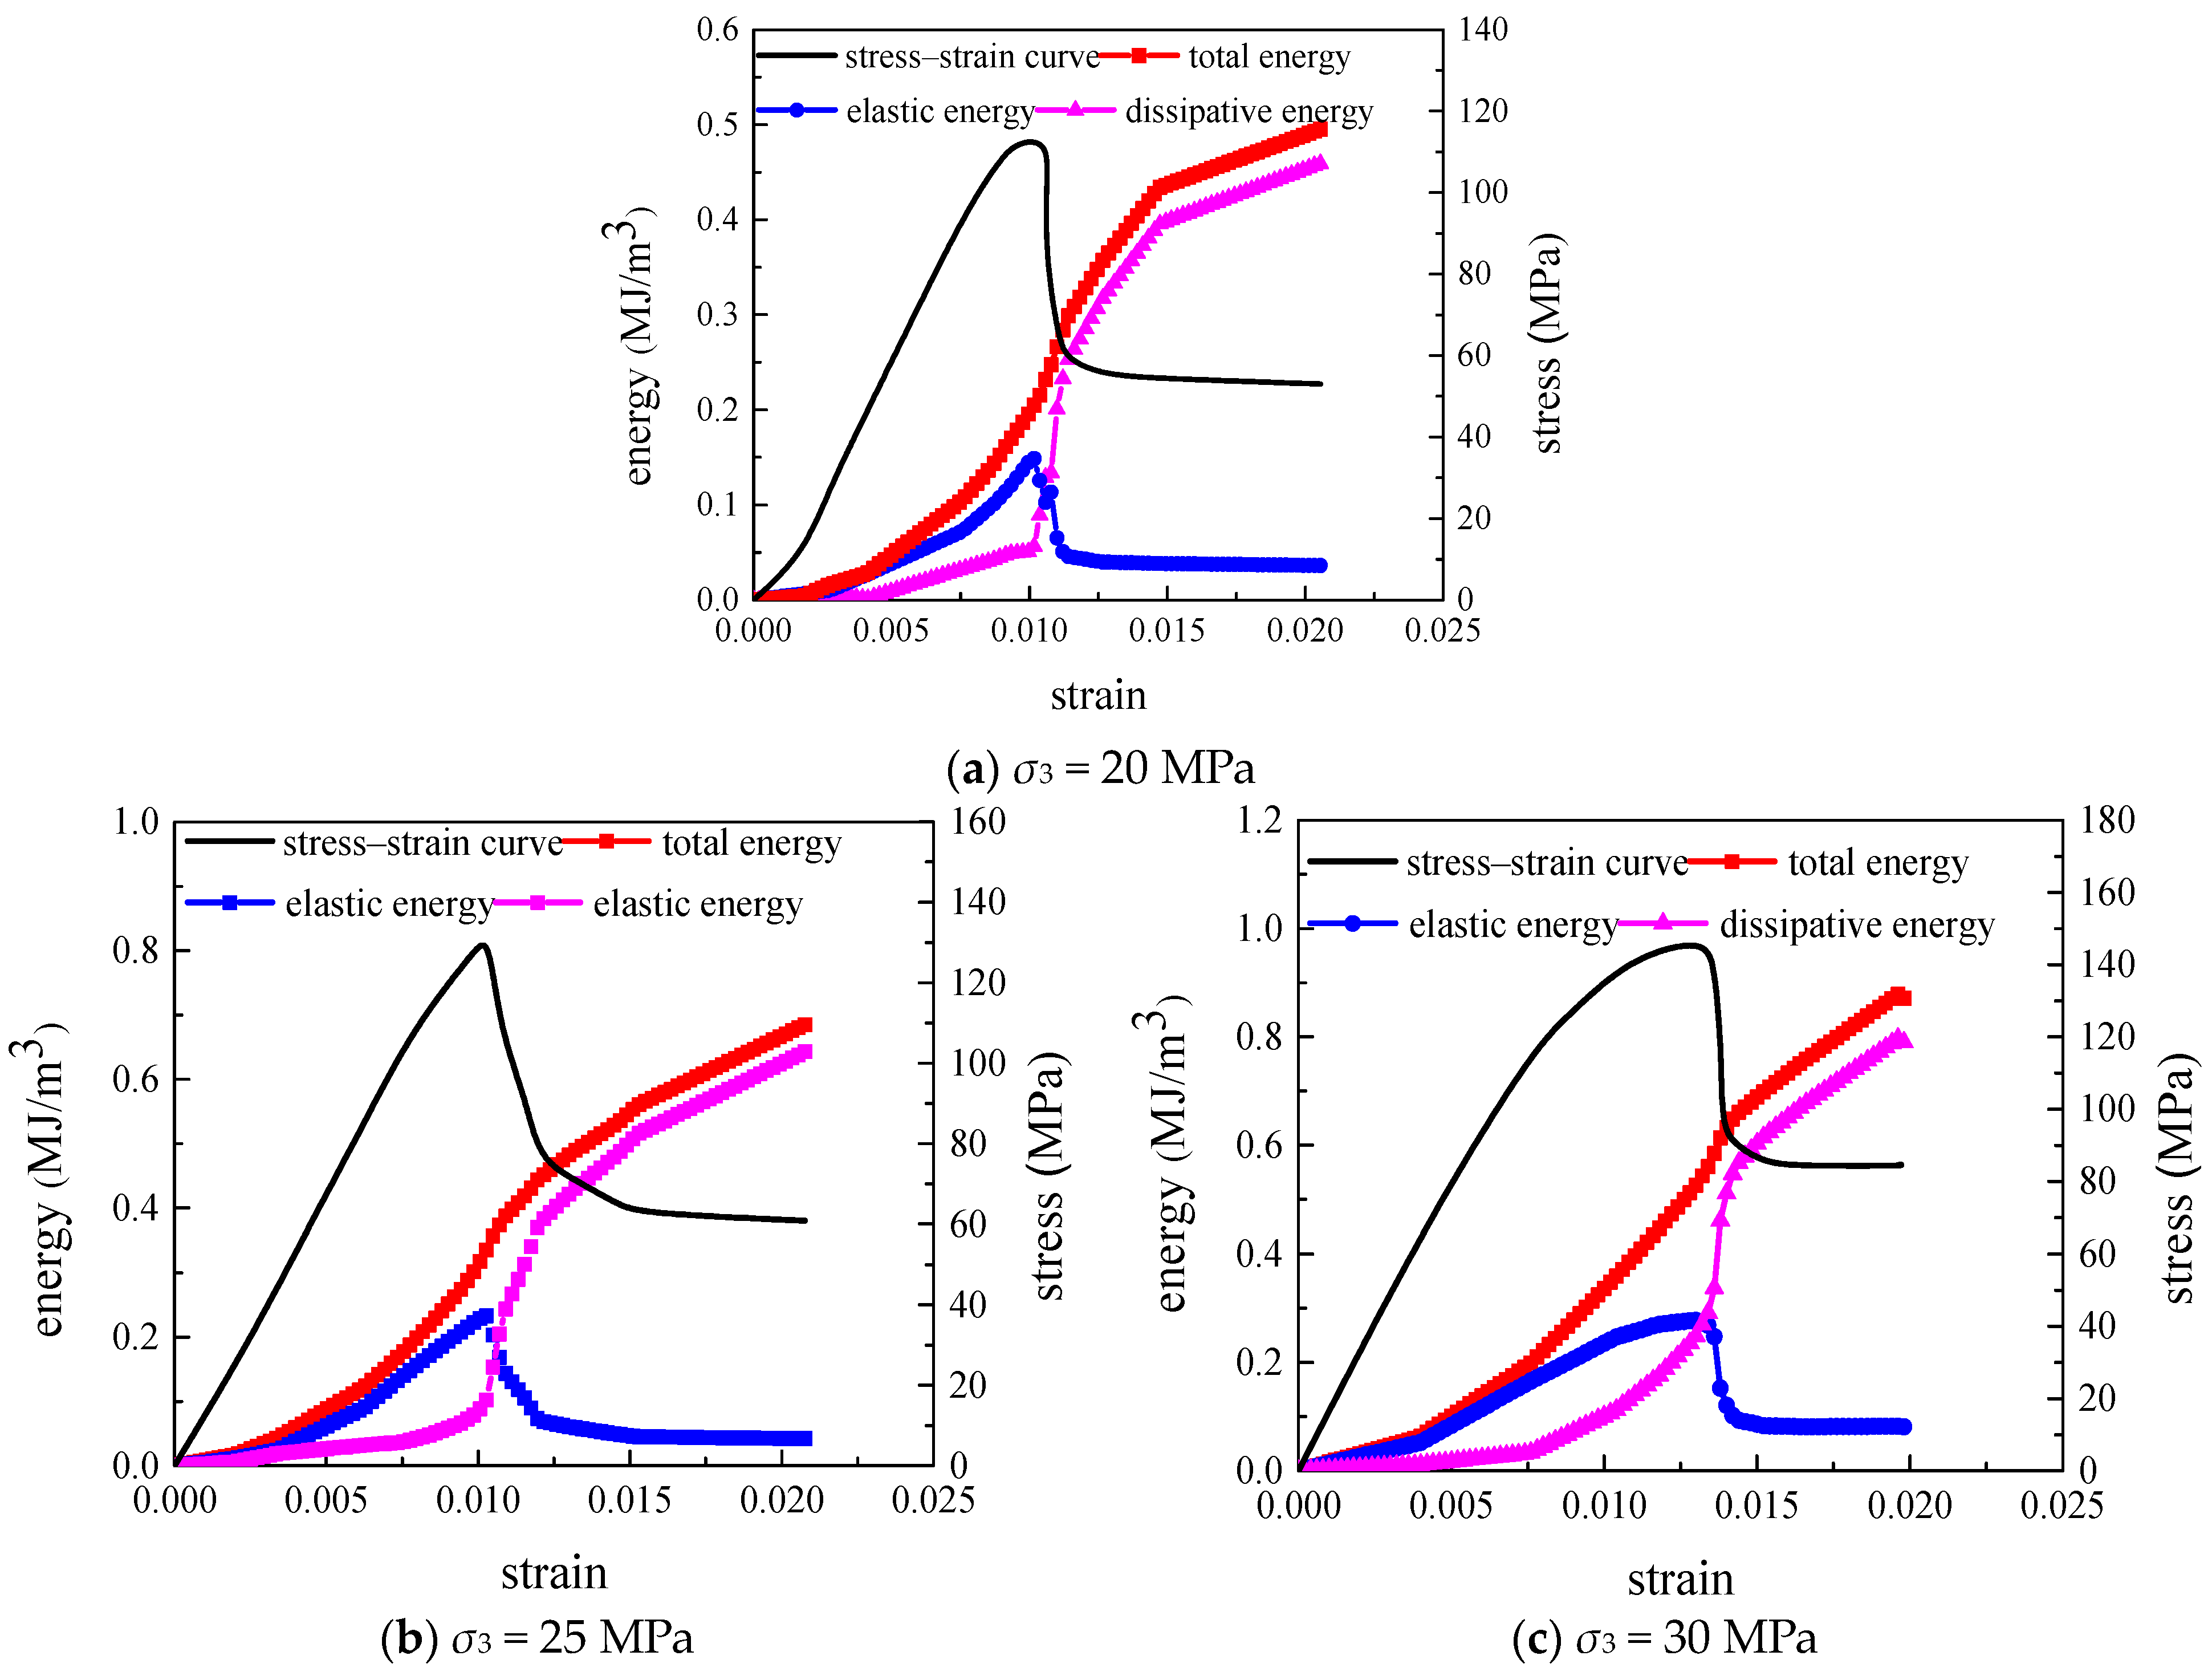
By utilizing the software Origin 9.0, the axial stress–strain and circumferential stress–strain data were individually integrated over their respective areas, producing new data as a result of the integration process. The total energy during the rock loading process was computed by summing the integrated data. First, the elastic modulus and Poisson’s ratio of the rock under different confining pressures were determined. The elastic energy of the rock during loading was then derived by inputting the axial stress–strain data, circumferential stress–strain data, elastic modulus, and Poisson’s ratio under various confining pressures into Equation (26).
Based on the energy calculation equation, the energy value for each component of the rock during the triaxial compression deformation test under the loading stress path was calculated. The energy evolution curve is shown in
Figure 6.
4. Model Validation and Parameter Identification
4.1. Parameter Identification
The model’s variables are determined according to the peak characteristics of the strain response plot [
23,
24]. The following conditions are met at the peak stress point: (1) When
σ1 =
σ1c, there exists
dσ/
dε = 0. (2) When
σ1 =
σ1c,
ε1 =
ε1c and
We =
Wec. From conditions (1) and (2), we obtain Equations (27)–(29).
According to condition (1), we obtain:
According to condition (2), we obtain:
By combining Equation (27)–(29), the following can be obtained:
Parameter C1 needs to be identified using the least-squares method. From a collection of model parameter initial values, C10 is assumed. Through the test, m groups of test values (σi, εi) can be confirmed. After establishing the initial model parameters, each σi is substituted into the stress–strain relationship to determine a preliminary theoretical value εi0.
By selecting the minimum square sum of the difference between the theoretical data and experimental data, the theoretical value can be as close to the experimental value as possible [
25].
The parameter determination method described above may lead to the excessive selection deviation of the initial parameters of the constitutive model, preventing the convergence of the iteration process. Therefore, the Levenberg–Marquardt algorithm is employed during the iterative process. The algorithm enhances the least-squares method by introducing a damping factor to prevent non-convergence during the iteration process. The parameter values of rock at the maximum point of the stress–strain curve under varying confining pressure conditions are presented in
Table 2.
The model parameter values are shown in
Table 3.
4.2. Model Validation
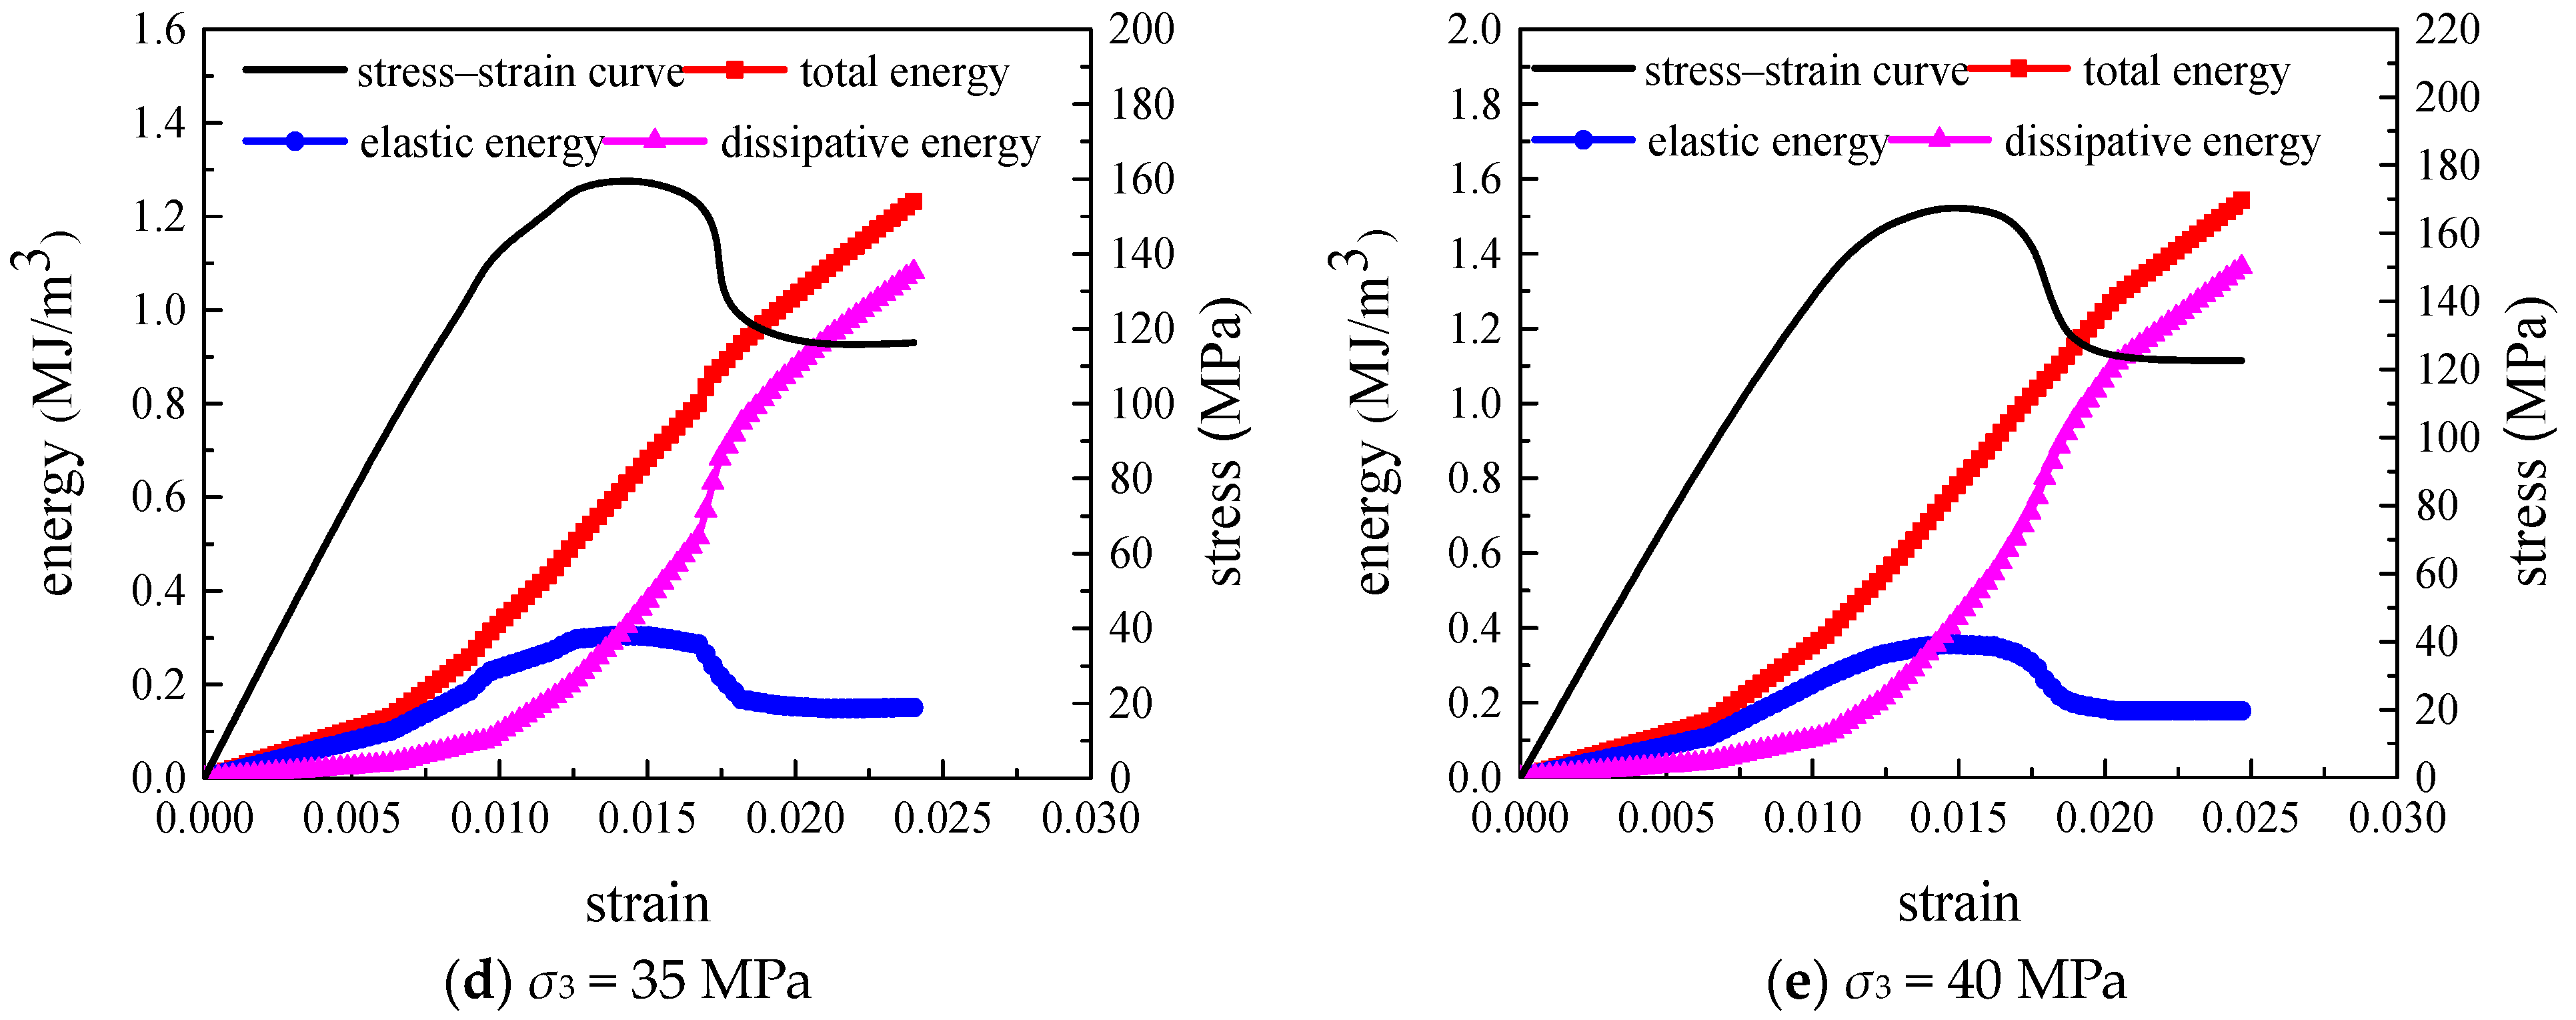
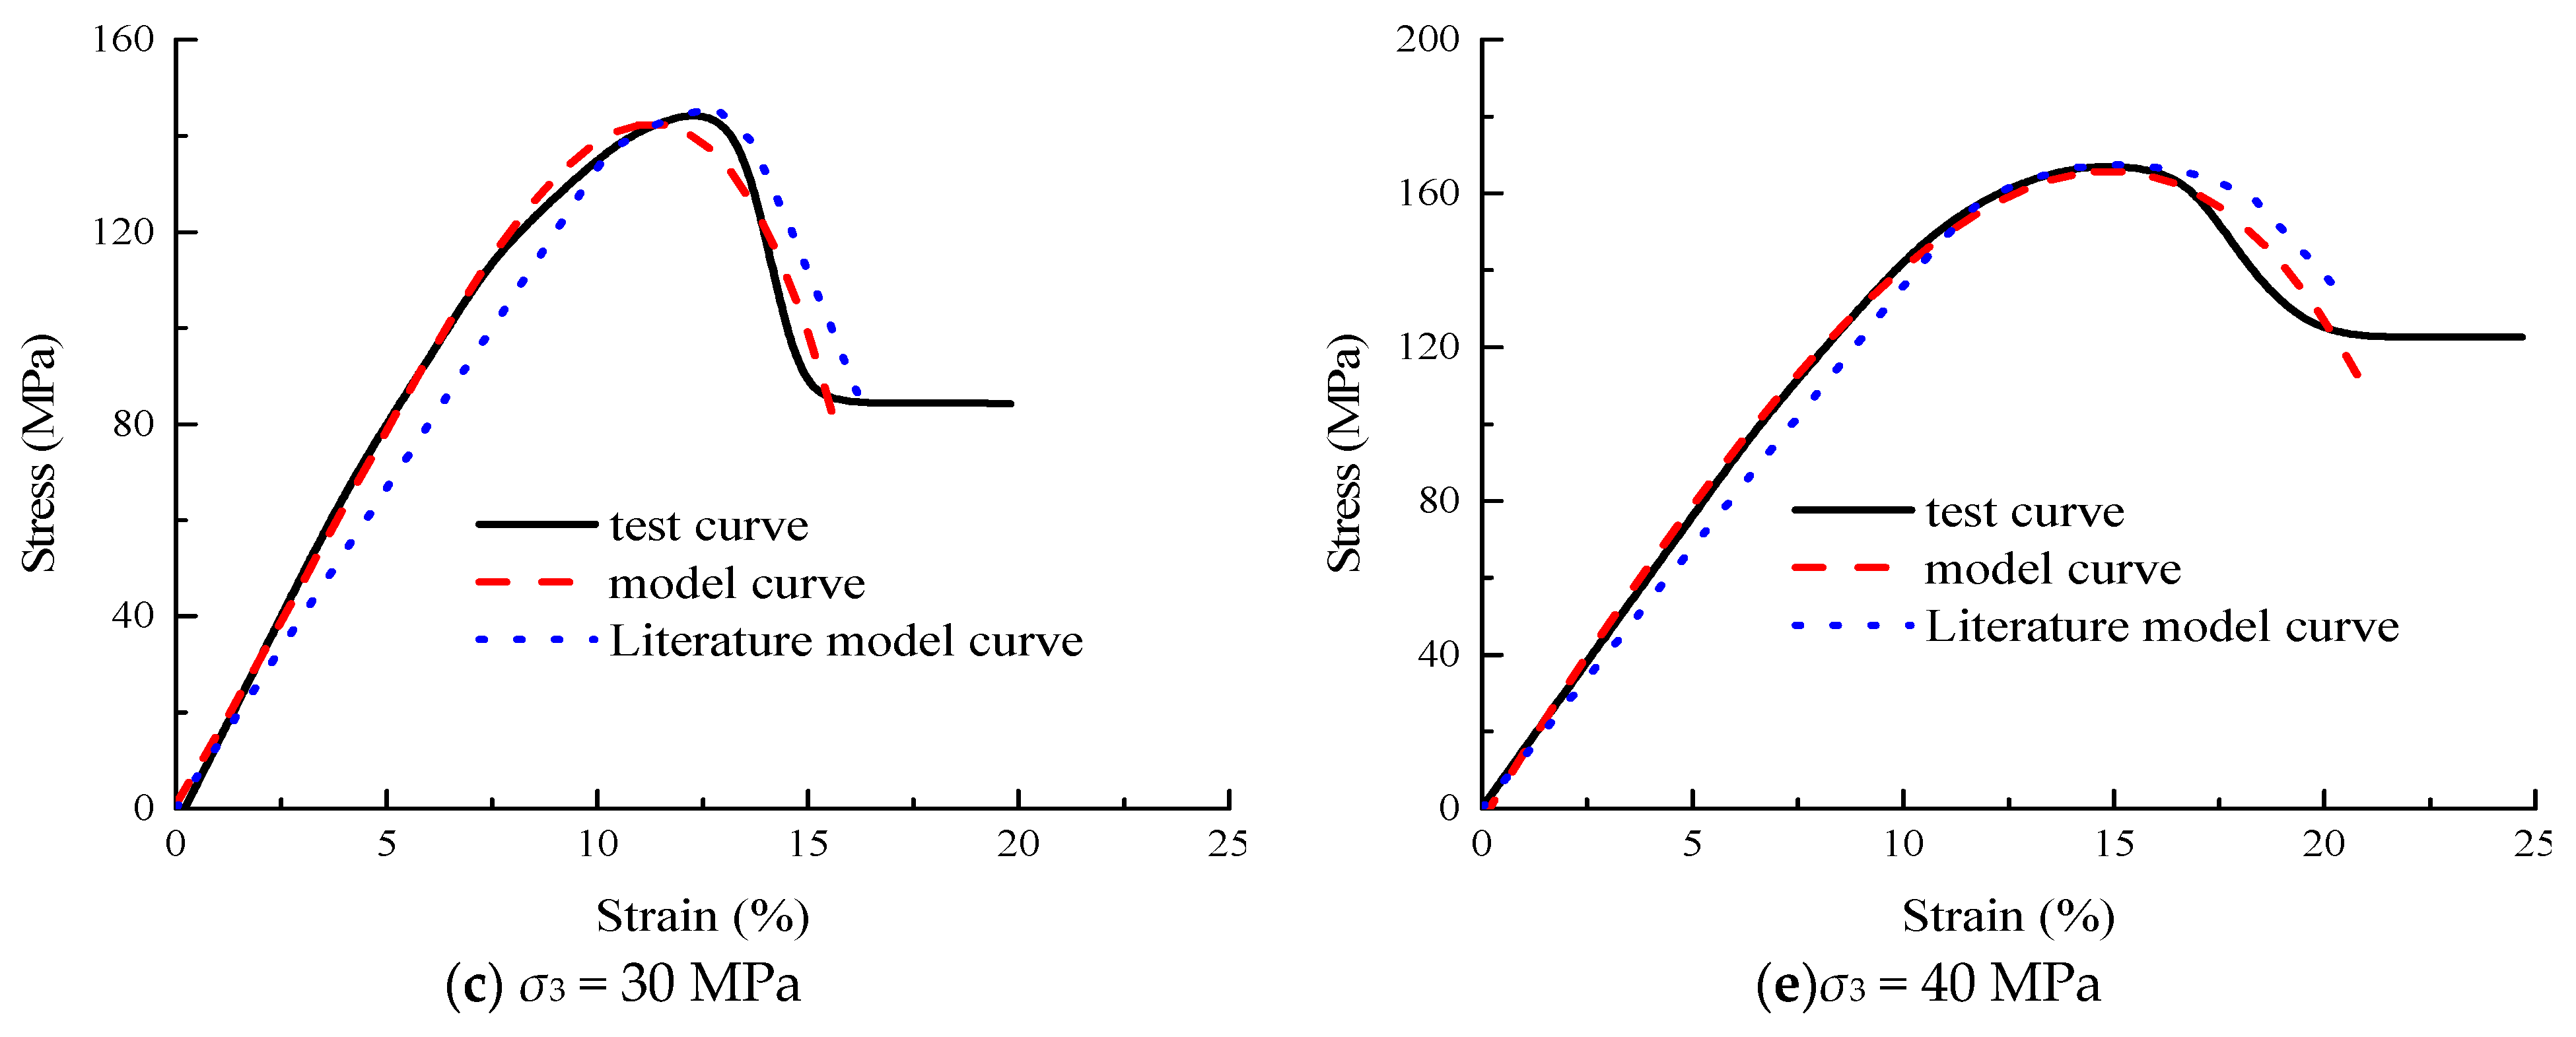
The model curve and test data are compared with the damage model in Reference [
26] for different confining pressure stress–strain curves, as shown in
Figure 7.
It can be seen from
Figure 7 that the agreement between the model established in this paper and the test curve is superior to that of the literature model and the test curve. Especially during the post-peak strain reduction phase, the model curve aligns more closely with the test curve. The stress–strain model demonstrates excellent fitting accuracy for rock samples with pronounced compaction characteristics. The fitting curve is basically consistent with the changing trend of the test curve. The correlation coefficients were all above 0.90. Therefore, the damage constitutive model based on the functional principle more accurately captures the stress–strain behavior of rock under varying radial pressures. This provides a theoretical foundation for practical engineering anchorage support.
A comparison between the load–strain relationship of marble and the model curve is shown in
Figure 8.
It is evident from
Figure 8 that the model also describes the strain response of marble well. The degree of agreement in the post-peak softening period is slightly low. The overall agreement is more than 0.90. It also shows that the model can be applied to the prediction and description of the load–strain relationship of various rocks.
4.3. Energy Model Validation
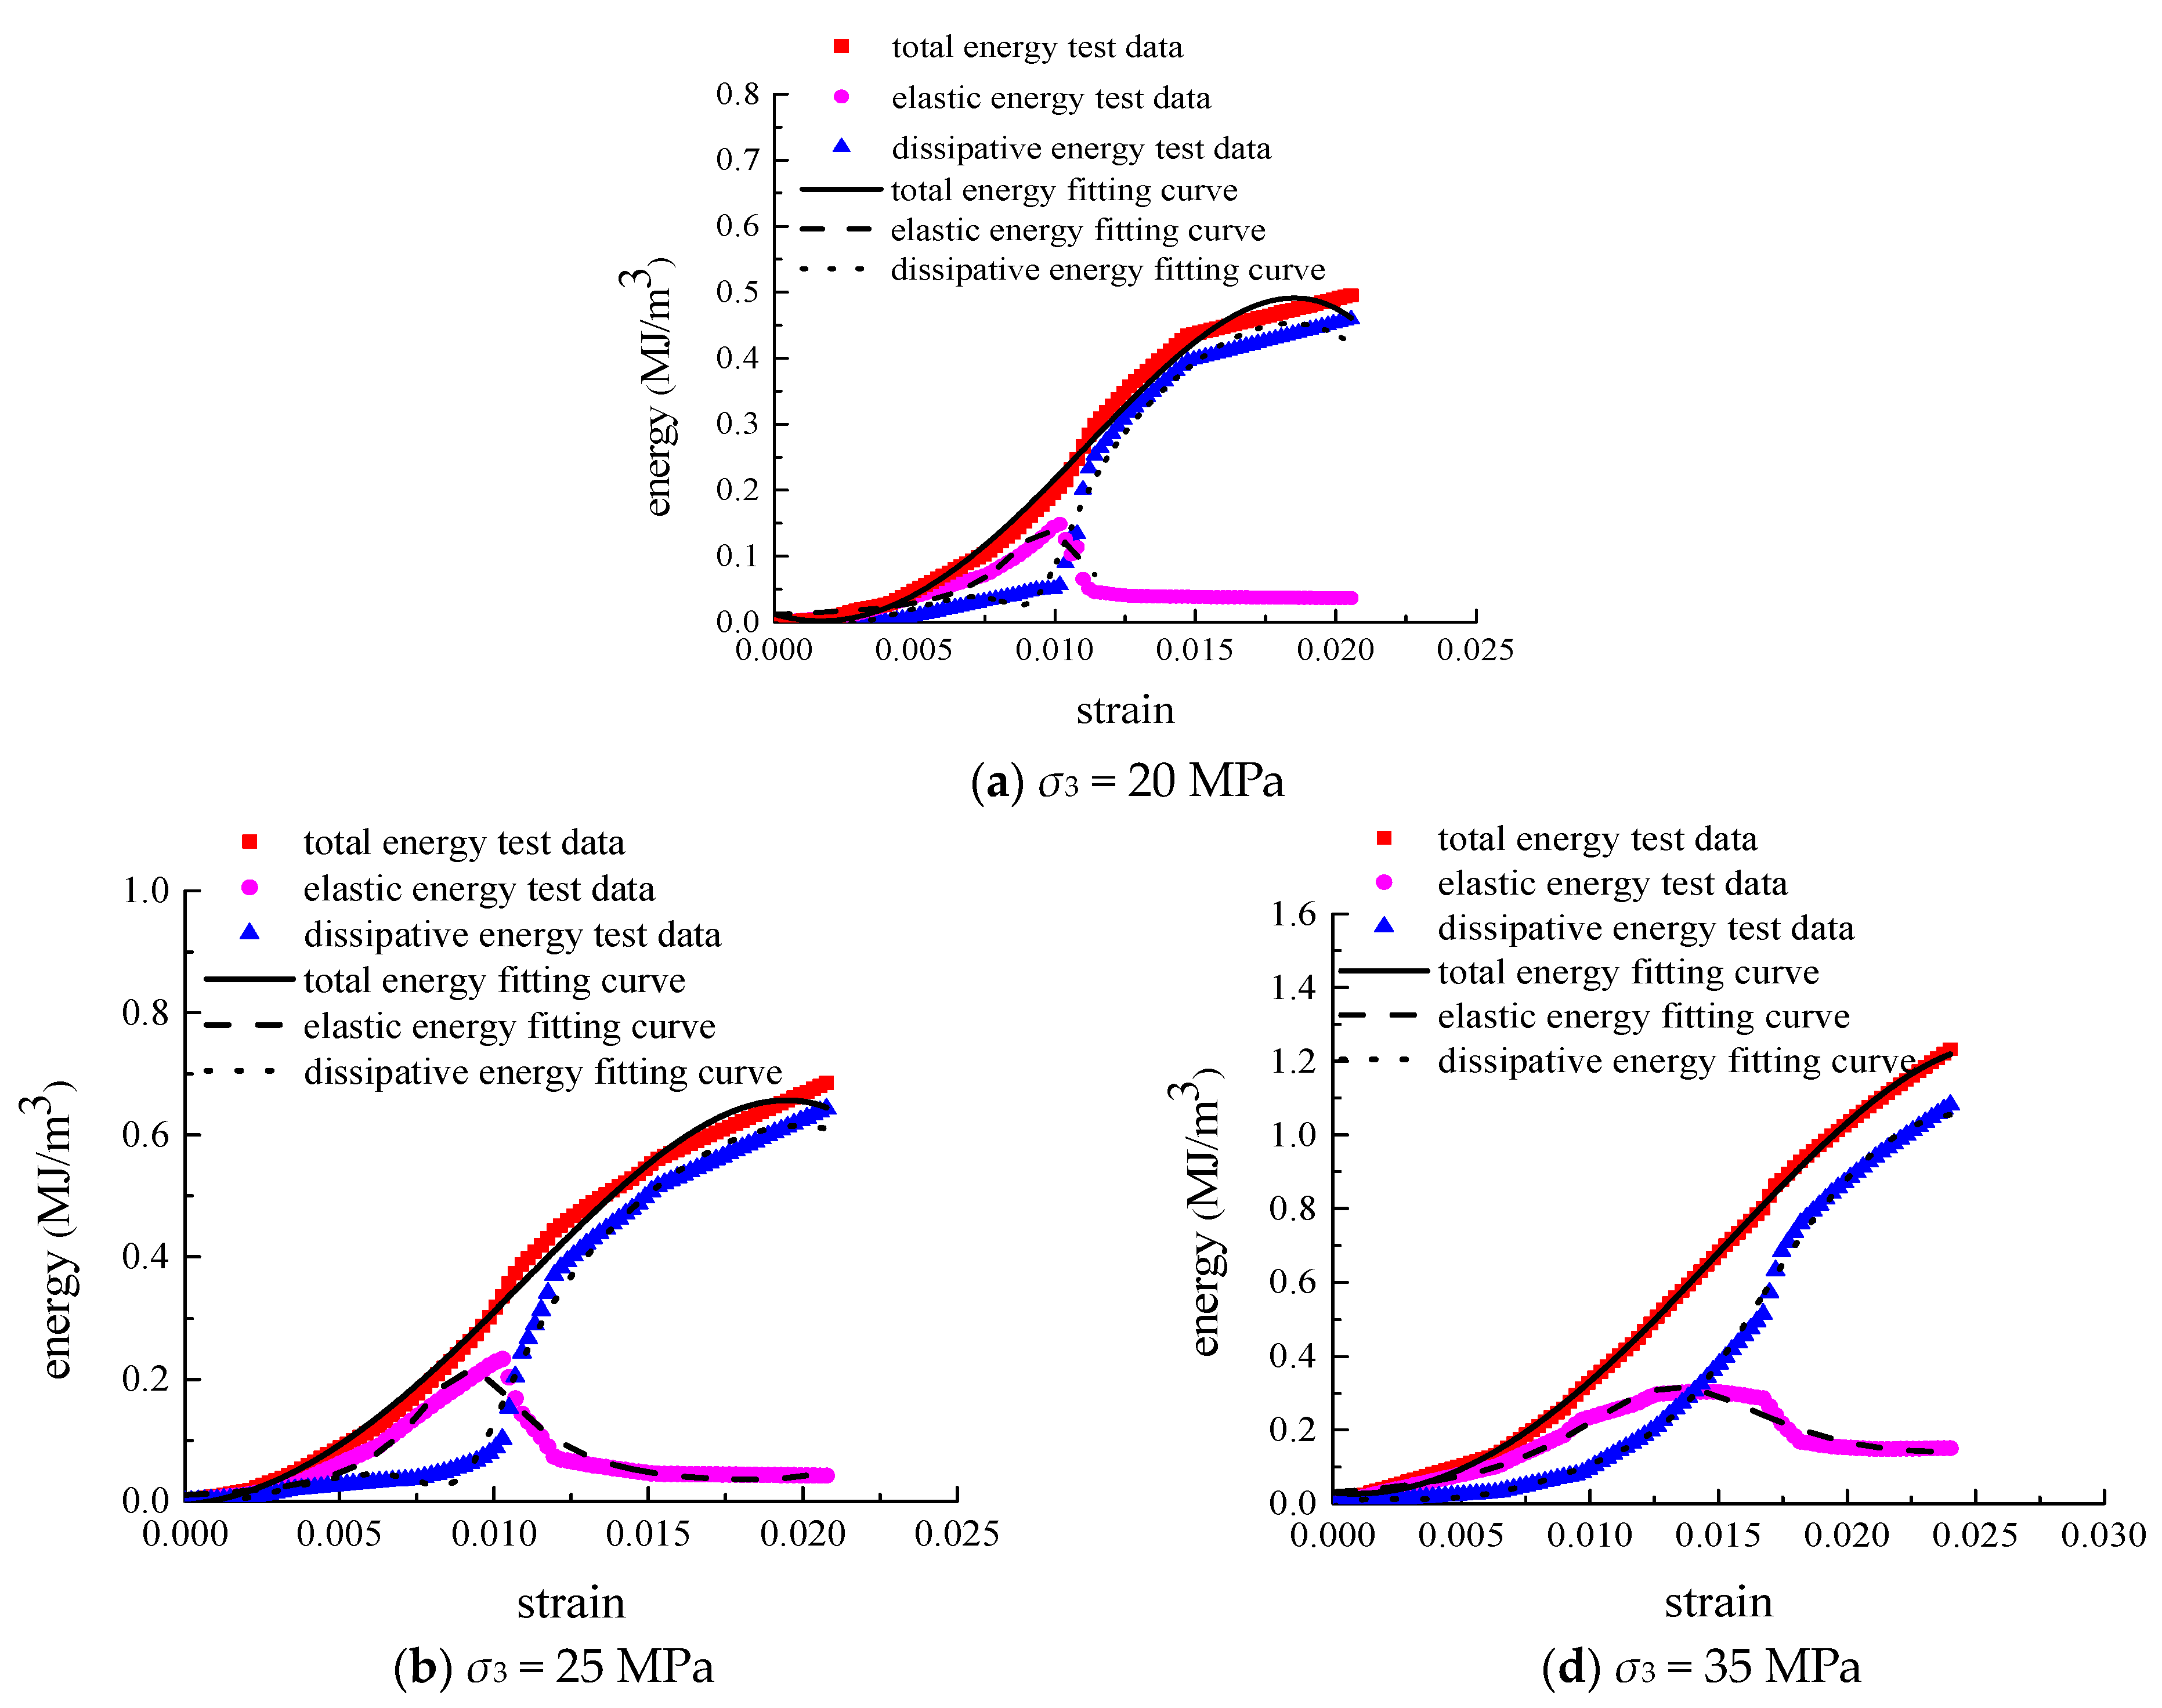
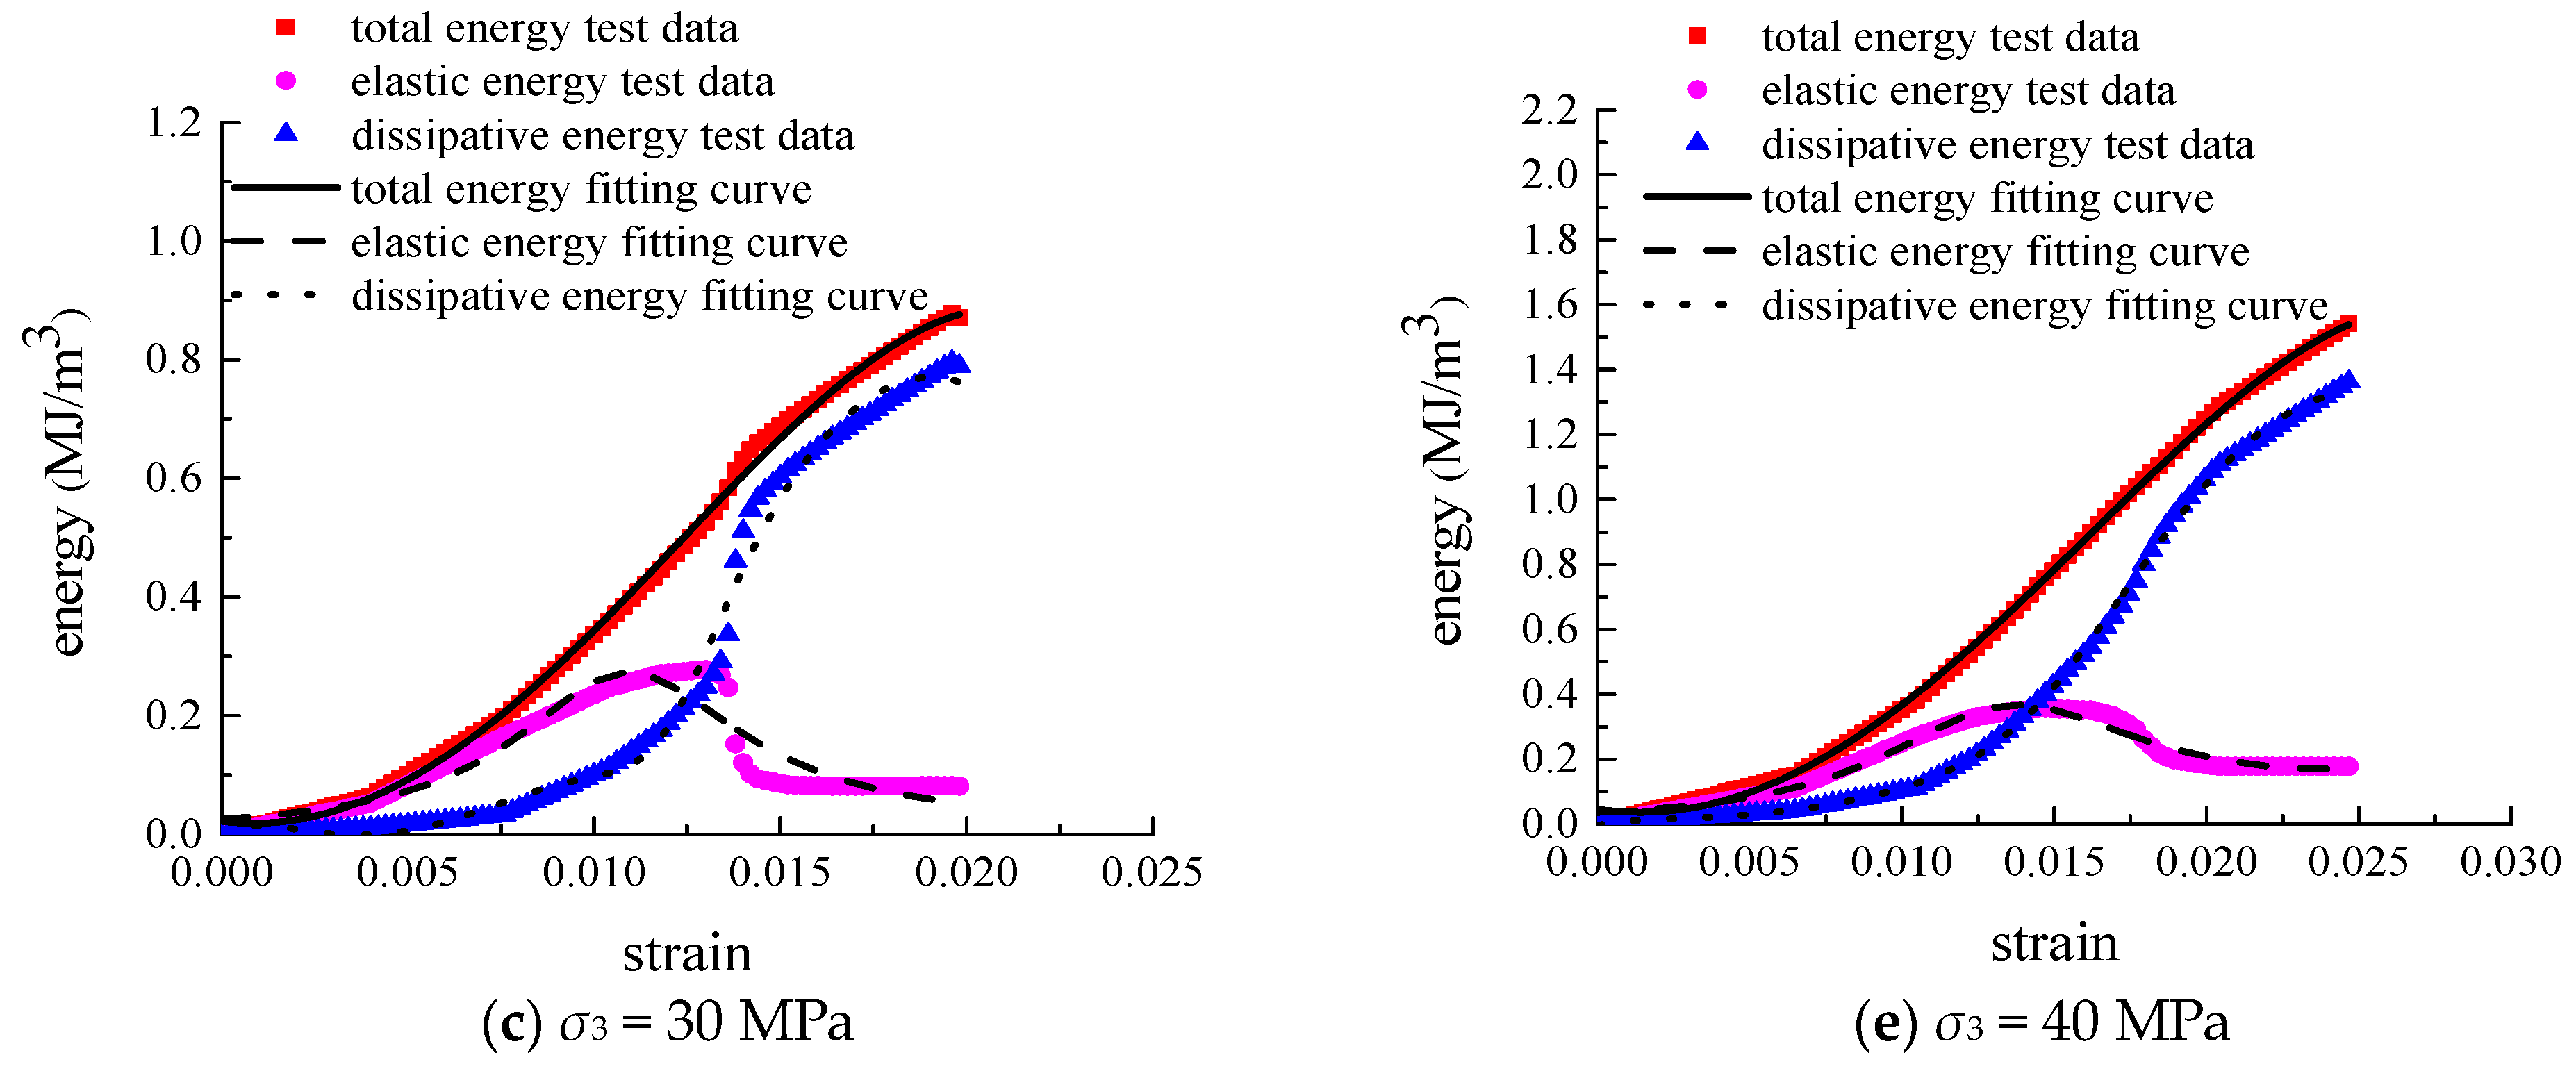
To more thoroughly verify the accuracy and reasonableness of the model developed within this document, the energy model curve was compared with the test data across various confining pressure load–strain relationships, as illustrated in
Figure 9. Combined with the load–strain data of rock in different scenarios, the damage model parameters under this condition were determined. By substituting the obtained damage model parameters into the formulation, the formulation curve was obtained.
As illustrated in
Figure 9, the theoretical energy curve demonstrates a high correlation with the experimental data. It is verified that the energy–strain model proposed in this paper is both reliable and reasonable. The correlation coefficients of the total energy–strain model, elastic energy–strain model, and dissipated energy–strain model with the test curves are all above 0.90. However, the level of agreement between the model curve and the test data is lower under low radial pressure compared to high radial pressure. Therefore, this method provides a novel approach to establishing an energy–strain curve model and also lays a theoretical foundation for later numerical calculations.
In the pre-peak stage, the elastic energy model curve shows a strong fit with the experimental data. However, the elastic energy model fails to accurately capture the variation in the post-peak curve. This indicates that the elastic energy model more closely represents the actual deformation and failure evolution behavior of the surrounding rock. The established model provides a better reflection of the relationship between elastic energy and rock strain. However, the total energy and dissipation energy models offer a more accurate description of the overall change pattern.
4.4. Sensitivity Analysis of Model Parameters
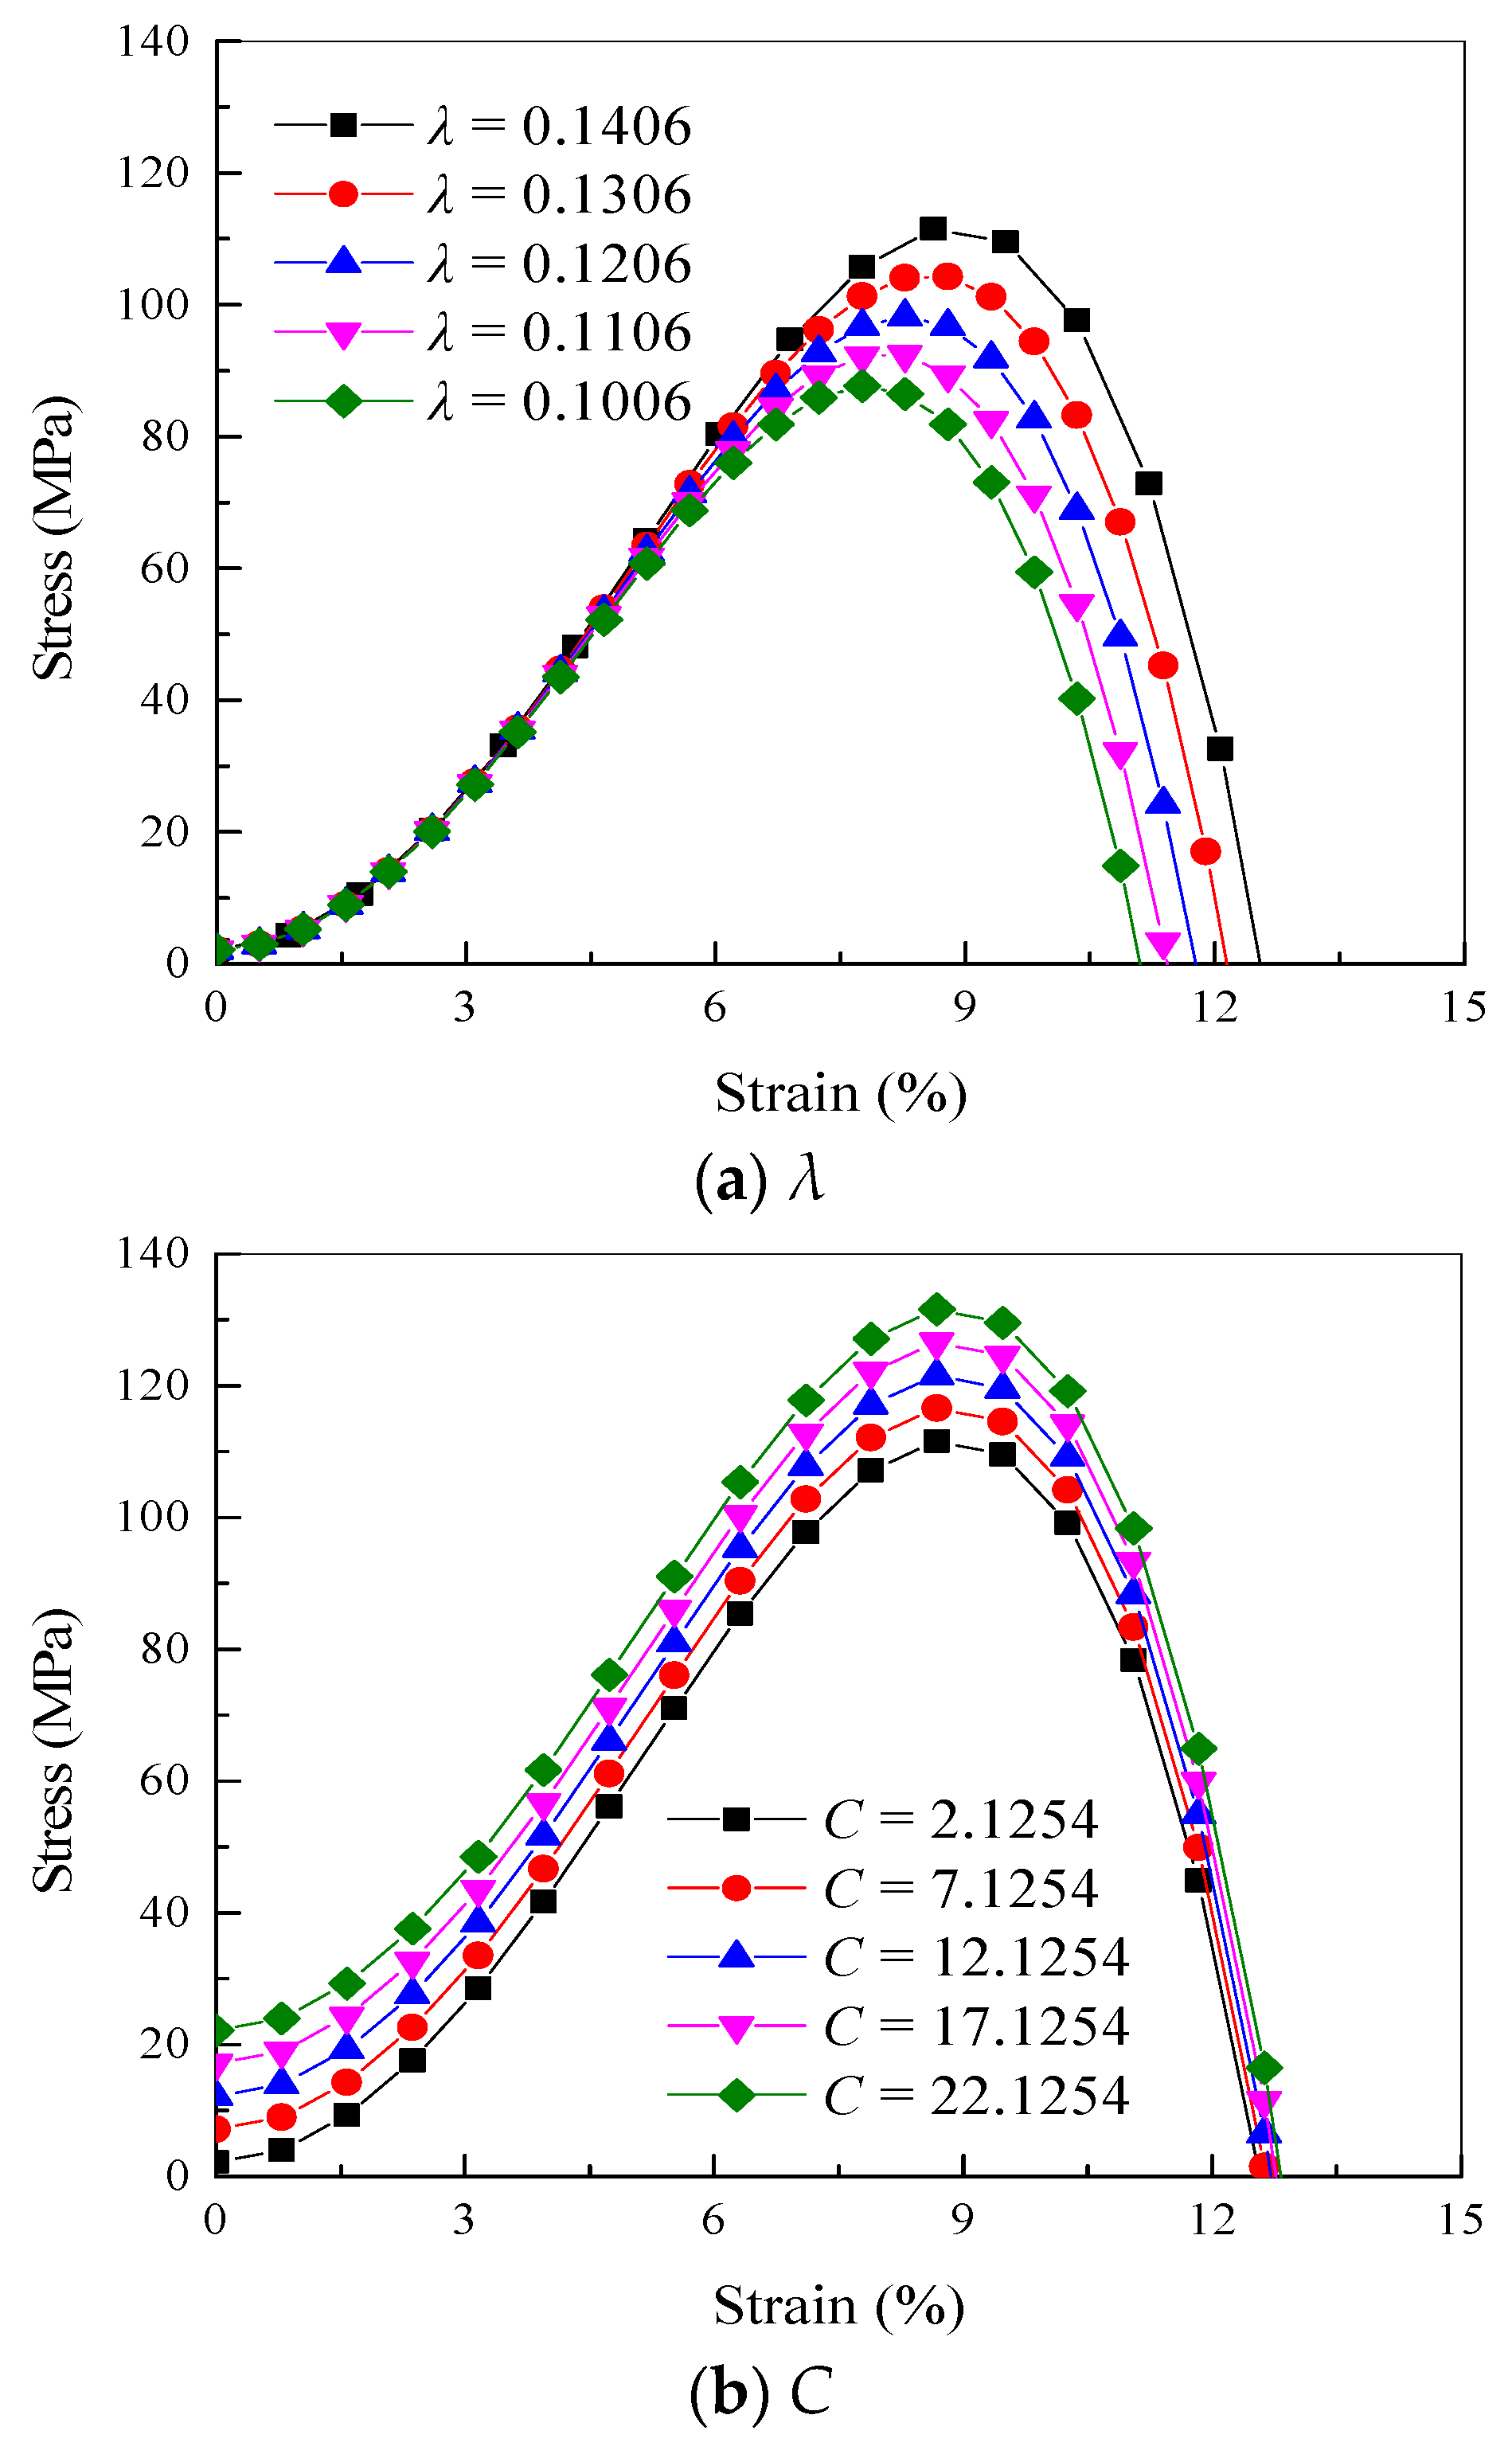
The stress–strain curves of the rock under various parameters are presented in
Figure 10 [
27].
It can be observed from
Figure 10 that, with the increase in parameter
λ, the pre-peak stress–strain curves of the rock under different radial pressures are generally well-fitted. However, the stress–strain curve deviates considerably in the post-peak strain softening stage, and the peak strength of the rock increases with the increase in parameter
λ. This indicates that parameter λ effectively captures the peak strength of the rock. With the increase in parameter
C, the stress–strain curves of the post-peak strain softening stage of rock under varying confining pressures are basically fitted. However, the pre-peak stress–strain curve of the rock deviates considerably, and the initial value and peak strength of the stress–strain curve increase with the increase in parameter
C. This shows that parameter
λ can reflect the peak strength of rock and the initial value of the stress–strain curve.
5. Discussion
In a loaded rock system, energy conversion can be broadly categorized into four processes: energy input, energy accumulation, energy dissipation, and energy release. There are two main mechanisms for energy-driven rock deformation and failure. On one hand, the external energy input leads to energy dissipation processes, such as damage and plastic deformation within the rock, which weaken its resistance to further damage. On the other hand, the rise in the elastic energy accumulated in the rock enhances the energy available for overall failure, thereby increasing the driving force behind rock failure.
The energy conversion process is controlled by strain-hardening and strain-softening mechanisms. During the strain-hardening phase, external energy applied to the rock system is converted into strain energy within the rock. Conversely, the strain-softening mechanism transforms the stored strain energy into damage energy, heat, and other energy forms.
The deformation and failure of rock can be explained by energy conservation theory in three stages. The first stage is the energy storage accumulation stage. A rock fracture develops through the compaction stage, linear elastic stage, and stable fracture development stage. At this stage, the energy is converted from the work carried out by the external load to the elastic property. The second phase is the energy dissipation stage, which roughly aligns with the un-stable rupture stage. This phase is primarily characterized by the transformation of elastic energy into damage dissipation energy. The third phase is the energy release stage, corresponding to the post-peak softening phase, during which a substantial amount of elastic energy is released and converted into the surface energy and kinetic energy of the fragments. It is important to note that the strain-hardening and strain-softening mechanisms coexist throughout the entire deformation and failure process of the rock. Before the peak, the strain-hardening mechanism dominates over strain-softening, resulting in observable strain-hardening and energy accumulation. However, after the peak, the strain-softening mechanism becomes more prominent than strain-hardening. The theory of rock energy evolution represents a novel area within rock mechanics with significant potential for practical applications. This article provides an initial exploration into the field, but many aspects remain under-explored and warrant further investigation. Future research on rock energy evolution should focus on several key areas, including the relationship between microscopic mechanisms and macroscopic mechanical behavior, the development of energy evolution constitutive theories, the stability of engineering rock masses, and the coupling of multiple energy fields.
6. Conclusions
The fit between the derived model and the experimental curve is superior to that of the literature model and the test curve. The correlation values of the models in this paper are all greater than 0.90. The correlation coefficient between the literature model and the test curve is less than 0.90. In particular, in the strain-softening phase following the peak, the model curve aligns more closely with the experimental curve. Therefore, the damage constitutive model based on the functional principle can better reflect the stress–strain variation in the rock under different confining pressures (20, 25, 30, 35, and 40 MPa).
The correlation coefficients of the total energy–strain model, elastic energy–strain model, and dissipated energy–strain model with the test curves are all above 0.90. However, the degree of agreement between the model curve and the test data is lower under low radial pressure compared to that under high radial pressure. Therefore, this method provides a novel approach to the establishment of energy–strain curve models and also lays a theoretical foundation for later numerical calculations.
The growth of pre-peak axial stress is in the range of 0.2~0. The driving mechanism of elastic energy, along with the dissipation mechanisms of dissipated energy, makes the accumulated energy inside the rock gradually reach the limit of energy storage, which forces the rock to undergo instability and failure. This shows that the transformation process of the energy inside the rock at this time causes the fracture to penetrate and form the fracture surface, changing the rock structure significantly. In summary, the law of energy evolution can be accurately described by the increase in the axial stress before the rock peak. This indicates that axial stress has a significant impact on the pre-peak energy.
The results show that the proposed model can accurately predict the mechanical behaviors of rock, such as pre-peak and post-peak strain softening, confining pressure effect, and energy evolution. The research results provide a theoretical reference and practical means for subsequent research on the construction of deep underground engineering from the perspective of energy. The model established in this paper has good identification ability for the whole process of deformation and failure in rocks in high-stress areas. However, this paper only proposes a constitutive relationship based on indoor test results. Due to the length and progress of research, there are no secondary developments or engineering applications in finite element software. In the future, our team will develop energy models for practical engineering applications.
Author Contributions
Conceptualization, H.L. and W.L.; methodology, X.Y.; validation, Y.Y.; formal analysis, X.Y. and Y.Y.; data curation, H.L. and W.L.; writing—original draft, H.L. and W.L.; writing—review and editing, H.L. and W.L.; project administration, H.L. All authors have read and agreed to the published version of the manuscript.
Funding
Hongmiao Lv is partially supported by Grant No. 2023JH2/101700003 of the Liaoning Province Science and Technology Plan Joint Program (Applied Basic Research Project), and Grant No. 2021BS011 of the Liaodong University Doctoral Research Initiation Fund Project.
Data Availability Statement
The data that support the findings of this study are available from the corresponding author upon reasonable request.
Conflicts of Interest
The authors declare no conflicts of interest.
References
- Chen, X.; He, P.; Qin, Z. Strength Weakening and energy mechanism of rocks subjected to wet–dry cycles. Geotech. Geol. Eng. 2019, 37, 3915–3923. [Google Scholar] [CrossRef]
- Li, D.; Sun, Z.; Xie, T.; Li, X.; Ranjith, P.G. Energy evolution characteristics of hard rock during triaxial failure with different loading and unloading paths. Eng. Geol. 2017, 228, 270–281. [Google Scholar] [CrossRef]
- Gong, F.; Yan, J.; Luo, S.; Li, X. Investigation on the linear energy storage and dissipation laws of rock materials under uniaxial compression. Rock Mech. Rock Eng. 2019, 52, 4237–4255. [Google Scholar] [CrossRef]
- Yan, Z.; Dai, F.; Zhu, J.; Xu, Y. Dynamic cracking behaviors and energy evolution of multi-flawed rocks under static pre-compression. Rock Mech. Rock Eng. 2021, 54, 5117–5139. [Google Scholar] [CrossRef]
- Zhao, K.; Yu, X.; Zhou, Y.; Wang, Q.; Wang, J.; Hao, J. Energy evolution of brittle granite under different loading rates. Int. J. Rock Mech. Min. Sci. 2020, 132, 104392. [Google Scholar] [CrossRef]
- Feng, P.; Xu, Y.; Dai, F. Effects of dynamic strain rate on the energy dissipation and fragment characteristics of cross-fissured rocks. Int. J. Rock Mech. Min. Sci. 2021, 138, 104600. [Google Scholar] [CrossRef]
- Masoumi, H.; Horne, J.; Timms, W. Establishing empirical relationships for the effects of water content on the mechanical behavior of Gosford sandstone. Rock Mech. Rock Eng. 2017, 50, 2235–2242. [Google Scholar] [CrossRef]
- Zhang, Z.; Liu, X.; Cheng, L.; Wu, S.; Zhang, B. A rheological constitutive model for damaged zone evolution of a tunnel considering strain hardening and softening. Geomech. Geophys. Geo-Energy Geo-Resour. 2020, 6, 1–17. [Google Scholar] [CrossRef]
- Zheng, Z.; Xu, H.; Zhang, K.; Feng, G.; Zhang, Q.; Zhao, Y. Intermittent disturbance mechanical behavior and fractional deterioration mechanical model of rock under complex true triaxial stress paths. Int. J. Min. Sci. Technol. 2024, 34, 117–136. [Google Scholar] [CrossRef]
- Gong, F.; Yan, J.; Wang, Y.; Luo, S. Experimental study on energy evolution and storage performances of rock material under uniaxial cyclic compression. Shock. Vib. 2020, 2020, 8842863. [Google Scholar] [CrossRef]
- Chen, Z.; He, C.; Ma, G.; Xu, G.; Ma, C. Energy damage evolution mechanism of rock and its application to brittleness evaluation. Rock Mech. Rock Eng. 2019, 52, 1265–1274. [Google Scholar] [CrossRef]
- Wang, P.; Xu, J.; Fang, X.; Wang, P. Energy dissipation and damage evolution analyses for the dynamic compression failure process of red-sandstone after freeze-thaw cycles. Eng. Geol. 2017, 221, 104–113. [Google Scholar] [CrossRef]
- Zhao, Z.; Ma, W.; Fu, X.; Yuan, J. Energy theory and application of rocks. Arab. J. Geosci. 2019, 12, 474. [Google Scholar] [CrossRef]
- Zhou, T.; Qin, Y.; Ma, Q.; Liu, J. A constitutive model for rock based on energy dissipation and transformation principles. Arab. J. Geosci. 2019, 12, 492. [Google Scholar] [CrossRef]
- Xi, Y.; Li, J.; Zeng, Y.; Ding, S.; Jiang, T. Research on Lateral Scale Effect and Constitutive Model of Rock Damage Energy Evolution. Geotech. Geol. Eng. 2018, 36, 2415–2424. [Google Scholar]
- Ning, J.; Wang, J.; Jiang, J.; Hu, S.; Jiang, L.; Liu, X. Estimation of crack initiation and propagation thresholds of confined brittle coal specimens based on energy dissipation theory. Rock Mech. Rock Eng. 2018, 51, 119–134. [Google Scholar] [CrossRef]
- Liu, W.; Zhou, H.; Zhang, S.; Jiang, S.; Yang, L. A nonlinear creep model for surrounding rocks of tunnels based on kinetic energy theorem. J. Rock Mech. Geotech. Eng. 2023, 15, 363–374. [Google Scholar] [CrossRef]
- Zhang, Q.; Liang, Y.; Fan, X.; Li, G.; Li, W.; Yang, B.; Tong, M. A modified Nishihara model based on the law of the conservation of energy and experimental verification. J. Chongqing Univ. 2016, 39, 117–124. (In Chinese) [Google Scholar]
- Sun, M.; Xu, W.; Wang, S.; Wang, R.; Wang, W. Study on damage constitutive model of rock based on principle of minimum dissipative energy. J. Cent. South Univ. (Sci. Technol.) 2018, 49, 2067–2075. [Google Scholar]
- Du, R.; Pei, X.; Jia, J.; Zhang, X.; Gao, M.; Li, T.; Zhang, G. A novel observation method for determining the crack stress thresholds of rock based on Hooke’s law. Fatigue Fract. Eng. Mater. Struct. 2020, 43, 3050–3062. [Google Scholar] [CrossRef]
- Liu, W. Study on the Constitutive Model and Rheological Properties of Sandstone Damage under High Stress. Ph.D. Thesis, Liaoning Technical University, Fuxin, China, 2020. [Google Scholar]
- Xie, H.; Ju, Y.; Li, L. Criteria for strength and structural failure of rocks based on energy dissipation and energy release principles. Chin. J. Rock Mech. Eng. 2005, 24, 3003–3010. [Google Scholar]
- Chen, S.; Qiao, C.; Ye, Q.; Khan, M.U. Comparative study on three-dimensional statistical damage constitutive modified model of rock based on power function and Weibull distribution. Environ. Earth Sci. 2018, 77, 108. [Google Scholar] [CrossRef]
- Zhao, H.; Shi, C.; Zhao, M.; Li, X. Statistical damage constitutive model for rocks considering residual strength. Int. J. Geomech. 2017, 17, 04016033. [Google Scholar] [CrossRef]
- Li, Q. Curve fitting method for creep parameter of soft rock. Chin. J. Rock Mech. Eng. 1998, 17, 559–564. (In Chinese) [Google Scholar]
- Wang, J.; Song, Z.; Zhao, B.; Liu, X.; Liu, J.; Lai, J. A study on the mechanical behavior and statistical damage constitutive model of sandstone. Arab. J. Sci. Eng. 2018, 43, 5179–5192. [Google Scholar] [CrossRef]
- Huang, S.; Liu, Q.; Cheng, A.; Liu, Y. A statistical damage constitutive model under freeze-thaw and loading for rock and its engineering application. Cold Reg. Sci. Technol. 2018, 145, 142–150. [Google Scholar] [CrossRef]
| Disclaimer/Publisher’s Note: The statements, opinions and data contained in all publications are solely those of the individual author(s) and contributor(s) and not of MDPI and/or the editor(s). MDPI and/or the editor(s) disclaim responsibility for any injury to people or property resulting from any ideas, methods, instructions or products referred to in the content. |
© 2024 by the authors. Licensee MDPI, Basel, Switzerland. This article is an open access article distributed under the terms and conditions of the Creative Commons Attribution (CC BY) license (https://creativecommons.org/licenses/by/4.0/).


