Article

Positional Effects of a Fly’s Wing Vein in the Asymmetric Distribution of Hydraulic Resistances

1
Graduate School of Science and Engineering, Toyo University, Kujirai 2100, Kawagoe 350-8585, Saitama, Japan
2
Faculty of Science and Engineering, Toyo University, Kujirai 2100, Kawagoe 350-8585, Saitama, Japan
*
Author to whom correspondence should be addressed.
Symmetry 2024, 16(9), 1212; https://doi.org/10.3390/sym16091212
Submission received: 8 August 2024 / Revised: 13 September 2024 / Accepted: 13 September 2024 / Published: 15 September 2024
(This article belongs to the Special Issue Symmetry in Biomechanics)

Abstract

:
Insect wing vein networks facilitate blood transport with unknown haemodynamic effects on their structures. Fruit flies have the posterior cross vein (PCV) that disrupts the symmetry of the network topology and reduces the total pressure loss during blood transport; however, the impact of its various positions among species has not been examined. This study investigated the haemodynamic effects of this vein with various connecting positions. By analogising venous networks to hydraulic circuits, the flow rates and pressure losses within the veins were derived using Poiseuille’s and Kirchhoff’s laws. The results showed that the total pressure loss decreased for both PCV connections near the wing’s base. In an idealised circuit imitating the network topology, applied high hydraulic resistances as one-sided as those along the edge of the wing, the same pressure loss response as that in the actual network was demonstrated, but not within a symmetric resistance distribution. Therefore, the most proximal PCV minimises the pressure loss within the asymmetric resistance distribution, indicating an evolutionary adaptation to reducing the pressure loss in certain species with this vein near the base. Our findings highlight the possible optimisation of the flies’ wing morphology to maintain the functions of the liquid transport networks and flight devices simultaneously.

1. Introduction

Insect wing veins form networks responsible for transporting insect blood haemolymph. Haemolymph typically flows into the anterior veins and exits from the posterior veins at the wing’s base [1,2,3]. In numerous holometabolous insects, including flies, haemolymph flow is facilitated by pulsatile organs in the thoracic region, commonly referred to as wing hearts [2,4]. Wing veins can be modelled as conduits or hydraulic resistors forming a microfluidic circuit, where the hydraulic resistances are inversely proportional to the fourth power of the diameter and proportional to the length under Poiseuille’s law [5,6]. The distribution of the hydraulic resistance determines the flow rate and pressure loss in every vein and the combined resistance of the entire vein network. From an engineering viewpoint, the reduction in the combined resistance contributes to low power consumption owing to frictional losses of the internal haemolymph flow. A previous study [7] has suggested that the vein diameters in butterflies and moths should be adjusted to minimise the total power consumption owing to pressure loss and metabolic activities. However, the influence of wing vein network’s morphology on the physical aspects of haemolymph flow is not extensively understood.
Typical insect wings exhibit an asymmetry in vein morphology in a network with small diameters along the wing’s edge and large ones along the base. Hydraulic resistances are high along the edge and low along the base, as seen in the fruit fly species Drosophila melanogaster (Figure 1a) [8]. Adjusting the flow rate distribution across the network according to its resistance distribution can suppress the entire friction loss. The presence of the posterior cross vein (PCV) in fruit fly wings (red caption in Figure 1) reduces the total pressure loss between the network inlet and outlet during haemolymph transportation [8], thus functioning as a parallel hydraulic resistor for the edge and base veins with the highest resistance, causing part of the haemolymph to bypass and flow into the PCV. This vein is located closer to the wing’s base in species phylogenetically close to D. melanogaster compared to other species [9]; however, the engineering implications of its positions are unknown.
In this study, we hypothesised that the position of the PCV might be evolutionarily adjusted to reduce pressure loss in the vein network with an asymmetric resistance distribution. The total pressure loss was examined at various positions of the PCV connections in the wing vein network of fruit flies. The haemolymph flow within the venous network was numerically simulated using circuit analysis methods based on the circuit analogy of wing vein networks to obviate the physical manipulation of wing veins in living insects. In the idealised fluidic circuit, partially imitating the network topology of the actual vein network, the influence of the asymmetrical resistance distribution on the positional effects of the PCV was demonstrated.

2. Materials and Methods

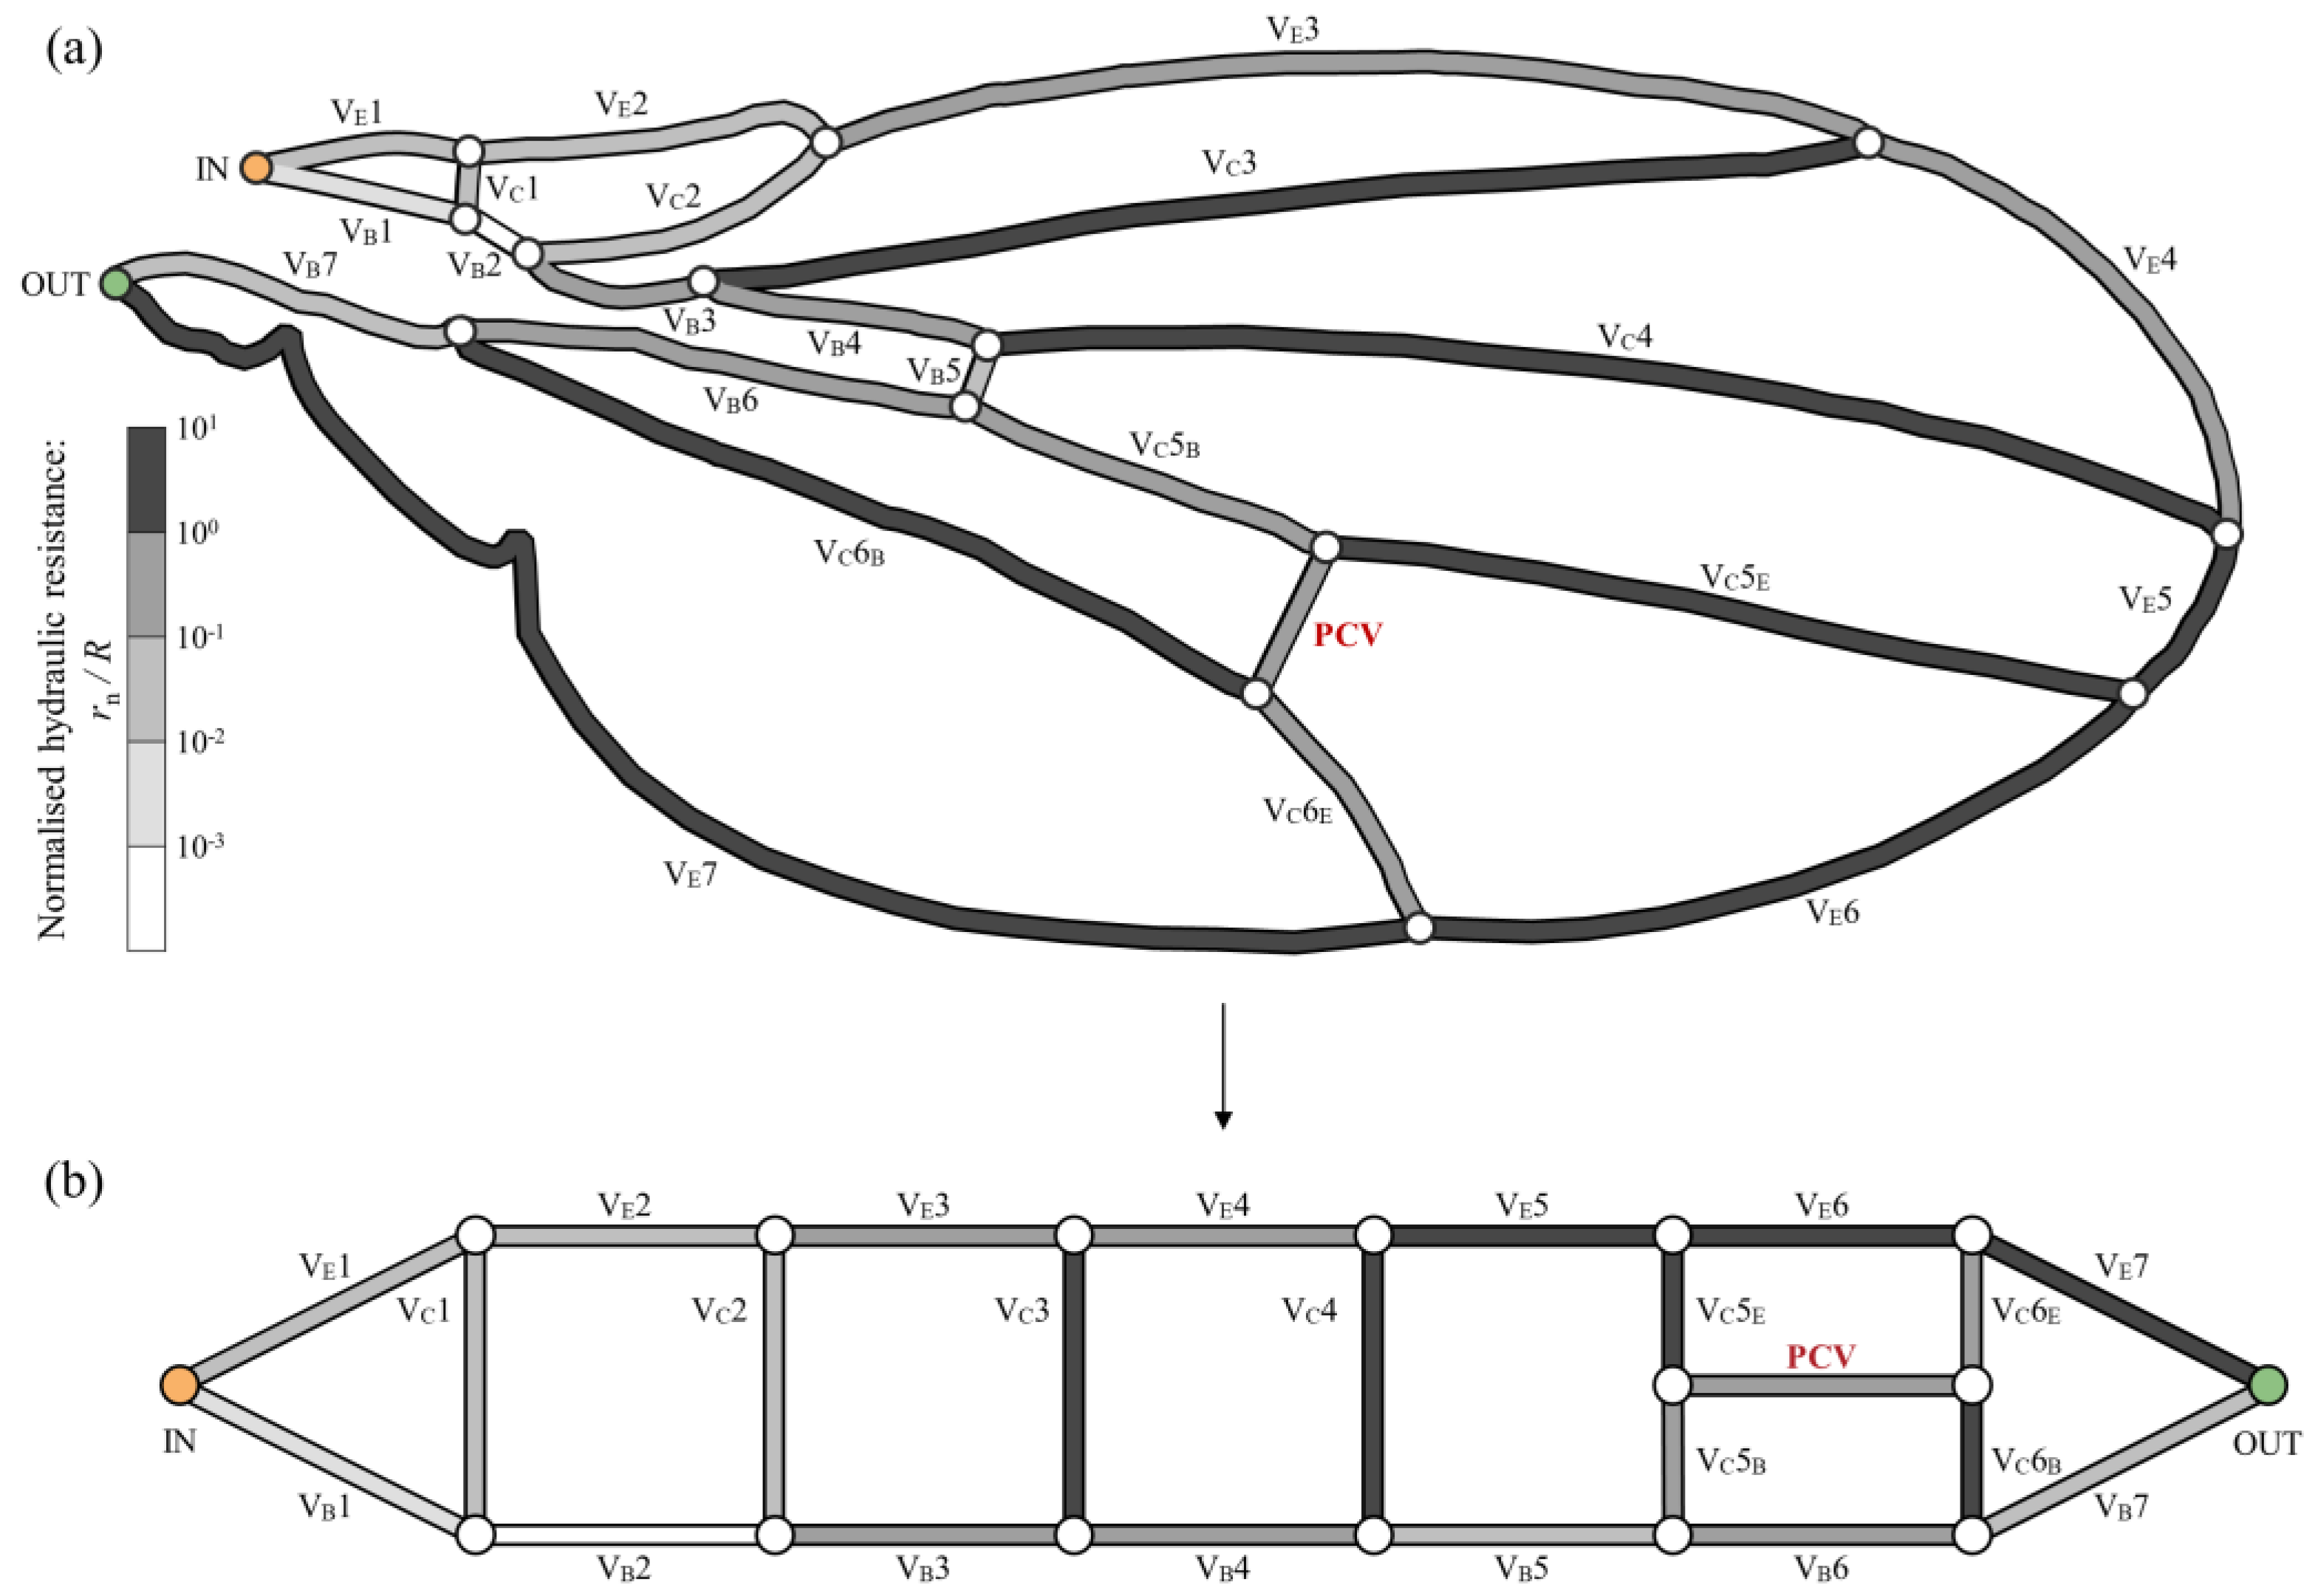
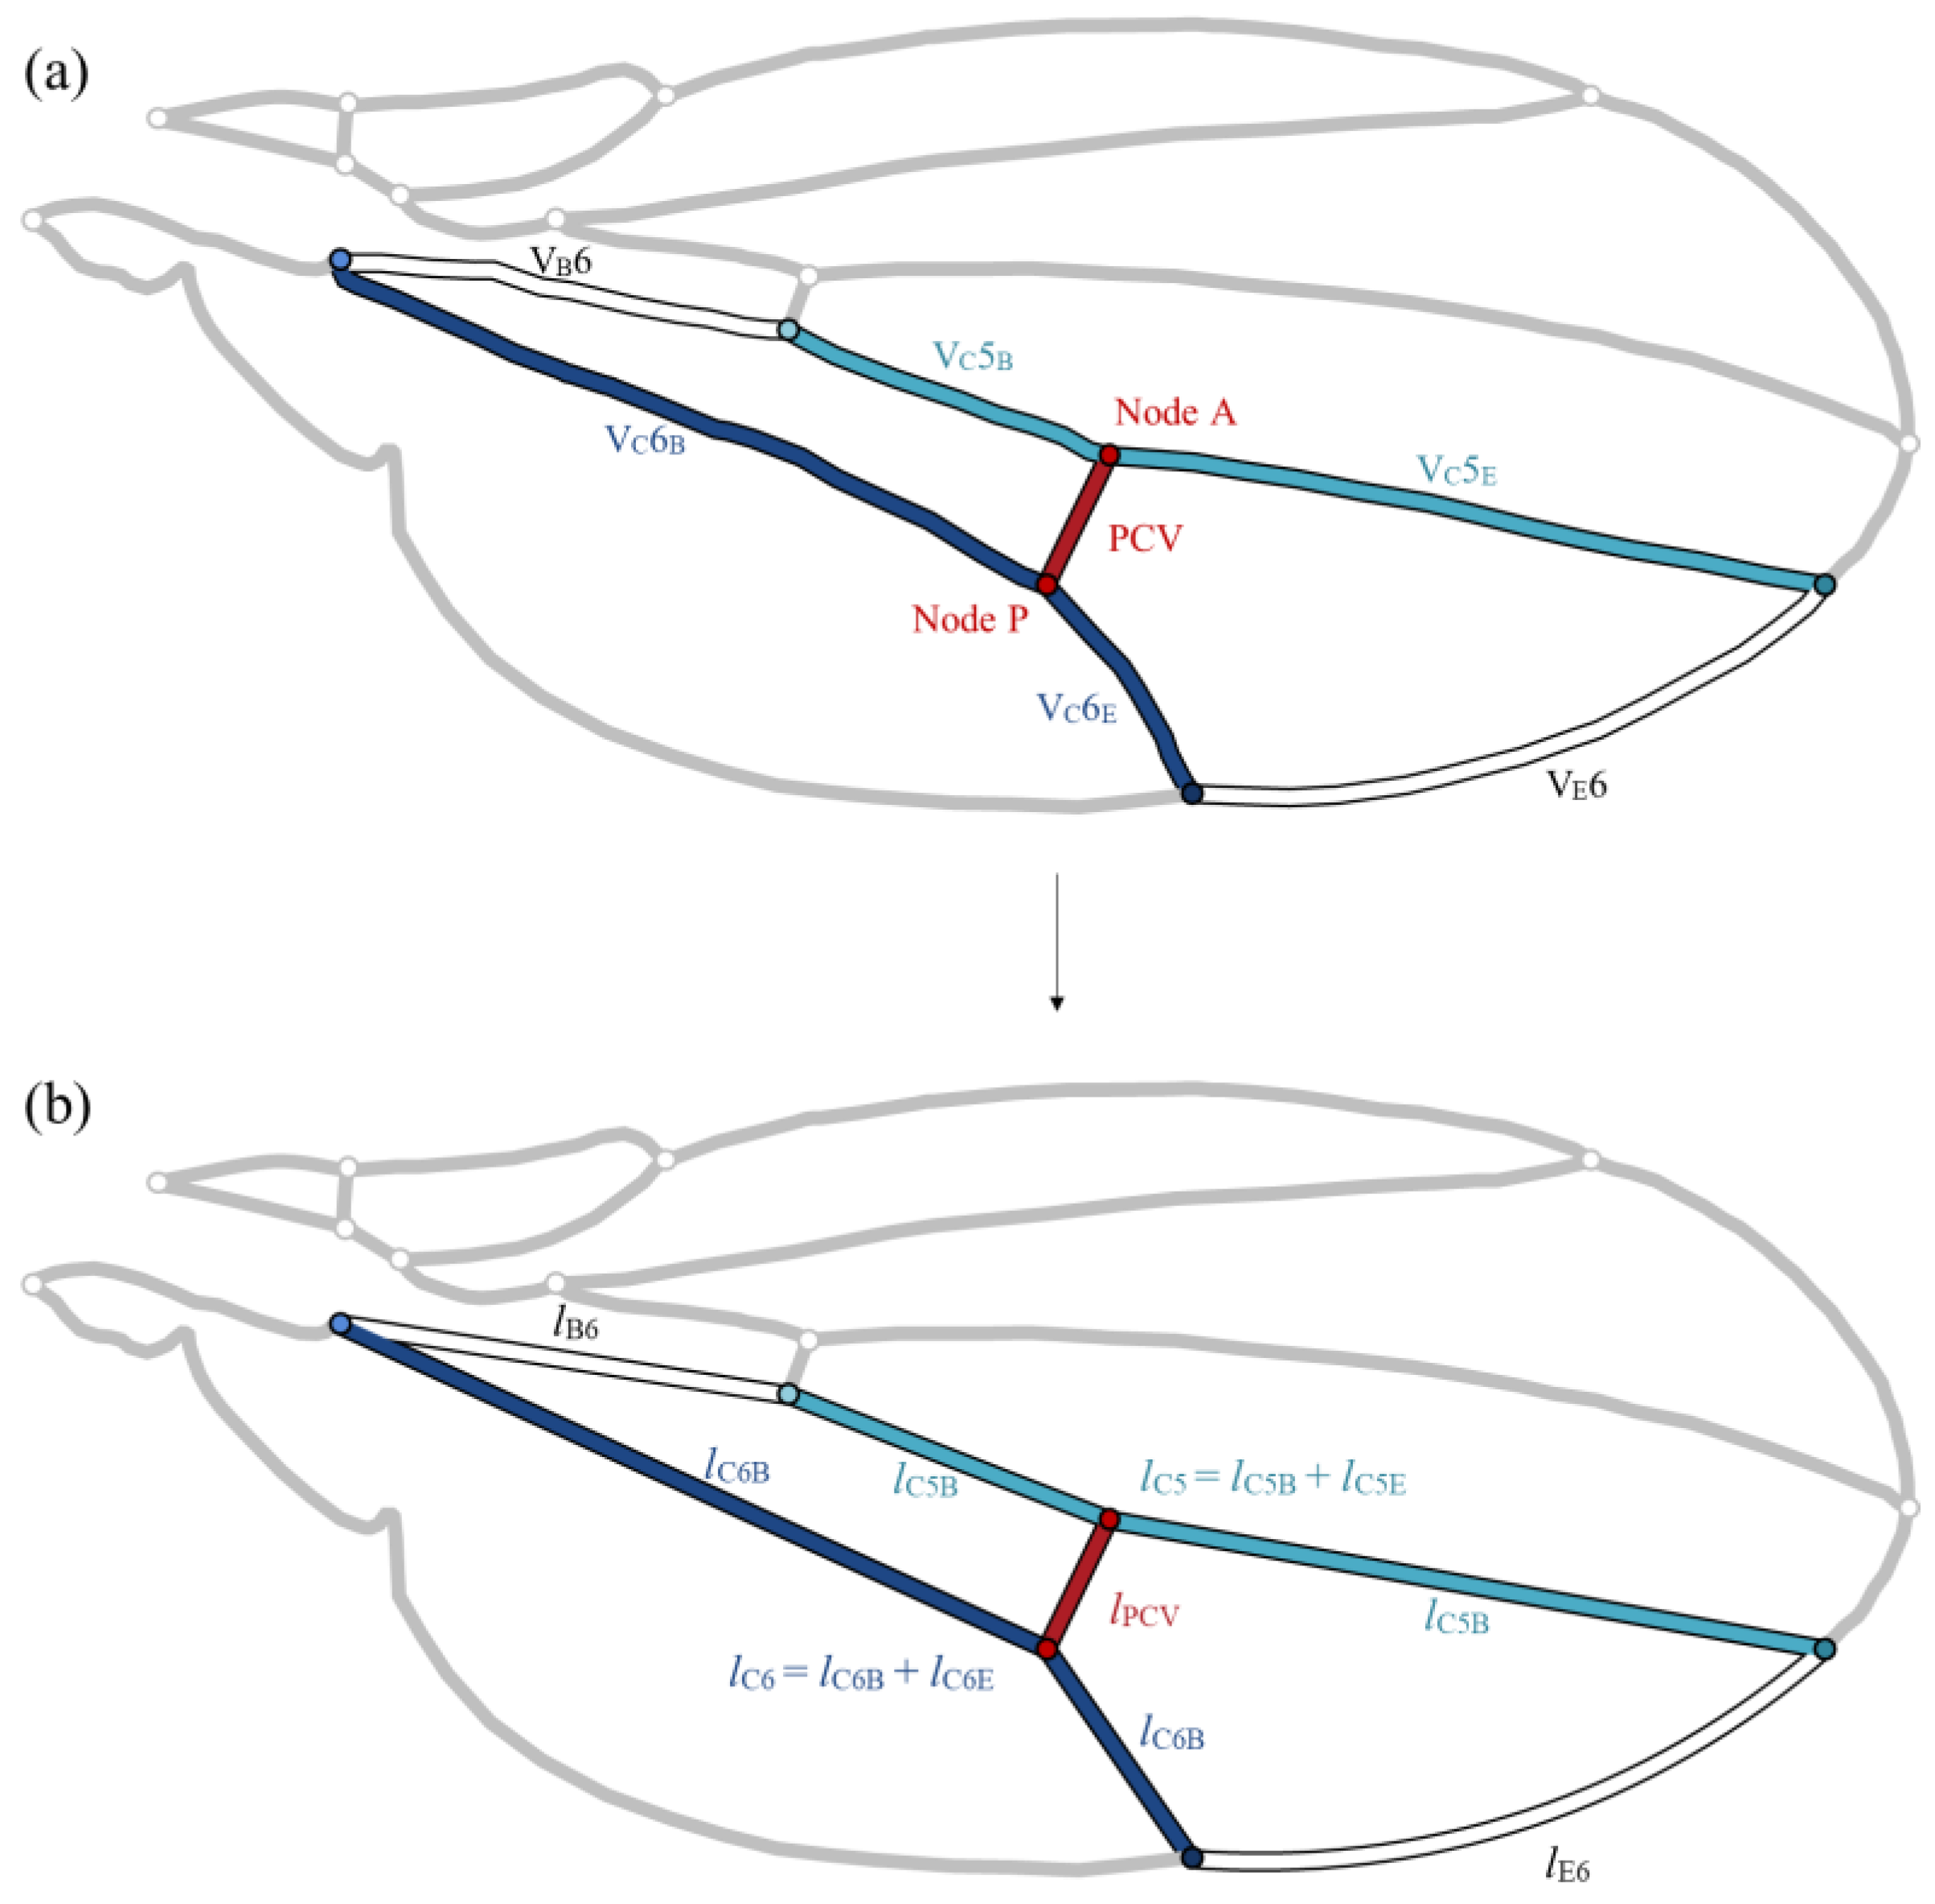
2.1. Network Modelling

The vein network model of the forewings of the fruit fly D. melanogaster was constructed from a previously reported vein network morphology [8]. The wing veins along the wing edge and base, VE1–7 and VB1–7 in Figure 1, were named edge veins and base veins, respectively. In our topological model (Figure 1b), these vein sets correspond to the upper and lower serial veins connected by veins labelled VC1–6, termed the connecting veins. The PCV links two of the connecting veins. The anterior and posterior ends of this vein, that is, nodes A and P, divide the fifth and sixth connecting veins, respectively, as shown in Figure 2a.
Parametric vein repositioning was required to examine the total pressure losses at various PCV positions. The connecting positions of the vein were virtually controlled. To calculate the haemolymph flow rates and local pressure losses within the veins corresponding to the connecting positions, the lengths of the PCV and edge and base segments of the contiguous connecting veins were necessary during vein repositioning. To define these vein lengths, the vein network was geometrically simplified by substituting certain wing veins with straight line segments and an arc, as shown in Figure 2b [8]. The lengths and hydraulic resistances of the substituted segments differed from those of the actual vein segments by 4%. The vein lengths ln and inner diameters dn of the simplified network model are presented in Appendix A.
The shifted positions of nodes A and P were defined by the lengths of the base-side segments of the contiguous connecting veins lC5B and lC6B, as shown in Figure 2b. These were normalised to the entire length of the respective connecting veins, lC5 and lC6. The normalised segment lengths, lC5B/lC5 and lC6B/lC6, were changed from 0.001 to 0.999 in increments of 0.001. lC5B/lC5 = 0.322 and lC6B/lC6 = 0.754 represented the actual positions in the simplified model, incorporating with respective errors of +0.10% and −1.1% because of the simplification. The diameter of the PCV and its connecting vein segments remained constant, whereas their lengths varied. Certain connection positions were excluded from the analysis to avoid PCV intersecting with other veins.
An idealised hydraulic circuit model that imitated the fourth to seventh sections of the wing vein network topology, including the PCV, was virtually constructed. This circuit was formed with micro-channels of 4 µm diameter and 0.6 mm length, which corresponded to the average diameter and length of the wing veins with one significant digit. The uniform geometry of the channels provided symmetry in the resistance distribution. To demonstrate the effect of the asymmetric resistance distribution on the total pressure loss at various PCV positions, the resistance values were controlled by adjusting the diameters in this circuit. A schematic of the idealised circuit is presented in Section 3.

2.2. Estimation of Haemolymph Flow Rate and Pressure Loss

The haemolymph flow was treated as a Poiseuille flow within a two-dimensional network of cylindrical pipes. The Reynolds number of the haemolymph flow was less than 10−3, indicating viscous flow [5,8]. The haemolymph was treated as a Newtonian fluid, consistent with a previous report on adult moths (i.e., another group in the Holometabola superorder to which flies belonged) [10]. Based on Poiseuille’s law, the pressure loss through the wing’s vein is as follows:
p n = 128 μ l n π d n   4 q n ,
where μ is the haemolymph viscosity (1.3 × 10⁻³ Pa·s in D. melanogaster [11]), ln and dn are the length and diameter of the wing’s vein, respectively, and qn is the volumetric flow rate in the vein. The hydraulic resistance is rn = 128µln/πdn4, whose distribution across the vein network is shown in Figure 1. Therefore,
p n = r n q n .
To solve the unknown flow rate and pressure loss in each vein, simultaneous equations were established for all wing veins.
The simultaneous equations formed a matrix based on the conservation laws of mass and energy, corresponding to Kirchhoff’s laws of current and voltage in electrical circuits. At each node, the incoming volumetric flow rate qin and outgoing flow rate qout satisfy qin = qout, thereby ensuring mass conservation. For energy conservation in each closed loop of veins, the sum of pressure losses satisfies ΣΔpn = Σrnqn = 0. In any closed loop with a pressure source, the algebraic sum of pressure losses equals the sum of the source pressures, that is, ΣΔpn = Σpsource = Σrnqn. In our calculation, the only source pressure was set and equal to the total pressure loss Δptotal. Thus, psource = Δptotal = Σrnqn. The number of equations should be equal to the number of unknown variables. The loop current method was employed to minimise the number of equations [12]. A matrix was formed using the simultaneous equations for eight loops and one loop, with the pressure source in the wing vein network of the fruit fly expressed as follows:
r E 1 + r C 1 + r B 1 r C 1 0   0 r C 1 r E 2 + r C 2 + r B 2 + r C 1 r C 2   0 r C 2 r E 3 + r C 3 + r B 3 + r C 2 r C 3 r C 3 r E 4 + r C 4 + r B 4 + r C 3 r C 4 0 r C 4 r E 5 + r C 5 E + r C 5 B + r B 5 + r C 4 r C 5 E r C 5 B 0 0 r C 5 E r E 6 + r C 6 E + r P C V + r C 5 E r P C V r C 6 E r C 5 B r P C V r P C V + r C 6 B + r B 6 + r C 5 B r C 6 B 0 0 r C 6 E r C 6 B r E 7 + r B 7 + r C 6 B + r C 6 E 0 r B 1 r B 2 r B 3 r B 4 r B 5 0 r B 6 r B 7 1 · Q 1 Q 2 Q 3 Q 4 Q 5 Q 6 E Q 6 B Q 7 p t o t a l = r B 1 Q i n r B 2 Q i n r B 3 Q i n r B 4 Q i n r B 5 Q i n   0 r B 6 Q i n r B 7 Q i n r B 1 + r B 2 + r B 3 + r B 4 + r B 5 + r B 6 + r B 7 Q i n
Qn is the loop flow rate, and Qin represents the volumetric inflow rate of the network. This matrix has the form Ax = y, where the matrix A contains the known resistance values of the veins and 0 or −1 along the rightest column to indicate the inclusion of pressure sources in the loops; the vector x contains loop flow rates and the total pressure loss, and y contains the known pressure loss expressed with the inflow rate and resistance values. The linear matrix was solved using MATLAB R2024a (MathWorks, Natick, MA, USA) with double precision. The same calculation method was used for the idealised fluidic circuit. This circuit analogy concept has been applied to haemolymph circulation in wing veins [8] and practical microfluidic networks [6,13,14].
The inflow rate (Qin) and outflow rate (Qout), of the venous network were fixed at the boundary, with 5.2 × 102 μm3/s [8]. The entrance and exit of the haemolymph flow were set at the anterior and posterior wing bases, respectively, as illustrated in Figure 1. Minor losses, excluding frictional loss, were ignored because frictional loss is more than 105 times larger than other losses, according to the present Reynolds number [5].

3. Results and Discussion

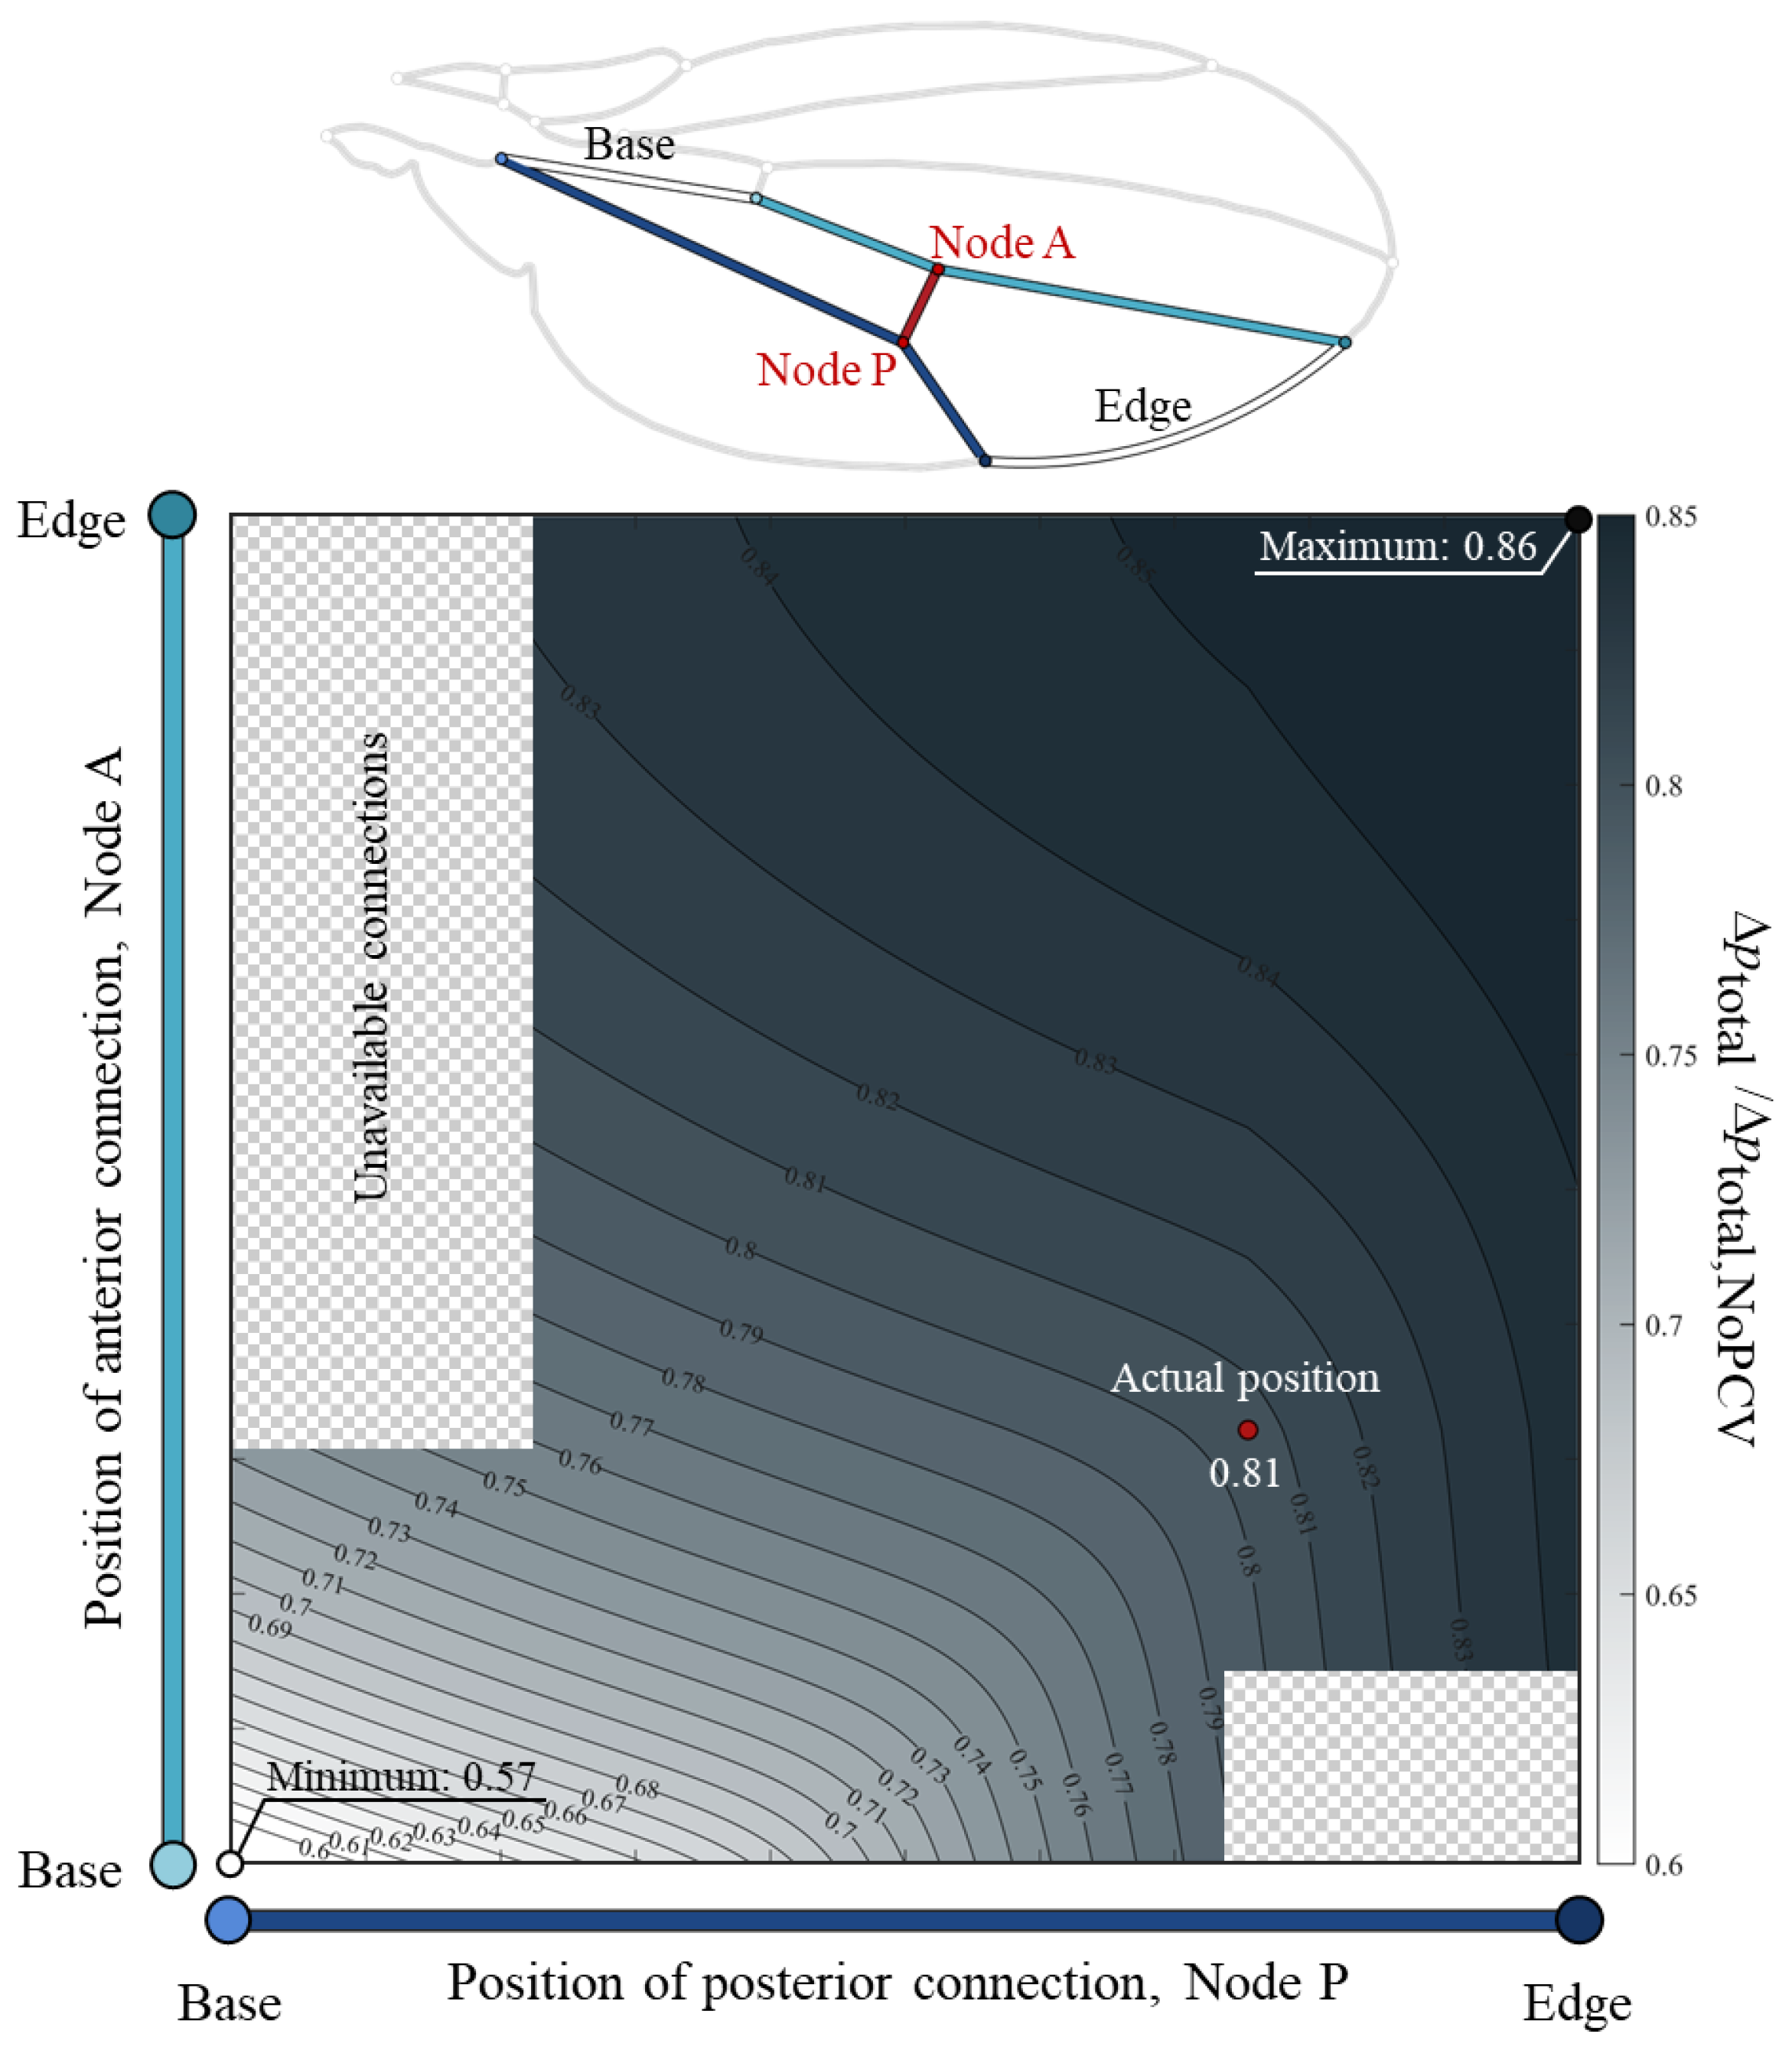
3.1. Total Pressure Loss Variation with PCV Position

The colour map in Figure 3 shows the total pressure loss between the network inlet and outlet, which varies with the position of the PCV. An isovalue distribution that fans outwards from the bottom left is shown; the pressure loss decreases as both the anterior and posterior connections are closer to the wing’s base and increase as they are closer to the wing’s edge. In comparison with the total pressure loss in the absence of the PCV, the minimum pressure loss was 43% smaller and the maximum pressure loss was 16% smaller. At the actual position, the pressure loss was 19% lower than that in the PCV’s absent, underestimated by 1.8% compared with that in the actual vein network model [8], feasibly due to geometrical simplification.
The flow rate in the PCV exhibits an opposite response to that of the total pressure loss; the maximum flow rate in this vein corresponds to the minimum total pressure loss. The PCV receives part of the haemolymph flow that bypasses the sixth edge and base vein segments, with the largest hydraulic resistance among all veins [8]. The maximum flow rate within this vein minimised the flow rates and local pressure losses within the sixth pair of veins, thus resulting in the smallest total pressure loss as the sum of the local pressure losses within the base or edge vein series.

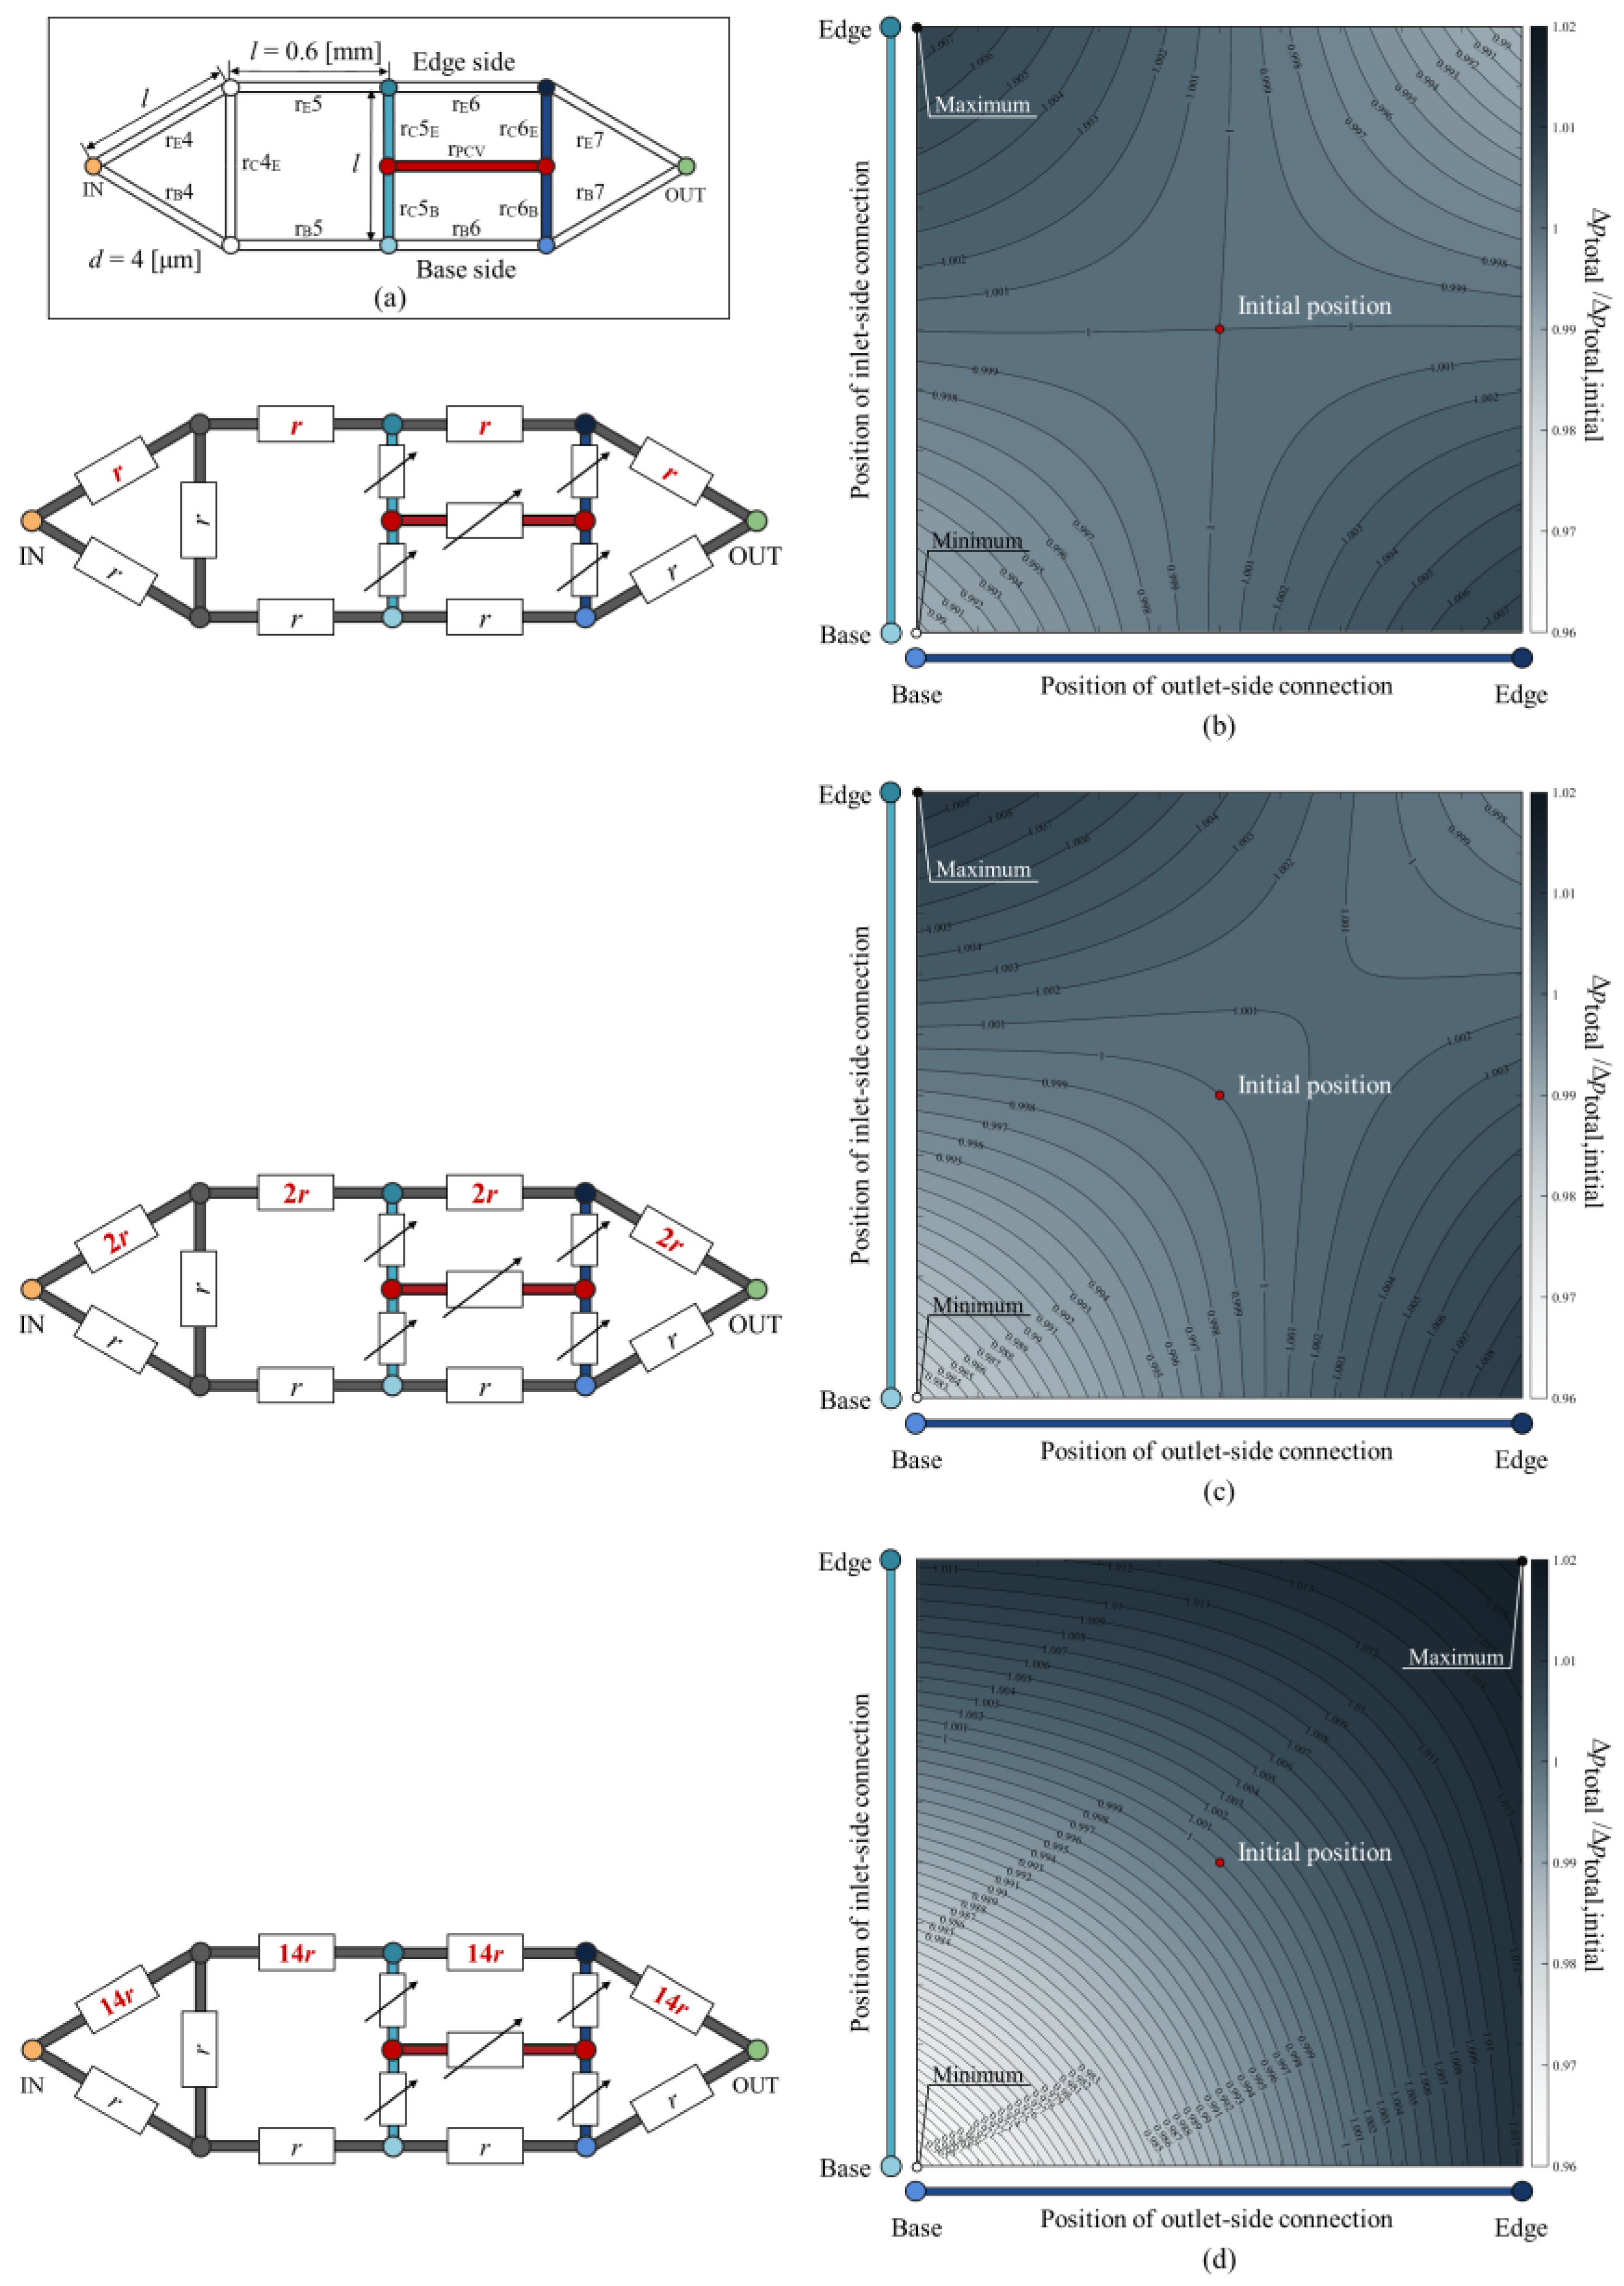
3.2. Total Pressure Loss in Idealised Circuit with Rearranged PCV

In the idealised fluidic circuit imitating the fourth to seventh sections of the wing vein network topology, as shown in Figure 4a, the total pressure loss corresponding to the varied PCV resistor was examined, as shown in Figure 4b. A saddle-node-like isovalue distribution with centre-point symmetry and near-diagonal line symmetry was exhibited. Both connections at the edge and base minimise the pressure loss, whereas when they are at the edge and base, the pressure loss is at a maximum. This circuit with symmetric resistance distribution did not exhibit a fan-like pressure loss variation.
Because this idealised circuit exhibited a higher degree of asymmetry in the resistance distribution, the pressure loss variation exhibited the same trend as that in the actual vein network. High resistance values were assigned to the edge vein resistors, rE series in Figure 4a, in the circuit model, similar to those of the edge veins. With their resistances being twice as large as the others, as shown in Figure 4c, the saddle-node point shifted to the edge side, and the pressure loss became minimal only with both connections at the base side. Because the resistance values of the edge veins were 14 times larger than those of the base veins on average in the wing vein network, an idealised circuit with resistance values of the edge vein resistors 14 times larger was tested. The pressure loss variation in Figure 4d lost the saddle node, and a quarter-circular distribution emerged instead. The pressure loss was minimum with both connections at the base and maximum with those at the edge, such as the vein network model shown in Figure 3. The variation in the flow rate of the PCV resistor exhibited a response opposite to that of the total pressure loss in every circuit, as observed in the actual vein network. Therefore, the total pressure loss was determined by the bypassing flow rate through the PCV. An idealised circuit imitating the Hawaiian fly’s vein network also reproduced the total pressure loss response in the actual vein network, with its resistance distribution characteristics in a previous numerical study [15].
This vein is located near the wing’s base in fruit fly species and is phylogenetically close to D. melanogaster [9]. Our results suggest that the wing morphology of these species may have been adapted to reduce the total pressure loss and pressure output required by the wing heart to circulate haemolymph in the venous network with an asymmetric resistance distribution. Although the PCV at the wing’s base can maximise the pressure loss reducing effect, its position conceivably needs to satisfy other requirements, such as water supply to the wing’s membrane [8]. This may explain why the vein is not located at the base.
Another issue is the requirement for an asymmetric distribution of hydraulic resistance that can be associated with the optimisation of haemolymph mass distribution across the wings. The mean diameter of the edge vein series was 0.58 times that of the base vein series, whereas the sum of their lengths was 2.74 times that of the base vein series. This resulted in the total inner volume of the edge vein series being 22% smaller than that of the base vein series, which could decrease the haemolymph mass at the wing’s edge and mitigate the moment of inertia of the wings. The flies flapped their wings at a frequency of 188.7 Hz during flight [16], indicating that a reduction in the moment of inertia was advantageous. This morphological adjustment for flight motion may have led to an increase in the hydraulic resistance of the edge veins. In a Hawaiian fruit fly species, the position of a cross-vein contributes to pressure loss reduction that may counterbalances the narrow wing veins conceivably mitigating moment of inertia [15]. The lightened wings with bristles in a 0.4 mm-scaled beetle reduces the inertial power requirement for wing flapping [17]. The present findings provide further knowledge of insect wing’s morphological adjustment-conserving functions relating to fluidic circuits and flight devices simultaneously. The diameter and length of the wing’s veins at the wing’s edge were smaller and longer, respectively, than those at the base, not only in fruit flies, but also in other typical insects. Their asymmetrical vein morphology could mitigate the wing’s moment of inertia, and their cross-vein positions might be evolutionarily adjusted to mitigate its haemodynamic drawbacks.

4. Conclusions

In this study, the wing vein network of fruit flies showed that the total pressure loss during haemolymph transport varied with the position of the PCV. The base-side position minimised the pressure loss, whereas the edge-side position maximised it. This variation was determined by the asymmetry in the hydraulic resistance distribution across the vein network, where the resistance values of the veins were higher at the wing’s edge than at the wing’s base, as demonstrated in the idealised circuit imitating the vein network topology with a symmetric distribution of hydraulic resistances. These results suggest that the proximal PCV positions in certain fruit fly species contribute to pressure loss reduction under the constraint of morphological adaptations to the moment of the wing’s inertia. Our findings highlight the possibility that the wing morphology of the fruit flies is optimised to simultaneously maintain functions of the haemolymph transport networks and flight devices.

Author Contributions

Conceptualisation, K.S., Y.K. and O.M.; methodology, K.S., Y.K. and O.M.; software, K.S. and Y.K.; validation, K.S.; formal analysis, K.S.; investigation, K.S.; resources, K.S.; data curation, K.S.; writing—original draft preparation, K.S.; writing—review and editing, Y.K. and O.M.; visualisation, K.S.; supervision, Y.K. and O.M.; project administration, K.S.; funding acquisition, K.S. All authors have read and agreed to the published version of the manuscript.

Funding

This research was funded by JST Spring (grant number JPMJSP2159) and TOYO University (INOUE ENRYO Memorial Grant).

Data Availability Statement

All relevant data are within the paper.

Conflicts of Interest

The authors declare no conflicts of interest. The funders had no role in the design of the study, in the collection, analyses, or interpretation of data, in the writing of the manuscript, or in the decision to publish the results.

Appendix A. Geometries of Wing Veins in the Simplified Venous Network Model of D. melanogaster

Table A1. Measured length ln and inner diameter dn of each wing vein in the simplified network model.
VeinLength: ln [µm]Inner Diameter: dn [µm]
VE13.0 × 1025.6 × 100
VE24.2 × 1024.4 × 100
VE31.2 × 1034.5 × 100
VE46.4 × 1023.1 × 100
VE52.2 × 1021.9 × 100
VE68.7 × 1021.7 × 100
VE71.9 × 1032.2 × 100
VB13.1 × 1021.2 × 101
VB28.7 × 1019.9 × 100
VB32.2 × 1023.4 × 100
VB43.3 × 1023.4 × 100
VB56.9 × 1013.4 × 100
VB65.9 × 1022.7 × 100
VB74.0 × 1025.7 × 100
VC17.6 × 1013.9 × 100
VC23.7 × 1025.8 × 100
VC31.3 × 1032.6 × 100
VC41.4 × 1033.1 × 100
VC5E9.3 × 1022.5 × 100
VC5B4.4 × 1022.8 × 100
VC6E3.3 × 1022.5 × 100
VC6B1.0 × 1032.7 × 100
PCV1.8 × 1023.1 × 100

References

  1. Arnold, J.W. Blood circulation in insect wings. Mem. Entomol. Soc. Can. 1964, 96, 5–60. [Google Scholar] [CrossRef]
  2. Chintapalli, R.T.V.; Hillyer, J.F. Hemolymph circulation in insect flight appendages: Physiology of the wing heart and circulatory flow in the wings of the mosquito Anopheles gambiae. J. Exp. Biol. 2016, 219, 3945–3951. [Google Scholar] [CrossRef] [PubMed]
  3. Salcedo, M.K.; Jun, B.H.; Socha, J.J.; Pierce, N.E.; Vlachos, P.P.; Combes, S.A. Complex hemolymph circulation patterns in grasshopper wings. Commun. Biol. 2023, 6, 313. [Google Scholar] [CrossRef] [PubMed]
  4. Pass, G.; Tögel, M.; Krenn, H.; Paululat, A. The circulatory organs of insect wings: Prime examples for the origin of evolutionary novelties. Zool. Anz. J. Comp. Zool. 2015, 256, 82–95. [Google Scholar] [CrossRef]
  5. Munson, B.R. Fundamentals of Fluid Mechanics; John Wiley & Sons, Inc.: Hoboken, NJ, USA, 2002. [Google Scholar]
  6. Rousset, N.; Lohasz, C.; Boos, J.A.; Misun, P.M.; Cardes, F.; Hierlemann, A. Circuit-based design of microfluidic drop networks. Micromachines 2022, 13, 1124. [Google Scholar] [CrossRef] [PubMed]
  7. Schachat, S.R.; Boyce, C.K.; Payne, J.L.; Lentink, D. Lepidoptera demonstrate the relevance of Murray’s law to circulatory systems with tidal flow. BMC Biol. 2021, 19, 204. [Google Scholar] [CrossRef] [PubMed]
  8. Sugiyama, K.; Kubota, Y.; Mochizuki, O. Circuit analogy unveiled the haemodynamic effects of the posterior cross vein in the wing vein networks. PLoS ONE 2024, 19, e0301030. [Google Scholar] [CrossRef] [PubMed]
  9. Kumar, N.; Huizar, F.J.; Farfán-Pira, K.J.; Brodskiy, P.A.; Soundarrajan, D.K.; Nahmad, M.; Zartman, J.J. MAPPER: An open-source, high-dimensional image analysis pipeline unmasks differential regulation of drosophila wing features. Front. Genet. 2022, 13, 869719. [Google Scholar] [CrossRef] [PubMed]
  10. Brasovs, A.; Palaoro, A.V.; Aprelev, P.; Beard, C.E.; Adler, P.H.; Kornev, K.G. Haemolymph viscosity in hawkmoths and its implications for hovering flight. Proc. Biol. Sci. 2023, 290, 20222185. [Google Scholar] [CrossRef] [PubMed]
  11. Zabihihesari, A.; Parand, S.; Rezai, P. PDMS-Based Microfluidic Capillary Pressure-Driven Viscometry and Application to Drosophila melanogaster’s Hemolymph. Microfluid. Nanofluid. 2023, 27, 8. [Google Scholar] [CrossRef]
  12. Chatzarakis, G.E.; Tortoreli, M.D.; Tziolas, A.D. Fundamental loop-current method using “virtual voltage sources” technique for special cases. Int. J. Electr. Eng. Educ. 2003, 40, 188–207. [Google Scholar] [CrossRef]
  13. Oh, K.W.; Lee, K.; Ahn, B.; Furlani, E.P. Design of pressure-driven microfluidic networks using electric circuit analogy. Lab Chip 2012, 12, 515–545. [Google Scholar] [CrossRef] [PubMed]
  14. Gompper, G.; Fedosov, D.A. Modeling microcirculatory blood flow: Current state and future perspectives. Wiley Interdiscip. Rev. Syst. Biol. Med. 2016, 8, 157–168. [Google Scholar] [CrossRef] [PubMed]
  15. Sugiyama, K.; Kubota, Y.; Mochizuki, O. Network topology of wing veins in Hawaiian flies mitigates allometric dilemma. Biomimetics 2024, 9, 451. [Google Scholar] [CrossRef] [PubMed]
  16. Muijres, F.T.; Elzinga, M.J.; Melis, J.M.; Dickinson, M.H. Flies evade looming targets by executing rapid visually directed banked turns. Science 2014, 344, 172–177. [Google Scholar] [CrossRef] [PubMed]
  17. Farisenkov, S.E.; Kolomenskiy, D.; Petrov, P.N.; Engels, T.; Lapina, N.A.; Lehmann, F.-O.; Onishi, R.; Liu, H.; Polilov, A.A. Novel flight style and light wings boost flight performance of tiny beetles. Nature 2022, 602, 96–100. [Google Scholar] [CrossRef] [PubMed]
Figure 1. Distribution of normalised hydraulic resistances across (a) wing vein network of fruit fly D. melanogaster, and (b) that projected on its topological network model. Resistance values of every wing vein, rn, are normalised by the combined resistance of the entire network, R. Colour scale is logarithmic.
Symmetry 16 01212 g001
Figure 2. Simplification of vein network in forewings of fruit fly. (a) Actual vein network. (b) Simplified network model. Base vein, VB6, anteriorly and posteriorly contiguous connecting veins, VC5 and VC6, and posterior cross vein (PCV) substituted by straight line segments coloured in light blue and dark blue respectively. Edge vein, VE6, substituted by arc. “Node A” and “Node P” are anterior and posterior connections of PCV, respectively. Physical quantities captioned ln in (b) are lengths of simplified vein segments (a figure from [8] was modified).
Symmetry 16 01212 g002
Figure 3. Normalised total pressure loss corresponding to varied positions of connections of posterior cross vein (PCV). Vertical and horizontal axes show positions of anterior and posterior connections, Nodes A and P, respectively. Colour intensity in colormap indicates level of total pressure loss, Δptotal, normalised by pressure loss without the PCV, Δptotal,NoPCV. Red circle represents actual connecting positions. Black and white circles represent positions where total pressure loss is maximum and minimum, respectively. Checkerboard-patterned regions were out of the present analysis.
Symmetry 16 01212 g003
Figure 4. Normalised total pressure loss corresponding to position of posterior cross vein (PCV) resistor in idealised circuit models. (a) Basic dimension of circuit. Variation in total pressure loss demonstrated in circuit models with (b) no change in resistance distribution where all resistors, base vein resistors, rB series, edge vein resistors, rE series, and connecting vein resistors, rC series, share resistance values r; (c) twice larger resistances, 2r, of edge vein resistors; (d) 14 times larger resistances, 14r, of the edge vein resistors referring to the actual resistance balance between the edge and base veins. Each schematic at the bottom left of each colourmap represents resistance values of resistors. Variable resistor symbols, the rectangles with arrows in left panels, indicate that their resistance values vary with the positions of PCV resistor’s connections. Vertical and horizontal axes show the connection positions on the inlet- and outlet-side. Colour intensity in the colourmap corresponds to the level of normalised total pressure loss, Δptotal/Δptotal,initial, where Δptotal is the total pressure loss with each PCV position, and Δptotal,initial is that with initial positions of PCV shown in (a). Red circle represents initial position. Black and white circles mark positions with minimum and maximum pressure losses, respectively.
Symmetry 16 01212 g004
Disclaimer/Publisher’s Note: The statements, opinions and data contained in all publications are solely those of the individual author(s) and contributor(s) and not of MDPI and/or the editor(s). MDPI and/or the editor(s) disclaim responsibility for any injury to people or property resulting from any ideas, methods, instructions or products referred to in the content.

