Article

Experimental Investigations on the Cavitation Bubble Dynamics near the Boundary of a Narrow Gap

1
Key Laboratory of Power Station Energy Transfer Conversion and System (Ministry of Education), School of Energy Power and Mechanical Engineering, North China Electric Power University, Beijing 102206, China
2
State Power Investment Corporation, Beijing 100029, China
3
College of Mechanical and Transportation Engineering, China University of Petroleum-Beijing, Beijing 102249, China
4
Beijing Key Laboratory of Process Fluid Filtration and Separation, China University of Petroleum-Beijing, Beijing 102249, China
*
Authors to whom correspondence should be addressed.
Symmetry 2024, 16(5), 541; https://doi.org/10.3390/sym16050541
Submission received: 25 March 2024 / Revised: 17 April 2024 / Accepted: 22 April 2024 / Published: 1 May 2024
(This article belongs to the Section Physics)

Abstract

:
Cavitation bubbles near narrow gaps widely exist within microfluidic control devices. In the present paper, a laser-induced cavitation bubble is arranged in a narrow gap composed of two parallel plates. The inception position of the bubble is set to be at the same distance from the two plates so that the dynamic behaviors of the bubble are symmetrical. The collapse and rebound dynamics of the bubble near the boundary of a narrow gap are investigated through high-speed photography. The bubble behaviors (e.g., shape deformation, translational movement, and jet characteristics) are analyzed while considering the influence of the dimensionless distance between the bubble and the boundary and the dimensionless gap width. The principal findings include the following: (1) When the dimensionless distance is small, a violent jet towards the gap is generated during the bubble collapse stage, along with a weak counter-jet towards the boundary appearing during the rebound stage. (2) As the dimensionless distance increases, the translational distance of the bubble during the collapse stage initially decreases, then increases, and finally decreases to zero. (3) Within the parameter range considered in this paper, the dimensionless width mainly affects the expansion degree and movement direction of the bubble cloud during its rebound and subsequent stages. The above research findings can provide experimental support for bubble-driven flow control, pumping, and liquid mixing in microfluidic channels.

1. Introduction

Cavitation bubble dynamics in microchannels and the resulting microfluidic flows have a wide range of applications (e.g., ink-jet printers [1], lab-on-a-chip in biology [2,3,4], and chemical reactions [5]). In these scenarios, a narrow gap channel composed of two parallel plates is a common type of microchannel. In the narrow gaps, the liquid disturbances induced via the bubble collapse and periodic oscillation enable flow control [6,7], the mixing of multiple liquids [8,9], and directional pumping [10,11,12]. In order to control the flow direction and flow velocity of the liquid with high precision, it is necessary to elucidate the bubble collapse and jet dynamics in the gap. Therefore, in the present paper, the cavitation bubble dynamics near the boundary of the narrow gaps are investigated based on high-speed photography.
In terms of research interests, the existing research can be divided into three categories. Among them, some scholars have focused on the bubble’s irregular collapse, together with its induced severe shear stress in the gaps. Other scholars have regarded the restricted bubble in the gap as a cylindrical shape and focused on the dynamics of the cylindrical bubbles. In addition, some scholars have further explored the influence of various boundaries on the evolution of cylindrical bubble collapse morphology and jet characteristics in the gap.
For the first category, the collapse jet and the shear stress enhancement in the gap, the shock wave, and the bubble deformation and splitting are mainly considered. Gonzalez-Avila et al. [12,13] considered the influences of the viscosity on the impact and diffusion of the jet, generalized three typical bubble collapse situations in terms of the jet direction, and revealed the mechanism of the enhancement of the jet velocity and the sharp increase in the shear stress on the plate surface. On this basis, Zeng et al. [14] found that different jet types in the gap depend on the competition results of the splitting flow, annular edge flow, and vertical inward flow. Rodriguez et al. [15] reported the propagation characteristics of the pressure distribution and the rarefaction waves, and those authors compared them with the situations in which the bubble is located near a flat wall. Sagar and Moctar [16] investigated the effect of the non-parallel degree of the two flat plates constituting the gap on bubble behaviors.
For the second category, the radial oscillation equations and the oscillation characteristics of the cylindrical bubble are primarily concerned. Kedrinskii [17,18] systematically proposed radial motion equations for a cylindrical bubble with compressible fluids based on acoustic wave propagation characteristics under the Kirkwood–Bethe hypothesis. This equation system is not restricted to a limited range of liquids and does not require curve fitting to agree with experimental measurements of inertial growth and collapse. In addition, Ilinskii et al. [19] obtained the radial motion equations of a cylindrical bubble in an incompressible liquid based on the Lagrange equation. They compared and analyzed three typical cylindrical bubble dynamics equations and identified their advantages and limitations. On this basis, Zhang et al. [20] deduced an analytical solution with second-order accuracy and the numerical solution of a cylindrical bubble under free oscillation, and they revealed the inherent law of the oscillation of the cylindrical bubble. It was found that the oscillation characteristics of the cylindrical bubble are significantly affected due to the equilibrium radius of the bubble. At the same time, the oscillation amplitudes of the analytical solution with different orders are also greatly affected due to the dimensionless initial radius of the bubble, which means that the size and initial conditions of the cylindrical bubble play a decisive role in its oscillation behavior. Quinto-Su et al. [21] explored the radius evolution and oscillation periods of the restricted bubble in the narrow gap, and they compared the experimental results with the cylindrical bubble dynamics equation. They found that the liquid flow induced via the bubble becomes essentially planar with a slow velocity, and the oscillation period of a restricted bubble generally increases by 50% compared to that of spherical bubbles [22]. Bokman et al. [23] analyzed the oscillation behaviors of a cylindrical bubble in non-Newtonian fluids and investigated the effects of shear stress on the bubble oscillation. Quinto-Su et al. [24] further considered the interaction of two cylindrical bubbles in a narrow gap, and they constructed a radial motion equation for cylindrical bubbles with double-cylindrical bubble systems.
For the third category, the cylindrical bubble collapse and jet dynamics near various boundaries (e.g., rigid walls, free surfaces, and air bubbles) are primarily concerned. Specifically concerning when a bubble is located near rigid walls, Zwaan et al. [25] reported the collapse and rebound stages of the restricted bubbles near various rigid walls in a narrow gap, and they found that the bubble splits into two parts along with a jet towards the wall during the collapse stage, and then two vortexes with opposite rotating directions appear and vigorously agitate the liquid. Wang et al. [26,27] constructed a Kelvin impulse theoretical model applicable to the cylindrical bubble based on the conformal transformation and image method, and they systematically analyzed the collapse dynamics of the cylindrical bubble near a right-angled wall. They found that, when the cylindrical bubble is near the apex of the right-angled wall, the jet intensity is violent, and the spatial sensitivity of the jet intensity and direction is quite strong. Quah et al. [28] and Xiong et al. [29] investigated the restricted bubble dynamics near a free surface and the resulting liquid splashing. Shen et al. [30,31] and Yu et al. [32] established a theoretical model for the dynamic behaviors of a cylindrical bubble near a symmetric and asymmetric Joukowsky hydrofoil, respectively, and they found that the influences of the hydrofoil on the jet angle gradually approaches a cylindrical boundary with the increase in the distance between the bubble and the hydrofoil. Chen et al. [33,34] explored the jet formed under the strong interaction between two bubbles, as well as bubble fusion and fragmentation. However, apart from the boundary types mentioned above, the cavitation bubbles are often arranged near the boundary between the narrow gap and the external broad liquid environment [4,11]. Nevertheless, the influence of this kind of boundary on bubble dynamics (e.g., morphological changes, jet, and positional shifts) is still unclear.
In the present paper, the laser-induced cavitation bubble dynamics near the boundary of a narrow gap formed via two parallel plates are experimentally investigated. The typical morphological characteristics of the bubble collapse near the gap boundary are mainly focused on, and the effects of the gap boundary and gap width on the bubble’s morphological changes, jet characteristics, and translational movement characteristics are analyzed in detail. This investigation can provide experimental support for bubble-driven flow control, pumping, and liquid mixing in microfluidic channels. The contents of the remaining sections are organized as follows. In Section 2, the high-speed photography platform and the important parameters are introduced. In Section 3, several typical collapse and rebound behaviors of the bubble are described. In Section 4, the characteristics of the bubble outlines, the feature points on the bubble surface, and the bubble centroids are quantitatively analyzed. In Section 5, the conclusions are summarized along with prospects for further research.

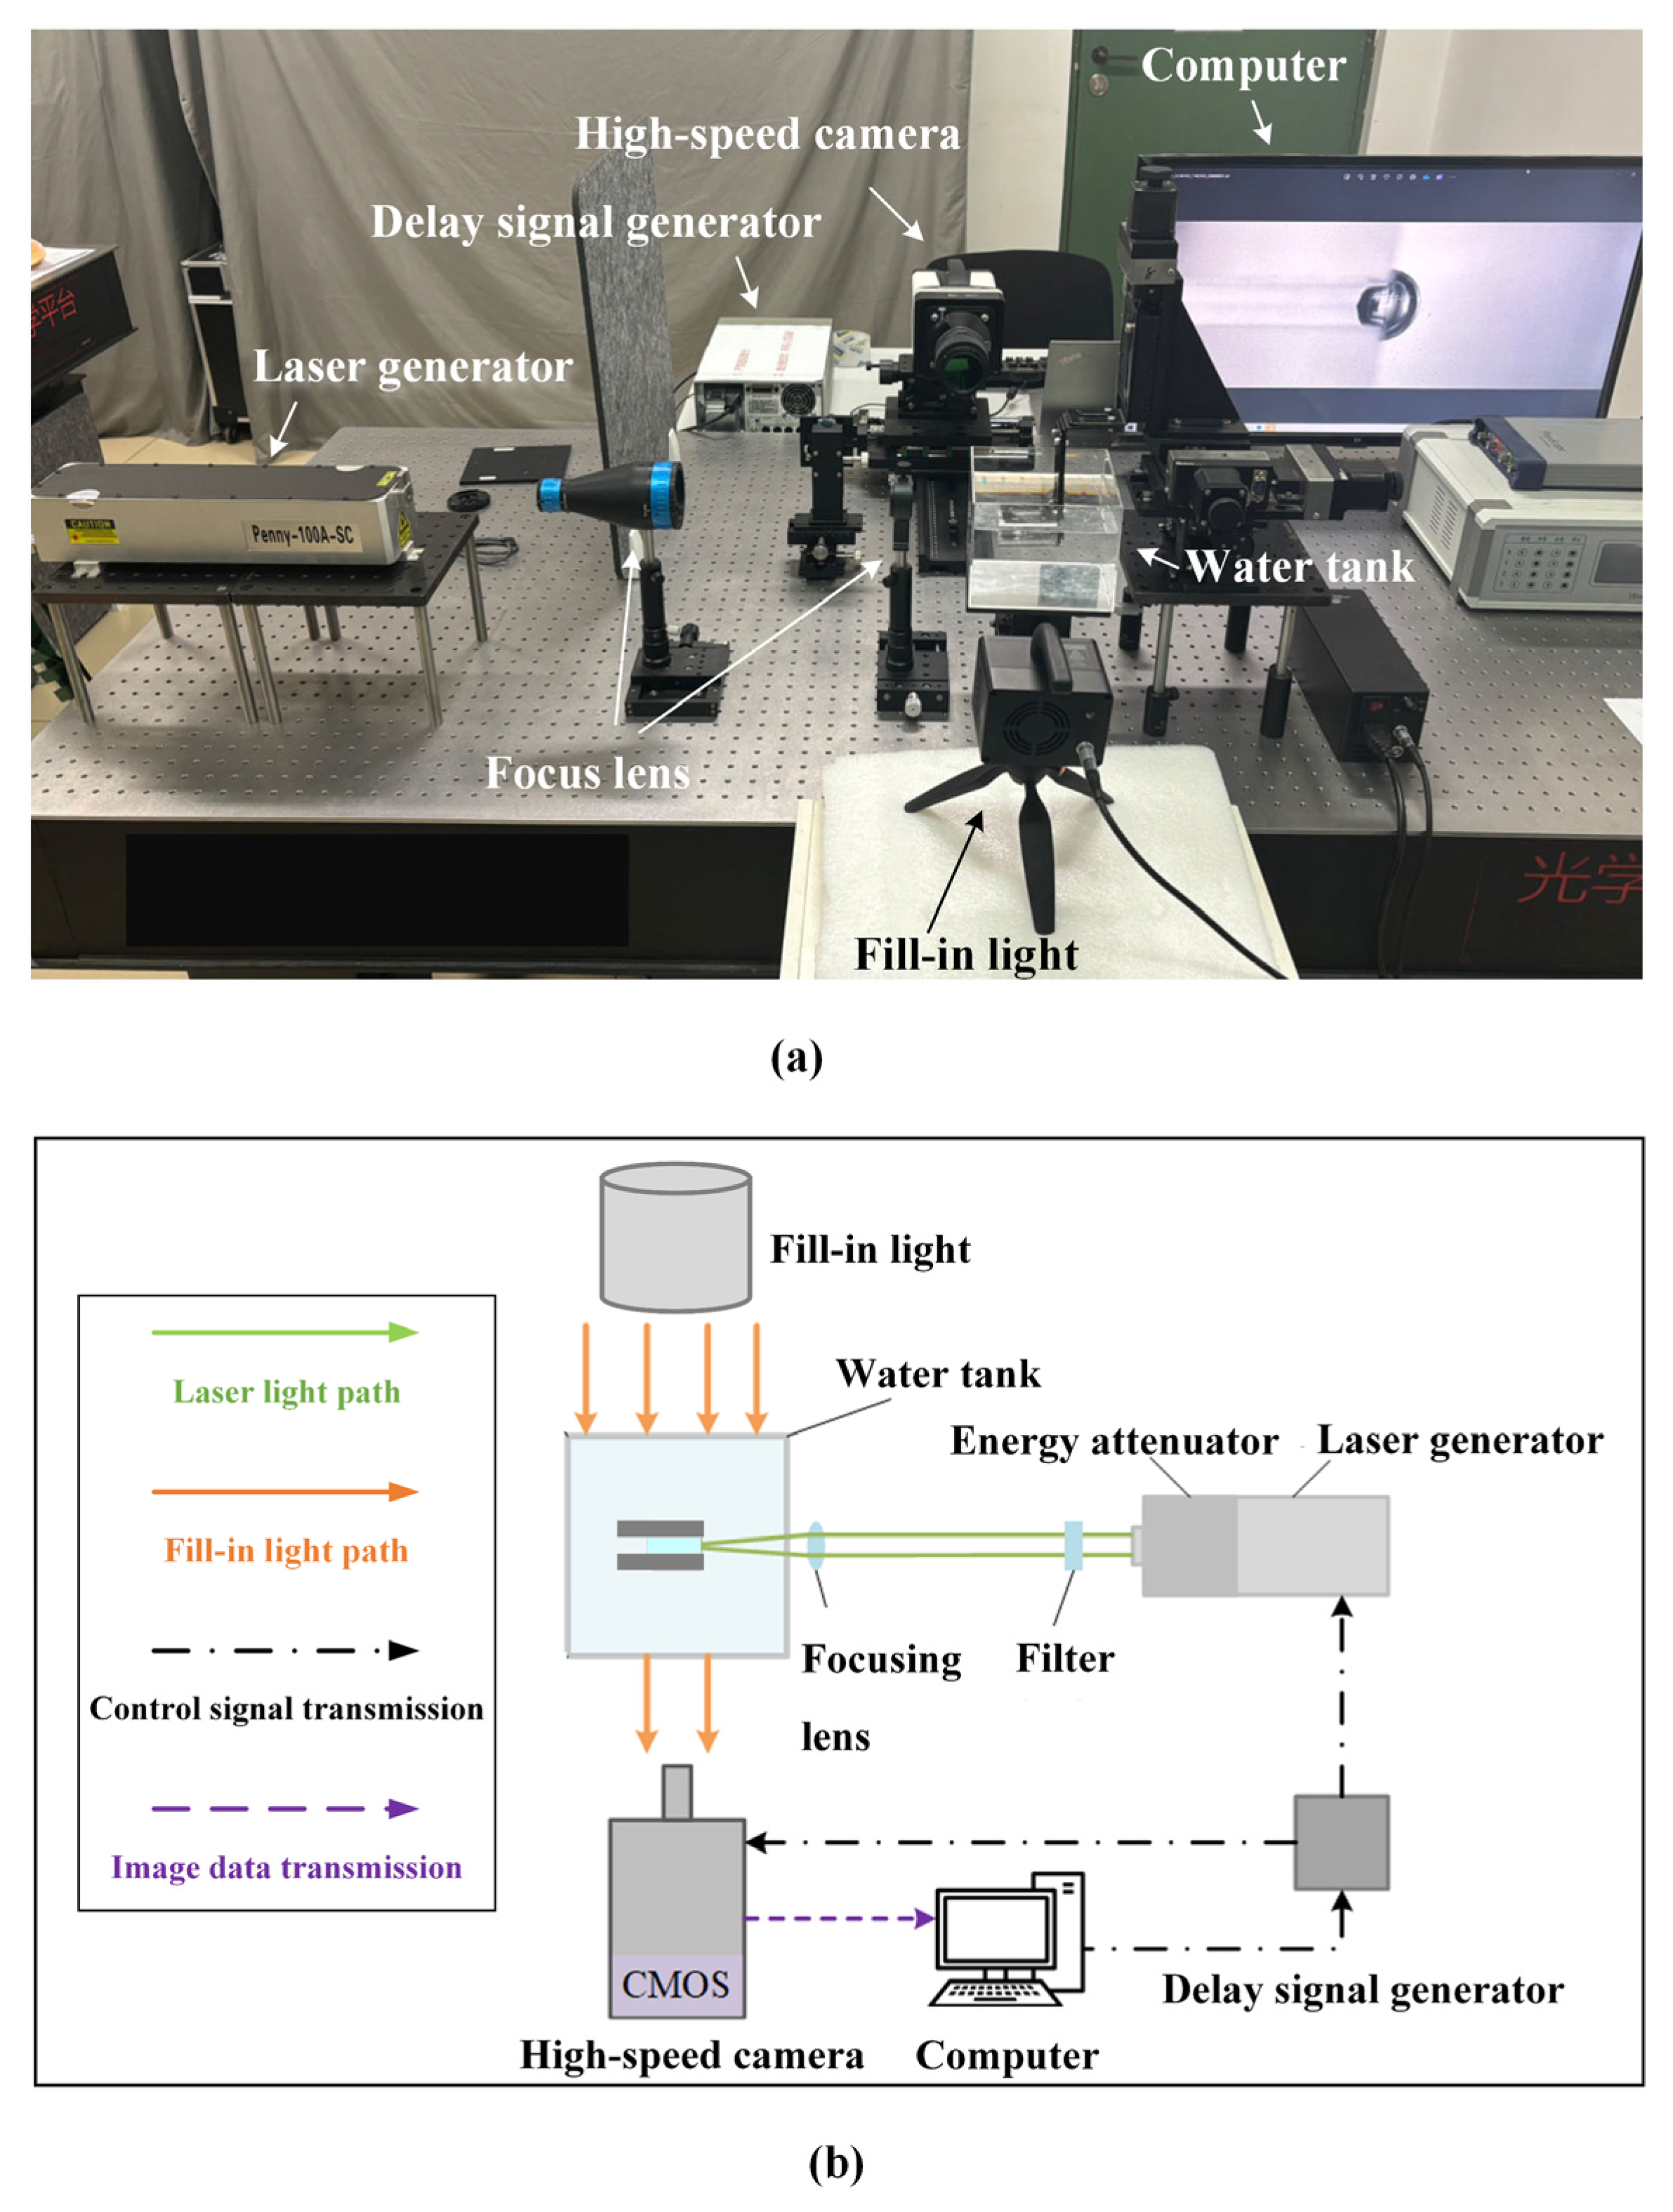
2. Experimental Setup

Figure 1 shows the physical diagram and the schematic diagram of the experimental system. In Figure 1a, the experimental equipment mainly includes a high-speed camera, a delay signal generator, a laser generator, a laser beam expander, a focusing lens, a full-in light, a water tank, glass plates, a three-dimensional, electronically controlled translation table, a computer, and additional accessories. In the experiments, the laser generator provided a high-energy parallel laser, which was focused on with the beam expander and focusing lens to generate plasma and which caused local vaporization of the liquid at the focal point in the narrow gap formed via two parallel plates. Finally, a cavitation bubble was generated near the boundary of the narrow gap. The bubble size could be controlled by adjusting the laser energy, and the relative position of the bubble and the gap boundary could be precisely controlled by adjusting the three-dimensional translation table.
In Figure 1b, the green lines are the laser light path, where the laser passes through the filter, is focused on via the focusing lens in the water tank, and induces a cavitation bubble in the narrow gap between the two glass plates. The orange lines are the fill-in light path formed by the constant light source to illuminate the background. The black dot–dash lines represent the transmission routes of the control signal. In the experiments, the computer transmits the command signals to the delay signal generator, which then sends the precise signals to the high-speed camera and the laser generator. The purple line represents the transmission route of the image data from the camera to the computer. Moreover, Table 1 lists the specific information on the main experimental equipment in Figure 1.
Figure 2 shows the specific structure of the narrow gap and the physical properties of the glass plate surface. Figure 2a shows the three-dimensional gap structure and the related parameters. In this figure, the gray plates are two transparent glass plates. The violet cylinder is the bubble. The green and orange light paths are the laser incidence direction and the camera shooting direction, respectively. A coordinate system was established with a point on the boundary as the origin. The bubble is located in the negative direction of the X-axis, the boundary of the narrow gap is on the Y-axis, and the parallel glass plates are perpendicular to the Z-axis. Cb is the bubble centroid position. Rmax is the maximum bubble radius. l is the distance between the bubble centroid and the boundary. h is the width of the gap between the two plates. In the experiments, the two glass plates were large enough, and the bubble was dominantly affected by the boundary located on the Y-axis. It is worth mentioning that, as l decreased below Rmax, the bubble partially protruded beyond the two plates. The influence of the boundaries in other directions (such as the upper, lower, and left boundaries) can be ignored. In Figure 2b, θ is the contact angle between the water droplet and the glass plate, which was set to 30°.
The dimensionless parameters are defined as
l * = l R max
h * = h R max
Here, l* represents the dimensionless distance between the bubble and the gap boundary. It can affect the degree of anisotropy of the liquid field around the bubble and, thus, affect the collapse pattern and jet of the bubble. h* represents the dimensionless width of the gap. It can reflect the influence degree of the parallel plates on the bubble collapse process and the jet characteristics. In addition, the Reynolds number is defined as [31]
Re = R max ρ h T μ
Here, ρ is the liquid density; T is the period of the bubble from its inception to the first collapse; and μ is the hydrodynamic viscosity. In the present paper, the parameters are set as follows: Rmax = 1.78 mm; h* = 0.73, 0.79, and 0.84; l* = [0, 1.75]; μ = 10−3 g/(m·s); and ρ = 1000 kg/m3. In the case of the above parameters, T is always less than 400 μs. Therefore, it can be calculated that Re > 5782.33 >> 1, and the influence of the gap boundary can be ignored.

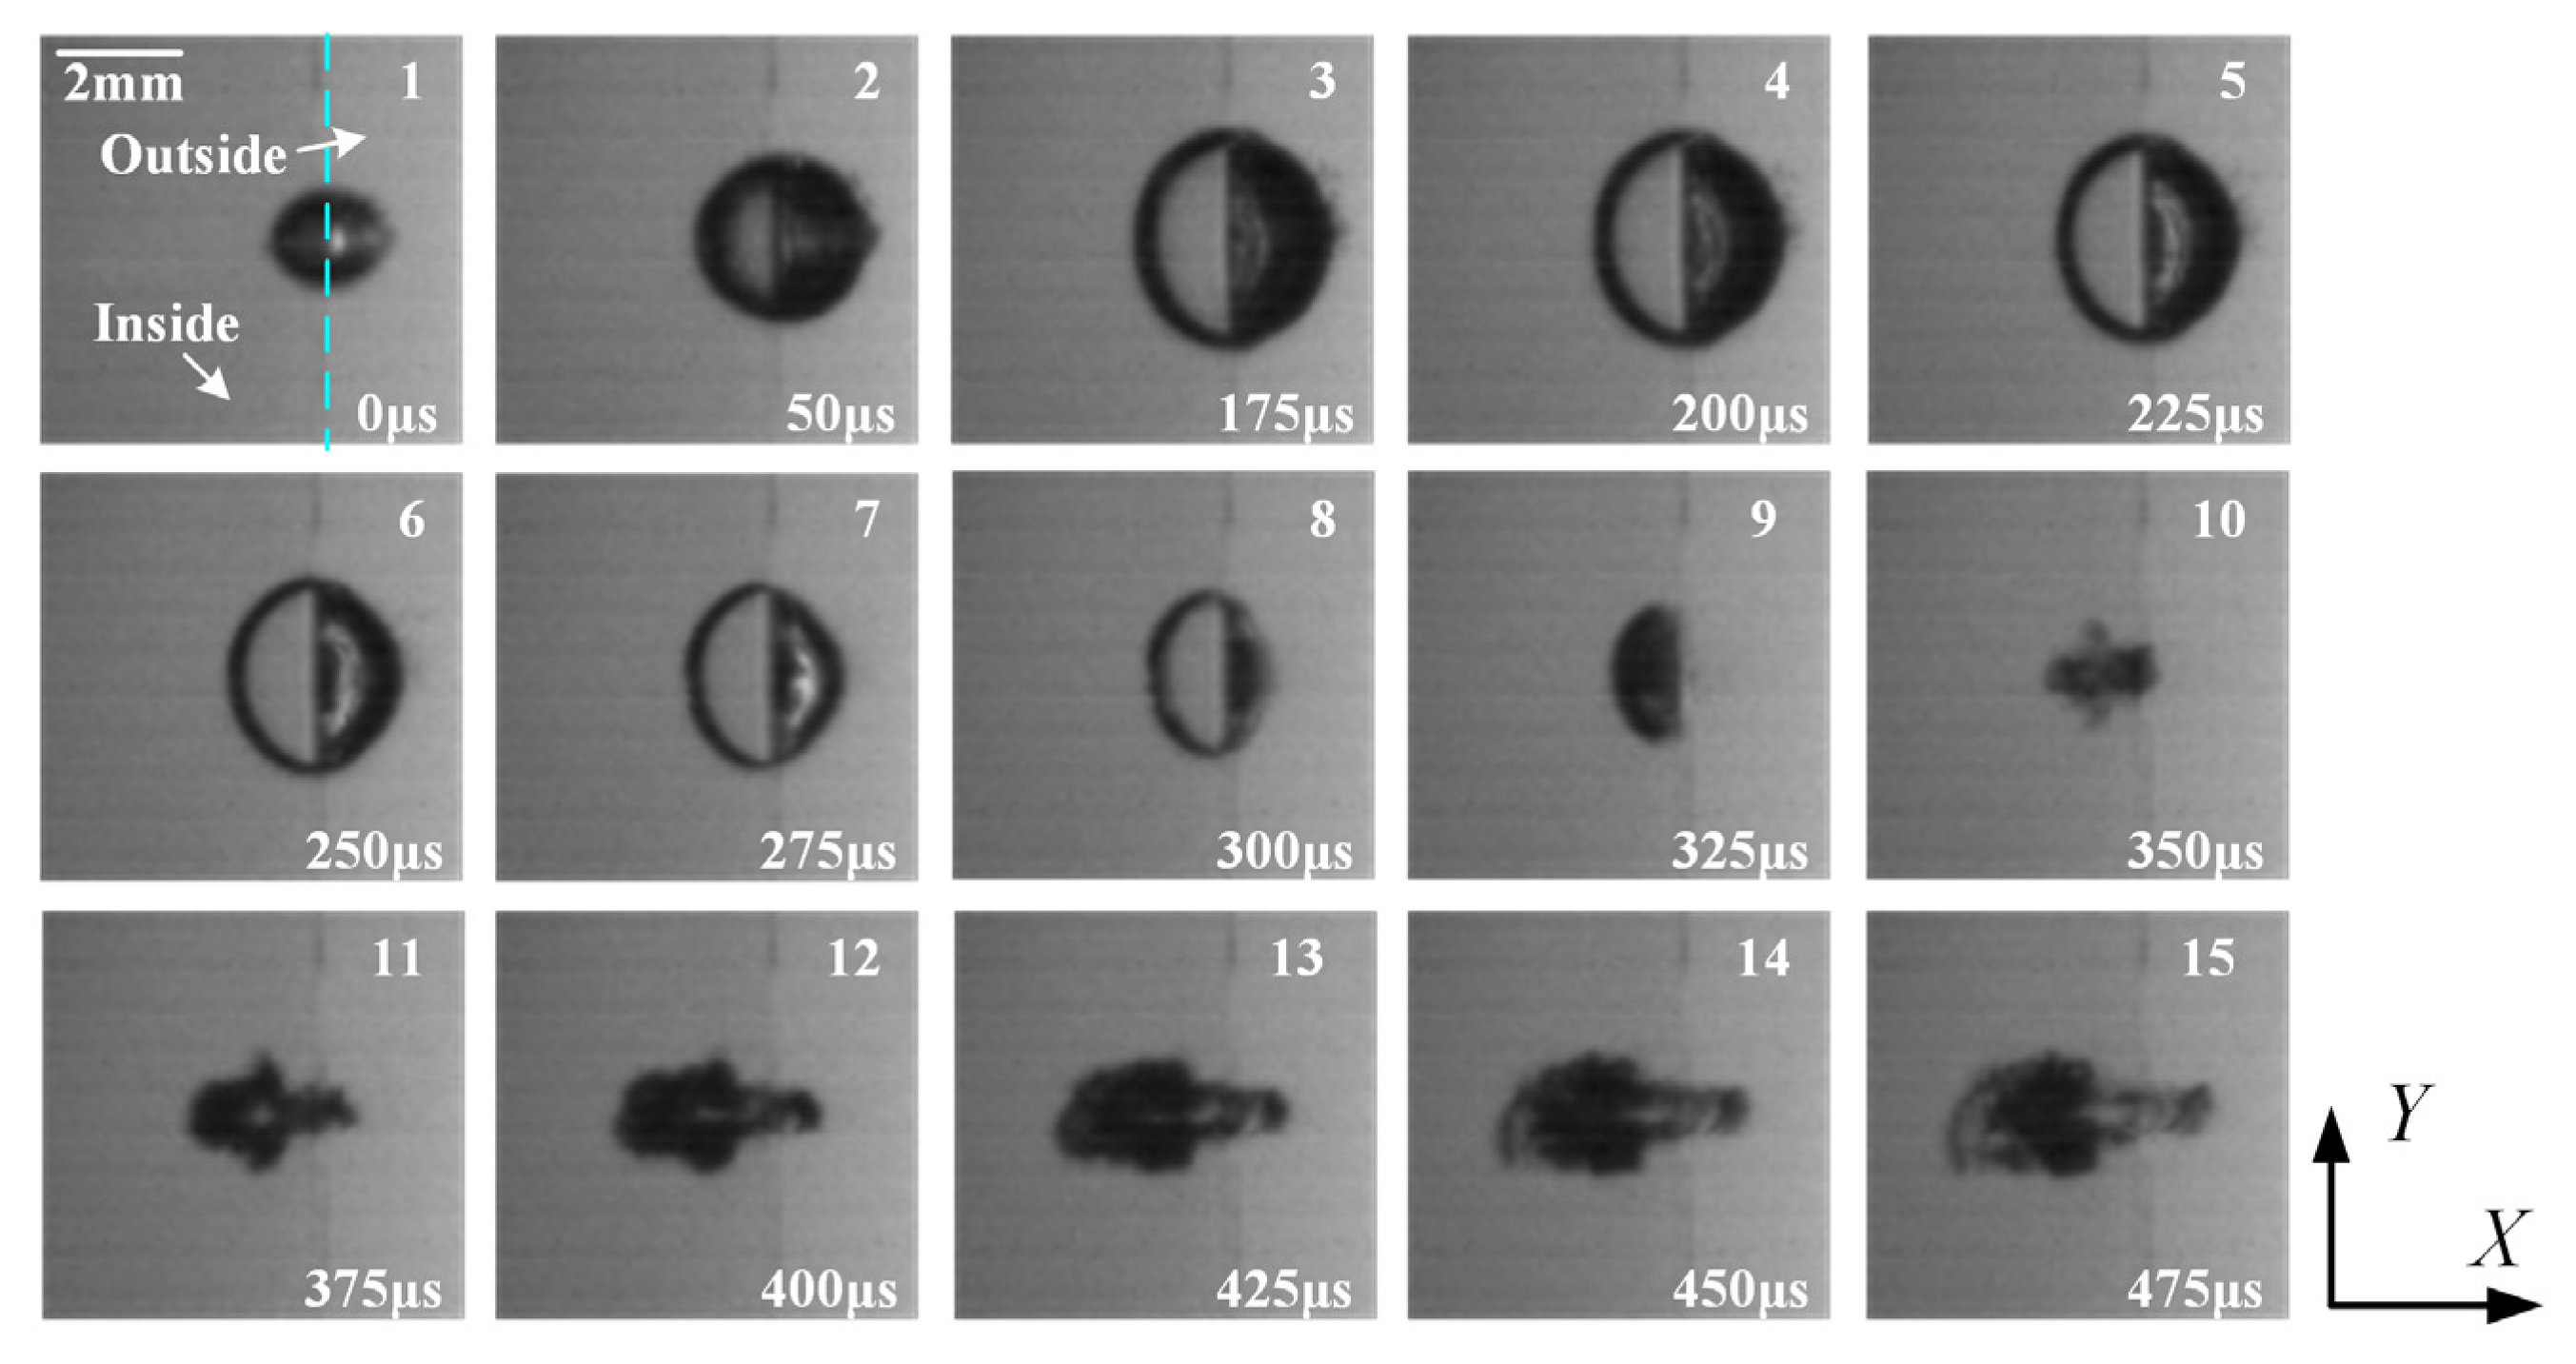
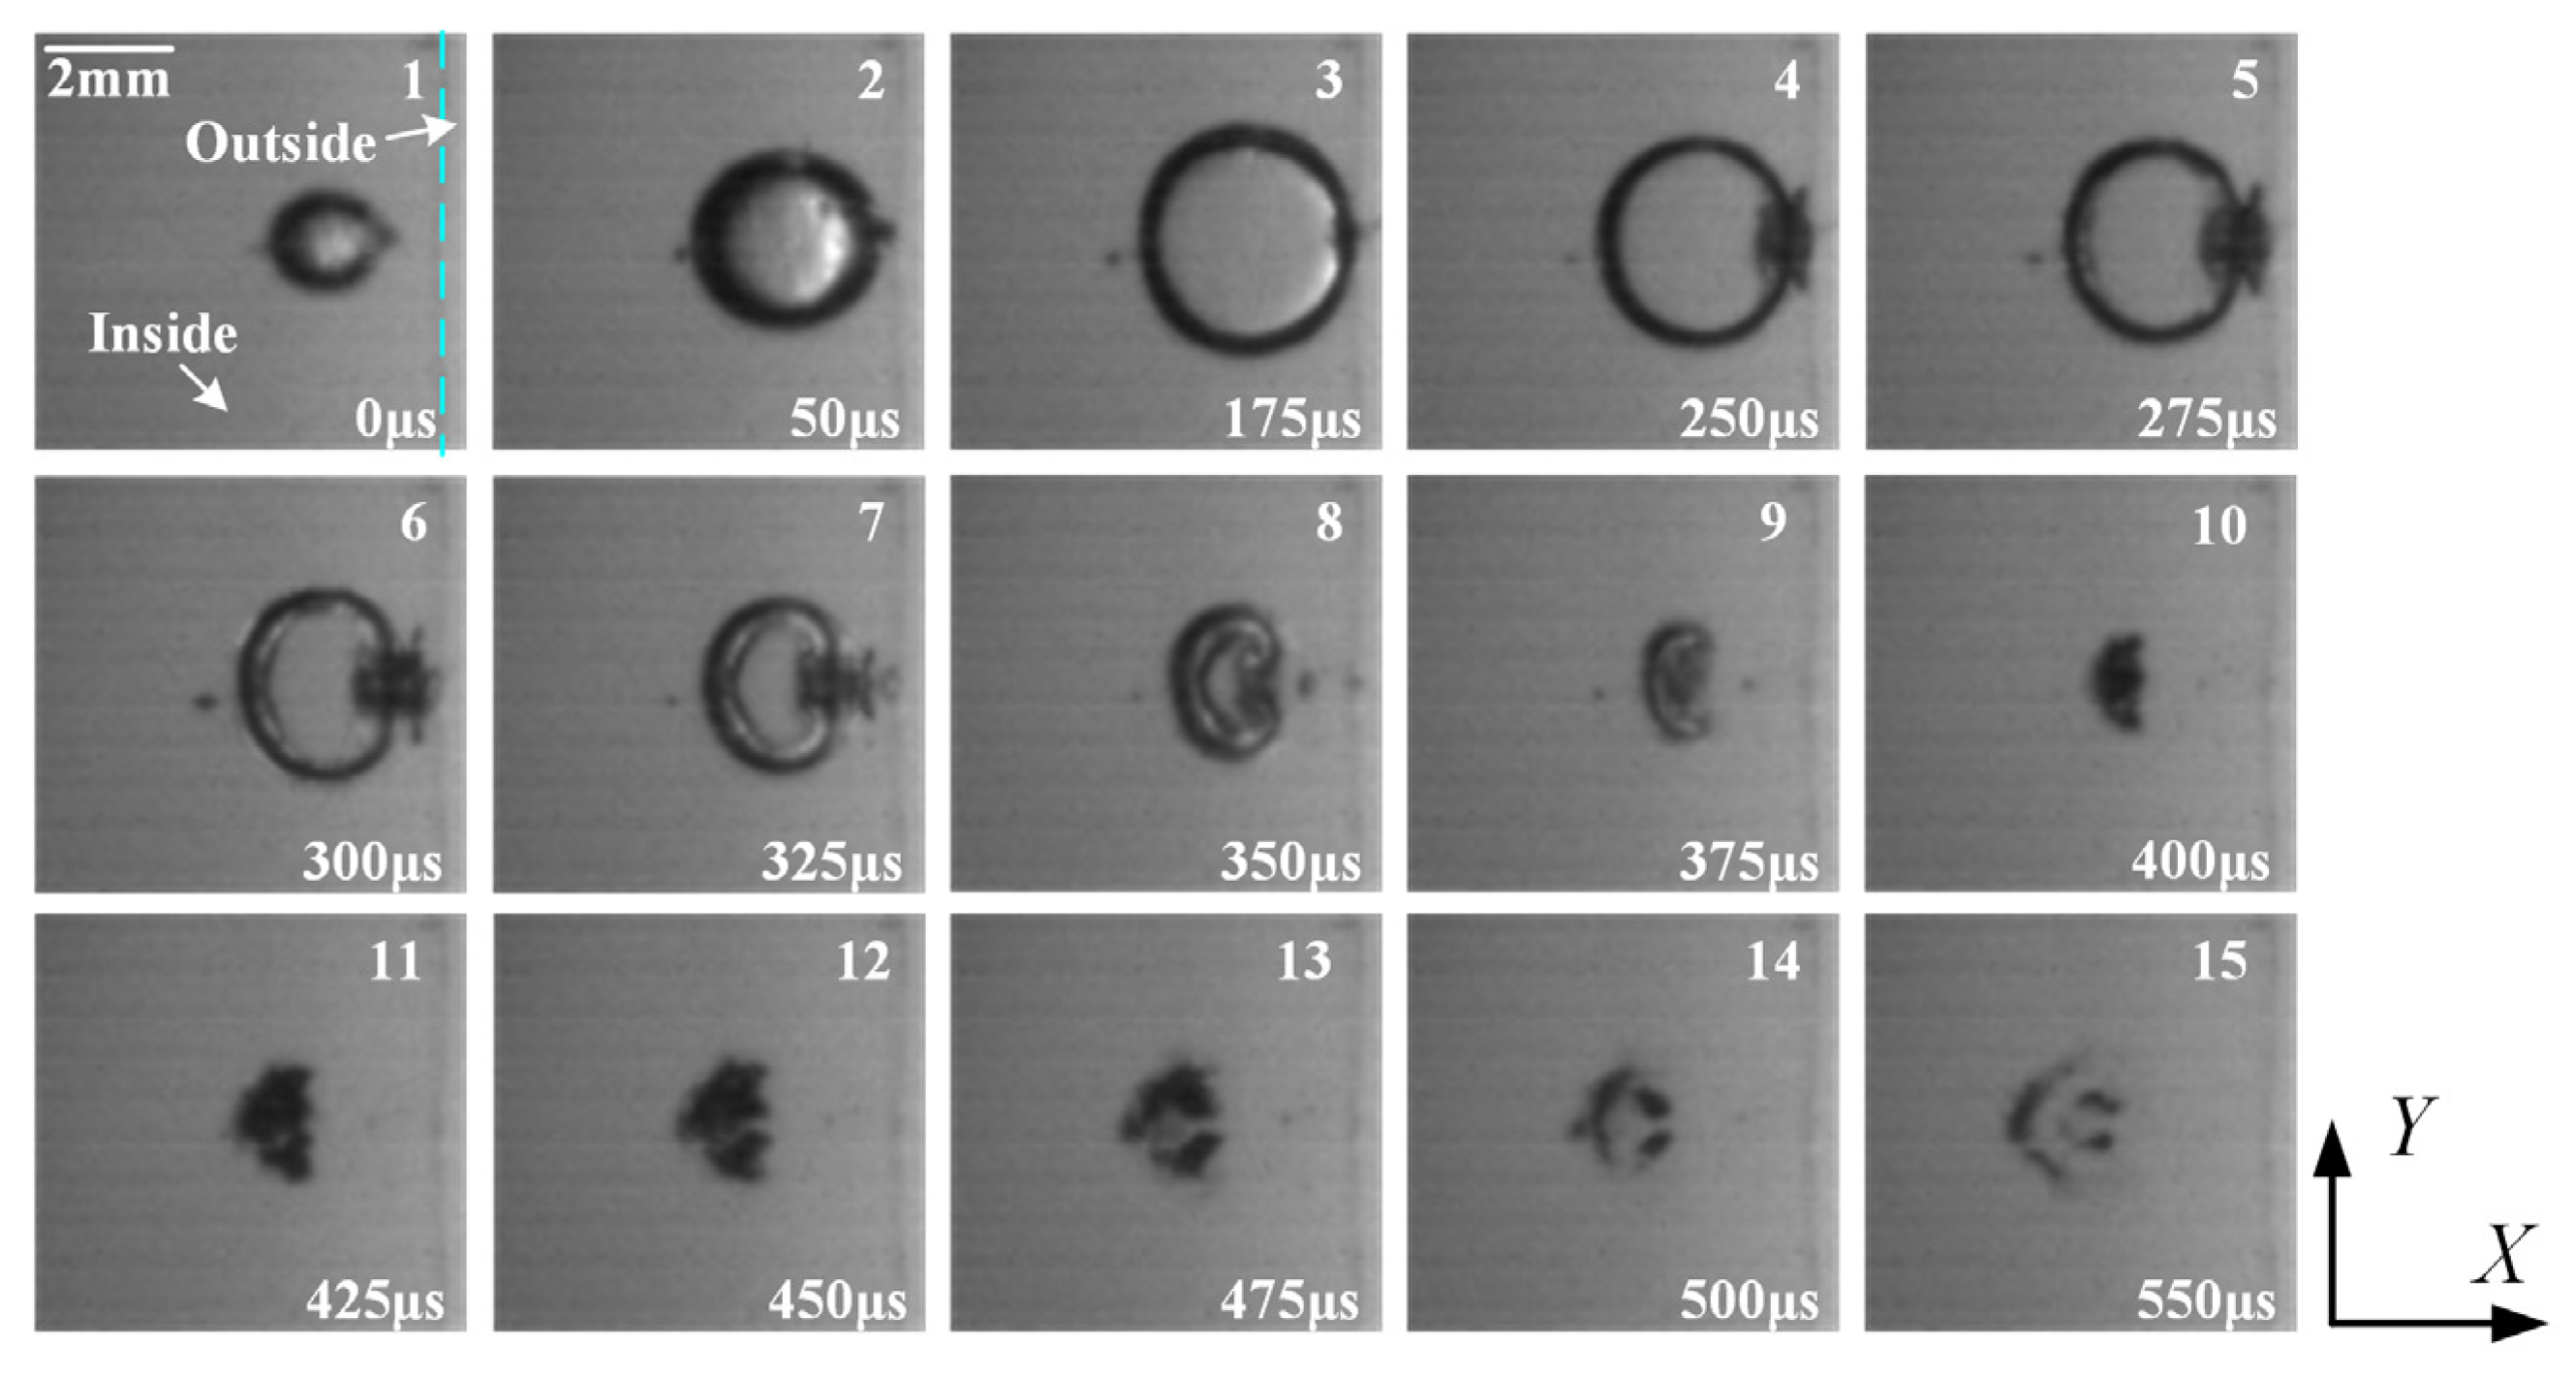
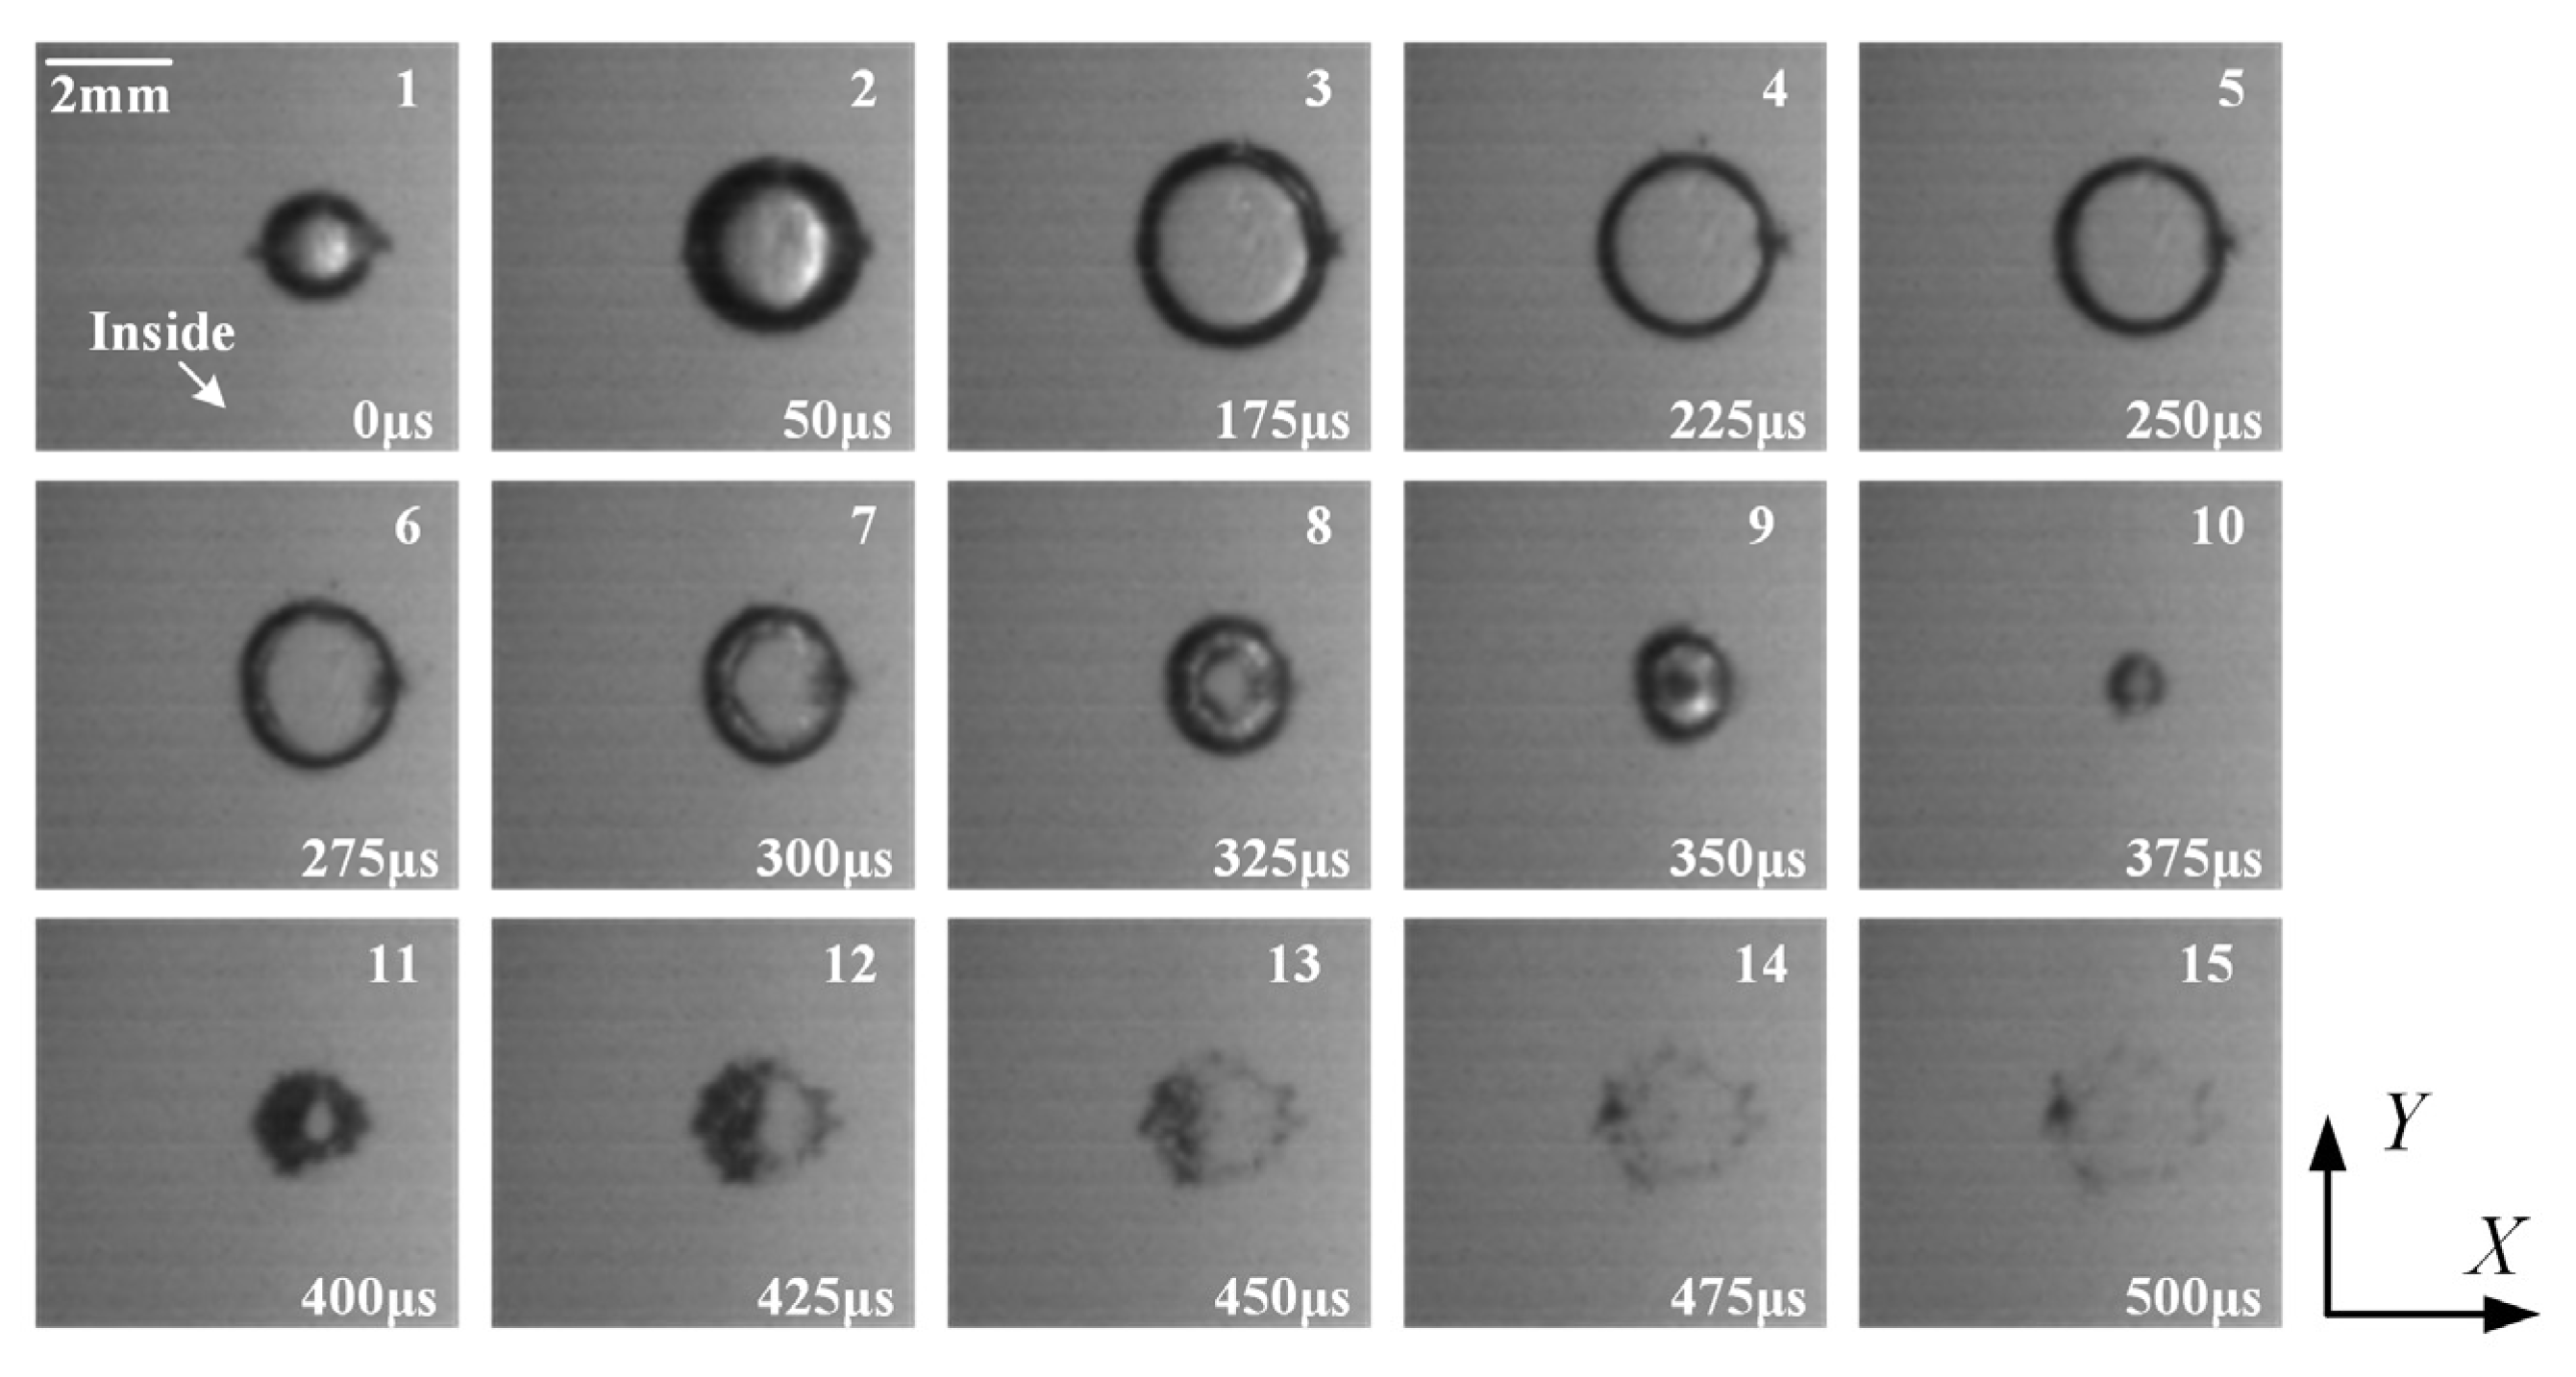
3. Typical Dynamic Behaviors of the Cavitation Bubble

Figure 3, Figure 4 and Figure 5 show high-speed photographs of the bubble at l* = 0.00, 1.00, and 1.75, respectively, including the bubble evolution during the first and subsequent oscillation periods. The dashed blue line is the boundary of the narrow gap. The left and right of the boundary represent the inside and outside of the gap, respectively. In each figure, the coordinate system in the lower right corner corresponds to the X-axis and Y-axis directions in Figure 2a. Frames 1–3 refer to the bubble growth stage; frames 4–10 refer to the collapse stage; and frames 11–15 refer to the rebound stage.
When l* is small (Figure 3), the bubble is partially inside the gap. When the bubble reaches its maximum radius (frame 3), the left half of the bubble is restricted due to the two plates. During the collapse stage, the right side of the bubble shrinks much faster than the left side, and the bubble has completely retracted into the gap (frame 9). Subsequently, the left surface of the bubble is penetrated with a jet towards the gap (frame 10). During the rebound stage, under the influence of the collapse jet, the left side of the bubble forms a tip and continues to move to the left, which is generally called the vapor jet. Meanwhile, a counter-vapor jet appears on the right side of the bubble, and it partially extends out of the gap.
When l* is medium (Figure 4), the bubble is completely inside the gap but still very close to the boundary. When the bubble reaches its maximum radius (frame 3), it appears as a standard cylindrical shape with its right endpoint exactly touching the boundary. During the collapse stage, a coronal structure is generated on the right side of the bubble (frame 4). As the bubble collapses and moves away from the boundary, the coronal structure gradually shrinks and disappears, and then the right side of the bubble shrinks rapidly, forming a depression (frame 8). During the rebound stage, the bubble is divided into three bubble clouds (frame 14). The bubble cloud on the left appears in an arc shape, and it keeps moving to the left. Meanwhile, the two bubble clouds behind it also move to the left, along with spin in opposite directions.
When l* is large (Figure 5), the bubble is completely inside the gap and is far from the boundary. The bubble is only weakly affected due to the boundary. During the growth and collapse stages, the bubble maintains a regular round shape. During the rebound stage, it is in the shape of a hollow cloud, it evenly spreads, and then it dissipates rapidly.
In addition, another camera shooting view was also considered. Figure 6 shows high-speed photographs from the right-side view at l* = 0.00, which corresponds to Figure 3. The coordinate system in the lower right corner corresponds to the Y-axis and Z-axis directions in Figure 2a. During the growth stage, the curvature of the upper and lower surfaces of the bubble gradually decreases and becomes almost flat when the bubble reaches its maximum radius (frame 3). During the collapse stage, the shrinkage speed of the bubble in the horizontal direction is greater than that in the vertical direction. Meanwhile, the depressions appear on the upper and lower surfaces of the bubble. Eventually, the bubble completely shrinks into the gap.

4. Quantitative Analysis of the Bubble Behaviors

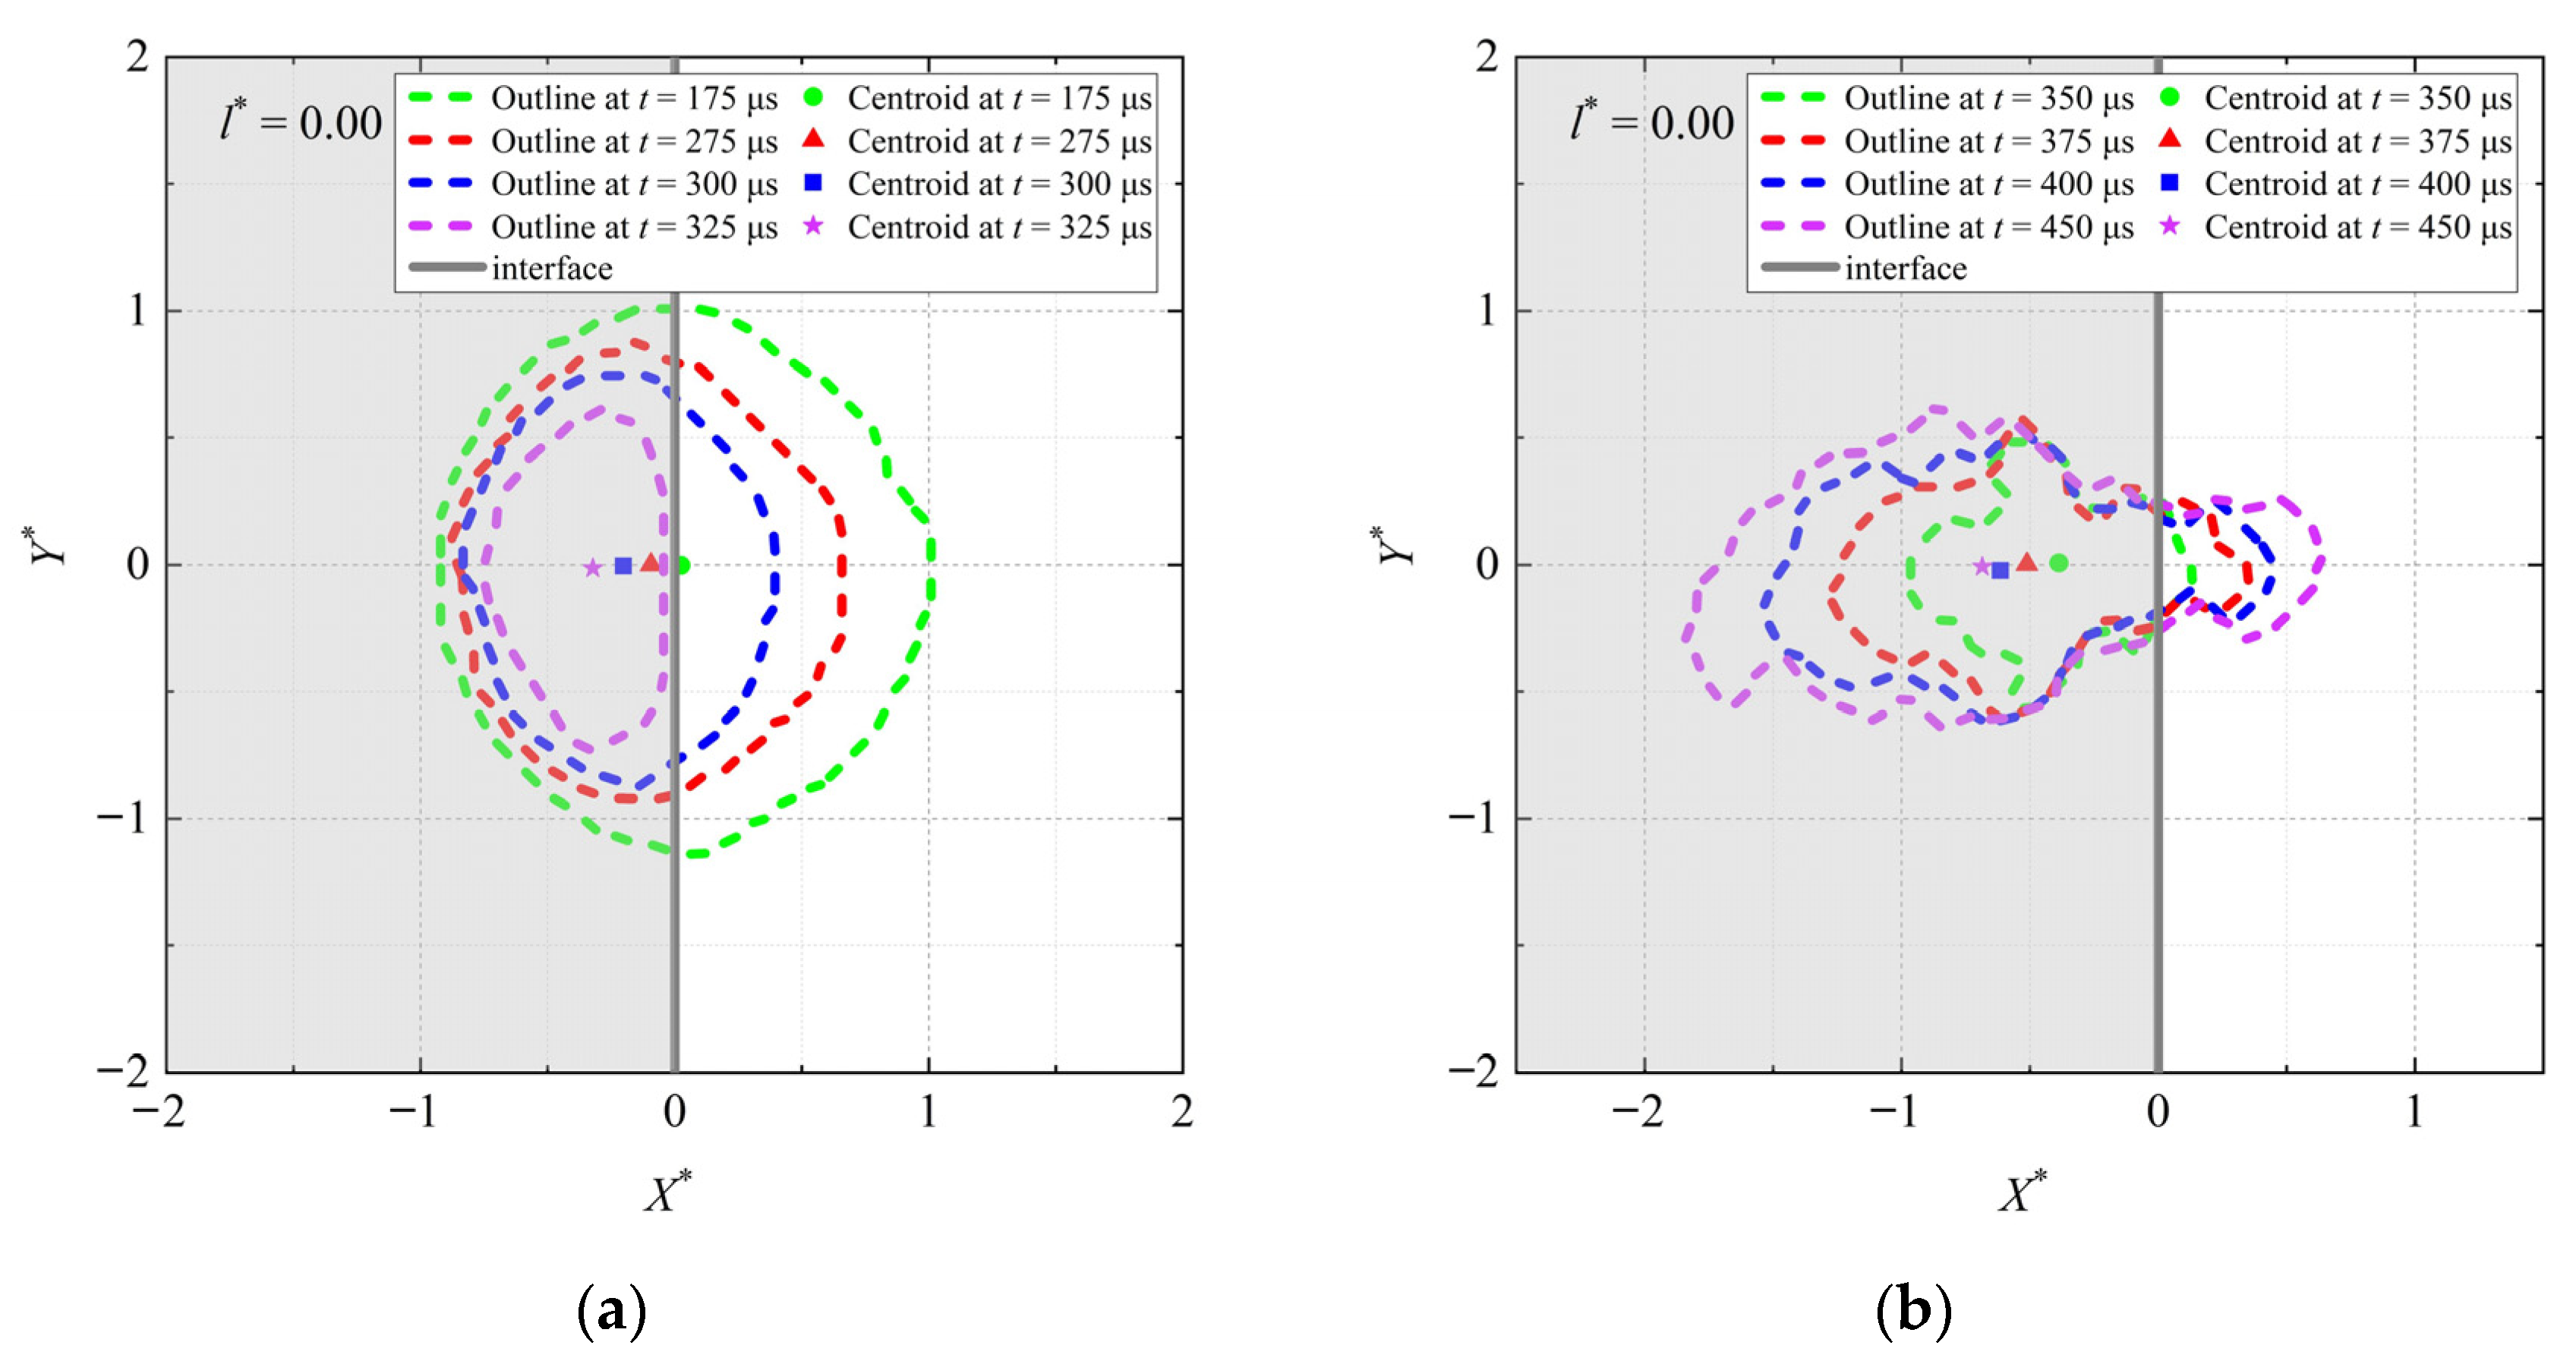
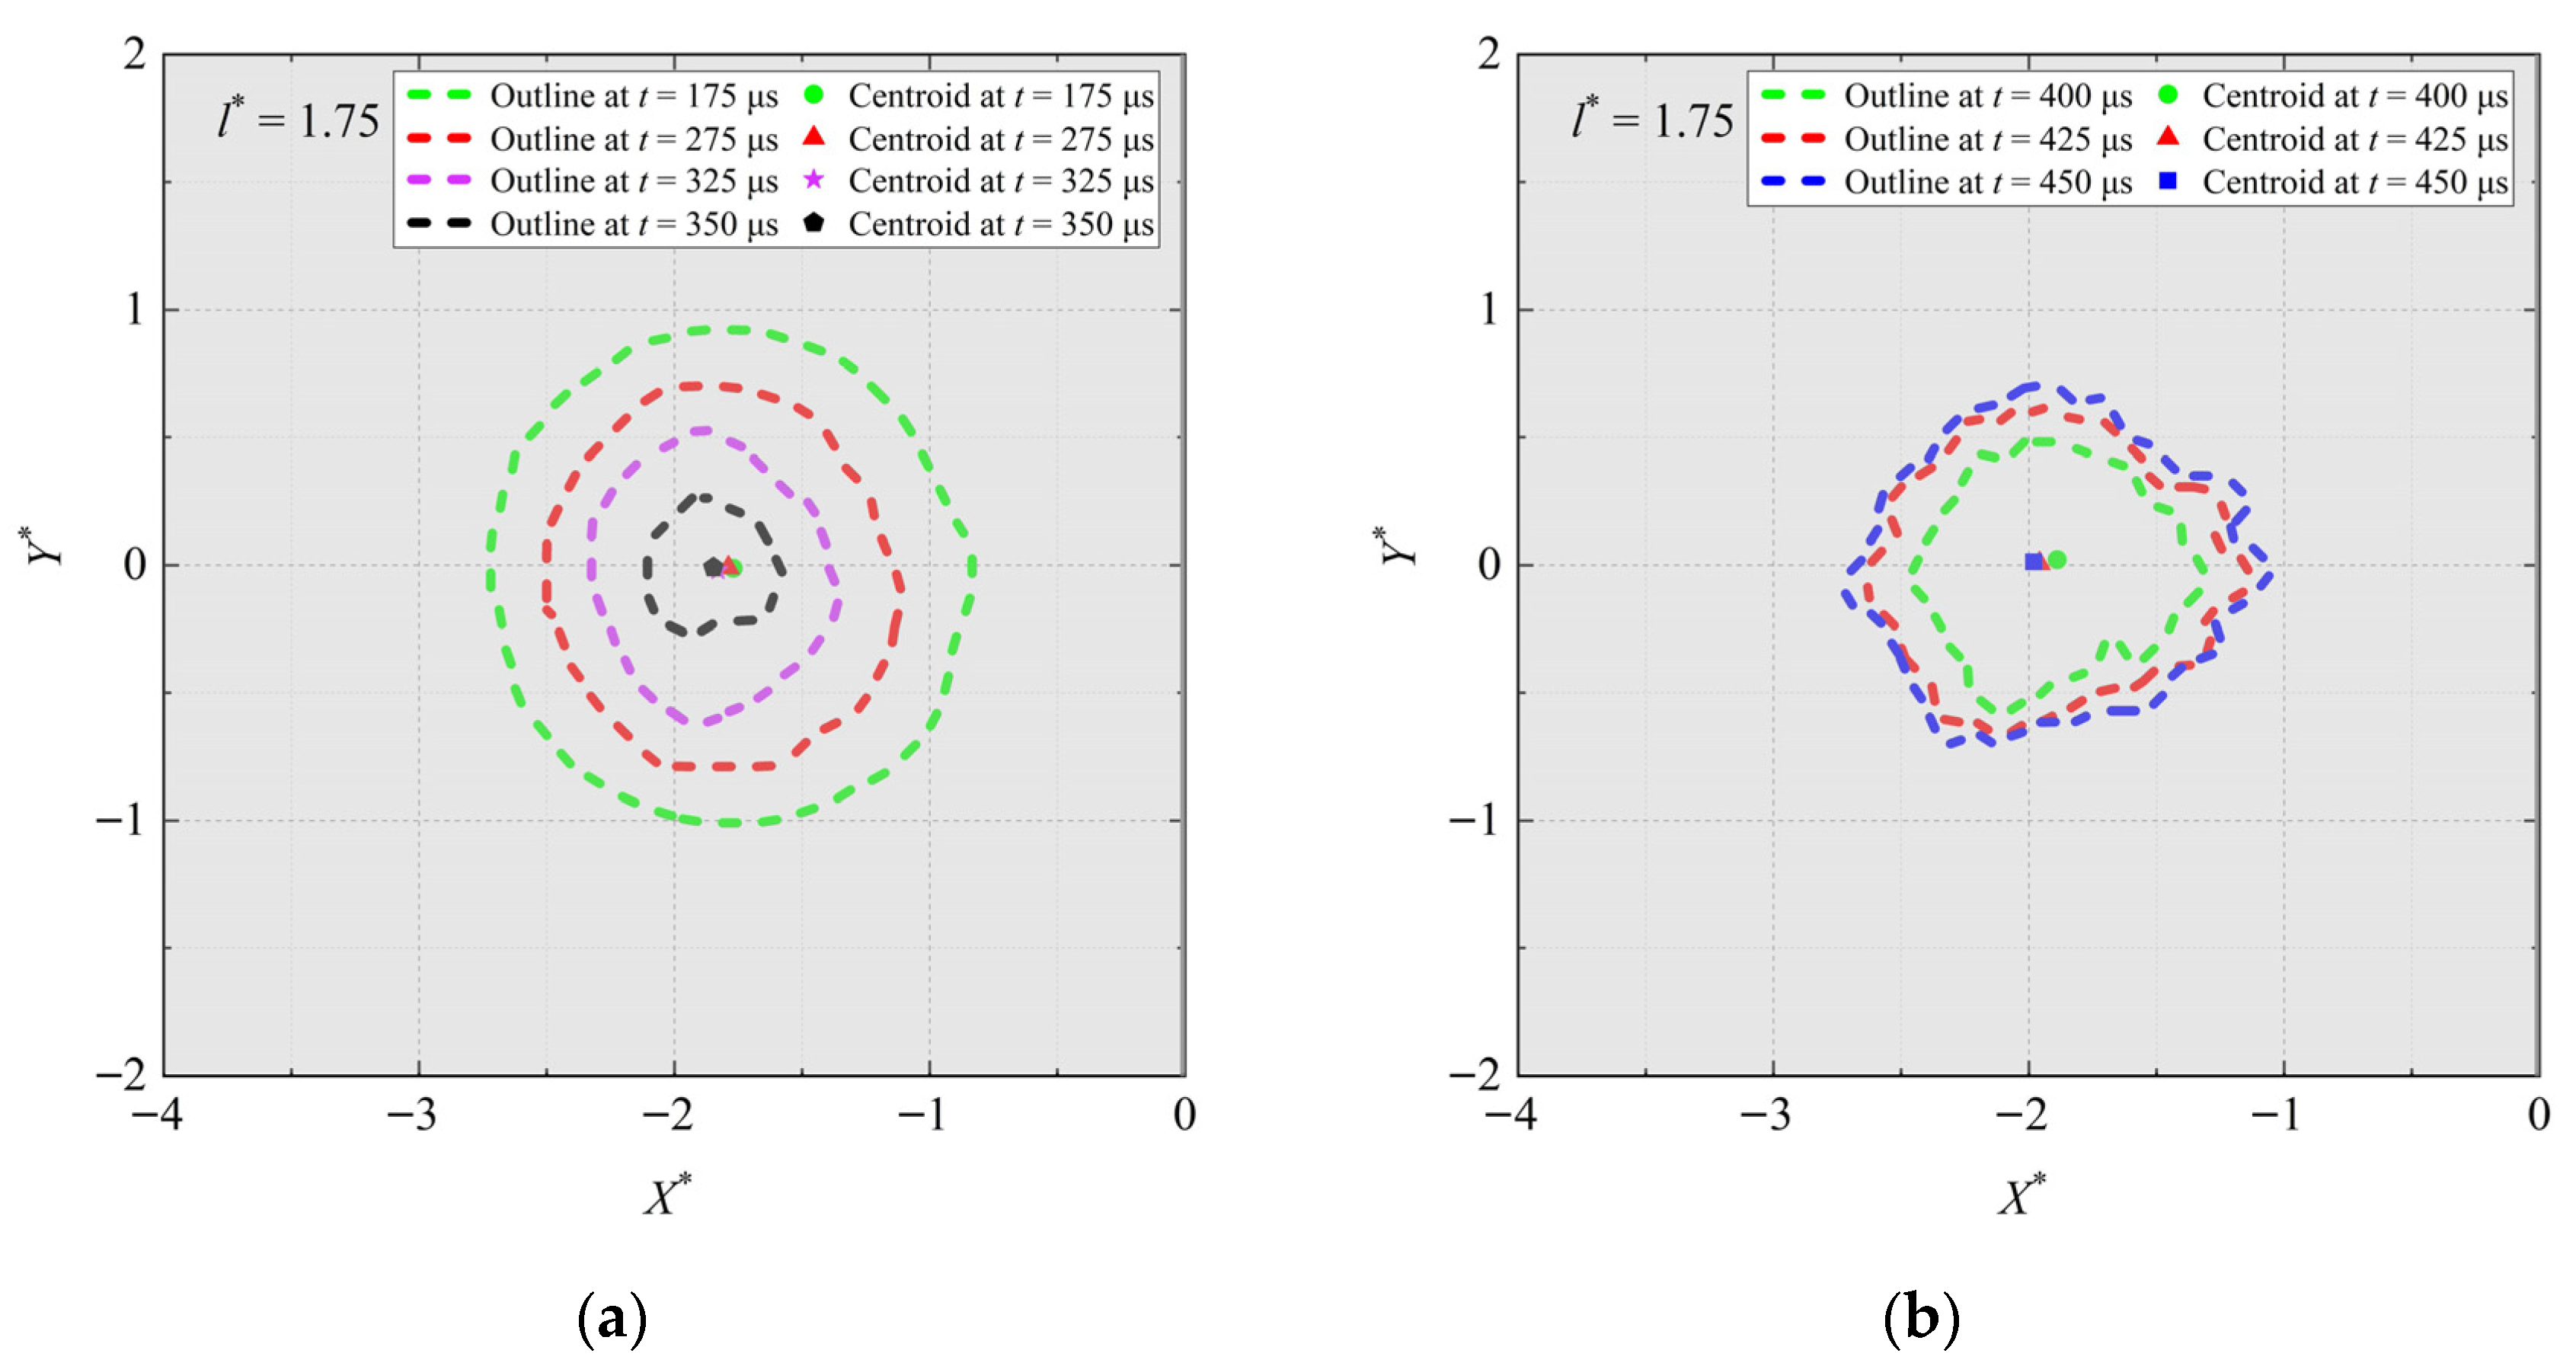
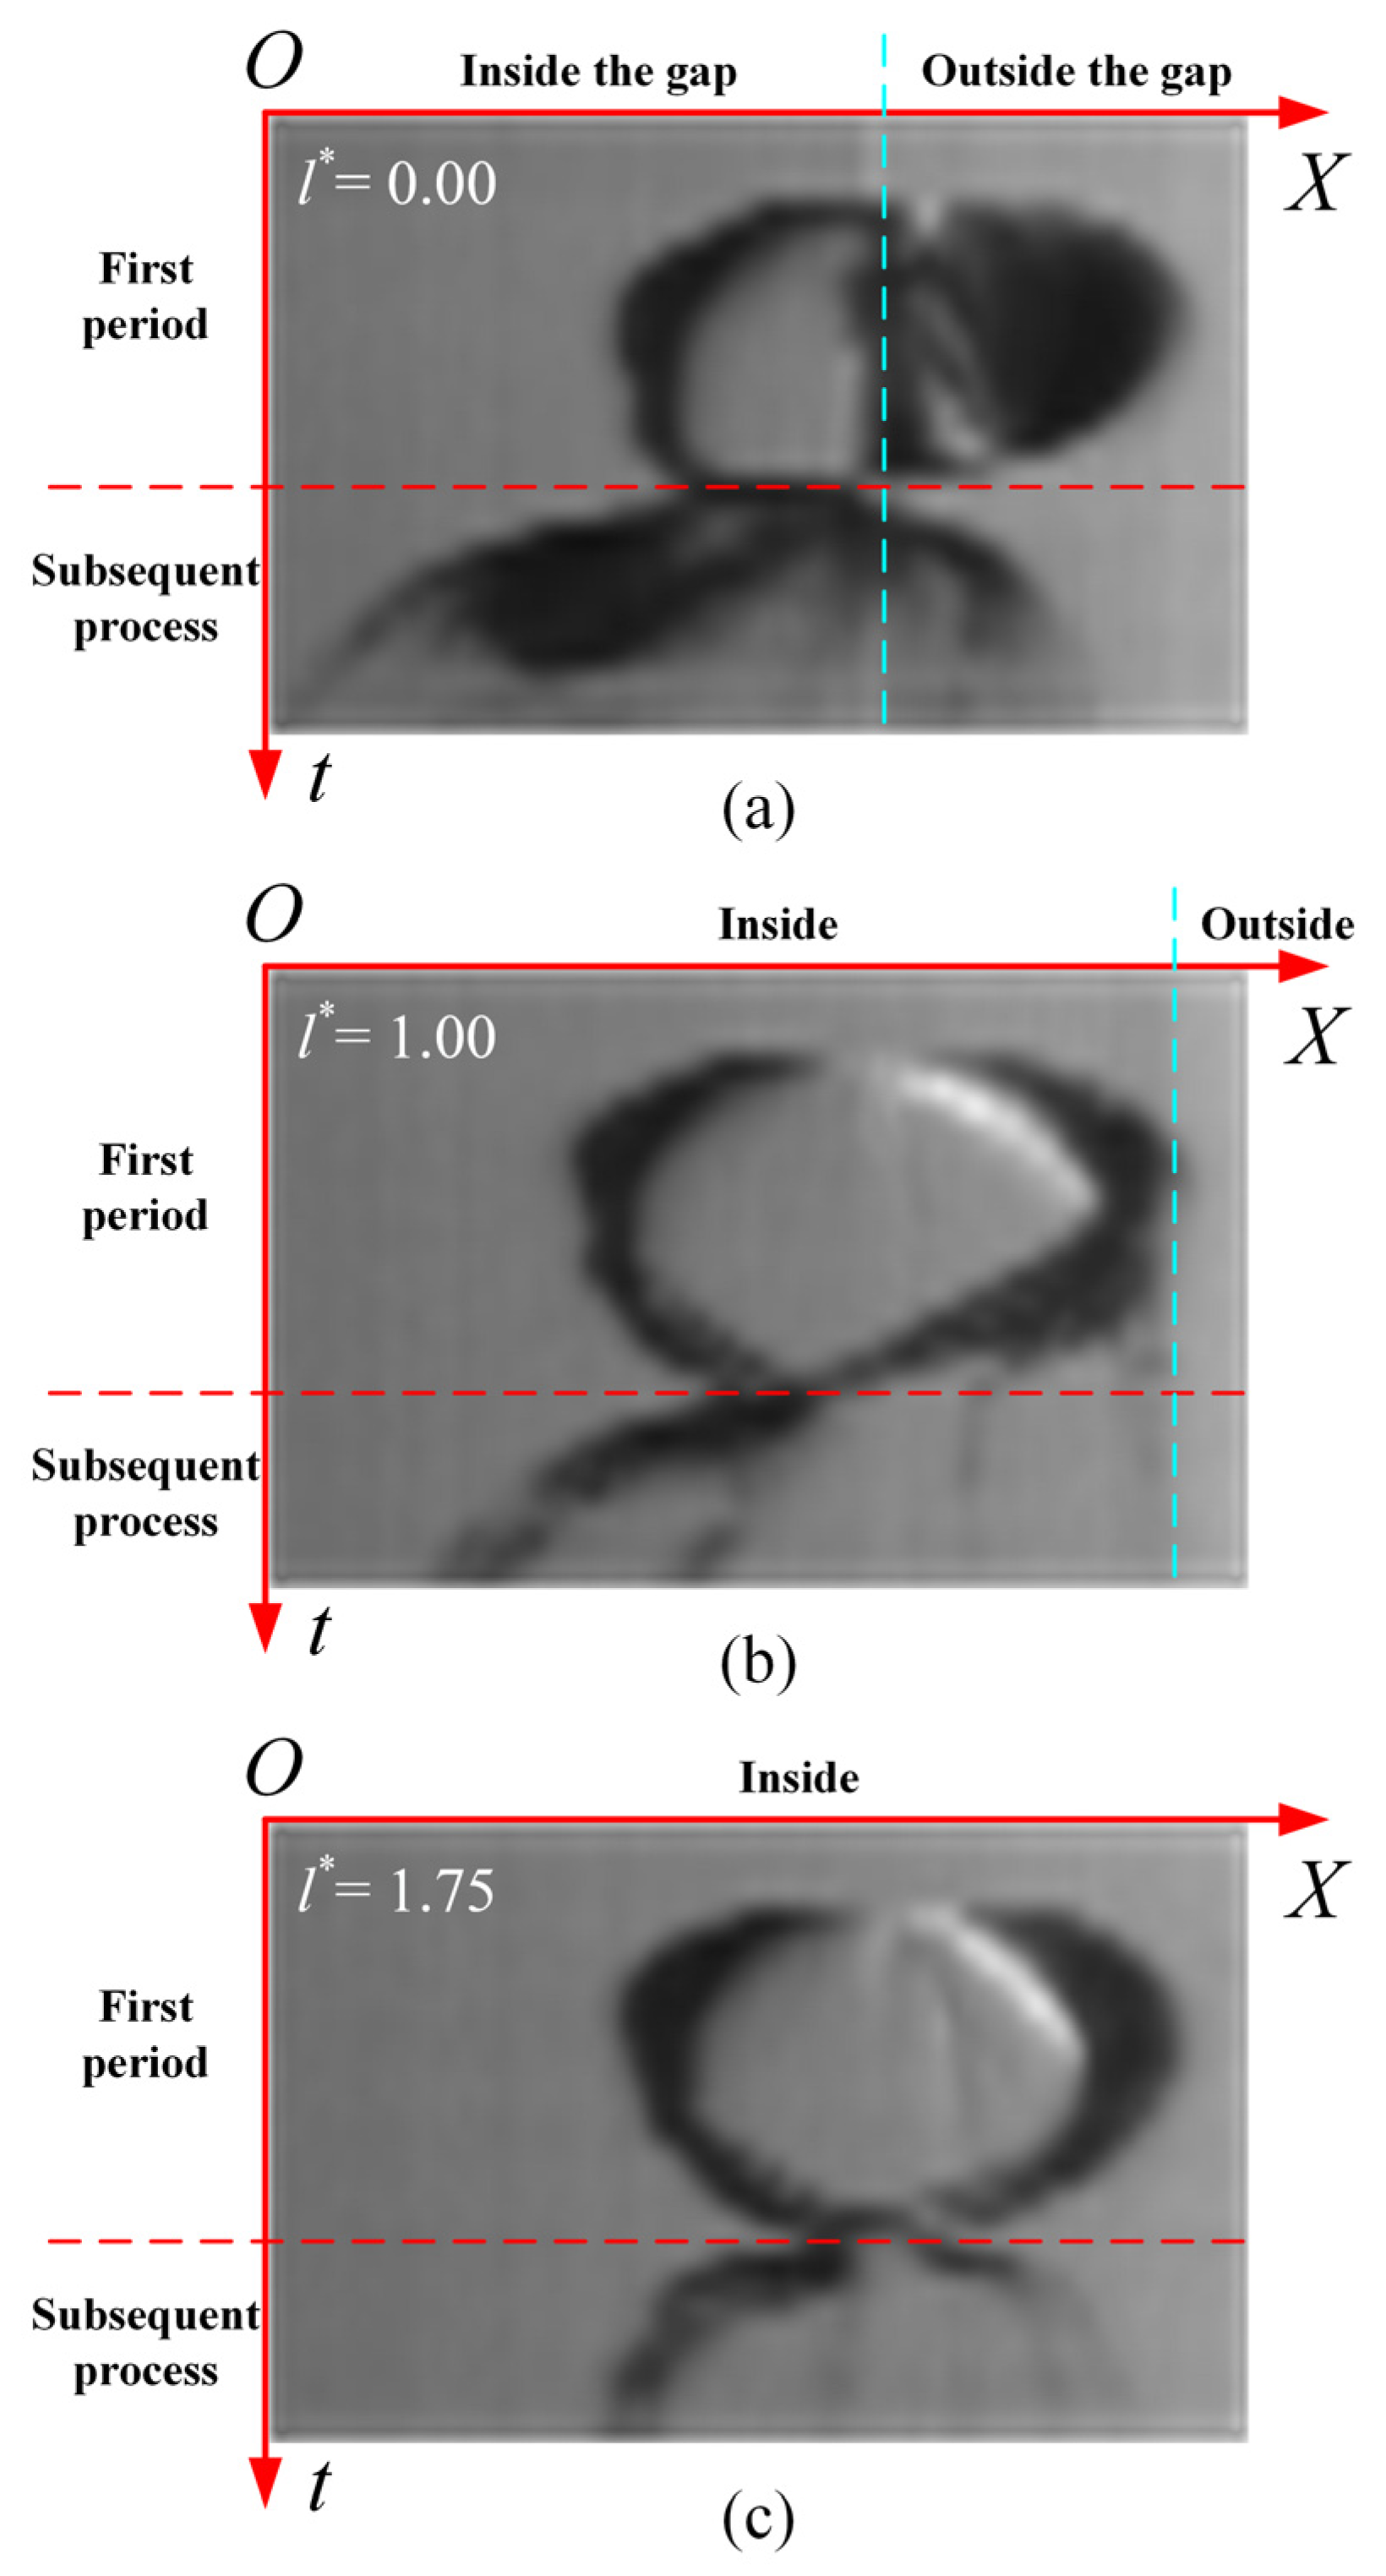
4.1. Bubble Outlines and Time Stacks

Figure 7, Figure 8 and Figure 9 show bubble outlines at l* = 0.00, 1.00, and 1.75, respectively. Among them, the sub-figures (a) and (b) correspond to the collapse and rebound stages, respectively. In each sub-figure, the gray and white areas represent the inside and outside of the gap. In terms of the time order, the outline and the centroid of the bubble correspond to green, red, blue, and purple in turn.
When l* is small (Figure 7), during the collapse stage (Figure 7a), the right side of the bubble shrinks at the fastest speed, the left side shrinks at the slowest speed, and the upper and lower sides have a moderate shrinkage speed. Meanwhile, the bubble centroid is constantly moving into the gap. It can be considered that the inhomogeneity of the pressure around the bubble and the influence of the viscous boundary layer are the main reasons for the bubble’s anisotropic deformation and translational movement. During the rebound stage (Figure 7b), the bubble expands significantly in both the left and right directions, and the expansion on the left side is much more dramatic, causing the bubble centroid to continuously move to the left.
When l* is medium (Figure 8), during the collapse stage (Figure 8a), the right side of the bubble shrinks irregularly, while the other sides shrink normally and are hardly affected due to the boundary. Meanwhile, the bubble centroid is still moving towards the left. During the rebound stage (Figure 8b), the bubble’s left side expands to the left, while the right side also exhibits a slight leftward movement. And the bubble centroid continues to move towards the left. When l* is large (Figure 9), there is no significant difference in the shrinkage or expansion of the bubble in all directions. And the bubble centroid just moves slightly towards the left.
Figure 10, Figure 11 and Figure 12 show composite images of high-speed photographs of the bubble over time at the gap width of h* = 0.79, 0.73, and 0.84, respectively. The subfigures (a–c) correspond to l* = 0.00, 1.00, and 1.75, respectively. In each sub-figure, the abscissa represents the X-axis defined in Figure 2a, and the ordinate represents the time. The left and right sides of the dashed blue line refer to the inside and outside of the narrow gap, respectively. The upper and lower sides of the dashed red line refer to the bubble’s first oscillation period and subsequent processes, respectively.
As shown in Figure 10 with a medium h*, for different l* values, there are obvious differences in the shrinkage speed of the right endpoint of the bubble during the collapse stage, as well as the moving direction of the left and right endpoints of the bubble during the rebound stage. During the collapse stage, as l* increases, the shrinkage speed of the bubble’s right endpoint gradually decreases. During the subsequent processes, as l* increases, the moving direction of the bubble’s left endpoint is always towards the left, and its moving distance gradually shortens. However, the moving direction of the bubble’s right endpoint changes. It moves towards the right at l* = 0.00, towards the left at l* = 1.00, and towards the right at l* = 1.75.
By comparing Figure 10, Figure 11 and Figure 12, it can be found that the influence of h* is mainly reflected in the rebound and subsequent processes. When the bubble is to l* = 0.00, as h* increases, the moving distance of the bubble’s left endpoint gradually shortens. The bubble cloud’s expansion degree is more concentrated. When the bubble is at l* = 1.75, as h* increases, the movement direction of the bubble’s right endpoint changes from the left to the right. The bubble cloud’s expansion degree is even less concentrated. In addition, the boundary has a larger spatial influence range (i.e., the range of l*) on the bubble dynamics for a smaller gap width.

4.2. Bubble Feature Points

Figure 13 shows the moving distances of the bubble’s left and right endpoints during the collapse stage over time. Figure 13a–c correspond to l*= 0.00, 1.00, and 1.75, respectively. In the figure, s represents the distance between the position of the bubble’s left/right endpoint at a certain moment and at the moment when the bubble reaches its maximum radius. When l* is small (Figure 13a), the difference in the movement of the two endpoints gradually increases over time. Among them, the moving distance of the left endpoint slowly increases, and its total moving distance during the collapse stage is quite small, about 0.22 Rmax. In contrast, the moving distance of the right endpoint increases significantly and becomes quite large at the end of the collapse, about 1.04 Rmax. When l* is medium (Figure 13b), the moving distances of the two endpoints mildly increase and are almost the same at the early collapse stage. But the difference between them suddenly increases at the end of the collapse. In this stage, the moving velocity of the right endpoint increases rapidly due to the disappearance of the coronal structure and the appearance of the depression on the bubble’s right side. During the entire collapse process, its moving distance is about 1.00 Rmax. When l* is large (Figure 13c), the moving distances of the left and right endpoints are similar. During the collapse process, the moving distances of the left and right endpoints of the bubble are 0.56 Rmax and 0.81 Rmax, respectively. In addition, when comparing the cases with different l* values, it can be found that, as l* increases, the total moving distance of the left endpoint during the collapse stage gradually increases and that of the right endpoint behaves conversely. With the increase in l*, the difference in the moving distance between the left and right endpoints of the bubble gradually decreases. Specifically, at l* = 1.0 and 1.75, the differences in the moving distances of the two endpoints at the end of the collapse are 68% and 10%, respectively, of that in the case at l* = 0.
To further analyze the difference in the movement of the left and right endpoints of the bubble during the collapse stage, Figure 14 shows the change to the difference in moving distance between the two endpoints of the bubble with respect to l*. In the figure, Δs represents the difference between the moving distance of the two endpoints at the end of the collapse, which is defined in Figure 13a. As shown in Figure 14, at l* = 0, the value of Δs is the highest, about 0.84 Rmax. As l* increases, the difference in the moving distance between the two endpoints first decreases and then increases. At l* = 0.50, it reaches its local minimum, about 0.31 Rmax. At l* = 1.00, it reaches its local maximum, about 0.58 Rmax. Finally, it gradually decreases to zero.

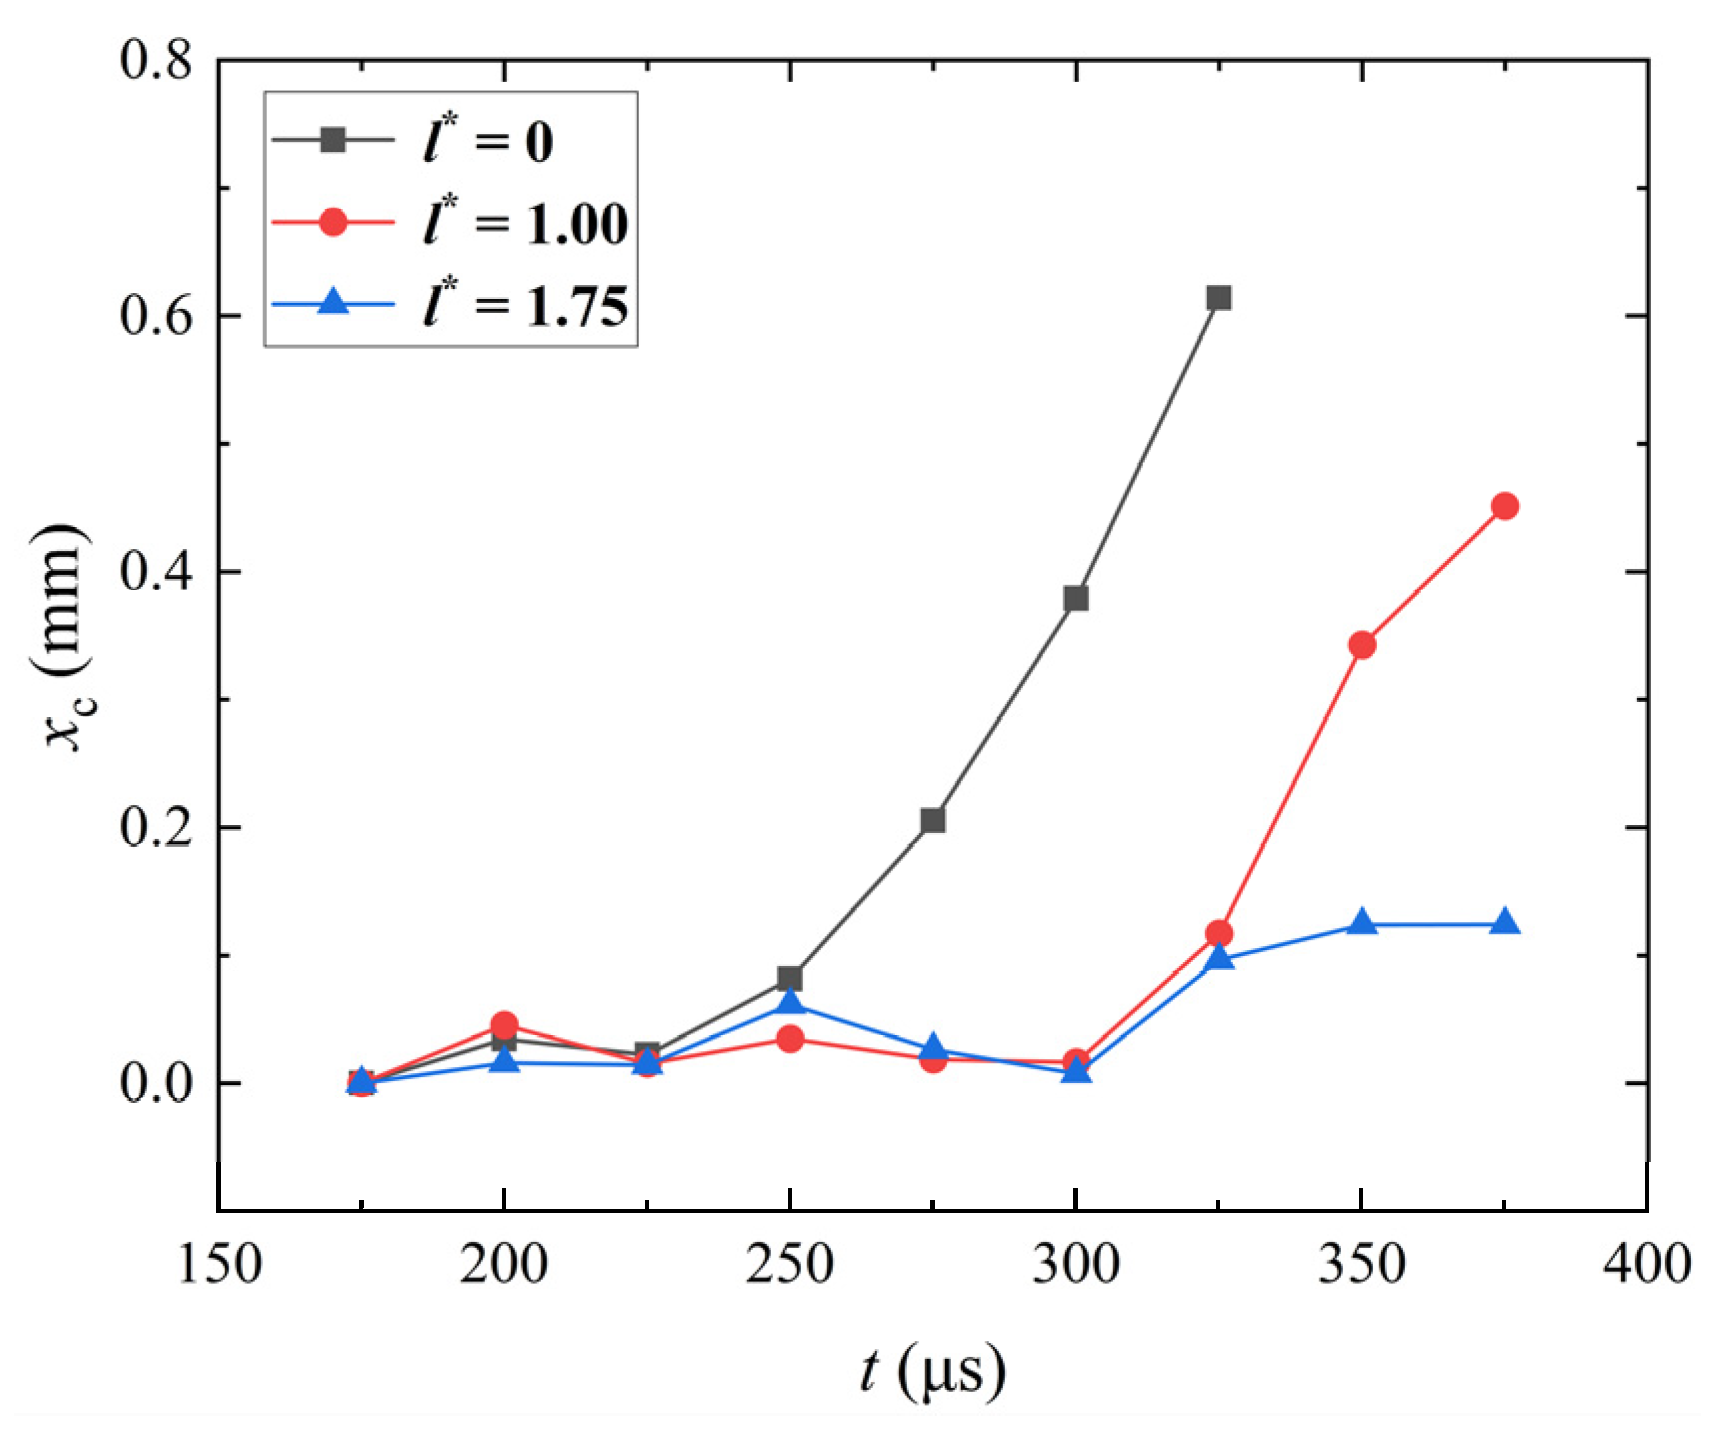
4.3. Bubble Centroids

Figure 15 shows the moving distances of the bubble centroid along the horizontal direction over time during the collapse stage. In the figure, xc represents the distance between the bubble centroid at a certain moment and at the moment when the bubble reaches its maximum radius in the horizontal direction. As shown in Figure 15, l* has a significant impact on the movement of the bubble centroid. When the bubble is at l* = 0.00, its centroid moves noticeably with a progressively increasing moving velocity, and the moving distance reaches about 0.35 Rmax at the end of the collapse. When the bubble is at l* = 1.00, it has no obvious moving distance at the early stage of the collapse but suddenly accelerates, and the moving distance reaches about 0.25 Rmax at the end of the collapse. When the bubble is at l* = 1.75, its centroid moves only slightly, and the moving distance reaches about 0.07 Rmax at the end of the collapse. With the increase in l*, the moving distance of the bubble centroid gradually decreases. Specifically, at l* = 1.0 and 1.75, the centroid moving distances at the end of the collapse are 73% and 20%, respectively, of that in the case at l* = 0.
To further analyze the influence of l* on the moving distances of the bubble centroid during the collapse stage, Figure 16 shows the change in the moving distance of the bubble centroid with l*. In the figure, Δxc represents the moving distance of the bubble centroid from the moment when the bubble radius is maximum to the end of the collapse. With the increase in l*, the moving distance of the bubble centroid gradually decreases overall, and e reaches about 0.05 Rmax at l* = 1.75. An irregular increase occurs at l* = 1.00 with Δxc reaching 0.20 Rmax, which is caused due to the appearance of the crown structure at the right side of the bubble.

5. Conclusions

In this paper, cavitation bubble dynamics near the boundary of the narrow gap formed via two parallel glass plates have been investigated. The influence of the dimensionless distance between the bubble, the boundary l*, and the dimensionless gap width h* on the jet, as well as the outline evolution and translational movement of the bubble during the bubble collapse and subsequent processes, have been revealed. The main conclusions are as follows:
(1)
When l* is small, the part of the bubble outside the gap shrinks quite quickly, and a violent jet is generated towards the gap during the collapse stage. Subsequently, a strong vapor jet toward the gap and a weak counter-vapor jet toward the boundary both appear during the rebound stage.
(2)
As l* increases, both the translational distance of the bubble centroid and the difference in the moving distance of the left and right endpoints of the bubble initially decrease, then increase, and finally decrease to zero.
(3)
Within the range of 0.73 < h* <0.84, h* mainly affects the expansion degree of the bubble cloud and the moving direction of the left and right endpoints of the bubble during its rebound and subsequent processes. As h* decreases, the influence range of the boundary (i.e., the range of l*) on the bubble behaviors increases. In addition, the value of the Re number during the bubble collapse is much higher than 1; hence, the influence of the liquid viscosity is very weak.
It is worth mentioning that, although several typical bubble collapse and jet behaviors near the gap boundary have been explored in this paper, the formation mechanism of these dynamic behaviors and their impact on the pressure and vortex distribution of the liquid inside and outside the gap have not yet been revealed. Hence, in future work, the formation mechanism of the collapse jet and the vortex structure near the boundary of the narrow gap will be further explored through a numerical simulation of the liquid pressure distribution during the bubble collapse stage [35,36]. In addition, the effects of the gap width will be considered more sufficiently with a wider variation range, and the effects of the bubble size and its growth rate will also be expanded.

Author Contributions

Conceptualization, Z.W.; methodology, Z.W., Y.Y., and X.W.; software, Z.W. and Z.G.; validation, Y.Y. and Y.Z. (Yuning Zhang 2); formal analysis, Y.Y., Q.H., and X.W.; investigation, Z.G. and J.L.; resources, Y.Z. (Yuning Zhang 2); data curation, Q.H.; writing—original draft, X.W. and Z.W.; writing-reviewing and editing, Y.Z. (Yuning Zhang 1) and Y.Z. (Yuning Zhang 2); visualization, Y.Y. and Z.G.; supervision, Y.Z. (Yuning Zhang 1); project administration, Y.Z. (Yuning Zhang 1) and J.L.; funding acquisition, Y.Z (Yuning Zhang 2). All authors have read and agreed to the published version of the manuscript.

Funding

This research was financially supported by the National Natural Science Foundation of China (Project No.: 52076215).

Data Availability Statement

Data are contained within the article.

Conflicts of Interest

Author Zhifeng Wang was employed by the company State Power Investment Corporation. The remaining authors declare that the research was conducted in the absence of any commercial or financial relationships that could be construed as a potential conflict of interest.

References

  1. Lohse, D. Fundamental fluid dynamics challenges in inkjet printing. Annu. Rev. Fluid Mech. 2022, 54, 349–382. [Google Scholar] [CrossRef]
  2. Li, Z.G.; Liu, A.Q.; Klaseboer, E.; Zhang, J.B.; Ohl, C.D. Single cell membrane poration by bubble-induced microjets in a microfluidic chip. Lab Chip 2013, 13, 1144–1150. [Google Scholar] [CrossRef] [PubMed]
  3. Yuan, F.; Yang, C.; Zhong, P. Cell membrane deformation and bioeffects produced by tandem bubble-induced jetting flow. Proc. Natl. Acad. Sci. USA 2015, 112, E7039–E7047. [Google Scholar] [CrossRef] [PubMed]
  4. Wu, T.H.; Chen, Y.; Park, S.Y.; Hong, J.; Teslaa, T.; Zhong, J.F.; Chiou, P.Y. Pulsed laser triggered high speed microfluidic fluorescence activated cell sorter. Lab Chip 2012, 12, 1378–1383. [Google Scholar] [CrossRef] [PubMed]
  5. Hellman, A.N.; Rau, K.R.; Yoon, H.H.; Bae, S.; Palmer, J.F.; Phillips, K.S.; Venugopalan, V. Laser-induced mixing in microfluidic channels. Anal. Chem. 2007, 79, 4484–4492. [Google Scholar] [CrossRef] [PubMed]
  6. Yang, T.; Chen, Y.; Minzioni, P. A review on optical actuators for microfluidic systems. J. Micromech. Microeng. 2017, 27, 123001. [Google Scholar] [CrossRef]
  7. Wang, C.; Jalikop, S.V.; Hilgenfeldt, S. Size-sensitive sorting of microparticles through control of flow geometry. Appl. Phys. Lett. 2011, 99, 034101. [Google Scholar] [CrossRef]
  8. Hashmi, A.; Yu, G.; Reilly-Collette, M.; Heiman, G.; Xu, J. Oscillating bubbles: A versatile tool for lab on a chip applications. Lab Chip 2012, 12, 4216–4227. [Google Scholar] [CrossRef] [PubMed]
  9. Ahmed, D.; Mao, X.; Shi, J.; Juluri, B.K.; Huang, T.J. A millisecond micromixer via single-bubble-based acoustic streaming. Lab Chip 2009, 9, 2738–2741. [Google Scholar] [CrossRef]
  10. Zhang, K.; Jian, A.; Zhang, X.; Wang, Y.; Li, Z.; Tam, H.Y. Laser-induced thermal bubbles for microfluidic applications. Lab Chip 2011, 11, 1389–1395. [Google Scholar] [CrossRef]
  11. Dijkink, R.; Ohl, C.D. Laser-induced cavitation based micropump. Lab Chip 2008, 8, 1676–1681. [Google Scholar] [CrossRef]
  12. Gonzalez-Avila, S.R.; Klaseboer, E.; Khoo, B.C.; Ohl, C.D. Cavitation bubble dynamics in a liquid gap of variable height. J. Fluid Mech. 2011, 682, 241–260. [Google Scholar] [CrossRef]
  13. Gonzalez-Avila, S.R.; Van Blokland, A.C.; Zeng, Q.; Ohl, C.D. Jetting and shear stress enhancement from cavitation bubbles collapsing in a narrow gap. J. Fluid Mech. 2020, 884, A23. [Google Scholar] [CrossRef]
  14. Zeng, Q.; Gonzalez-Avila, S.R.; Ohl, C.D. Splitting and jetting of cavitation bubbles in thin gaps. J. Fluid Mech. 2020, 896, A28. [Google Scholar] [CrossRef]
  15. Rodriguez, M.; Beig, S.A.; Barbier, C.N.; Johnsen, E. Dynamics of an inertially collapsing gas bubble between two parallel, rigid walls. J. Fluid Mech. 2022, 946, A43. [Google Scholar] [CrossRef]
  16. Sagar, H.J.; El Moctar, O. Dynamics of a cavitation bubble between oblique plates. Phys. Fluids 2023, 35, 013324. [Google Scholar] [CrossRef]
  17. Kedrinskii, V.K. Propagation of perturbations in a liquid containing gas bubbles. J. Appl. Mech. Tech. Phys. 1968, 9, 370–376. [Google Scholar] [CrossRef]
  18. Kedrinskii, V.K. Hydrodynamics of Explosion: Experiments and Models; Springer Science & Business Media: Berlin/Heidelberg, Germany, 2005. [Google Scholar]
  19. Ilinskii, Y.A.; Zabolotskaya, E.A.; Hay, T.A.; Hamilton, M.F. Models of cylindrical bubble pulsation. J. Acoust. Soc. Am. 2012, 132, 1346–1357. [Google Scholar] [CrossRef]
  20. Zhang, X.Q.; Yang, C.X.; Wang, C.T.; Zhang, Y.N.; Zhang, Y.N. Dynamics of an oscillating cavitation bubble within a narrow gap. Phys. Fluids 2023, 35, 103302. [Google Scholar] [CrossRef]
  21. Quinto-Su, P.A.; Lim, K.Y.; Ohl, C.D. Cavitation bubble dynamics in microfluidic gaps of variable height. Phys. Rev. E 2009, 80, 047301. [Google Scholar] [CrossRef]
  22. Zhang, A.; Li, S.M.; Cui, P.; Li, S.; Liu, Y.L. A unified theory for bubble dynamics. Phys. Fluids 2023, 35, 033323. [Google Scholar] [CrossRef]
  23. Bokman, G.T.; Supponen, O.; Mäkiharju, S.A. Cavitation bubble dynamics in a shear-thickening fluid. Phys. Rev. Fluids 2022, 7, 023302. [Google Scholar] [CrossRef]
  24. Quinto-Su, P.A.; Ohl, C.D. Interaction between two laser-induced cavitation bubbles in a quasi-two-dimensional geometry. J. Fluid Mech. 2009, 633, 425–435. [Google Scholar] [CrossRef]
  25. Zwaan, E.; Le Gac, S.; Tsuji, K.; Ohl, C.D. Controlled cavitation in microfluidic systems. Phys. Rev. Lett. 2007, 98, 254501. [Google Scholar] [CrossRef] [PubMed]
  26. Wang, X.Y.; Wu, G.H.; Shen, J.W.; Sun, Z.; Zhang, Y.N.; Zhang, L.; Zhang, Y.N. Research on the collapse dynamics of a restricted cavitation bubble near a right-angle wall based on Kelvin impulse theory. Phys. Fluids 2023, 35, 073335. [Google Scholar] [CrossRef]
  27. Wang, X.Y.; Li, S.W.; Shen, J.W.; Bian, H.J.; Wu, G.H.; Zhang, Y.N.; Jiang, Q.Q.; Li, J.T.; Zhang, Y.N. Dynamic behaviors of a bubble near a rectangular wall with a bulge. Phys. Fluids 2024, 36, 023343. [Google Scholar] [CrossRef]
  28. Quah, E.W.; Karri, B.; Ohl, S.W.; Klaseboer, E.; Khoo, B.C. Expansion and collapse of an initially off-centered bubble within a narrow gap and the effect of a free surface. Int. J. Multiph. Flow 2018, 99, 62–72. [Google Scholar] [CrossRef]
  29. Xiong, S.; Chin, L.K.; Ando, K.; Tandiono, T.; Liu, A.Q.; Ohl, C.D. Droplet generation via a single bubble transformation in a nanofluidic channel. Lab Chip 2015, 15, 1451–1457. [Google Scholar] [CrossRef] [PubMed]
  30. Shen, J.W.; Liu, Y.H.; Wang, X.Y.; Wang, C.T.; Zhang, Y.N.; Xian, H.Z.; Zhang, Y.N. Research on the dynamics of a restricted cavitation bubble near a symmetric Joukowsky hydrofoil. Phys. Fluids 2023, 35, 072111. [Google Scholar] [CrossRef]
  31. Shen, J.W.; Li, S.W.; Wang, X.Y.; Zhang, Y.N.; Xian, H.Z.; Zheng, S.; Zhang, Y.N. Theoretical and experimental investigation of a bubble collapsing near an asymmetric hydrofoil. Phys. Fluids 2024, 36, 023362. [Google Scholar] [CrossRef]
  32. Yu, J.X.; Wang, X.Y.; Hu, J.S.; Shen, J.W.; Zhang, X.Q.; Zheng, X.X.; Yao, Z.F. Laser-induced cavitation bubble near boundaries. J. Hydrodyn. 2023, 35, 858–875. [Google Scholar] [CrossRef]
  33. Chen, Y.H.; Chu, H.Y.; Lin, I. Interaction and fragmentation of pulsed laser induced microbubbles in a narrow gap. Phys. Rev. Lett. 2006, 96, 034505. [Google Scholar] [CrossRef] [PubMed]
  34. Chen, Y.H.; Lin, I. Dynamics of impacting a bubble by another pulsed-laser-induced bubble: Jetting, fragmentation, and entanglement. Phys. Rev. E 2008, 77, 026304. [Google Scholar] [CrossRef] [PubMed]
  35. Xia, G.J.; You, W.B.; Manickam, S.; Yoon, J.Y.; Xuan, X.X.; Sun, X. Numerical simulation of cavitation-vortex interaction mechanism in an advanced rotational hydrodynamic cavitation reactor. Ultrason. Sonochem. 2024, 105, 106849. [Google Scholar] [CrossRef]
  36. Sun, X.; Xia, G.J.; You, W.B.; Jia, X.Q.; Manickam, S.; Tao, S.; Zhao, S.; Yoon, J.Y.; Xuan, X.X. Effect of the arrangement of cavitation generation unit on the performance of an advanced rotational hydrodynamic cavitation reactor. Ultrason. Sonochem. 2023, 99, 106544. [Google Scholar] [CrossRef]
Figure 1. Physical diagram and schematic diagram of the experimental system: (a) physical diagram; (b) schematic diagram.
Symmetry 16 00541 g001
Figure 2. Specific structure of the narrow gap and the physical properties of the glass plate surface: (a) three-dimensional gap structure and the parameter definitions; (b) the wettability of the plate surface.
Symmetry 16 00541 g002
Figure 3. High-speed photographs of the bubble at l* = 0.00. The dashed blue line is the boundary of the narrow gap. The left and right of the boundary represent the inside and outside of the gap, respectively. h* = 0.79.
Symmetry 16 00541 g003
Figure 4. High-speed photographs of the bubble at l* = 1.00. The dashed blue line is the boundary of the narrow gap. The left and right of the boundary represent the inside and outside of the gap, respectively. h* = 0.79.
Symmetry 16 00541 g004
Figure 5. High-speed photographs of the bubble at l* = 1.75. In each frame, the presented area is completely inside the gap, and the boundary is on the right side outside the frames. h* = 0.79.
Symmetry 16 00541 g005
Figure 6. High-speed photographs of the bubble at l* = 0.00 from the right-side view. The vertical dark gray strips are the two glass plates. h* = 0.79.
Symmetry 16 00541 g006
Figure 7. Bubble outlines at l* = 0.00. (a) Collapse stage. (b) Rebound stage. The gray area is the inside of the gap, and the white area is the outside of the gap. h* = 0.79.
Symmetry 16 00541 g007
Figure 8. Bubble outlines at l* = 1.00. (a) Collapse stage. (b) Rebound stage. The gray area is the inside of the gap, and the white area is the outside of the gap. h* = 0.79.
Symmetry 16 00541 g008
Figure 9. Bubble outlines at l* = 1.75. (a) Collapse stage. (b) Rebound stage. The gray area is the inside of the gap, and the boundary is on the right side outside the subfigure. h* = 0.79.
Symmetry 16 00541 g009
Figure 10. Composite images of high-speed photographs of the bubble over time: (a) l* = 0.00; (b) l* = 1.00; and (c) l* = 1.75. h* = 0.79. The red dashed lines are the demarcation between the first oscillation period of the bubble and the subsequent processes. The blue dashed lines are the boundary of the narrow gap.
Symmetry 16 00541 g010
Figure 11. Composite images of high-speed photographs of the bubble over time: (a) l* = 0.00; (b) l* = 1.00; and (c) l* = 1.75. h* = 0.73. The red dashed lines are the demarcation between the first oscillation period of the bubble and the subsequent processes. The blue dashed lines are the boundary of the narrow gap.
Symmetry 16 00541 g011
Figure 12. Composite images of high-speed photographs of the bubble over time: (a) l* = 0.00; (b) l* = 1.00; and (c) l* = 1.75. h* = 0.84. The red dashed lines are the demarcation between the first oscillation period of the bubble and the subsequent processes. The blue dashed lines are the boundary of the narrow gap.
Symmetry 16 00541 g012
Figure 13. Moving distances of the bubble’s left and right endpoints during the collapse stage over time: (a) l* = 0.00; (b) l* = 1.00; and (c) l* = 1.75. The black and red curves refer to the left and right endpoints, respectively. The two blue dashed lines in the sub-figure (a) correspond to the moving distance of the left and right endpoints of the bubble at the end of the collapse, and the blue arrow line represents the difference of the moving distance between the two endpoints, represented by Δs.
Symmetry 16 00541 g013
Figure 14. Change in the differences of the moving distance between the left and right endpoints of the bubble with l* during the bubble collapse. h* = 0.79.
Symmetry 16 00541 g014
Figure 15. Moving distances of the bubble centroid over time during the bubble collapse stage at different l*. The black, red, and blue curves refer to l* = 0.00, 1.00, and 1.75, respectively. h* = 0.79.
Symmetry 16 00541 g015
Figure 16. Change in the moving distance of the bubble centroid with l* during the bubble collapse. h* = 0.79.
Symmetry 16 00541 g016
Table 1. Specific information on the main experimental equipment.
EquipmentModelInformationAccuracy/Sensitivity
Laser generatorPenny-100A-SCMaximum pulse energy: 50 mJ
Wavelength: 532 nm
Power instability: 0.81%
High-speed cameraQianyanlang X113Shooting speed: 41,666 fps
Picture scale: 0.078 mm/pix
Scale error: ±0.001 mm/pix
Delay signal generatorStanford DG535Distinguishability: 5 psResolution: 5 ps
Water tankCustomizationVolume: 150 × 150 × 150 mm3
Disclaimer/Publisher’s Note: The statements, opinions and data contained in all publications are solely those of the individual author(s) and contributor(s) and not of MDPI and/or the editor(s). MDPI and/or the editor(s) disclaim responsibility for any injury to people or property resulting from any ideas, methods, instructions or products referred to in the content.

