Abstract
Due to their excellent thermal conductivity and sensitivity to temperature changes, special attention should be paid to the influence of temperature on steel-structure bridges. The temperature effect is complex, especially for unstable steel arch bridges with complex structural forms. This paper proposes an approximate method that measures the three-dimensional temperature field of the symmetrical arch rib with the two-dimensional temperature field of multiple sections. In addition, it converts the complex radiant intensity calculation of the special-shaped steel box arch rib into the calculation of numerous planar radiant intensities. It uses the ANSYS Workbench to establish the three-dimensional transient thermal analysis finite element model of the No. 2 steel box arch rib. The influence of seasons and arch rib direction on the temperature field of steel box arch ribs and the stress and deformation of steel box arch ribs under non-linear temperature effects were analyzed. The results show that the temperature changes in different seasons significantly impact the temperature changes in the arch ribs. The change in the azimuth angle of the arch rib has a significant impact on the temperature difference between the web plates on both sides of the arch rib; under the influence of the temperature field at the most unfavorable time in summer and winter, symmetrical stress concentration occurs in the arch foot area. Furthermore, the maximum vertical displacement is 13.9 mm and 10.8 mm, respectively. Finally, when the angle is 40°, the maximum temperature difference between the web plates on both sides is 6.9 °C.
1. Introduction
Steel-structure bridges are one of the essential components of highway traffic construction due to the arch-shaped symmetry along the bridge direction and their integrated single- and double-arch rib structures. This design has the advantages of strong bearing capacity, good durability and sustainability, short construction, and long service life, so it has been widely used in practical projects [1,2]. However, in the natural environment, steel-structured bridges are vulnerable to damage and destruction, affecting their service life and safety. Among these hazards, the temperature effect is one of the critical factors that must be considered in the design and use of steel-structure bridges [3].
The temperature effect has an essential impact on steel-structure bridges, as it affects not only the mechanical properties of steel-structure materials but also the shape, size, and stress distribution of the structure [4,5,6,7,8]. Under high temperature conditions, steel-structure bridges are prone to thermal deformation, which leads to structural instability or reduced bearing capacity. At low temperatures, the toughness of steel-structure bridge materials will decrease, making it easy to produce brittle fractures and cracks. Especially for special-shaped steel arch bridges with complex structural forms, the influence of temperature is more complicated [9,10,11].
There are many studies on the effect of temperature on steel bridges through measured data and numerical simulation. For example, Biliszczuk et al. [12] researched the temperature distribution of various types of bridges based on Structural Health Monitoring (SHM) system data and described the temperature effects on different bridges. In addition, Zhu et al. [13] used 2-year on-site monitoring data of a 108-m-long steel bridge to study the effect of temperature on strain response and used relevant analysis and numerical simulation to examine the relationship between temperature-induced stress and the standard temperature effect. They provided a simple universal formula to capture the relationship between temperature distribution and temperature-induced strain. They verified the formula’s accuracy using on-site monitoring data of box and H-shaped components. On the other hand, Zhang et al. [14] proposed a new probability model based on the copula method to establish a temperature difference analysis model for steel box girders of large-span suspension bridges.
On the other hand, Zhang et al. [15] developed and validated shadow recognition methods and simulation models for long-term thermal simulations to determine the characteristic values of temperature effects on composite bridges in the future. In the same line, Fu and DeWolf [16] established a three-dimensional finite element analysis model based on the measured data to discuss the influence of temperature differences on the overall behavior of the bridge.
Additionally, Huang et al. [17] proposed a new method based on Support Vector Machine (SVM) and Moth Flame Optimization (MFO) to identify structural damage considering temperature changes. Li et al. [18] investigated the overall three-dimensional temperature characteristics of a three-tower cable-stayed bridge through a combination of on-site monitoring and unified numerical simulation. Dongchao et al. [19] used a single arch rib as the research object and analyzed the stress law of the concrete arch rib under bi-directional gradient temperature. Moreover, Yilong [20] studied and examined the temperature effect of the whole bridge of the Concrete-Filled Steel Tube (CFST) arch bridge with the help of finite element software and found that the heating effect would increase the arch rib length of the CFST arch bridge. Based on the measured data and finite element numerical simulation, Dawei [21] calculated and analyzed the temperature effect of the completed concrete-filled steel tube arch bridge during its operation stage and found that the impact of uniform cooling on the arch foot section was more prominent than other sections of the arch rib. Yali [22] analyzed and studied the distribution law of the temperature gradient of the central arch section of the concrete-filled steel tube arch rib in southwest China under the action of sunshine radiation utilizing finite element simulation and test measurement and fitted the calculation equation of the radial temperature gradient of the main arch section.
In recent years, with the wide application of steel box structures in the arch rib of arch bridges, the temperature effect of the steel box arch rib has been given more attention by bridge workers. For example, in 2011, based on the measured temperature data of steel box arch ribs, Yongguo [23] fitted the vertical and transverse most unfavorable temperature gradient curves of steel box arch ribs with the help of the numerical analysis software Origin. In 2014, Luo [24] fitted the temperature field distribution curve of the steel box arch rib based on the measured temperature field data. In 2022, Yu et al. [25] fitted the vertical temperature difference prediction model of the steel box arch rib according to the measured temperature data of the steel box arch rib and the ambient temperature of the bridge site.
The research objects in studies of temperature fields in steel box structures are mostly steel box beams, while in studies of temperature fields in arch bridges, the research objects are mostly steel-tube concrete arch bridges. There is very little research on the temperature field of steel box arch ribs. In addition, the existing research on the temperature field of steel box arch ribs is based on long-term temperature monitoring data and has not introduced numerical simulations for calculation and analysis. Therefore, this paper is based on the actual engineering project for the Zhuhai Jindao Bridge. A comprehensive and systematic study was conducted on the temperature field and temperature effects on steel box arch ribs. An analytical method is proposed to calculate the temperature distribution of steel box arch ribs using finite element numerical simulation. The necessary initial and boundary conditions for solving the temperature field of steel box arch ribs were determined using the basic theory of structural temperature fields, such as heat conduction. The reliability of the transient thermal analysis numerical model was verified based on measured temperature data, and an approximate processing method is proposed to approximate the three-dimensional temperature field of the arch rib with a multi-section two-dimensional temperature field. The influence of season and arch rib direction on the steel box arch rib’s temperature field, as well as the stress and deformation of the steel box arch rib under non-linear temperature action were analyzed.
2. Engineering Background
2.1. Engineering Overview
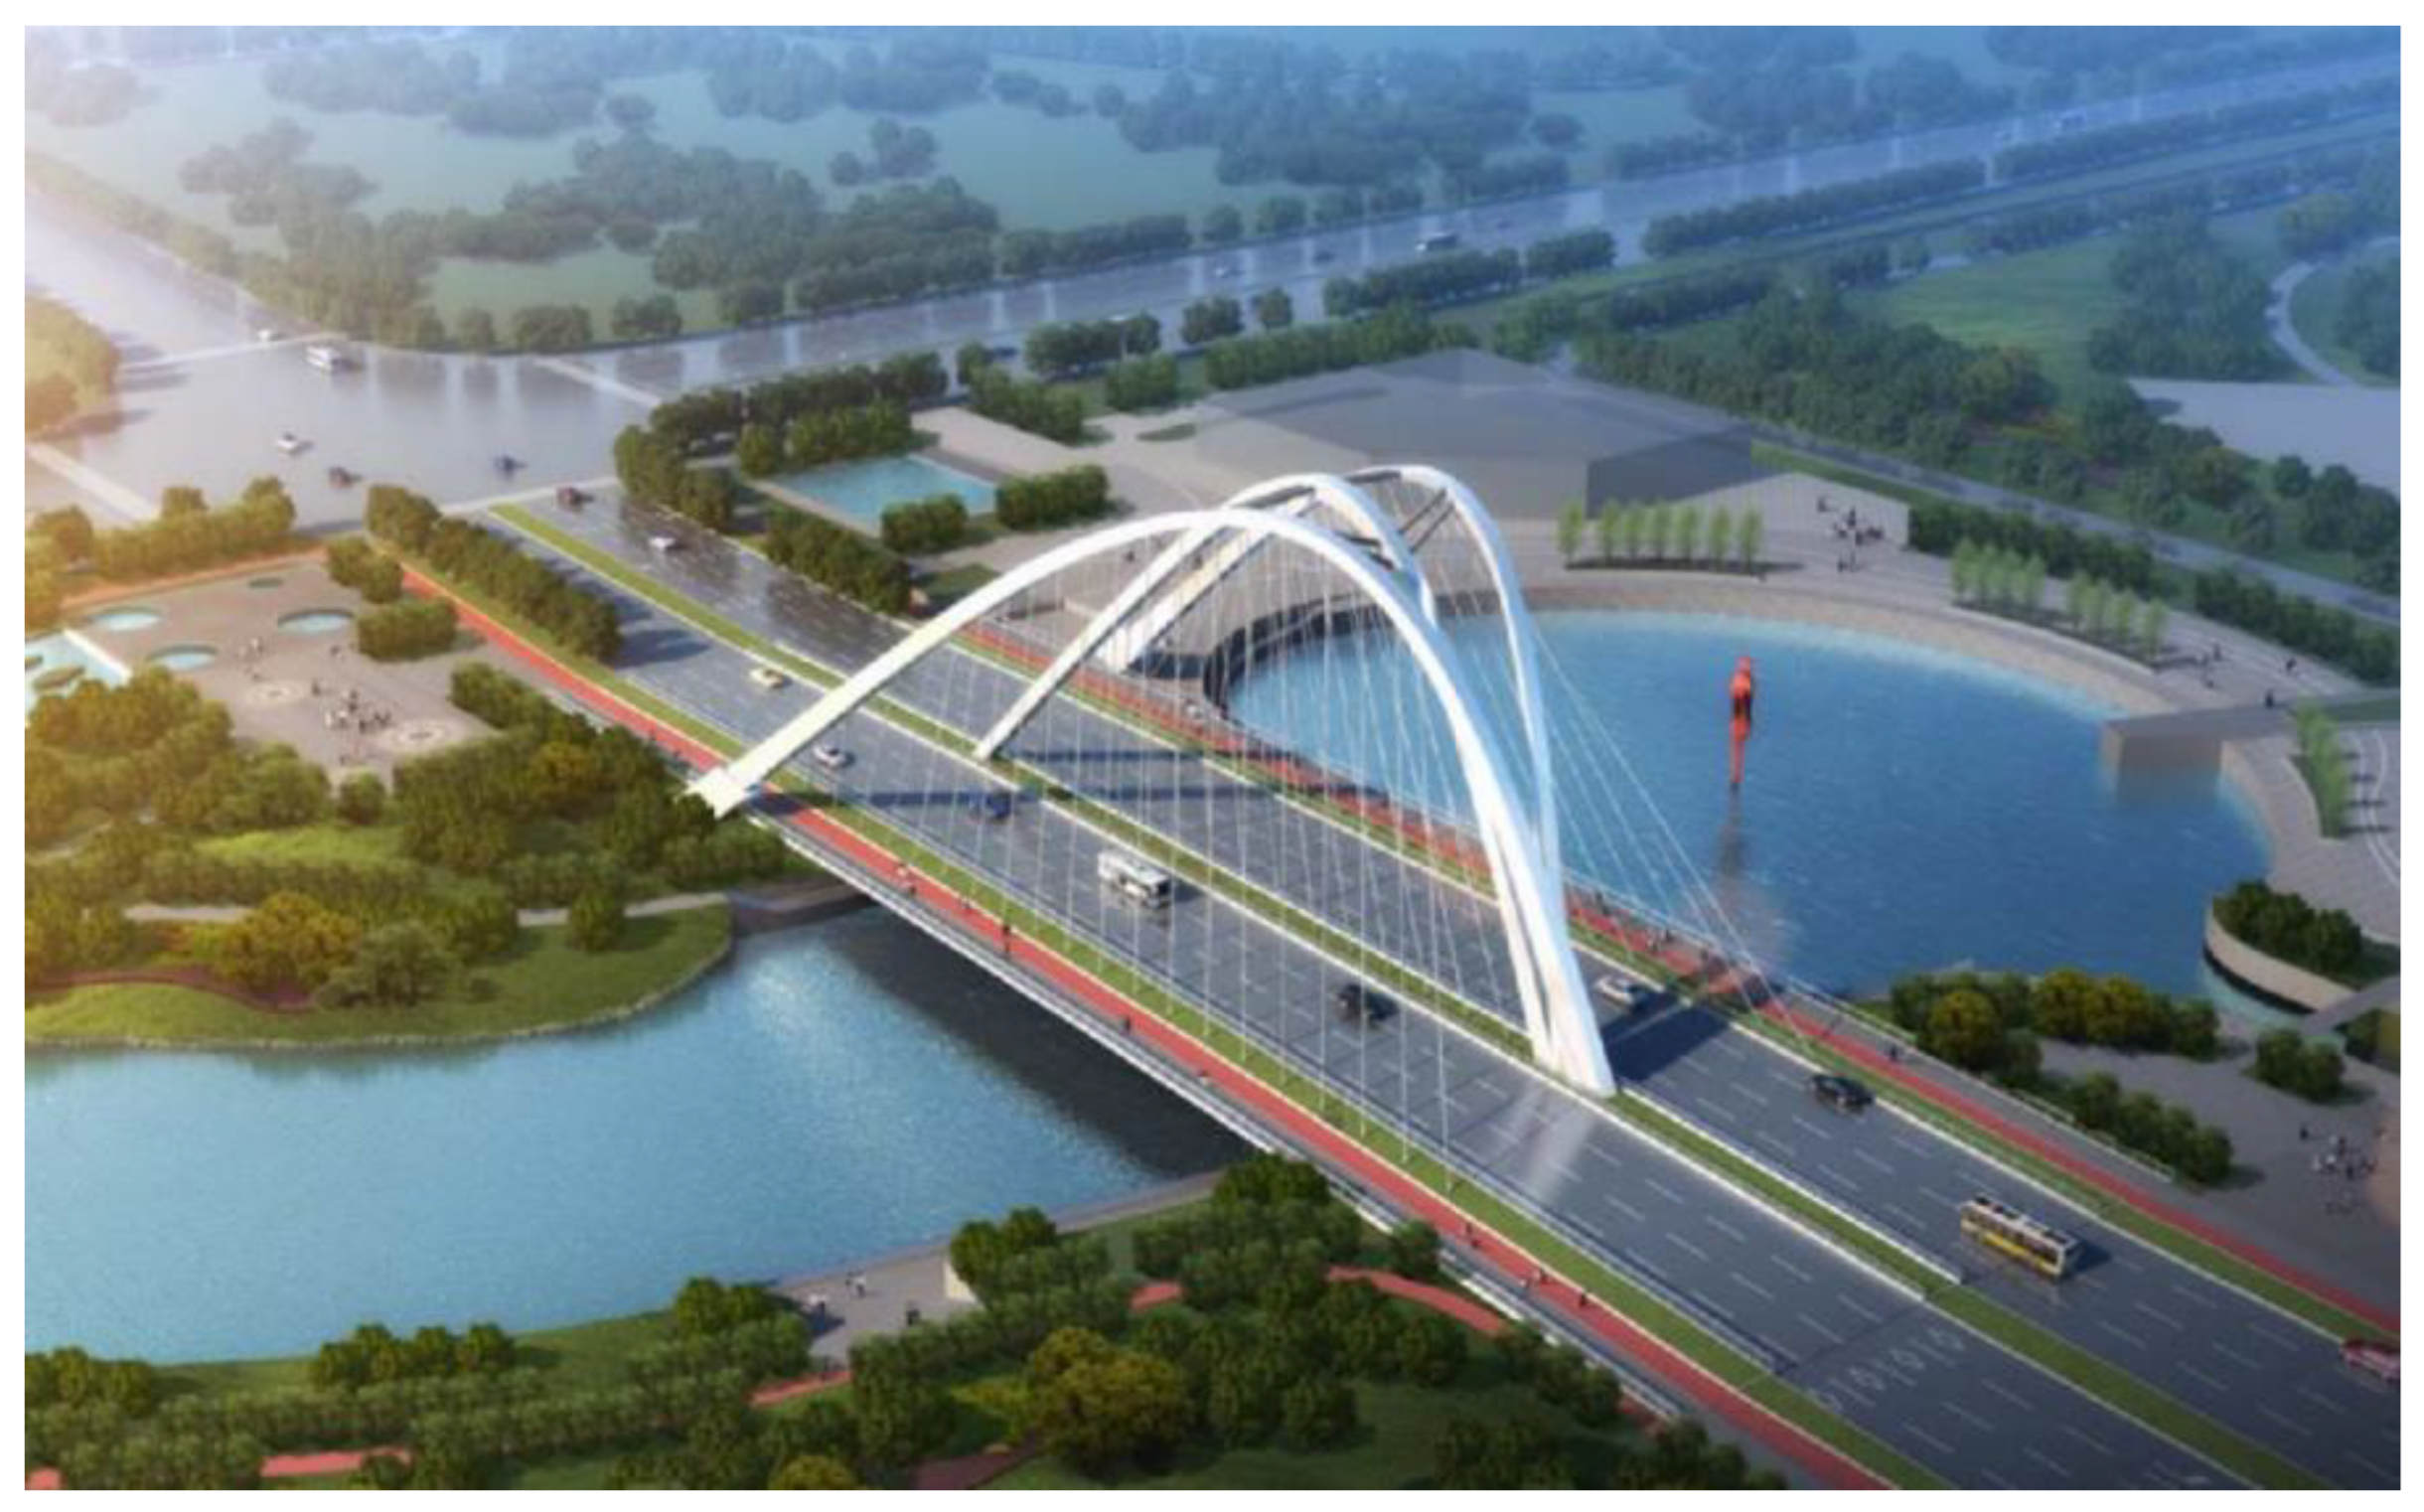
The Jindao Bridge is located in Jinwan District, Zhuhai City, China, and has a through shaped steel box arch rib arch bridge structure with a span of 100 m [26]. The central arch of this bridge is located in a vertical plane, and the two stable arches (auxiliary arches) form a 12.68° angle with the central arch, forming a semi crossing carriageway different from the diagonal arch structure. Moreover, the axis of the three arch ribs is a modified quadratic parabola. The bridge is arranged from east to west, with three arch ribs from north to south, namely arch 1, arch 2, and arch 3. A rendering of the Jindao Bridge is shown in Figure 1.

Figure 1.
Rendering of the Jindao Bridge.
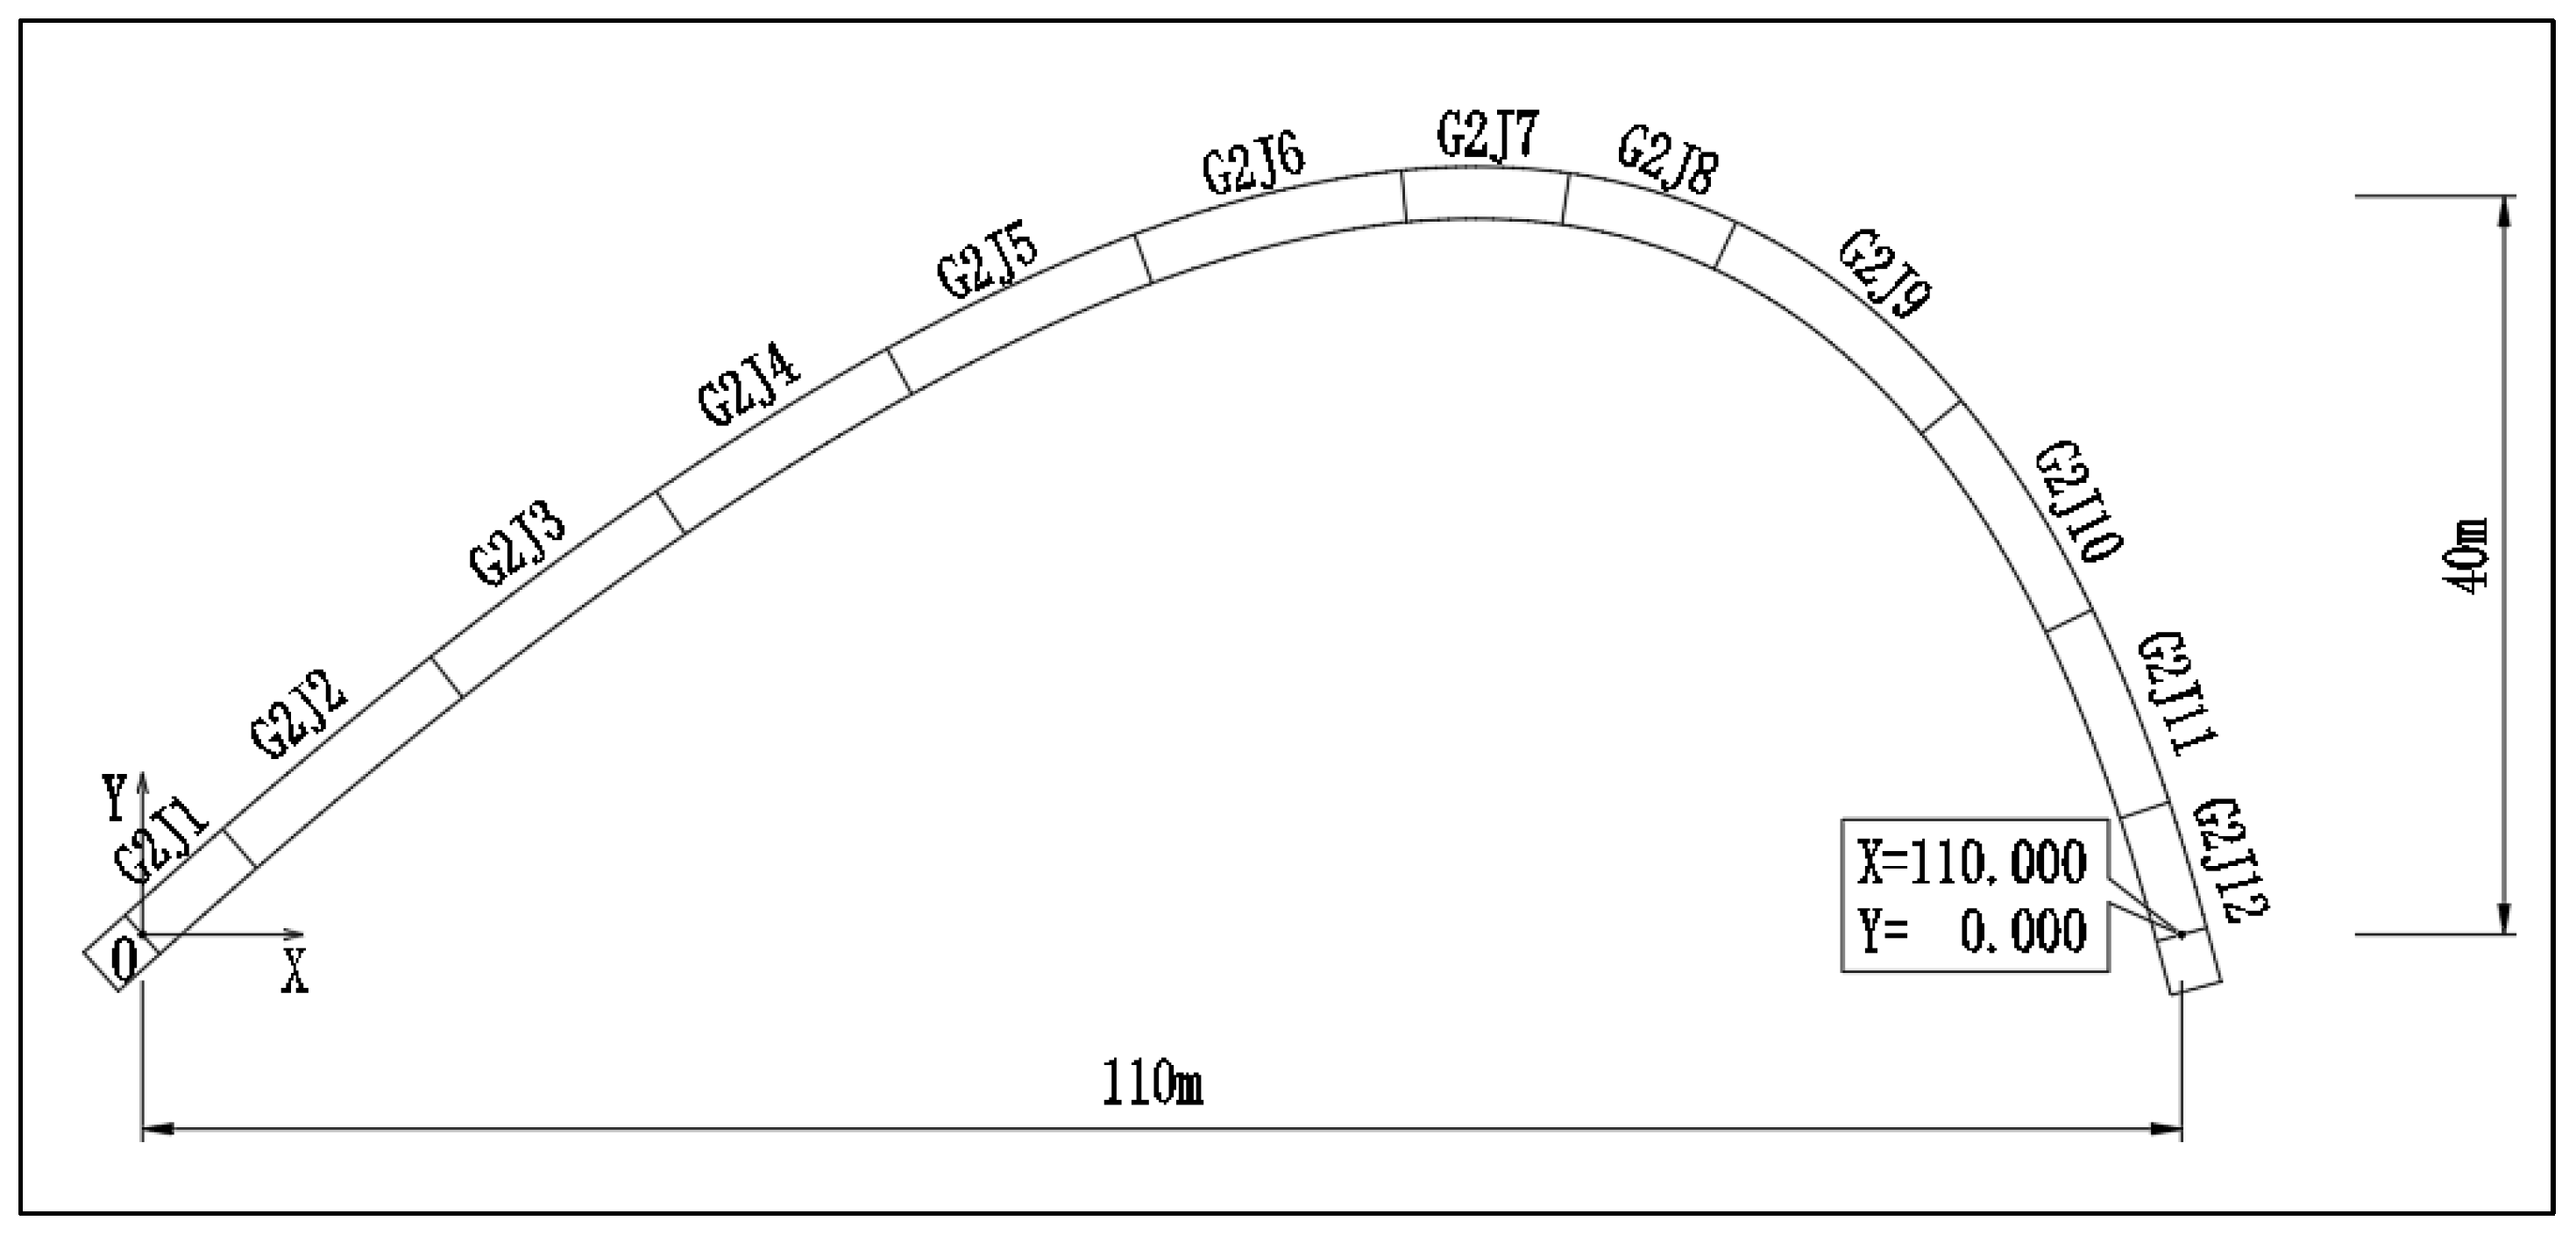
The theoretical spans of arch ribs 1 to 3 are 128.125 m, 110.0 m, and 128.125 m, respectively. The rise heights are 44 m, 40 m, and 44 m, and the rise span ratios are l/2.91, 1/2.75, and 1/2.91, respectively. The designed arch axis adopts an inclined quadratic parabola. The arch rib adopts a steel box cross-section with cross-sectional dimensions of 2.8 m × 2.8 m and a longitudinal equal cross-section. The plate thickness is adjusted only based on the stress situation. The main structure of the steel arch rib is made of Q420qD steel. The elevation view of the arch rib (No. 2 arch rib) is shown in Figure 2.
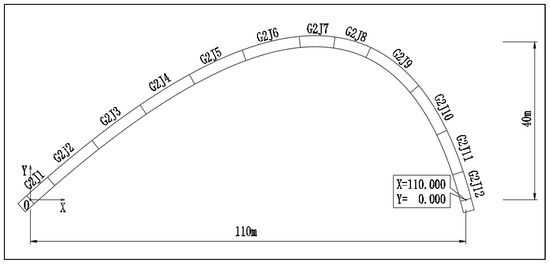
Figure 2.
Elevation view of No. 2 arch rib.
2.2. Climate Condition
Zhuhai is adjacent to the South China Sea and experiences subtropical marine monsoon climate at low latitudes. The climatic conditions are shown in Table 1.

Table 1.
Climate condition.
2.3. Arrangement of Temperature Measurement Points for Arch Ribs
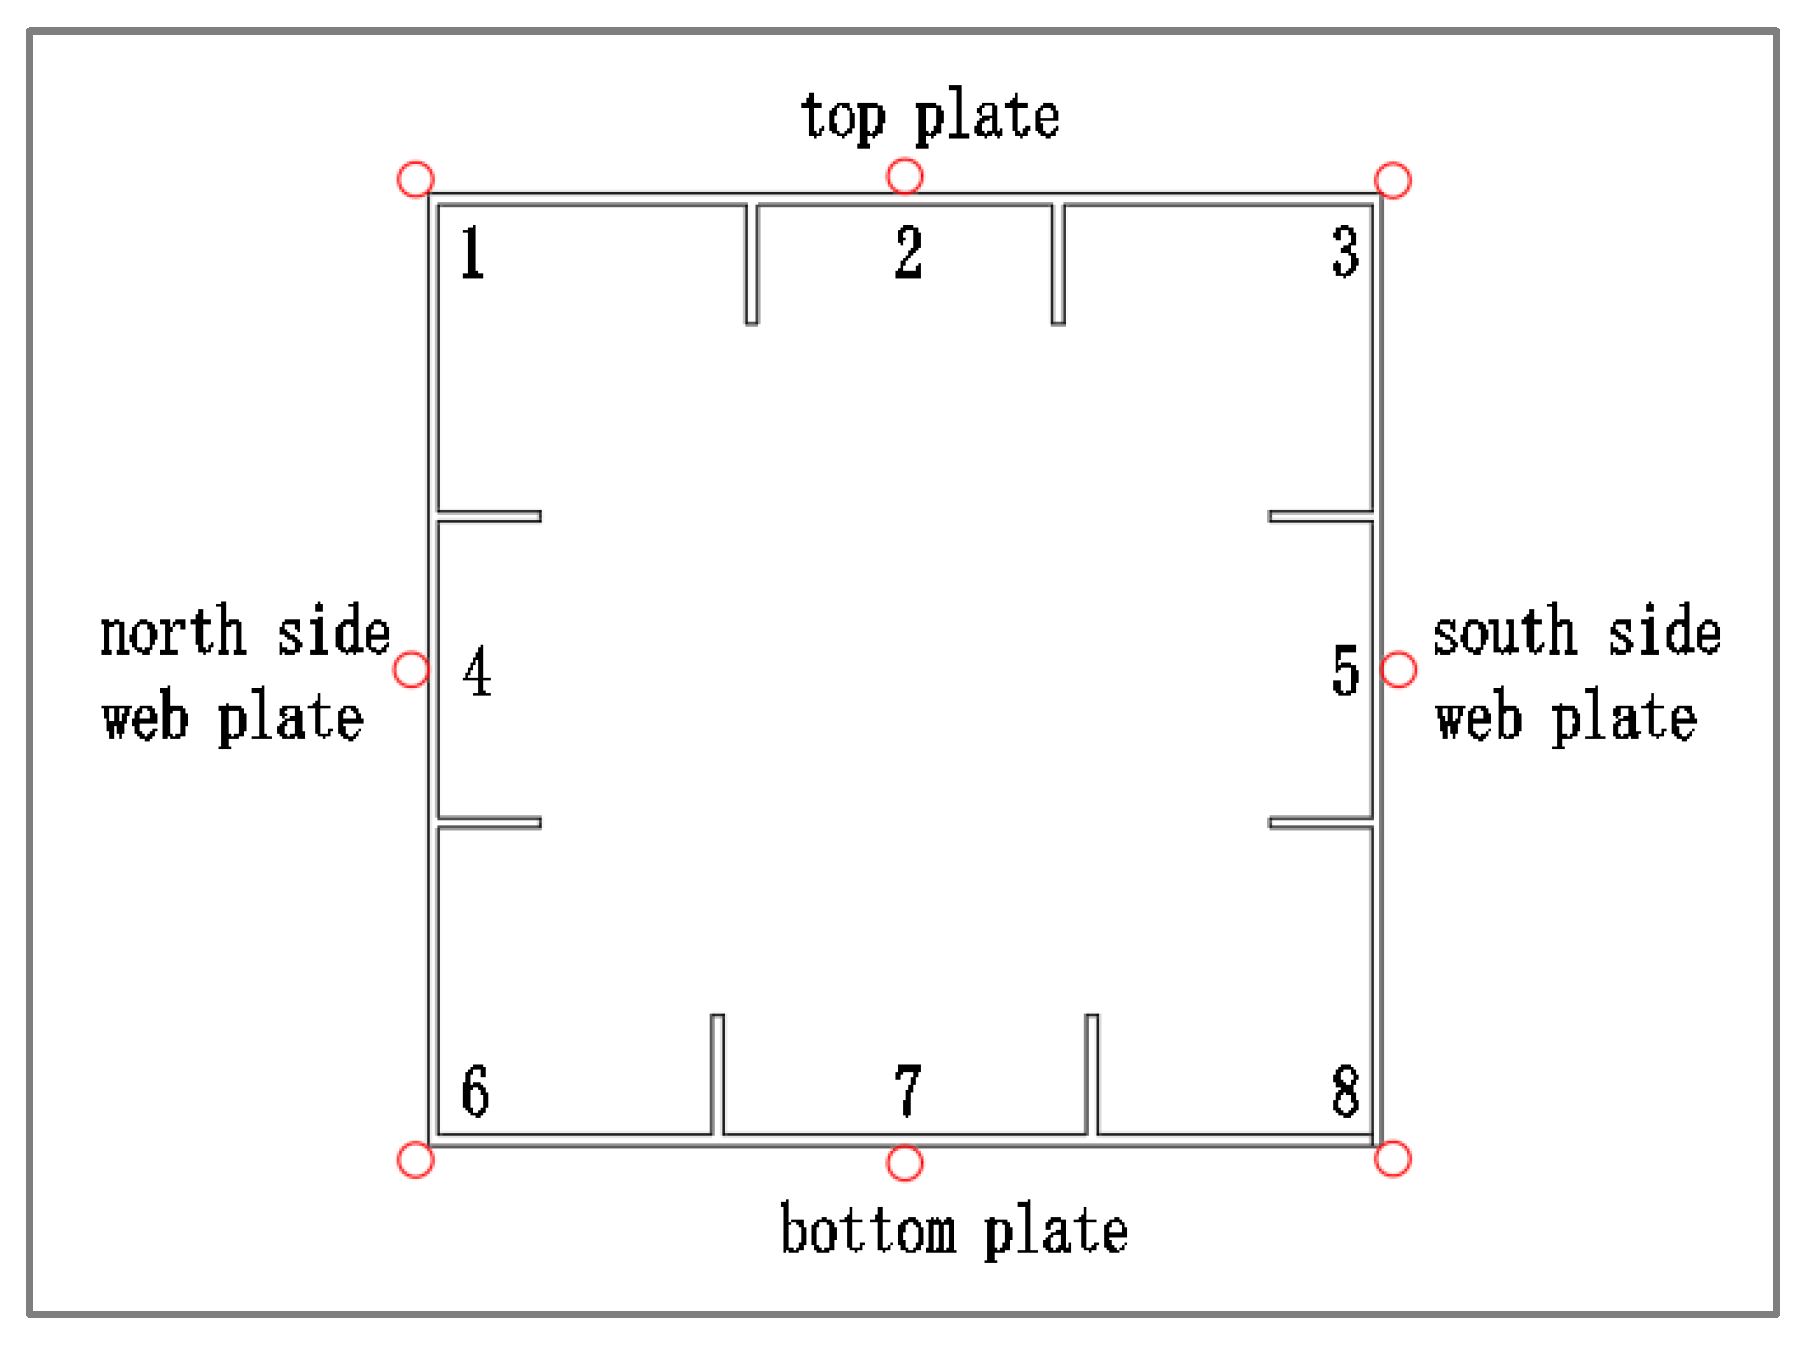
Measuring Point Layout
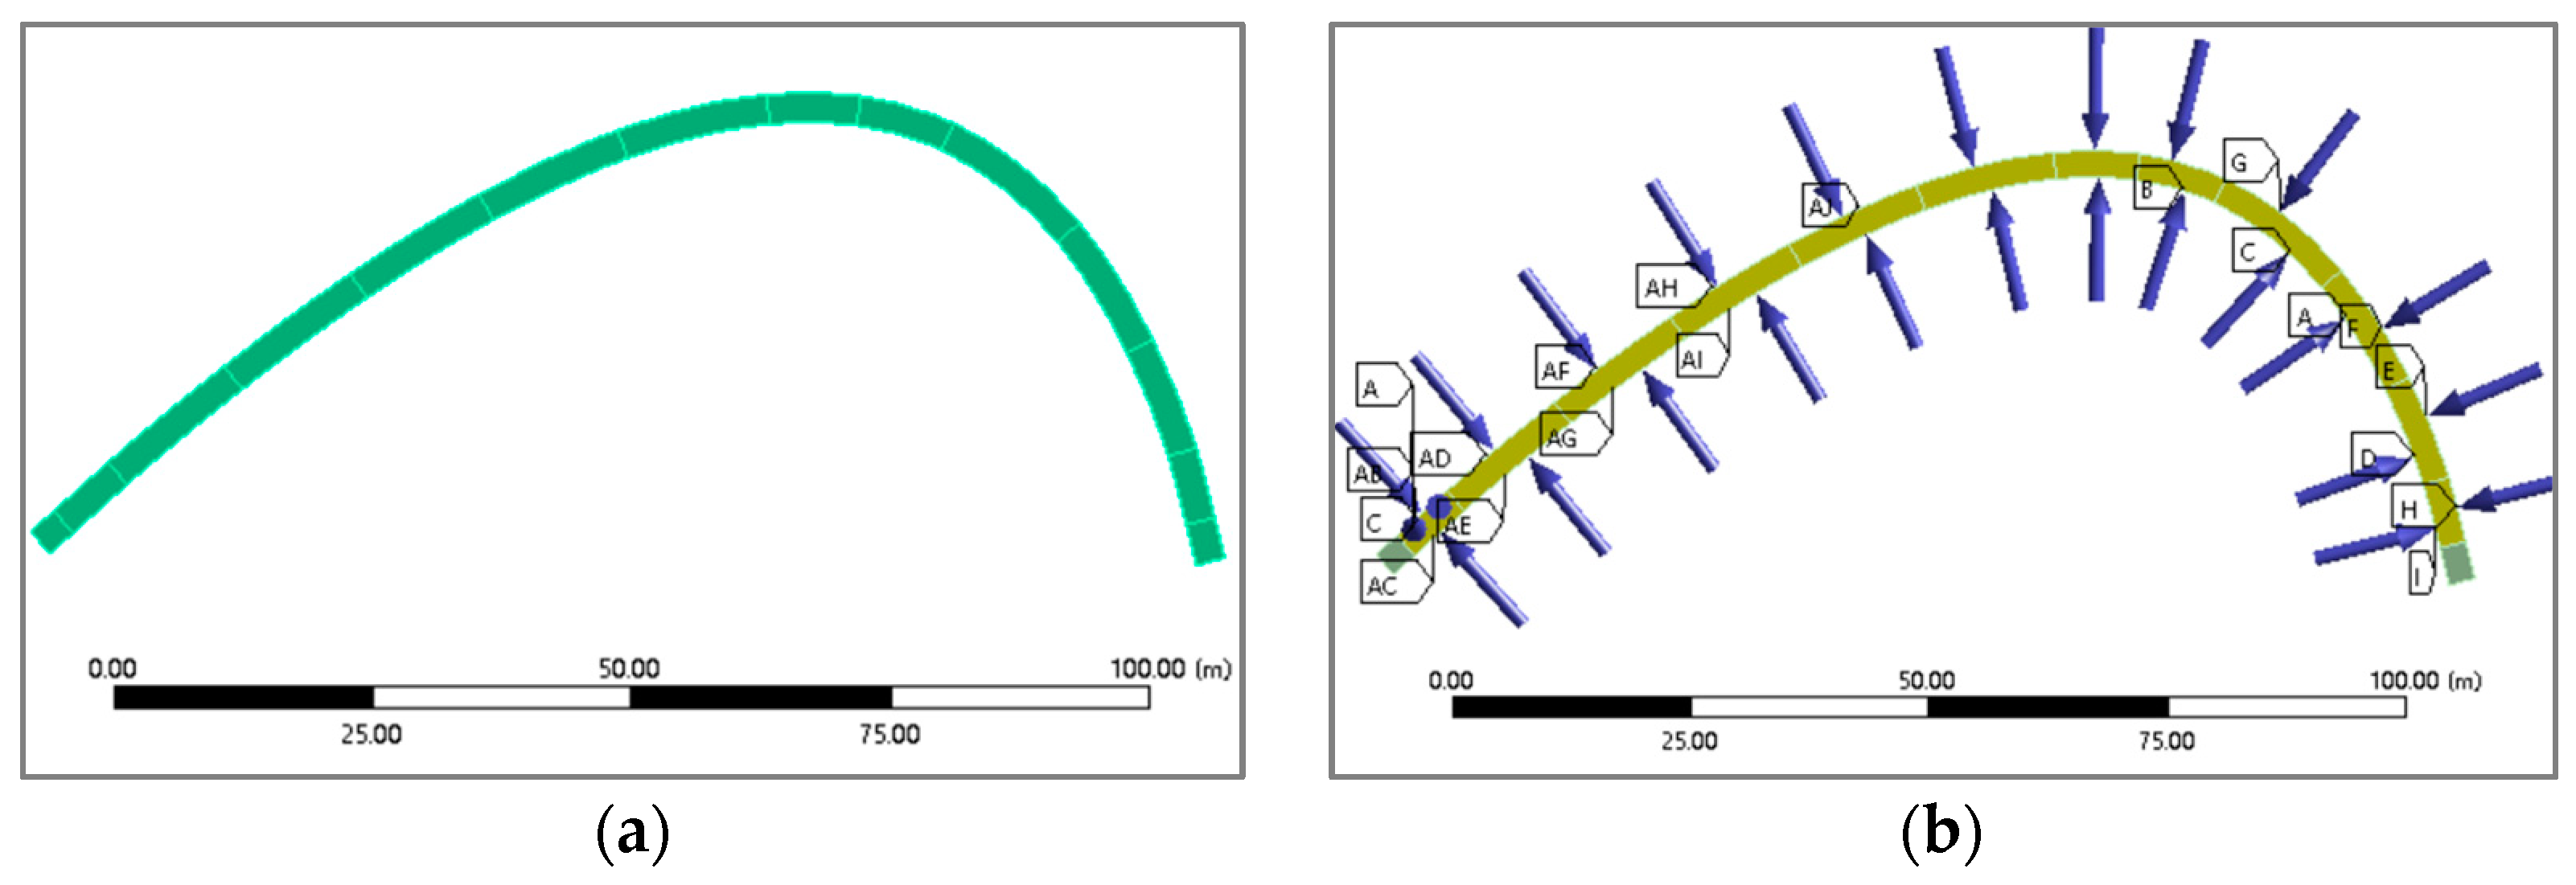
Five temperature test sections were selected, as shown in Figure 3. A total of 8 measurement points were arranged on the same section, and 40 temperature measurement points were placed on the second arch rib, as shown in Figure 4.
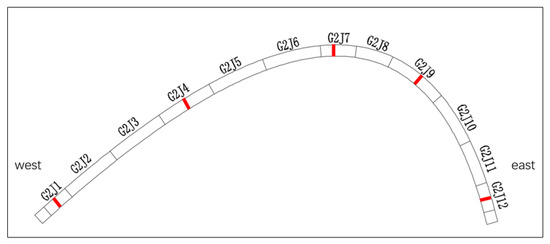
Figure 3.
Temperature test sections of the arch rib.
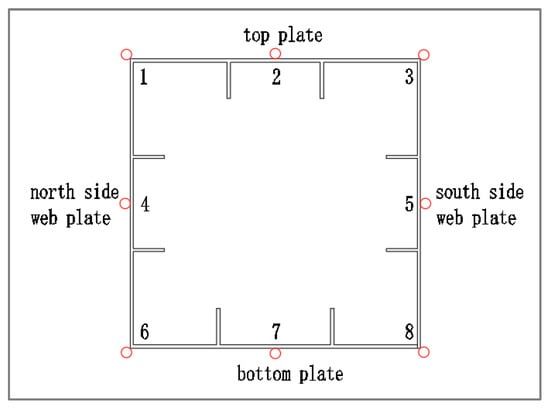
Figure 4.
Schematic diagram of sensor layout points and numbering.
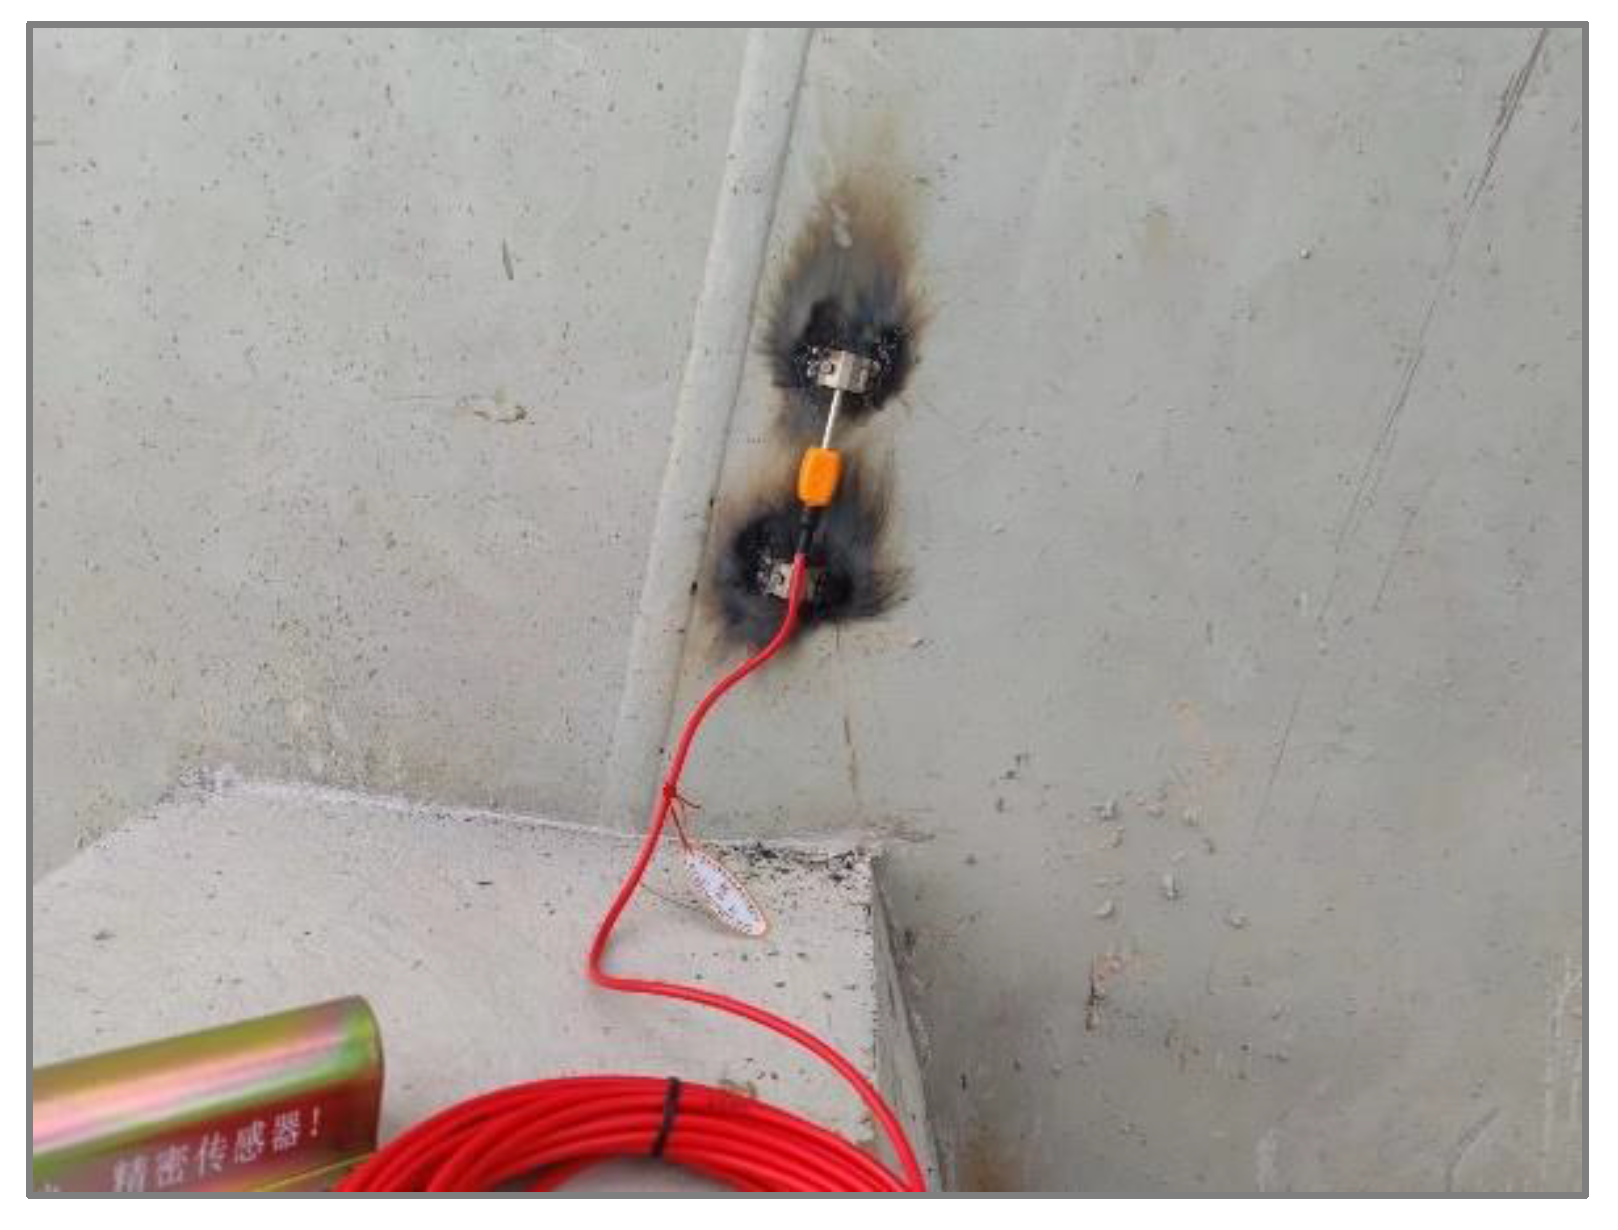
The sensor adopts a surface-type intelligent string strain gauge JMZX-212HAT, equipped with a semiconductor temperature sensor. Strain values and temperature data are collected using a 1/3/6 channel comprehensive tester, as shown in Figure 5 and Figure 6. However, we selected two typical sunny weather data sets of arch rib surface temperature for research and analysis, corresponding to 15 August 2022 and 26 December 2022.
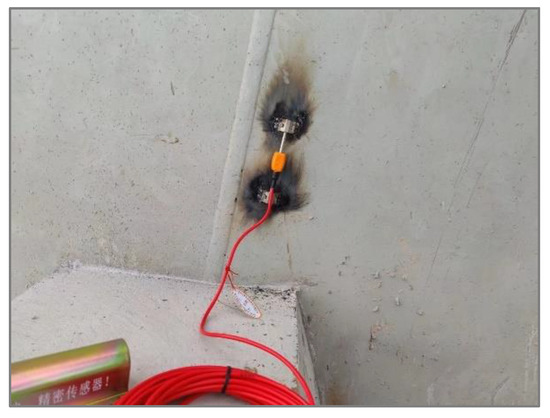
Figure 5.
Sensor installation.
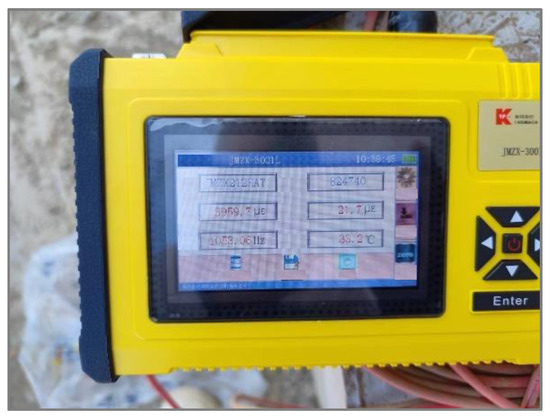
Figure 6.
Sensor temperature data collection.
3. Determination of Temperature-Field Calculation Parameters
3.1. Solar Radiation Calculation
Solar radiation calculations must consider the solar constant, solar tilt angle, solar hour angle, solar elevation angle, solar azimuth angle, and solar incidence angle. The derivation process of each parameter is listed here without proof [2,3,4,5,6].
3.1.1. The Absolute Position of the Sun
The solar constant, solar tilt angle, and solar hour angle determine the absolute position of the sun are calculated with Equations (1)–(3) [2,3,4]:
where is the solar constant; is the solar tilt angle; is the solar hour angle; and N is the ordinal day of the year. The solar time angle changes by 15° every hour and represents true solar time. In addition, Equation (4) is used for calculating true solar time [2,3,4]:
and can be found in Equations (5) and (6) [2,3,4]:
In these equations, is the time difference, and is the sun corner.
3.1.2. The Relative Position of the Sun
The solar elevation angle and azimuth determine the sun’s location relative to the bridge [2,3,4]. The calculation Equations (7) and (8) are:
In the equations, φ is the geographical latitude, with the north latitude as the positive.
3.1.3. Solar Incidence Angle
The solar incidence angle is one factor that determines the radiant intensity of the bridge [2,3,4,5,6]. The calculation equation is:
where is the inclination angle between the normal direction of the structure surface and the horizontal plane, and is the angle between the normal direction of the structure surface and the due south direction.
The thermodynamic parameters of the steel box arch rib section are as follows:
- (1)
- Material density: steel density is 7850 kg/m3;
- (2)
- Thermal conductivity: the thermal conductivity of steel is 55.1 W·m−1·K−1;
- (3)
- Specific heat capacity: steel specific heat capacity is 435.7 J/(kg·K) [7];
- (4)
- Solar radiation absorption coefficient: because no coating work was carried out during the temperature monitoring period of the arch rib, it is considered uncoated steel; the average value of the solar radiation absorption coefficient is 0.82 [8].
3.1.4. Direct Solar Radiation Intensity
The solar radiation received on the Earth’s surface includes three parts: direct solar radiation, sky-scattered radiation, and ground-reflected radiation. Among them, sky scat-tering and ground reflection can affect the total amount and wavelength distribution of solar radiation received on the ground.
When calculating direct solar radiation, the concept of atmospheric optical mass is usually introduced, because direct solar radiation is absorbed, scattered, and reflected by atmospheric gases, water vapor, clouds, aerosols, and other factors when passing through the atmosphere. Direct solar radiation is attenuated when it reaches the ground. The atmospheric optical quality can describe the degree of attenuation of direct solar radiation by the atmosphere, which is related to factors such as atmospheric thickness, changes in atmospheric refractive index, and solar altitude angle. The expression for atmospheric optical quality [2,3,4,5,6] is shown in Equation (10):
According to Equation (10), the direct solar radiation intensity reaching the ground can be calculated [6] by Equation (11):
where P is the atmospheric transparency coefficient [6].
In addition, the direct solar radiation intensity on the surface of a structure placed at any angle can be determined by Equation (12):
3.1.5. Sky-Scattered Radiation Intensity
The scattered radiation from the sky is mainly caused by the scattering of solar radiation by gases and aerosols in the atmosphere and also includes solar radiation reflected by clouds. The intensity of scattered radiation from the sky on a horizontal plane can be determined by Equation (13) [4,5,6]:
The scattering intensity of the sky on any inclined plane can be determined by Equation (14) [4,5,6]:
3.1.6. Ground-Reflected Radiation Intensity
Ground-reflected radiation refers to the radiation that occurs on the surface of the ground after being reflected by the sun. It is the reflection and diffuse reflection of solar radiation on the ground surface. The intensity of ground-reflected radiation reaching the outer surface of the structure can be determined by Equation (15) [4,5,6]:
where is the reflectance of the ground, usually taken as 0.2 [6].
The calculation formula for the total solar radiation intensity reaching the surface of the structure is obtained by combining Equations (12), (14), and (15), as shown in Equation (16) [4,5,6]:
Based on the determination methods of astronomical parameters and heat transfer parameters of the structural temperature field, as well as factors such as the environment, geographical location, and testing time of the Jieyu Island Bridge, the relevant calculation parameters for the temperature field of the steel box arch rib section are determined as follows:
- (1)
- Longitude of the bridge location: 113° 24′ 0″ E;
- (2)
- Latitude of the bridge location: 22° 6′ 0″ N;
- (3)
- Arch rib azimuth angle: The angle between the second arch rib and due south is 60°;
- (4)
- Ground reflectance: calculated based on grassland, taken as 0.2;
- (5)
- Days of the year: The day of the year for the second arch rib summer test day on 15 August 2022 is 227, and the day of the year for the winter test day on 26 December 2022 is 360.
- (6)
- Atmospheric transparency: Based on the geographical location of the bridge, taken to be 0.6.
3.2. Final Radiant Intensity
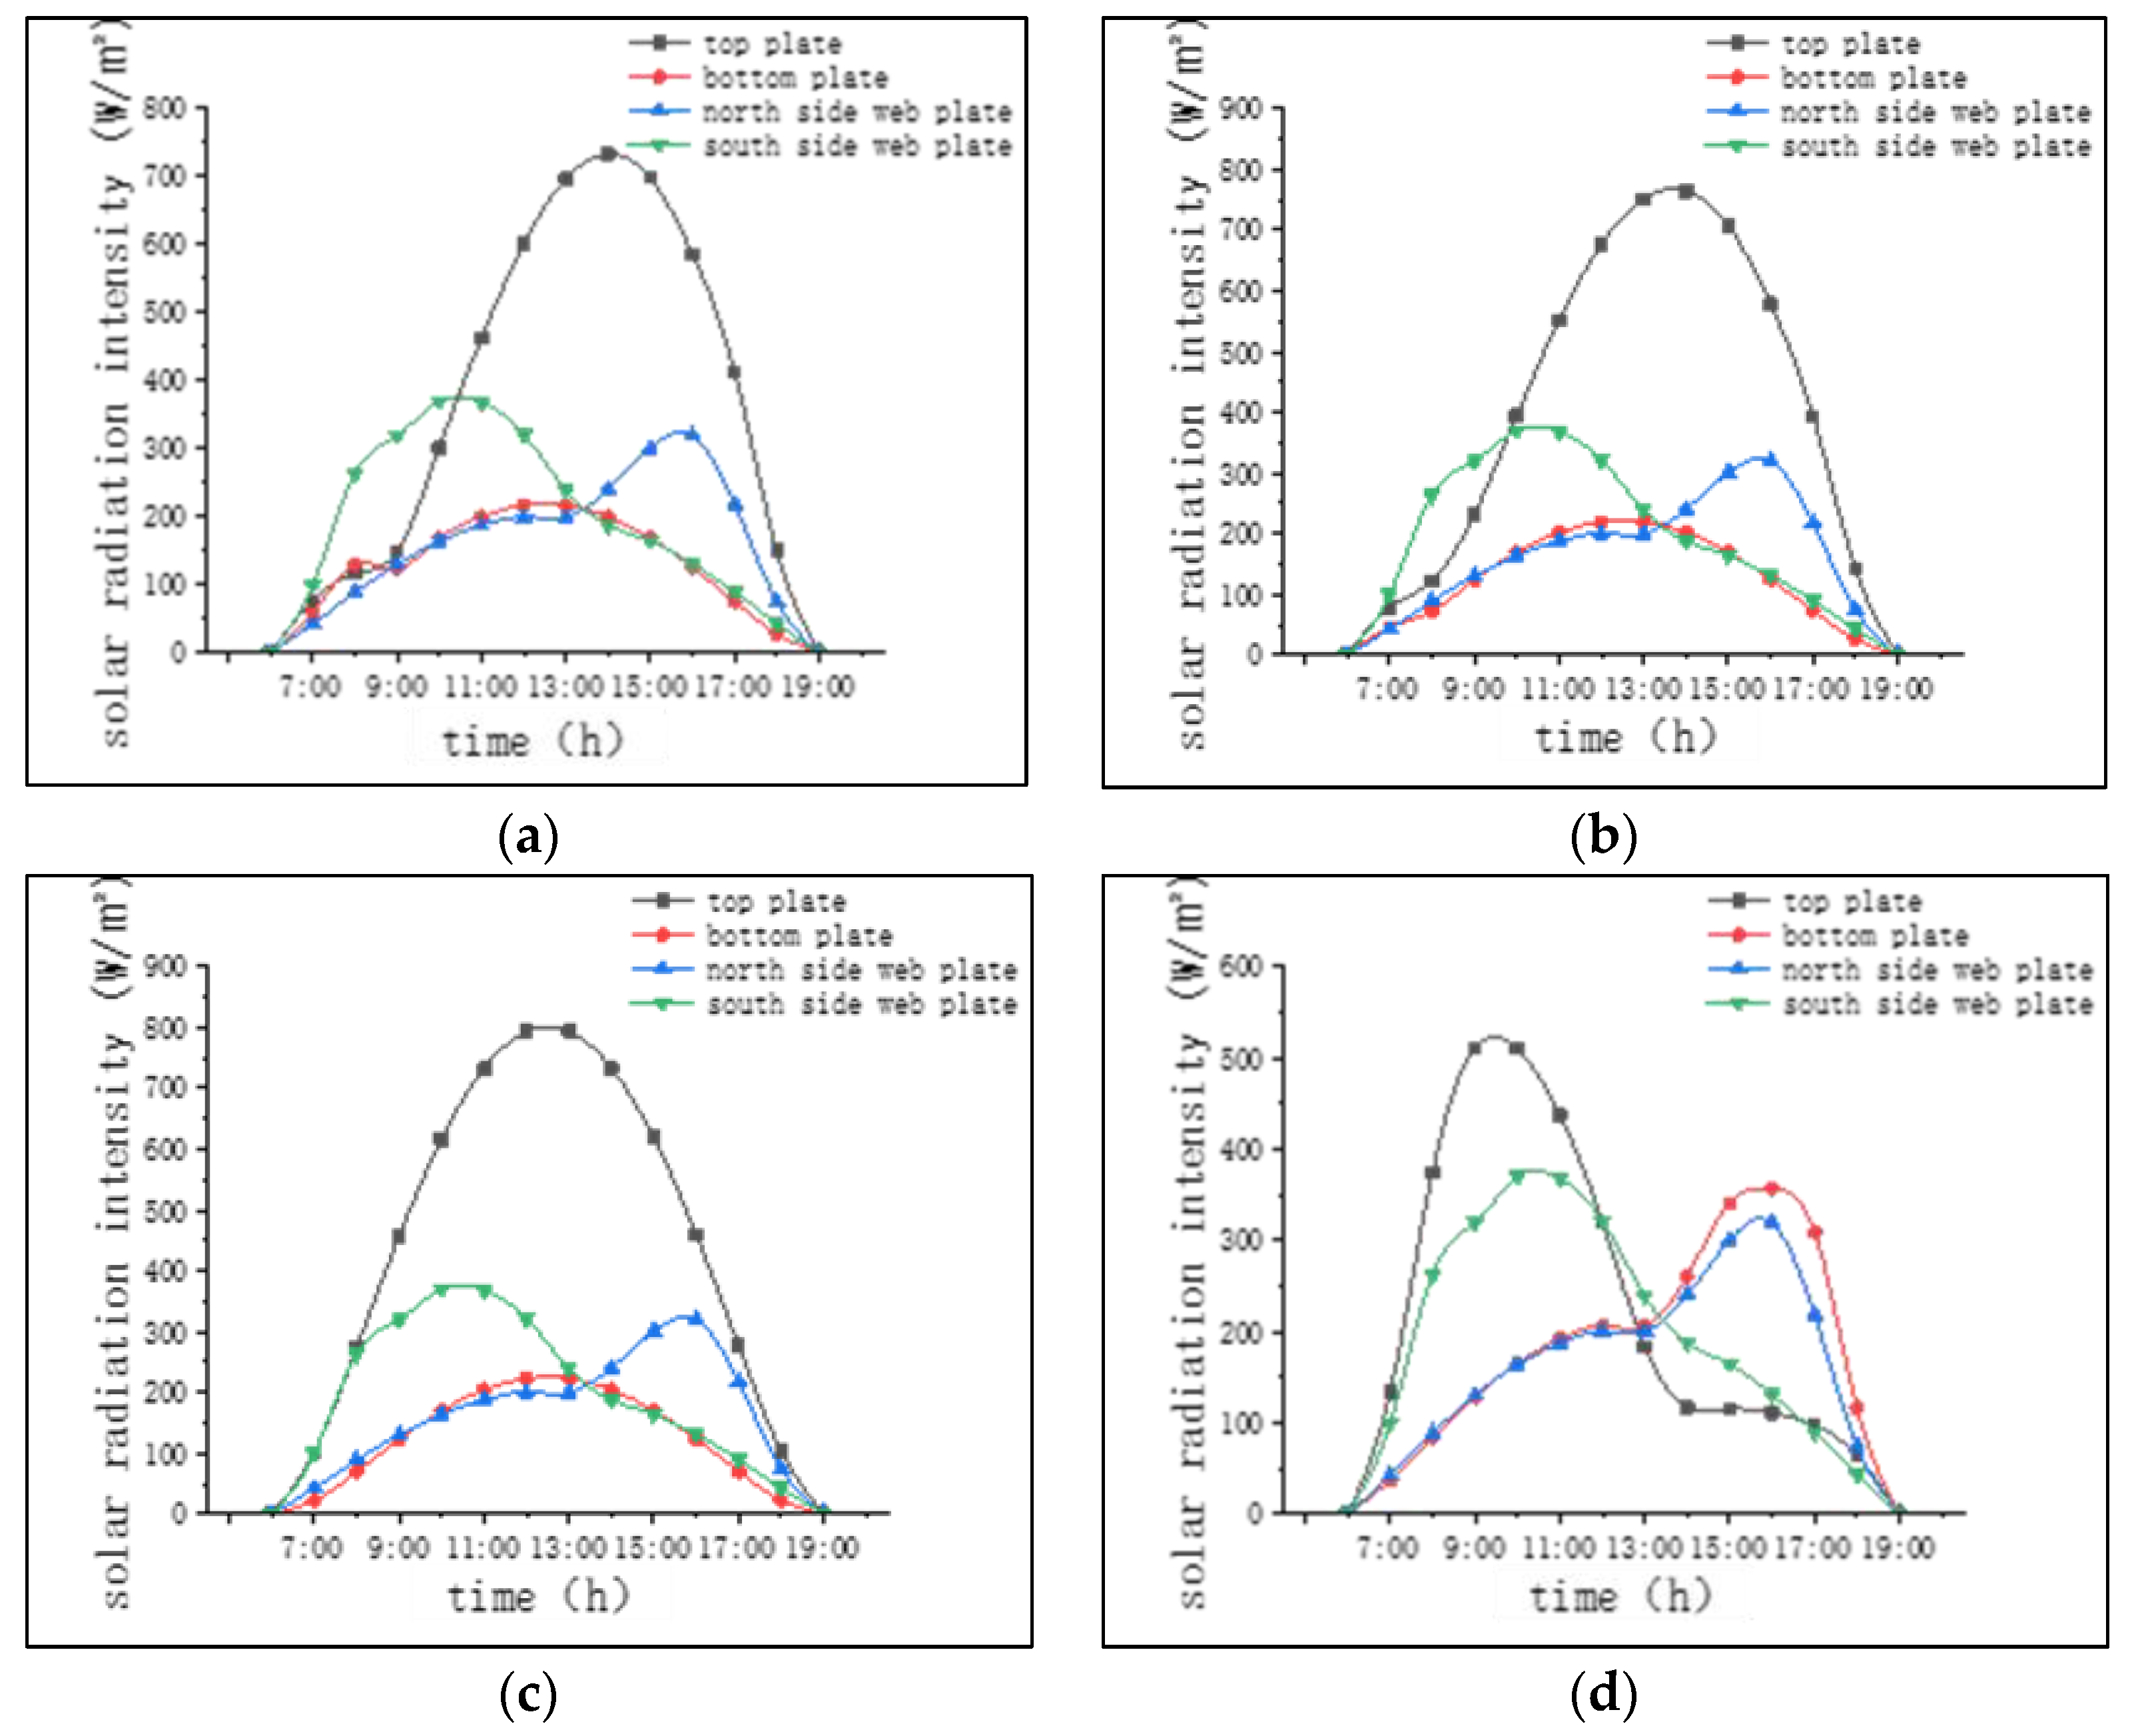
According to the calculation method of temperature field astronomical parameters, the final radiant intensity of each boundary of the temperature test section of No. 2 steel box arch rib on 15 August and 26 December 2022 was determined. Given limited space, this paper only lists the final radiant intensity curves of each boundary of the four test sections of the No. 2 arch rib on 15 August 2022, as shown in Figure 7:
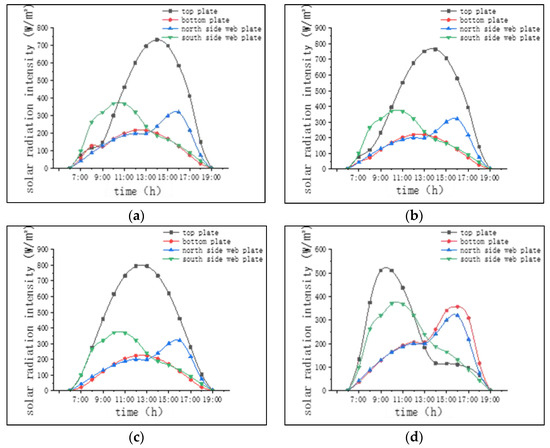
Figure 7.
Final radiant intensity curve of each boundary of test section of the No. 2 arch rib: (a) G2J1 test section, (b) G2J1 test section, (c) G2J1 test section, and (d) G2J12 test section.
As shown in Figure 7, the intensity of solar radiation absorbed by different segments is the same for the north and south web plates. The southern web absorbs the maximum solar radiation intensity at 10:00 h. In contrast, the northern web absorbs the maximum solar radiation intensity at 15:00 h. This is because the change in solar incidence angle causes the northern web to be on the back-shaded surface before 12:00 h, while the southern web is on the back-shaded surface after 12:00 h, resulting in its inability to receive direct solar radiation intensity. The final radiation intensity curve also undergoes a sudden change.
In addition, the solar radiation intensity absorbed by the top plate is always greater than that of the bottom plate. Although the two arch rib bottom plates can receive a certain amount of direct solar radiation for a specific time, the inclination angle of the two arch rib segments relative to the horizontal plane is slight, resulting in the bottom plate receiving too short a period of direct solar radiation. From Figure 3 and Figure 4, it can be seen that from 13:00 to 17:00 h, test section G2J12 represents a cross-section where the solar radiation intensity absorbed by the bottom plate is greater than that of the top plate. The final radiation intensity curve of the top and bottom plates shows a sudden change at 13:00 h, due to the large inclination angle of section G2J12. From 13:00 h, the top plate is on the back-shaded side and no longer receives direct solar radiation, while the bottom plate begins to receive natural solar radiation. Similar conclusions can also be drawn in segment G2J9, except that there is a specific difference in the time when the bottom plate begins receiving direct solar radiation and when the top plate receives natural solar radiation. On the other hand, G2J7 represents the maximum solar radiation intensity absorbed by the top and bottom plates of the cross-section at noon, and the minimum solar radiation intensity absorbed at 6:00 and 18:00 h. This is because the segment is approximately parallel to the horizontal plane and can receive direct solar radiation from 6:00 to 18:00 h.
In summary, it can be seen that for the arch rib, the top and bottom plates can receive direct solar radiation during the period of 6:00~18:00 h. However, because each part of the arch rib is inclined at a different angle and the sun shines at different angles, the top and bottom plates can receive different amounts of direct solar radiation for different amounts of time. This means that the final radiation intensity they absorb is also different.
3.3. Calculation of Heat Transfer Boundary Conditions
The heat transfer modes of the environment in which the structure is located include thermal convection heat transfer, thermal radiation heat transfer, and thermal conduction. These three heat transfer methods usually coexist, interact and couple with each other, so their effects must be comprehensively considered in the actual heat transfer process. The wind speed values at different times were measured using a wind speed tester, and the convective heat dissipation calculation was carried out using the empirical equation proposed by Liu [8]. The arch ribs exchange and transfer heat with other external objects, described by radiative heat dissipation. Combined with the meteorological data of the project location, the radiative heat transfer coefficient is taken as 5.31 W/(m2·K). After calculation, the comprehensive heat transfer coefficient of each boundary of the second arch rib test section on 15 August can be obtained [6], as shown in Table 2.
Table 2.
Comprehensive heat transfer coefficient of the No. 2 arch rib in W/(m2·K).
4. Establishment of Finite Element Model
4.1. Modeling
Using the arch rib test section as the analysis object, a thermal analysis model for the corresponding section was established using the ANSYS Workbench. The material properties of the numerical model are presented in Table 3, and its unit mesh was divided (mesh size = 10 mm), as shown in Figure 8. The analysis model consists of 18,560 nodes and 5264 units. In Workbench’s two-dimensional transient thermal analysis, the application method of temperature load and boundary conditions is as follows: solar radiation is applied to the top and bottom plates of the arch rib and the outer side of the web plate through heat flux, and the comprehensive heat transfer coefficient is applied to the inner and outer boundaries of the arch rib through convection. The temperature field simulation of the steel box arch rib takes the sunrise time on the test day as the calculation start time and the sunset time as the calculation end time. The final radiant intensity and comprehensive heat transfer coefficient of each boundary of the test section of the steel box arch rib on 15 August and 26 December are applied to the transient thermal analysis model.
Table 3.
Material properties of the numerical model.
Figure 8.
Finite element model of the transient temperature field in a test section: (a) numerical analysis model, (b) unit grid division.
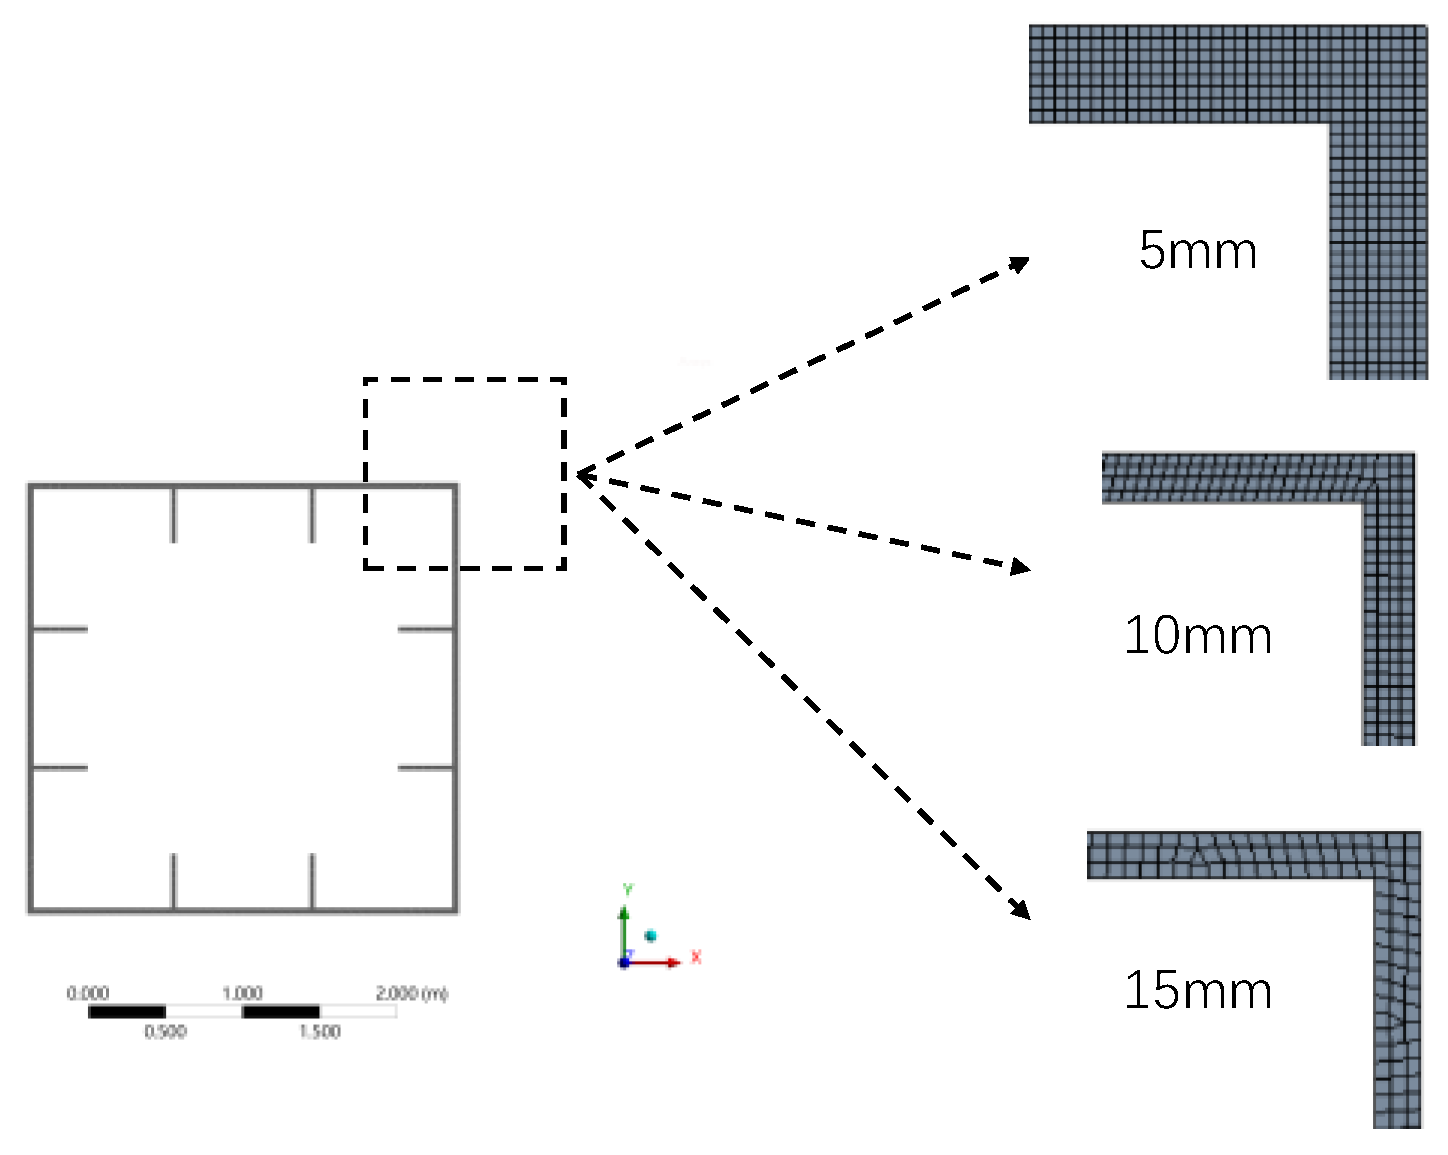
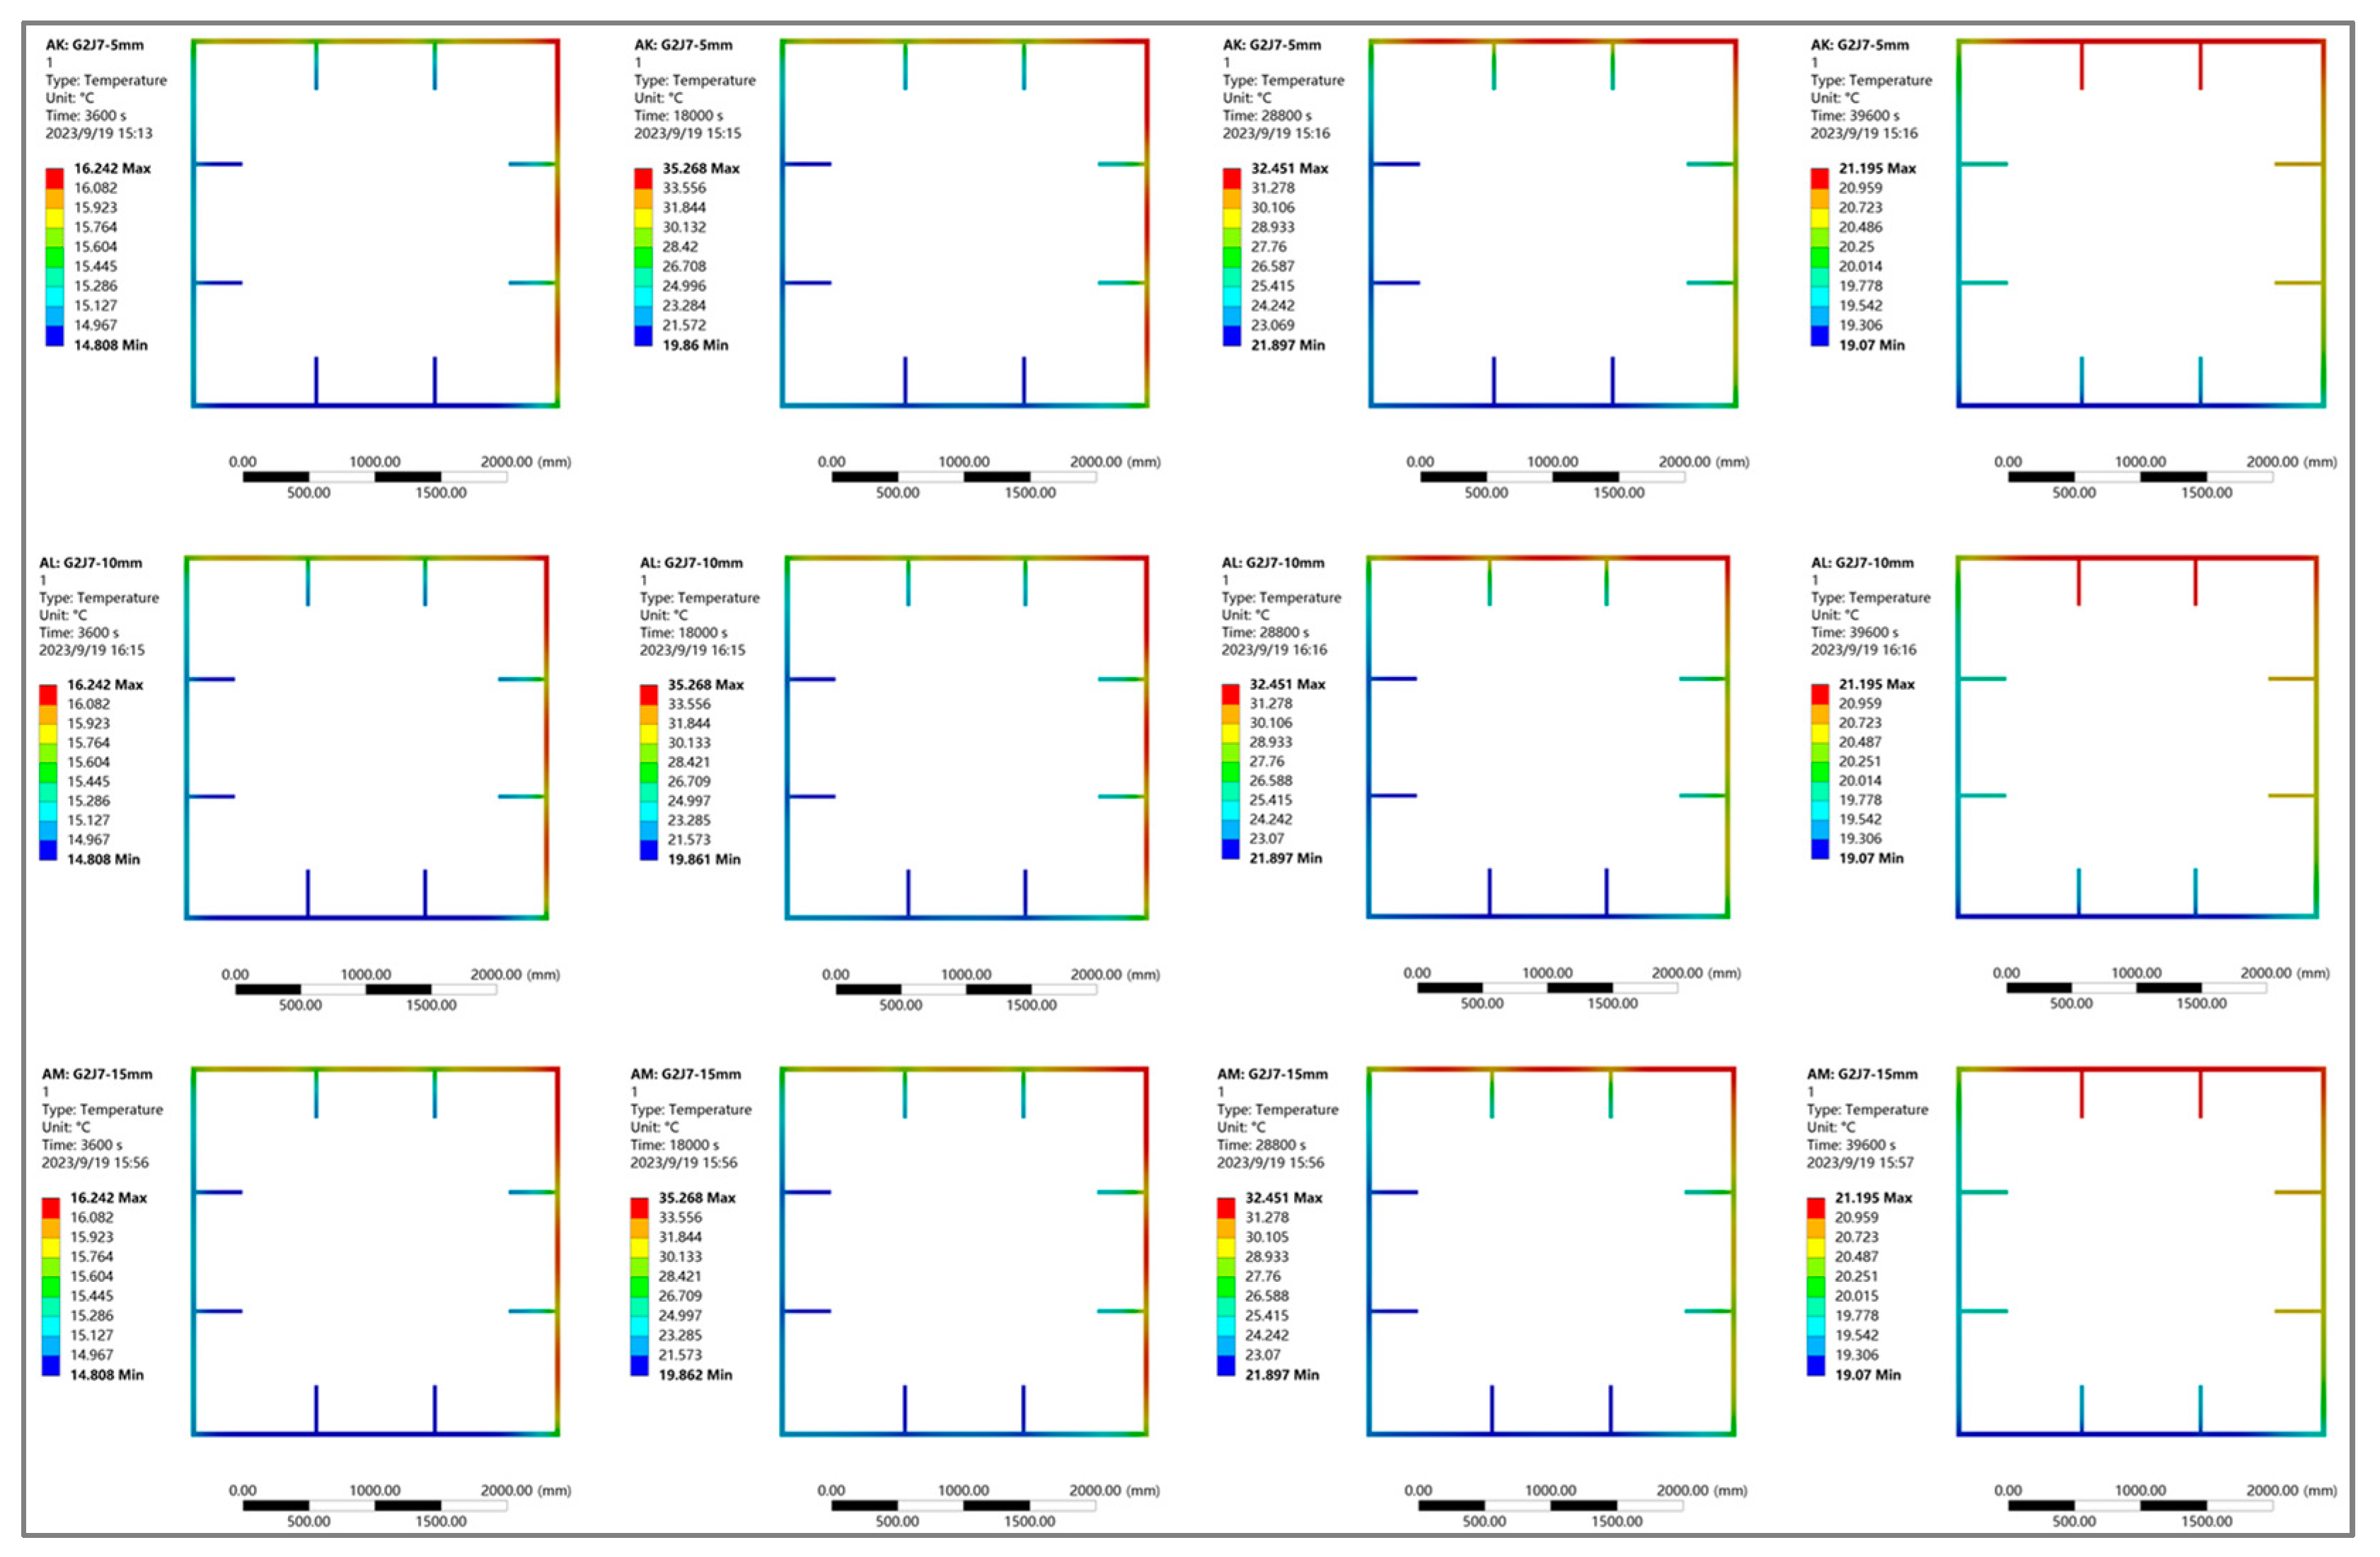
In the model, section G2J7 of the second arch rib (26 December) was used as the analysis object. The temperature distribution of the test section was estimated at mesh sizes of 5 mm, 10 mm, and 15 mm; the mesh size of the test section is shown in Figure 9. The comparison of temperature distributions in different test sections at other times is shown in Figure 10.

Figure 9.
Mesh sizes of the test section.
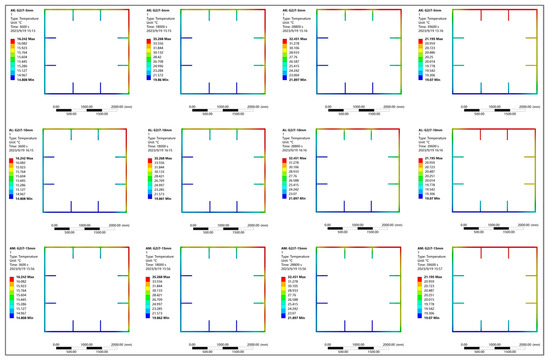
Figure 10.
Comparison of temperature distribution in different test sections at different times.
From Figure 10, it can be seen that when the calculation mesh size is 5 mm, 10 mm, or 15 mm, the temperature distribution of the test section is consistent and there is no significant difference. The results indicate that the mesh size selected in this article (10 mm) is reasonable and adequate.
4.2. Result Comparison
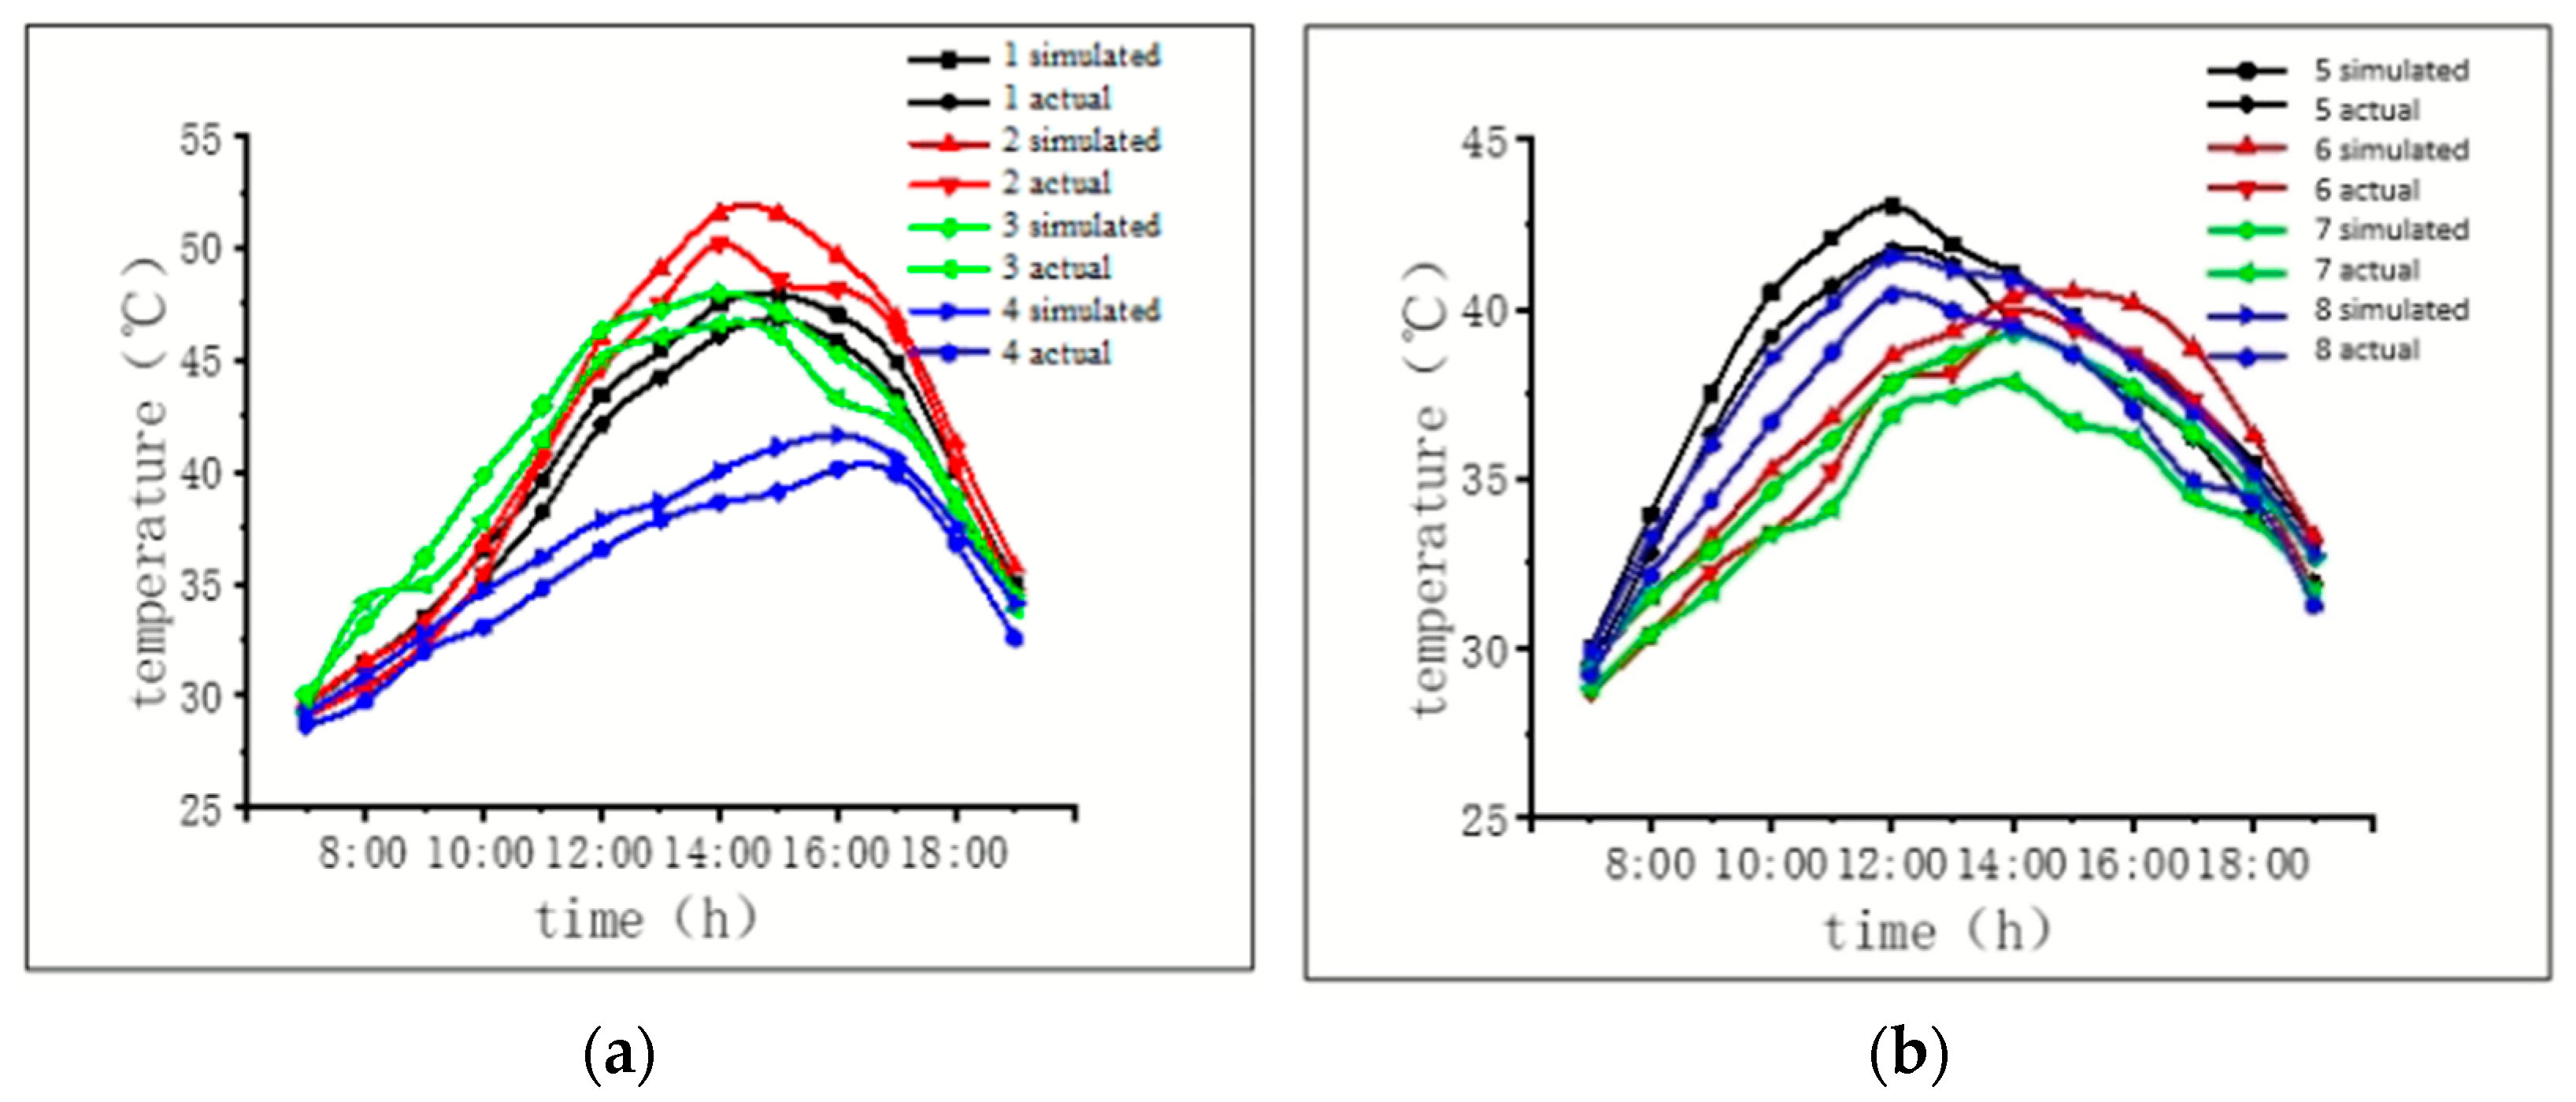
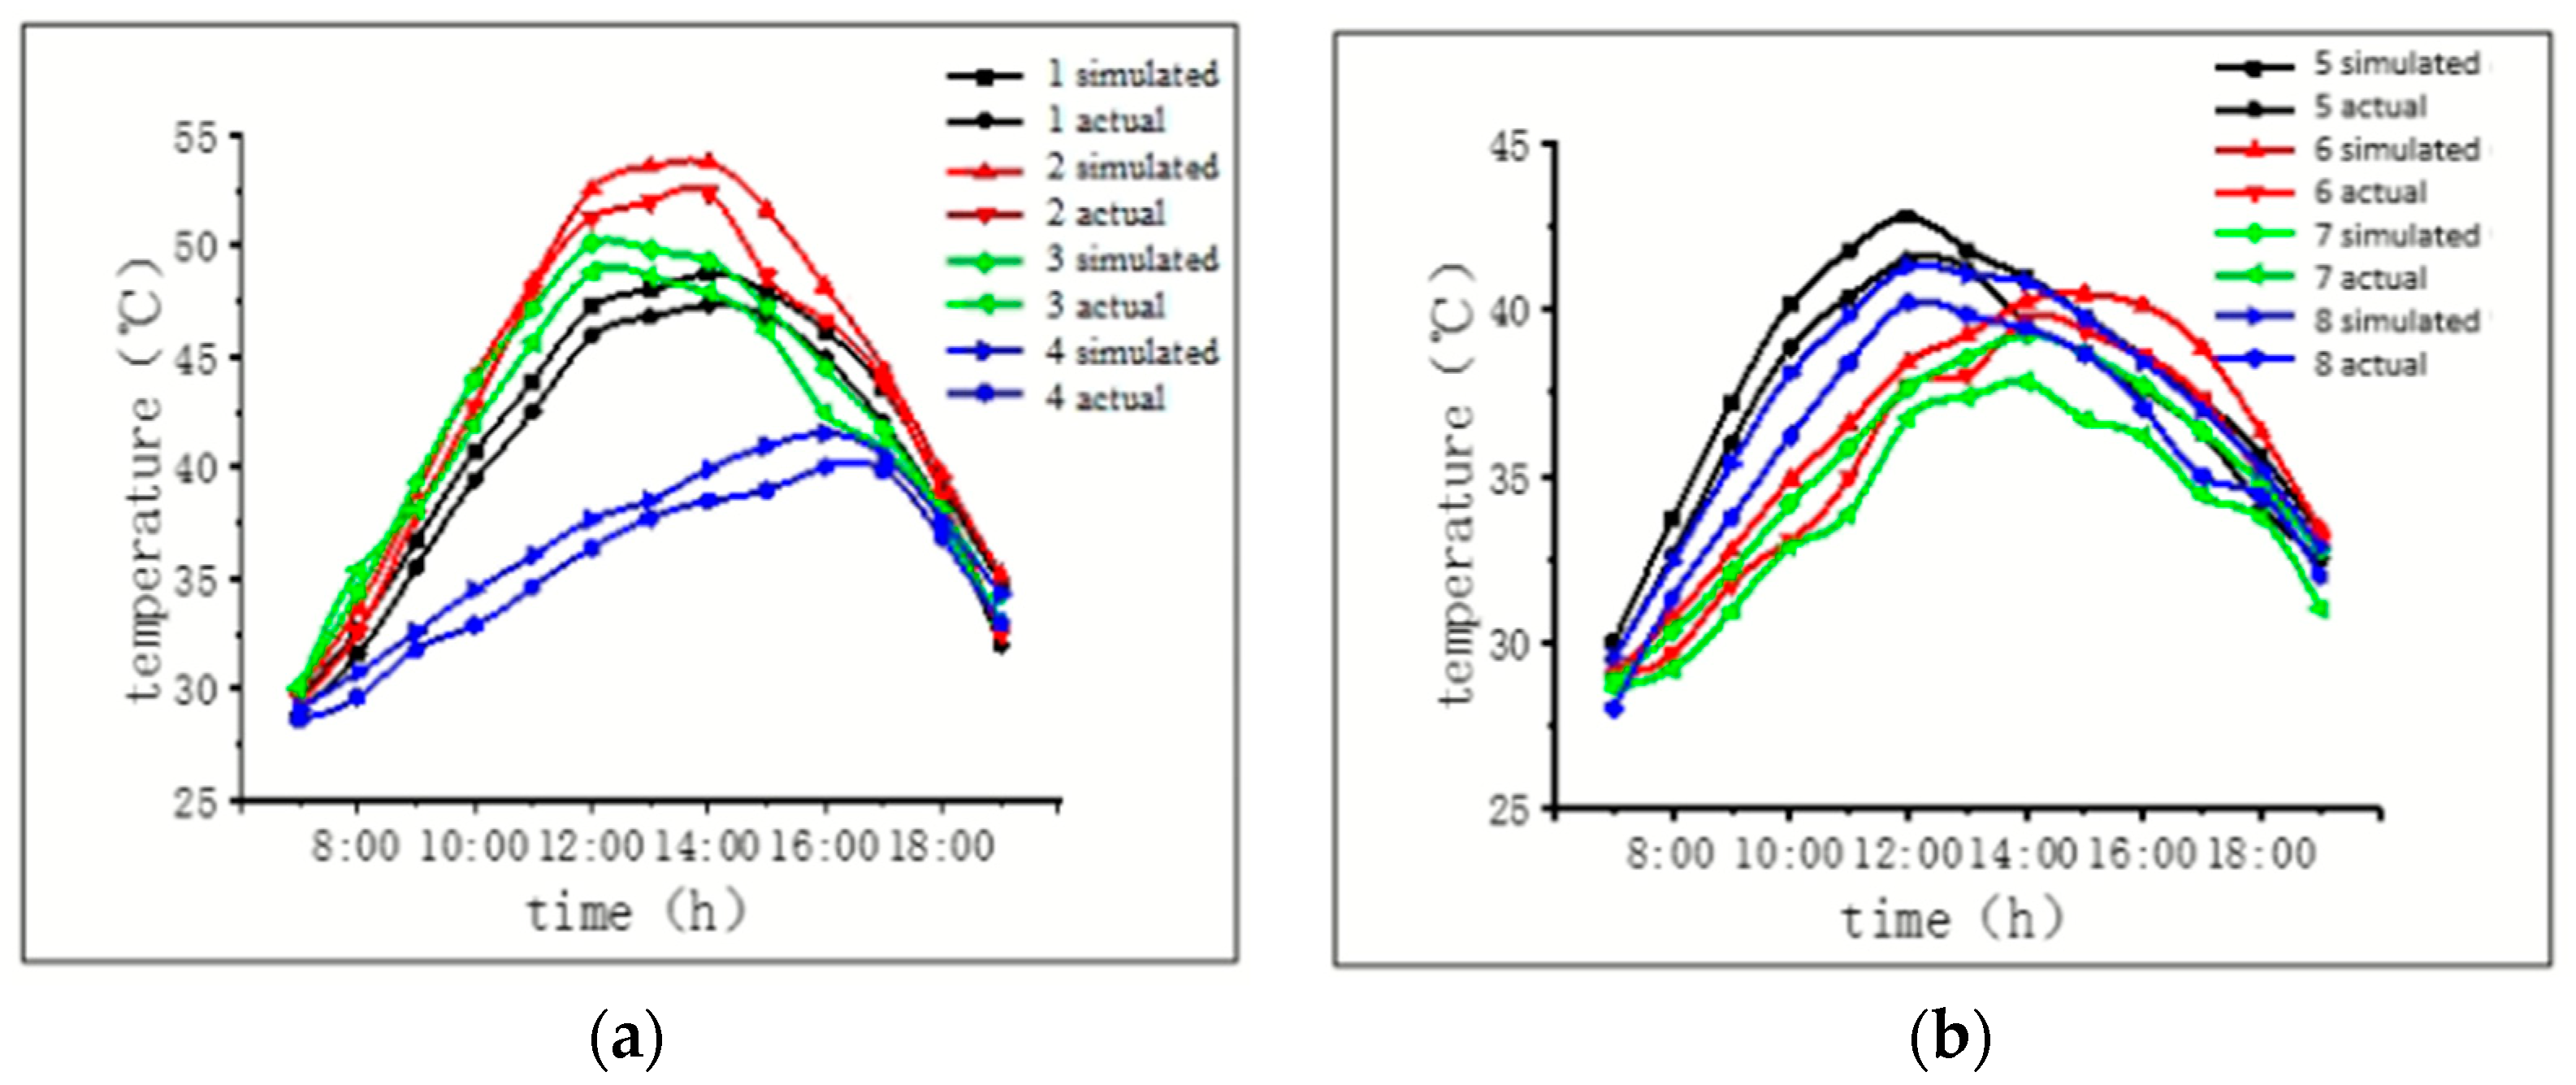
4.2.1. Segment G2J1 (15 August)
From Figure 11, it can be seen that on the summer test day, the time history variation curves of the finite element simulation and the measured temperatures at each measuring point of segment G2J1 of the No. 2 arch rib are in good agreement, and the maximum temperature error at the same time does not exceed 3 °C. The error is caused by the fact that the environmental temperature curve used in finite element simulation is close to the trigonometric function curve, and there is a specific deviation between the calculated parameters, such as the comprehensive heat transfer coefficient, and the actual situation. Meanwhile, during the testing period, the temperature distribution at the boundaries of the steel box arch ribs showed significant non-uniformity, with the maximum temperature difference at the top plate being 4.1 °C at 14:00 h, and the maximum temperature difference between the bottom plate being 4 °C at 23:00 h. In addition, the maximum temperature difference between the north and southern sides of the belly plate is 7.4 °C and 7 °C, respectively, corresponding to 14:00 h.
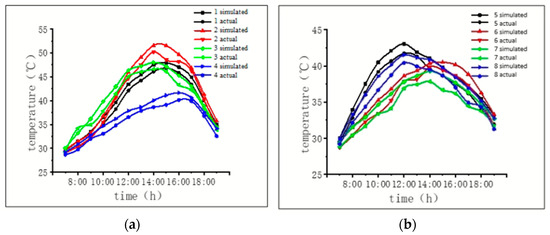
Figure 11.
Comparison of simulated temperature and actual measured temperature for section G2J1 (a) at measurement points 1, 2, 3, and 4, and (b) at measurement points 5, 6, 7, and 8.
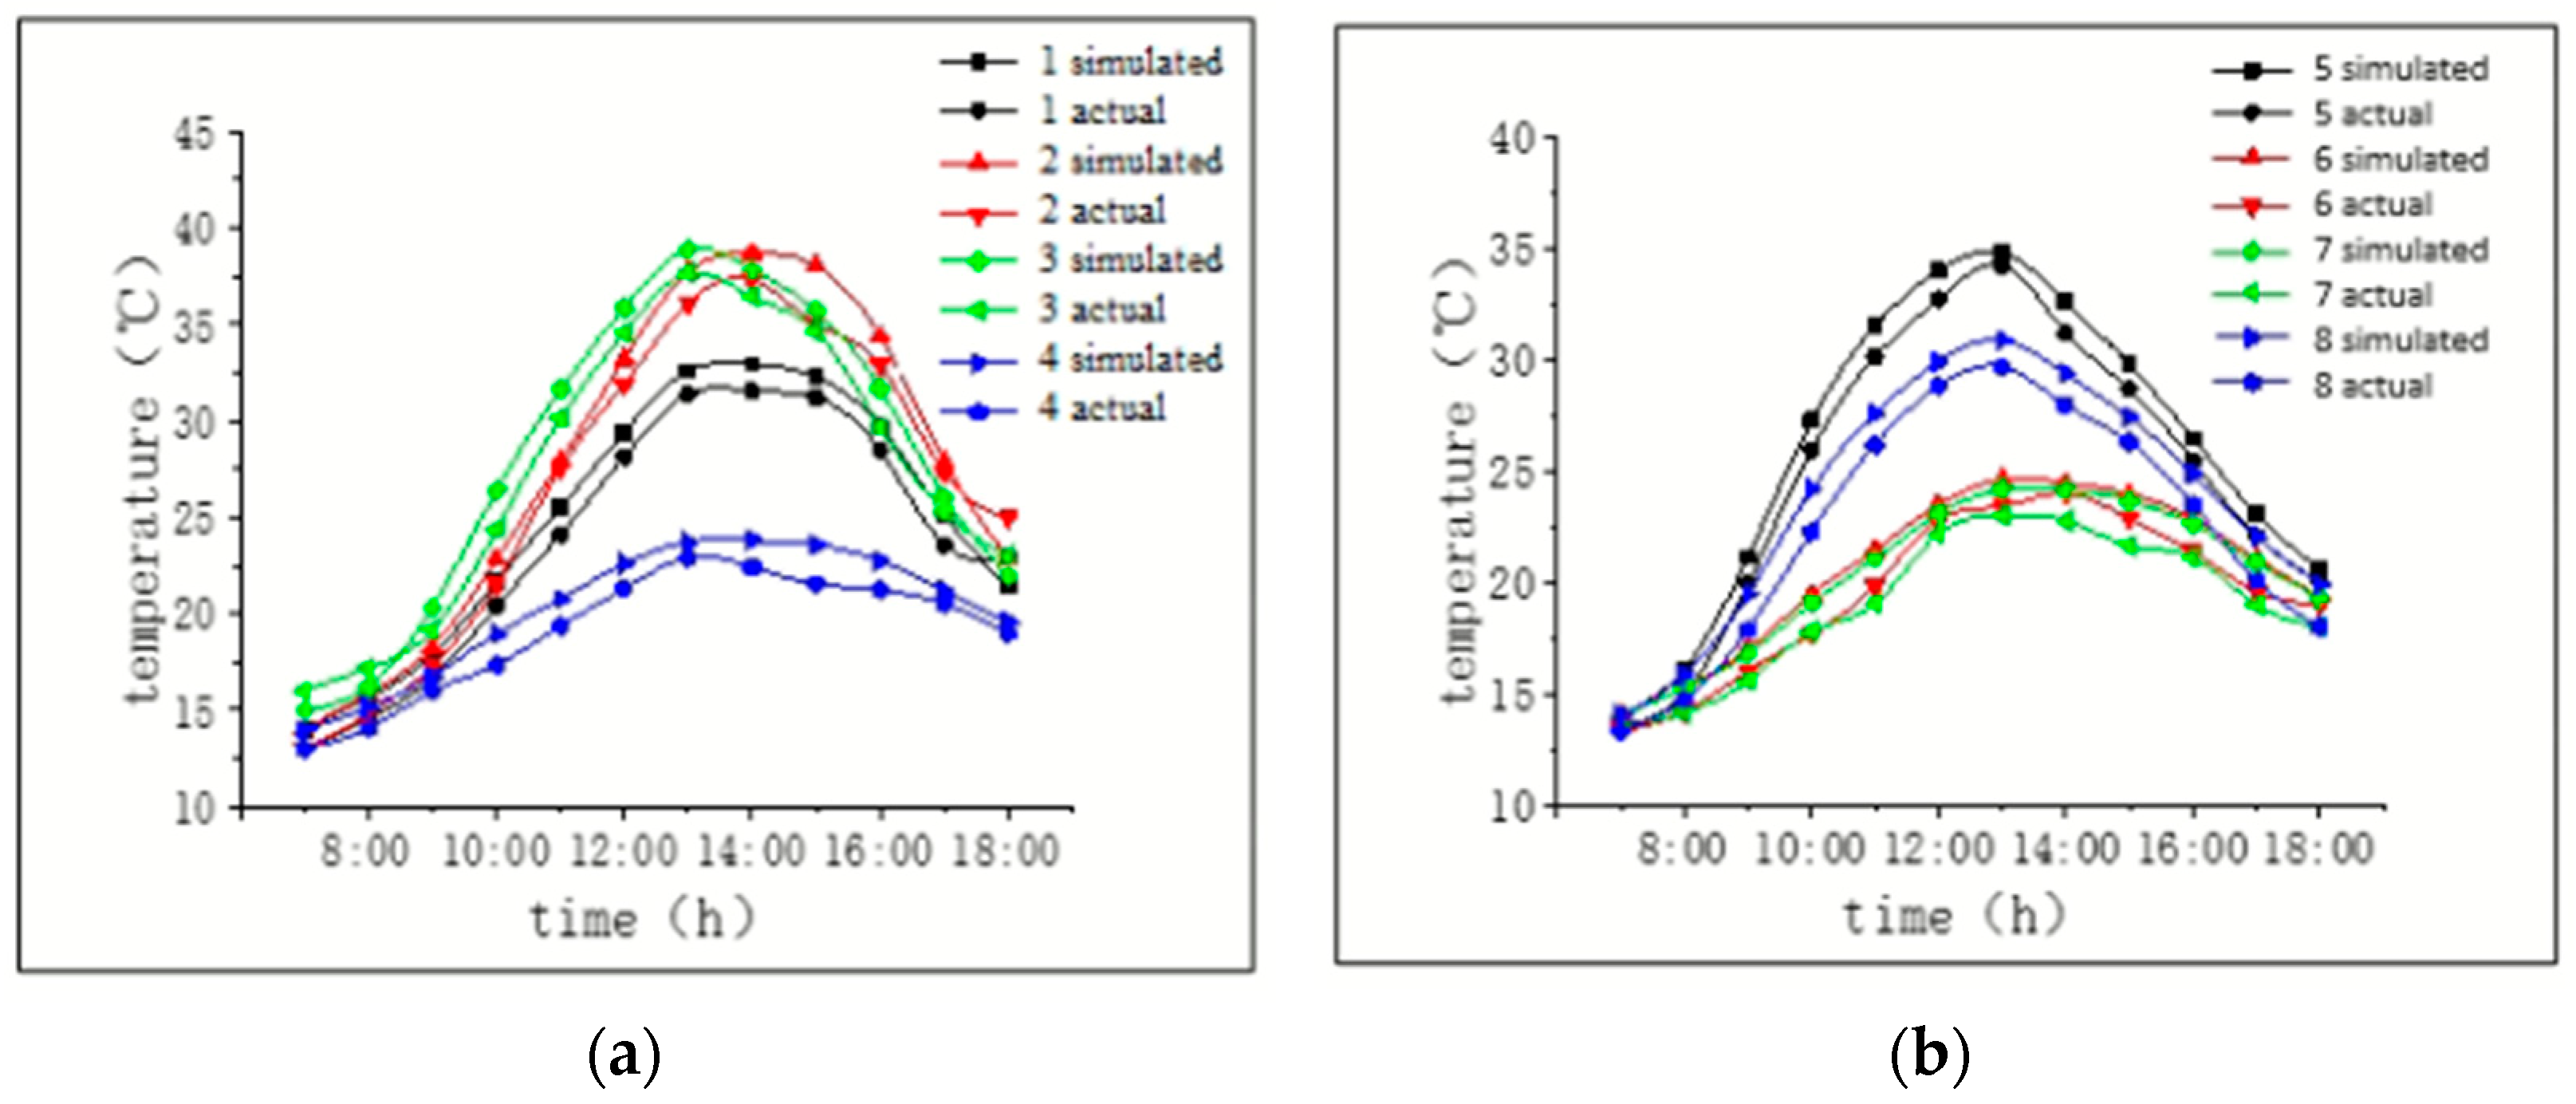
4.2.2. Segment G2J7 (15 August)
Figure 12, shows that on the summer test day, the time history curves of the finite element simulation and the measured temperatures at each measuring point of segment G2J7 of the second arch rib are in good agreement. The maximum temperature error at the same time is 2.8 °C, and the significant error is mainly concentrated at the top plate measuring point at sunset. In addition, the influence of the temperature distribution on the south web plate causes the peak temperature of measurement point 3 to advance by 2 h. The peak temperature at measurement points 4–8 coincides with segment G2J1.
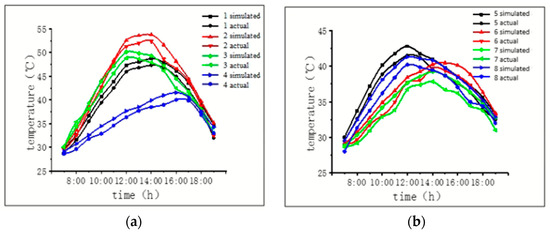
Figure 12.
Comparison of simulated temperature and actual measured temperature for section G2J7 (a) at measurement points 1, 2, 3, and 4, and (b) at measurement points 5, 6, 7, and 8.
4.2.3. Segment G2J12 (15 August)
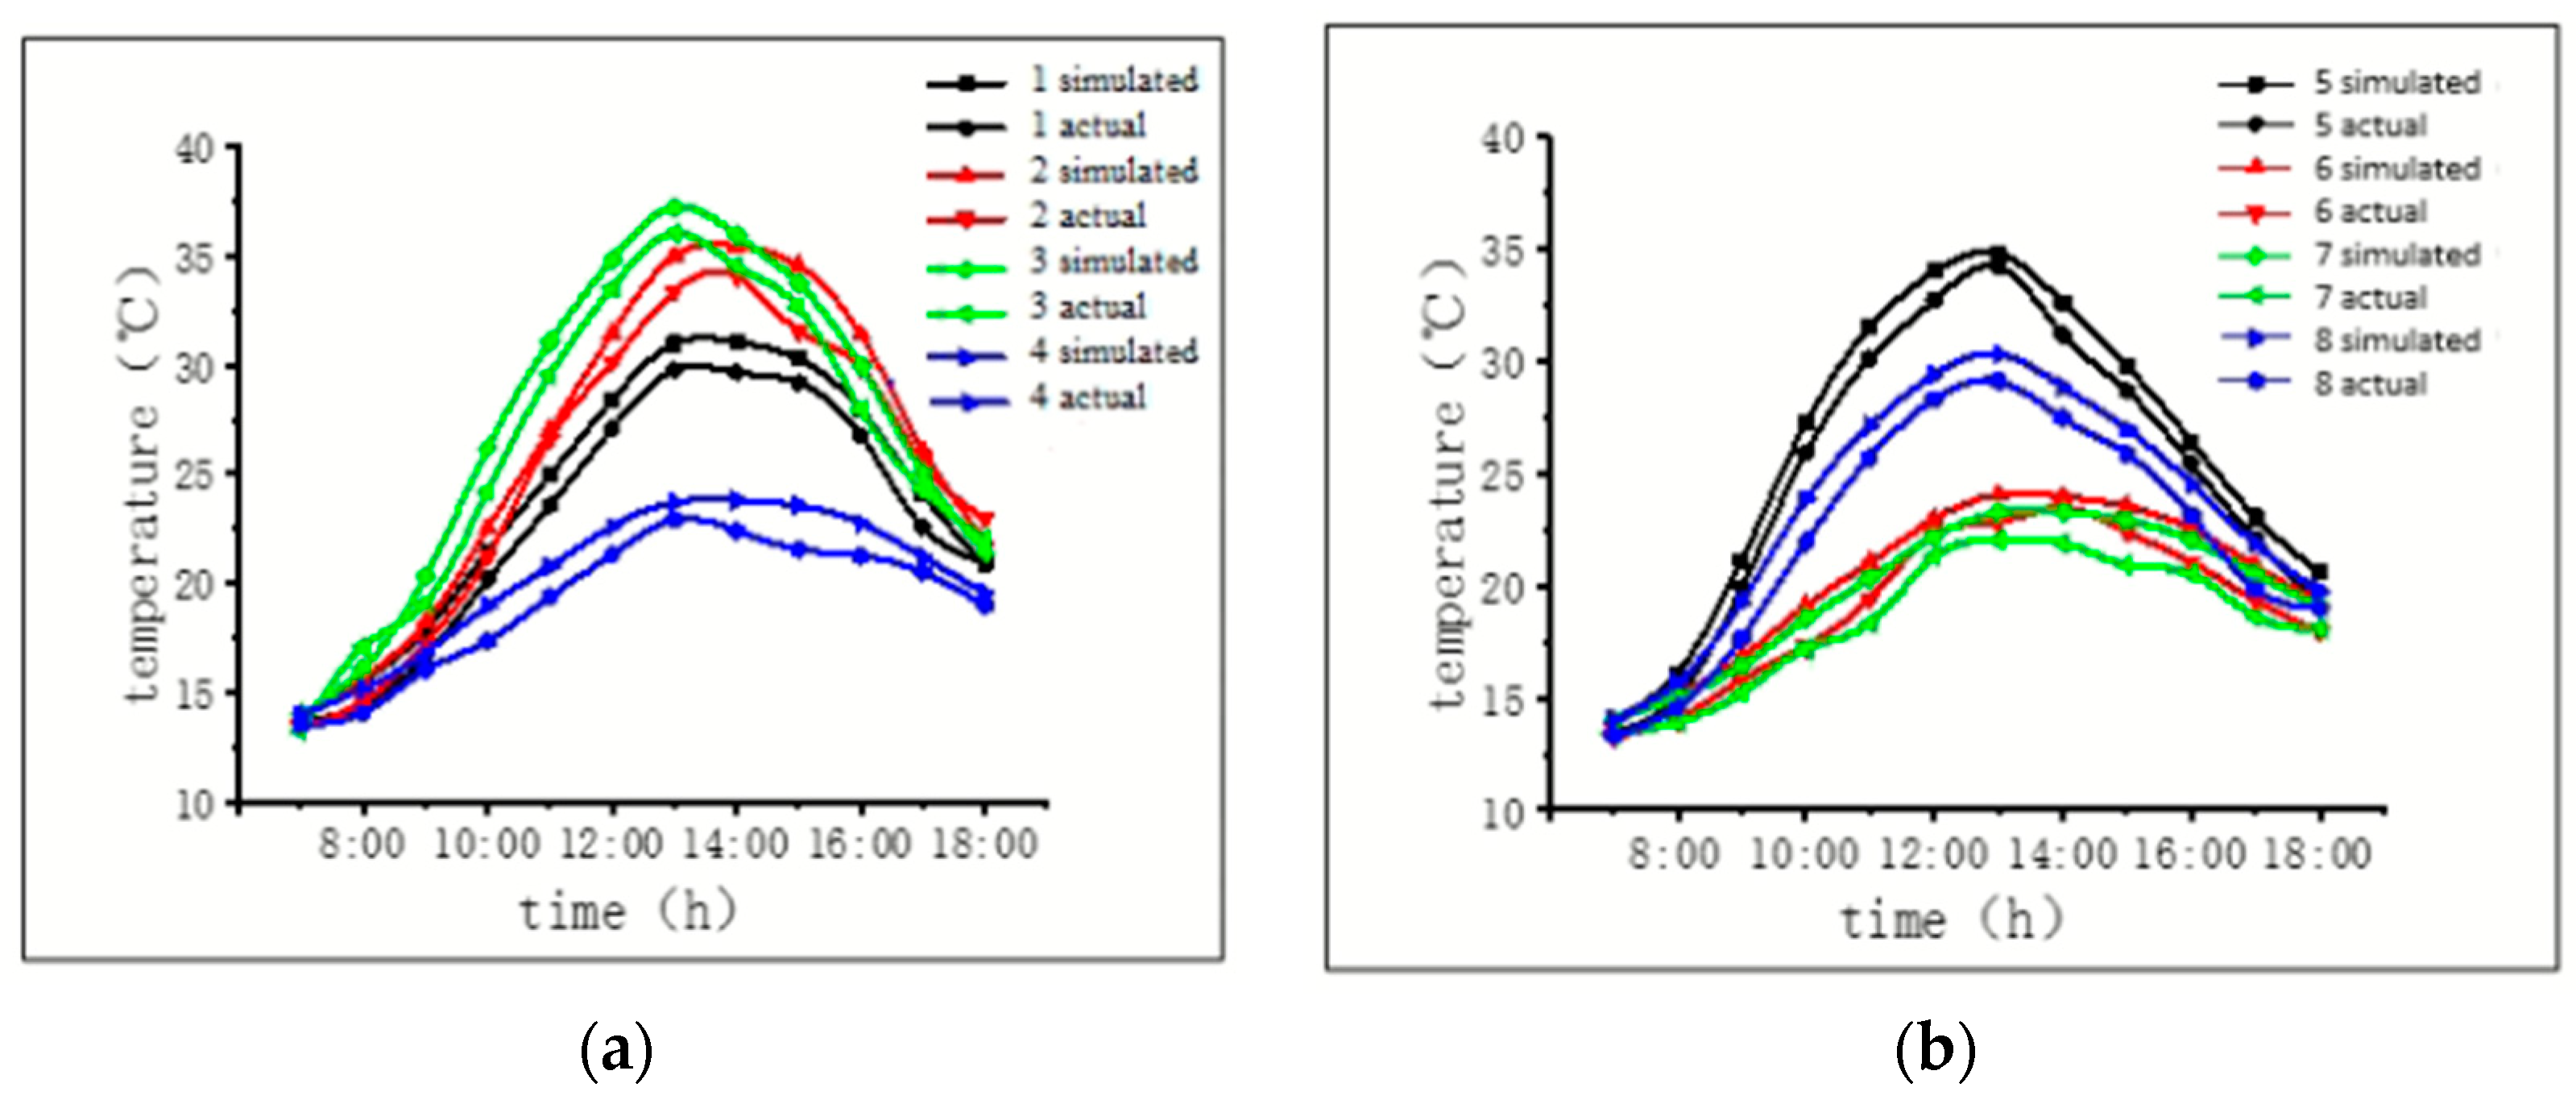
The comparison between the measured temperature values at each measuring point of test section G2J12 and the theoretical calculation values is shown in Figure 13.
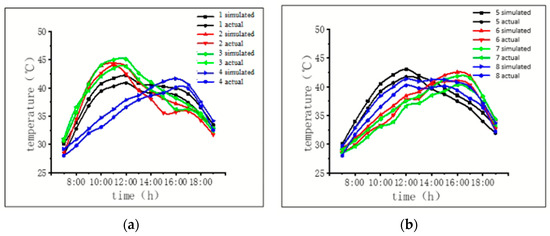
Figure 13.
Comparison of simulated temperature and actual measured temperature for section G2J12 (a) at measurement points 1, 2, 3, and 4, and (b) at measurement points 5, 6, 7, and 8.
Figure 11, Figure 12 and Figure 13, show that the time history variation curves of the finite element simulation temperature and the measured temperature at each measuring point of the No. 2 arch rib on the summer test day fit well. The maximum temperature error at the same time is 2.8 °C, and the significant error is mainly concentrated at the top plate measuring point at sunset.
Overall, the temperature simulation results of the steel box arch rib section on the summer testing day are consistent with the measured results, indicating that the selected calculation parameters are in line with reality and can be used to simulate the temperature field distribution of the steel box arch rib.
4.3. Comparison of Winter Measurement Results with Finite Element Simulation
According to the calculation parameters of the temperature field, such as the measured wind speed and atmospheric temperature at the bridge site on 16 December 2022, the comprehensive heat transfer coefficient and solar radiant intensity at each boundary of the steel box arch rib on the winter test day were calculated and were then added to the finite element model of the transient temperature field of the steel box arch rib section. The computed temperature at the measuring point was compared with the measured value for verification. By comparing and analyzing the measured temperature at the measuring points of the test section with the theoretical calculation results, it was found that the measured temperature curves of the web plates of each test section were relatively close. The trend of the measured temperature curves of the top and bottom plates was consistent, except for the inconsistent occurrence of temperature peaks. Taking test sections G2J1, G2J4, and G2J12 as examples, the temperature curves of each measurement point under winter sunshine conditions are compared with the theoretical simulated temperature curves as follows.
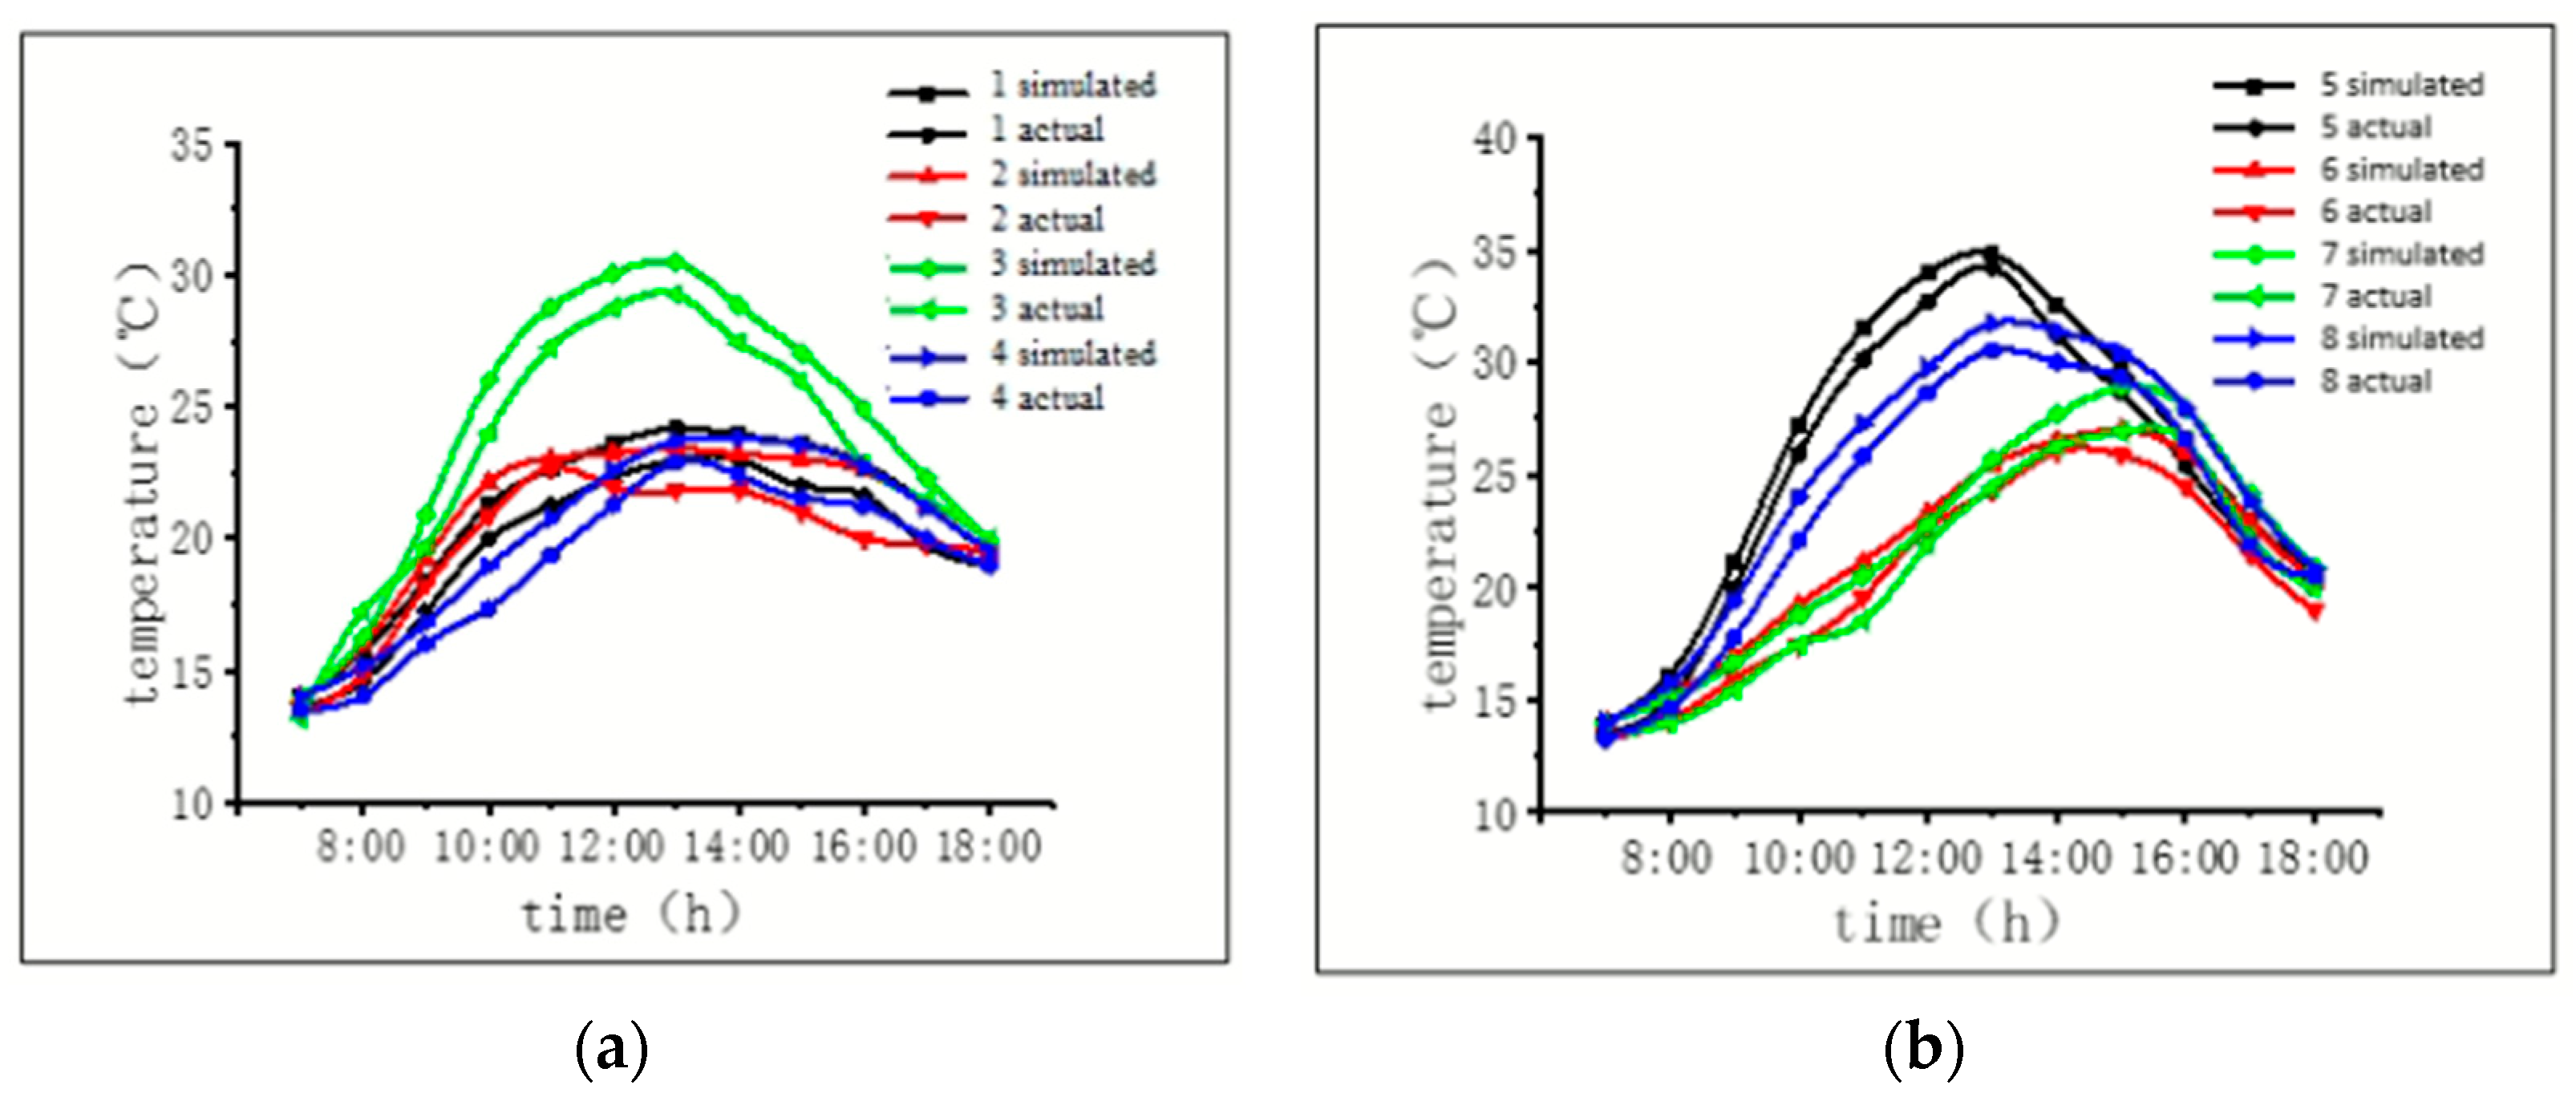
4.3.1. Comparison of Test Cross Section Results for Section G2J1 of Arch Rib No. 2
Figure 14 shows that on the winter test day, the time history curves of the finite element simulation and the measured temperatures at each measuring point of segment G2J1 of arch rib No. 2 fit well. The maximum temperature error simultaneously is 2.2 °C, and the error is mainly concentrated in the afternoon cooling segment. At sunrise, the heating rate of each measuring point is slower than in the theoretical simulation. During the cooling phase in the afternoon, the temperature at each measuring point decreases faster than the theoretical simulation temperature, and the downward trend slows near sunset. During the testing period, the maximum temperature at each measuring point of section G2J1 was 38.9 °C. The temperature peaks at measurement points 1, 2, and 3 (arch rib roof) are concentrated between 13:00 and 14:00 h. The temperature peaks at measurement points 4–8 occur at 13:00 h.
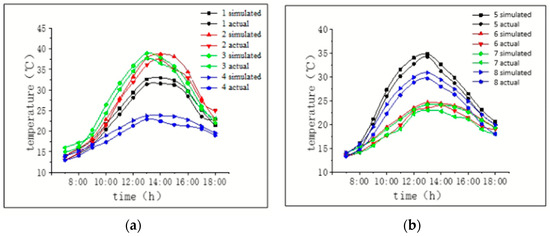
Figure 14.
Comparison of simulated temperature and actual measured temperature for section G2J1 (a) at measurement points 1, 2, 3, and 4, and (b) at measurement points 5, 6, 7, and 8.
4.3.2. Comparison of Test Cross Section Results for Section G2J4 of Arch Rib No. 2
Figure 15 shows that on the winter test day, the time history curves of the finite element simulation and the measured temperatures at each measuring point of segment G2J4 of arch rib No. 2 fit well. The maximum temperature error simultaneously is 2.2 °C, and the error is mainly concentrated at sunset. At sunrise, the heating rate at measurement point 3 is faster than the theoretical simulation, while the heating rates at other measurement points are slower than the theoretical simulation. During the cooling phase in the afternoon, the temperature at each measuring point decreases faster than the theoretical simulation temperature, and the downward trend slows near sunset. During the testing period, the maximum temperature at each measuring point of the G2J4 section was 36.1 °C. The temperature peaks at measurement points 1, 2, and 3 (arch rib roof) are concentrated between 13:00 and 14:00 h. The temperature peaks at measurement points 4–8 occur at 13:00 h.

Figure 15.
Comparison of simulated temperature and actual measured temperature for section G2J4 (a) at measurement points 1, 2, 3, and 4, and (b) at measurement points 5, 6, 7, and 8.
4.3.3. Comparison of Test Cross Section Results for Section G2J12 of Arch Rib No. 2
The comparison between the measured temperature values at each measuring point of test section G2J12 and the theoretical calculation values is shown in Figure 16.
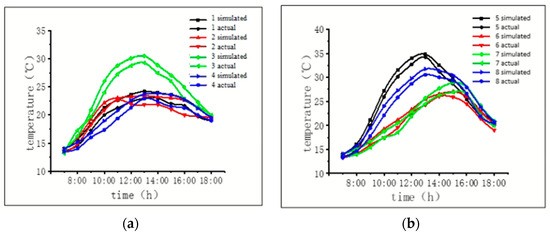
Figure 16.
Comparison of simulated temperature and measured temperature for section G2J12 (a) at measurement points 1, 2, 3, and 4, and (b) at measurement points 5, 6, 7, and 8.
Overall, the temperature simulation results of the steel box arch rib section on the winter testing day are consistent with the measured results, indicating that the selected calculation parameters are in line with reality and can be used to simulate the temperature field distribution of the steel box arch rib.
5. Three-Dimensional Transient Temperature Field Analysis of Steel Box Arch Ribs
5.1. Establishment of a Three-Dimensional Finite Element Numerical Model
According to the segment division of the No. 2 arch rib, this section calculates the middle section of each section of the No. 2 arch rib by “replacing the curve with a straight line” to calculate the solar radiant intensity of the arch rib. The calculation result of this section reflects the solar radiant intensity of the corresponding section. To verify that this approximate treatment can meet the calculation accuracy requirements, a comparison was made between each segment’s starting and ending points of the No. 2 arch rib and the middle section. The comparison results are shown in Table 4. It can be seen from the table that the maximum absolute value of the difference between the end section and the middle section of each segment is 1.3°. According to the calculation equation for the solar radiant intensity, the 1.3° error value has little impact on the final radiant intensity, indicating that this approximation is reasonable.
Table 4.
Comparison of at the starting and middle points of each segment of the arch rib.
According to the calculation method of astronomical parameters of the temperature field, the final radiant intensity of different boundaries of each steel box arch rib segment on August 15 was determined. The comparison between the measured results in the previous text and the finite element simulation has verified the correctness of selecting thermodynamic parameters. The comprehensive heat transfer coefficient values for each boundary of each segment of the arch rib are the same as in Table 1.
Based on the division of arch rib segments and the position of steel concrete joint segments, we established a three-dimensional solid model of arch rib No. 2 as shown in Figure 17. The analysis model consists of 77,240 nodes and 12,040 elements. In the three-dimensional transient thermal analysis of Workbench, the application method of temperature load and boundary conditions is as follows: solar radiation is applied to the top and bottom plates of each segment of the arch rib and the outside of the web plate through heat flux, and the comprehensive heat transfer coefficient is applied to the inner and outer boundaries of each segment of the arch rib through convection.
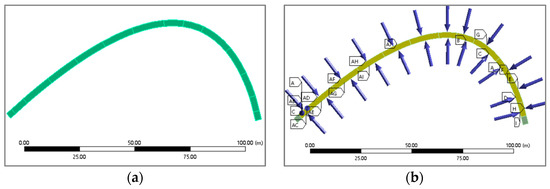
Figure 17.
Three-dimensional transient temperature field analysis model for (a) the arch rib solid model and (b) temperature loads and boundary conditions.
5.2. The Influence of Seasons and Arch Rib Orientation on the Temperature Field of Arch Ribs
5.2.1. Seasonal Impact
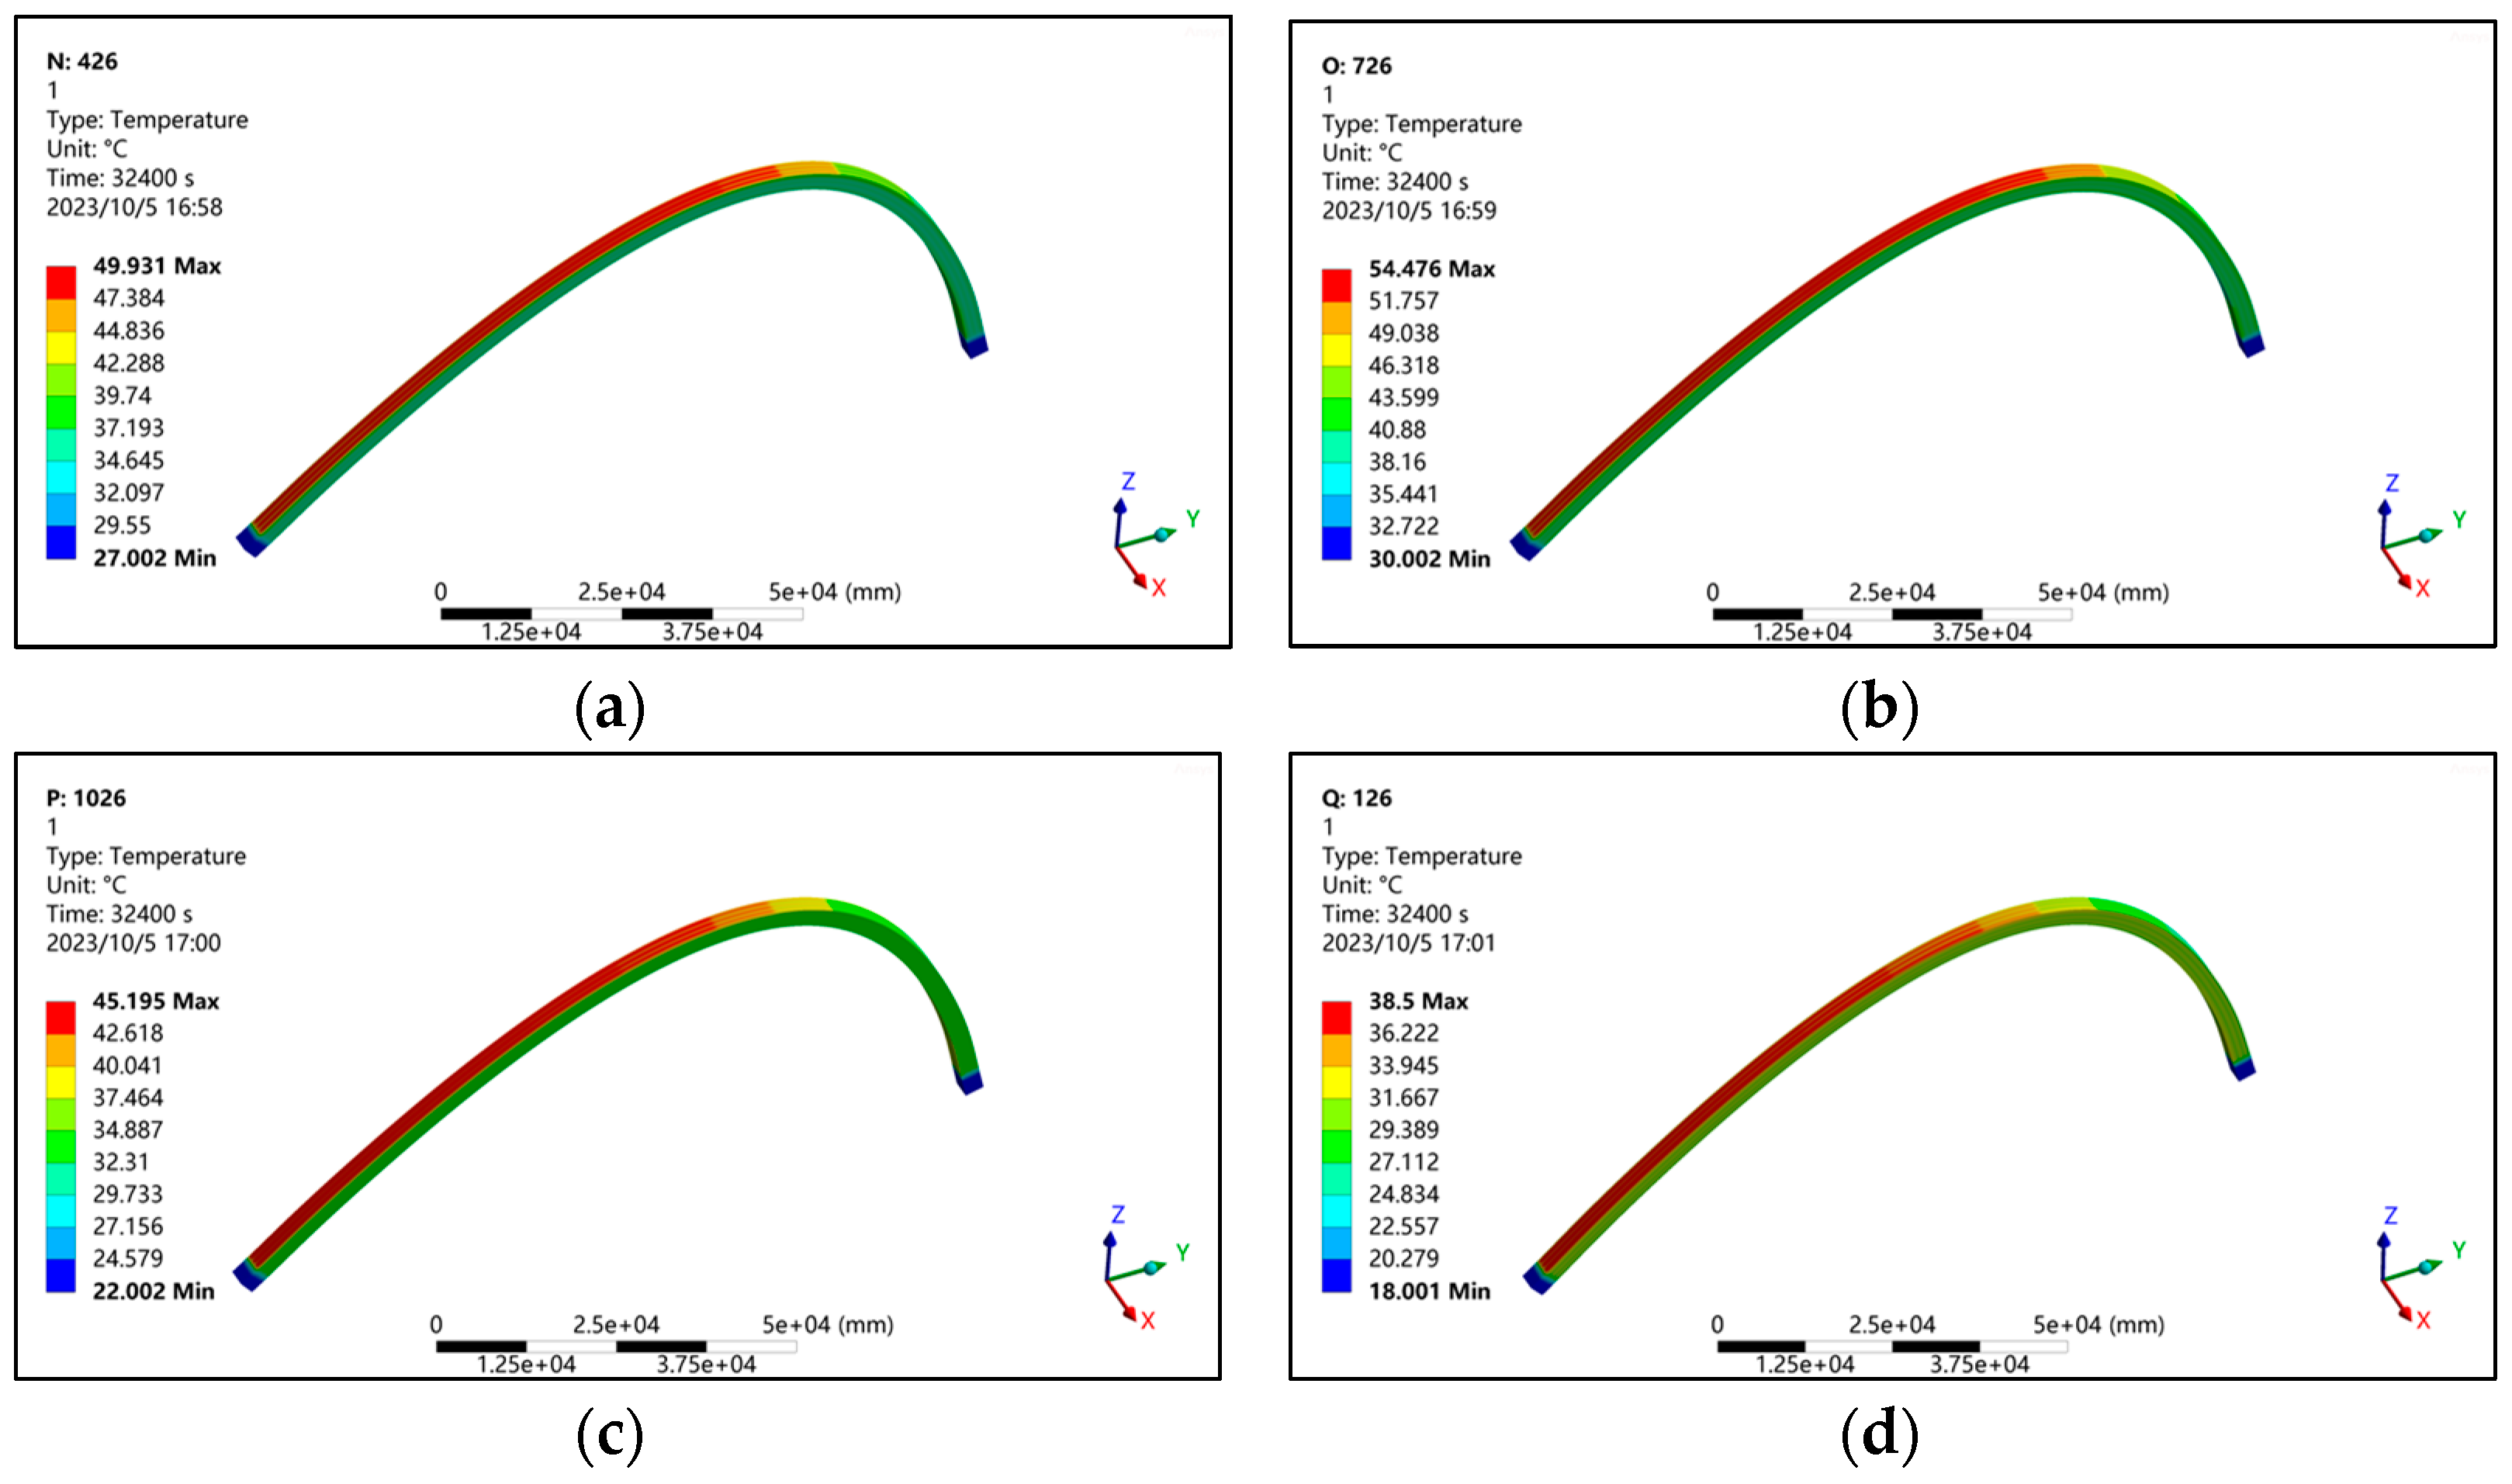
In different seasons, the movement track of the sun relative to the bridge structure, the radiation law of the sun at each boundary of the bridge structure, and the temperature distribution of the structure are different. Through 3D transient temperature field analysis models of the No. 2 arch rib, the temperature load and boundary conditions of the representative sunny day corresponding to the four seasons (spring, summer, autumn, and winter) were applied to each arch rib boundary. The temperature distribution and the temperature distribution cloud diagram at the time corresponding to the maximum temperature of the arch rib in different seasons were obtained as shown in Figure 18. The representative dates for the four seasons are 26 April 2022 (spring), 26 July 2022 (summer), 26 October 2022 (autumn), and 26 January 2022 (winter).
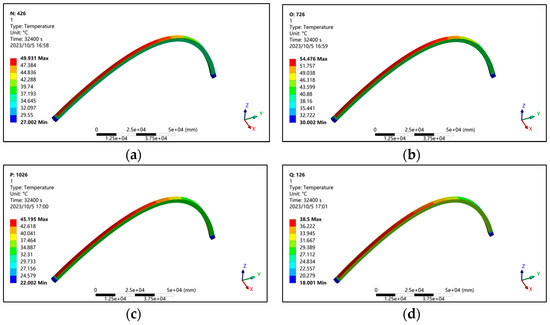
Figure 18.
Cloud chart of the corresponding time for the maximum temperature of the second arch rib in different seasons; (a) spring (26 April), (b) summer (26 July), (c) autumn (26 October), and (d) winter (26 January).
It can be seen from Figure 18 that there are apparent differences in the temperature distribution of the arch rib in different seasons:
- The peak temperature of arch ribs appears simultaneously in different seasons, all around 15:00 h, but the areas where the temperature peak appears are inconsistent. In spring and summer, the peak appears at the junctions of the section roofs of G2J5 and G2J6, respectively, whereas it appears at the intersection of the section roofs of G2J3 and G2J4 roof in autumn, and at the junction of the section roofs of G2J1 and G2J2 in winter.
- The maximum temperature of the arch ribs under the influence of sunlight radiation varies in different seasons. The maximum temperature of the arch rib is 49.9 °C, 54.5 °C, 45.2 °C and 38.5 °C in spring, summer, autumn, and winter, respectively.
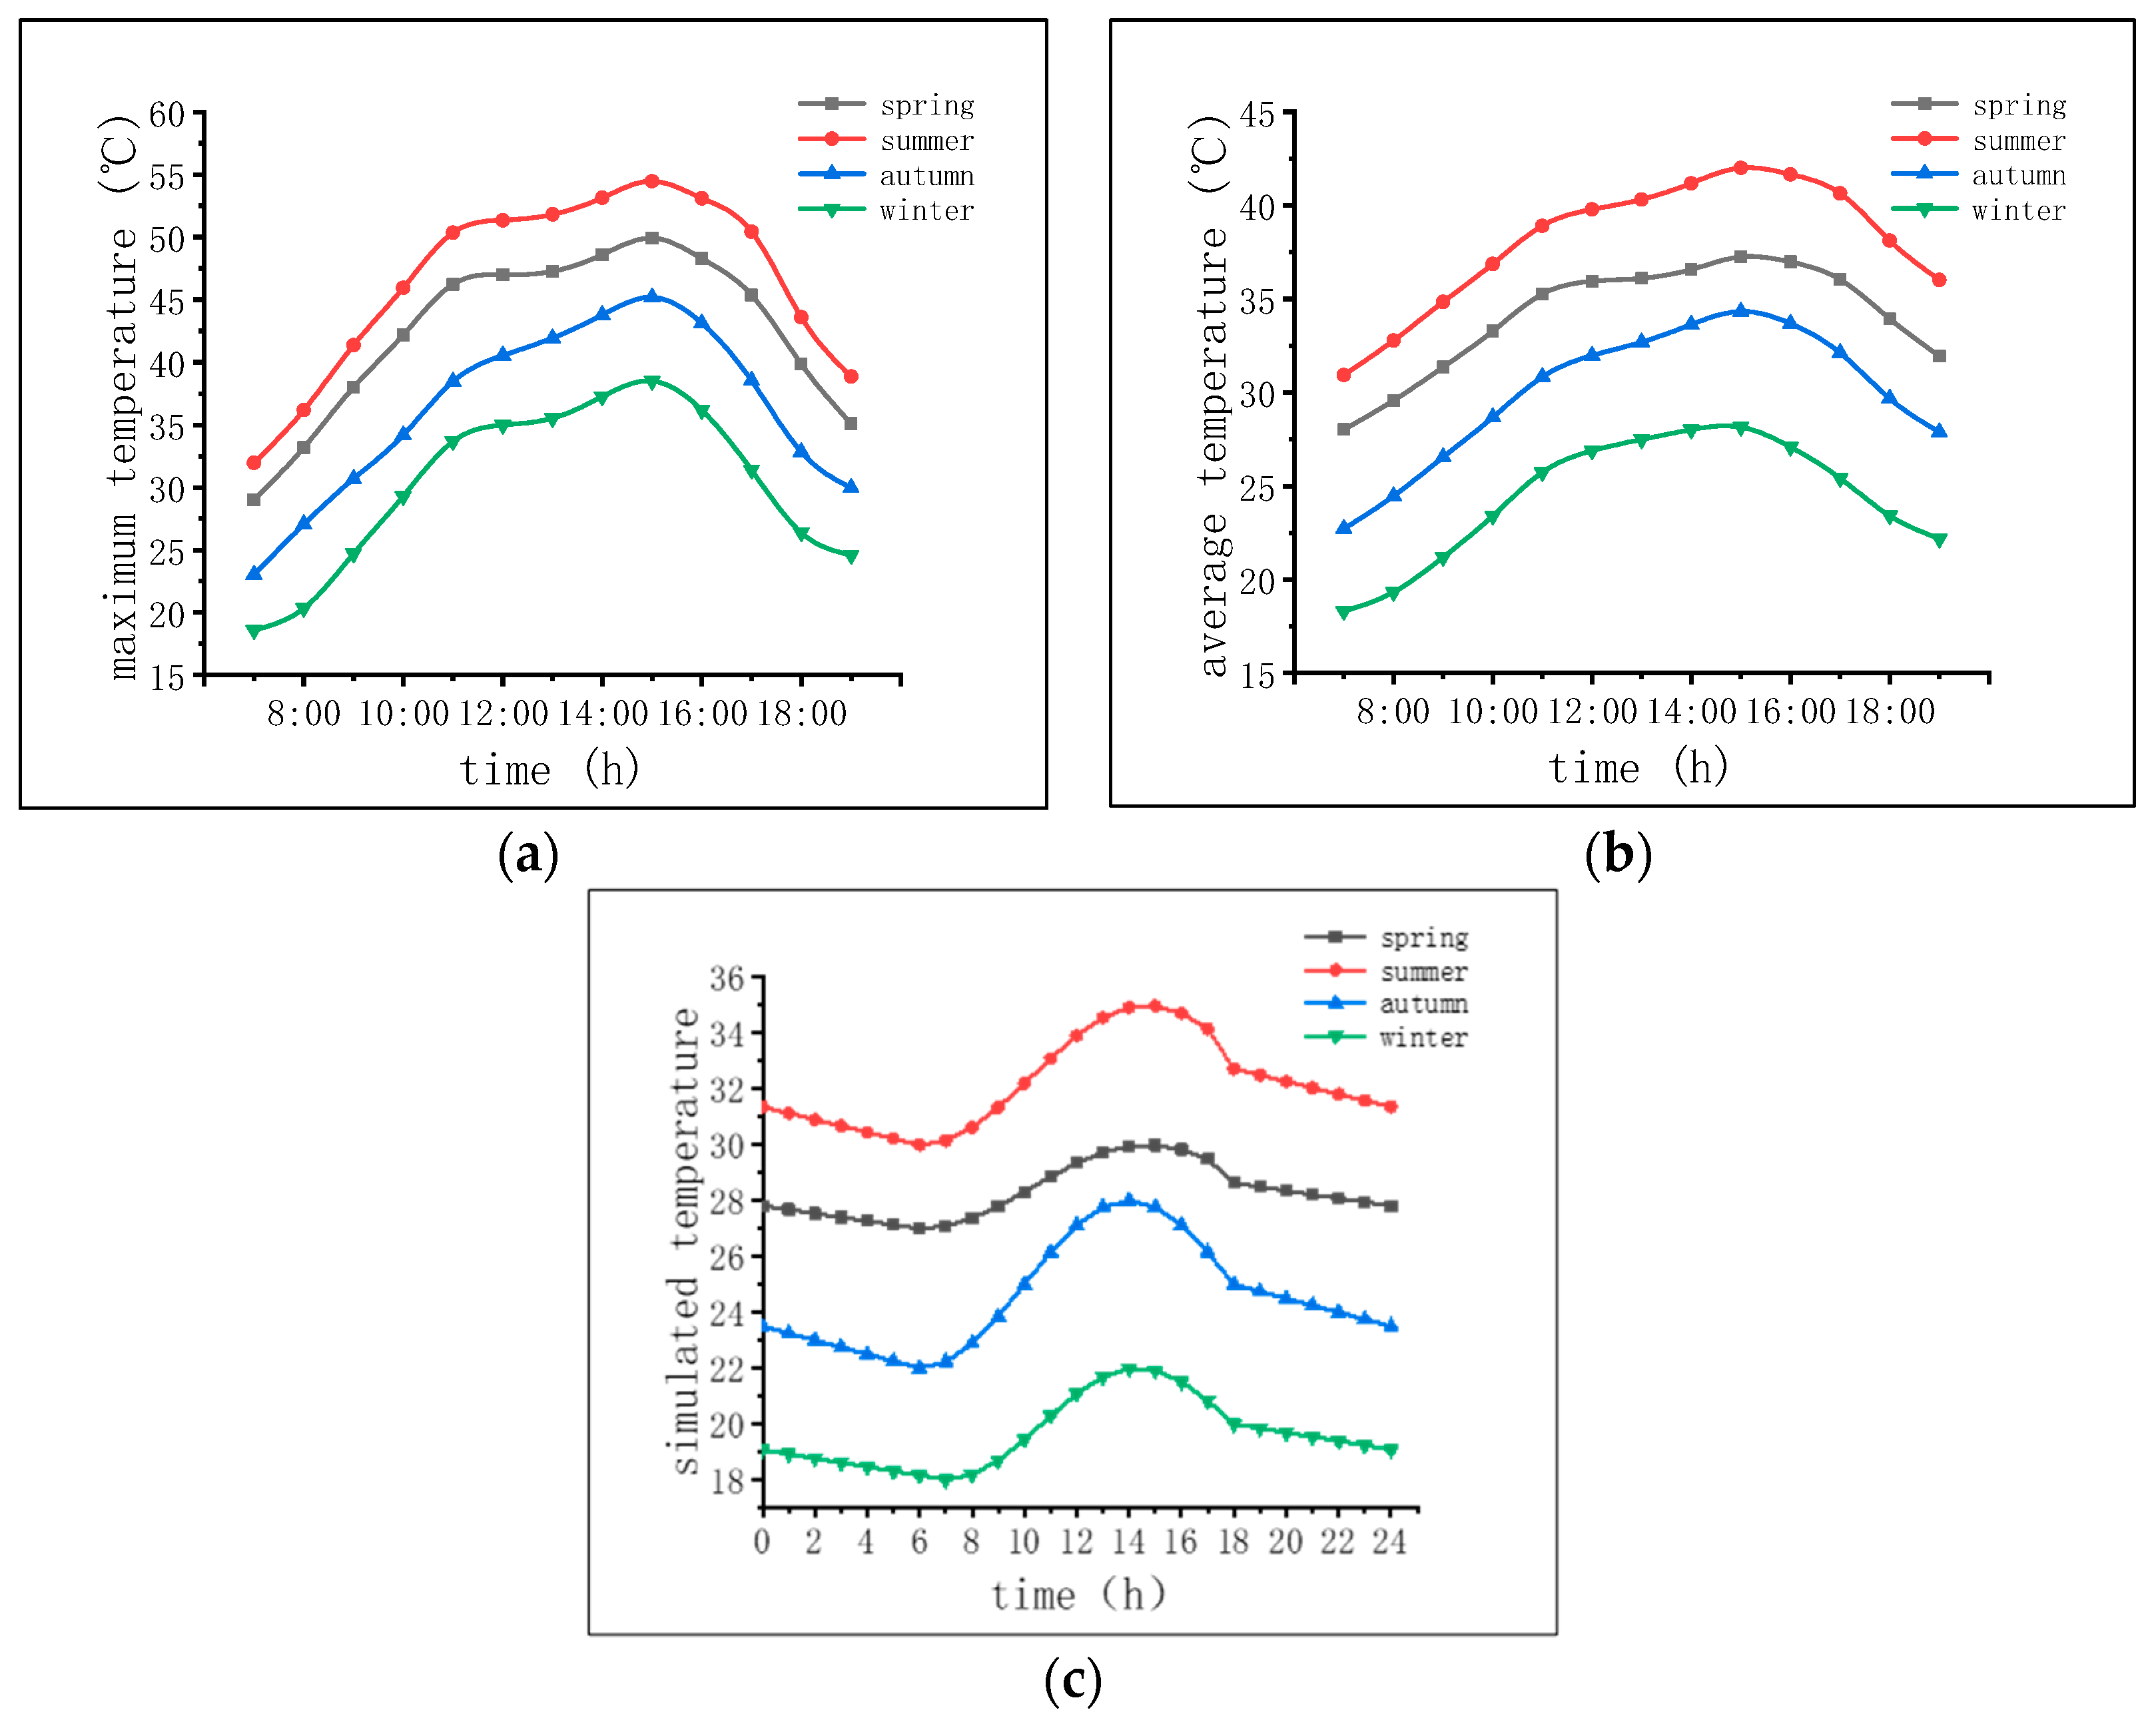
To visualize the temperature changes in the arch ribs at different seasons and times, the maximum and average temperature curves of arch ribs two were plotted over time, as shown in Figure 19.
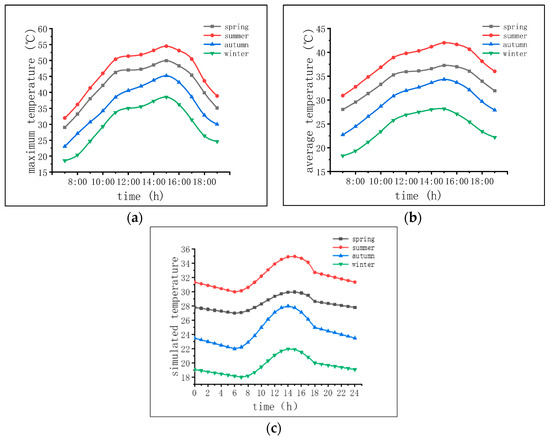
Figure 19.
Time varying curves of the maximum and average temperature values of arch rib No. 2 in different seasons: (a) maximum temperature time history variation of arch ribs, (b) average temperature time history variation of average arch ribs, and (c) change in environmental temperature time history.
Figure 19 shows that the trend in the maximum and average temperature values of the second arch rib over time is consistent in different seasons. The total and average temperatures of the arch ribs at other times reach their maximum temperatures around 15:00 h. The heating rate of the arch rib is faster from 6:00 to 11:00 h. It slows down from 11:00 to 15:00 h and reaches its maximum temperature around 15:00 h, after which it begins to cool down at a faster rate. This is consistent with the trend in the environmental temperature changes representing dates in different seasons, indicating that ecological temperature changes in different seasons significantly impact the temperature changes of arch ribs.
5.2.2. The Influence of Arch Rib Orientation
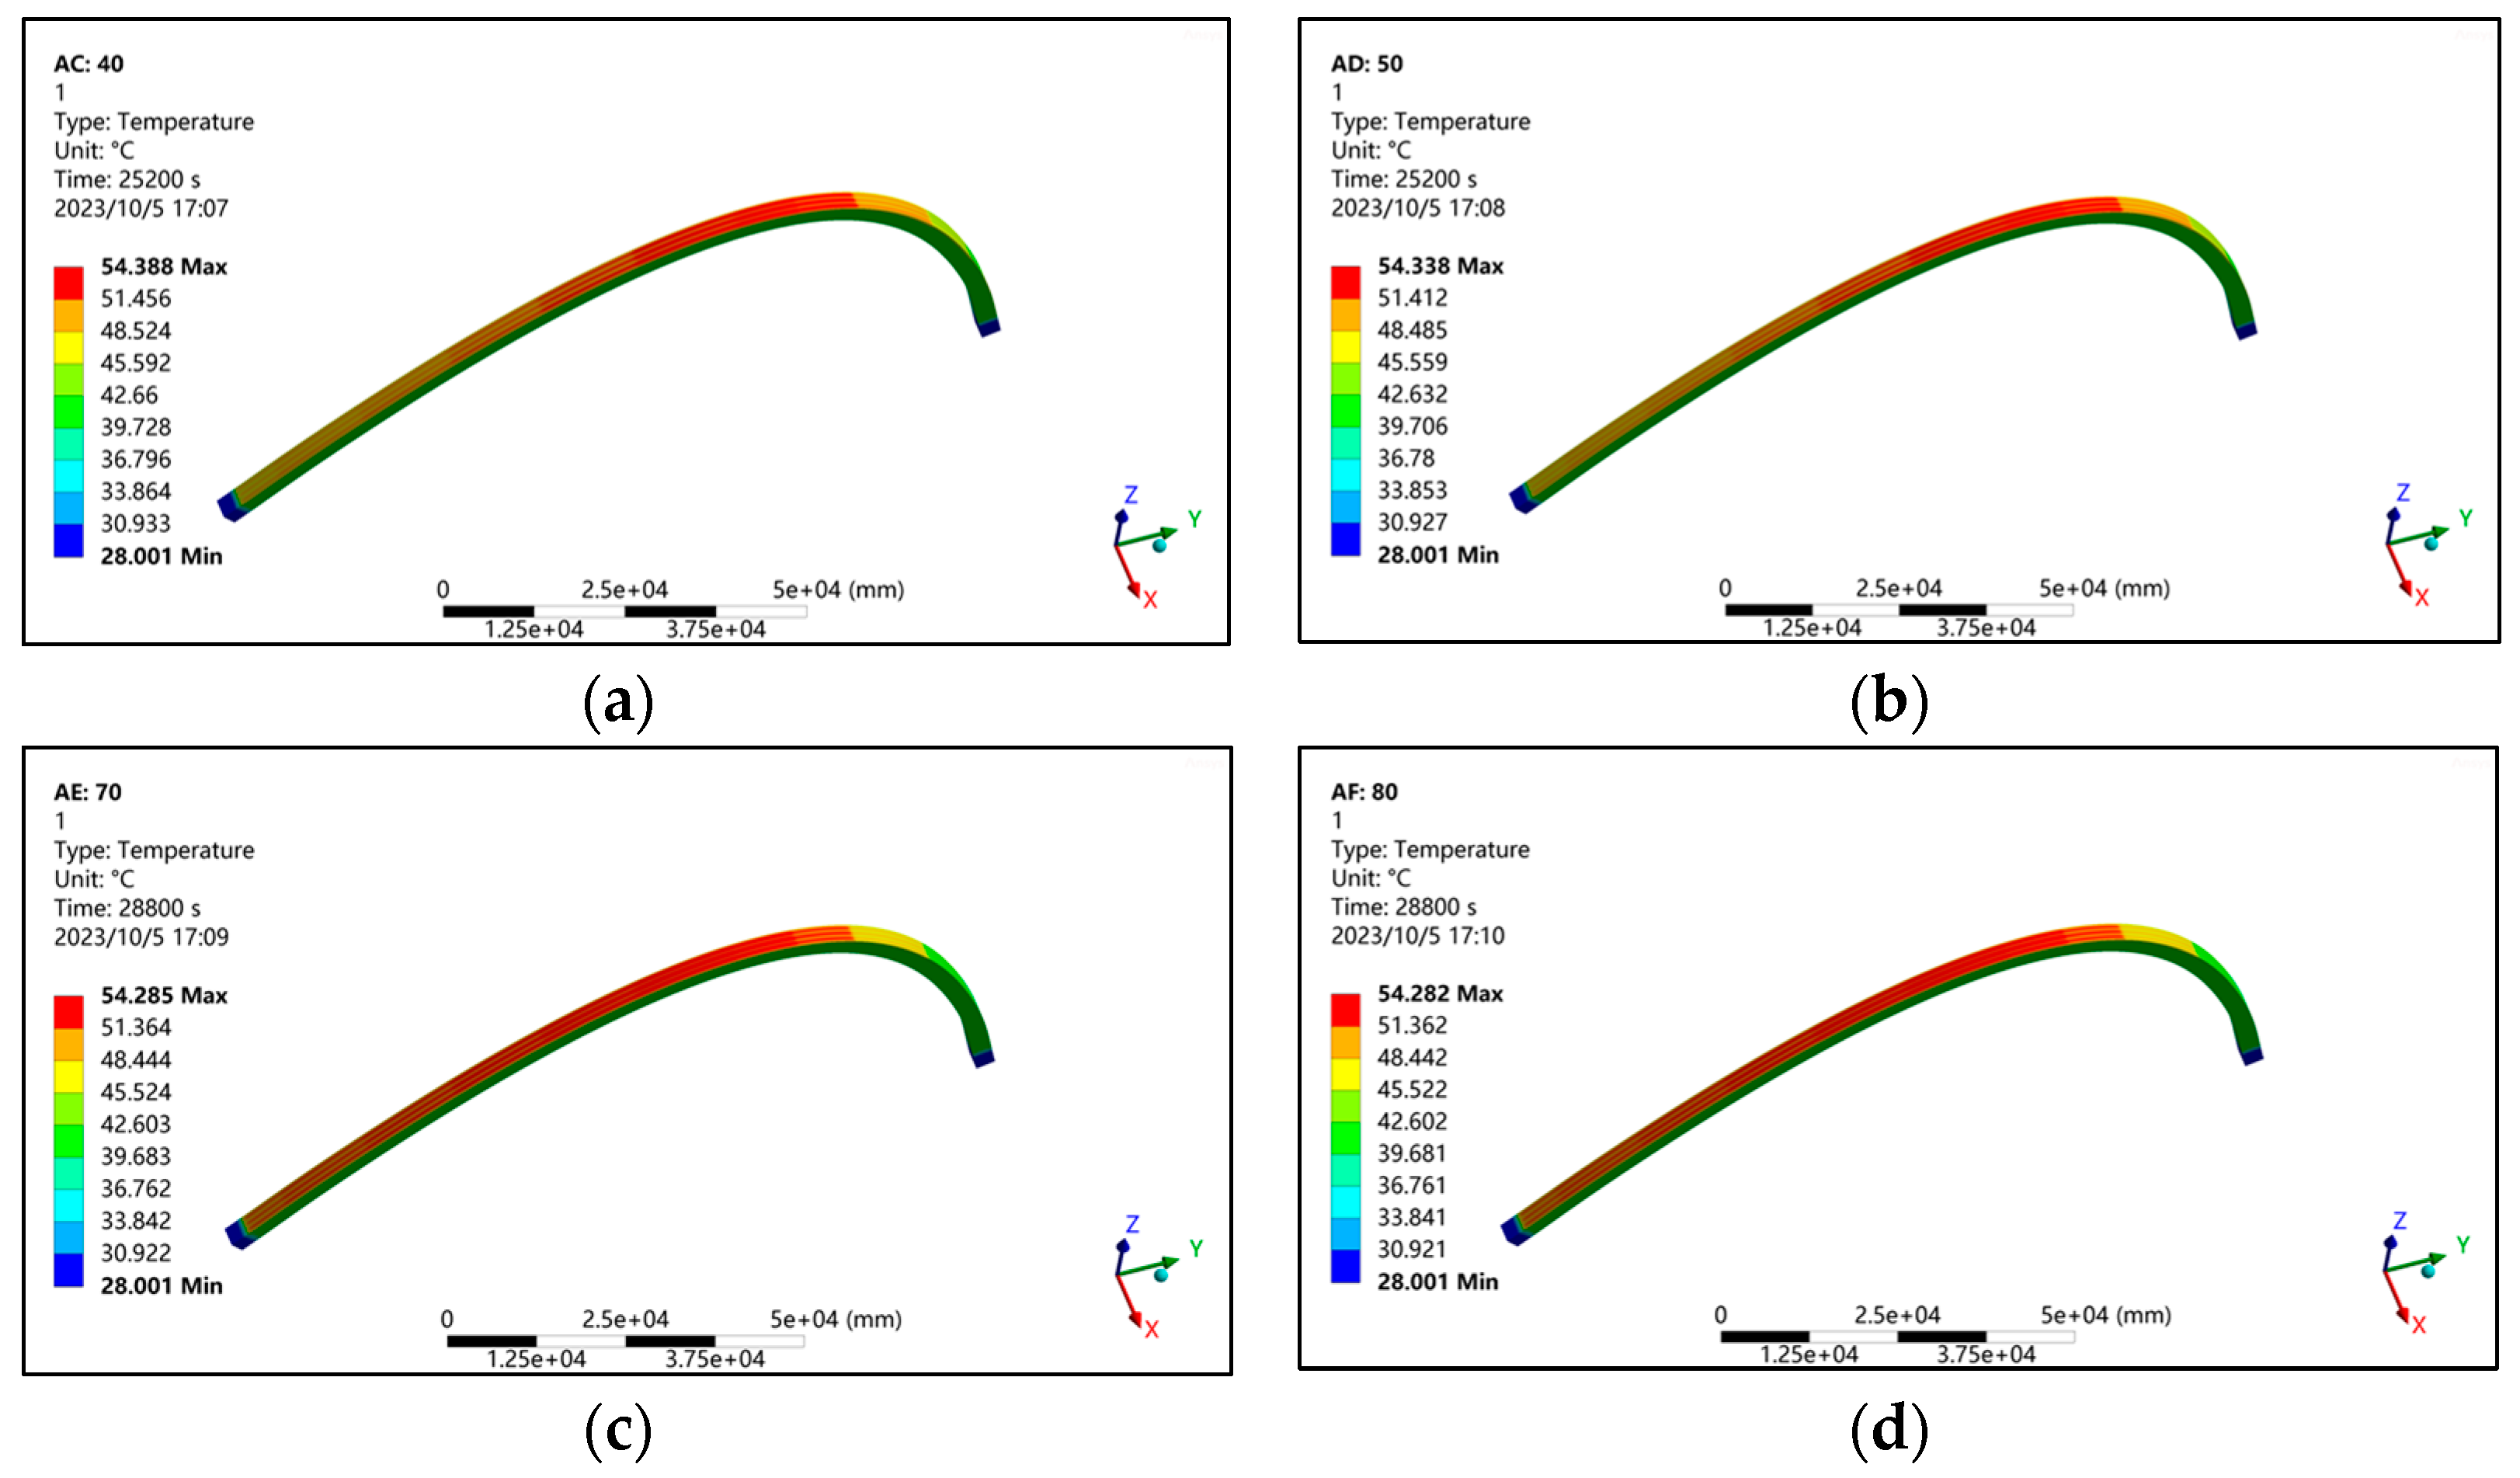
The change in the direction of the arch rib will change the final radiant intensity of the sun received by each boundary of the arch rib. In order to study the influence of arch rib orientation on its sunshine temperature field, this section is based on the original orientation of arch rib No. 2 (with an angle of 60° between the arch rib and due south). It uses the three-dimensional transient temperature field analysis model of arch rib No. 2 to analyze the distribution of the sunshine temperature field of arch rib No. 2 under five working conditions: the normal direction of the arch rib axis (40°) and four angles due south (50°, 60°, 70°, and 80°). The temperature distribution nephogram at the time corresponding to the maximum temperature of different arch rib orientations is shown in Figure 20.
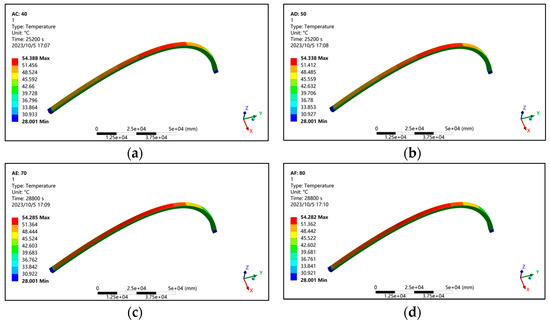
Figure 20.
Cloud chart of the corresponding time for the maximum temperature of the second arch rib in different seasons at different angles between the second arch rib and due south: (a) 40°, (b) 50°, (c) 70°, and (d) 80°.
To study the influence of the change in the arch rib azimuth on the temperature distribution of the arch rib web, this section extracts the average temperature difference of the web on both sides of the arch rib at different times under different working conditions (the average temperature of the web on the south side of the arch rib is higher than the average temperature of the web on the north side, which is positive, and vice versa). The comparison results are shown in Figure 21.
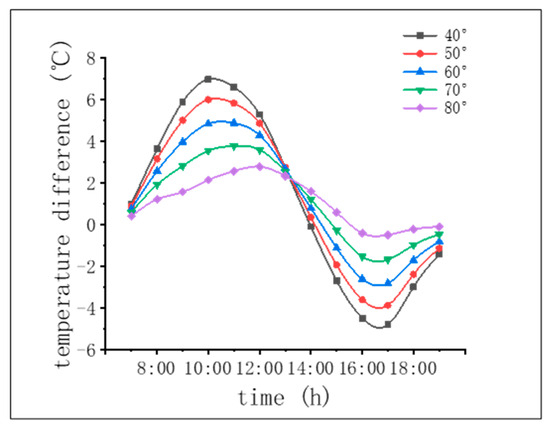
Figure 21.
Time history variation in average temperature difference between the web plates on both sides of the No. 2 arch rib under different working conditions.
Figure 20 and Figure 21 show that when the angle between the normal direction of the arch axis of the second arch rib and the due south direction is 40°, the temperature difference between the web plate is most significant, reaching a maximum of 6.9 °C. When the angle is 80°, the temperature difference between the belly plates is not substantial, with a maximum of only 2.7 °C. The smaller the angle between the normal direction of the arch rib axis and the south, the more influential the temperature difference between the web plates on both sides of the arch rib. Among the three arch ribs of this irregular arch bridge, the third arch rib has the smallest angle between the normal direction of the arch axis and the south. Therefore, it is necessary to strengthen the monitoring of the sunshine temperature field of the third arch rib.
Overall, the smaller the angle between the normal direction of the arch axis of the arch rib and the south, the more significant the temperature difference between the web plates on both sides of the arch rib. Among the three arch ribs of this irregular arch bridge, the third arch rib has the smallest angle between the average direction of the arch axis and the south. Therefore, it is necessary to strengthen monitoring of the sunshine temperature field of the third arch rib.
5.3. Calculation Method for Temperature Stress and Deformation of Steel Box Arch Ribs
According to the simulation results of the sunlight temperature field of the steel box arch rib, the temperature stress of each part of the steel box arch rib can be calculated. This section adopts the sequential coupling method and utilizes Workbench’s built-in thermal structural coupling analysis module to drag transient structural analysis into transient thermal analysis. The thermal analysis is transformed into a structural analysis, and the temperature fields at different times in the transient thermal analysis are introduced as loads into the brief structural analysis. Consolidation constraints are applied to the steel concrete joint section of the steel box arch rib arch foot, thereby calculating the stress and deformation of the steel box arch rib under the temperature effect of sunlight. We used the solar temperature field of steel box arch ribs on 15 August (summer) and 26 December (winter) for calculation and analysis.
5.4. Temperature Response of Steel Box Arch Ribs in Summer
The stress distribution and deformation cloud map of the steel box arch rib under the temperature field at the most unfavorable time in summer is shown in Figure 22, Figure 23 and Figure 24:
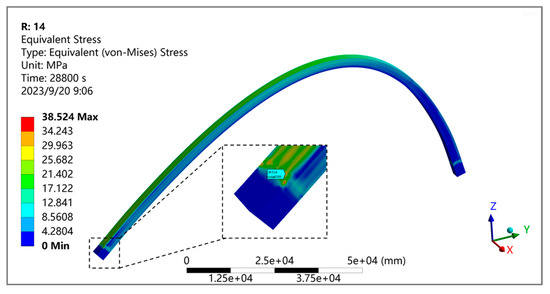
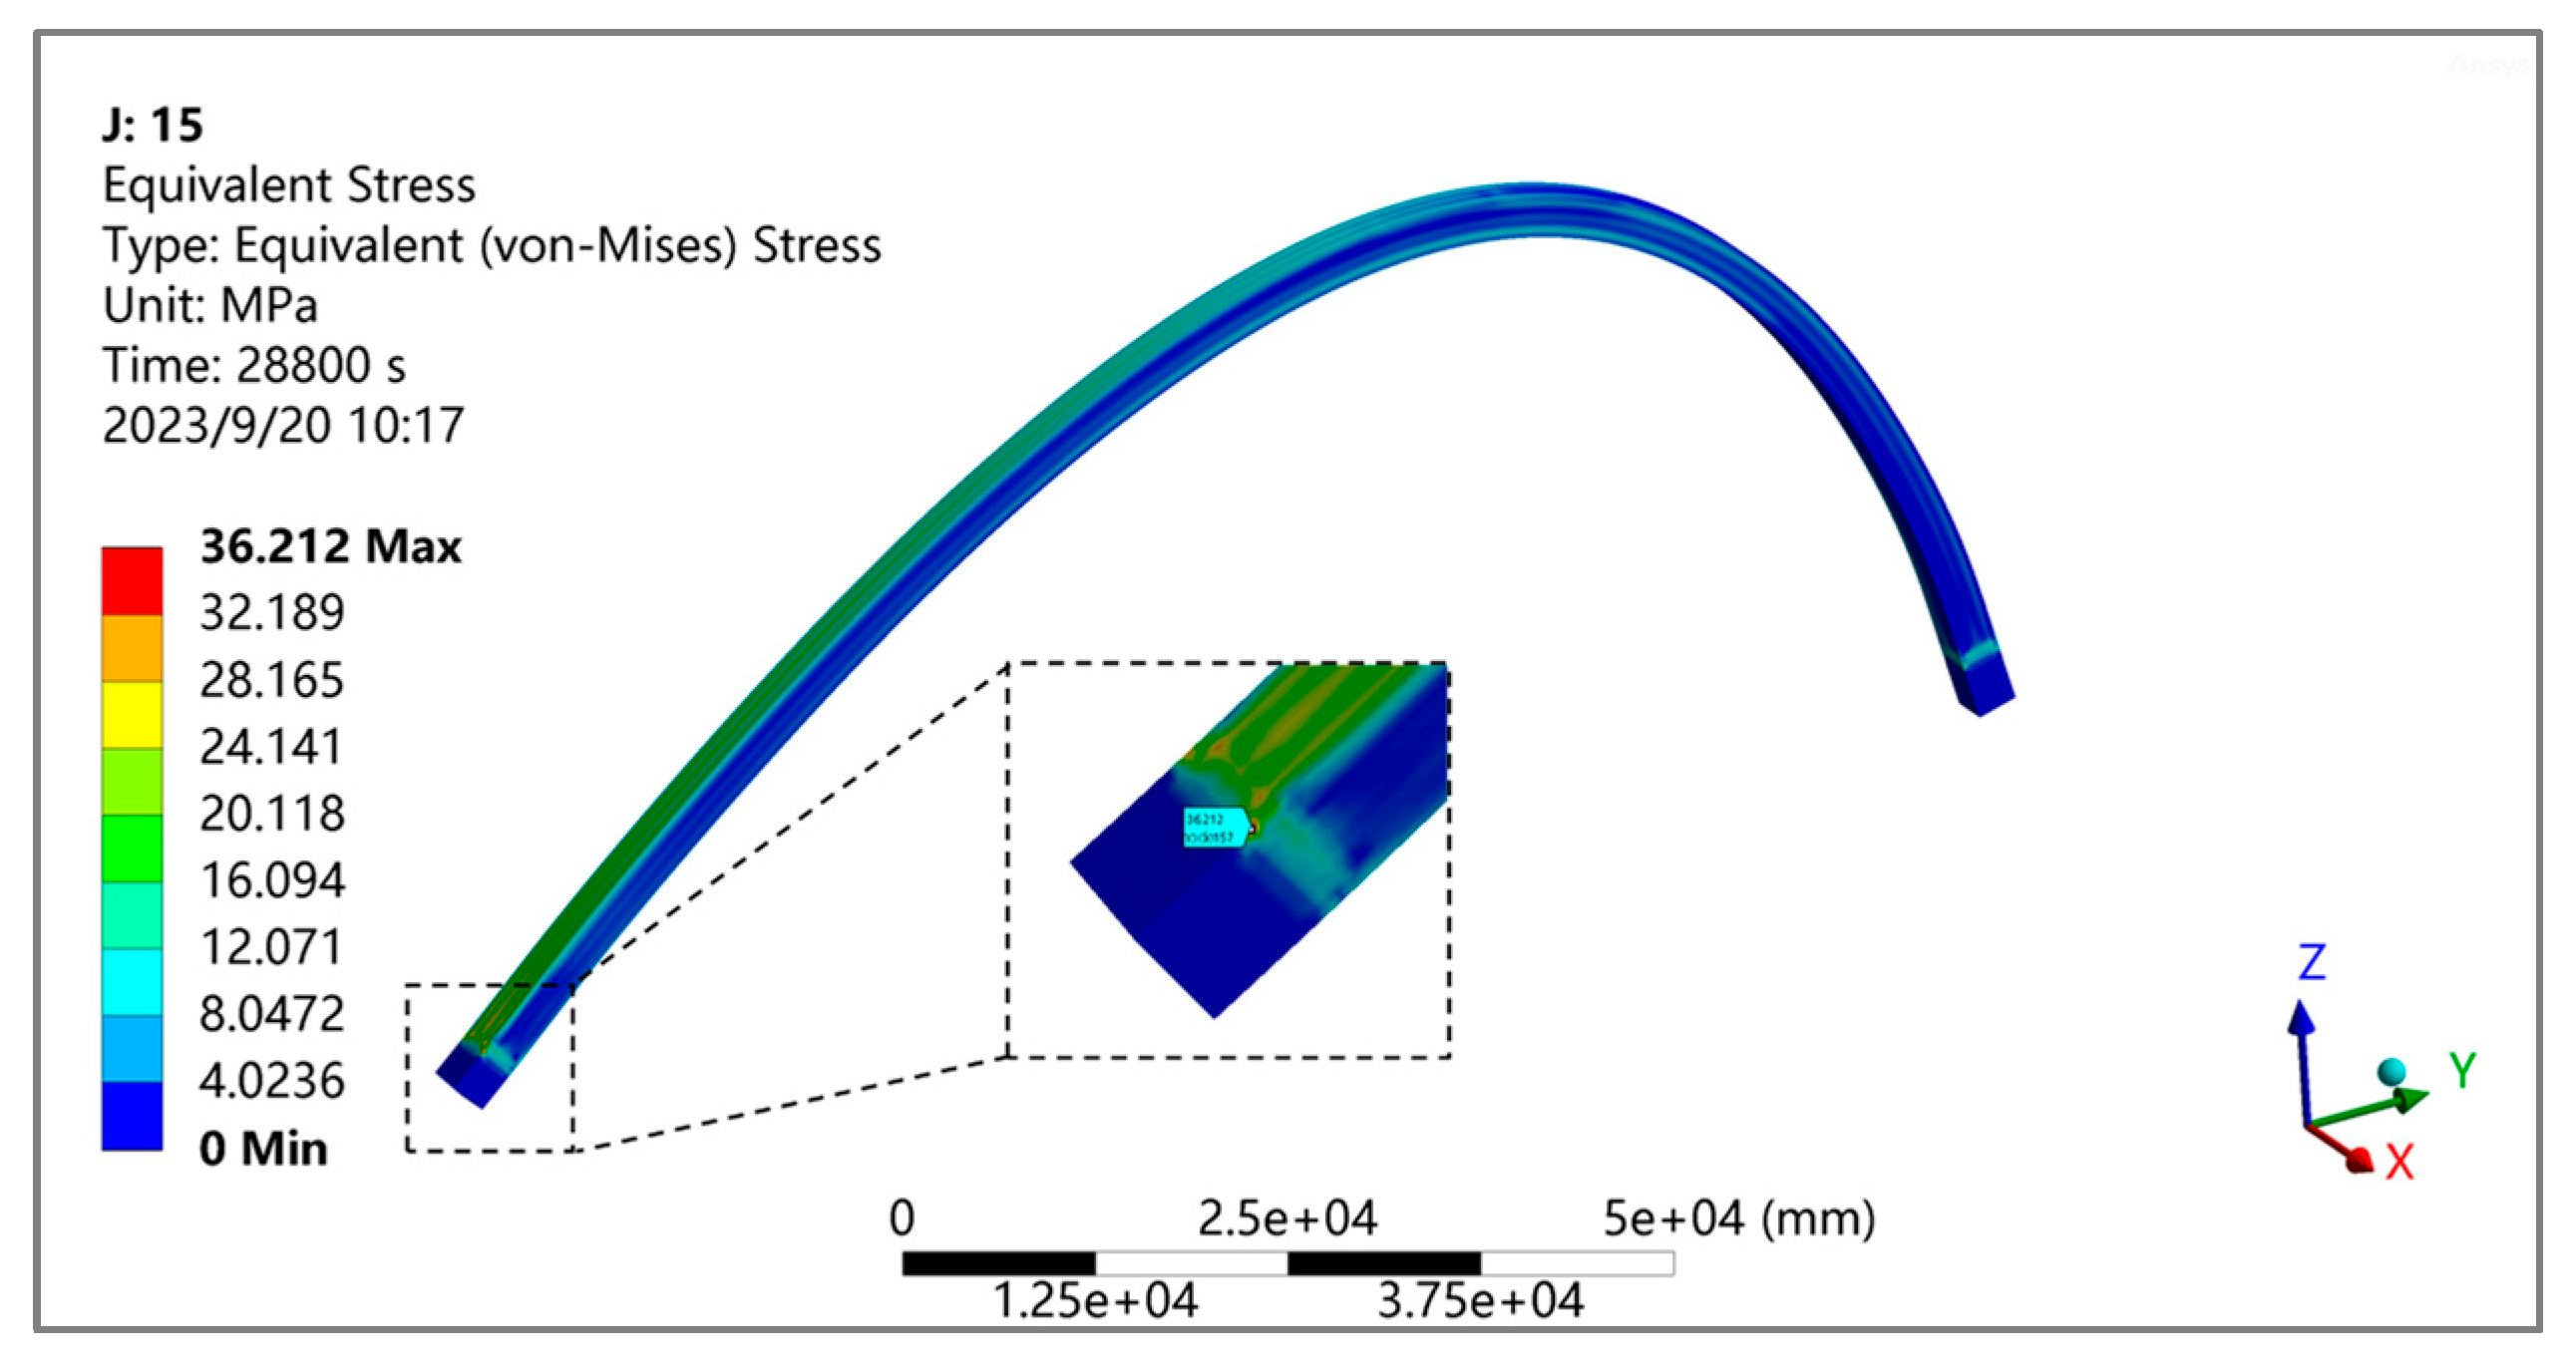
Figure 22.
Temperature equivalent stress distribution of steel box arch ribs in summer.

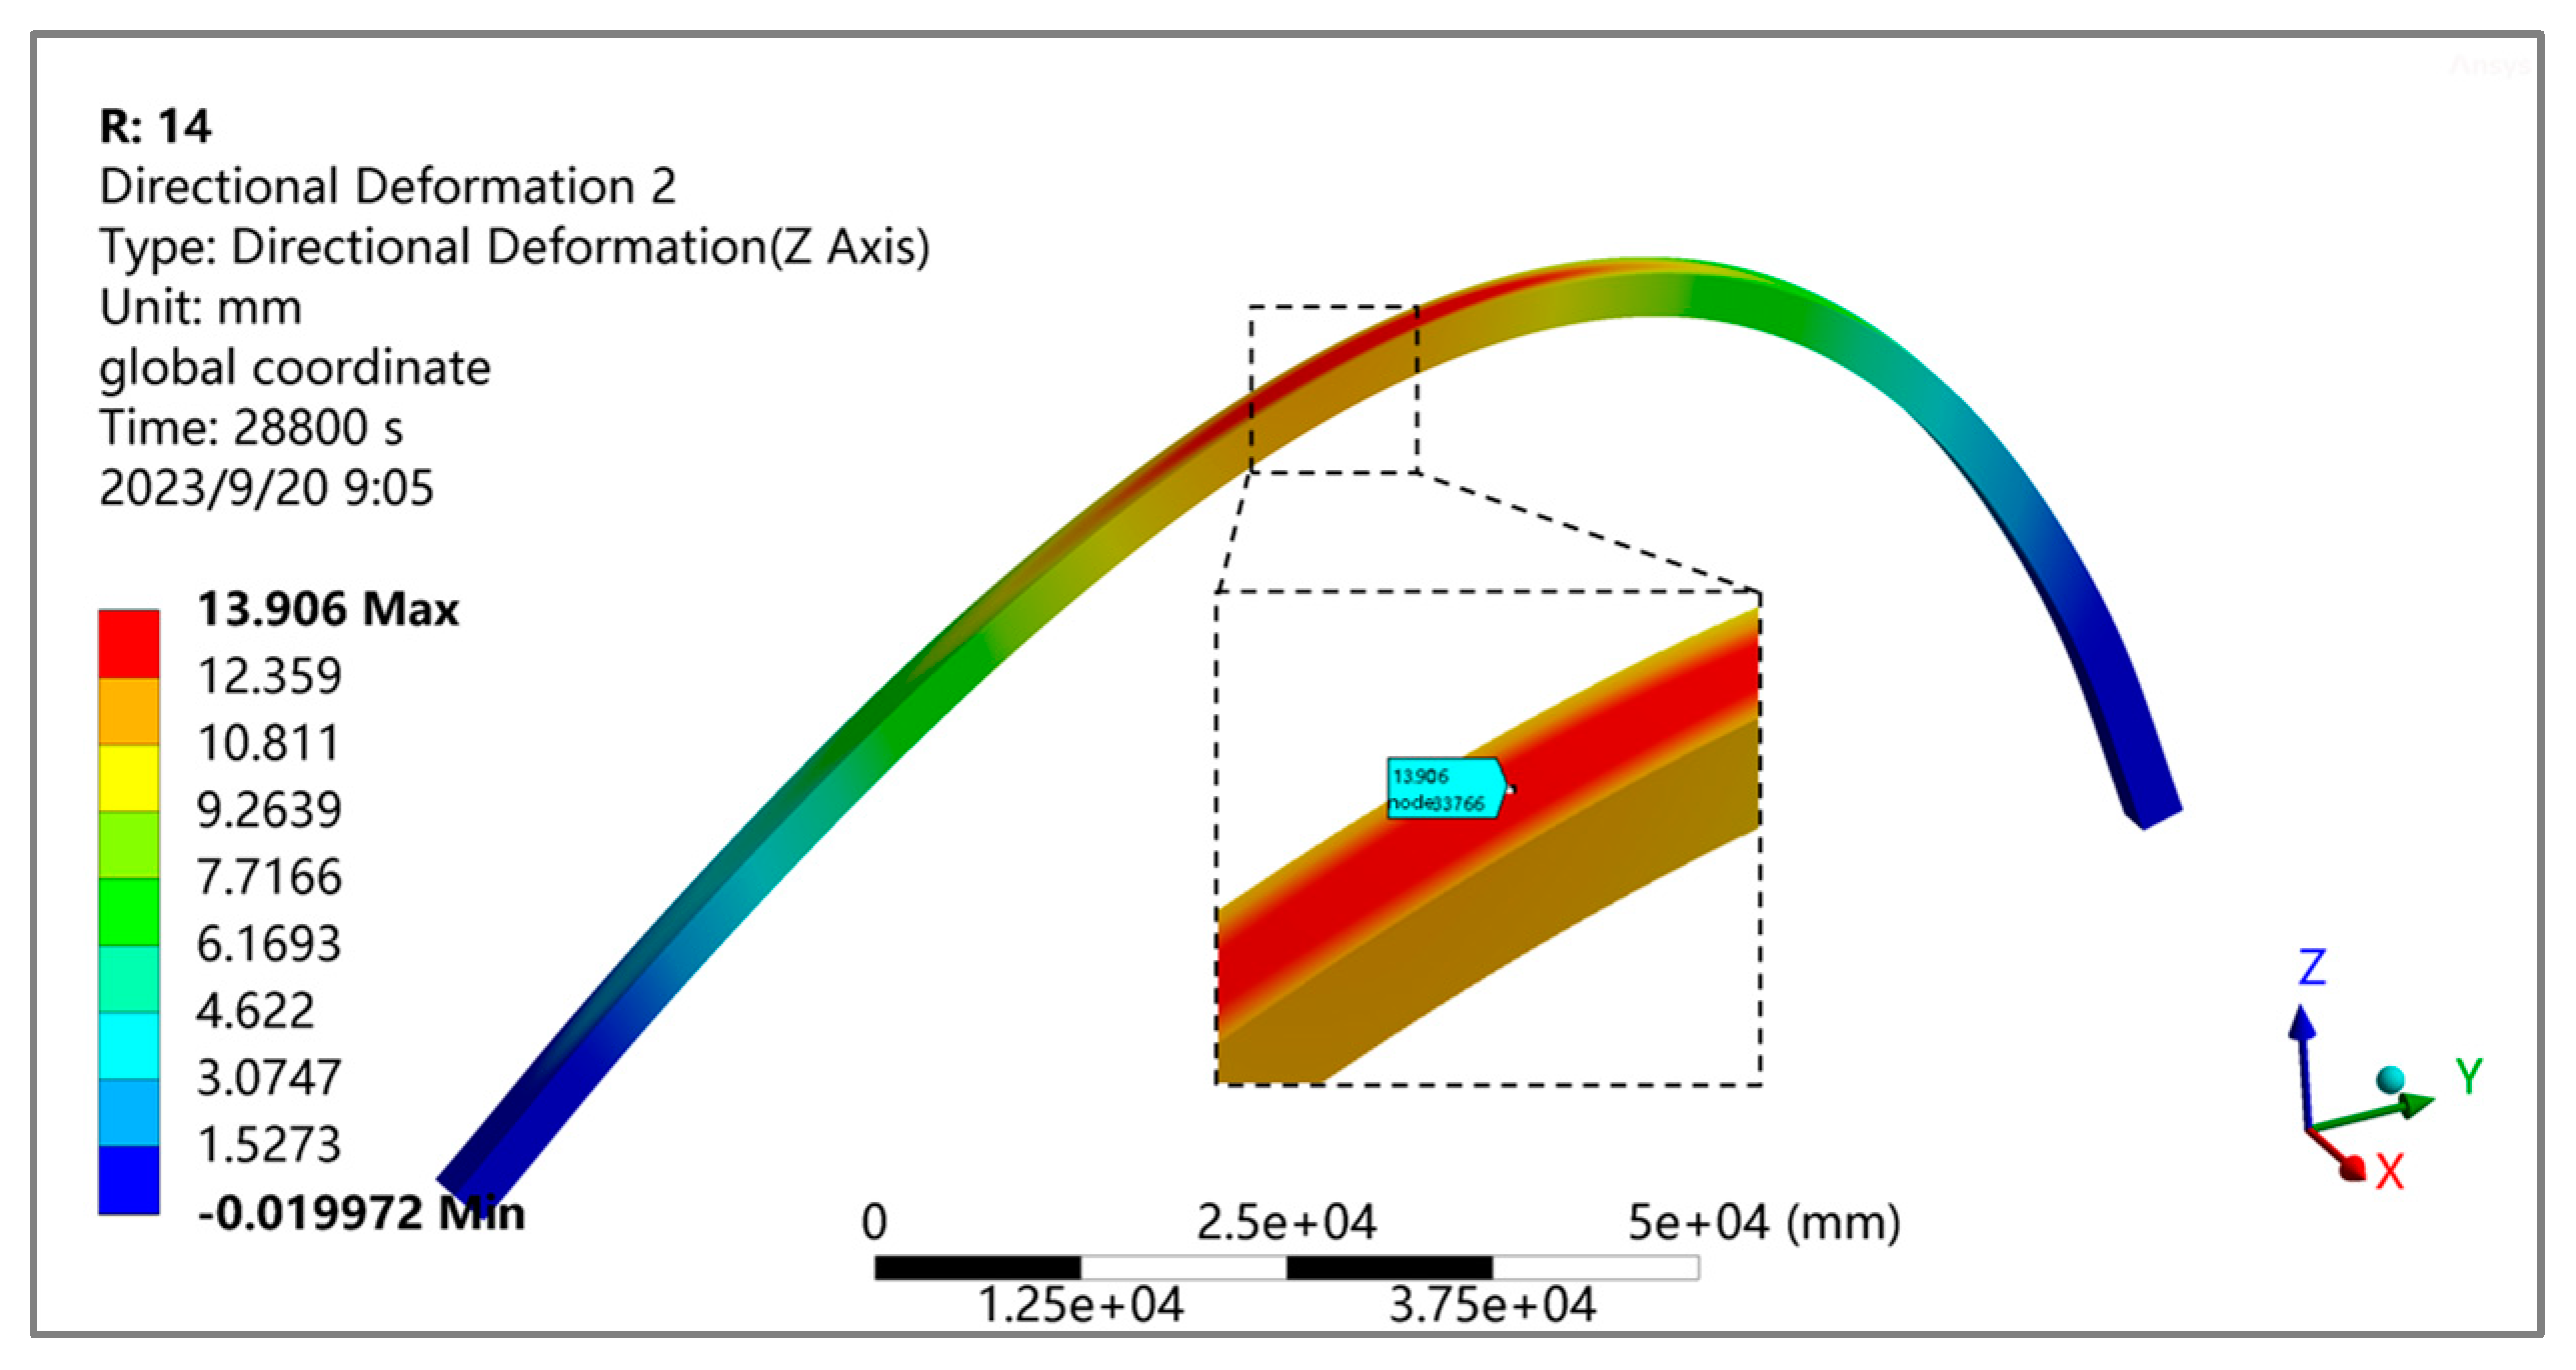
Figure 23.
Vertical deformation of steel box arch ribs in summer.
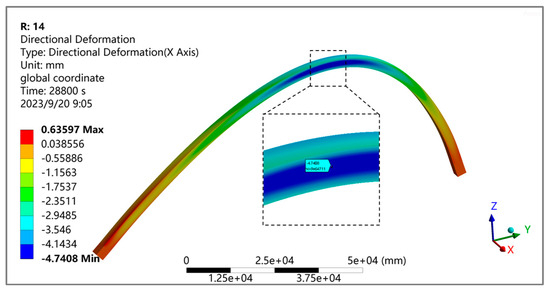
Figure 24.
Transverse deformation of steel box arch ribs in summer.
From Figure 22, Figure 23 and Figure 24, it can be noted that under the influence of the temperature field at the most unfavorable time in summer, the temperature stress in section G2J1 of the steel box arch rib near the arch foot is relatively high, resulting in stress concentration. The maximum equivalent stress of the steel box arch rib is 38.5 MPa, and the maximum vertical displacement of the steel box arch rib is 13.9 mm, which occurs near the top plate of the middle part of section G2J6. The maximum lateral displacement is −4.7 mm, near the web plate of the middle part (arch) of segment G2J7.
5.5. Temperature Response of Steel Box Arch Ribs in Winter
The stress distribution and deformation cloud map of the steel box arch rib under the temperature field at the most unfavorable time in winter are shown in Figure 25, Figure 26 and Figure 27:

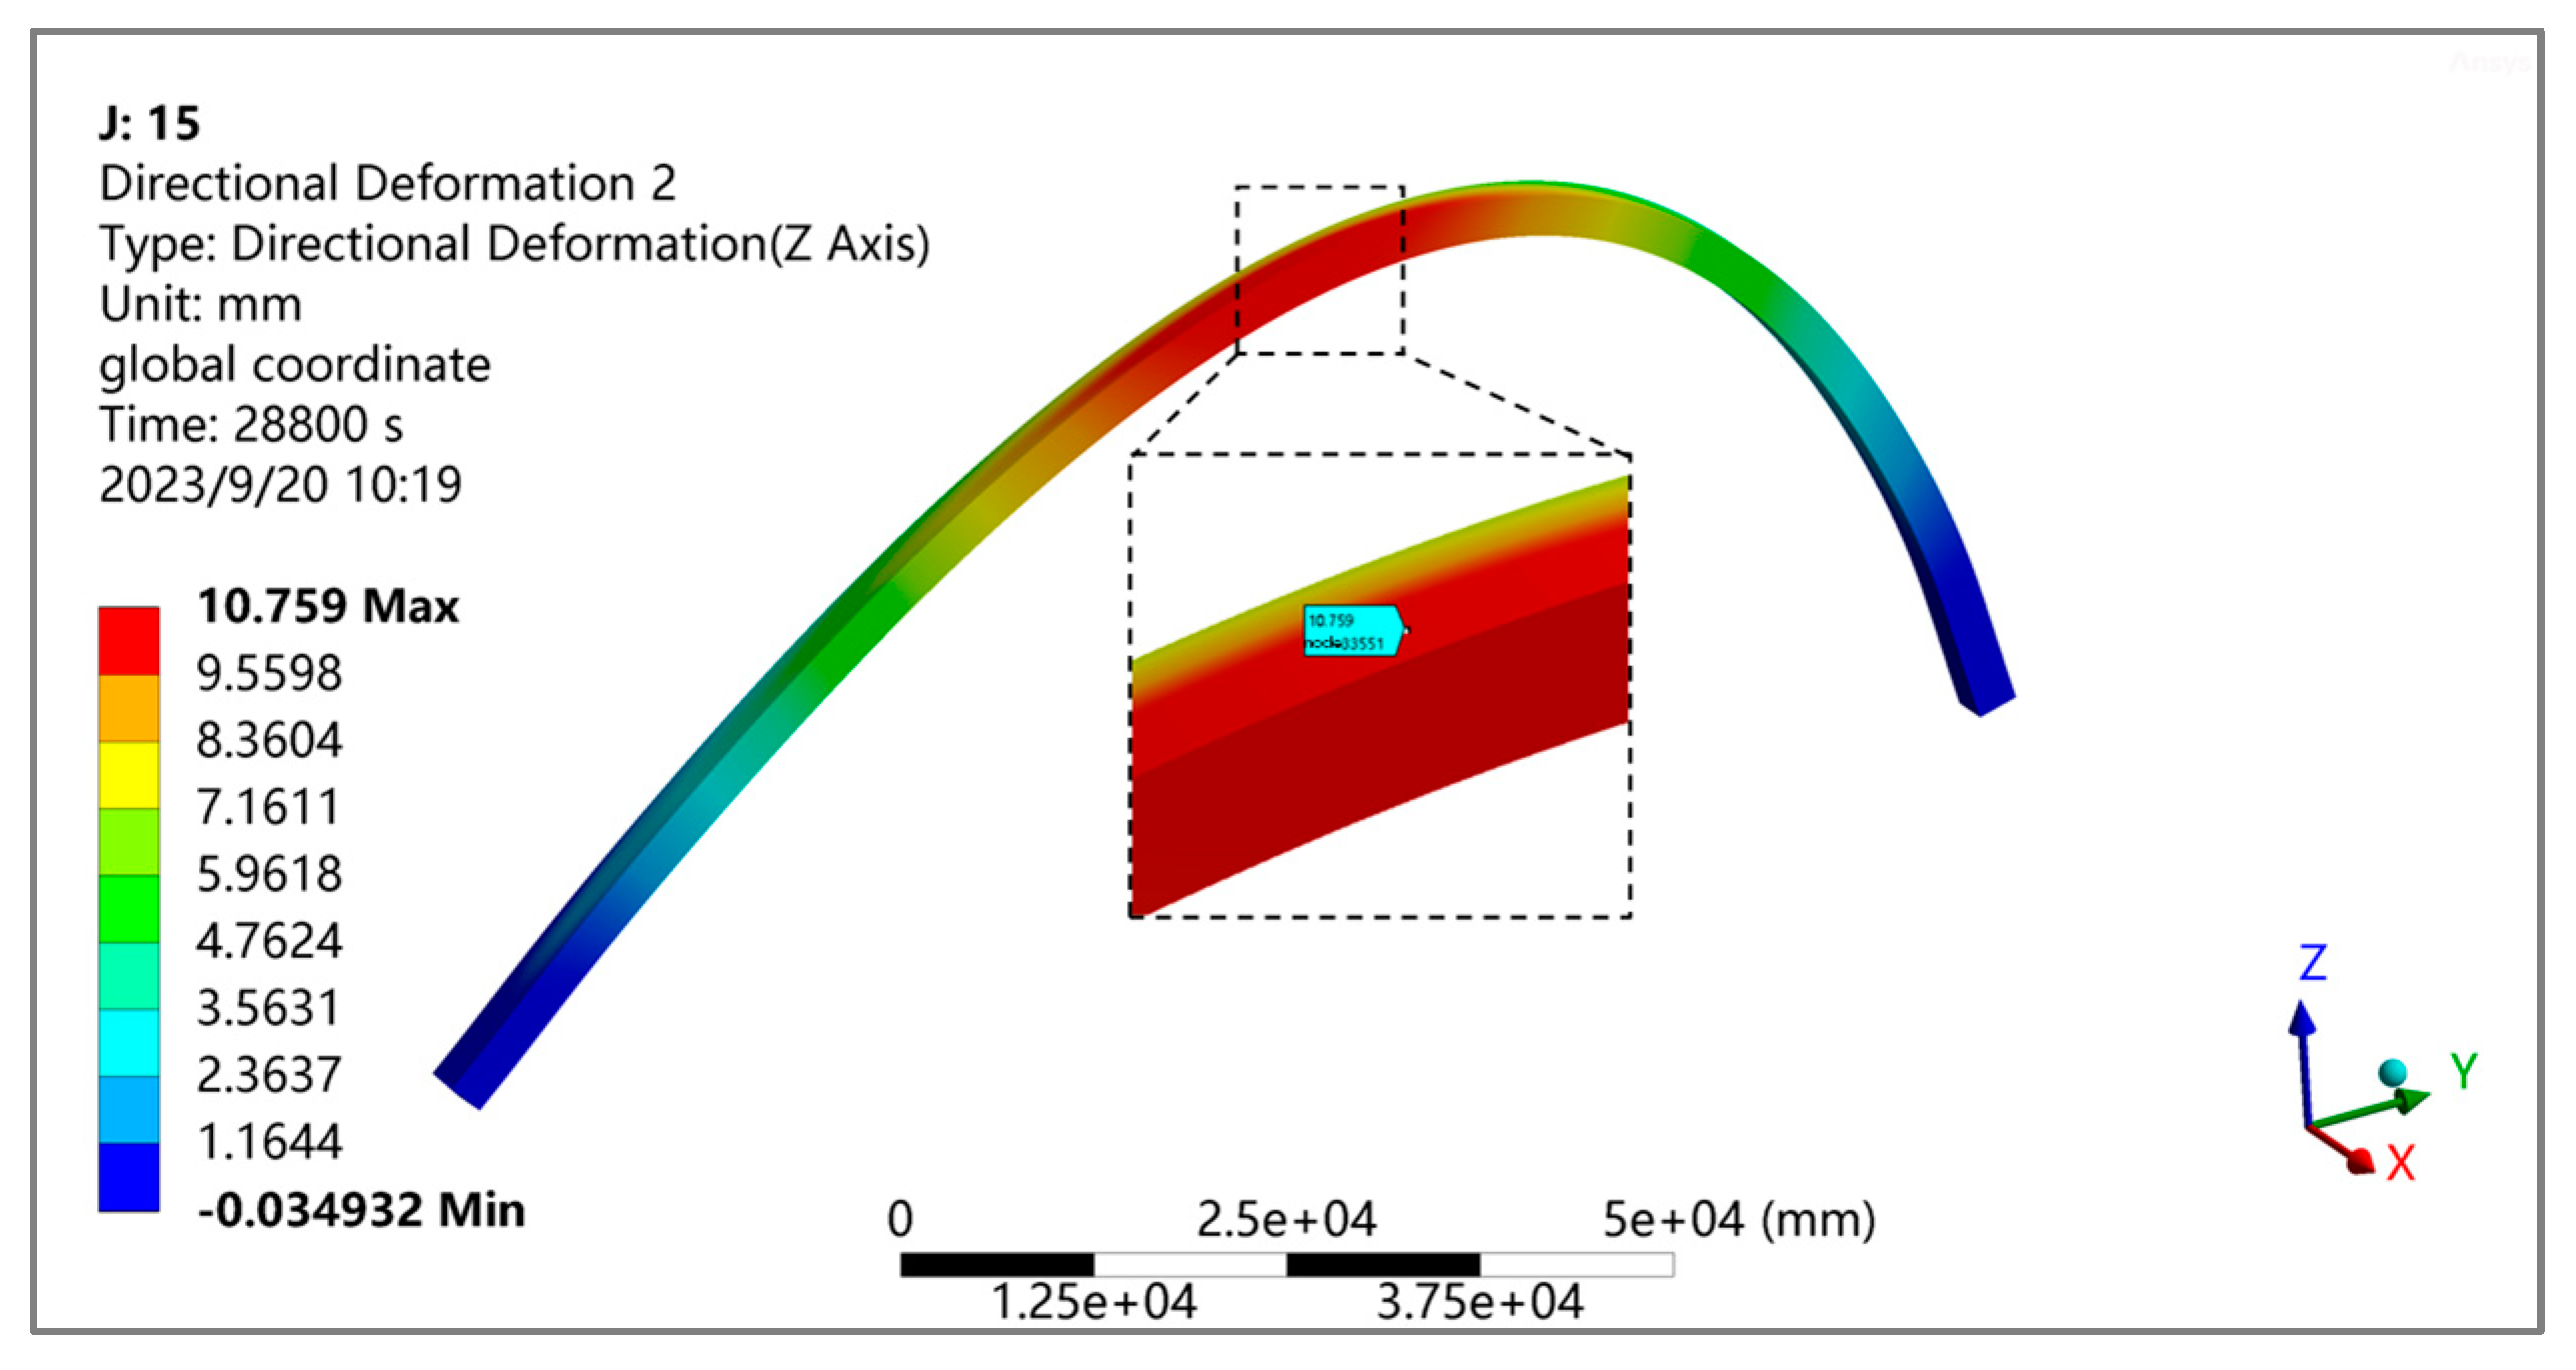
Figure 25.
Temperature equivalent stress distribution of steel box arch ribs in winter.

Figure 26.
Vertical deformation of steel box arch ribs in winter.

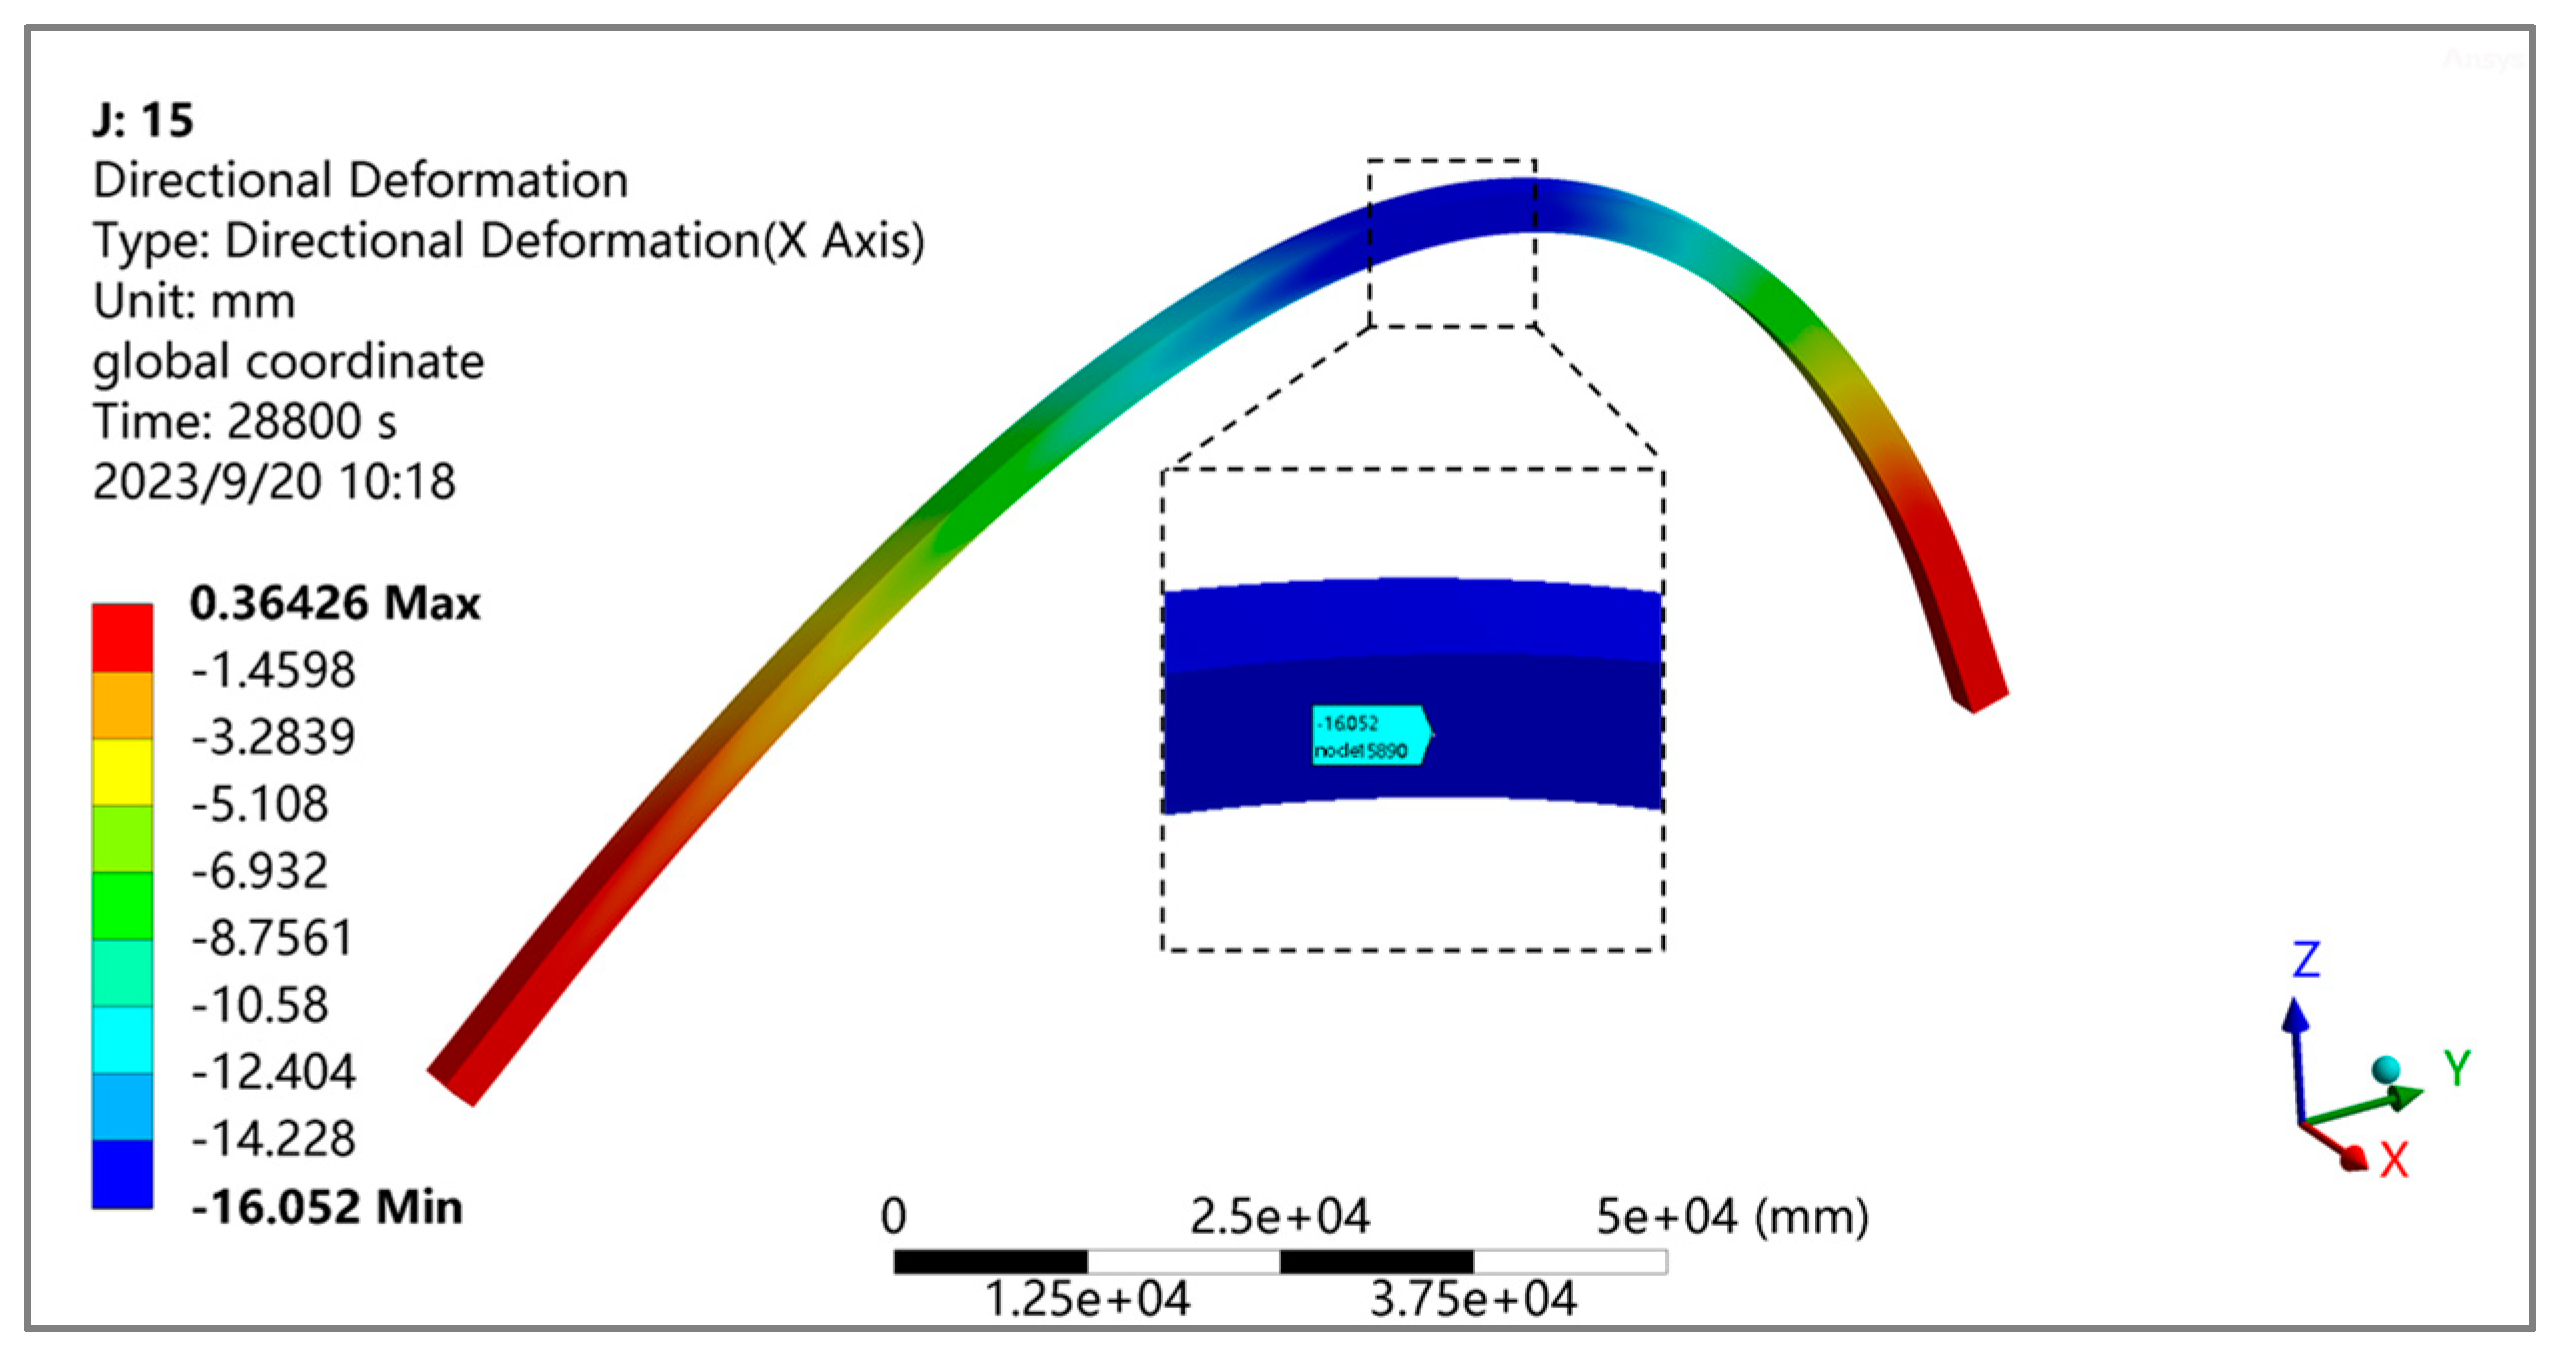
Figure 27.
Lateral deformation of steel box arch ribs in winter.
Figure 25, Figure 26 and Figure 27 show that the area where stress concentration occurs in the arch ribs is consistent with summer, with a maximum equivalent stress of 36.2 MPa. The maximum vertical displacement of the steel box arch rib is 10.8 mm, which occurs near the top plate of the middle portion of segment G2J6. The maximum lateral displacement is −16.1 mm, happening near the web plate of the middle part (arch) of segment G2J7.
6. Conclusions
This article calculates the thermal parameters required for simulating the temperature field of a steel box arch rib based on climate conditions and bridge design parameters at the bridge site. A transient thermal analysis model of the steel box arch rib section is established. Aiming at the structural characteristics of irregular steel box arch ribs, based on the simplified concept of “replacing curvature with straightness”, a three-dimensional transient thermal analysis finite element model of the No. 2 steel box arch rib is established, and the influence of season and arch rib direction on its temperature field, as well as the stress and deformation of steel box arch ribs under nonlinear temperature action, are analyzed. The following conclusions can be drawn:
- Under the influence of summer sunlight radiation, due to the inconsistent final radiation intensity absorbed by the top, bottom, and web plates of different segments of the steel box arch rib, the temperature peak at different times will not stably appear at a certain boundary.
- The temperature changes in different seasons have a significant impact on the temperature changes in the arch rib. The change in the azimuth angle of the arch rib has little effect on the peak temperature of the arch rib but has a more significant impact on the temperature difference between the web plates on both sides of the arch rib. The maximum temperature difference between the web plates on both sides is 6.9 °C.
- At the most unfavorable temperature field, the maximum equivalent stress of the steel box arch rib is 38.5 MPa, the maximum vertical displacement is 13.9 mm, and the maximum lateral displacement is 16.1 mm.
- In the operation stage of steel box arch ribs, special attention should be paid to the influence of the sunlight temperature field on the lateral displacement of the arch crown and the stress at the arch foot, and numerical models can be used to calculate its temperature effect.
Author Contributions
Conceptualization, H.Q., K.W., W.H. and M.A.; methodology, M.A. and K.W.; software, K.W. and M.A.; validation, H.Q., K.W. and M.A.; formal analysis, M.A.; investigation, H.Q., K.W. and M.A.; resources, H.Q., K.W. and M.A.; writing—original draft preparation, M.A., K.W. and H.Q.; writing—review and editing, H.Q., K.W. and M.A.; supervision, H.Q. and M.A. All authors have read and agreed to the published version of the manuscript.
Funding
This research was funded by the National Natural Science Foundation of China (No. 11672215).
Data Availability Statement
The data presented in this study are available on request from the corresponding authors.
Conflicts of Interest
The authors declare no conflicts of interest.
Abbreviations
The following symbols are used in this paper:
| t | true solar time |
| N | ordinal day of the year |
| td | time differences |
| sun angle | |
| I0 | absolute position of the sun |
| declination | |
| slow time angle | |
| geographical latitude | |
| inclination between the normal line of inclined plane and the horizontal plane | |
| angle between the normal direction of the structure surface and the due south direction |
References
- Shenkai, P. Construction control points of butterfly steel structure bridge. J. Constr. Eng. 2008, 5, 676–678. [Google Scholar]
- Xuecheng, L. Construction Monitoring and Cable Force Optimization Analysis of Double Basket Arch Bridge. Ph.D. Thesis, Wuhan University of Technology, Wuhan, China, 2016. [Google Scholar]
- Du, G. Structural Stability and Dynamic Performance Analysis of Special-Shaped Arch Bridge. Ph.D. Thesis, Southwest Jiaotong University, Chengdu, China, 2011. [Google Scholar]
- Zou, Q. Temperature Effect of Long-Span Fly-Winged Concrete-Filled Steel Tube Arch Bridge. Ph.D. Thesis, Southwest Jiaotong University, Chengdu, China, 2021. [Google Scholar]
- Yousong, P. Research on Sunshine Temperature Effect Theory and Application of Concrete Bridge Structure. Ph.D. Thesis, Southwest Jiaotong University, Chengdu, China, 2007. [Google Scholar]
- Li, S. Research on Sunshine Temperature Field and Temperature Effect of Long Span Continuous Rigid Frame Bridge. Ph.D. Thesis, Southwest Jiaotong University, Chengdu, China, 2013. [Google Scholar]
- Zhu, C.; Jingyu, L.; Xihua, D.; Ya, N. Temperature and humidity field analysis of large size steel box girder. Bridge Constr. 2021, 51, 81–87. [Google Scholar]
- Liu, C. Research on Temperature Field and Temperature Effect of Steel-Concrete Composite Bridge. Ph.D. Thesis, Tsinghua University, Beijing, China, 2018. [Google Scholar]
- Lie, T.T. Fire resistance of circular steel columns filled with bar-reinforced concrete. J. Struct. Eng. 1994, 120, 1489–1509. [Google Scholar] [CrossRef]
- Fan, Z.; Wang, Z.; Tang, J. Temperature field analysis and closing temperature study of long-span steel structure of National Stadium. J. Build Struct. 2007, 28, 32–40. [Google Scholar]
- Kehlbeck, F. Effect of Solar Radiation on Bridge Structure; Liu, X.F., Ed.; Translator; Chinese Railway Publishing Company: Beijing, China, 1981. [Google Scholar]
- Biliszczuk, J.; Hildebrand, M.; Teichgraeber, M. Temperature distribution in different bridges types based on data from SHM systems. In Proceedings of the IABSE Congress Ghent-Structural Engineering for Future Societal Needs, Ghent, Belgium, 22–24 September 2021; pp. 540–548. [Google Scholar]
- Zhu, Q.X.; Wang, H.; Mao, J.X.; Wan, H.P.; Zheng, W.Z.; Zhang, Y.M. Investigation of temperature effects on steel-truss bridge based on long-term monitoring data: Case study. J. Bridge Eng. 2020, 25, 05020007. [Google Scholar] [CrossRef]
- Zhang, H.; Liu, Y.; Deng, Y. Temperature gradient modeling of a steel box-girder suspension bridge using Copulas probabilistic method and field monitoring. Adv. Struct. Eng. 2021, 24, 947–961. [Google Scholar] [CrossRef]
- Zhang, C.Y.; Liu, Y.J.; Liu, J.; Yuan, Z.Y.; Zhang, G.J.; Ma, Z.Y. Validation of long-term temperature simulations in a steel-concrete composite girder. Structures 2020, 27, 1962–1976. [Google Scholar] [CrossRef]
- Fu, Y.; DeWolf, J.T. Effect of differential temperature on a curved post-tensioned concrete bridge. Adv. Struct. Eng. 2004, 7, 385–397. [Google Scholar] [CrossRef]
- Huang, M.; Lei, Y.; Li, X.; Gu, J. Damage identification of bridge structures considering temperature variations-based SVM and MFO. J. Aerosp. Eng. 2021, 34, 04020113. [Google Scholar] [CrossRef]
- Li, L.; Shan, Y.; Jing, Q.; Yan, Y.; Xia, Z.; Xia, Y. Global temperature behavior monitoring and analysis of a three-tower cable-stayed bridge. Eng. Struct. 2023, 295, 116855. [Google Scholar] [CrossRef]
- Dongchao, W.; Zhao, Y.; Yuan, R. Temperature effect of concrete arch rib under bidirectional gradient temperature. Sino-Foreign Highw. 2015, 35, 159–163. [Google Scholar]
- Yilong, Z. Analysis of Temperature Effect of Long-Span Concrete-Filled Steel Tube LIFT basket Arch Bridge. Ph.D. Thesis, Lanzhou Jiaotong University, Lanzhou, China, 2018. [Google Scholar]
- Dawei, Z. Research on Temperature Field and Temperature Effect of Long-Span Concrete-Filled Steel Tube Arch Bridge. Ph.D. Thesis, Guangxi University, Nanning, China, 2021. [Google Scholar]
- Yali, Z. Analysis of Gradient Temperature Effect of Concrete-Filled Steel Tube Arch Rib. Ph.D. Thesis, Chongqing Jiaotong University, Chongqing, China, 2022. [Google Scholar]
- Yongguo, G. Research on Temperature Field and Temperature Effect of Steel Box Arch Ribbed Tie Bar Arch. Ph.D. Thesis, Chang’an University, Xi’an, China, 2011. [Google Scholar]
- Luo, Y. Study on Temperature Effect of Steel Box Arch Rib of Fenghuang Third Bridge. Ph.D. Thesis, South China University of Technology, Guangzhou, China, 2014. [Google Scholar]
- Yu, Y.; Gao, L.; Huarui, G.; Zhang, F. Temperature field of box steel arch rib of mid-tie arch bridge. J. Archit. Struct. 2022, 52, 1271–1277. [Google Scholar]
- Qiu, H.; Wang, H.; Ayasrah, M.M.; Zhou, Z.; Li, B. Study on Horizontal Bearing Capacity of Pile Group Foundation Composed of Inclined and Straight Piles. Buildings 2023, 13, 690. [Google Scholar] [CrossRef]


Disclaimer/Publisher’s Note: The statements, opinions and data contained in all publications are solely those of the individual author(s) and contributor(s) and not of MDPI and/or the editor(s). MDPI and/or the editor(s) disclaim responsibility for any injury to people or property resulting from any ideas, methods, instructions or products referred to in the content. |
© 2024 by the authors. Licensee MDPI, Basel, Switzerland. This article is an open access article distributed under the terms and conditions of the Creative Commons Attribution (CC BY) license (https://creativecommons.org/licenses/by/4.0/).