1. Introduction
Digital geospatial information products are increasingly integrated into our daily lives. Vector geographic data, characterized by its high precision, rich informational content, ease of storage, and suitability for automated processing, is widely utilized in various fields, including urban planning, environmental monitoring, and disaster management [
1,
2,
3,
4]. However, alongside its extensive application in the geographic information industry, data leakage and infringement incidents have become increasingly frequent, drawing attention to critical vulnerabilities in the security mechanisms protecting these data [
5,
6,
7,
8,
9]. A major concern is the potential for symmetry-breaking within these security mechanisms, which can introduce exploitable vulnerabilities, allowing attackers to alter the data undetected. For example, interactions within federated authentication systems can propagate such vulnerabilities if dependency systems adopt weaker security measures, highlighting challenges in indirect authentication [
10]. This can severely compromise data integrity, leading to erroneous decision-making and, in some cases, jeopardizing national security. Consequently, data authentication for vector geographic data has consistently remained a focal point of research due to its critical role in ensuring data integrity and reliability [
11,
12,
13,
14].
Existing data authentication algorithms can be divided into two categories. The first is the global authentication method. This type of method is generally inspired by cryptographic research findings and is foundational to many data security practices. Numerous cryptographic hash functions [
15,
16,
17] are employed to create message digests, such as the family of secure hash algorithms [
18,
19,
20]. These methods are easy to implement and have high accuracy, making them popular choices for various applications. However, the data and the hash values used for comparison are stored separately, leading to vulnerabilities that introduce a risk of tampering with the hash values used for comparison [
21,
22]. That is, an attacker could modify the data and then change the comparison hash value to match the hash of the modified data, effectively bypassing the authentication process.
The second category is the regional authentication method, which typically employs fragile watermarking [
23,
24,
25,
26,
27]. It involves dividing the data into spatial blocks and embedding fragile watermarks in each block, thereby enabling precise block-level data authentication. The fragile watermark in these algorithms integrates seamlessly with the data, addressing the separation issue of data and hash values in the first category. For instance, the literature [
28] divides vector geographic data into blocks based on the number of data points and embeds watermarks in them. This method verifies the integrity of vector data and locates tampering down to the block level. Reference [
29], combining chaotic mapping techniques with vector data characteristics in GIS (Geographic Information System), proposed a fragile watermarking-based integrity authentication method for vector data. This method also effectively verifies the integrity of vector data and can determine the location and extent of tampering, but it is limited to block-level localization. Reference [
30] proposed a point-constrained, block-based precise verification algorithm for vector geographic data. In the authentication process, it uses point constraints to divide vector geographic data into blocks and sorts each block to establish relationships between features. However, the block division results are highly susceptible to deletion attacks. It is apparent that the main limitation of these algorithms is that they can only localize blocks, which is not precise enough.
In summary, leveraging cryptographic research, the global authentication algorithm is easy to implement but risks data and hash value tampering. Regional authentication algorithms using fragile watermarking technology eliminate the former’s risk, but can only localize to the block level, which may not be sufficient for scenarios requiring precise data integrity checks. The point is the smallest unit of presentation in vector geographic data. Therefore, the question of how to use fragile watermarking to establish connections between points is a scientific problem.
To address these issues, this paper introduces a novel fragile watermarking authentication algorithm based on multiple sorting mechanisms. Leveraging the IEEE 754 structure [
31,
32] of double-precision floating-point numbers, it uncovers more watermark embedding space, facilitating the establishment of connections between points.
Section 2 presents the fundamental concepts and specifics of the algorithm. The experiments are set up in
Section 3. Following that,
Section 4 offers the experimental results and analysis, while
Section 5 engages in further discussions.
Section 6 summarizes the findings.
2. Methodology
The framework of the algorithm proposed in this paper is illustrated in
Figure 1. It primarily comprises two components: (1) watermark embedding and (2) watermark extracting and authentication. The process involves extracting a sequence of points from vector geographic data and embedding watermarks into each data point. The embedded watermark information includes self-identification and ordering information of the points. The self-identification information adds a unique identifier to each point, while the ordering information establishes connections among all points. Therefore, the self-identification information can determine whether a point has been subjected to an addition attack, and the ordering information can identify regions that have suffered deletion attacks.
Targeting ESRI Shapefile as the data format, storing point coordinates as double-precision floating-point numbers that provide potential space for embedding watermark information. This choice is particularly relevant given the widespread use of Shapefiles in GIS. However, the proposed algorithm is not constrained by the Shapefile format or any specific projection system. Since this method operates directly on the floating-point representation of coordinates (x, y) following the IEEE 754 standard, it is applicable to any vector geographic dataset containing floating-point coordinates. Furthermore, a projection system maps the (x, y) values from one coordinate system to another while preserving their floating-point type. Ordering information includes the sorting information of the x coordinates and y coordinates, which can confine the area of deleted points within a series of rectangular regions, thereby improving the algorithm’s effectiveness in tamper localization.
2.1. Multiple Sorting Mechanisms
The proposed algorithm employs multiple sorting mechanisms as a fundamental approach to improve the accuracy of tampering authentication in vector geographic data. Specifically, the multiple sorting mechanisms involve sorting the data points by x coordinates and y coordinates. These sorting processes constitute the foundation of the algorithm’s capability to authenticate deletion attacks.
In detail, after sorting the data points by their x coordinates, each point is embedded with information about the preceding point in the sorted sequence. Similarly, after sorting by y coordinates, each point also embeds information about the preceding point in the sorted sequence. This process establishes two chains of relationships: one in the x direction and the other in the y direction. When a point is deleted, both chains are disrupted at that location, enabling the algorithm to accurately detect and localize deletion attacks. Moreover, because disruptions occur simultaneously in both the x and y directions, their intersection naturally identifies the affected region, making the authentication of deletion attacks more accurate. This dual relationship forms the basis for the algorithm’s precise tampering authentication and represents a novel contribution to the field of vector geographic data security. Further details on the implementation of the multiple sorting mechanisms are elaborated in the subsequent subsections.
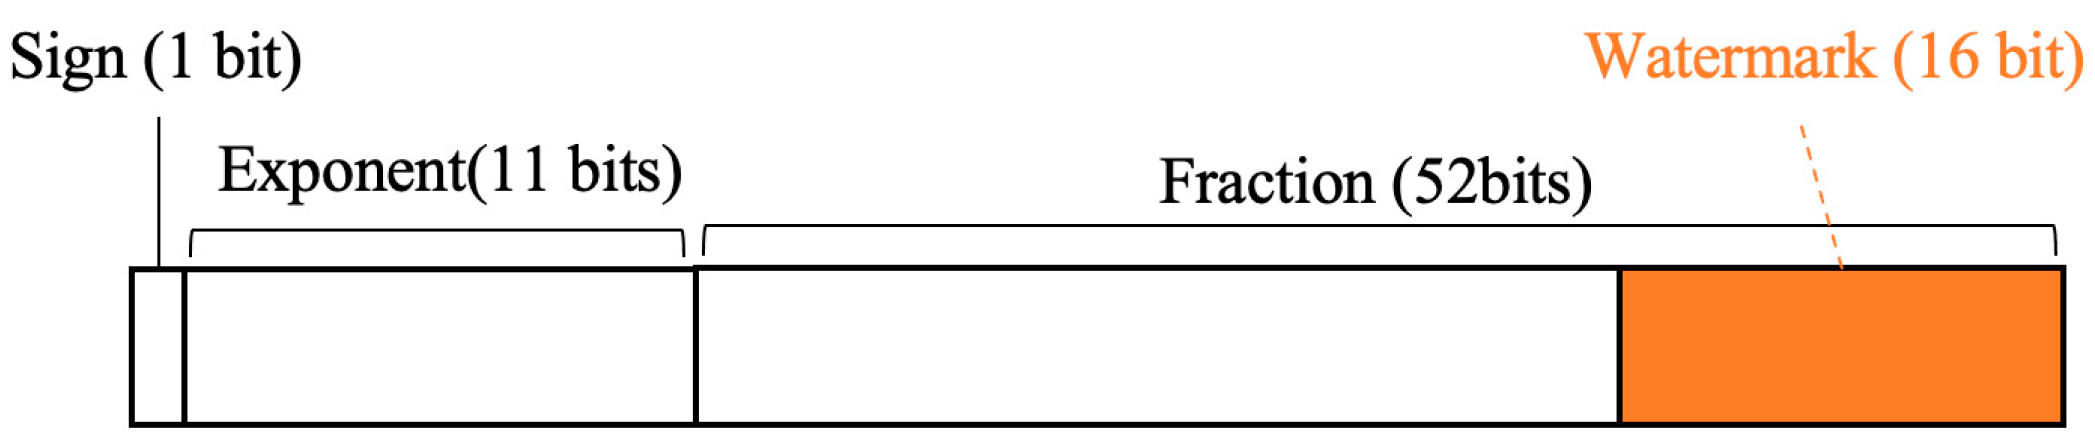
2.2. Floating-Point Number and Watermark Embedding Position
According to the IEEE 754 standard, the double-precision floating-point number consists of the sign, the exponent, and the fraction, occupying 1 bit, 11 bits, and 52 bits, respectively. This structure is fundamental for representing a wide range of values with high precision, making it ideal for geographic coordinate storage. In conjunction with analyzing the characteristics of vector geographic data, this paper uses the 1st to 16th bits of the fraction of
x and
y coordinates for watermark embedding. This approach ensures that the watermarking process does not significantly alter the original data representation. The structure of the floating-point number and the selection of watermark embedding positions are depicted in
Figure 2.
The organization of Shapefile vector geographic data is fundamentally based on coordinate points, and different types of data arise from the various organizational rules for points. Each point contains at least x and y coordinates, stored as double-precision floating points. Vector geographic data have a certain accuracy tolerance when in use. Within the bounds of reasonable tolerance, the redundant space that does not affect data precision provides an opportunity for watermark embedding. Moreover, the choice of embedding within the floating-point representation minimizes the risk of noticeable distortion, ensuring that the embedded watermark remains imperceptible to end users and thus preserves the usability of the vector data for practical applications.
2.3. Watermark Information Generation
The generation of watermark information involves two primary components: self-identification information and sorting information. This paper calculates the self-identification information for each point using its own
x and
y coordinates. The self-identification information involves converting specific bits of the coordinates into a unique identifier for each point, which is vital for detecting addition attacks. Assuming the watermark length is
N, the 17th to 52nd bits of the fraction of
x and
y coordinates are converted to uint64 integers, denoted as a and b, respectively. This conversion is essential for facilitating the manipulation of bits to embed watermark information effectively. The watermark information can be generated using the following formula:
where
represents the modulo operation, and
is the bitwise XOR operation. The value range of
is [0,
−1]. When generating self-identification information, the watermark length
N is set to 16. When generating sorting information, the watermark length
N is set to 8. The process of generating watermark information ensures that each point retains a unique identification, which is vital for subsequent authentication phases.
Regarding addition attacks, the proposed method significantly improves the accuracy in detecting added points. This improvement is achieved by utilizing 16 bits for self-identification, embedding the information directly into the binary representation of the coordinates. In contrast, traditional methods, which often operate on textual representations and embed watermark information into specific decimal places, typically have a much lower watermark capacity (e.g., 1 bit per digit). Such limited capacity makes it challenging for these methods to achieve the precision of the proposed approach, which utilizes 216 unique possibilities for self-identification.
2.4. Watermark Information Embedding
The primary task of watermark information embedding is to embed the generated watermark information into the embedding position. For the x coordinate, its embedding position is used to embed 16-bit length self-identification information, while for the y coordinate, it is used to embed sorting information. This dual-purpose embedding approach optimizes the use of available bit space, maximizing the watermark’s effectiveness.
The embedding of sorting information involves sorting by
x coordinates and
y coordinates. Specifically, for the embedding position of
y coordinates, the 1st to 8th bits are used to embed watermark information sorted by
x, and the 9th to 16th bits are used to embed watermark information sorted by
y. This embedding strategy differs significantly from traditional watermarking algorithms, which typically process coordinate values as text and embed watermark information into specific decimal places. Instead, the proposed algorithm embeds the watermark directly into the binary representation of coordinate values. This approach minimizes the impact of watermark embedding on the data’s precision. It is important to note that the watermark embedding process involves converting the watermark information into binary digits and replacing the corresponding bits in the floating-point representation of the coordinate values. This sorting mechanism is crucial, as it establishes a relational framework among the data points, enhancing the ability to detect any alterations. The embedding operation uses bit replacement. For a point (
x,
y), where its self-identification information is denoted as
, then
where
sets the bits at a range of specific bits, with the second and third parameters being the starting and ending positions of the bit, respectively.
For embedding sorting information, it is a precondition to sort the data first. After sorting by
x from smallest to largest, the
y of each coordinate point is embedded with the sorting information denoted as
from the previous coordinate point.
Similarly, the sorting information of the previous point, sorted by
y, is denoted as
. After sorting by
y from smallest to largest, the watermarked
can be expressed by the following equation.
2.5. Watermark Information Extraction and Authentication
Watermark extraction is the reverse process of watermark embedding. The authentication process involves comparing the extracted watermark information with the re-calculated watermark information. For a coordinate point (, ), this paper classifies the types of attacks based on the position changes of each point in the vector geographic data into two categories: addition attacks and deletion attacks. Other types of attacks can be considered combinations of these two types. For example, a modification attack can be regarded as a combination of deletion followed by addition.
2.5.1. Addition Attack Authentication
Extract the self-identification information
by the following formula.
Like , retrieves bits at a specific range from a double-precision floating-point number and interprets them as an integer.
If is equal to , then the point (, ) is an original point. Otherwise, (, ) is an added point. Therefore, the authentication of addition attacks can be precise down to the individual point.
2.5.2. Deletion Attack Authentication
This mainly involves extracting the sorting information from the points, taking into account the points that have passed the addition attack authentication. For the point (
,
) sorted by
x, extract the sorting information
of its previous point (
,
) by the following equation.
If is identical to , it can be inferred that no deletion attack has occurred between the lines and . Conversely, any discrepancy between and indicates the presence of a deletion attack.
Similarly, for the sorting information
that is sorted by
y can extracted as below.
If is identical to , it can be concluded that no deletion attack has occurred between the lines and . Conversely, any discrepancy between and would indicate the presence of a deletion attack.
Finally, the rectangular block where points have been deleted can be pinpointed by intersecting the horizontal and vertical intervals. This allows for the precise localization of tampering within the data. As shown in
Figure 3, the deletion attack occurred in the textured area. Additionally, if multiple rectangular blocks with adjacent boundaries are detected, they can be merged into a single larger rectangular block for a more comprehensive identification of the tampered area.
4. Results and Analyses
4.1. Results of Imperceptibility
The imperceptibility results are shown in
Table 1. All of the indicators show very low values. For instance, the maximum change in
y and the maximum change in the distance are both 2.97 × 10
−5 m, which equates to 29.7 μm and is considered negligible. These values fall within acceptable limits for practical geospatial data applications, ensuring that the watermark remains imperceptible.
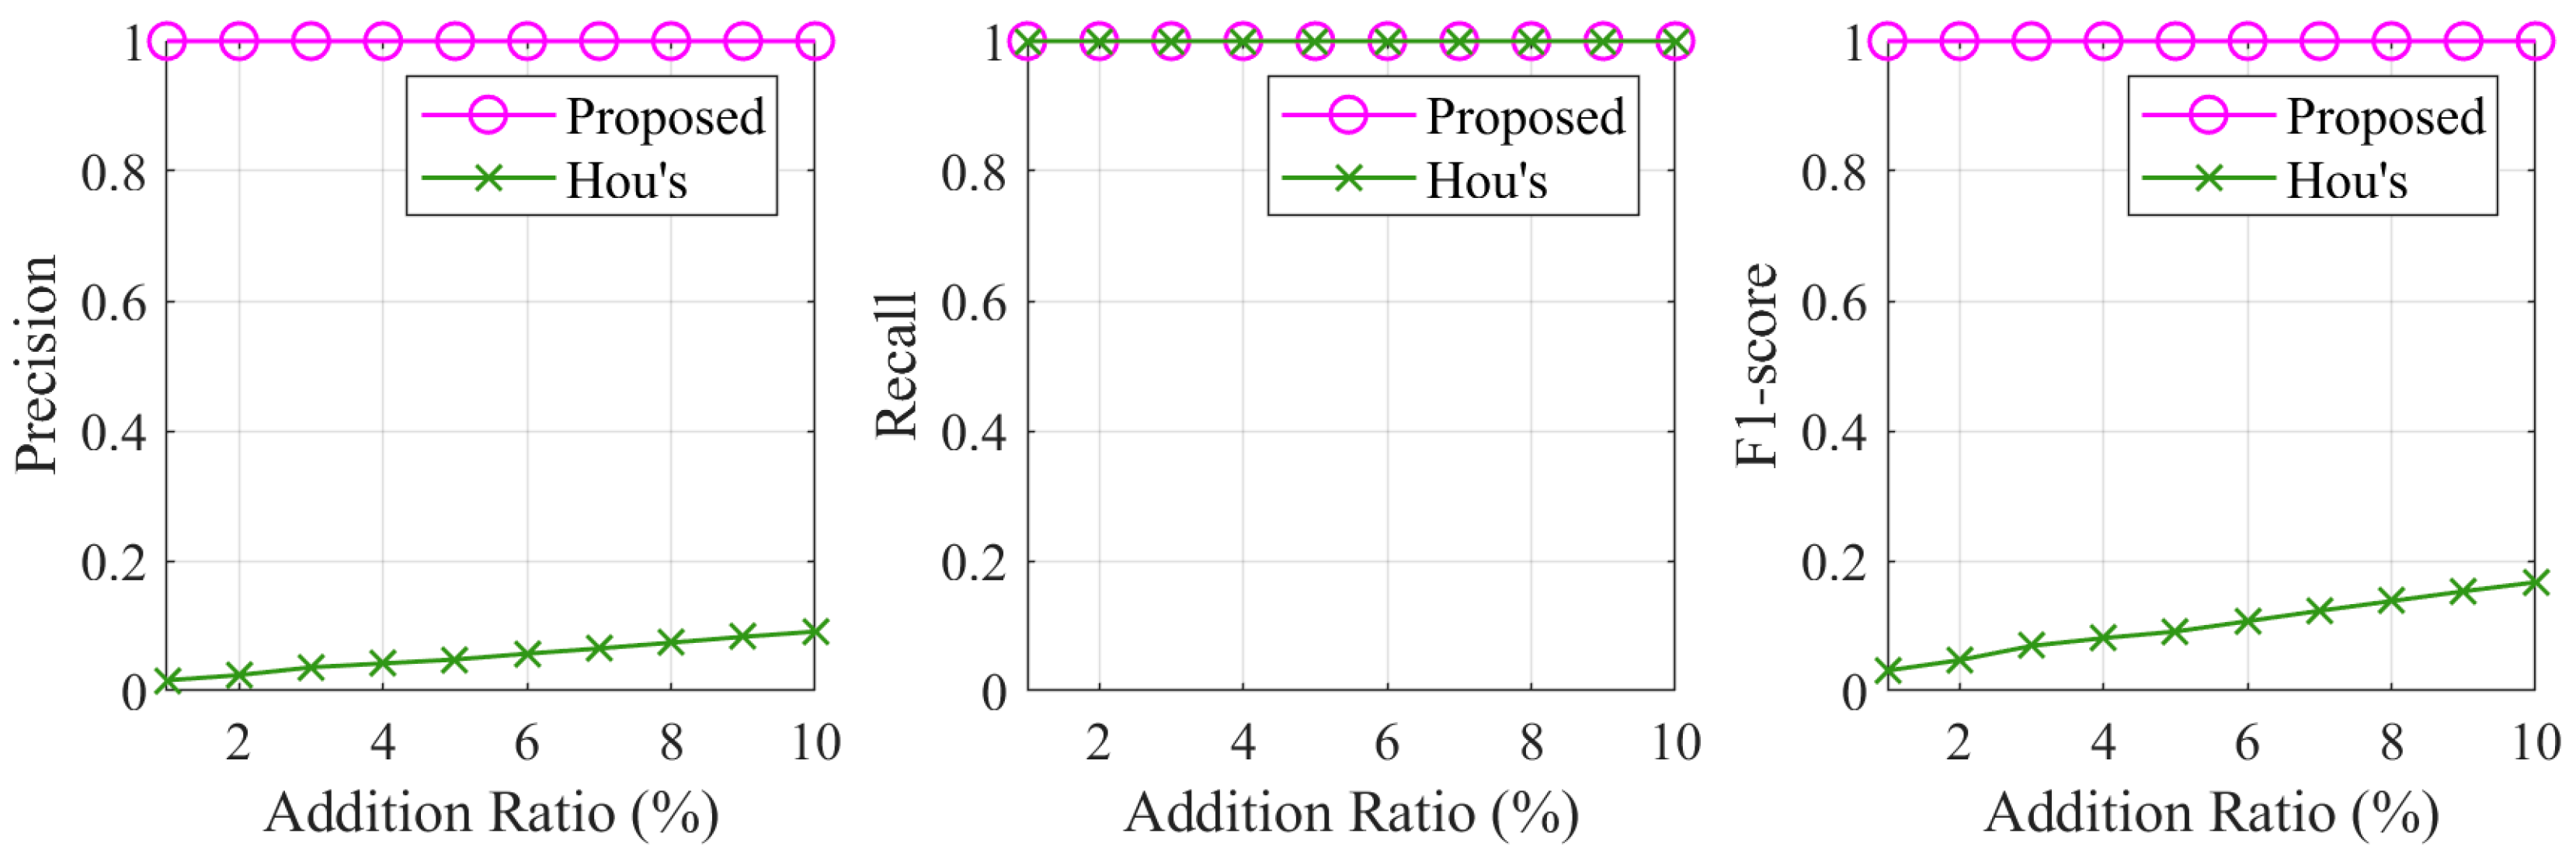
4.2. Authentication Results of Addition Attacks
Figure 6 presents a visual comparison between the proposed method and Hou’s method in detecting addition attacks at various ratios. The graph shows how the performance of both methods varies as more points are added to the original dataset. Specifically, the proposed method maintains consistent accuracy across all tested addition ratios, while Hou’s method exhibits a relatively low level in precision and F1-score as the addition ratio increases.
Specifically, the proposed method accurately identifies all added points without misclassifying any original points, resulting in perfect precision and recall. The detection performance remains stable even when the addition ratio reaches 10%, highlighting the method’s effectiveness in distinguishing added points from the original dataset. On the other hand, Hou’s method suffers from a considerable number of false positives, especially at higher addition ratios. The clustering-based approach leads to several original points being incorrectly flagged as added. This limitation reduces the method’s precision and demonstrates its inherent weakness in handling dense tampering scenarios where fine-grained accuracy is crucial.
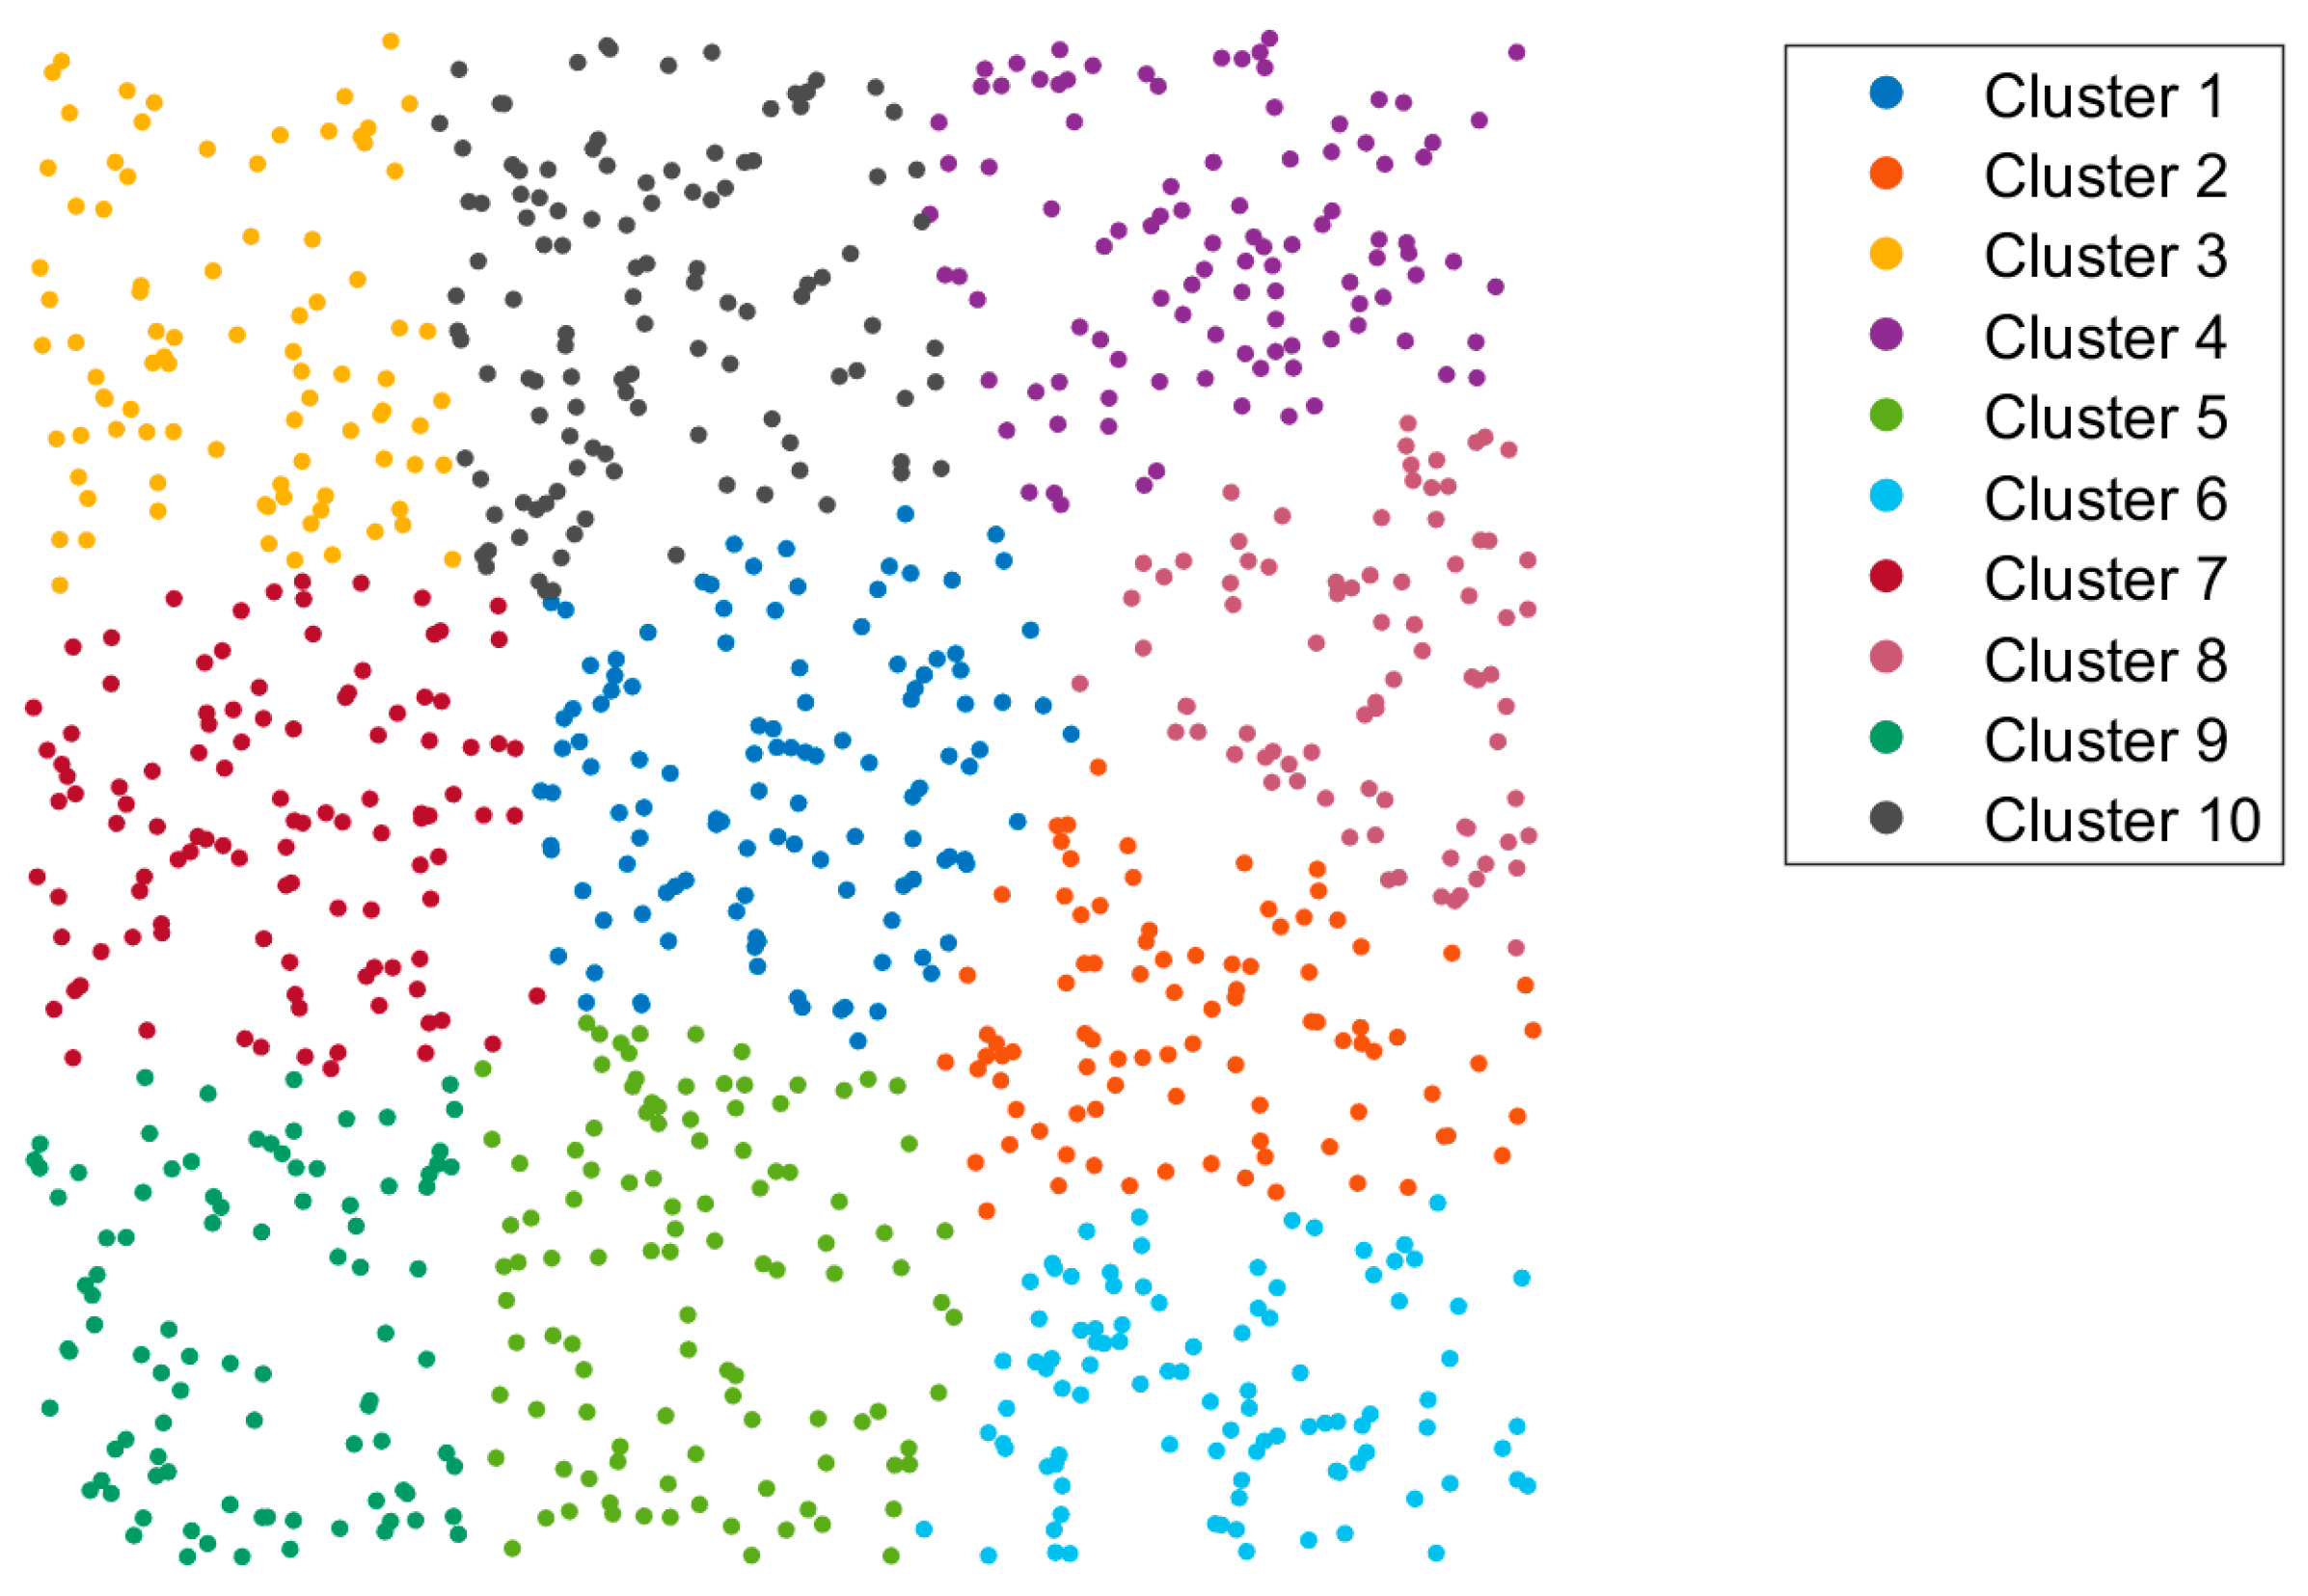
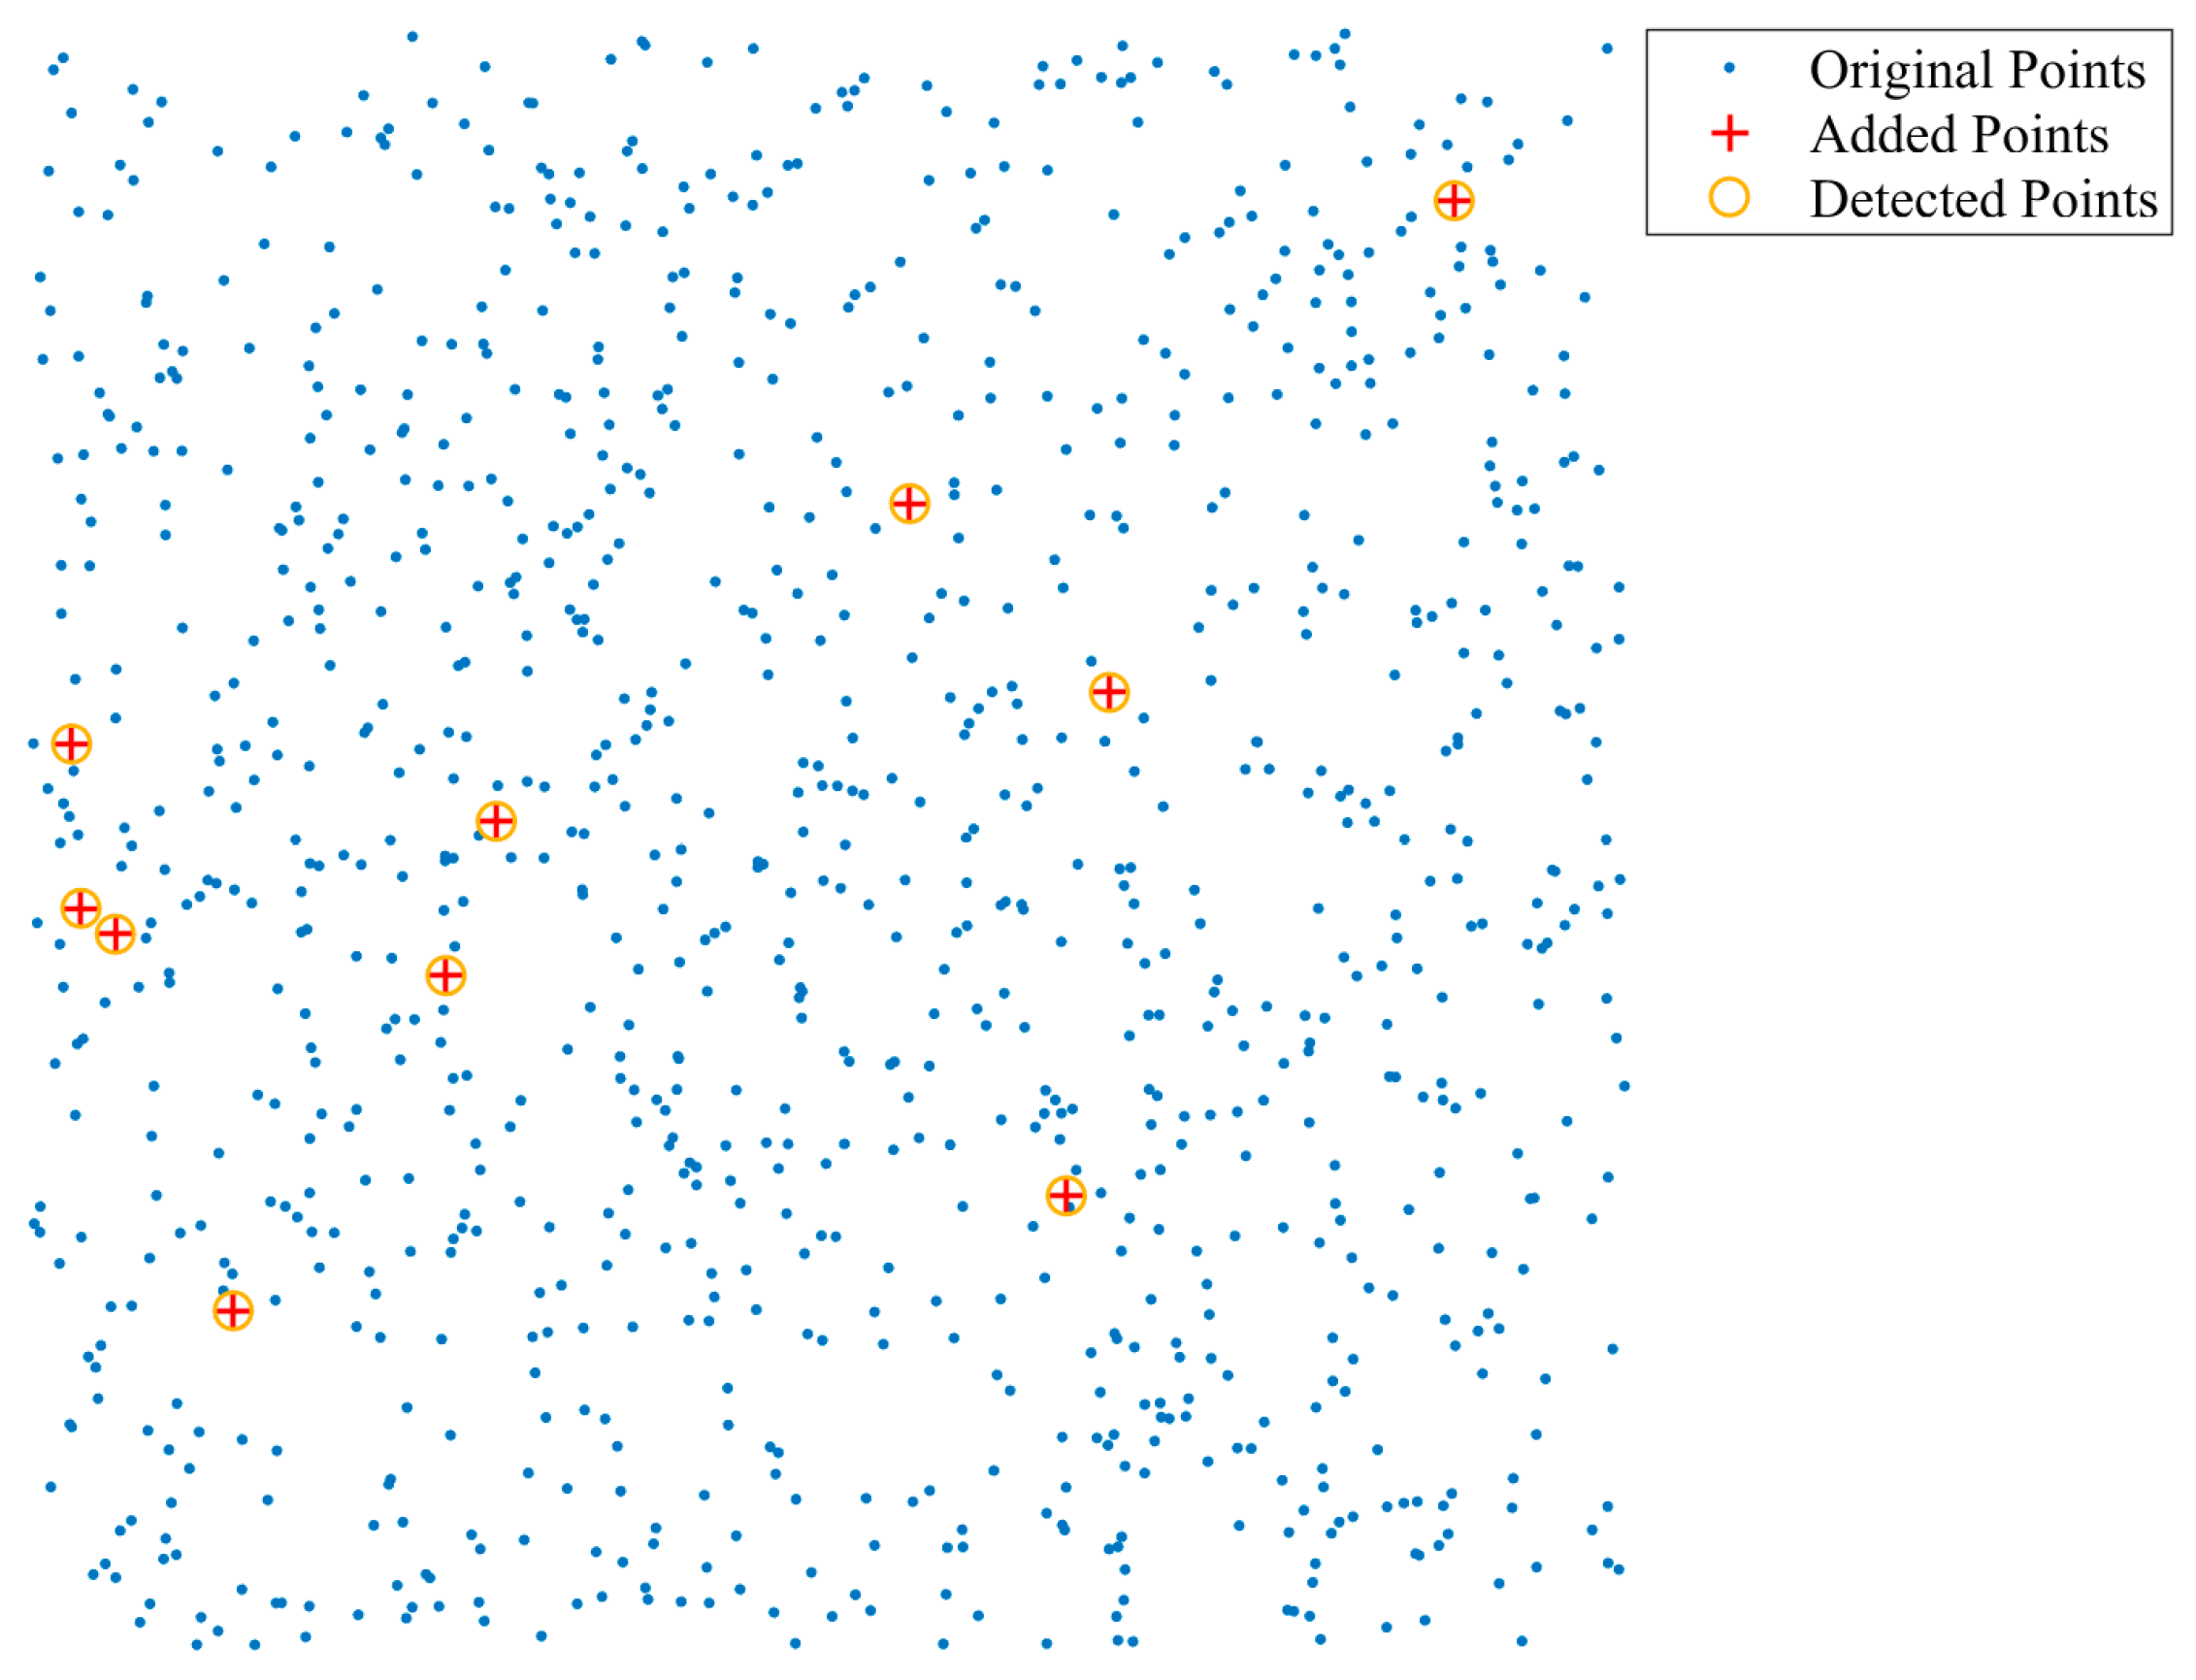
To further illustrate these findings,
Figure 7 and
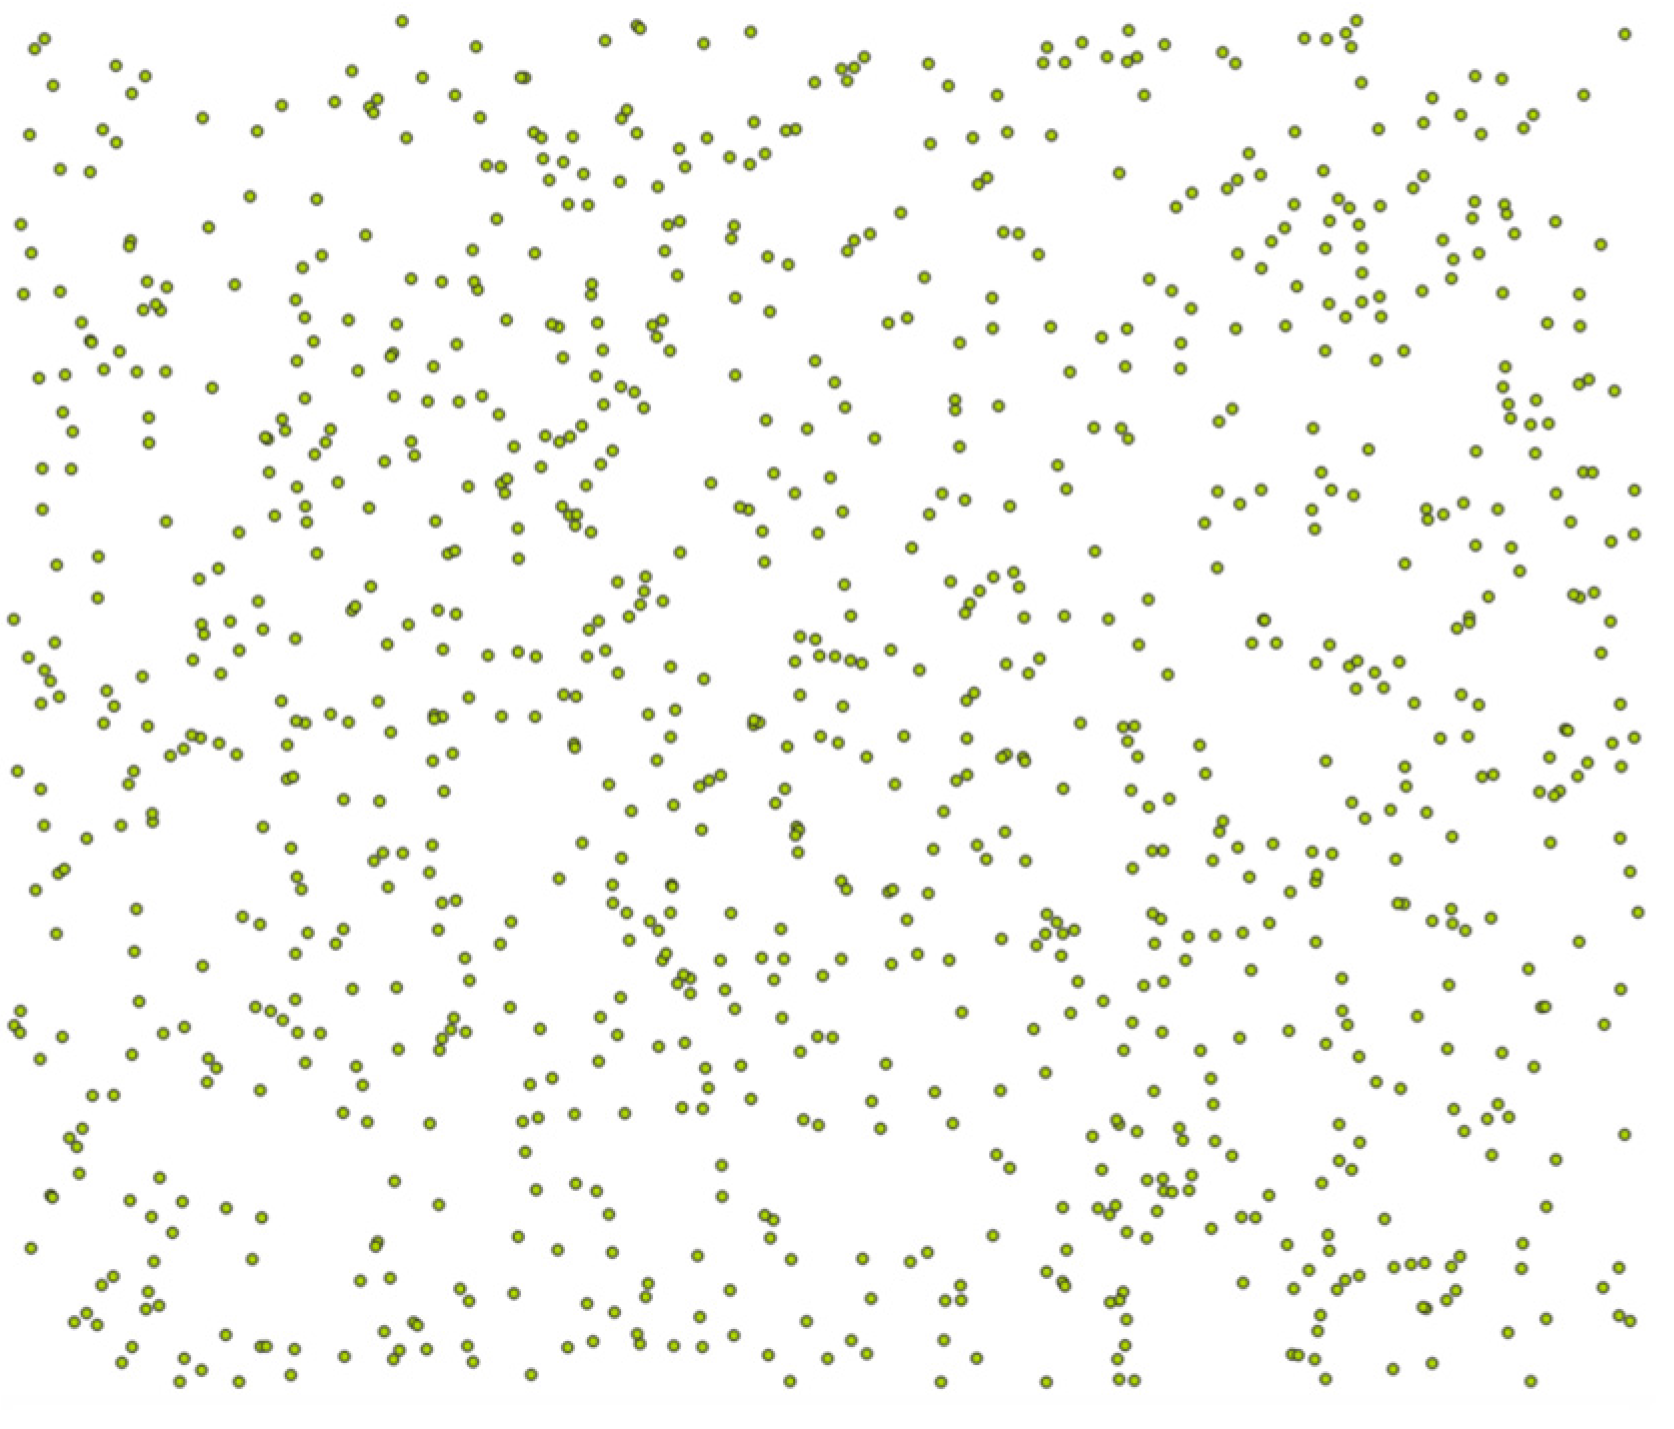
Figure 8 provide examples of the 1% addition ratio.
Figure 7 shows that the proposed method successfully detects all ten added points, marked in red, with no false positives, confirming its precise detection capabilities. In contrast,
Figure 8 reveals that Hou’s method misclassifies several original points, resulting in numerous false positives. This example underscores the impact of clustering granularity on detection accuracy.
4.3. Authentication Results of Deletion Attacks
Figure 9 illustrates the overall performance of the proposed method and Hou’s method in detecting deletion attacks, comparing both DCR and DCAR. The graph shows that both methods consistently achieve a DCR of 100%, indicating that they are able to detect all deleted points effectively. However, a clear distinction emerges in their DCAR values: the proposed method exhibits a controlled and gradual increase, maintaining a relatively low DCAR, while Hou’s method experiences significant fluctuations and higher DCAR values, reflecting less precise localization.
Focusing on the details, the DCAR reveals localization accuracy. At a deletion ratio of 3%, Hou’s method’s DCAR sharply rises to 100%, indicating that deletions affect the entire clustering structure, causing a significant expansion of the detection area. This result suggests that Hou’s method is more prone to inaccuracies as deletion intensity increases. In contrast, the proposed method maintains a controlled and smaller DCAR, demonstrating better precision in localizing deleted areas, even under higher tampering levels.
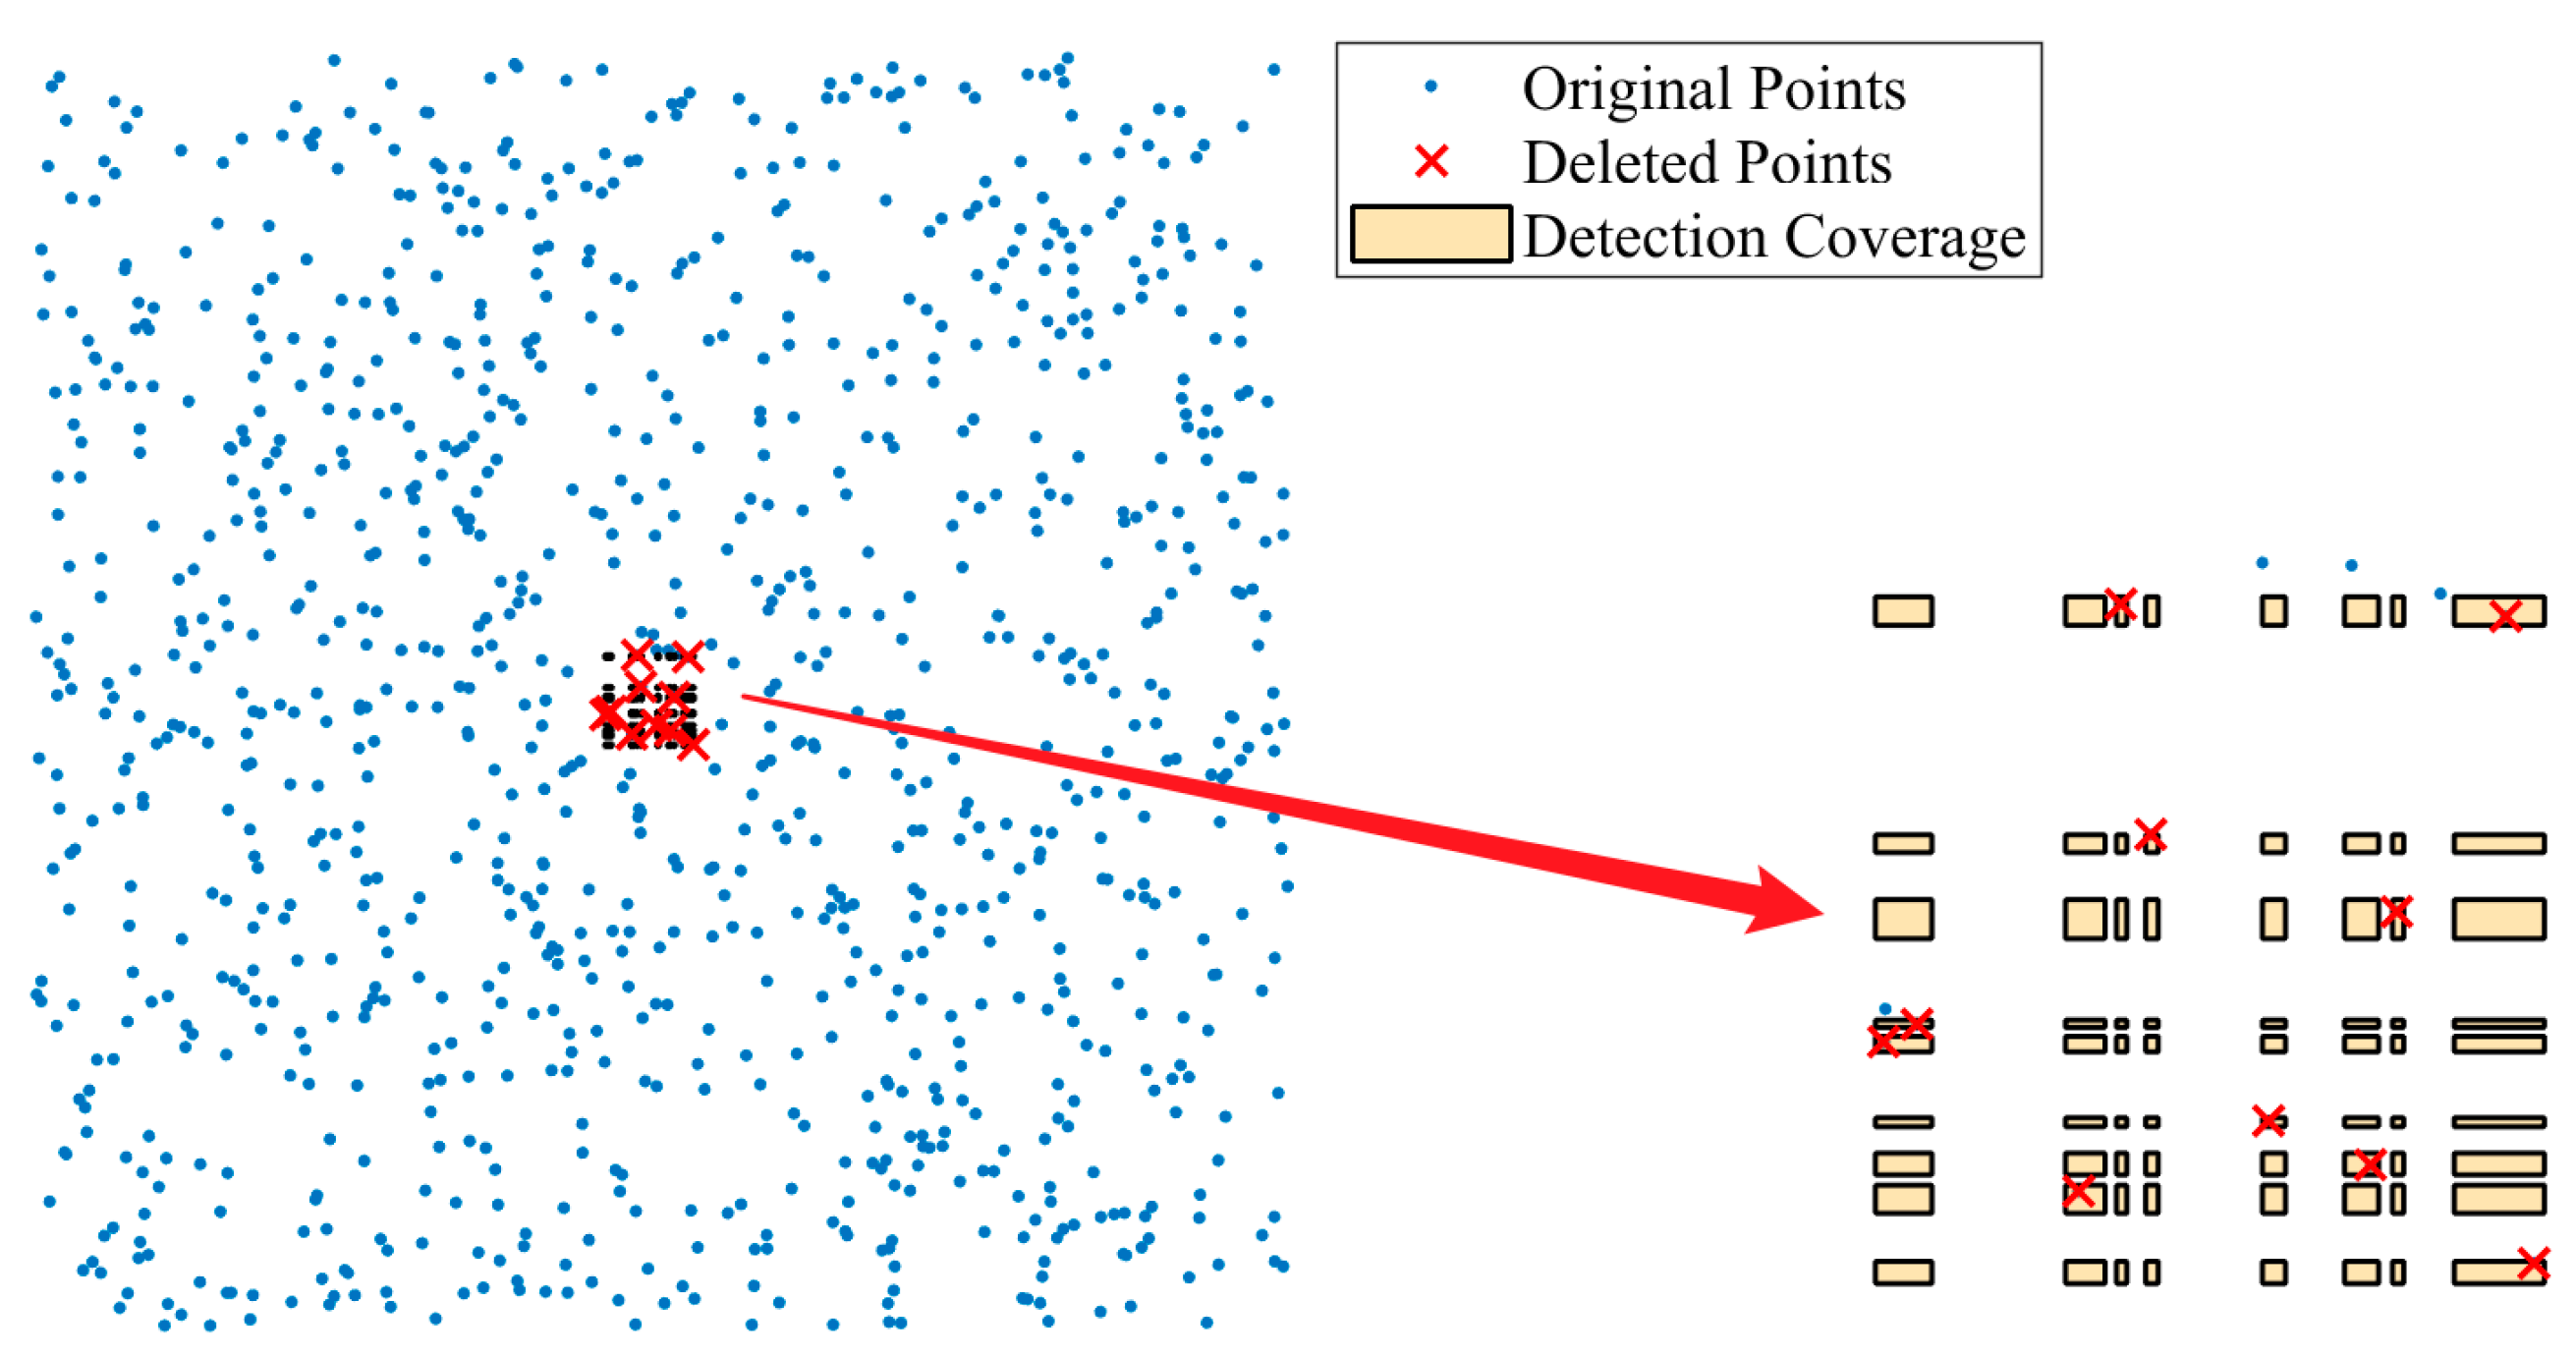
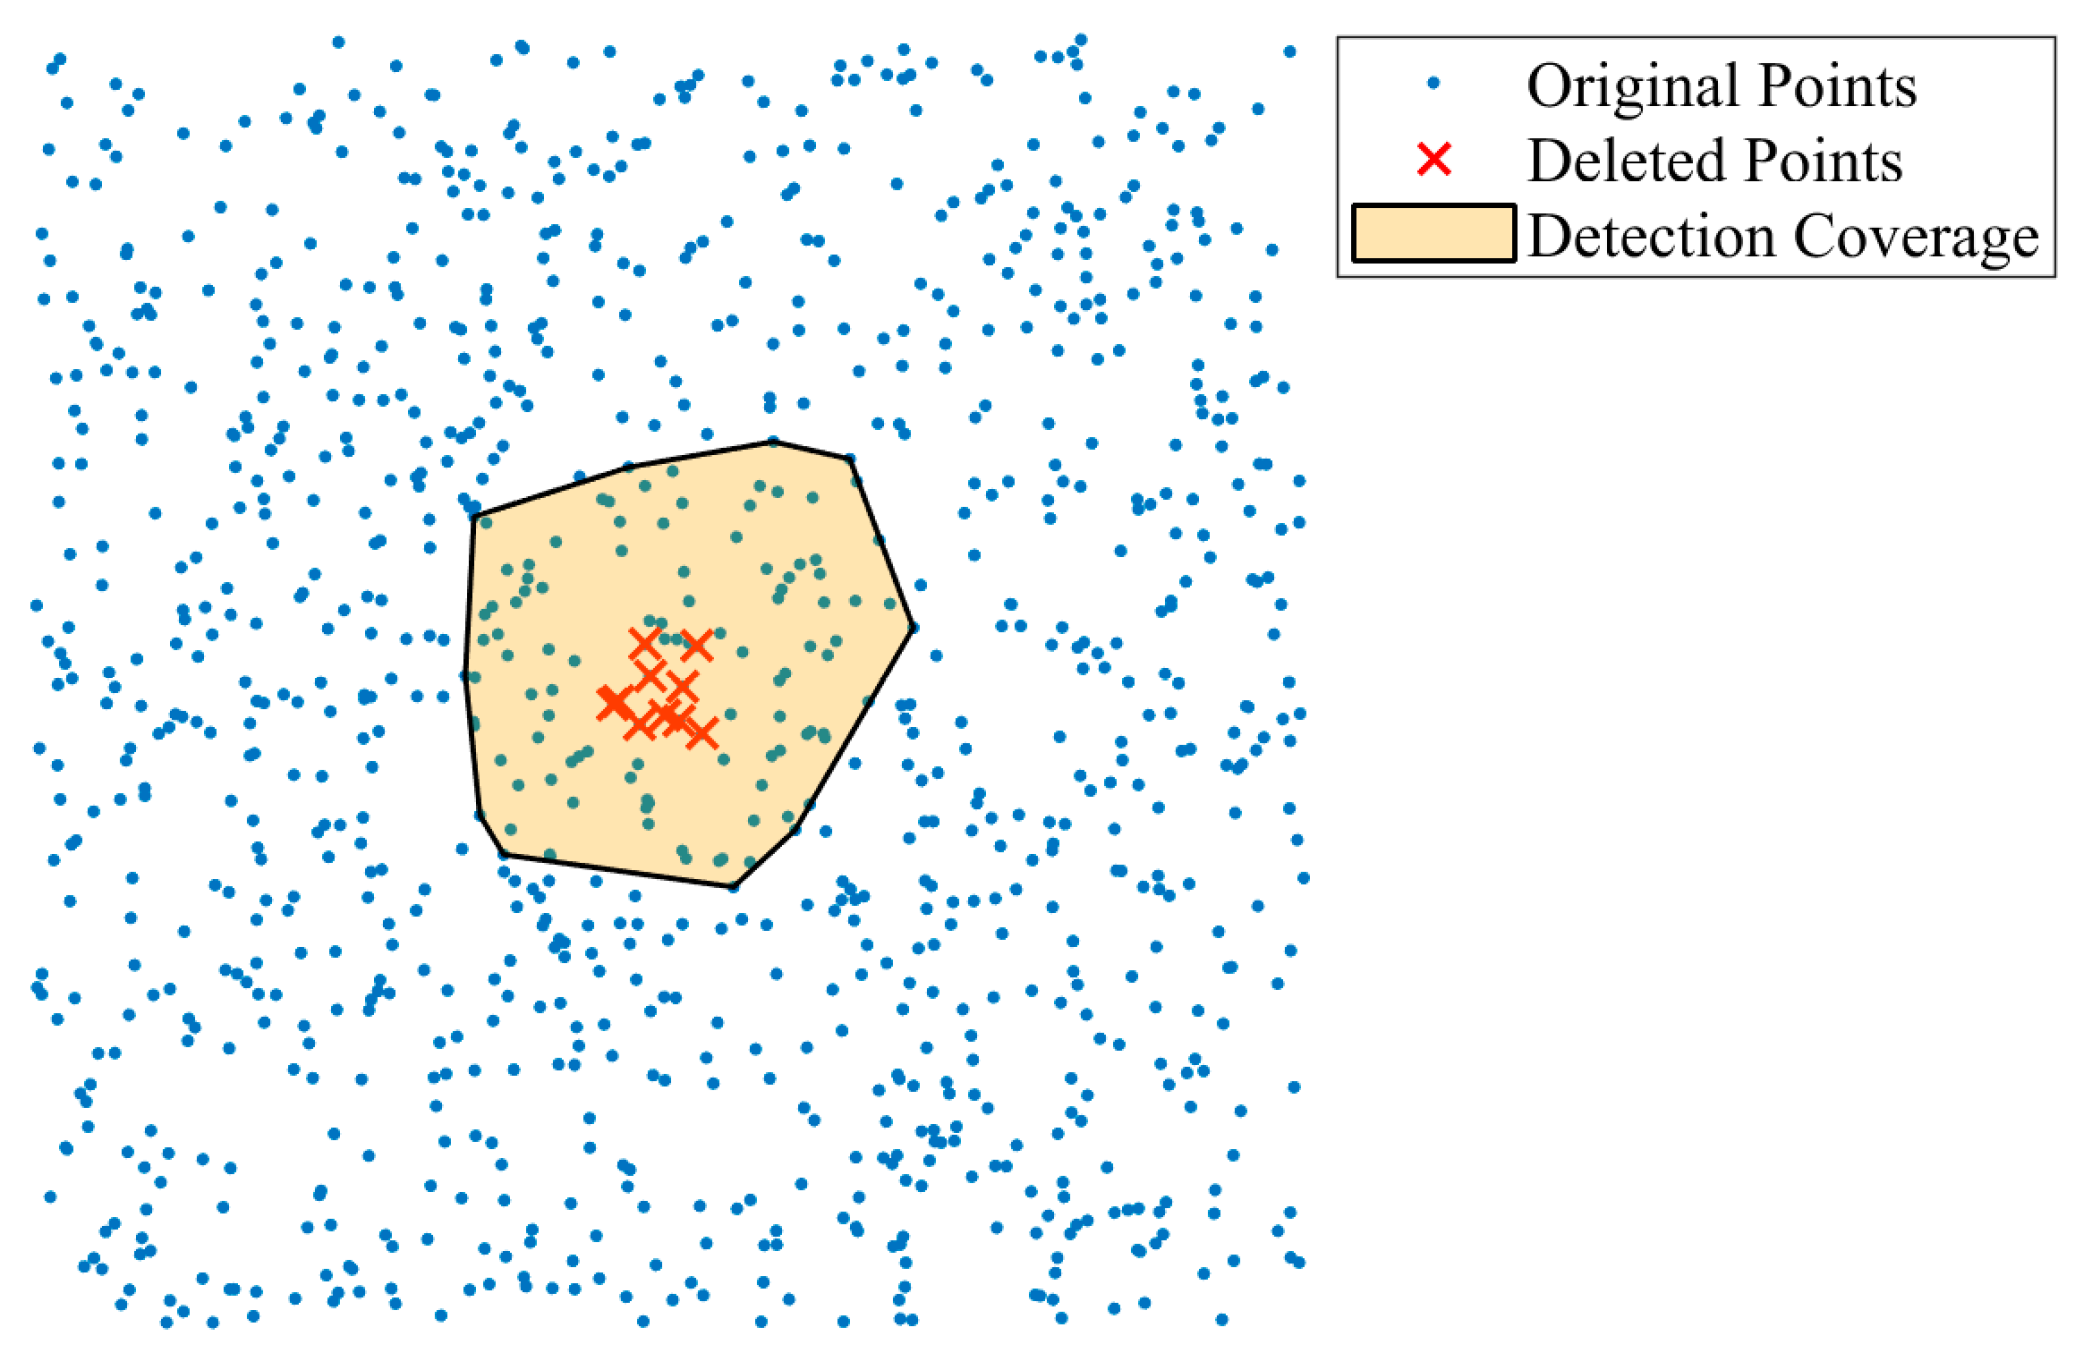
To illustrate these findings further,
Figure 10 and
Figure 11 provide a specific example of the 1% deletion ratio.
Figure 10 shows that the proposed method tightly confines the detection area, covering all deleted points while minimizing unnecessary coverage. On the other hand,
Figure 11 reveals that Hou’s method generates a much larger detection area, extending beyond the actual tampered regions and underscoring the limitations of its approach.
Overall, the proposed algorithm exhibits strong imperceptibility and accurately authenticates addition attacks with perfect precision. For deletion attacks, it achieves precise localization with a smaller detection area compared to Hou’s method, which suffers from significant false detection regions due to its cluster-based limitations.


