Abstract
The study introduces a new threshold method based on a neutrosophic set. The proposal applies the neutrosophic overset and underset concepts for thresholding the image. The global threshold method and the adaptive threshold method were used as the two types of thresholding methods in this article. Images could be symmetrical or asymmetrical in professional disciplines; the government maintains facial image databases as symmetrical. General-purpose images do not need to be symmetrical. Therefore, it is essential to know how thresholding functions in both scenarios. Since the article focuses on biometric image data, face and fingerprint data were considered for the analysis. The proposal provides six techniques for the global threshold method based on neutrosophic membership, indicating neutrosophic overset (), neutrosophic overset (), neutrosophic overset (), neutrosophic underset (), neutrosophic underset (), neutrosophic underset (); similarly, in this study, the researchers generated six novel approaches for the adaptive method. These techniques involved an investigation using biometric data, such as fingerprints and facial images. The achievement was accurate for facial image data and accurate for fingerprint data.
1. Introduction
Enhancing an image is necessary to perfect its appearance and highlight certain processing aspects of the contained information. Thresholding techniques involve various algorithms that are based on the characteristics of the image. The gray-level histogram of the image plays a major role in the task of thresholding, as it allows for the separation of objects from the image background. Proper thresholding requires the separation of objects from the background of the image. The characteristics of the image can affect the outcome directly or indirectly. The neutrosophic theory is applied to digital image processing and it includes a membership function, an indeterminacy function, and the non-membership function. The authors implemented the min–max normalization method to reduce uncertainty noises from the images. Through the computed membership functions, the non-linearity problem was solved by applying the activation functions. The transformed sets of neutrosophic images helped us to find the similarities and dissimilarities of the image. In addition, to reduce the uncertain noises in an image, Jha [1] discussed a novel approach of neutrosophic sets (NS) for image segmentation to overcome the uncertainty intensity issues from the missing data. The interval neutrosophic sets (INS) enables the transformation of an image and the description of the intervals of the membership functions. This approach helps to evaluate the contrast between the membership functions and also defines a score function for INS. Yuan [2] proposed a new image segmentation method based on INS, and the experimental results showed that it achieved higher PSNR values and performed better than the k-means clustering algorithm. Song [3] proposed a fast image segmentation method that combines a saliency map with NS (SMNS) to achieve higher accuracy. The SMNS method can effectively solve the issues of under-segmentation and over-segmentation, and performs well in the presence of salt and pepper noise, Gaussian white noise, and mixed noise. Multi-class image segmentation is a method that can handle uncertainty management by weak continuity constraints with the NS domain [4]. This method segments the images by the spatial and boundary data of the images. An advantage of this method is that it can perform segmentation without prior knowledge of the number of classes in the image, using an iterative technique. The modified Cramer–Rao bound is used to statistically validate noise perturbations. Ji [5] also proposed a neutrosophic c-means clustering method for color image segmentation that incorporates gradient-based structural similarity to address misclassification issues. Instead of using a maximum membership rule, the method implements similarity in the superpixels. Additionally, the Linguistic neutrosophic cubic set (LNCS) method is used for NS membership degrees, which aggregates using aggregation operators. The LNCS method is validated with various noise types, including Gaussian, speckle, and Poisson noises. The neutrosophic convolutional neural network (NCNN) is a method that involves the NS theory in CNN techniques to segment or classify the images. NCNN achieves and on MNIST and CIFAR-10 datasets, respectively, for five different noise levels. Yang [6] introduced an adaptive local ternary pattern (ALTP) by using Weber’s law. The ALTP features select the threshold for local ternary patterns based on automatic strategies. This proposal focused on face recognition with the center-symmetric adaptive local ternary (CSALT). The CSALT patterns extract better discriminative information patterns from facial images. For ORL and JAFEE face datasets, the weighted nonnegative matrix factorization (WNMF) achieved and , respectively, which are more efficient than the PCA algorithm [7]. Alagarsamy [8] proposed ear and face recognition by the method of the Runge–Kutta threshold with ring projection. This proposal was examined for the IIT Delhi dataset and ORL face data; the level of achievement was approximately . An analysis of ear symmetry is necessary to understand the possibility of matching an individual’s left and right ears. Reconstructed portions of the ear were occluded in a surveillance video. The ear symmetry was assessed geometrically using symmetry operators and Iannarelli’s measurements [9]. Das [10] proposed a new approach—a pixel-based scheme to segment fingerprint images. This proposal consists of three phases: image enhancement, threshold evaluation, and post-processing. Based on the analysis, the author concluded that the SVM algorithm is not suitable when the speed of recognition is the key factor. From the opening and closing of the morphological operations, Wan [11] improved the robustness of Otsu’s algorithm. In this direction, we present a literature review of the individual contributions in this area.
In this aspect, regarding biometric data, such as fingerprint and face data, NS and thresholding play important roles. Our objective is to utilize NS, with its membership functions, to produce better outcomes by analyzing the data in three ways. Each NS domain image contains more features than the classical features of the images, which is advantageous in making decisions in scenarios where indeterminacy exists. Since biometric data contains both symmetrical and asymmetrical types of images, it is essential to analyze both aspects. In this study, we limited our focus to fingerprint and facial images. Our aim is to take on the responsibility of implementing NS overset and underset concepts in the thresholding process. This method will threshold images by dual or triple-step conditions. We use the concept of thresholding in neutrosophic for face and fingerprint images because our goal is to integrate these concepts. The remaining sections of this article are organized as follows: Section 2 presents the preliminaries, Section 3 explains the proposed method, and Section 4 summarizes the findings and discusses the results obtained. Our conclusions and the scope of the article’s future work are presented in Section 5.
2. Preliminaries
Definition 1.
Let X be a universe of discourse, with a generic element in X denoted by x, then a neutrosophic set, A, is an object with form [12]
where the functions define, respectively, the degree of truth, the degree of indeterminacy, and the degree of the falsity of the element to the set condition.
Definition 2
([13]). Let X be a space of points (objects), with a generic element in X denoted byx. A single-valued neutrosophic set A in X is characterized by the truth membership function , indeterminacy membership function , and falsity membership function . For each point, x in X, . When X is continuous, SVNS A can be written as
when X is discrete, SVNS A can be written as
Definition 3.
A neutrosophic image is characterized by neutrosophic components, which are , where are the pixel values of the image. Neutrosophic images are universally approached with gray-level images. Therefore, the neutrosophic image set is defined as [14]
In general, mean values and standard deviations of the image are taken as truth and indeterminacy memberships. The image transformation pixels are made by the following formulae
where is the pixel mean in the region and w is generally
Definition 4
(Single-valued neutrosophic overset [15]). Single-valued neutrosophic overset A is defined as , such that there exists at least one element in A that has at least one neutrosophic component that is > 1, and no element has neutrosophic components that are < 0.
Definition 5
(Single-valued neutrosophic overset [15]). Single-valued neutrosophic underset A is defined as , such that there exists at least one element in A that has at least one neutrosophic component that is < 0, and no element has neutrosophic components that are > 1.
The performance measured [16]
where is the background of the ground truth image, denotes the foreground of the ground truth image, represents the background area pixels, denotes the foreground area pixels in the image, and is the cardinality of the set.
3. Proposed Method
In this article, we modify the overset and underset concepts for image thresholding. While using this, the performance of the neutrosophic and a single-valued neutrosophic is more similar. The article uses neutrosophic sets to address the basic concepts.
Definition 6.
Let be an image, then the zero padding for neutrosophic image is defined with respect to h as follows:
where , and .
Definition 7.
Let be an image, then the one padding for the neutrosophic image is defined with respect to h as
where , and .
Definition 8.
Let be an image, then the set of arithmetic mean μ values for h of the image is defined as
where and
Definition 9.
Let be an image, then the set of the standard deviation σ values for h (of the image) is defined as
where and
Figure 1 displays the truth, indeterminacy, and falsity memberships for the Lena image. Figure 1b–d exhibit the corresponding memberships for truth, indeterminacy, and falsity, respectively. Through membership figures, readers can recognize the indeterminacy peaks that may affect the system to threshold images. On the other hand, the indeterminacy peaks that correspond to truth and falsity can also impair one’s ability to make decisions. This is why we present various threshold methods in this article.
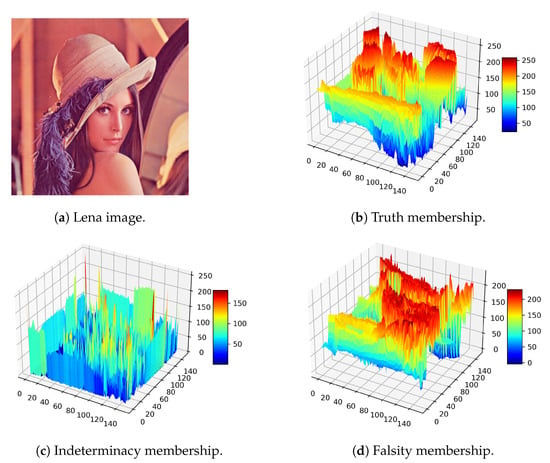
Figure 1.
Neutrosophic membership visualization, Lena image source: https://en.wikipedia.org/wiki/File:Lenna_(test_image).png (accessed on 14 December 2022).
3.1. Neutrosophic Overset Global Threshold
Let be an image, then the neutrosophic components of A represent with respect to h.
Definition 10
( Overset). The neutrosophic overset of A based on memberships for the threshold value α satisfies the following conditions
- i.
- and
- ii.
where
then the binary image for the global threshold value α is defined as
Definition 11
( Overset). The neutrosophic overset of A based on memberships for the threshold value α satisfies the following conditions
- i.
- and
- ii.
then the binary image for the global threshold value α is defined as
Definition 12
( Overset). The neutrosophic overset of A based on memberships for the threshold value α satisfies the following conditions
- i.
- ii.
- iii.
then the binary image for the global threshold value α is defined as
The article observes how the accuracy tends to vary with the alpha values in Figure 2. Here, this article considers three different types of ground truth values: binary using the OTSU method, normalization, and the minimax normalization method. These metrics are computed for neutrosophic overset thresholds based on ; Figure 2a, Figure 2b, and Figure 2c.
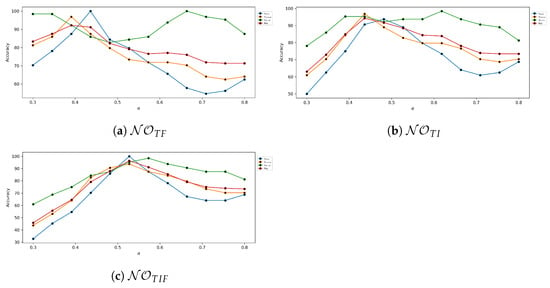
Figure 2.
Neutrosophic overset global threshold accuracy analysis for various values.
3.2. Neutrosophic Overset Adaptive Threshold
Let be an image, then the neutrosophic components of A represent with respect to h.
Definition 13
( Overset). The neutrosophic overset of A based on memberships for the adaptive threshold satisfies the following conditions
- i.
- and
- ii.
- and
where
The adaptive image over of A is
then the binary image over of A is
Definition 14
( Overset). The neutrosophic overset of A based on memberships for the adaptive threshold satisfies the following conditions:
- i.
- and
- ii.
- and
The adaptive image over of A is
then the binary image over of A is
Definition 15
( Overset). The neutrosophic overset of A based on memberships for the adaptive threshold satisfies the following conditions:
- i.
- or
- ii.
- or
The adaptive image over of A is
then the binary image over of A
The comparison between the mean adaptive threshold and the Gaussian adaptive threshold for the multivariate normal distribution is depicted in Figure 3. Figure 3a–f exhibit the mean adaptive, Gaussian adaptive, mean adaptive, mean adaptive, and Gaussian adaptive, respectively.
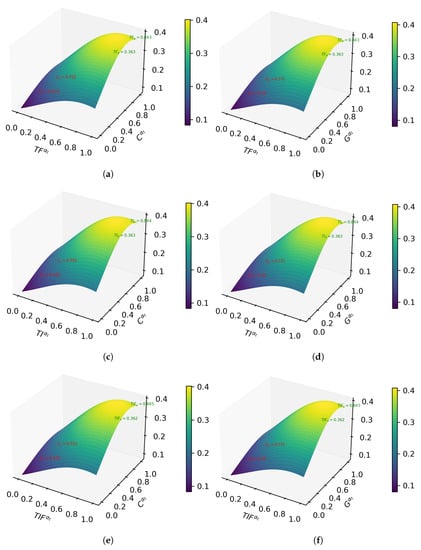
Figure 3.
Neutrosophic overset adaptive thresholding method. (a) c-means method, (b) Gaussian method, (c) c-means method, (d) Gaussian method, (e) c-means method and (f) Gaussian method. Sudoku image source: https://www.fatalerrors.org/a/opencv-threshold-segmentation.html (accessed on 15 December 2022).
3.3. Neutrosophic Underset Global Threshold
Let be an image, then the single-valued neutrosophic components of A represent with respect to h.
Definition 16
( Underset). The single-valued neutrosophic underset of A based on memberships for the threshold value α satisfies the following conditions
- i.
- and
- ii.
where
then the binary image for the global threshold value α is defined as
Definition 17
( Underset). The neutrosophic underset of A based on memberships for the threshold value α satisfies the following conditions
- i.
- and
- ii.
then the binary image for the global threshold value α is defined as
Definition 18
( Underset). The neutrosophic underset of A based on memberships for the threshold value α satisfies the following conditions
- i.
- ii.
- iii.
then the binary image for the global threshold value α is defined as
The article demonstrates how the alpha values in Figure 4 tend to alter how accurate the neutrosophic underset theory is. The accuracy study for this neutrosophic underset of the global threshold takes into consideration Lena’s image.
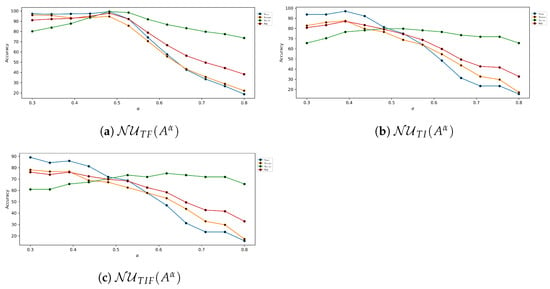
Figure 4.
Neutrosophic underset global threshold accuracy analysis for various values.
3.4. Neutrosophic Underset Adaptive Threshold
Let be an image, then the single-valued neutrosophic components of A represent with respect to h.
Definition 19
( Underset). The neutrosophic underset of A based on memberships for the adaptive threshold satisfies the following conditions
- i.
- and
- ii.
- and
where
The adaptive image over of A is
then the binary image over of A
Definition 20
( Underset). The neutrosophic overset of A based on memberships for the adaptive threshold satisfies the following conditions
- i.
- and
- ii.
- and
The adaptive image over of A is
then the binary image over of A
Definition 21
( Underset). The neutrosophic underset of A based on memberships for the adaptive threshold satisfies the following conditions
- i
- or
- ii
- or
The adaptive image over of A is
then the binary image over of A
The analog method of the overset adaptive for the multivariate distribution is contrasted with the neutrosophic underset adaptive threshold in Figure 5.
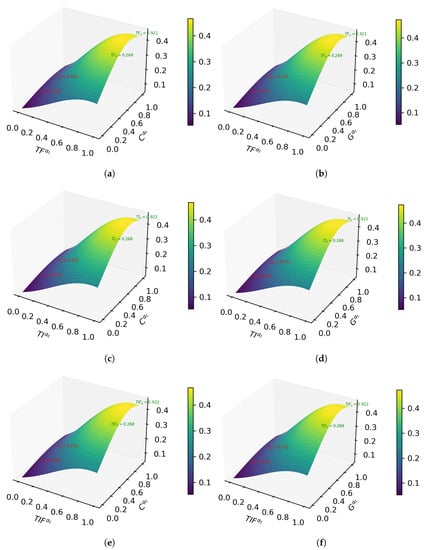
Figure 5.
Neutrosophic underset adaptive thresholding method. (a) c-means method, (b) Gaussian method, (c) c-means method, (d) Gaussian method, (e) c-means method and (f) Gaussian method.
The accuracy of a sample image (in comparison with the neutrosophic global and adaptive threshold approaches) is presented in Table 1 and Table 2, respectively.

Table 1.
Accuracy of the global threshold method for .

Table 2.
Accuracy of the adaptive threshold method based on .
4. Results and Discussion
We used hardware that supports the 11th Gen Intel(R) Core(TM) i5-1135G7 @ 2.40GHz 2.42 GHz with 16 GB of RAM capacity for the analysis.
As previously discussed, symmetrical images are present on authenticated documents, such as passports, driver’s licenses, voter identification cards, Aadhar cards, etc. However, a face cannot always be symmetrical. Some faces may even be asymmetric when they have wounds or natural misalignments. Due to the patterns of the structures, symmetric fingerprint images are very uncommon. Likewise, biometric images include both symmetric and asymmetric formation images. Therefore, the proposed methods must cooperate efficiently in both scenarios.
The sample images for each method of visualization are explicit in Figure 6. The original image is displayed in the first column of the figure, followed by , , , , , global and adaptive thresholds, in that order. Similarly, the symmetric image outputs of the proposed thresholding methods are also displayed in Figure 7. The threshold image is validated using average accuracy, recall, and f1 score. The ground truth for the global threshold is determined by normalization, minimax, and Otsu with binary, while the adaptive threshold is based on Gaussian and mean threshold.

Figure 6.
Proposed outputs of the sample images.
Figure 7.
Proposed output of the symmetric sample image. Original image source: https://en.wikipedia.org/wiki/File:Braus_1921_395.png (accessed on 28 January 2023).
The article will first investigate biometric data collected from different databases, such as FVC 2000 [17], FVC 2002- [18], FVC 2004 [19], SD302a [20], SD302d [21], and Soco [22]. A variety of sensor datasets, including low-cost optical sensors, low-cost capacitive sensors, and optical sensors are included in the dataset FVC 2000. Similar to the previous dataset, FVC 2002 includes an optical sensor, a capacitive sensor, and a synthetic fingerprint generation type that generates fingerprint images that are 110 fingers wide with 8 impressions (finger deep). The FVC 2004 dataset also contains updated versions of the optical sensor “V300”, optical sensor “U4000”, thermal sweeping sensor “FCD4B14CB”, and synthetic fingerprint generation version 3. The databases are significantly more challenging to use than the FVC2002 and FVC2000 ones due to the intentional perturbations that are produced by data. The NIST datasets (SD302a and SD302d) were used to generate activity scenarios where subjects would probably leave their fingerprints on various objects. The activities and objects were selected to simulate the types of items frequently used in actual law enforcement casework and different latent print development techniques. The analysis was made from 18 sample images with various types of datasets.
Table 3 lists the performance accuracy of each approach for the considered fingerprint data. According to the data in the table, the following technique is advised for each dataset: FVC 2000—, FVC 2002—, , FVC 2004—, SD302a—, , SD302d—, Soco—, for global threshold; FVC 2000—, FVC 2002—, , FVC 2004—, SD302a -, SD302d—, Soco— for the adaptive threshold. According to the threshold type, the best method for the global threshold is , and the best method for the adaptive thresholds is , as shown Figure 8. Overall, is preferable to other methods for fingerprint images.

Table 3.
Accuracy of fingerprint data.
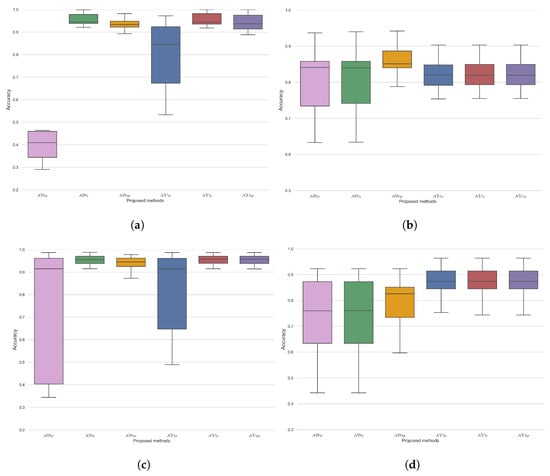
Figure 8.
Method-wise analysis for the global and adaptive threshold for fingerprint and facial image data; (a) global method for fingerprint data, (b) adaptive method for fingerprint data, (c) global method for face data, (d) adaptive method for face data.
Based on our data, we have found that performs poorly in comparison to other global threshold methods. In a set-by-set comparison, the underset method is recommended for the global threshold. In comparison to the other methods, all underset methods performed poorly. Even though the set-wise analysis favored the underset methods, the overset methods dominated the adaptive threshold. The majority of fingerprint images were asymmetrical, so choosing one of the suggested threshold methods would not have made much of a difference. This denotes that when using a symmetry analysis, it is meaningless as to whether an image is symmetric or asymmetric if it is a fingerprint image. Instead, we use the global threshold method by using neutrosophic underset approaches. The sample image for the SD302a dataset contained more fingerprint patterns than the background’s brightness level. Furthermore, it had a few shades of existence where intensity measurements were missing. The image in the dataset with the highest accuracy had more shades or missing measurements. The neutrosophic overset method is preferable in cases where the image contains missing data, especially for the SD302a dataset. The samples in the SD302b dataset, which were completely covered by patterns, performed remarkably well in the global threshold technique’s neutrosophic underset method and overset method. However, the overset method outperformed the underset accuracy in the adaptive approach. With an equivalently bright background, the Soco dataset sample images contained more dark shades. This dataset performed similar to SD302b when using the global threshold method. The overset method was more advantageous in the adaptive case than the underset method. FVC2000 was completely distinct from previous image types because of the gray features that make fingerprint images. These samples progressed well toward both global threshold tasks. The underset approach in the adaptive method aimed to attain the same level of accuracy. Visually, it is evident that the FVC 2002 and 2004 samples are of a similar type, with some ambiguous fingerprint patterns mixed in with dark shading noise. Undersets performed extraordinarily well in global thresholding for both datasets. However, oversets in the adaptive methods had some noticeable accuracy. The results indicate that the NOTF method typically performs poorly in some scenarios in terms of the global threshold.
The images we used for the facial image analysis were from Caltech Web Faces [23], MIT-CBCL [24], RF (real fake) data [25] NIST-MEDS (Multiple Encounter Dataset)-I [26], and NIST- MEDS-II [27]. Google Image Search was used to collect images of people for the Caltech Web Faces dataset by attempting to enter frequently given names. The dataset is accompanied by a ground truth file that provides the positions of the centers of each frontal face’s eyes, nose, and mouth. It comprises a total of 10,524 human faces in various scenarios and resolutions, including portrait photos and groups of people. In the MIT-CBCL database, there are ten faces. These data contain high-resolution images of faces in frontal, half-profile, and profile views, along with fake images made from 3D head models made by fitting a morphable model. In MEDS-I and MEDS-II, the resolution and image sizes vary significantly. The MEDS data offer instances of repeated observations of the same person over time and include people of different ages; the baseline performance benchmark for face detection was carried out by the MITRE Corporation using Google Picasa. MEDS-I and MEDS-II are intended to promote research and assist the NIST multiple biometric evaluations. The MEDS-II update roughly doubles the number of images and expands the metadata support research and evaluation of pose conformance and local facial features. These data are available to assist the FBI and partner organizations in developing face recognition tools, techniques, and procedures in order to support next-generation identification (NGI), forensic comparison, training, analysis, facial image conformance standards, as well as inter-agency exchange standards. The MITRE Corporation developed MEDS-I and MEDS-II in the FBI Data Analysis Support Laboratory (DASL). Facial analysis was made from 15 sample images with various types of datasets.
Images of faces typically differed from those of fingerprints. Multiple objects, such as ears, eyes, noses, and facial expressions, were not present in fingerprint images. NS must perform tasks involving face data thresholding in multi-object images. In the global threshold method for the considered face, the data from Table 4 for CWF—, for CBCL and RF—except , for MEDS-I—, , and for MEDS-II—, , and perform exceptionally well. Typically, is preferable for global face data thresholds. While focusing on the adaptive approach for CWF—, , for CBCL—all underset methods , , , for RF—, for MEDS-I and II , , provide impressive results for face data. In terms of general performances, both the and methods perform admirably; however, regarding the error rate, the method is preferable for adaptive purposes; is the best possible method that combines global and adaptive approaches for the considered face dataset. For facial images, a symmetrical analysis is possible, so using symmetrically based images for analysis makes sense. In the CW, CBCL, and MEDS-II datasets, symmetric images perform better than asymmetric images for the neutrosophic global threshold. In this type of threshold, only MEDS-I under-performs. The RF only contains asymmetric images. Furthermore, the adaptive threshold method outperforms symmetrical facial images. As the article suggests, symmetrical facial images perform much better than asymmetrical ones in the global and adaptive thresholds. Readers can also validate this via Figure 8. In a set-by-set comparison of the global and adaptive techniques, the underset method models outperform the overset method. performed less efficiently in both global and adaptive approaches compared to other methods. To better assess the global performance of these methods, when an image contains multiple objects, the adaptive method is the best solution. The CWF sample data consisted of facial images, facial images with text, and multi-object faces with text existences, which were analyzed. Except for TF-based approaches, the other techniques used to calculate the global threshold have good levels of accuracy. However, when the TF method was switched to an adaptive approach, it also overcame its flaws, and all of the suggested methods produced positive results. Comparatively, the global threshold performs very well compared to the adaptive method in most of the scenarios. The CBCL samples had bright backgrounds and covered faces. In both global and adaptive approaches, the accuracy levels of all proposed methods were achieved at around . The results revealed that all methods performed well and more similarly when the image did not contain multi-objects or bright backgrounds. Images with expression scenarios were included in the RF sample data. Expression images passed the global threshold manner successfully above However, it would have been challenging to reach with the adaptive method. As a result, when the value is well-known, a global threshold is preferable. The MEDS-I and II datasets, which contain various background facial images with or without objects, are similar. In an environment with global thresholds, MEDS-I performed better than MEDS-II. MEDS-I’s global method was not overcome by MEDS-I in the adaptive concept but the MEDS-II adaptive method’s accuracy overcame the MEDS-II global method.

Table 4.
Accuracy of face data.
5. Conclusions
This research, expected to demonstrate the effectiveness of the neutrosophic set concept in handling indeterminacy challenges, can also be applied to image data. We explored twelve innovative approaches for global and adaptively thresholding images. Following the procedures, these techniques reveal various image patterns. With the help of these multiple image patterns, it might be possible to overcome challenges in the threshold task. The analysis of biometric image data, such as fingerprint and face data, was considered for the threshold task. Symmetrical and asymmetrical approaches were also investigated. As per the results, the symmetrical concept was ineffective for fingerprint images but effective for facial images. Asymmetric faces typically produced worse results than symmetric ones. Face data scored as the best score and fingerprint images reached maximum accuracy. Through this study, we found excellent quantitative results. The proposed method was used mainly for the biometrics dataset. The methods examined different types of fingerprint and face data, such as sensor type, background intensity, and bright and dark shades in the images; each dataset was unique from the others. Every method, except for , performed with greater than accuracy in the majority of global threshold cases. The method achieved accuracy for fingerprint images depending on the data. When there were missing measurements in the image and shades presented on both and , the latter method had an advantage. We obtained lower adaptive accuracy values when compared to global. The precise alpha value is essential for the global threshold. The use of adaptive techniques is preferable when the alpha is unknown. The proposed methods used the mean intensity value of the local blocks to evaluate the alpha values. Here, the alpha values vary according to the image block. The advantage of the method is that it functions well when an image has multiple objects in it. Whenever very few errors occurred, these methods achieved a maximum of accuracy for fingerprint images. The difference between the classical threshold and the proposed threshold methods was analyzed based on their ability to handle indeterminacy. The proposed methods were also tested on facial images containing multiple objects; all proposed methods except for the method yielded positive results in the global thresholding approach. The CBCL dataset had a maximum face data accuracy of . When comparing the overset and underset, the underset was the most preferable. The MEDS-II data for adaptive estimation received , and the underset method was recommended for the image threshold. The overall findings were that the -based overset and underset lacked accuracy. It would be challenging to improve the better results. Feature segmentation-based techniques have the potential to improve biometric recognition by enabling gender, age, and expression detection, among other things. Furthermore, these techniques could be applied to various types of image data, including medical images and animal images. If these methods prove to be effective in all domains, they could become the most impactful image pre-processing technique. Our primary goal is to implement these techniques in all segments of image analysis. The proposed methods will be applied to binary image classification for various types of image datasets in the future.
Author Contributions
Concept, methodology, validation: V.D.; manuscript preparation, enhancement, discussions: E.D. All authors have read and agreed to the published version of the manuscript.
Funding
The APC was funded by the Vellore Institute of Technology.
Institutional Review Board Statement
Not applicable.
Informed Consent Statement
Not applicable.
Data Availability Statement
The data that support the findings of this study are openly available. The data sources are mentioned in Section 4.
Acknowledgments
Authors would like to express our appreciation to the reviewers for their valuable and constructive suggestions during the development of this research work.
Conflicts of Interest
The authors declare no conflict of interest.
Abbreviations
| Abbreviations/Symbols | Definition |
| h | Block size |
| T | Truth membership |
| I | Indeterminacy membership |
| F | Falsity membership |
| Zero padding | |
| One padding | |
| Arithmetic mean function | |
| Standard deviation function | |
| Performance measure | |
| Global threshold value | |
| Adaptive threshold value | |
| Image with coordinates with m rows and n columns | |
| -based neutrosophic overset global threshold of image A | |
| -based neutrosophic overset global threshold of image A | |
| -based neutrosophic overset global threshold of image A | |
| -based neutrosophic overset adaptive threshold of image A | |
| -based neutrosophic overset adaptive threshold of image A | |
| -based neutrosophic overset adaptive threshold of image A | |
| -based neutrosophic underset global threshold of image A | |
| -based neutrosophic underset global threshold of image A | |
| -based neutrosophic underset global threshold of image A | |
| -based neutrosophic underset adaptive threshold of image A | |
| -based neutrosophic underset adaptive threshold of image A | |
| -based neutrosophic underset adaptive threshold of image A |
References
- Jha, S.; Kumar, R.; Priyadarshini, I.; Smarandache, F.; Long, H.V. Neutrosophic image segmentation with dice coefficients. Measurement 2019, 134, 762–772. [Google Scholar] [CrossRef]
- Yuan, Y.; Ren, Y.; Liu, X.; Wang, J. Approach to image segmentation based on interval neutrosophic set. Numer. Algebr. Control. Optim. 2020, 10, 1–11. [Google Scholar] [CrossRef]
- Song, S.; Jia, Z.; Yang, J.; Kasabov, N.K. A fast image segmentation algorithm based on saliency map and neutrosophic set theory. IEEE Photonics J. 2020, 12, 1–6. [Google Scholar] [CrossRef]
- Dhar, S.; Kundu, M.K. Accurate multi-class image segmentation using weak continuity constraints and neutrosophic set. Appl. Soft Comput. 2021, 112, 107759. [Google Scholar] [CrossRef]
- Ji, B.; Hu, X.; Ding, F.; Ji, Y.; Gao, H. An effective color image segmentation approach using superpixel-neutrosophic C-means clustering and gradient-structural similarity. Optik 2022, 260, 169039. [Google Scholar] [CrossRef]
- Yang, W.; Wang, Z.; Zhang, B. Face recognition using adaptive local ternary patterns method. Neurocomputing 2016, 213, 183–190. [Google Scholar] [CrossRef]
- Zhou, J. Research of SWNMF with New Iteration Rules for Facial Feature Extraction and Recognition. Symmetry 2019, 11, 354. [Google Scholar] [CrossRef]
- Alagarsamy, S.B.; Murugan, K. Multimodal of ear and face biometric recognition using adaptive approach runge–kutta threshold segmentation and classifier with score level fusion. Wirel. Pers. Commun. 2022, 124, 1061–1080. [Google Scholar] [CrossRef]
- Abaza, A.; Ross, A. Towards understanding the symmetry of human ears: A biometric perspective. In Proceedings of the 2010 Fourth IEEE International Conference on Biometrics: Theory, Applications and Systems (BTAS), Washington, DC, USA, 27–29 September 2010; pp. 1–7. [Google Scholar]
- Das, D. A fingerprint segmentation scheme based on adaptive threshold estimation. In Proceedings of the 2018 11th International Congress on Image and Signal Processing, Biomedical Engineering and Informatics (CISP-BMEI), Beijing, China, 13–15 October 2018; pp. 1–6. [Google Scholar]
- Wan, G.C.; Xu, H.; Zhou, F.Z.; Tong, M.S. Improved Fingerprint Segmentation Based on Gradient and Otsu’s Method for Online Fingerprint Recognition. In Proceedings of the 2019 PhotonIcs & Electromagnetics Research Symposium-Spring (PIERS-Spring), Rome, Italy, 17–20 June 2019; pp. 1050–1054. [Google Scholar]
- Smarandache, F. Neutrosophy: Neutrosophic Probability, Set, and Logic: Analytic Synthesis & Synthetic Analysis; American Research Press: Pasadena, CA, USA, 1998. [Google Scholar]
- Smarandache, F. Multispace & Multistructure. Neutrosophic Transdisciplinarity (100 Collected Papers of Sciences), Volume IV. 2010. Available online: https://digitalrepository.unm.edu/math_fsp/39/ (accessed on 27 May 2022).
- Guo, Y.; Cheng, H.D.; Zhang, Y. A new neutrosophic approach to image denoising. New Math. Nat. Comput. 2009, 5, 65. [Google Scholar] [CrossRef]
- Smarandache, F. Neutrosophic Overset, Neutrosophic Underset, and Neutrosophic Offset. Similarly for Neutrosophic Over-/Under-/Off-Logic, Probability, and Statistics. Infinite Study. 2016. Available online: https://digitalrepository.unm.edu/math_fsp/26 (accessed on 20 October 2022).
- Tizhoosh, H.R. Image thresholding using type II fuzzy sets. Pattern Recognit. 2005, 38, 2363–2372. [Google Scholar] [CrossRef]
- Maio, D.; Maltoni, D.; Cappelli, R.; Wayman, J.L.; Jain, A.K. FVC2000: Fingerprint verification competition. IEEE Trans. Pattern Anal. Mach. Intell. 2002, 24, 402–412. [Google Scholar] [CrossRef]
- Maio, D.; Maltoni, D.; Cappelli, R.; Wayman, J.L.; Jain, A.K. FVC2002: Second fingerprint verification competition. In Proceedings of the 2002 International Conference on Pattern Recognition, Quebec City, QC, Canada, 11–15 August 2002; Volume 3, pp. 811–814. [Google Scholar]
- Maio, D.; Maltoni, D.; Cappelli, R.; Wayman, J.L.; Jain, A.K. FVC2004: Third fingerprint verification competition. In Biometric Authentication: First International Conference, ICBA 2004, Hong Kong, China, 15–17 July 2004; Springer: Berlin/Heidelberg, Germany, 2004; pp. 1–7. [Google Scholar]
- Fiumara, G.P.; Flanagan, P.A.; Grantham, J.D.; Ko, K.; Marshall, K.; Schwarz, M.; Tabassi, E.; Woodgate, B.; Boehnen, C. NIST Special Database 302: Nail to Nail Fingerprint Challenge. 2019. Available online: https://www.nist.gov/publications/nist-special-database-302-nail-nail-fingerprint-challenge (accessed on 5 December 2022).
- Fiumara, G.; Schwarz, M.; Heising, J.; Peterson, J.; Flanagan, P.A.; Marshall, K. NIST Special Database 302: Supplemental Release of Latent Annotations. 2021. Available online: https://www.nist.gov/publications/nist-special-database-302-supplemental-release-latent-annotations (accessed on 5 December 2022).
- Shehu, Y.I.; Ruiz-Garcia, A.; Palade, V.; James, A. Sokoto coventry fingerprint dataset. arXiv 2018, arXiv:1807.10609. [Google Scholar]
- Li, F.-F.; Andreeto, M.; Ranzato, M.; Perona, P. Caltech 101 (1.0). In CaltechDATA; Computational Vision Group, California Institute of Technology: London, ON, Canada, 2022. [Google Scholar] [CrossRef]
- Weyrauch, B.; Heisele, B.; Huang, J.; Blanz, V. Component-based face recognition with 3D morphable models. In Proceedings of the 2004 Conference on Computer Vision and Pattern Recognition Workshop, Washington, DC, USA, 27 June–2 July 2004; p. 85. [Google Scholar]
- Nam, S.; Oh, S.W.; Kang, J.Y. Real and Fake Face Detection. January 2019. Available online: https://www.kaggle.com/datasets/ciplab/real-and-fake-face-detection (accessed on 24 November 2022).
- Watson, C.I. Multiple Encounter Dataset I (MEDS-I), NIST Interagency/Internal Report (NISTIR); National Institute of Standards and Technology: Gaithersburg, MD, USA, 2010. Available online: https://tsapps.nist.gov/publication/get_pdf.cfm?pub_id=904685 (accessed on 24 November 2022).
- Founds, A.; Orlans, N.; Genevieve, W.; Watson, C. NIST Special Databse 32—Multiple Encounter Dataset II (MEDS-II), NIST Interagency/Internal Report (NISTIR); National Institute of Standards and Technology: Gaithersburg, MD, USA, 2011. Available online: https://tsapps.nist.gov/publication/get_pdf.cfm?pub_id=908383 (accessed on 24 November 2022).
Disclaimer/Publisher’s Note: The statements, opinions and data contained in all publications are solely those of the individual author(s) and contributor(s) and not of MDPI and/or the editor(s). MDPI and/or the editor(s) disclaim responsibility for any injury to people or property resulting from any ideas, methods, instructions or products referred to in the content. |
© 2023 by the authors. Licensee MDPI, Basel, Switzerland. This article is an open access article distributed under the terms and conditions of the Creative Commons Attribution (CC BY) license (https://creativecommons.org/licenses/by/4.0/).

