4. Algorithm for Calculating Stego-Areas
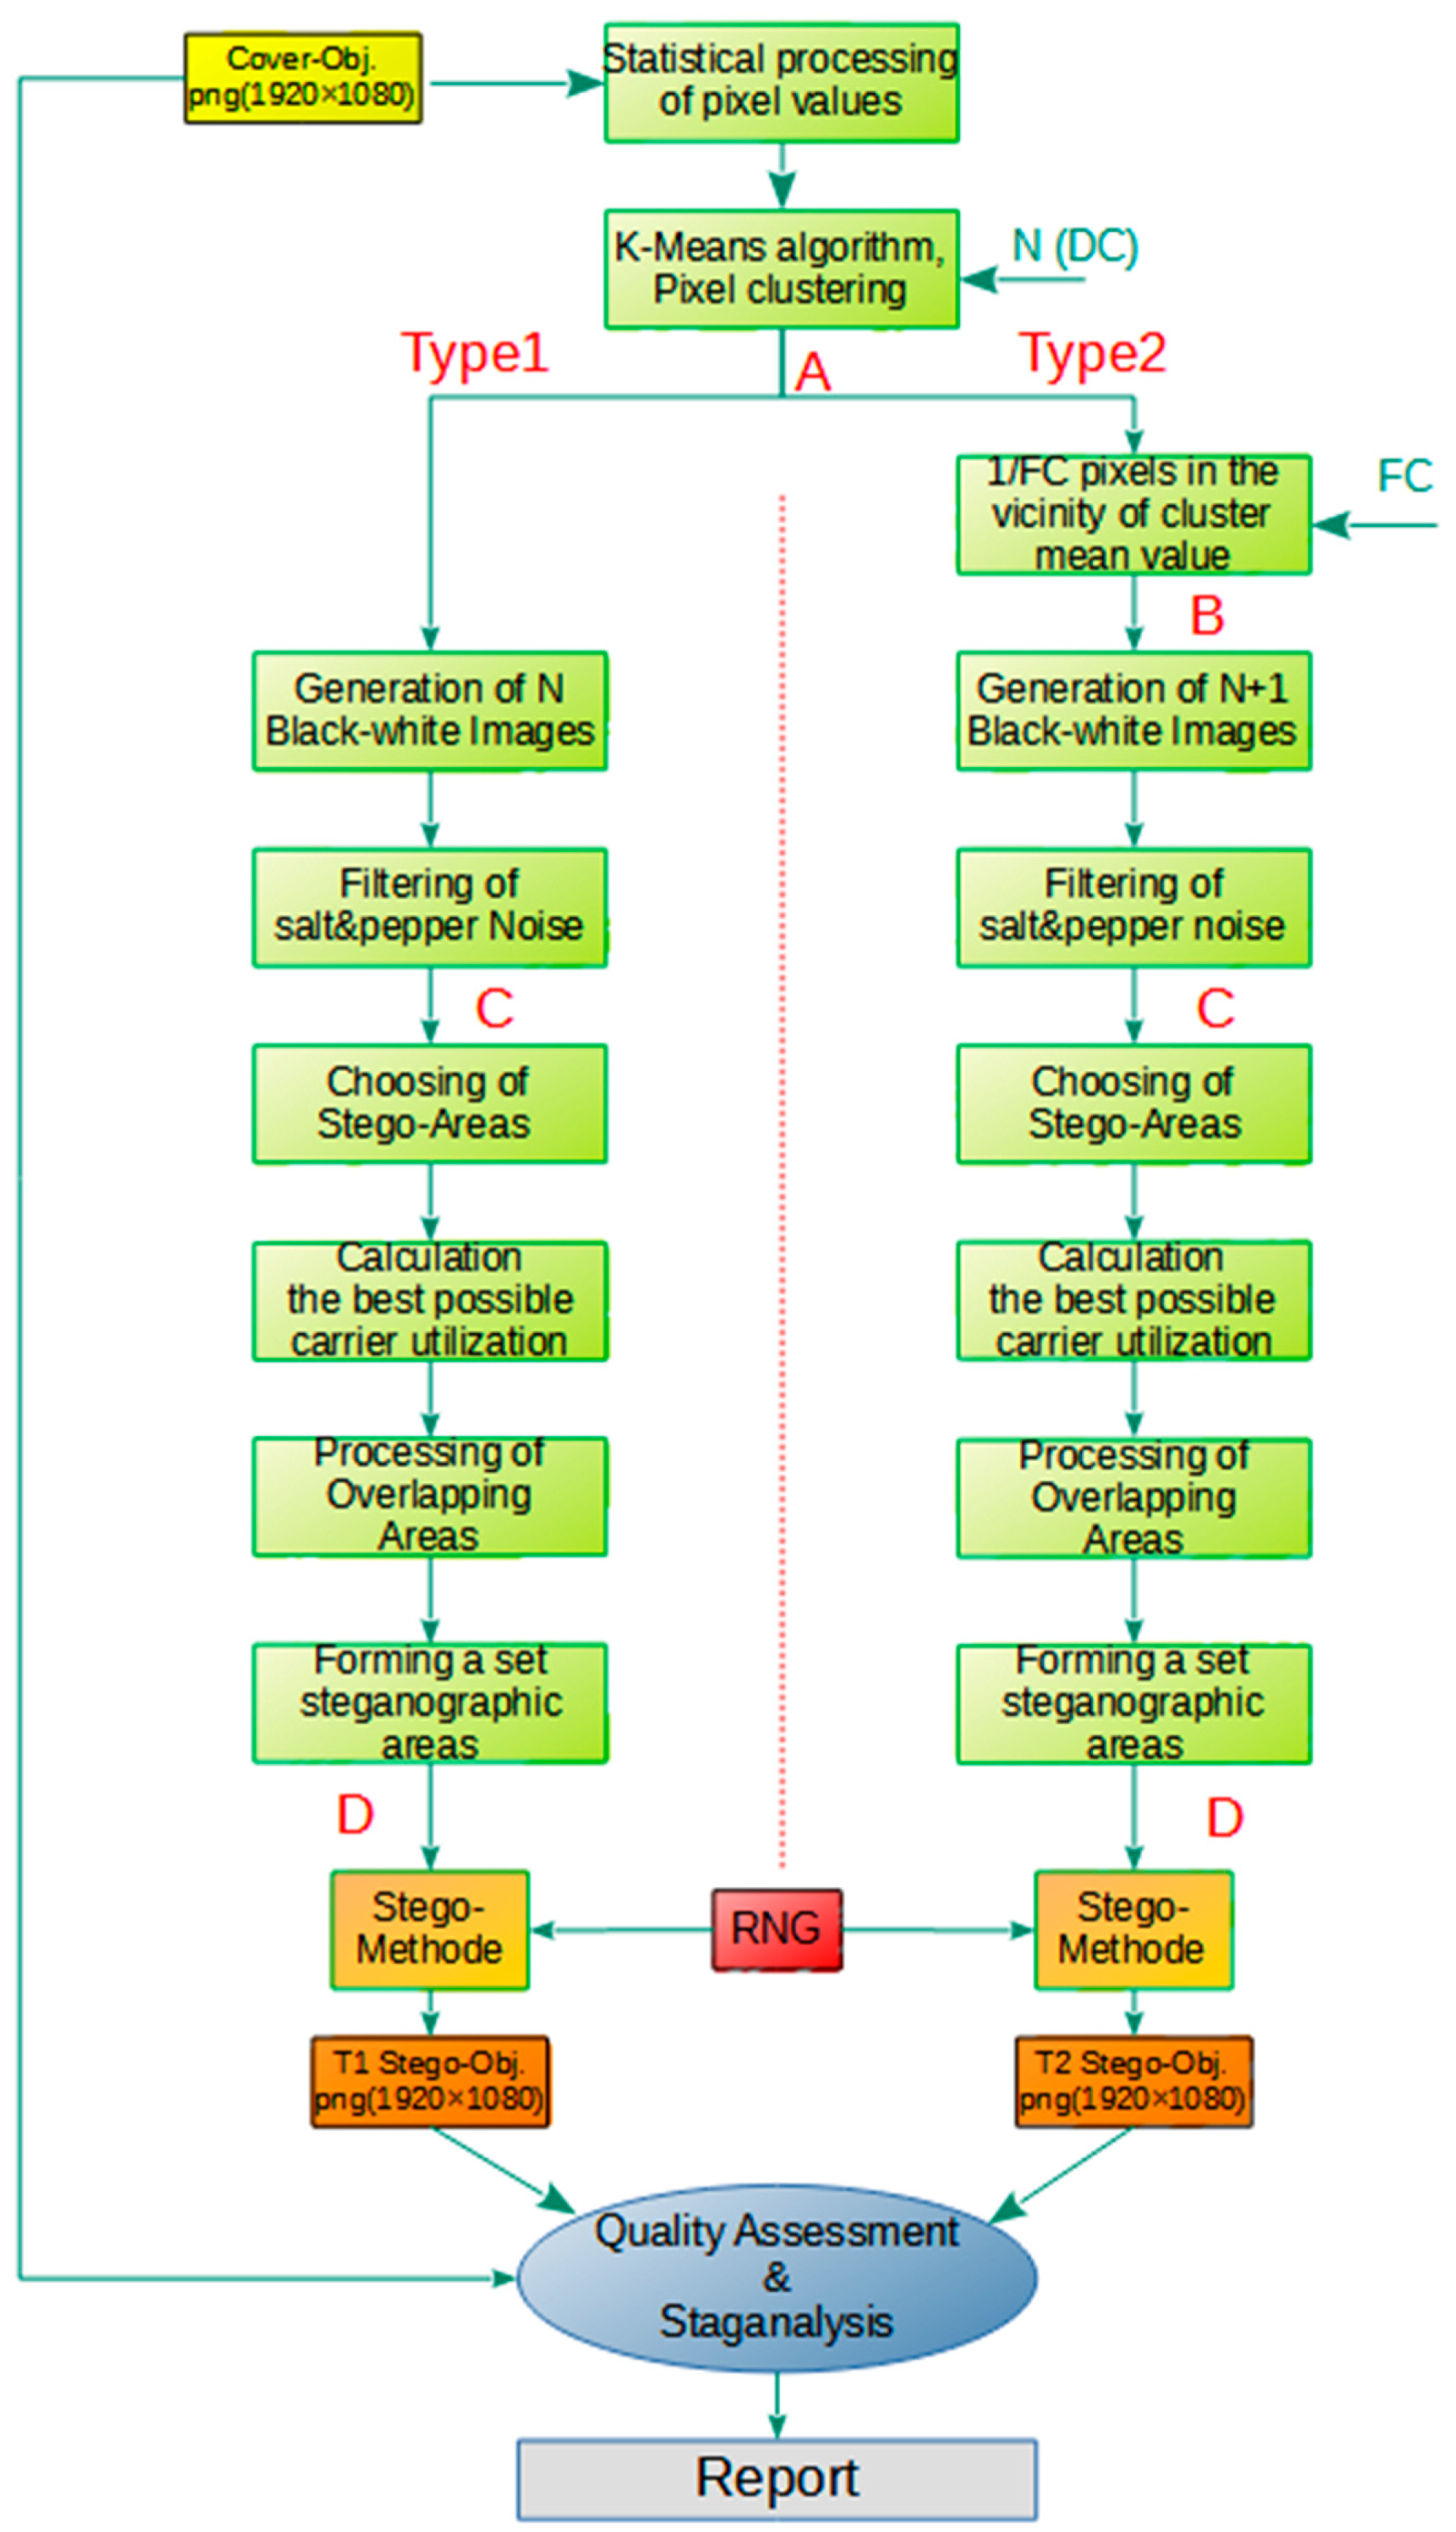
Figure 2 shows a detailed block diagram of the system. The colors of individual parts of the algorithm correspond to the colors shown in
Figure 1. In this section, the focus is on the part of the system that deals with calculation of the stego-areas, and those parts of the system are shown in green on the block diagram.
An iterative K-means algorithm is performed over the decimal values of the pixels of the input file in png format, on all three channels (RGB), which results in the clustering of all pixels into N clusters, where N is the input parameter of the algorithm (the number of dominant colors). The iterative K-means algorithm is performed in the following way:
Step 1: Determining the mean value of all pixels (A0);
Step 2: Division of all pixels into two new clusters (C1 and C2) by the K-means algorithm and calculation of new mean values (A1 and A2), which we consider to be the dominant colors, for the newly formed clusters;
Step 3: If the input value is N > 2, an analysis is made of each of the clusters C1 and C2; thus, it is estimated in which cluster there are greater deviations from the mean values of A1 and A2. Suppose that a cluster C2 is selected that has larger pixel deviations than the mean of A2. The K-means algorithm is performed again on the selected cluster C2; then, two new clusters are created that complement the cluster C2. We will call the new clusters C21 and C22 and the new mean values A21 and A22 are calculated. Now, we have a total of three clusters C1, C21 and C22 as well as their three mean values A1, A21 and A22, which we consider the dominant colors;
Step 4: If N > 3, we look at the three existing clusters C1, C21 and C22 and, in the same way as in step 3, we choose which of the existing clusters will be divided into two new ones, while calculating the new mean values. As a result, we obtain four clusters with four mean values.
For larger values of the input parameter N, the algorithm is performed iteratively as explained in steps 3 and 4.
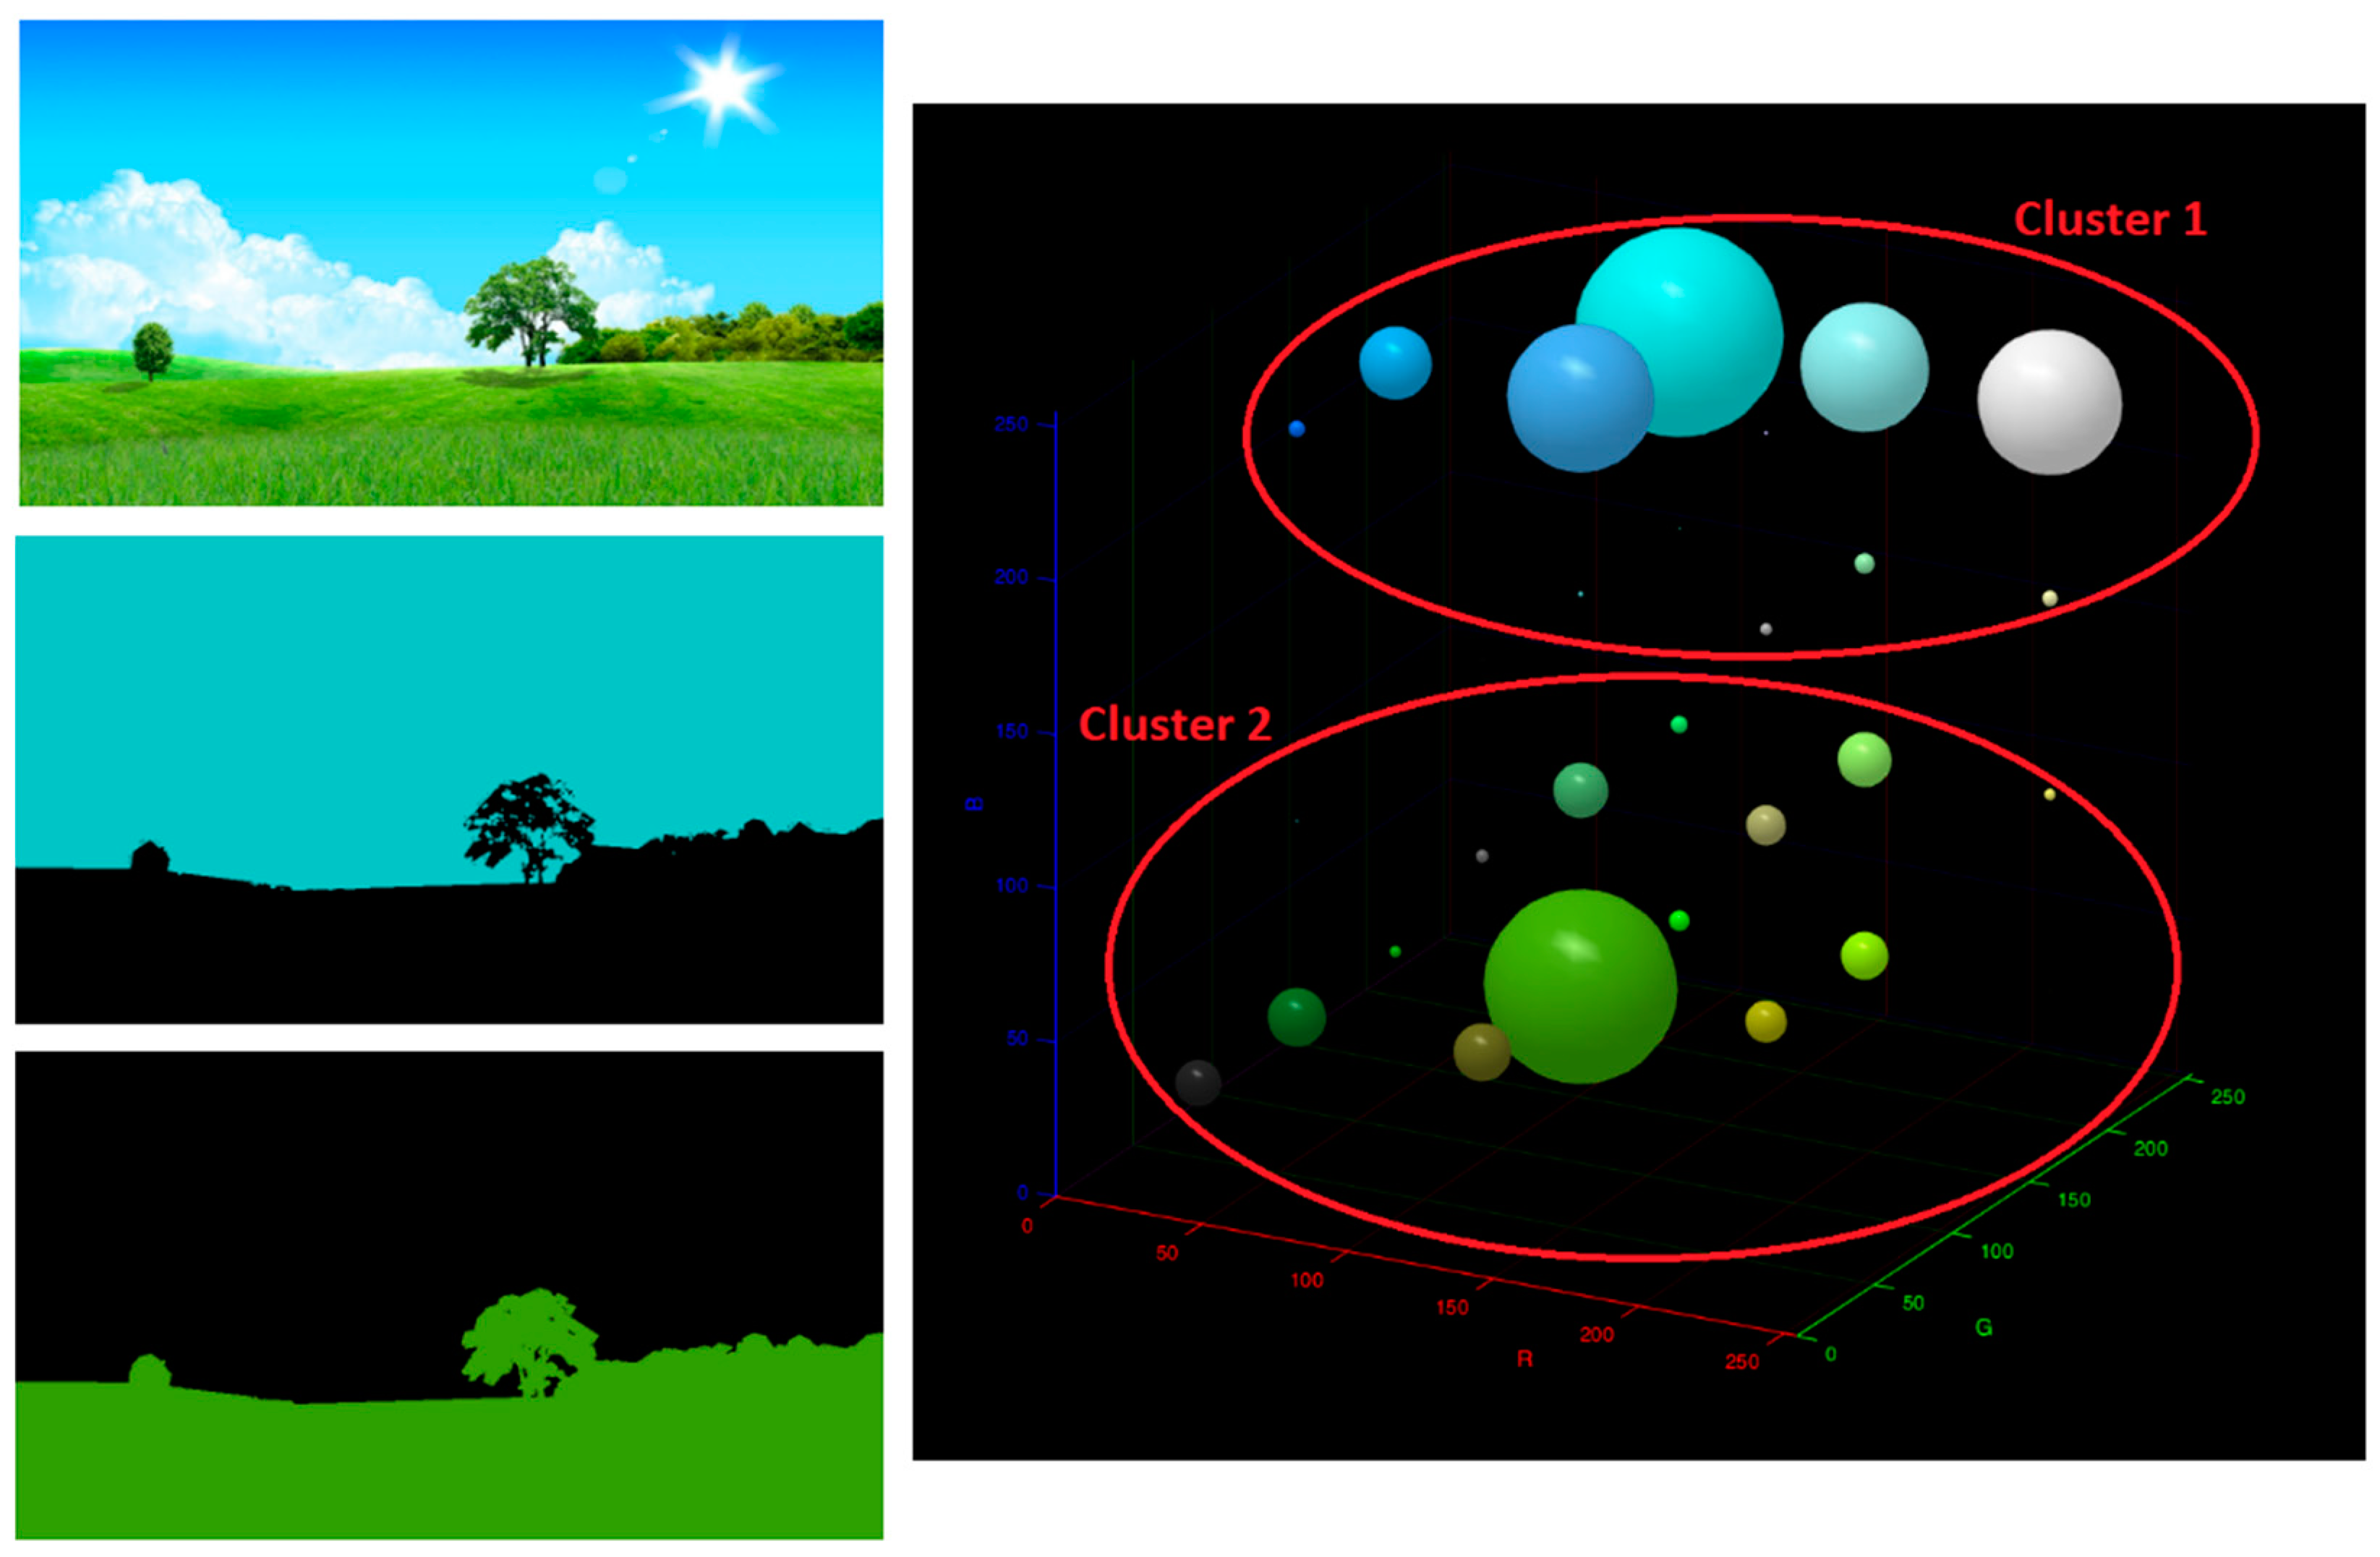
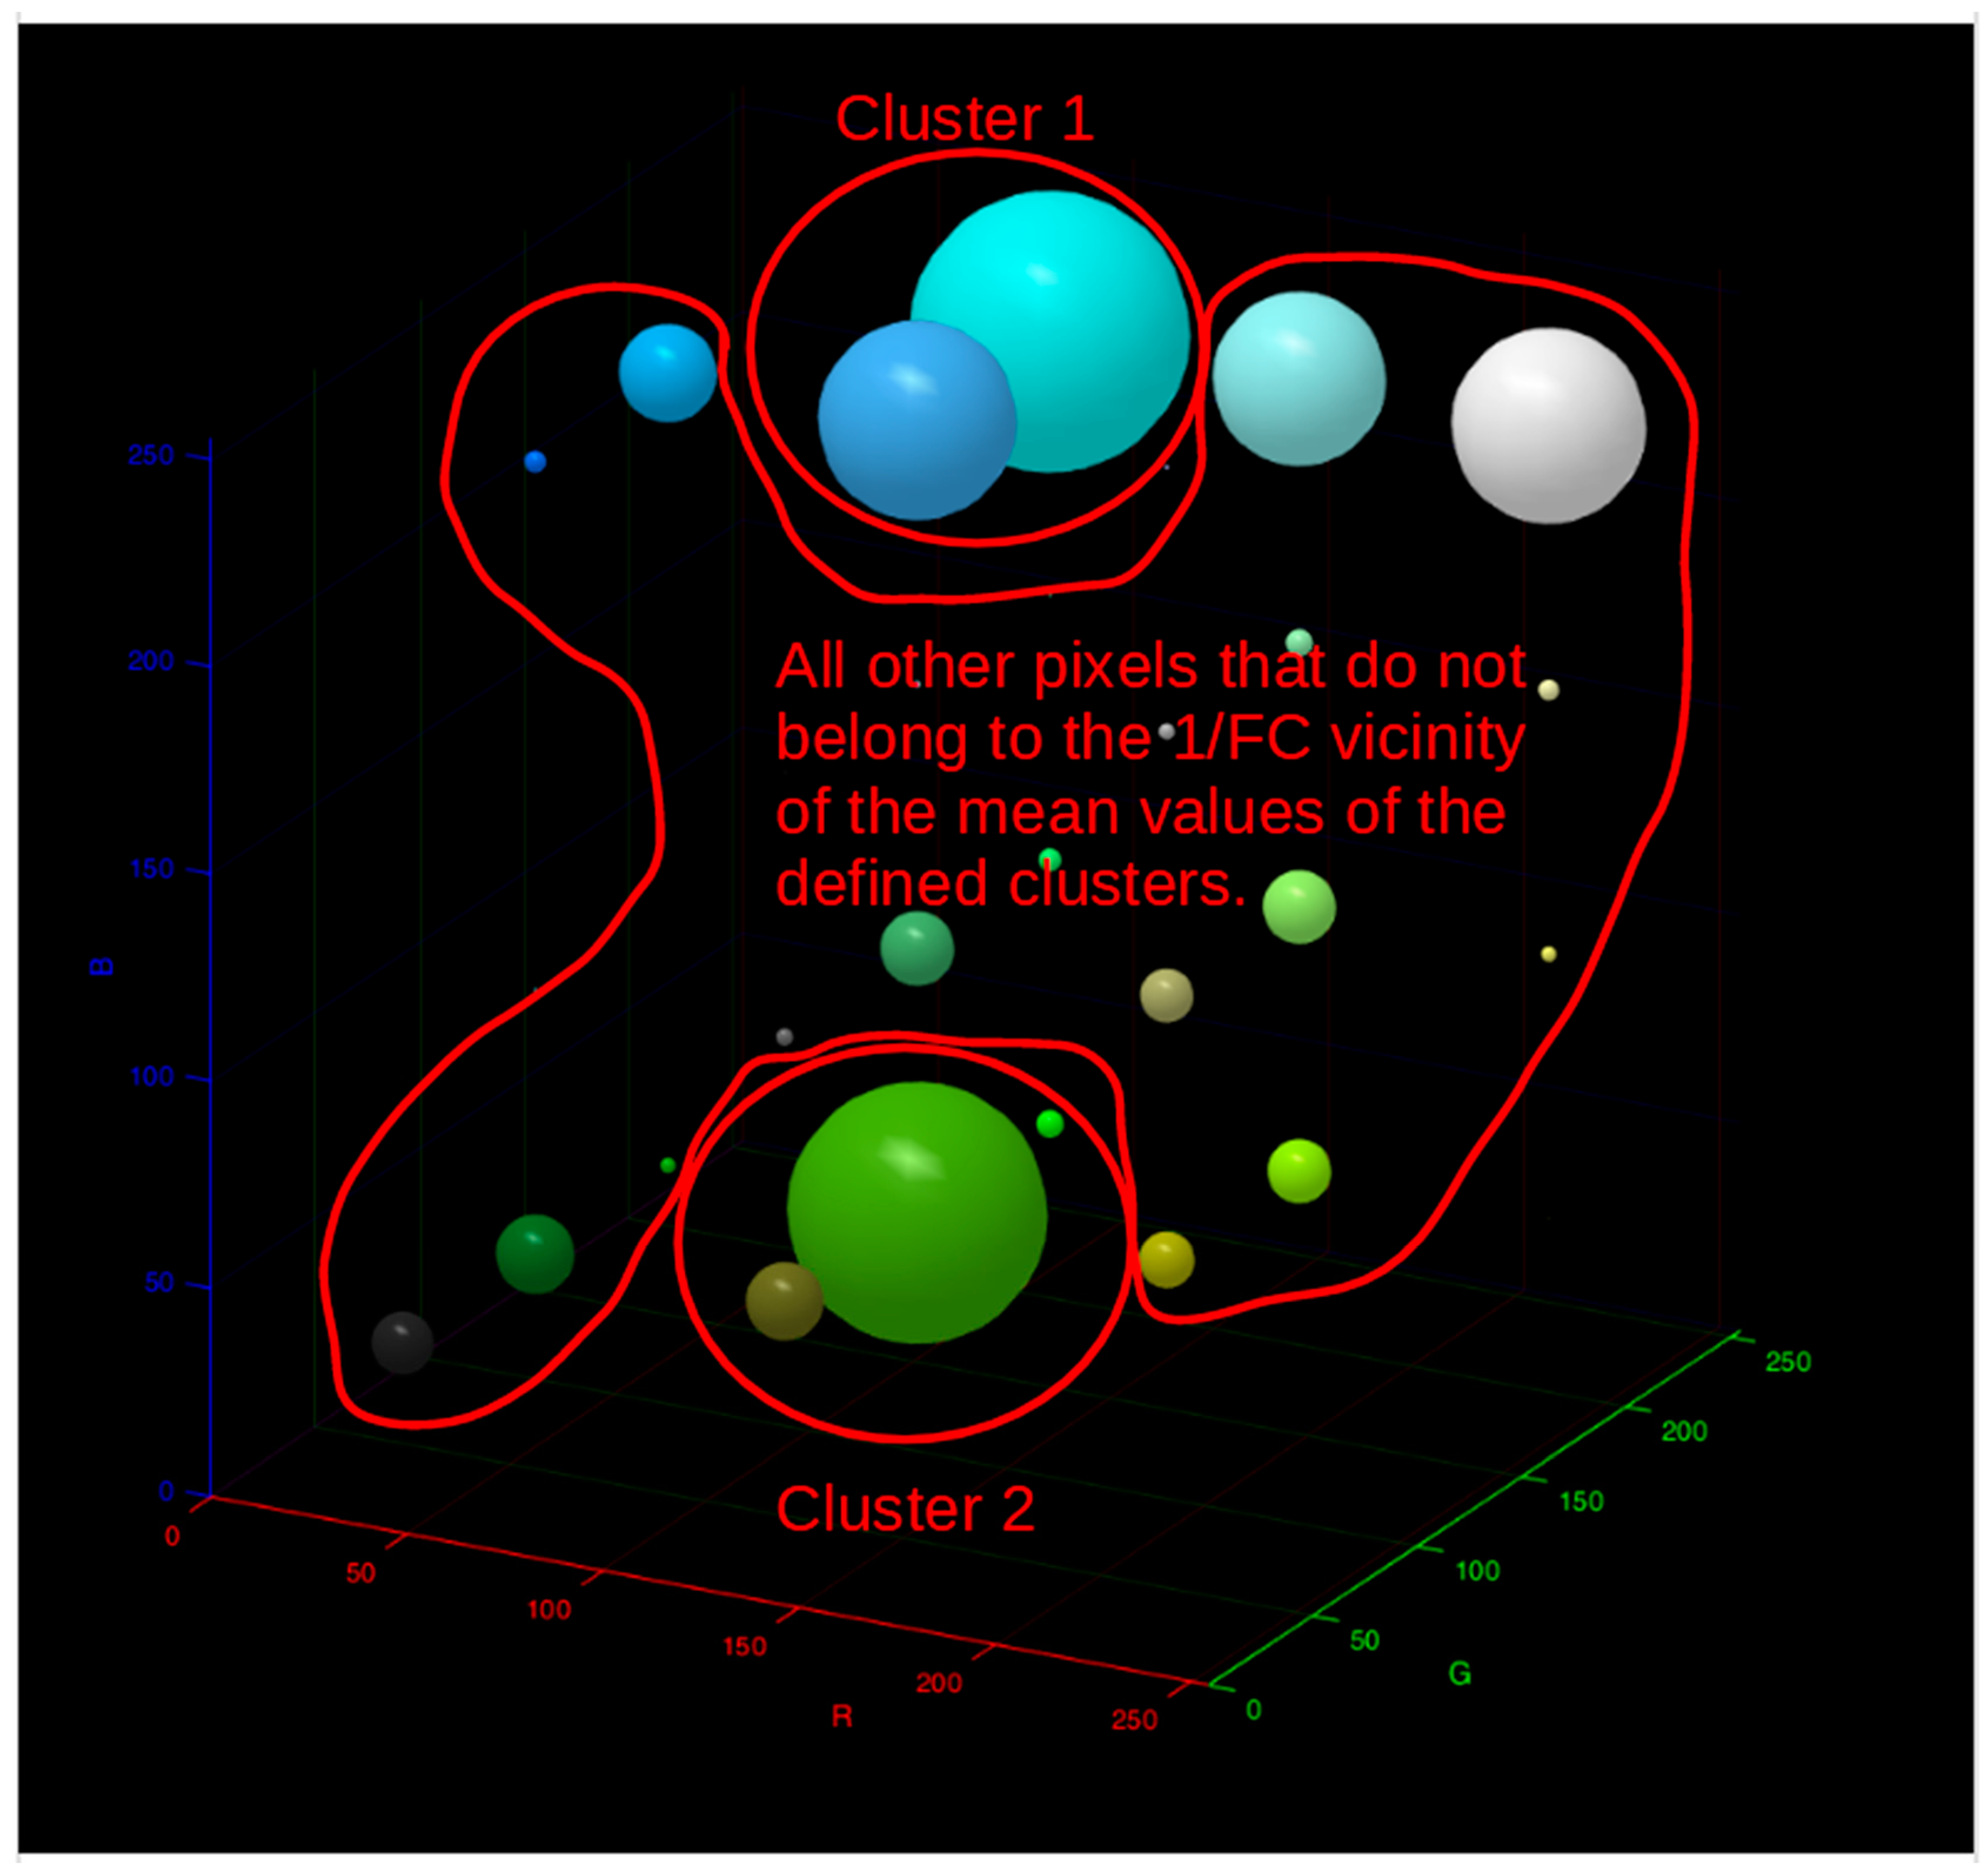
Figure 3 shows the original image, and further shows the distribution of pixels of the original image in the 3D (RGB) space, where the size of each sphere is directly proportional to the number of pixels of a particular shade and the way in which the pixels are divided into two clusters. Finally, when we return from the 3D domain of pixel distribution to the image domain, all pixels belonging to cluster 1 are represented by dominant blue color, while all pixels belonging to cluster 2 are represented by dominant green color.
The proposed Type 1 algorithm creates N black and white images where pixels of cluster c = i are shown in white, while pixels belonging to clusters c ≠ i are shown in black, where i takes values from 1 to N, where N is the number of required clusters.
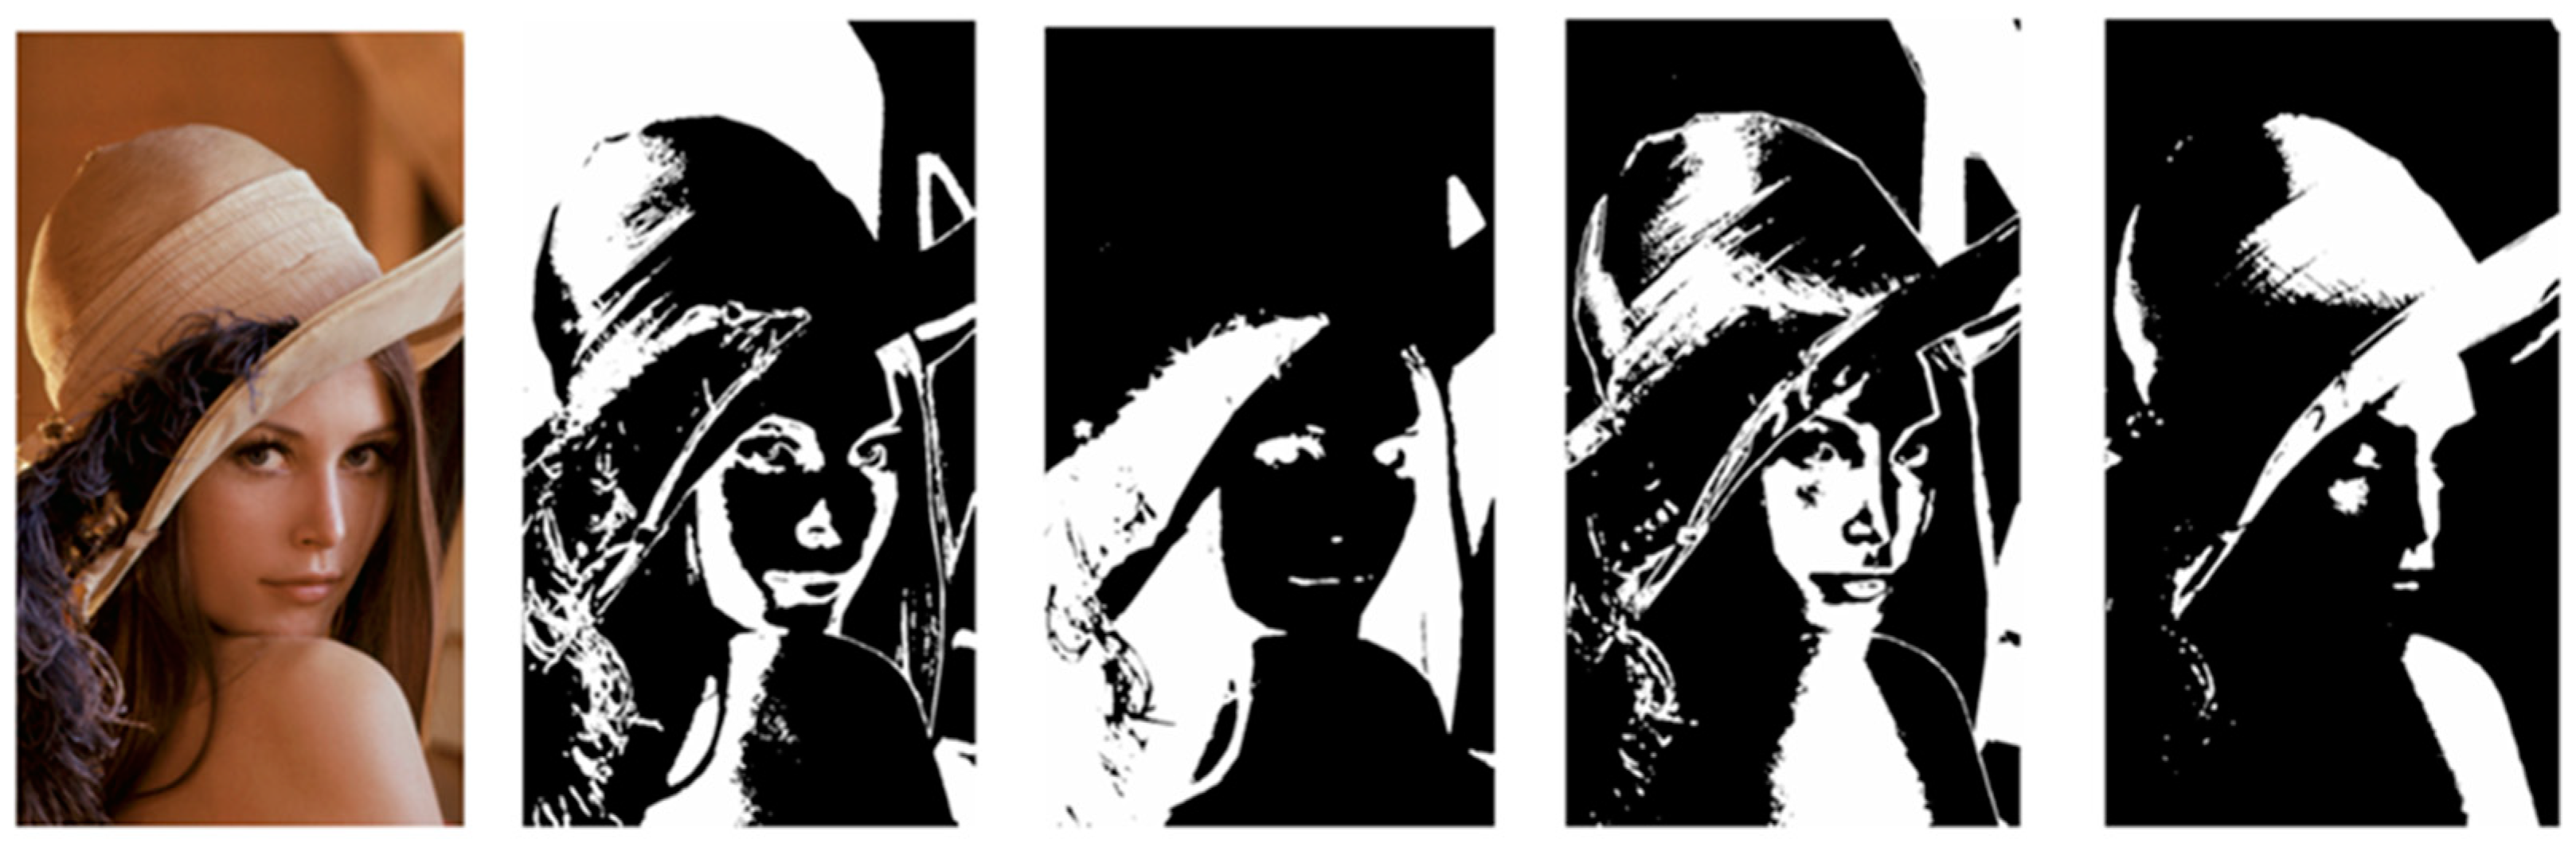
Figure 4 shows the original image as well as four black-and-white images, the product of the algorithm’s interprocessing, for the required N = 4 clusters. Further processing continues on the mentioned black and white images.
The further flow of the left branch of the algorithm in
Figure 2 (Type 1) performs salt and pepper filtering (removing individual solitary pixels to maximize individual zones). At point “C”, the next two algorithmic blocks (“Selection of stego area” and “Calculation of the best possible carrier utilization”) accept N black and white images, estimate the size of the white areas and try to calculate the rectangles for each black and white image to identify the best possible way to fill the given white area. It is important that the number of calculated rectangles does not exceed the defined limit, and it is also necessary to discard rectangles whose size is smaller than the defined minimum value. The output information from the aforementioned algorithmic block represents a set of rectangles defined for each black and white image, specifically the pixel positions of the upper left and lower right vertices of the rectangle. The next block of algorithms (“Processing overlapping surfaces”) accepts information about the calculated rectangles, checks whether there is a possible overlap of individual rectangles created on different black and white images. If there is an overlap, the algorithm performs an appropriate revision of the rectangle sizes so that, on the one hand, there is no overlap between them, and on the other hand, their size remains as large as possible. Finally, a set of all of the rectangles is formed, selected on N black-and-white images and possibly revised, and the algorithmic block immediately before point “D” (“Formation of a set of steganographic areas”) calculates the percentage of stego-areas in a certain carrier, i.e., the amount of confidential information which the carrier can transfer. For visual report purposes, the selected rectangles are drawn in different colors on a grayscale version of the original image so that the viewer can more easily see their position and size. Different geometric shapes can be used in the proposed algorithm. The reason for choosing a rectangle, as a geometric figure that the algorithm will use to form a stego-area, is that multiple rectangles can easily fill an irregular image surface, on the one hand, and on the other hand, information about the position and size of a certain rectangle can be transmitted in minimal amounts of data (upper left pixel position and bottom right pixel position). By increasing the value of the input parameter N, more black-and-white images are obtained, each of which will have a smaller percentage of the white area, which implies the generation of smaller rectangles and thus the reduction in the carrier capacity. As we transmit the information about the generated rectangles (stego-areas) through a special communication channel to the receiving side, it would make sense to define the maximum number of possible stego-areas on one carrier so that the information about them is not too large. In this case, the number of maximum rectangles is limited to less than or equal to 20. Based on the presented idea, it is expected that the capacities of the carriers will differ depending on the type of cover object, so that images with large areas in similar or the same color/shade will have a higher capacity, while images without large zones in similar shades will have a lower capacity.
Now look at the right branch of the algorithm in
Figure 2 (Type2), a block behind point “A”-1/FC pixels in the vicinity of the mean color value for a particular cluster is noticed. The idea is different from the previous idea described for the left branch of the algorithm. Actually, the goal is to select 1/FC pixels around the mean color values for individual N clusters (Z
i, i = 1, 2, …, N) and create N subsets of pixels composed of them. We declare these subsets as new zones, while all other pixels that deviate sufficiently from the mean values, for each zone Z
i, create a unique, new zone, “Z″ (
Figure 5). As shown on the right branch of the algorithm in
Figure 2, the further flow of processing and calculation of the surface is identical to the left branch of the algorithm, except that now instead of N black and white images, the algorithm searches for stego-regions on N + 1 black and white images. With this approach, we will perform the steganographic process in particular in the zones of dominant colors, and especially in the zone that does not belong to any of the N dominant, so-called “colorful zones”. Speaking of LSB steganography, the assumption is that in colorful zones there is a possibility of changing more bits of less weight and at the same time reduce the visual degradation of the quality of the stego-object, while obtaining a greater capacity of the stego-carrier.
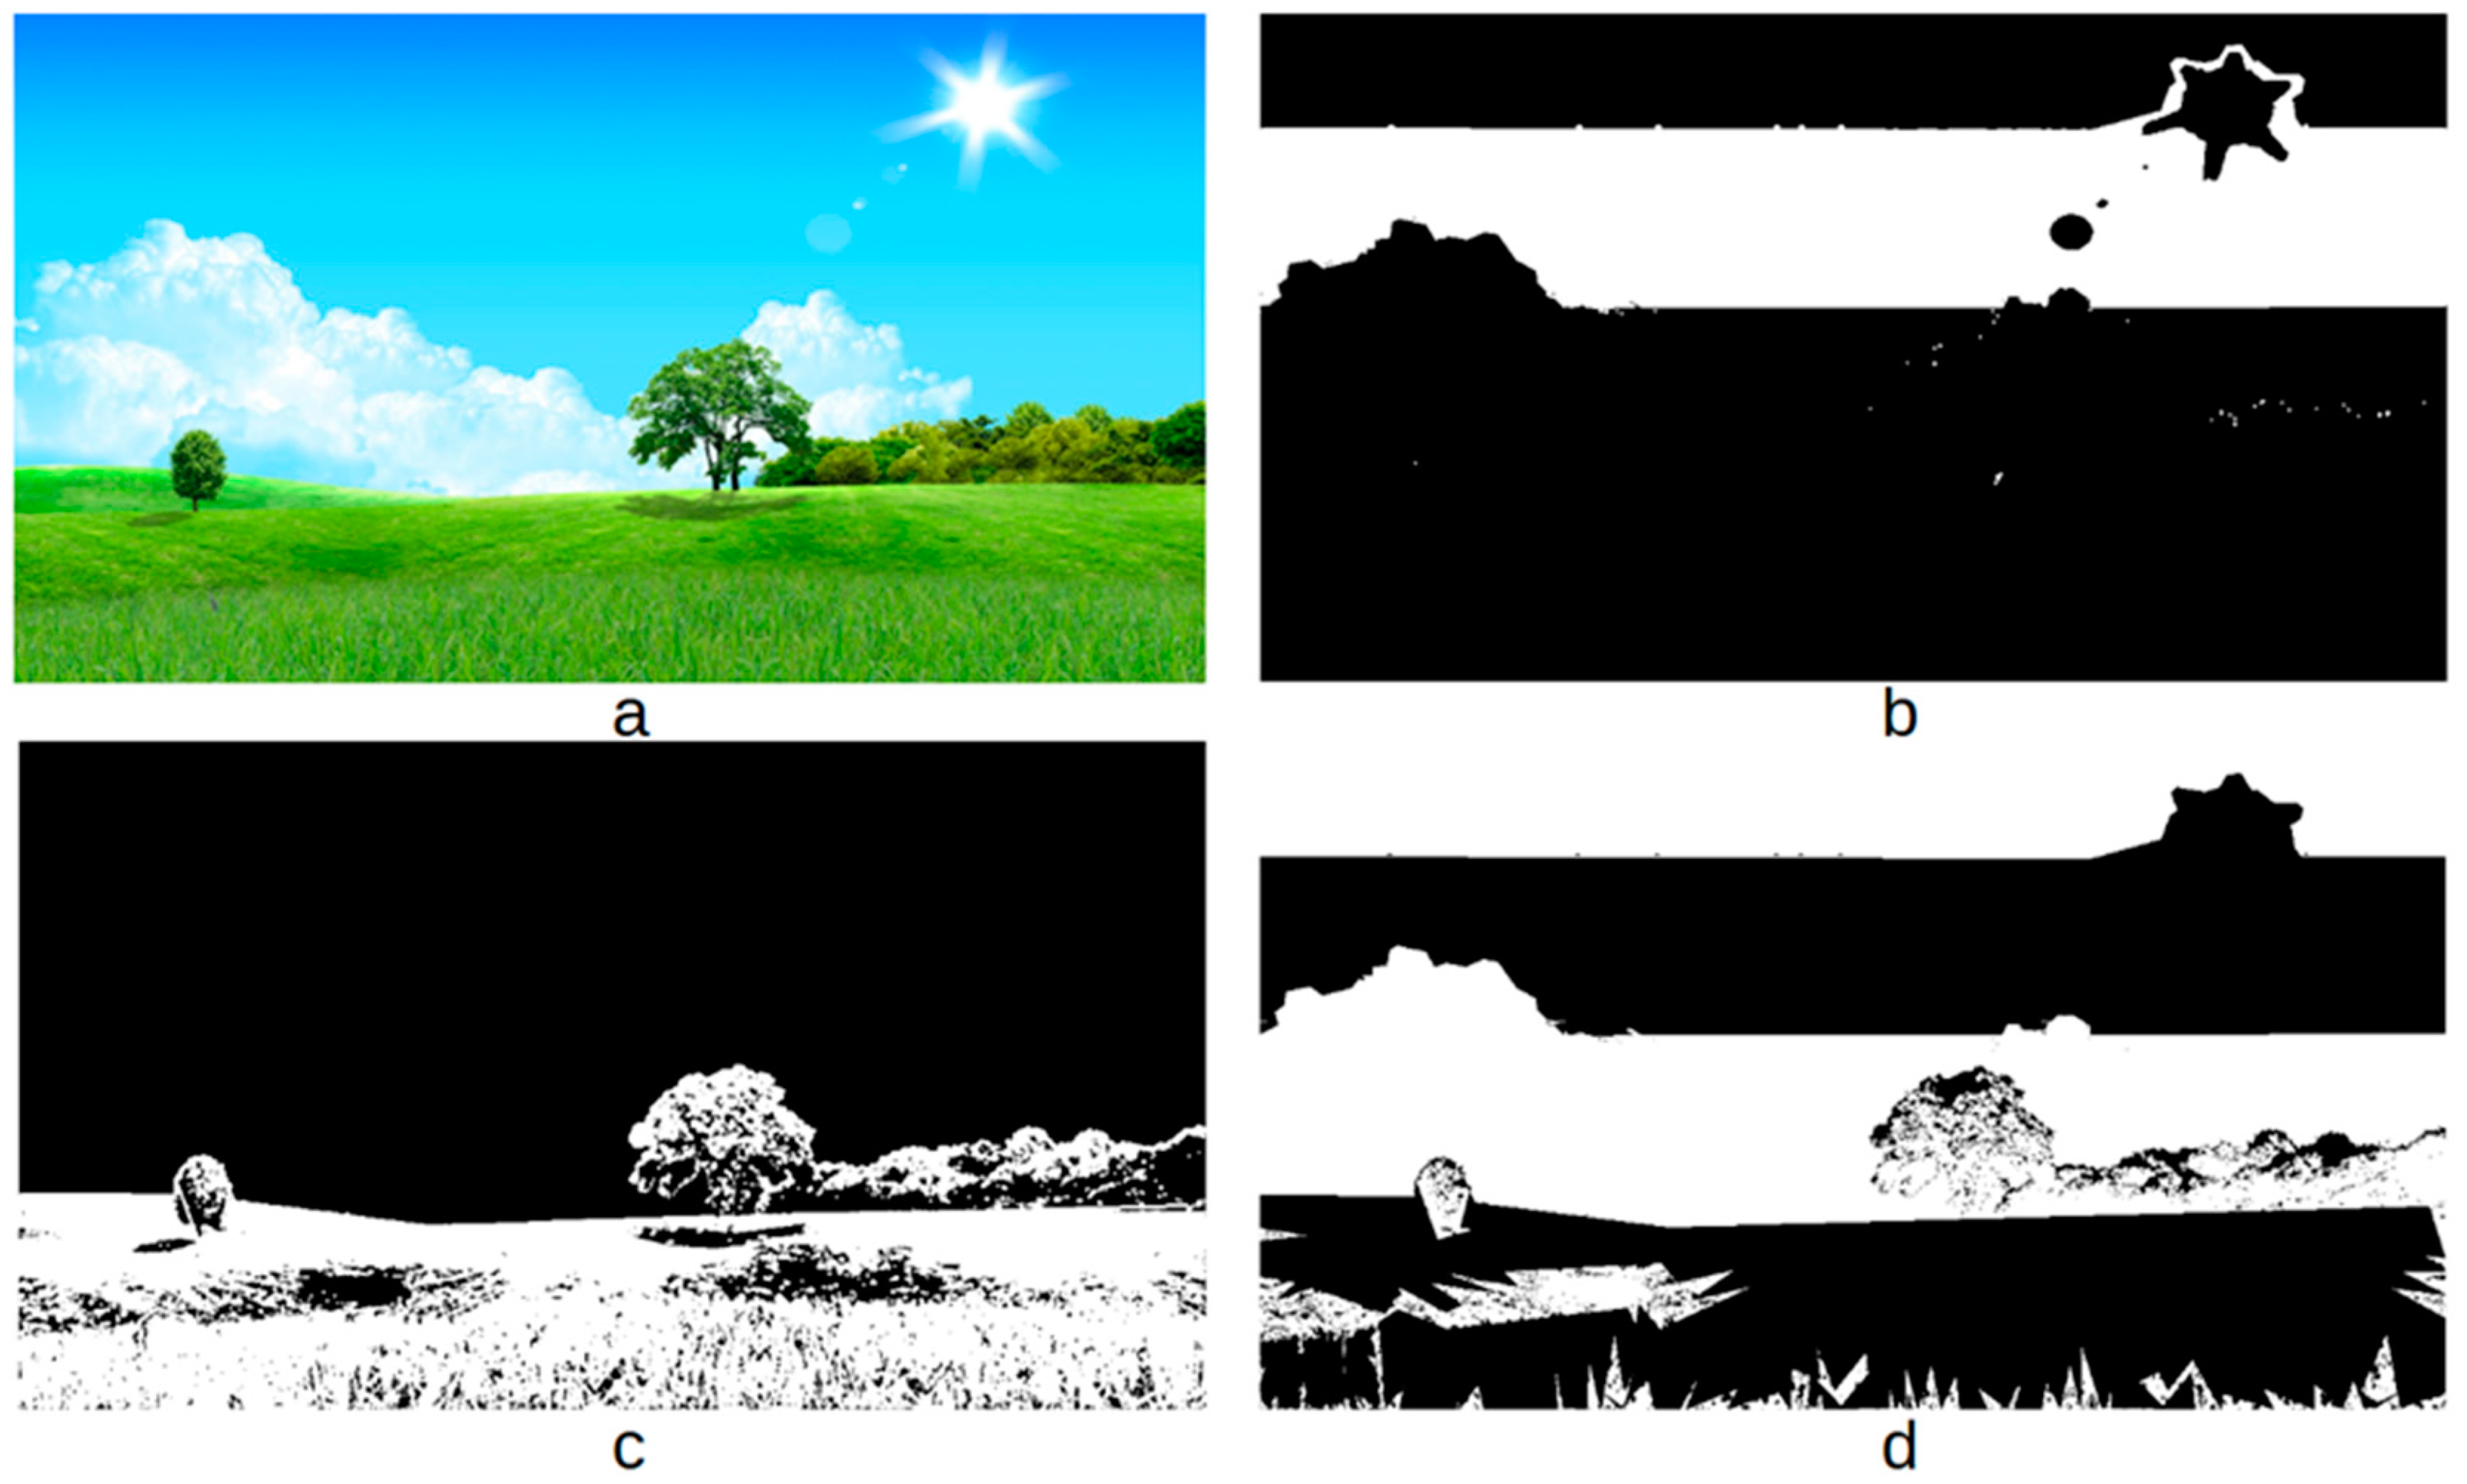
Figure 6 is the counterpart of
Figure 4 for the right branch of the algorithm (
Figure 2). In this case, the number of dominant colors is DC = 2 and the filtration coefficient is FC = 3. The algorithm recognizes the light blue sky color in the image for the input image (a) as well as the green grass area and generates the first two black and white images (b–c). In the third black and white image (d), the white zones clearly show the clustering of all other pixels that do not belong to the 1/FC region for the two dominant colors, just as shown in
Figure 5.
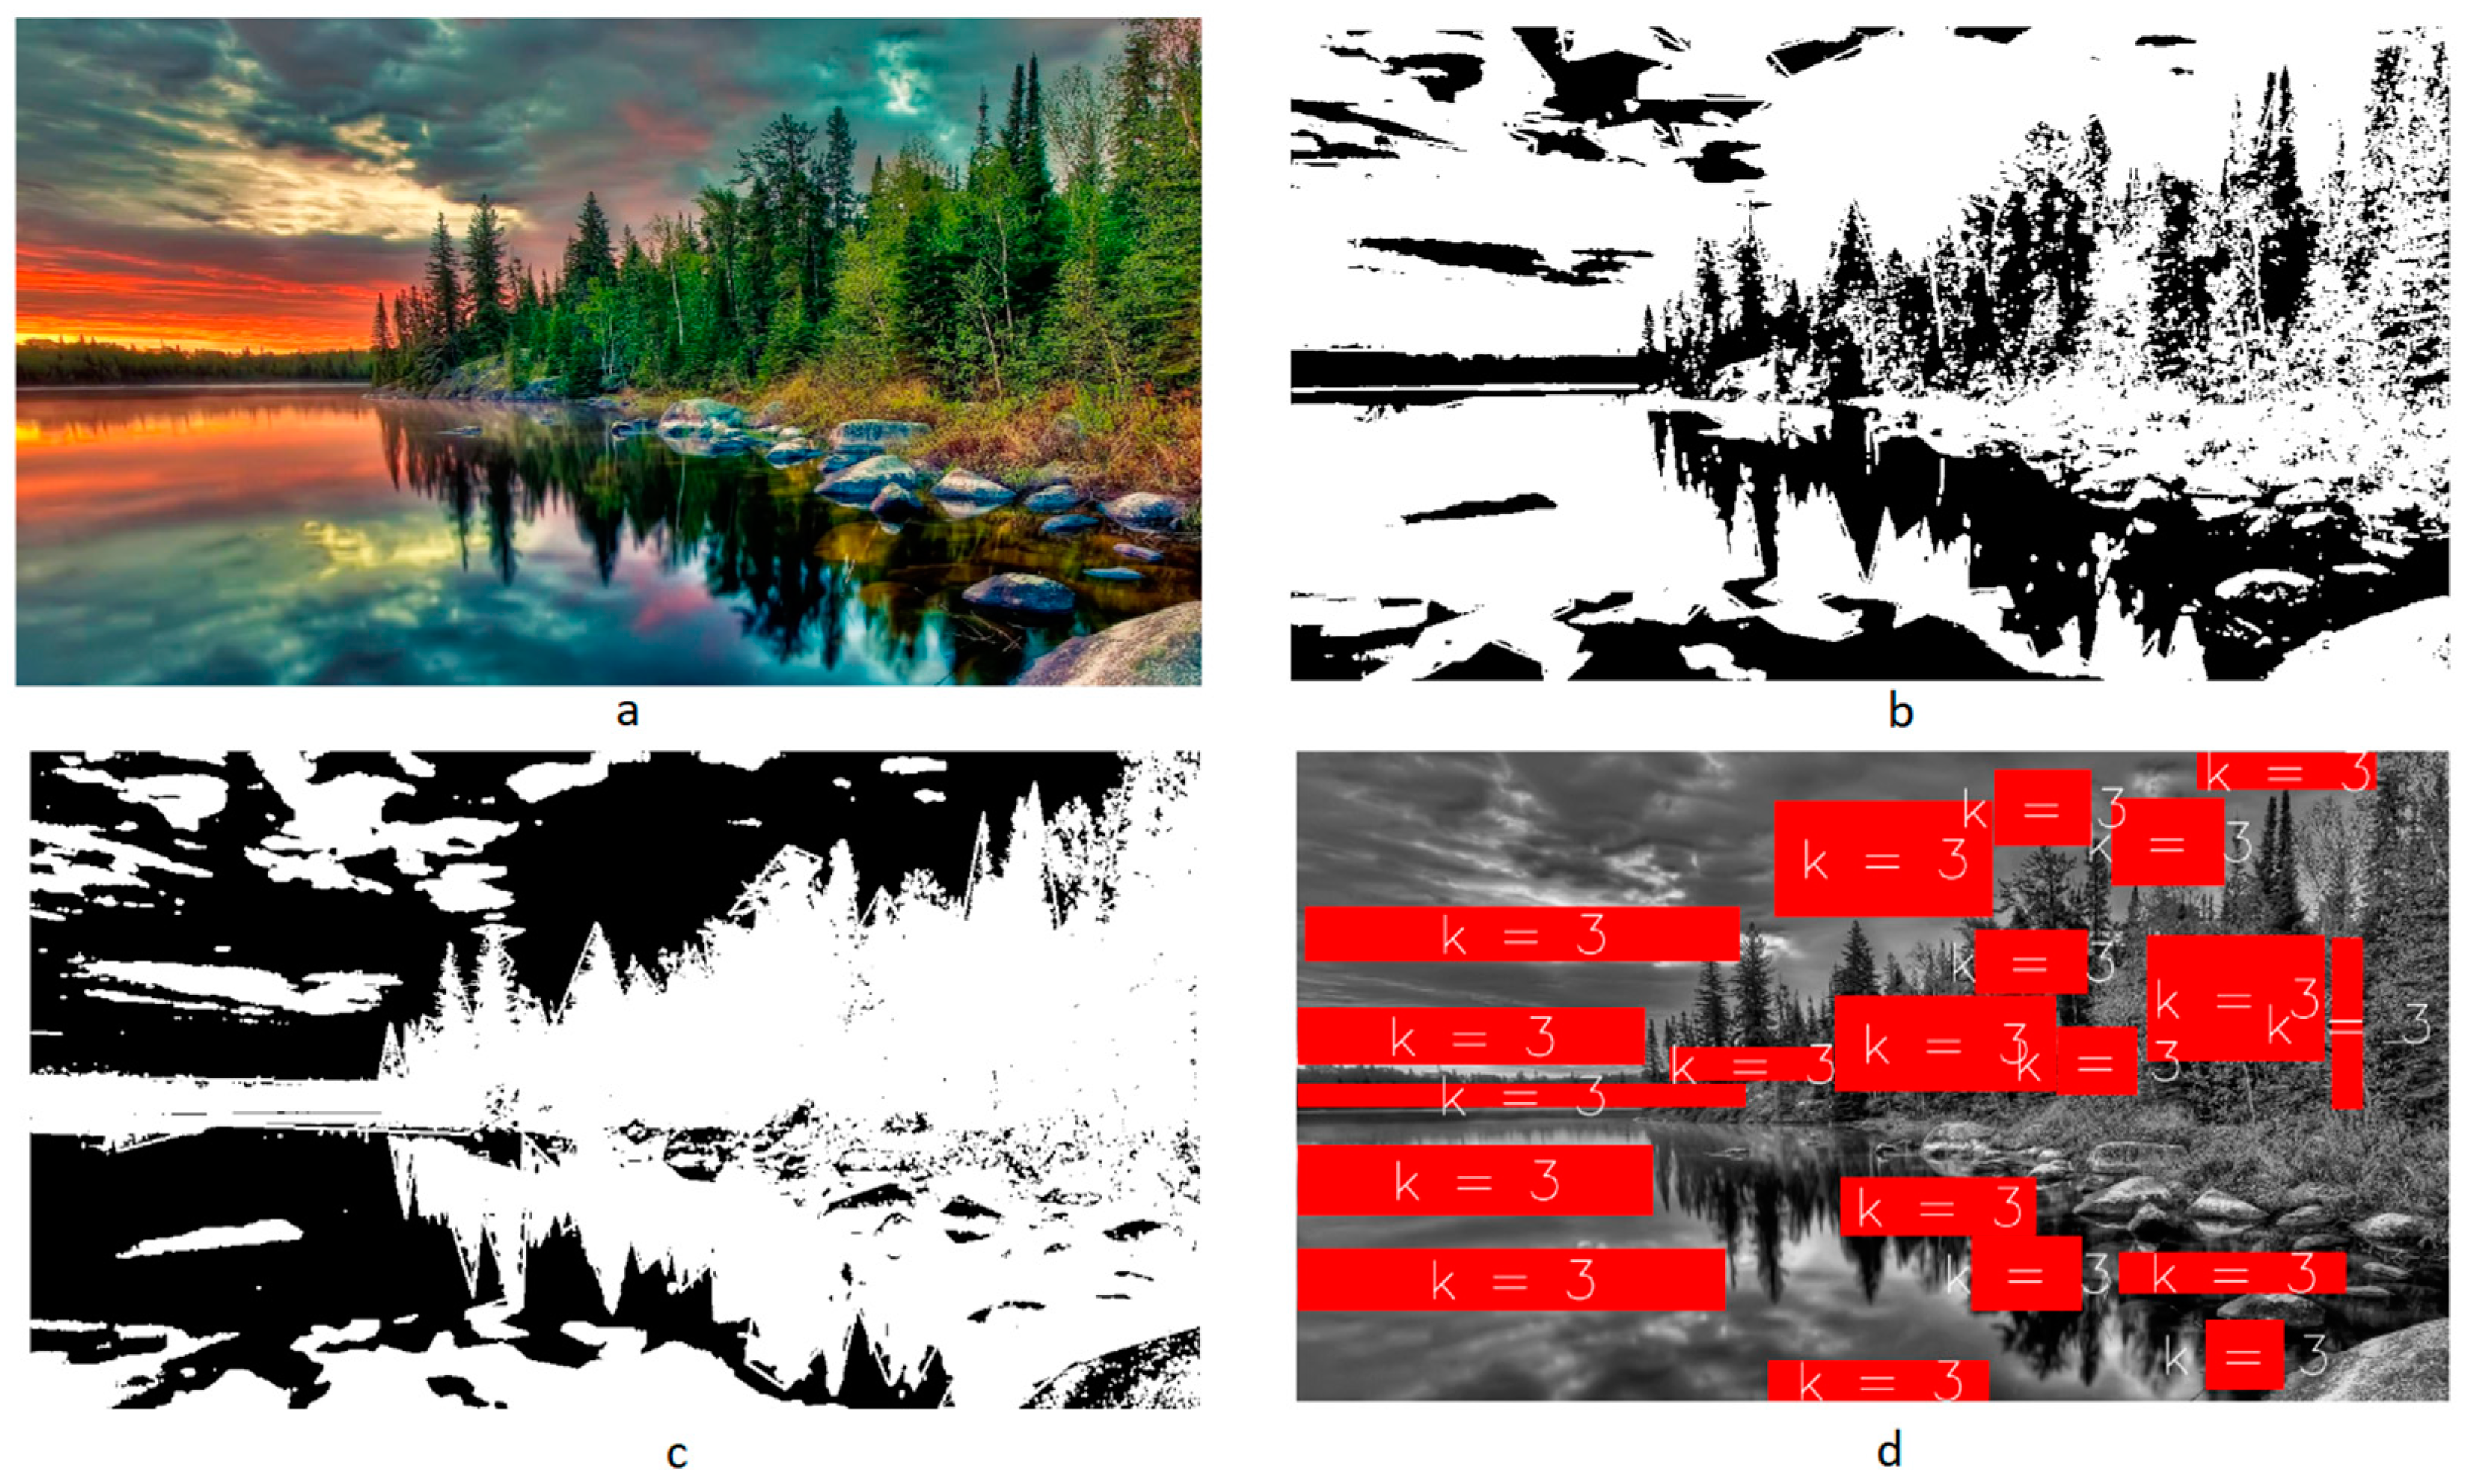
Finally,
Figure 7 shows how the input cover object will be processed, two black-and-white images as a result of interprocessing, and finally the input image presented in grayscale with marked rectangles, i.e., stego-areas. All three images (b-c-d) are part of the stego-region calculation algorithm report.
Based on the explanation of the complete algorithm, it should be noted that complexity is of the order of O(n3), where n is the number of carrier pixels in one dimension. The processing power and additional time required to run an algorithm of this level of complexity is the price to pay for increasing system security. It should be noted that increasing the resolution of the hiding objects can significantly increase the required processing power and/or processing time.
4.1. Embedding Procedure
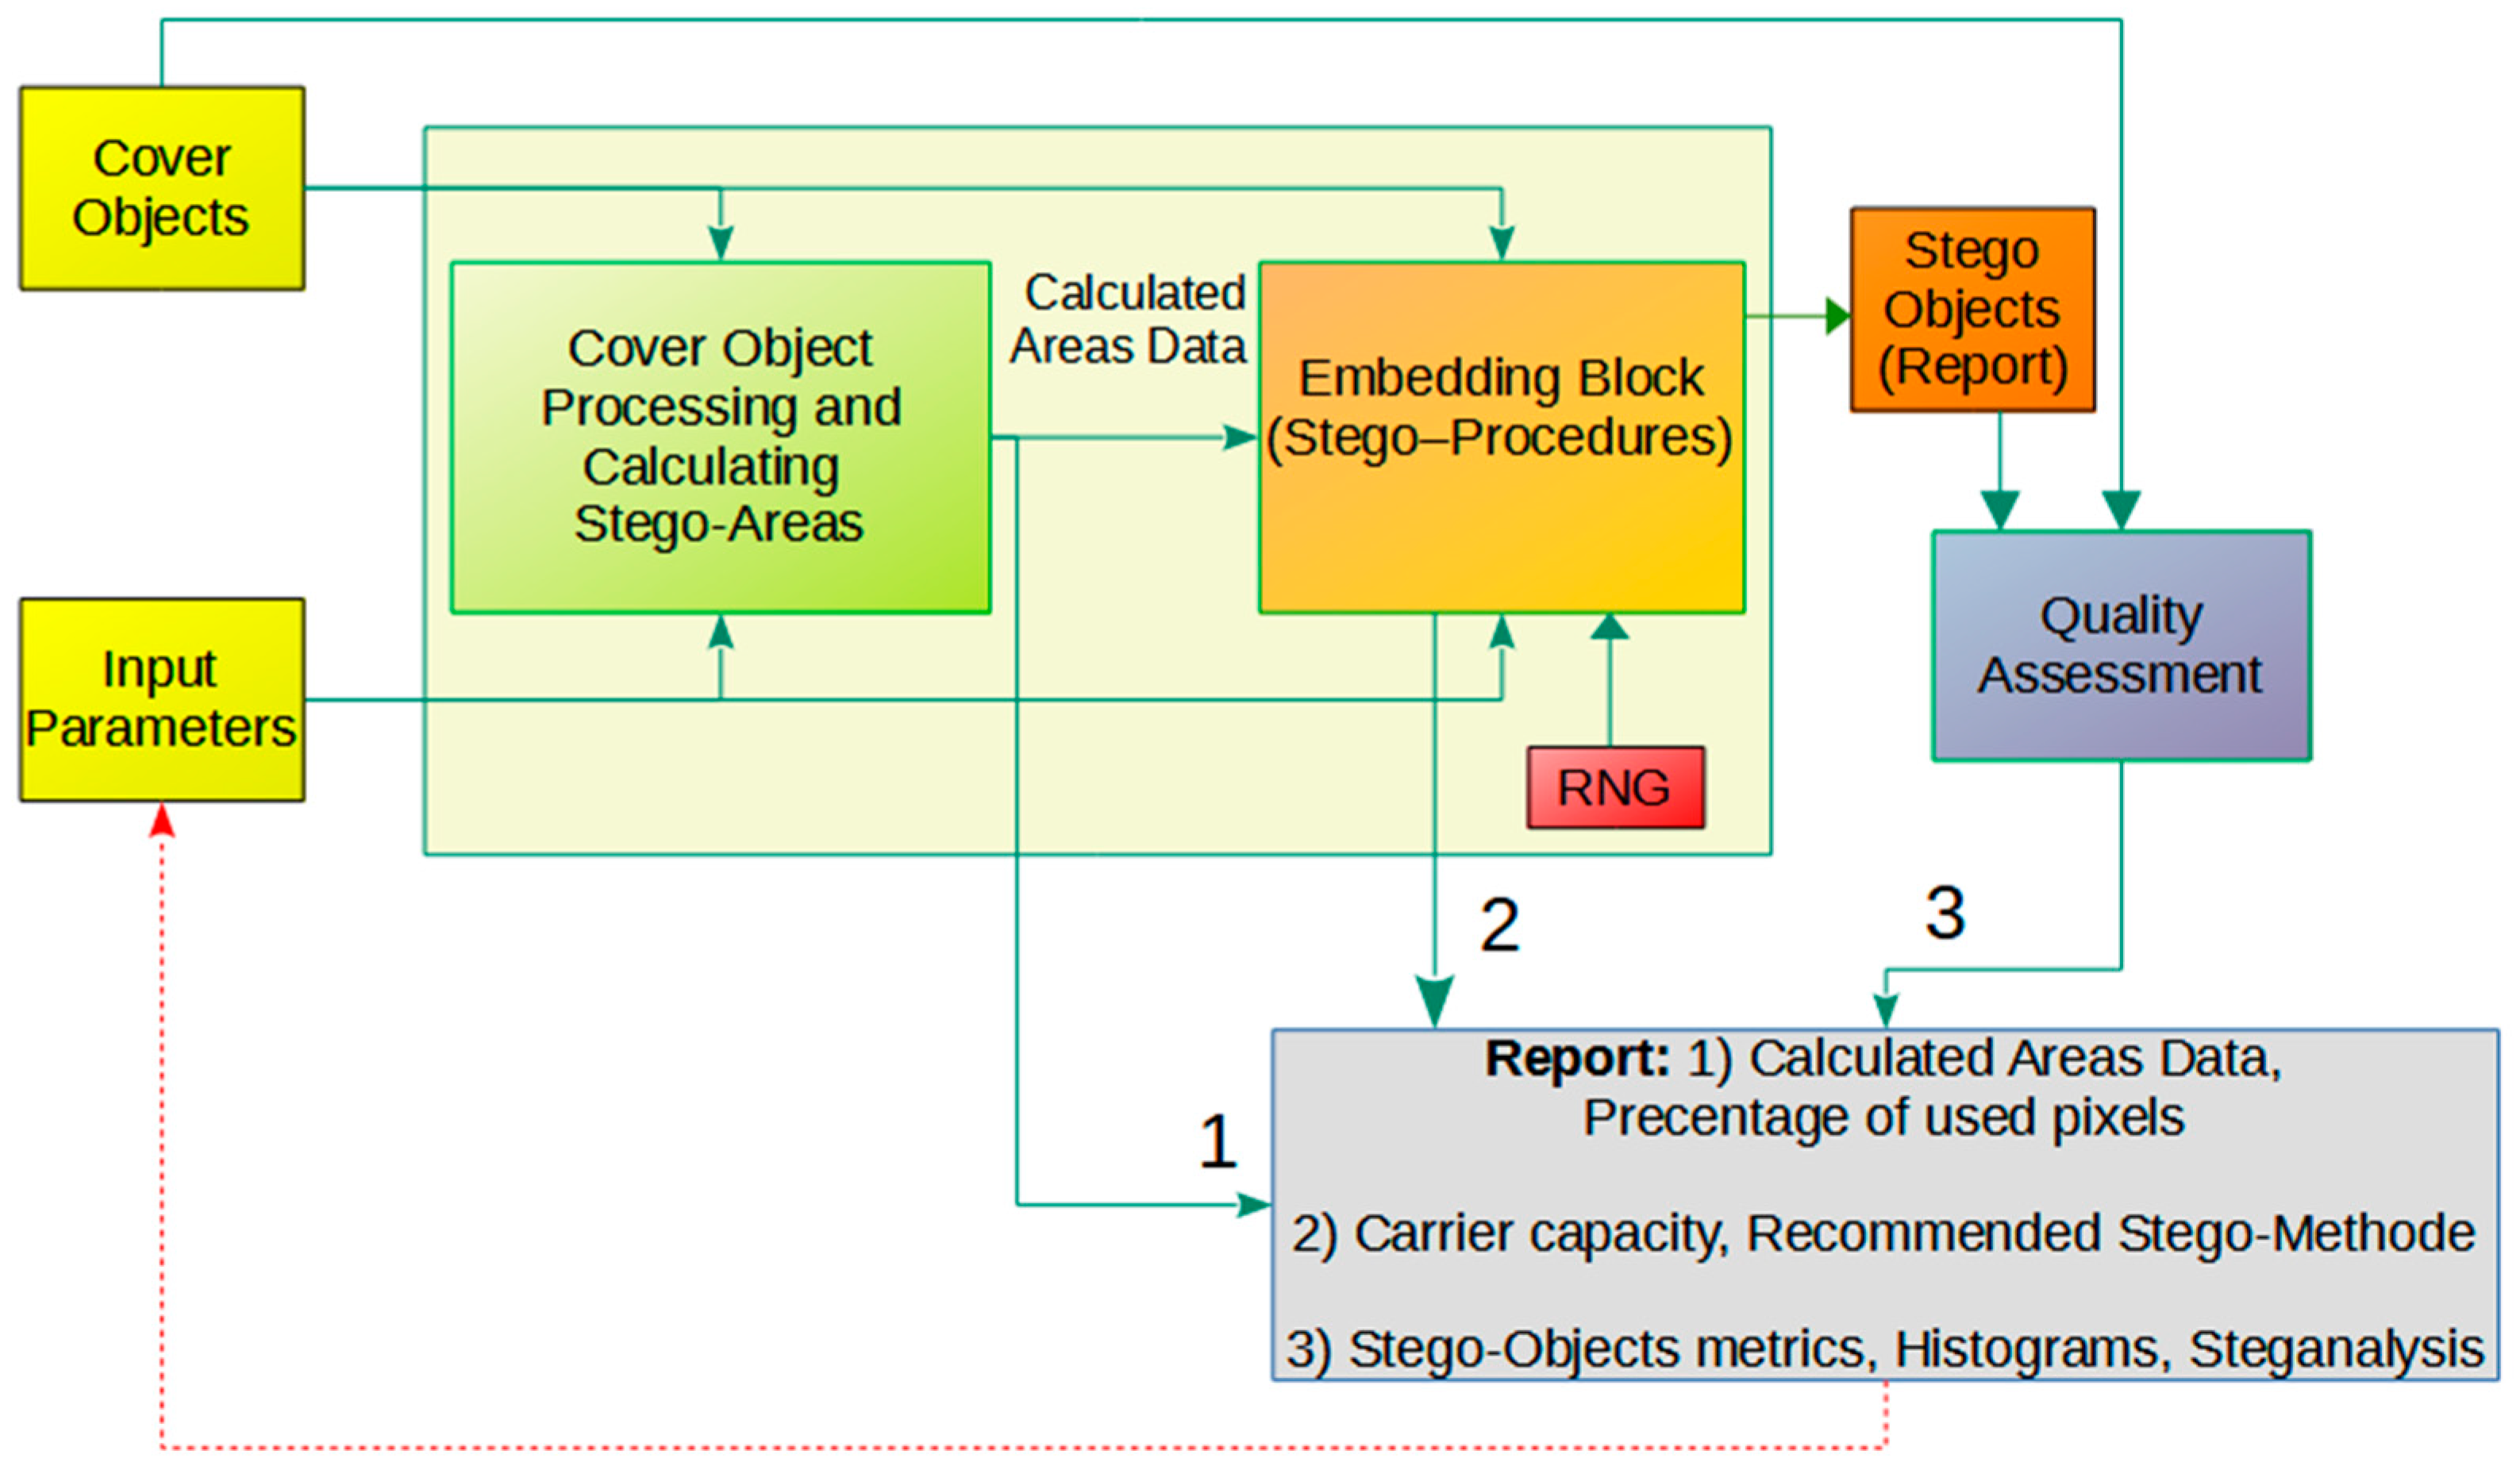
Since the areas of the carrier in which the secret content will be imprinted are defined by the algorithm described, serial numbers (indexes) are assigned to the specified rectangles. The process of embedding secret information is completed in pixels, by rows from left to right, and in rectangular areas by indexes, respectively. This approach allows different steganographic methods to be used during the embedding process. The position and the role of the embedding block are shown in
Figure 1.
4.2. Extraction Procedure
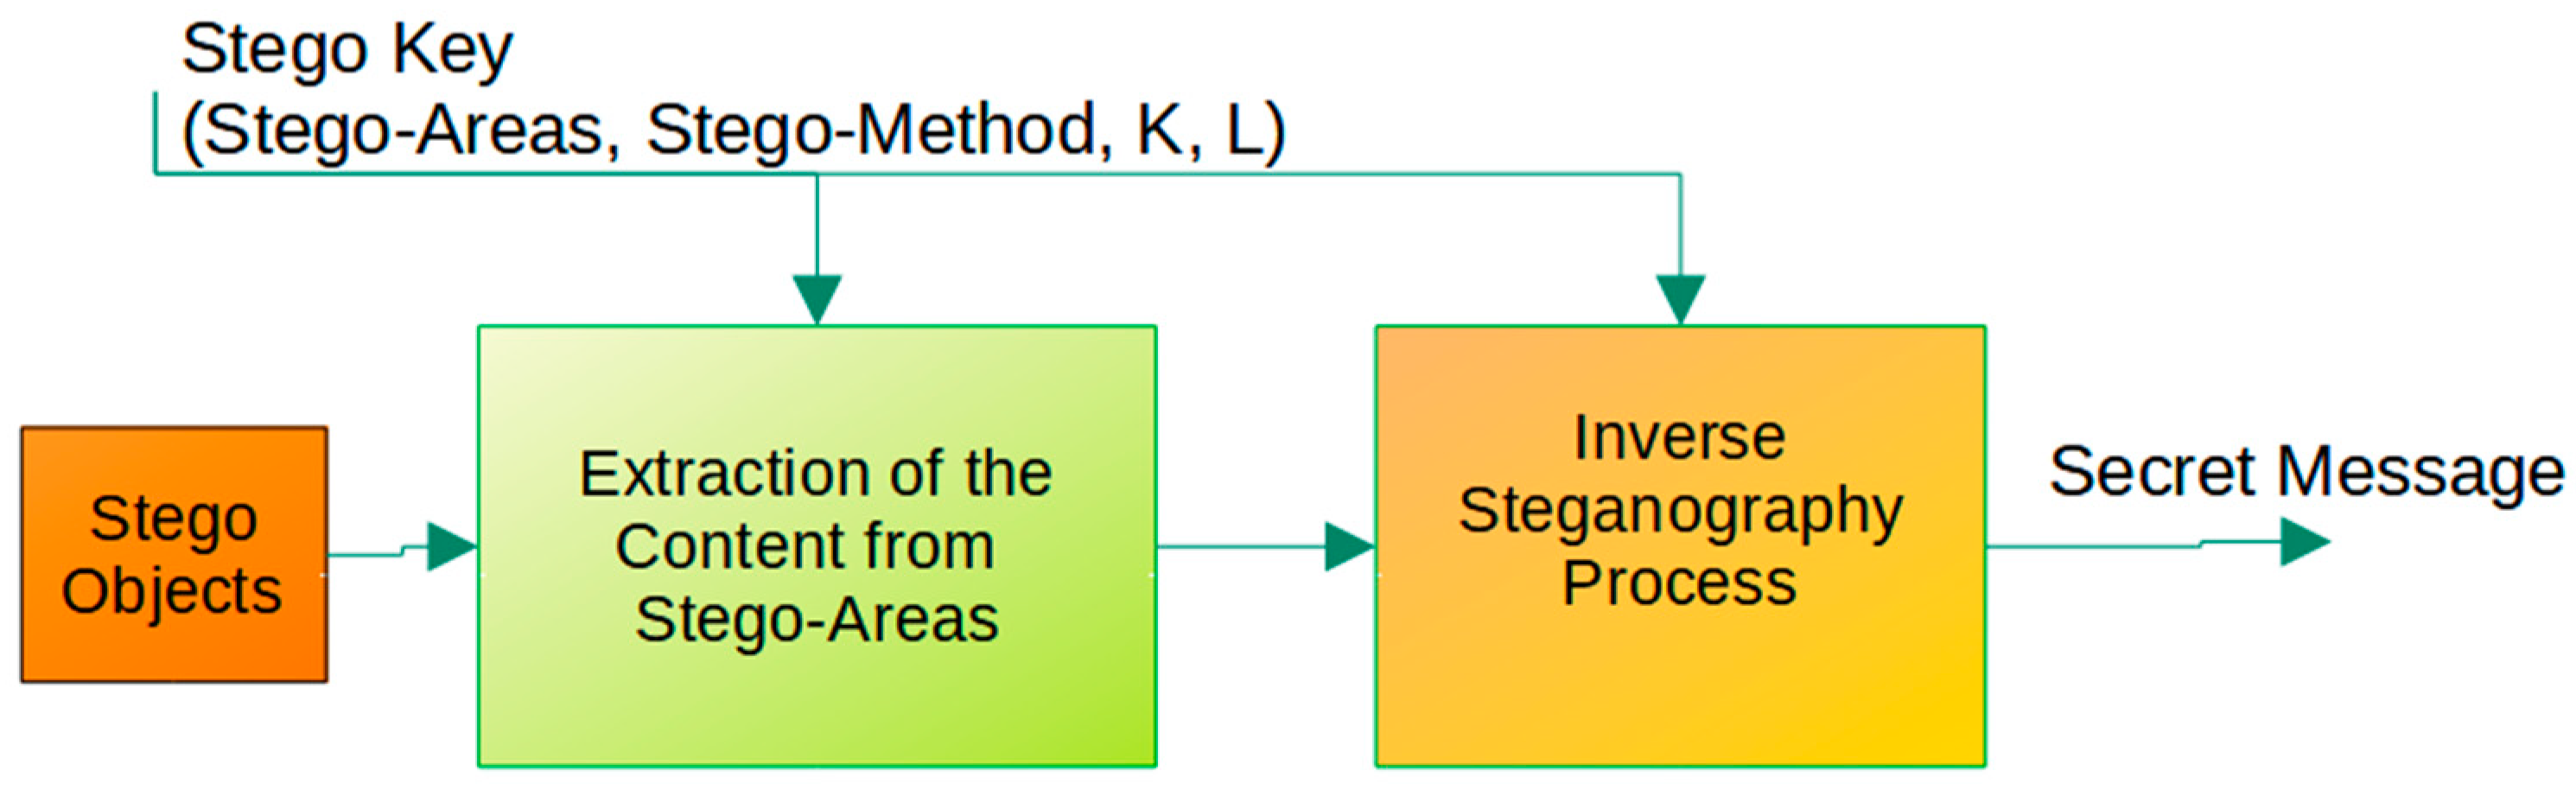
Since the information about the positions of the rectangles and their serial numbers (indexes) arrives at the receiving side through a special (independent) channel, the algorithm uses this information (Stego-Key), accesses certain areas of the stego-object according to the index, and performs content extraction. As shown in
Figure 8, after extracting the content from the defined areas, the inverse process of steganography is performed.
5. Implemented Steganographic Methods and Quality Assessment Criteria of Stego Objects
The goal of every steganographic algorithm is to achieve the most performant final product of the system, that is, the stego-object: minimization of visual distortions of the stego-object, greater capacity of the carrier, greater resistance to stego-analytical tools and attacks, greater robustness of the stego-object, better performance expressed in numerical values for carrier quality assessment, less processing time required for imprinting and extraction of secret content. In order to accurately characterize the efficiency of the algorithms, it was necessary to define different evaluation methods and metrics that clearly quantify the quality of the obtained stego-objects as output quantities of the system [
14]. There are two types of visual image quality metrics in the literature:
1. Non blind-methods are based on the mathematical calculation of the difference between the input image (image of the carrier-Cover Object) and the output image after the imprinted content (Stego-Object). It is clear that such mathematical tools require two images as input arguments—basic and steganographically modified.
2. Blind methods do not require the original image as a reference for mathematical calculations, but their assessment is based on shape recognition statistics, where the applied algorithm is based on neural networks and machine learning where the processing system is pre-trained.
The subject of this paper is the analysis of the generated stego-objects and the exclusive determination of their quality by means of metrics that show the distortion of the stego-objects in relation to the original concealment objects. Therefore, in further analysis, the focus will be exclusively on Non-Blind metrics.
The methods for image quality assessment (IQA) and calculation of individual (Non blind) metric data applied in this paper are as follows:
MSE—Mean Square Error:
where C
i is the pixel value of the carrier; S
i is the pixel value of the stego-object and
is the height and width of the carrier image. Lower scores on this metric are considered better.
RMSE—Root Mean Square Error:
SNR—Signal to Noise Ratio:
PSNR—Peak Signal to Noise Ratio:
where
Max is the highest value of pixel intensity (per channel), i.e., 255.
SSIM—Structural Similarity Index:
where
,
,
,
, and
are mean values, standard deviations and cross-variances for images x, y.
Papers [
15,
16] deal with image quality assessment depending on different metrics. The defined limit values of different quality zones in this paper are a direct consequence of the conclusions and guidelines of the aforementioned studies. Metrics and Numerical Relations:
RMSE: lower values are considered better.
SNR: higher values are considered better. Limits: >35 dB—good, >25 dB—acceptable, <25 dB—unacceptable.
PSNR: higher values are considered better. Limits: >40 dB—good, >35 dB—acceptable, <35 dB—unacceptable.
SSIM: higher values are considered better. Limit values: >0.99—excellent, >0.95—acceptable, <0.95—unacceptable
Test results for which SNR > 35 dB and PSNR > 40 dB (good quality) with SSIM > 0.99 are classified as excellent quality.
When it comes to the steganalysis of the generated stego-objects, the RS steganalysis described in [
12,
13] was performed. The obtained results are represented by the parameter p
rs, which represents the size of the imprinted content expressed in percentages of RS steganalysis pixels. As the steganography process is performed in certain areas of the carrier, the secret content detectability coefficient p
d is defined and can be calculated as:
where p
rs is the length of imprinted content expressed as a percentage of stego-object pixels, p
ib is the value of the cover object’s initial bias for RS steganalysis, and cp is the percentage of modified stego-object pixels normalized to a range of 0 to 1.
6. Experiment Design
When it comes to steganography in the spatial domain, the LSB and PVD [
17] methods are among the most commonly used techniques, so many authors often compare their characteristics and combine them with each other. The MDD method described in [
18,
19] was used for the basic steganographic method in this work. The MDD method is a derivative of the basic LSB method and, in relation to it, has significant advantages in the quality of stego-objects, which are shown in [
18,
19]. For the purposes of the experiment, a mutual comparison of the stego-objects obtained by the mentioned methods (MDD/LSB, PVD) was performed, with the expectation that the MDD method will be dominant and thus justify why it was used in this work. In the section dealing with the analysis of the results, a comparison of the quality of stego-objects obtained by the method of adaptive steganography was made, in the context of carrier capacity, quality of stego-objects and resistance to steganalysis.
As described in
Section 3 and
Section 4, the algorithm for calculating the stego-areas passes information about the sizes and positions of the rectangles to the module that performs the steganography process. The sum of the number of pixels of all rectangles represents the total number of pixels that will be affected during the steganography process, this quantity is called
PixelsToImpact. This number of pixels can be represented as an absolute value as well as a percentage of the total number of pixels of the cover object. The carrier capacity,
Cap, for the MDD method is calculated as:
where
K represents the number of LS bits that we change in each channel of the corresponding pixels.
The experiment is performed in two phases, as shown by the left and right branches of the algorithm in
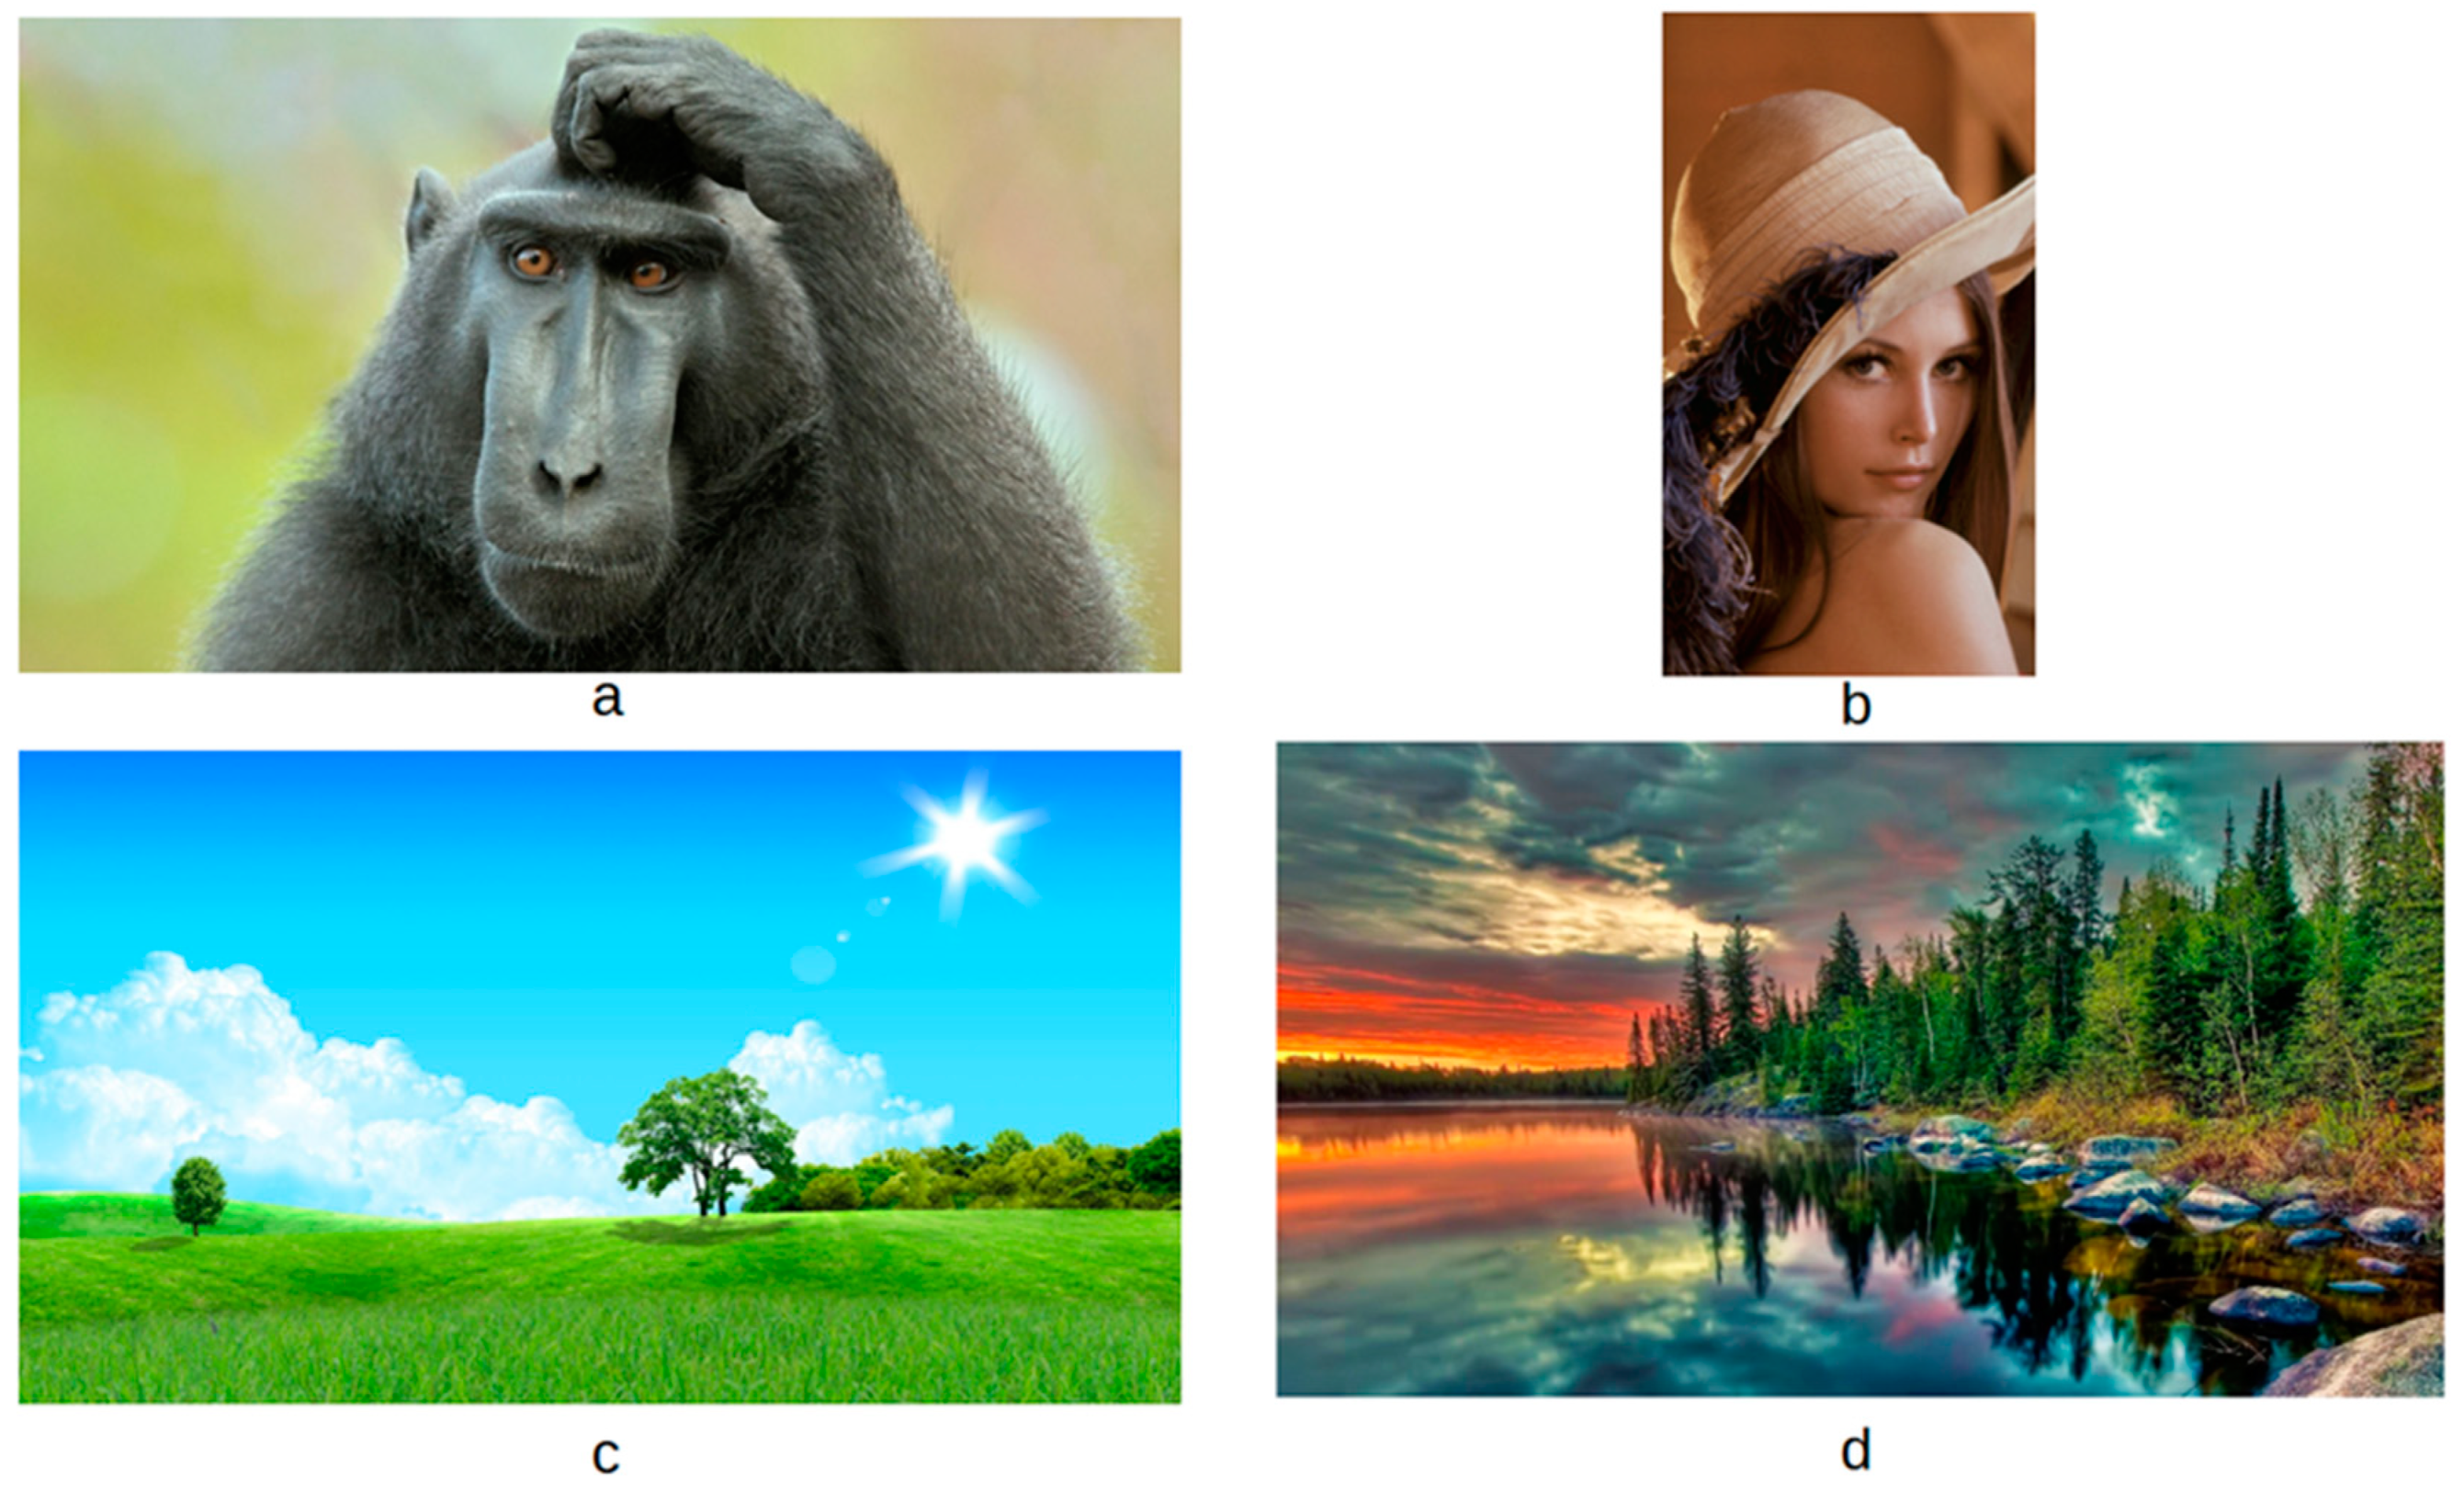
Figure 2, on a dataset specially designed for this purposes. We create a dataset consisting of 10 pictures for each of the 10 chosen topics (nature, people, fantasy, food, space, animals, sport, cities, technology, music). The analysis is performed on the full dataset while we illustrate results on the four typical pictures (carriers): Baboon.png, Lena.png, Nature1.png and Nature2.png (
Figure 9). In order to better differentiate the obtained results, as the stego-surface calculation algorithm works, the carriers were chosen so that the images Baboon.png and Nature1.png have large areas of similar colors, while this is not the case with the images Lena.png and Nature2.png. In fact, the Nature2.png image was chosen to contain many different colors and without large areas of similar tones. The obtained results and their analysis should show the mentioned differences in the visual experience of the proposed images. It is important to note that all used png image carriers are of full HD format, dimensions 1920 × 1080 pixels, in color, three channels. The size of each of the used media is: 1B × 3Ch(rgb) × 1920 × 1080 = 6075 KB. Before describing the experiments and tests, it should be noted that the complete implementation of the algorithm was developed in the C++ programming language, in the QT development environment and the OpenCV library was used as a tool for image processing.
The idea of the Type 1 method is to change the input parameter N (N = 0, 2, 4, 6, 8) and thus zone the corresponding pixels of the input image into N ranges Zi. The parameter N is varied in steps of two to make the distinction between adjacent measurements more noticeable. For the value of the input parameter N = 0, there is no zoning, that is, the selection of stego-areas which implies the performance of the steganographic process on the entire surface of the stego-carriers.
The software is designed so that it is possible to save the specified black and white derivatives of the processing within the detailed report. After calculating the stego-area of the carrier and marking them on the image in gray scale (
Figure 7d), the software also creates a text report that contains data about the rectangles (coordinates of the upper left and lower right pixels), the total number of pixels included in the rectangles, as well as the percentage of specified pixels in relation to the total number of pixels. As stego-methods of the LSB category can be performed with different numbers of K bits that we change, this parameter took the values K = 3, 4 and 5 in the test. As explained earlier, due to the characteristics of the PVD method, it is not possible to choose the number of bits to be modified in the process of steganography, for each channel or for each pixel, so this method will be performed in the usual way, over the entire coverage object or over the stego-areas.
The idea of the Type 2 method is based on the right branch of the algorithm described in
Section 3. In this experiment, the number of dominant colors (DC) is fixed at N = 2, while the filtering coefficient is changed as FC = 1, 2, 3, 4. The reason why the parameter N is fixed to the number 2 is that in that case all the pixels are divided into only two large zones and therefore the effects of later filtering around the mean value of the shade for the corresponding cluster according to the FC coefficient are better and clearer. This is where we come to the moment of implementation of the assumption presented in
Section 4. Namely, the module for performing the stego-method, for MDD, is implemented with the possibility of influencing
K bits in areas belonging to zones Z
i′ as well as influencing
L bits in zones Z″ (so-called “colorful” areas). In this case, the carrier capacity is calculated as:
where
.
In order to better represent the quality behavior of stego-objects for Type 2, the parameter K will have a constant value of K = 3, while the parameter L will have values of 3, 4 and 5.
7. Analysis of Experimental Results Obtained
The results of all tests are presented in the form of a table and can be obtained upon direct request from the authors of this paper.
Table 1 as well as
Table 2 show the results for the stego-carrier Lena.png obtained based on processing for Type 1 and Type 2 methods, respectively.
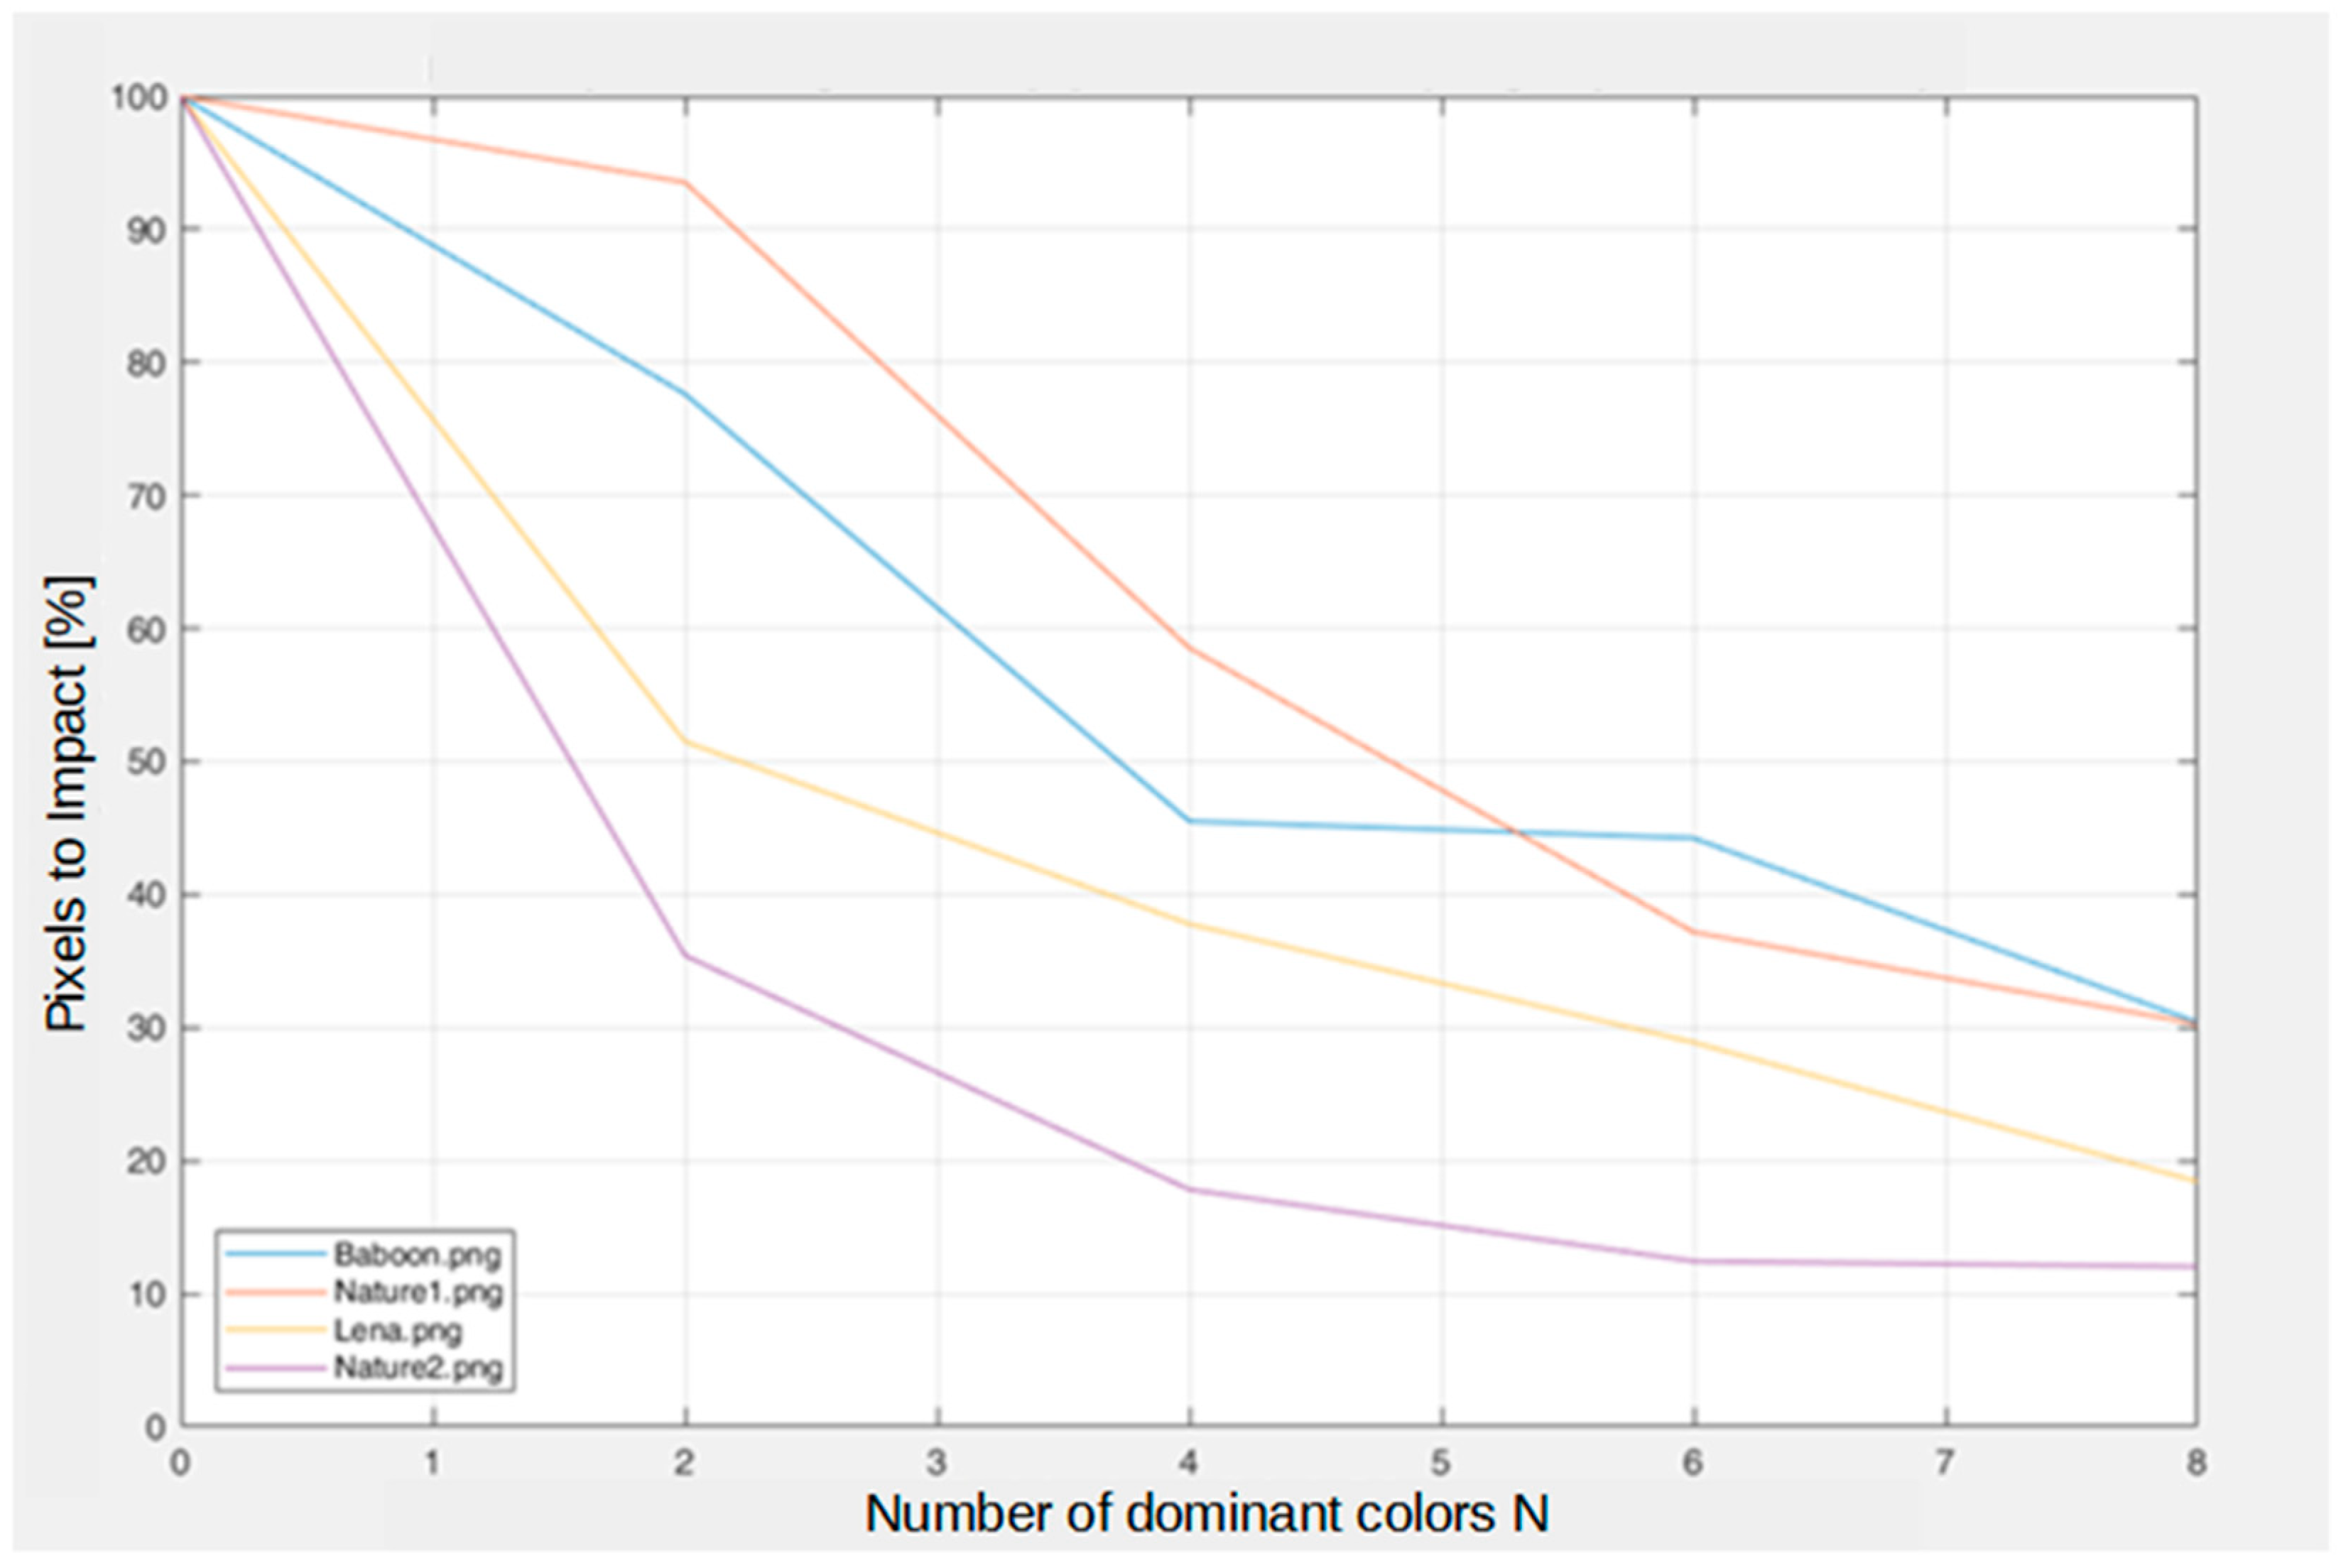
The results obtained for the Type 1 method (
Table 1) show that the carrier capacities decrease with the increase in the number of dominant colors. At the same time, we notice that for the carriers Baboon.png and Nature1.png the capacities decrease more slowly. On the other hand, with Lena.png and Nature2.png carriers, capacities decrease faster due to the characteristics of the images themselves. The change in capacity for different carriers is shown in
Figure 10.
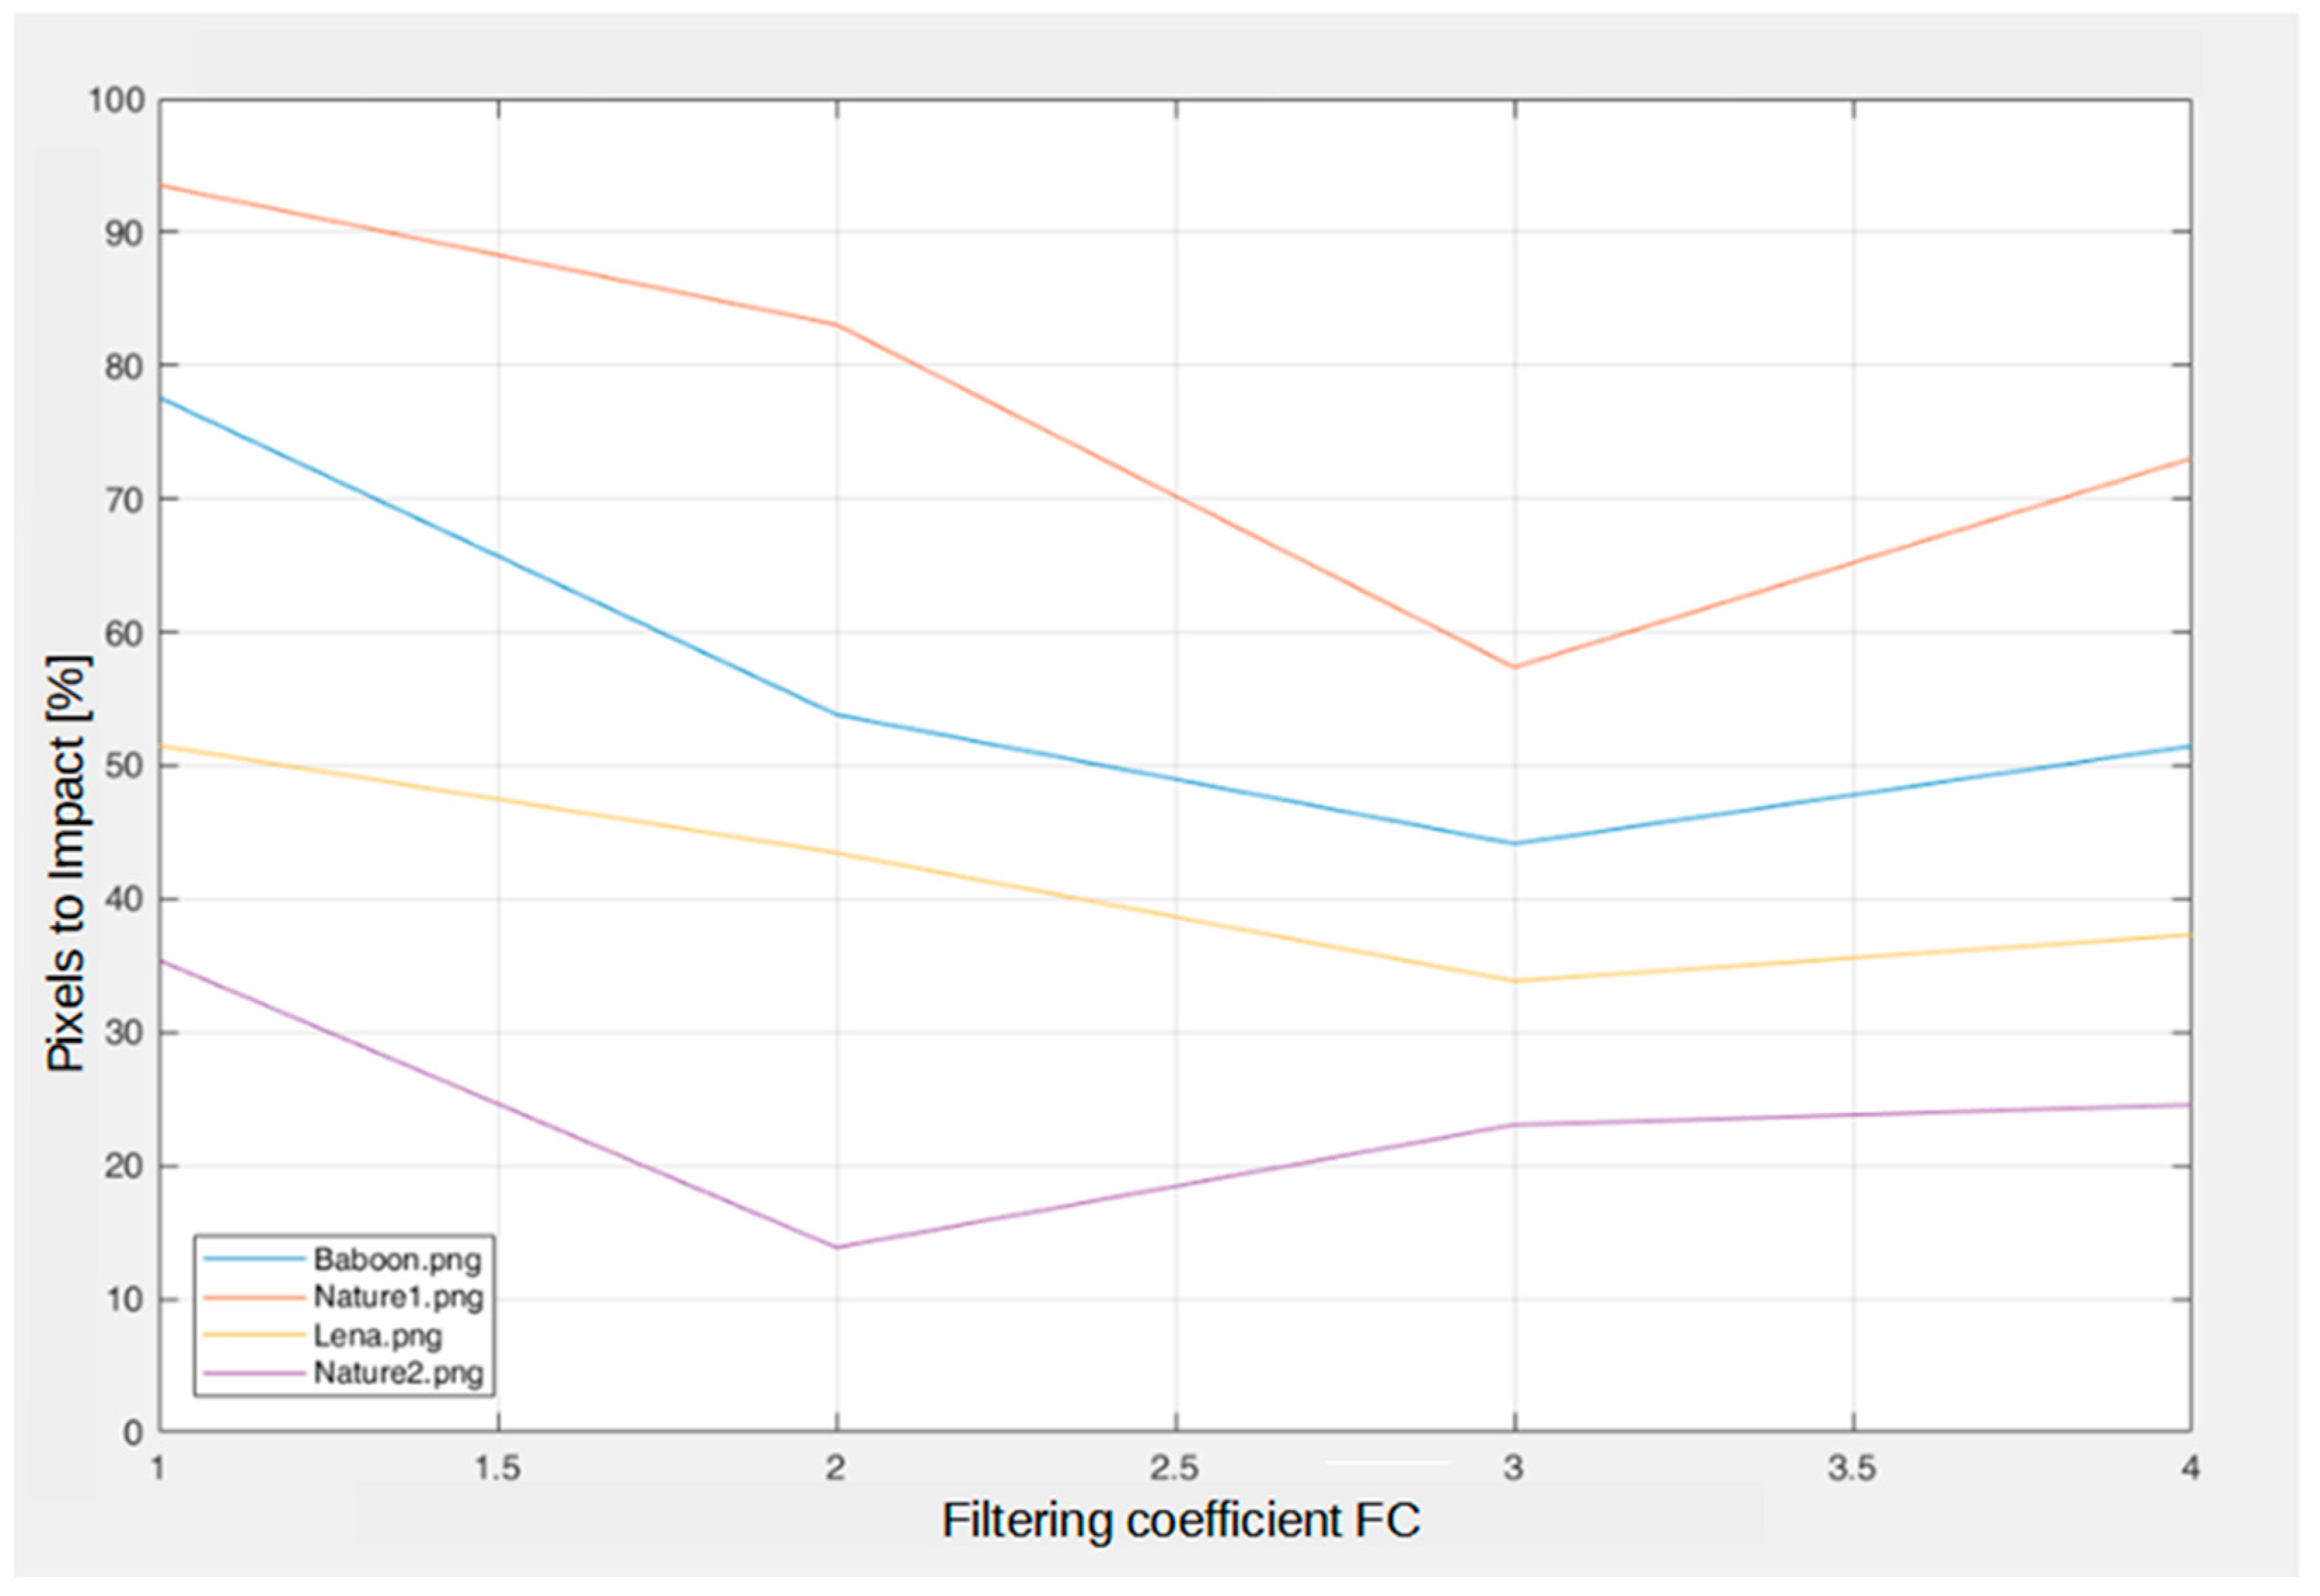
The Type 2 method is performed by selecting two dominant colors, changing the filtering coefficient in steps FC ∈ {1, 2, 3, 4}. In this way, the clusters around the two dominant colors are narrowed, and the areas in which the pixel values have larger deviations from the decimal values of the dominant colors are expanded. It is logical that with the filtration coefficient FC = 1 we obtain the same results as in the case of two dominant colors without numerical filtering (
Figure 11). It is interesting to note that for three carriers, the minimum capacity is reached at FC = 3, while for Nature2.png the local minimum capacity is reached se for FC = 2. This effect is a consequence of the type of carrier, i.e., the carrier’s characteristic is that it does not have large surfaces in the same or similar tones (colors). In order to better represent the average value of the occupancy of stego-carriers of rectangular surfaces after processing with the proposed algorithm, 250 images were randomly selected for processing.
Table 3 shows the average value of the percentage of occupancy of stego-carriers depending on the value of the input parameters of the algorithm (the number of dominant colors DC and the filtering coefficient FC).
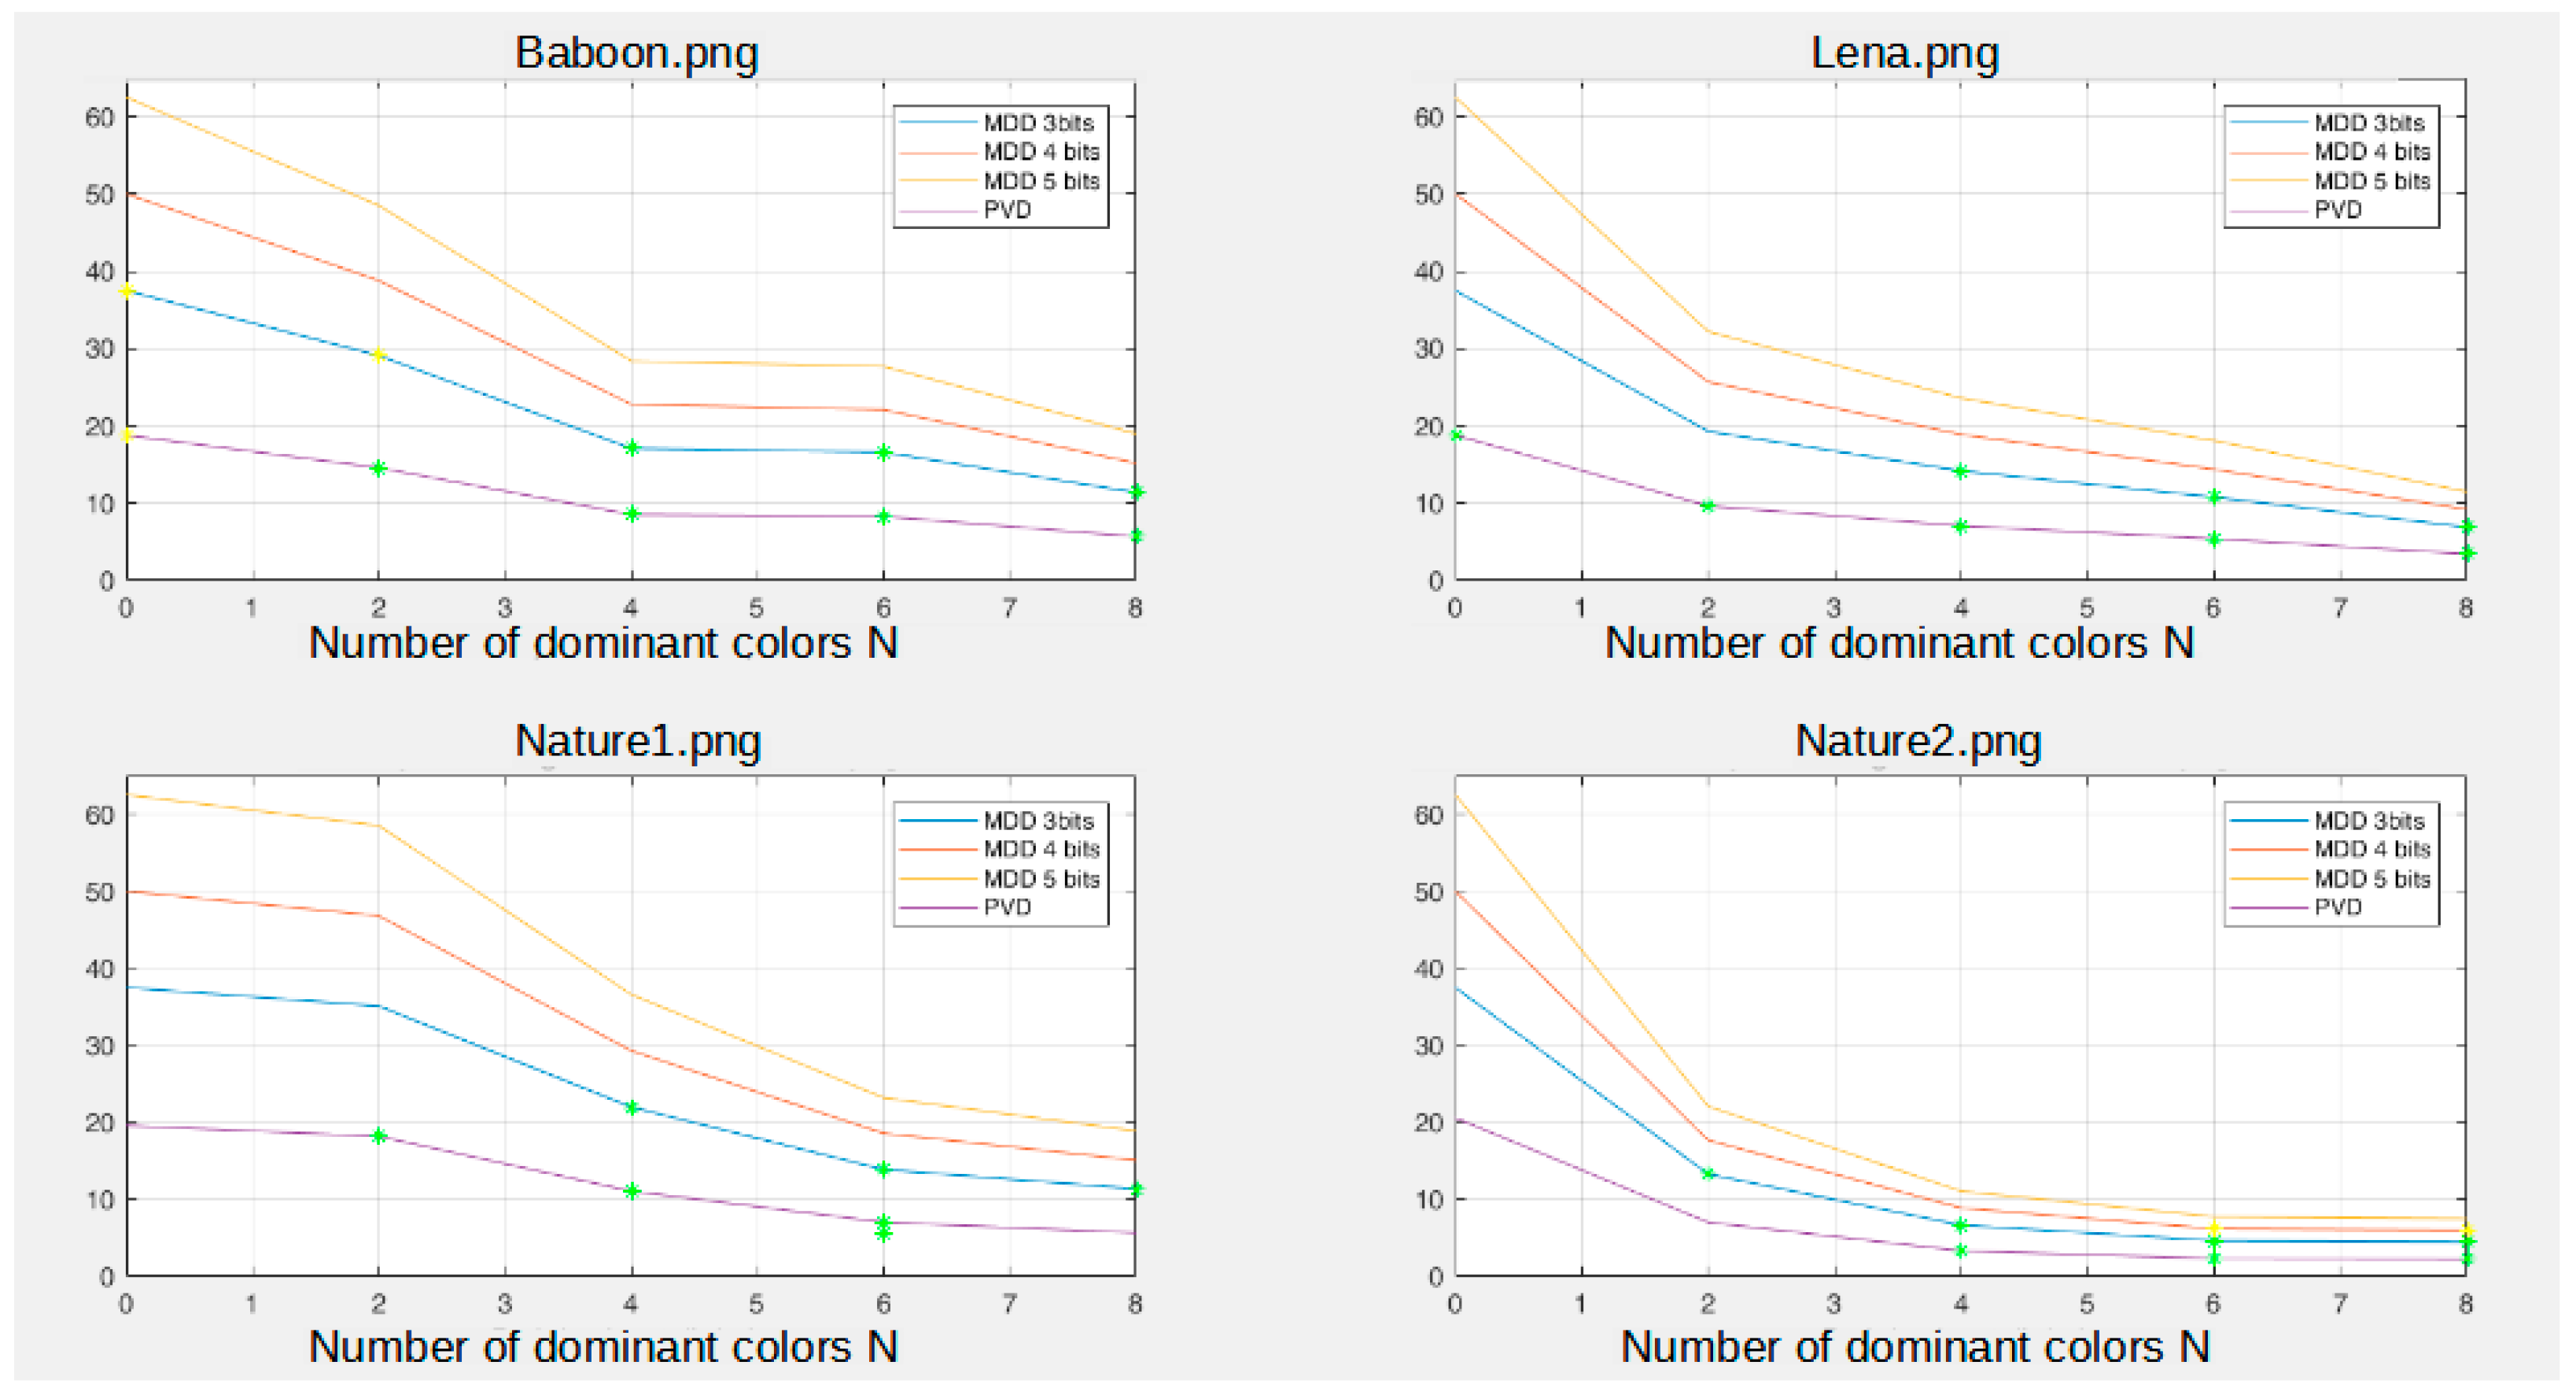
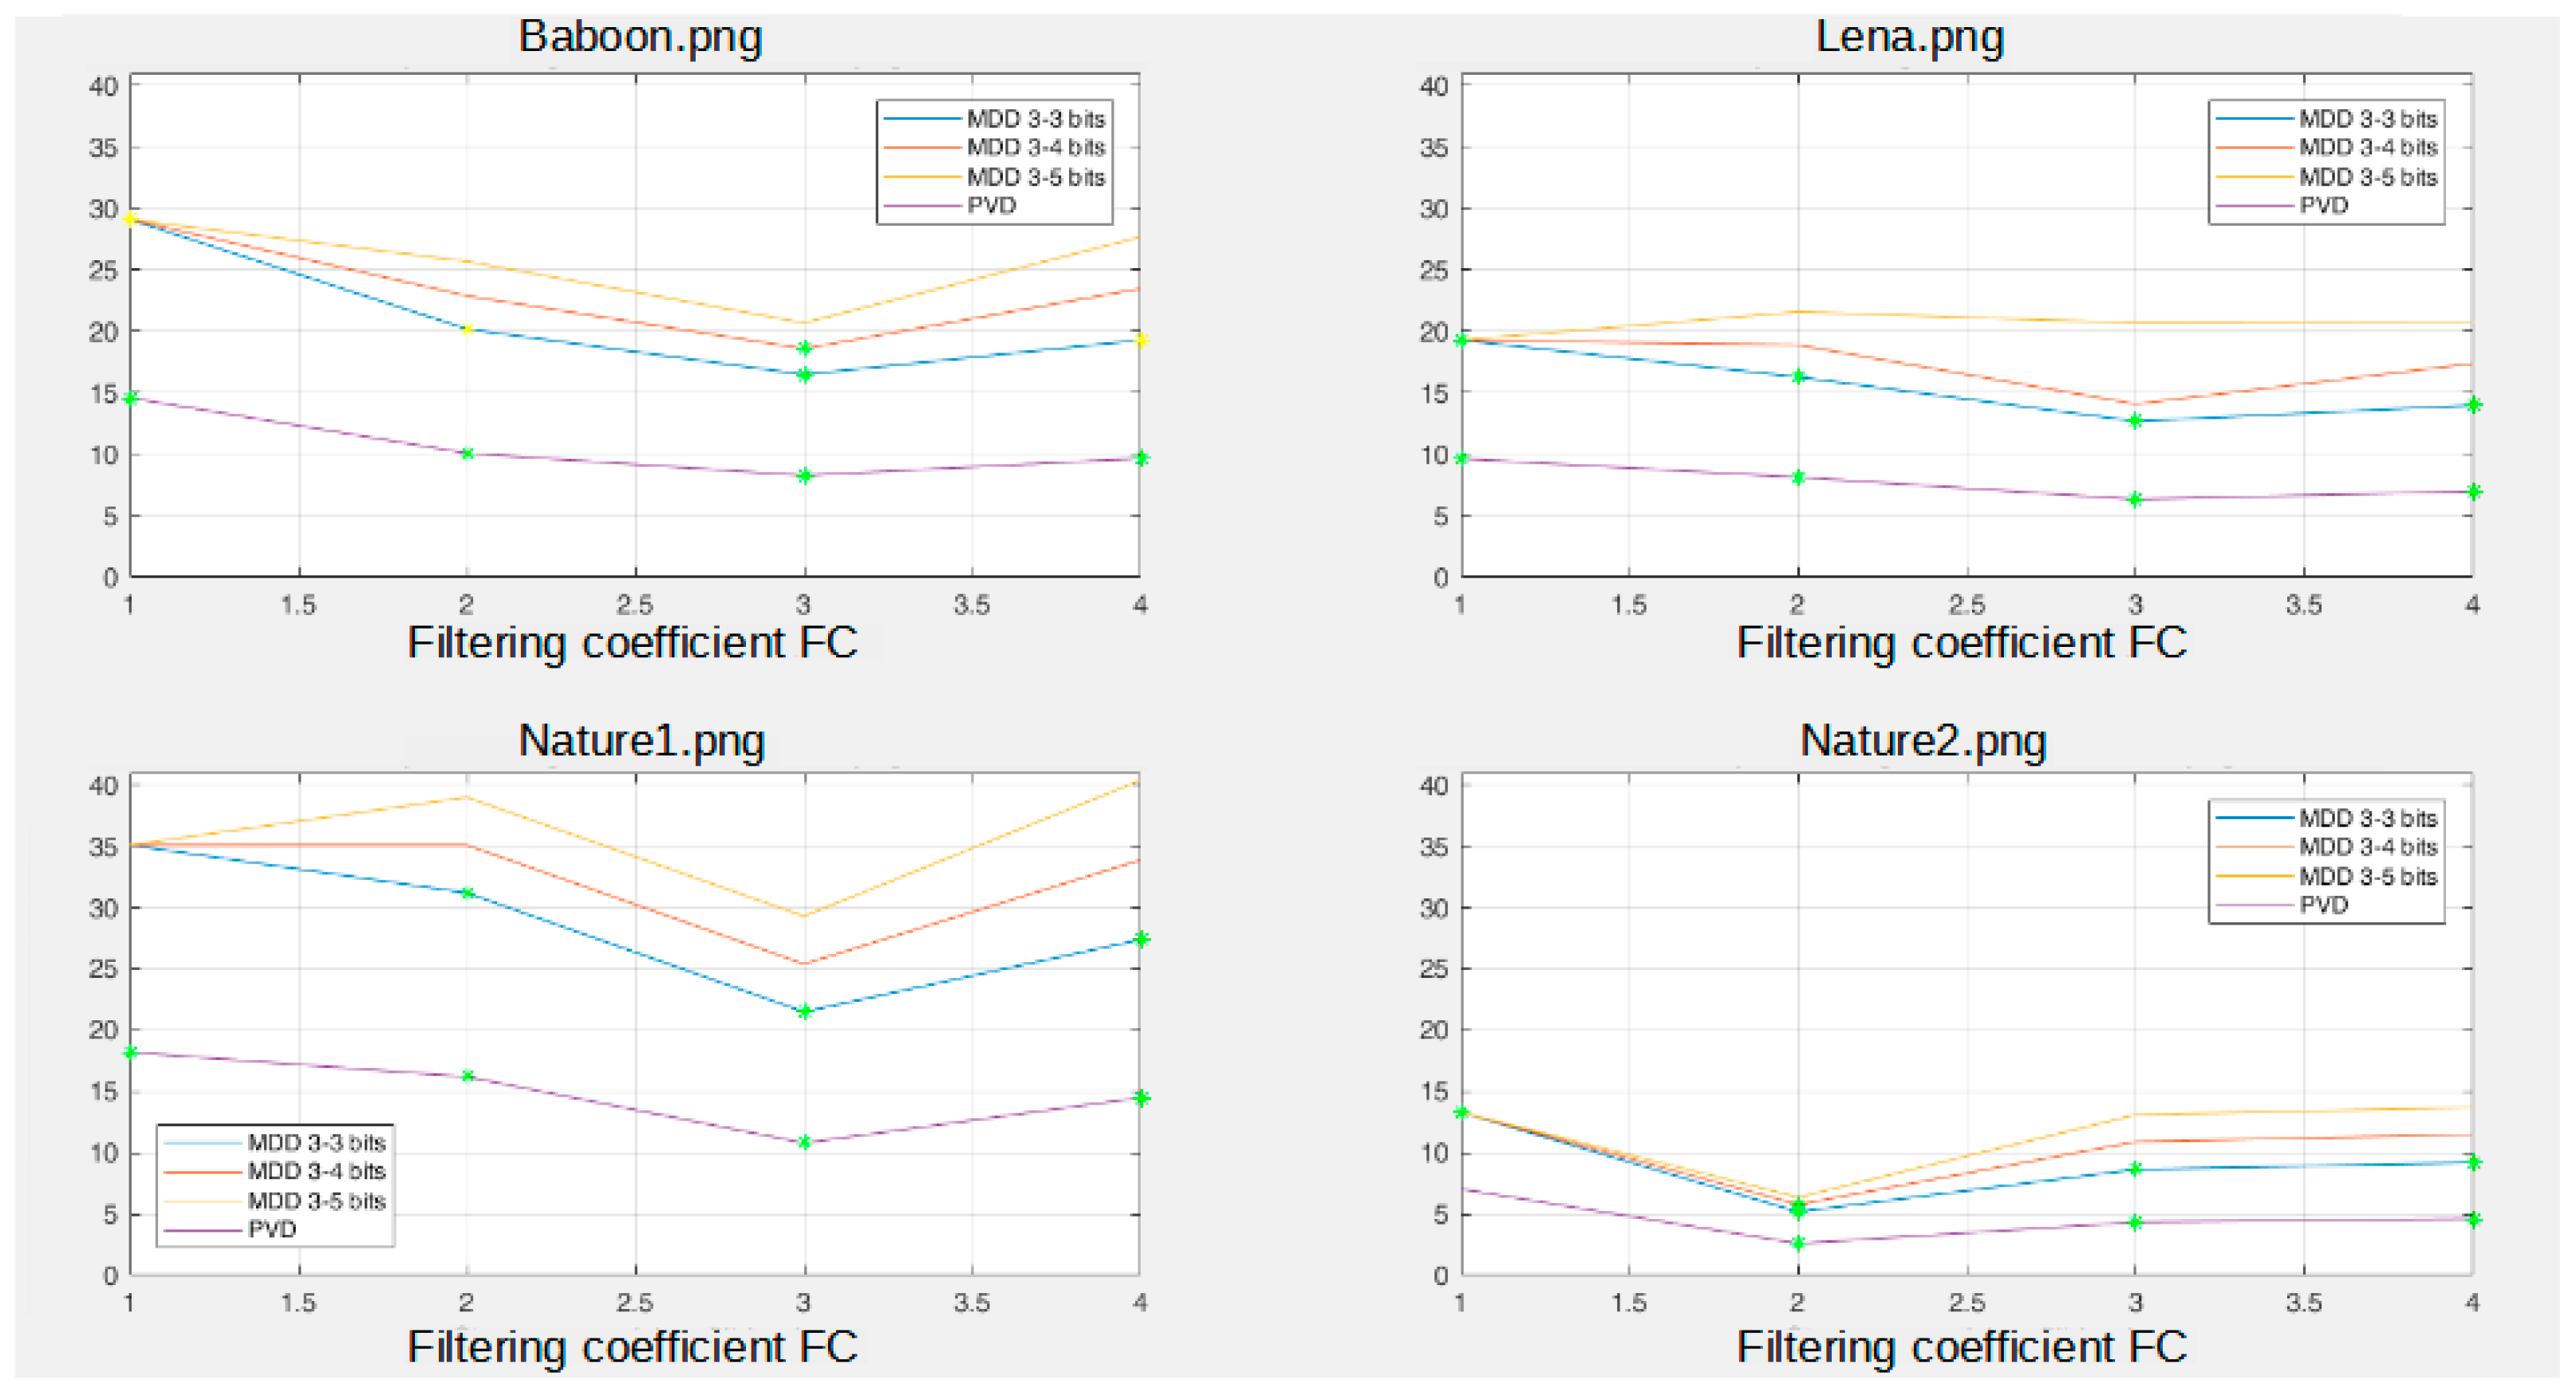
As for Type 1,
Figure 12 shows the change in carrier capacity for different methods, for different numbers of selected dominant colors. The graphs are generated based on the numerical data obtained by measurement, the yellow points show the values where the obtained results are considered good, and the green points show the values where the obtained results are considered excellent.
The benefit of steganography in the areas is reflected in the fact that due to the reduction in the capacity of the carriers, the cover object is qualitatively less degraded and thus meets the defined metric limits.
As for Type 2,
Figure 13 shows the change in carrier capacity for different methods, for different values of the numerical filtering coefficient (for DC = 2). The graphs are drawn based on the data from the mentioned tables, the yellow points show the values where the obtained results are considered good, and the green points show the values where the obtained results are considered excellent.
Based on the numerical results, it is clear that the SNR and PSNR metrics of the stego-objects decrease with the increase in the number of changed pixels, as well as with the increase in the number of LSB bits that we change. At the same time, by increasing the number of changed LSB bits, the mentioned metric degrades faster.
Several tests and examples have shown better performance of the MDD method compared to PVD, where for the same capacities the MDD stego-carrier gives a better metric or in cases where for similar metric values the MDD has a significantly higher capacity.
The minimum capacity in the graphs shows the best metric performance of the stego-objects, but we can also consider the optimal capacity value and the metric to the left and right of the minimum value, as far as the defined metric limits allow.
A comparative analysis of the results obtained for Type 1 and Type 2 methods leads to clear conclusions about the benefits of performing the MDD steganographic method in selected areas.
Table 4 and
Table 5 provide a comparative segment of the total set of results for stego-carriers Lena.png and Baboon.png
The benefit realized by performing steganography with a variable number of LS bits (K = 3, L = 4) for the same carrier capacity is clear.
The generated stego-objects were subjected to RS steganalysis and
Table 6 shows the values of the p
rs parameter for stego-objects generated by the MDD steganography method. For the purposes of comparing the behavior characteristics of the p
rs parameter, the measurement was performed both for the basic LSB method and for the PVD method. The comparative characteristics clearly indicate the dominance of the MDD method in relation to the basic LSB and PVD methods. For a complete set of obtained numerical results, contact the author of this paper.
As the process of steganography is performed only in certain parts of the stego-carrier, it would be useful to calculate the deviation values of the obtained p
rs parameters from the initial bias in relation to the percentage of pixels of the stego-carrier that were affected. Therefore,
Table 7 shows the stego-carrier occupancy for different input parameters of the image processing algorithm (expressed in percentages depending on the applied parameters K and L for the MDD method).
Table 8 shows the behavior of the detectability factor p
d, described in
Section 5, and was obtained based on the data from
Table 6 and
Table 7, which are used to calculate the cp factor from Formula 6.
The way the detectability parameter p
d is defined shows that the detectability of the secret content is higher if the value of the parameter p
d is closer to 1, while for the values of the parameter p
d closer to 0, the detectability of the secret content is lower.
Table 8 shows low values of the parameter p
d for stego-carriers Baboon, Lena and Nature2, while somewhat higher values of the parameter p
d were obtained for stego-carrier Nature1. The reason for this is the large areas of the same shades of blue (sky) and green (grass).
The conclusion indicates that this type of stego-carrier should generally be avoided in order to prevent obtaining higher values of the detectability factor p
d.
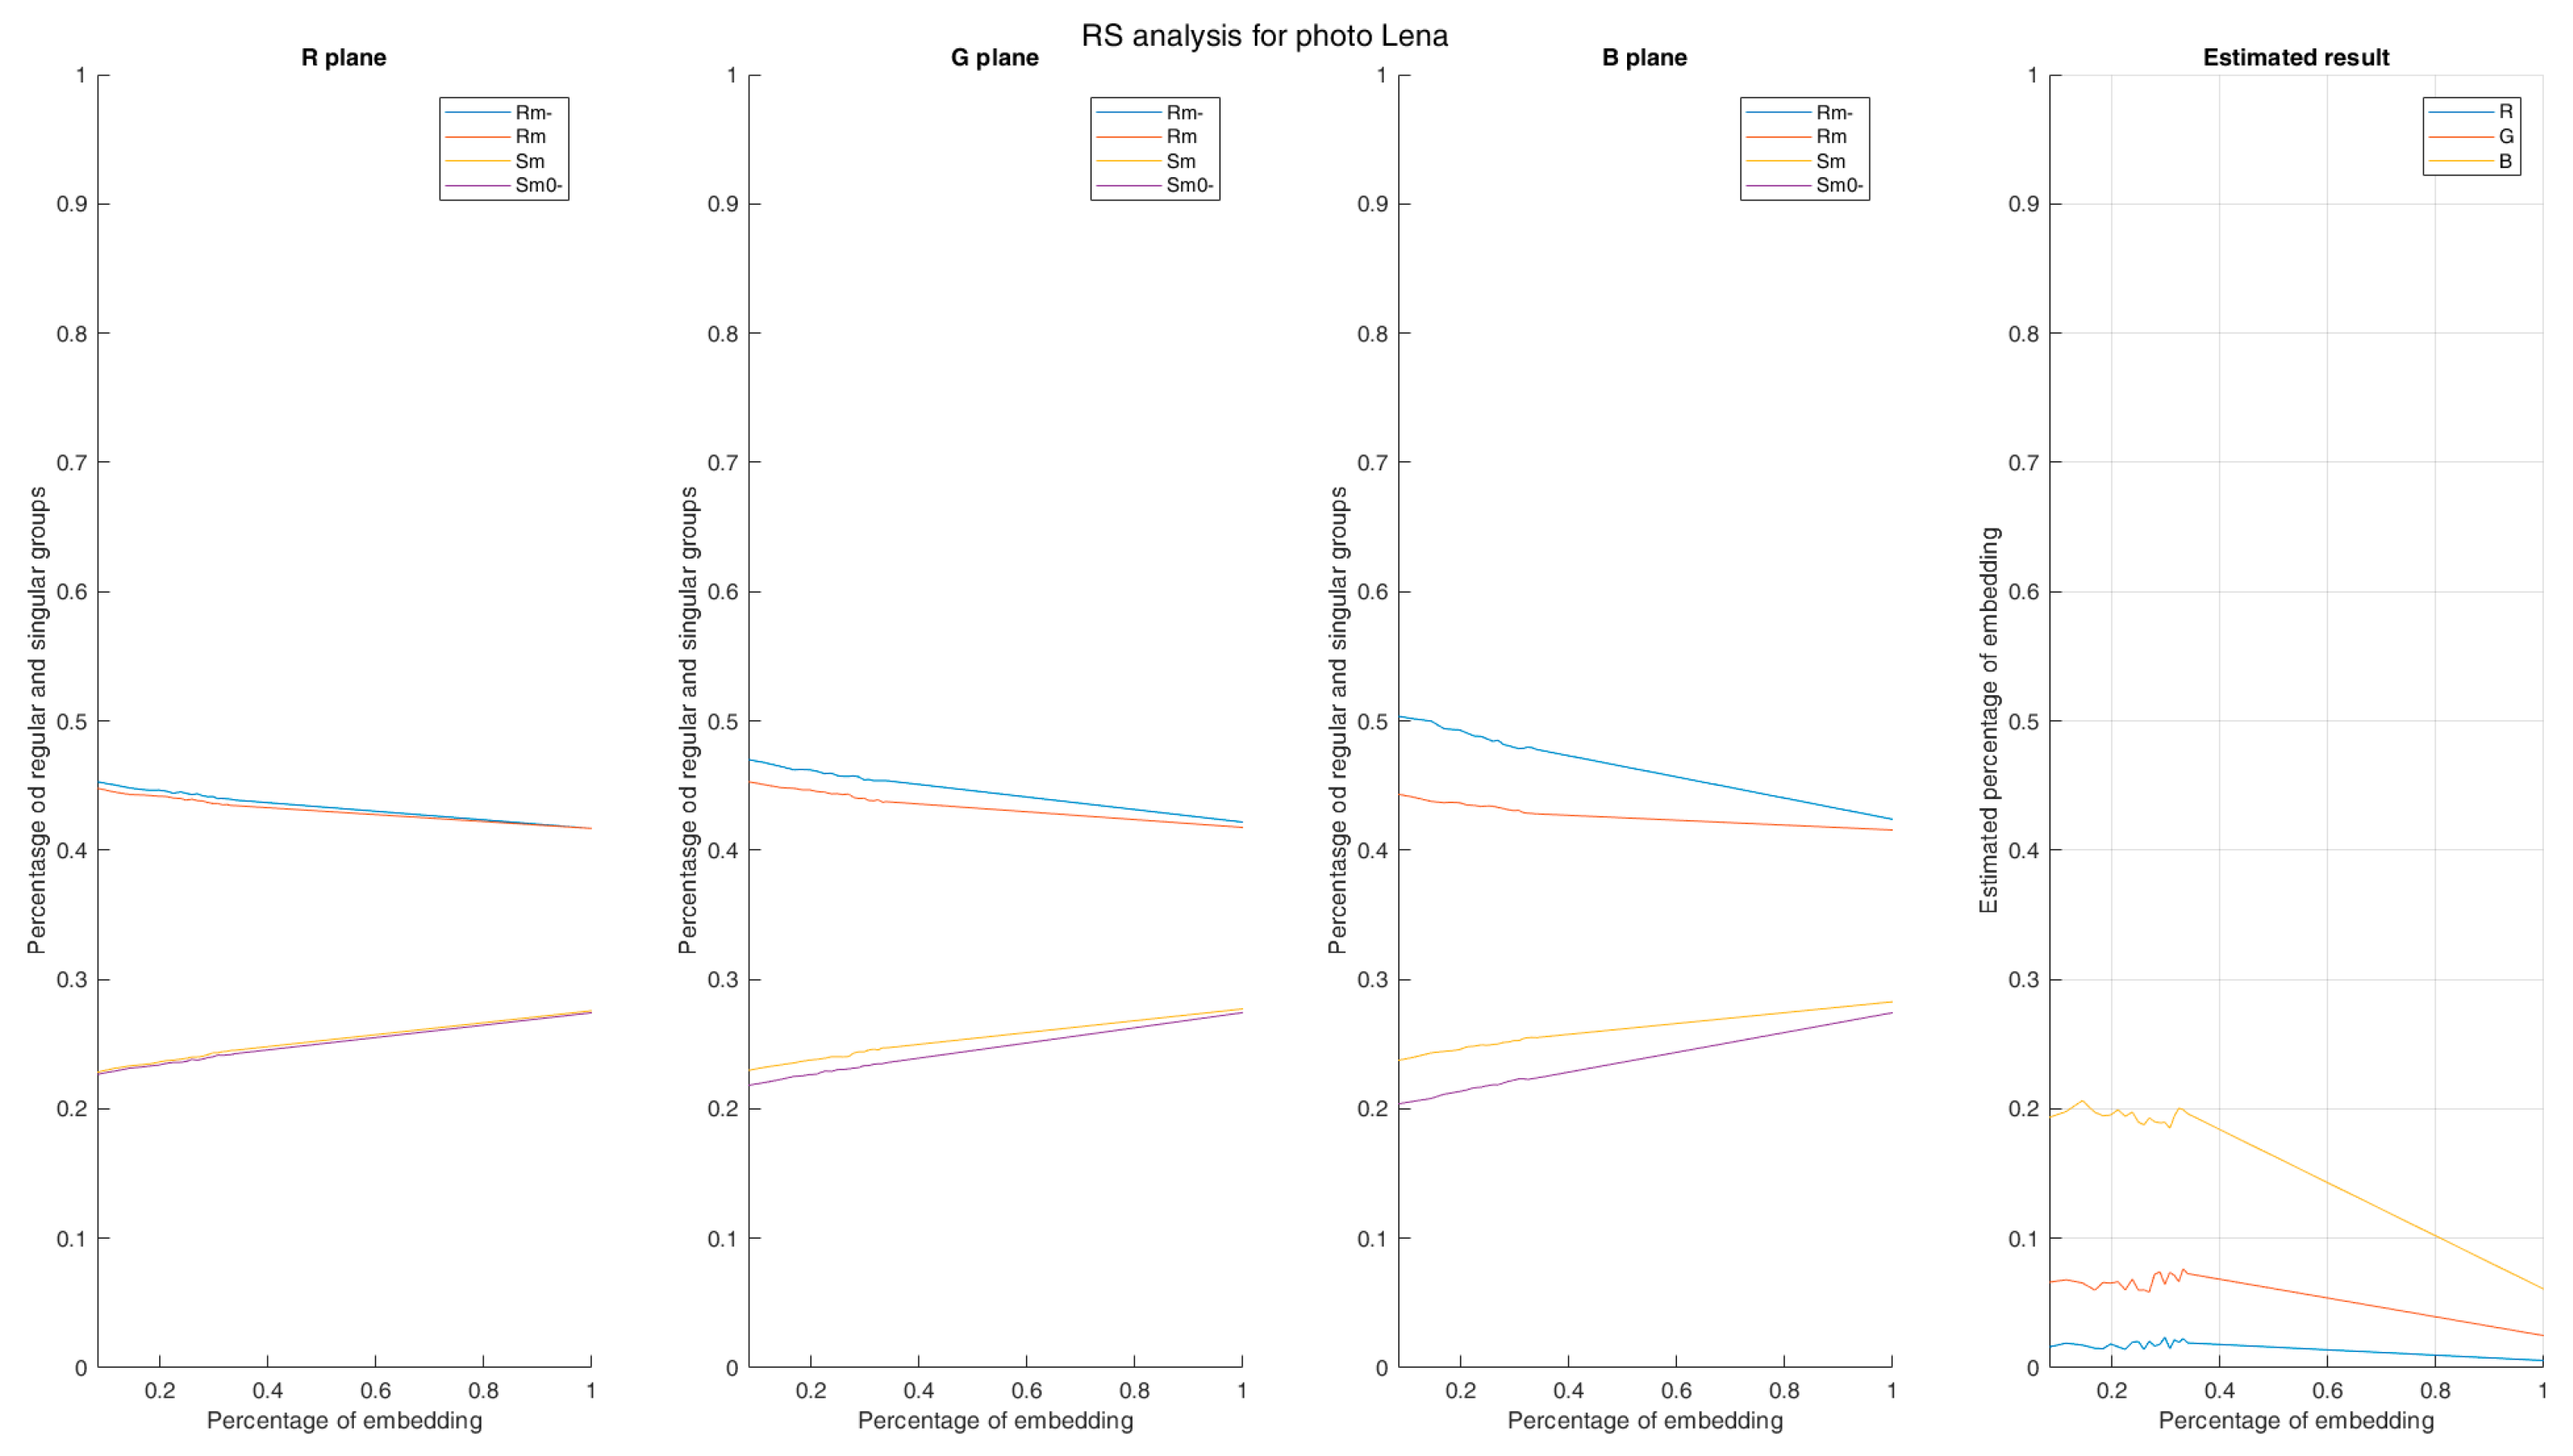
Figure 14 shows RS diagrams for stego-object Lena.png.
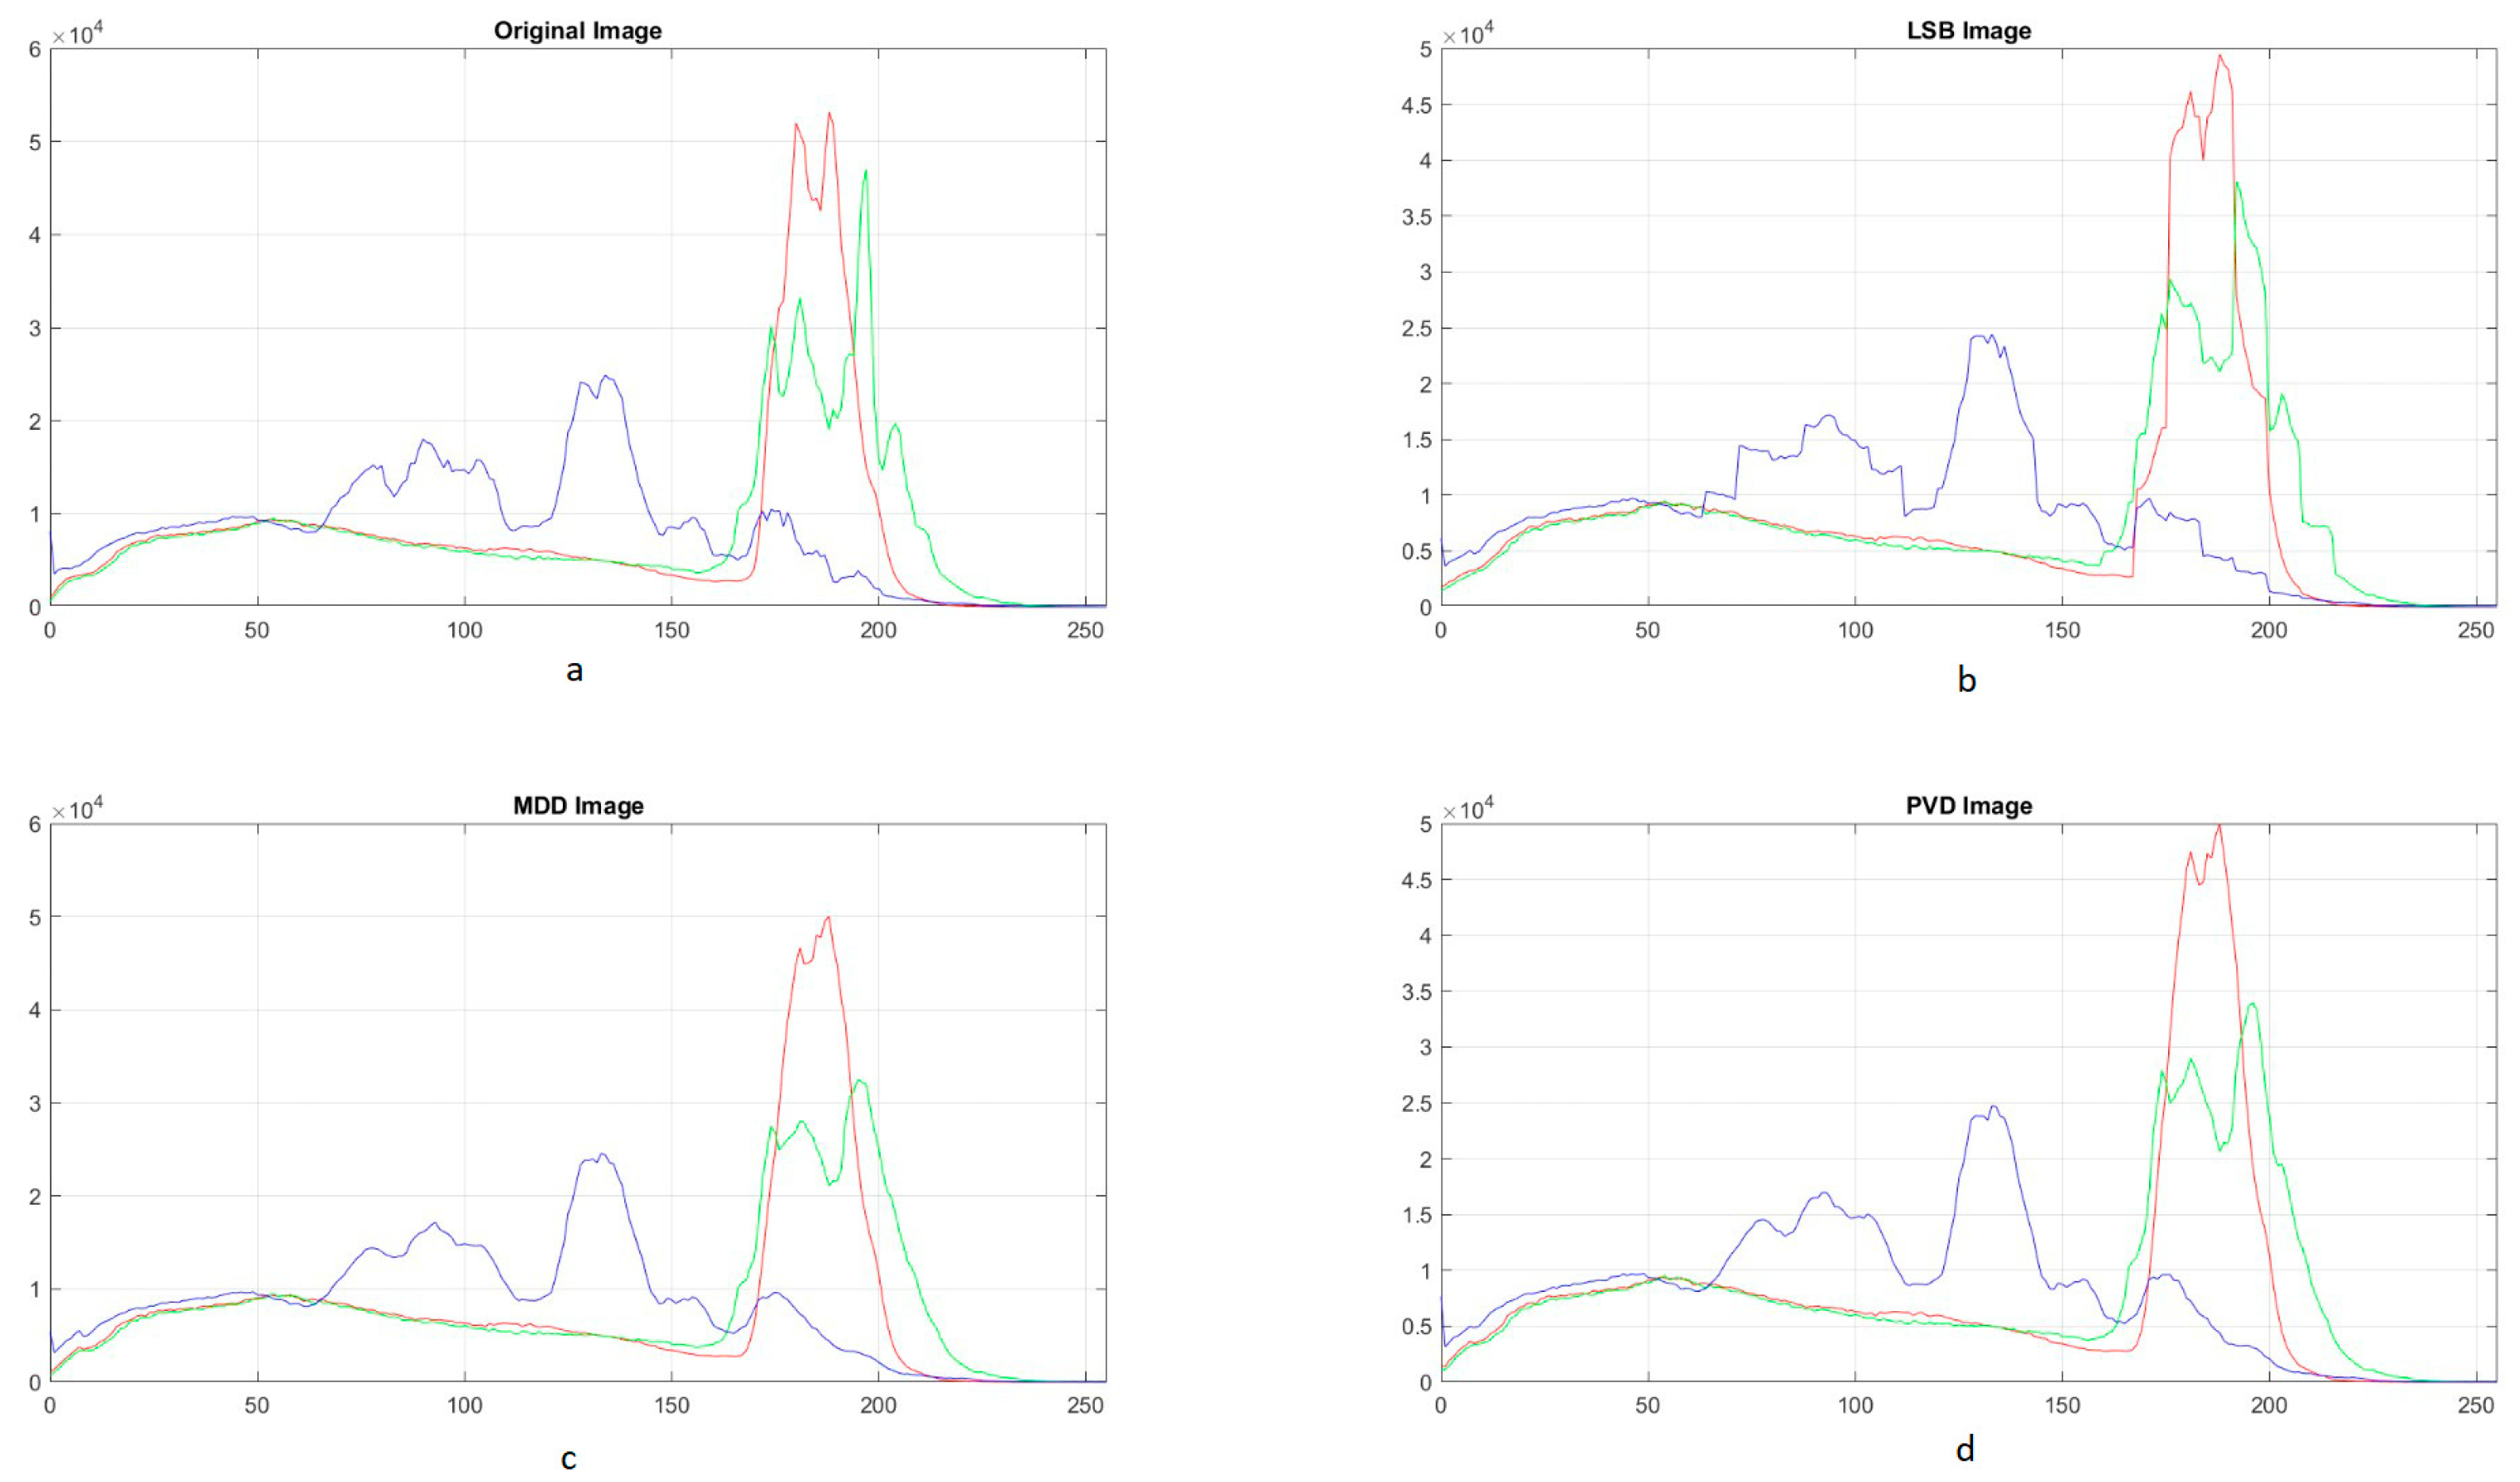
Figure 15 shows histograms for stego-objects obtained by the classical LSB method, the MDD method as well as the PVD method. The histogram for the stego-object obtained by the classic LSB method has noticeable deviations from the histogram of the original stego-carrier, while the histogram of the stego-object obtained by the PVD method is the least distorted with the fact that this stego-object has approximately twice the capacity of the stego-object obtained by the MDD method.
In general, the classical steganographic LSB method leads to the quantization of the histogram in 8-K zones, where K is the number of LS bits that we change. This histogram behavior is very unfavorable in the context of stego-analysis. The MDD method shows better histogram behavior, with less distortion and no quantization effects, as shown in [
18].
By performing steganographic procedures on certain areas of the carrier, the distortion of the histogram of stego-objects in relation to the original carrier is additionally reduced, and therefore the price is paid in the reduction in the capacity of the stego-carrier.
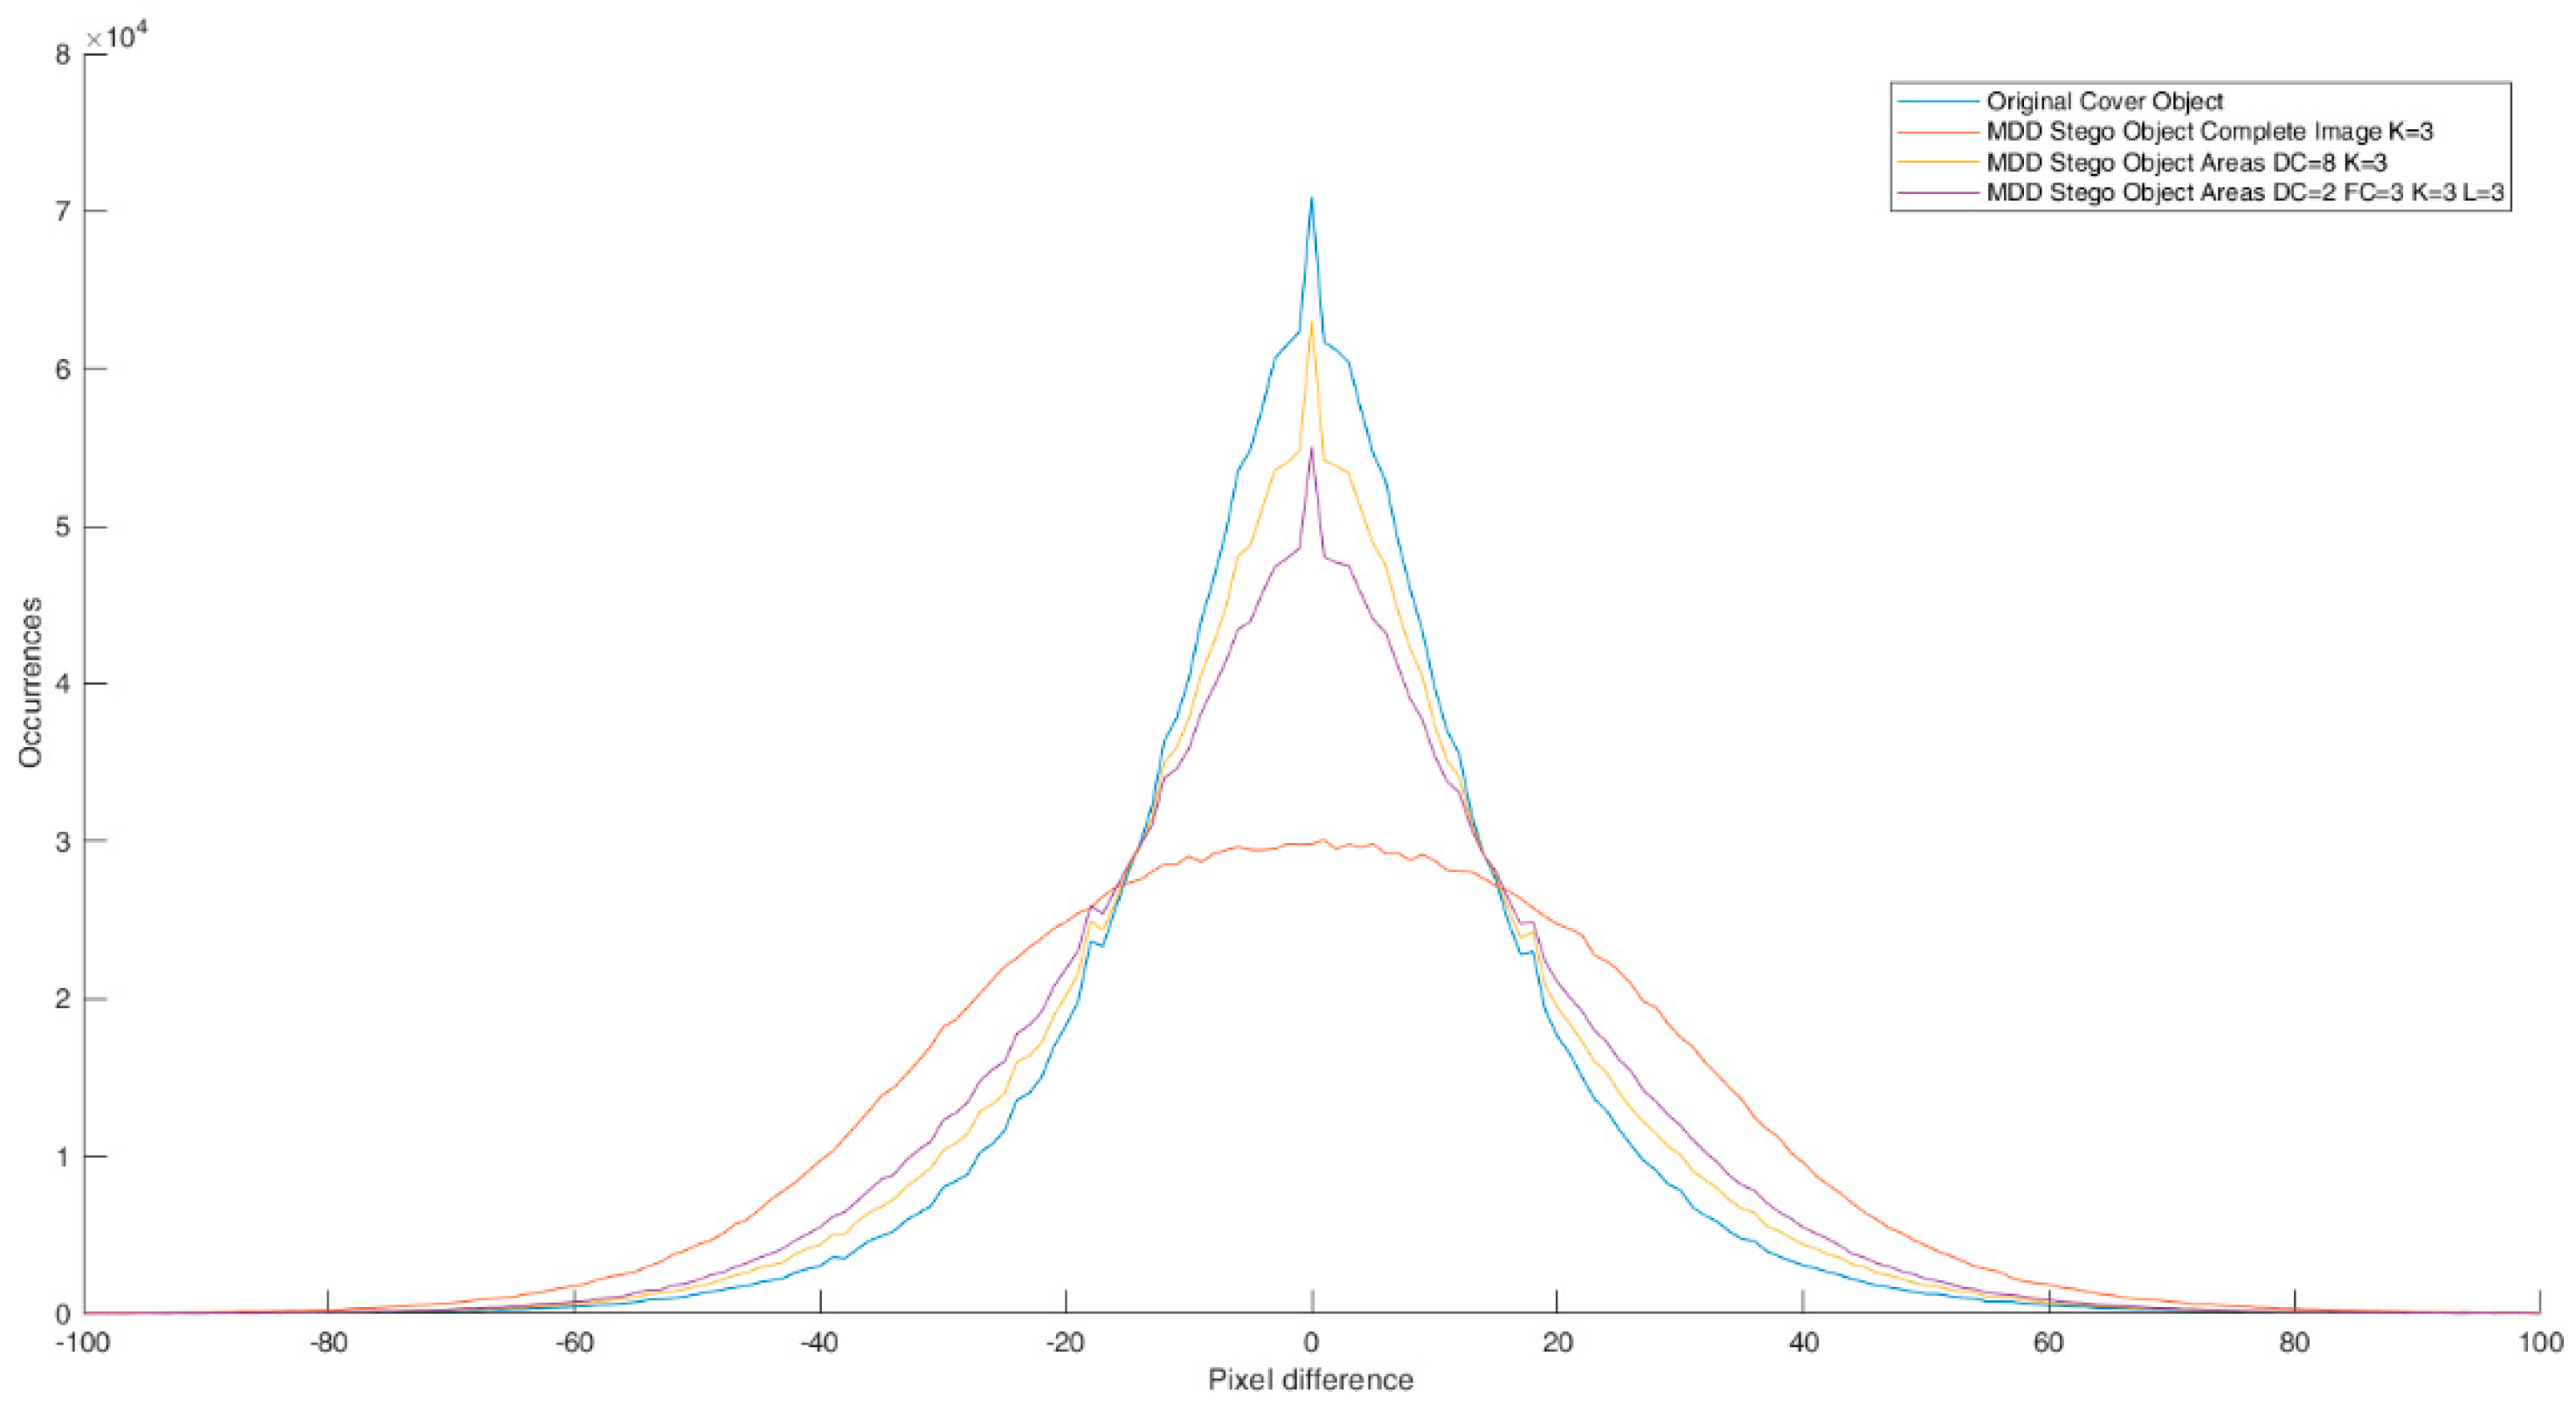
Figure 16 shows a significantly smaller distortion of the pixel difference histogram in MDD stego-objects where the steganography procedure is performed in areas compared to the case when the steganography procedure is performed over the entire image (red line).
For the purposes of comparison with related works and methods of adaptive steganography by other authors,
Table 9 shows the capacity (expressed in percentages and in bpp) and PSNR values for different stego-objects, obtained with different input parameters proposed by the algorithm using different stego-carriers.
The results from
Table 9, in the first case, will be compared with the results from
Table 10.
Table 11 represents the sublimated last row (average values) of
Table 3 from [
7] where the capacities are expressed in percentages by the ratio of the number of embedded bits to the total number of image bits (having given that the authors used images with a size of 512 × 512 pixels) while the PSNR values were kept in the original format. So, for example, for 2,385,386 imprinted bits, the capacity is 2,385,386/(512 × 512 × 3 × 8) = 0.3791—that is, 37.91%.
It is clearly observed that the stego-objects obtained by the Khodaei and Faez method as well as by the G. Swain method have higher capacities and significantly worse PSNR values compared to the values of the proposed method shown in
Table 9. Trying to make a comparison between the results shown, we suggest beginning by focusing on the fifth row of
Table 9 and the obtained average values of 18.22% for capacity and 44.16 dB for PSNR. This result was chosen because 18.22% represents approximately twice the capacity of Khodaei and Faez and G. Swain in
Table 10. From the example, it can be seen that for stego-objects with twice the capacity, the proposed method gives a PSNR value that is more than 4 dB higher than the value obtained by Khodaei and Faez and slightly less than 4 dB higher than the value obtained by the method of Gandharba Swain.
A direct comparison will be performed with the results of the method of A. Ioannidou, S. T. Halkidis and G. Stephanides presented in [
9].
Table 11 is a sublimation of
Table 1 from [
9] in which the authors provide a comparison of their results with the method proposed by Chen in [
20]. As in the previous case, in
Table 11 the capacities of the carrier are expressed in percentages, bearing in mind that the authors Ioannidou, Halkidis and Stephanides used images with a size of 128 × 128 pixels.
Table 11 shows low stego-carrier capacity values expressed in percentages as well as in bpp, on the one hand, and solidly high PSNR values, on the other hand. By comparing the bpp and PSNR ratio from
Table 9, the stego objects obtained by the proposed method in this paper and the values from
Table 11, it is clearly seen that the capacity obtained by our proposed method is significantly higher for similar PSNR values. So, for example, if we focus on the penultimate row in
Table 9 for the stego-carrier Nature2, we see that with a similar value of PSNR (46.92 dB) we obtain a significantly higher capacity–2.07 bpp, while with the I.H.S. method that value is significantly lower—1.26 bpp.
An interesting algorithm based on hybrid edge detection is presented in the paper [
21]. The results presented in this paper show extremely high PSNR values (
Table 1) at the cost of some capacity reduction expressed in bpp (
Table 2).
Table 12 shows a comparison of the results obtained in the experiments, showed in
Table 9, with several results from [
21] (cover image–Lincoln, hidden image–Barbara, Cameraman).
It is observed that the results obtained by the proposed method are comparable and similar to the results presented in [
21] in the terms of the ratio of quality and capacity expressed through PSNR and bpp.
When it comes to the resistance of the proposed method to different types of attacks such as cropping, compression, filtering or noise addition, it should be kept in mind that the complete system is made up of two independent parts: the algorithm for selecting the stego area and the implemented stego method. Different steganographic methods provide different degrees of robustness of stego objects and resistance to image sterilization processes. Some sterilization techniques are presented in [
22,
23,
24]. As the MDD method belongs to the category of LSB steganography (in spatial domain), it is not resistant to different types of attacks or the sterilization of the stego object. On the other hand, if the stego area selection algorithm were to be combined with another steganographic method more resistant to attacks (such as the steganography methods in frequency domain [
3]), it is to be expected that such a system would show improvements in the context of security, which can be the subject of further research. However, considering the application of this system for higher levels of protection, each detection of any kind of attack attempt entails a change in the communication channel.
8. Conclusions
On the basis of the proposed experiment, the tests performed, the results obtained and the analysis carried out, the justification of performing steganography in the selected areas was proven. In addition to increasing the safety of the stego-process itself, it was shown how the desired quality of stego-objects is achieved by degrading the capacity of the carrier. Furthermore, the method of selecting the input parameters of the algorithm, depending on the performance of the carrier, is shown in order to achieve the appropriate capacity/quality ratio. The introduction of additional filtering of pixels within a specific cluster open up a much wider range of possibilities in the way of setting the input parameters in order to achieve the desired effects.
Section 7 shows the validity of the assumption presented in the previous sections. In fact, it has been shown that by using a different number of bits for the steganography process in areas of similar colors and hues, steganographic areas containing several different colors can have their advantages for appropriately chosen input parameters of the algorithm. Finally, the dominance of the MDD method over the PVD method is shown. The MDD method in most cases gives better performance as well as the possibility of choosing the LS bits that we influence (K and L). The PVD method showed that there is no difference in performing the stego-process in areas of similar colors or in “colorful” areas. For that reason, the PVD method should be chosen in situations where high quality of the stego-object is important for low capacity values. A high degree of resistance of MDD stego-objects to the process of steganalysis is shown. By comparing the capacity parameters and PSNR values with the values obtained by the authors of similar adaptive steganography methods, the competitiveness of the proposed method was proven.
It is important to note that the basic idea of this approach to the problem has already found its application in several current projects, i.e., systems for secure file exchange, where after the data encryption process, such a hybrid process of steganography is implemented in order to overcome the problem of banning the use of encrypted files on some mail services and clouds (vPCP-FC) [
25]. In order to be practically applied in a software solution, the described algorithm must satisfy the following limitations: the maximum number of rectangles on one carrier must be defined, as well as the minimum size of the stego-surface expressed in pixels or as a percentage of the total size of the carrier, in advance.
The disadvantages of this approach can be considered as increased complexity of the system, time required to execute the algorithm for selecting stego-areas, reduced capacity of carriers, the need for an additional method for transmitting information about the number and positions of the stego-area.
Finally, an idea for further work and research could be the implementation of several more steganographic methods of different categories, as well as the creation of a feedback loop in the system (
Figure 1 shows the red dotted line). Such feedback would enable the system to select the stego-area, stego-method and stego-process parameters for the appropriate carrier, desired capacity and quality of stego-objects. In addition, combining the proposed algorithm for area selection with more robust steganographic methods could be the subject of further research in order to create stego objects more resistant to stego attacks as well as the sterilization process. Another branch of the approach to the problem could be reflected in the development of a more advanced algorithm for selecting stego-areas, where the areas of the carrier, in which the secret content would be imprinted, have some other regular geometric shape or even an irregular geometric shape. One of the results of the proposed algorithm for the selection of the stego area, based on the homogenization of the parts of the carrier, can be the detection of typical shapes, objects and contours. As algorithms based on deep learning techniques presented in [
26] have the same goal, one of the directions of further research could be to combine these techniques.


