Abstract
This study examined the impact of custom foot orthoses made of ethyl-vinyl acetate (EVA) and expanded thermoplastic polyurethane (TPU) materials, both compared to a control condition (CON; shoes only), on mechanical asymmetries during repeated treadmill sprints. Eighteen well-trained male runners executed eight, 5-s sprints (rest: 25 s) on an instrumented motorized treadmill in three footwear conditions (EVA, TPU, and CON). We evaluated the group mean asymmetry scores using the ‘symmetry angle’ (SA) formula, which assigns a score of 0% for perfect symmetry and a score of 100% for perfect asymmetry. There was no condition (all p ≥ 0.053) or time (p ≥ 0.074) main effects, nor were there any significant time × condition interactions on SA scores for any variables (p ≥ 0.640). Mean vertical, horizontal, and total forces presented mean SA values (pooled values for the three conditions) of 2.6 ± 1.9%, 2.9 ± 1.6%, and 2.4 ± 1.8%, respectively. Mean SA scores were ~1–3% for contact time (1.5 ± 0.5%), flight time (3.0 ± 0.3%), step frequency (1.1 ± 0.5%), step length (1.9 ± 0.7%), vertical stiffness (2.1 ± 0.9%), and leg stiffness (2.4 ± 1.1%). Mean SA scores were ~2–6.5% for duration of braking (4.1 ± 1.6%) and propulsive (2.4 ± 1.0%) phases, and peak braking (6.2 ± 2.9%) and propulsive (2.1 ± 1.4%) forces. In well-trained runners facing intense fatigue, wearing custom foot orthoses did not modify the observed low-to-moderate natural stride mechanical asymmetries.
1. Introduction
Human gait for a range of slow-to-fast running speeds is rarely perfectly symmetrical, even on a treadmill in laboratory-controlled conditions [1]. As such, practitioners regularly quantify bilateral leg differences or asymmetries as a screening/testing tool [2], as asymmetrical stride patterns can lead to higher metabolic energy expenditure [3] and an increased risk of re-injury [4]. Multiple techniques are available to calculate asymmetry (such as limb symmetry index, asymmetry index, or bilateral strength index), each with merits and drawbacks (for review, see [5]), exist. The symmetry angle (SA) is a dimensionless measure of asymmetry that is not prone to artificial inflation [6], which has been adopted in several sprint running studies [7,8].
Recent studies have extensively detailed the biomechanical effects of fatigue during repeated treadmill sprints [9,10]. By enabling the continuous measurement of vertical and horizontal ground reaction forces, instrumented sprint treadmills make it possible to estimate the mechanical loads exerted on the musculoskeletal system as fatigue develops [11]. Despite computing sprinting kinetics and kinematics from both left and right sides, available repeated-sprint studies almost exclusively report the average between legs [8,10]. This approach assumes that adjustments to sprinting mechanics are not different between body sides, and that both legs would actually fatigue at a similar rate. Additionally, much of what we currently know about mechanical stride asymmetries has come from studies involving individuals wearing “standard” footwear, such as shoes alone.
Several interventions, including improved footwear or other assisted devices (i.e., inserts [12]), could be effective in restoring the symmetry of gait. Custom foot orthoses (CFOs) are devices created by a podiatrist from a three-dimensional representation of the individual’s foot, which are designed to enhance comfort by decreasing plantar pressure and/or shock accelerations [13]. Although still a controversial issue [14], wearing CFOs bilaterally can minimize imbalances for selected biomechanical variables, and could thereby represent a preventive tool in clinical populations. A study on male children with flexible flat feet found that foot orthoses reduced the asymmetry of the frontal plane hip joint moment, but had a minimal impact on ankle and knee joint asymmetry [15]. To date, however, identification of potential adjustments in asymmetry scores during ‘all out’ runs with versus without CFOs, as well as changes in their magnitudes over sprints repetition in trained (i.e., healthy) individuals, is currently lacking.
Enhanced comprehension regarding the impact of inserts composed of varying materials is necessary for assessing the rehabilitation or return-to-sport process and for monitoring athletic performance [16]. It can be argued that smaller or larger asymmetries in certain mechanical variables may develop during sprinting as a result of one leg being functionally weaker or stronger when the athlete is pushing each leg to its limit [17]. The stiffness of CFOs (ranging from more flexible to stiffer inserts) is anticipated to have an impact on the device’s energy storage and return abilities and, consequently, its effectiveness. However, this has only been explored in untrained individuals walking at normal speeds [18]. All of these situations call for research into whether CFOs made of varying materials, but constructed identically, provide protection against excessive imbalances during acute fatigue intense.
This study aimed to investigate the impact of CFOs made from ethyl-vinyl acetate (EVA) and expanded thermoplastic polyurethane (TPU) materials in comparison to a control condition (CON; shoes only) on mechanical asymmetries during repeated treadmill sprints. We hypothesized that wearing CFOs would alter the impact of intense fatigue on the magnitude and range of asymmetry in some kinetics and kinematics, while only minor differences would be observed between the inserts in terms of bilateral leg asymmetry.
2. Materials and Methods
2.1. Participants
This study recruited eighteen male well-trained athletes (age, 38.9 ± 5.1 years; stature, 175.3 ± 5.8 cm; body mass, 74.9 ± 7.7 kg; maximal oxygen uptake, 49.1 ± 6.6 mL · min−1 · kg−1; maximal aerobic speed, 18.4 ± 1.6 km · h−1). On average, they trained for 8.8 ± 3.7 h per week in the three months leading up to data collection with an average weekly running distance of 37.6 ± 26.7 km. Out of the participants, 13 struck the ground with their rear-foot, one with their midfoot, and four with their forefoot while running at a speed of 10 km · h−1. The study was approved by the Anti-Doping Laboratory Ethics Committee in Qatar (IRB Application Number 2017000201) and was conducted in accordance with the Declaration of Helsinki, with written informed consent obtained from participants.
2.2. Protocol Overview
This study was part of a larger project investigating the effects of CFOs on stride mechanics during repeated treadmill sprints, but the primary outcome measures reported here (SA scores) are distinct from previous analyses [19,20]. This study used a counter- balanced randomized crossover design.
Participants completed a preliminary session about a week before testing, which included 7 to 10 short sprints (<5 s) for familiarization. Following a 10-min recovery period, they performed the repeated-sprint exercise (outlined below). On separate occasions (4–5 days apart, same time of day [±1 h]), participants executed eight 5-s treadmill sprints with 25-s recovery (participants stood on the treadmill) in different footwear conditions: a control session with standardized footwear (i.e., only shoe liner inserted) and CFOs made of EVA and TPU. Upon arriving at the laboratory, the participants’ shoes were fitted with CFOs bilaterally. The researcher who guided the session and the participants were visually blinded to the CFO materials. The warm-up included 10 min of running at 10 km · h−1, followed by 15 min of sprint-specific muscular warm-up exercises, and three to five submaximal sprints. Participants then completed three maximal 5-s sprints, separated by 2 min of passive rest. To prevent any pacing strategy, the best of the three trials was used as the 95% criterion score, which was always met. Participants were then given 5 min of free cool down before testing.
2.3. Footwear
Participants wore neutral-like running shoes (Pearl Izumi N2v2, CO, USA) with an average European shoe size of 43.6 ± 1.6, a stack height of 23–24 mm, and a heel drop of 4 mm throughout the running tests. Two pairs of CFOs were used, based on individual non-weight bearing 3D scans of the foot using a Delcam iCube scanner (Elinvision, Karmelava, Lithuania). A sport podiatrist with nearly 20 years of experience designed the CFOs using Orthomodel Pro CAD software (Autodesk, CA, USA). The design process involved importing scans into the software; placing markers over the heel, first- and fifth metatarsal, and medial arch; and adjusting the base model surface to match the contour of the foot. The thickness of the orthotics was arbitrarily set to 8 mm to maximize the potential of the expanded thermoplastic polyurethane (TPU) beats inside the Infinergy® material (BASF, Ludwigshafen, Germany). All CFOs were direct-milled from EVA and TPU materials and manually finished to fit inside the shoes. The shoes were worn for 4.5 ± 2.5 days between the first and second intervention session, and for 4.6 ± 2.8 days between the second and last intervention session. The average weight of the three footwear conditions were 600.3 ± 32.0 g, 647.3 ± 36.0 g, and 681.1 ± 35.7 g for the shoes with its original liners (CON), with the custom EVA orthoses (EVA), and with the custom TPU orthoses (TPU), respectively.
2.4. Instrumented Sprint Treadmill
The sprints were conducted on an instrumented motorized treadmill (ADAL3D-WR, Medical Development-HEF Tecmachine, France), as described elsewhere [19,20]. The treadmill was mounted on a highly rigid metal frame, set at 0° incline, fixed to the ground through four piezoelectric force transducers (KI 9077b; Kistler, Winterthur, Switzerland) and installed on a specially engineered concrete slab to ensure maximal rigidity of the supporting ground. The treadmill allowed participants to sprint by using a constant motor torque [11]. This motor torque was adjusted to the participant’s body weight and set to 160% of the default torque after preliminary testing. This default torque value was chosen to allow participants to sprint comfortably and produce their maximal effort without risking loss of balance. It was determined by increasing the driving torque until observing a movement of the belt greater than 2 cm over 5 s while the subject stood still at the center of the treadmill belt.
Participants were tethered to a 0.4-m vertical rail anchored to the wall behind them using a single-pass waist and a stiff rope with a diameter of 1 cm and a length of approximately 2 m. Once properly attached, they were instructed to assume a standardized crouched sprint-start position with their left foot forward. This starting position was maintained throughout the sprint series. Following a 5-s countdown (“5 s, 3-2-1- Go”), given through both visual and audio instructions by the same investigator, the treadmill was released, and the belt began to accelerate as participants applied a positive horizontal force. The average distance covered over the eight sprints was used to assess repeated sprint ability.
2.5. Running Mechanics
The data was collected at a sampling rate of 1000 Hz and then filtered using a Butterworth-type 30 Hz low-pass filter. The vertical, net horizontal, and resultant ground reaction forces were averaged for each support phase (vertical force > 30 N), and were accompanied by measurements of step kinematic variables, such as contact time (s), flight time (s), swing time (s), step frequency (Hz), and step length (m). The foot strike and toe-off instants were determined as the vertical ground reaction forces rose above and fell below 30 N. Step frequency was calculated as the inverse of step duration, contact time was defined as the duration from the foot strike to toe-off, and flight time was the duration from toe-off to foot strike. Furthermore, vertical and leg stiffness (kN/m) were calculated as described elsewhere [1,8]. Finally, peak braking and propulsive forces (BW), and duration of braking and propulsive phases (s) were determined. Participants completed between 15 and 18 steps during each 5-s sprint [8,9]. The first step was consistently excluded as it does not represent a complete push-off. Values of the 2nd to the 15th step were averaged during the 5-s sprint and then averaged for each leg.
2.6. Symmetry Angle
The symmetry angle (SA) equation [6] was used to measure inter-leg symmetry for each participant:
But if
Then
The SA is an arctan function of the ratio of two bilateral values, and a score of 0% indicates complete symmetry while a score of 100% indicates complete asymmetry.
2.7. Statistical Analysis
Data are reported as mean ± SD and 95% confidence interval (CI95%). Two-way repeated-measures analysis of variance (ANOVAs) [Time (Sprints 1–8) × Condition (CON, EVA, and TPU)] were used to compare investigated variables. Mauchly’s test of sphericity was conducted to check the assumptions of variance, and a Greenhouse–Geisser correction was applied to adjust the degrees of freedom if the assumption was violated. If a significant main effect was observed, Bonferroni post-hoc multiple comparisons were performed. The effect size was estimated by calculating partial eta-squared (η2), with values of 0.01, 0.06, and above 0.14 representing small, moderate, and large effect sizes, respectively. Finally, levels of agreement for the direction of asymmetry were reported as a percentage of the total sample between conditions [21]. Statistical analysis was performed using SPSS statistical software V.27.0 (IBM Corp., Armonk, NY, USA), and significance was set at p < 0.05.
3. Results
There was no influence of time on SA scores for the thirteen variables tested (p ≥ 0.074; 0.03 < η2 < 0.15) (Table 1; Figure 1, Figure 2, Figure 3 and Figure 4). Consequently, the group mean and the range of SA scores are subsequently presented as pooled values, corresponding to the average of sprints 1–8. This averaging procedure offers, for a given mechanical variable, a material benchmark for expected asymmetry magnitudes during repeated treadmill sprints.

Table 1.
Descriptive statistics of the symmetry angle (SA) score for all variables.
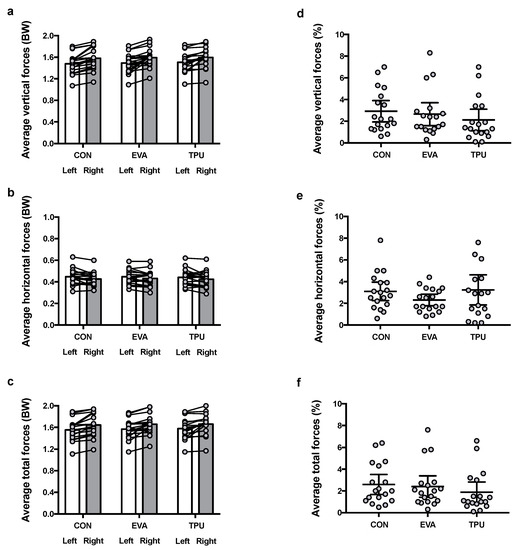
Figure 1.
Kinetics variables for both legs (left panels) and symmetry angle scores (right panels) during the repeated sprint exercise in three different footwear conditions (CON = shoes only; EVA = shoes + ethyl-vinyl acetate orthotic; TPU = shoes + expanded thermoplastic polyurethane orthotic). (a,d) Average vertical forces. (b,e) Average horizontal forces. (c,f) Average total forces. Values are mean with 95% confidence interval (n = 18). Symmetry angle score of 0% indicates perfect symmetry and 100% indicates perfect asymmetry.
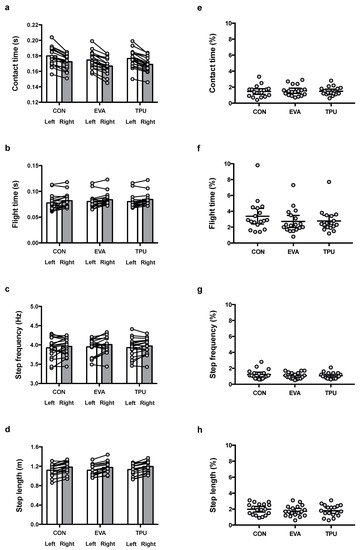
Figure 2.
Spatio-temporal variables for both legs (left panels) and symmetry angle scores (right panels) during the repeated sprint exercise in three different footwear conditions (CON = shoes only; EVA = shoes + ethyl-vinyl acetate orthotic; TPU = shoes + expanded thermoplastic polyurethane orthotic). (a,e) Contact time. (b,f) Flight time. (c,g) Step frequency. (d,h) Step length. Values are mean with 95% confidence interval (n = 18). Symmetry angle score of 0% indicates perfect symmetry and 100% indicates perfect asymmetry.
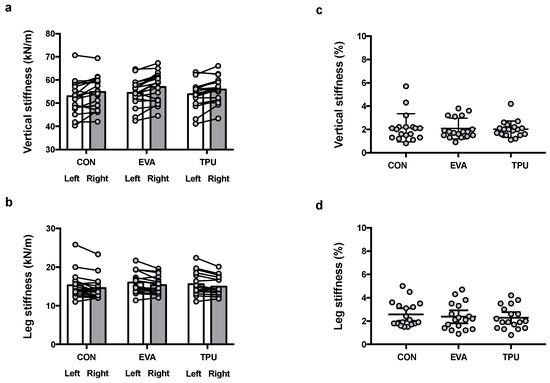
Figure 3.
Spring-mass characteristics for both legs (left panels) and symmetry angle scores (right panels) during the repeated sprint exercise in three different footwear conditions (CON = shoes only; EVA = shoes + ethyl-vinyl acetate orthotic; TPU = shoes + expanded thermoplastic polyurethane orthotic). (a,c) Vertical stiffness. (b,d) Leg stiffness. Values are mean with 95% confidence interval (n = 18). Symmetry angle score of 0% indicates perfect symmetry and 100% indicates perfect asymmetry.
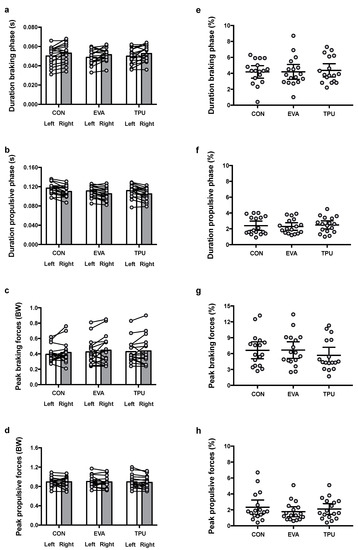
Figure 4.
Horizontal force production variables for both legs (left panels) and symmetry angle scores (right panels) during the repeated sprint exercise in three different footwear conditions (CON = shoes only; EVA = shoes + ethyl-vinyl acetate orthotic; TPU = shoes + expanded thermoplastic polyurethane orthotic). (a,e) Duration braking phase. (b,f) Duration propulsion phase. (c,g) Peak braking forces. (d,h) Peak propulsive forces. Values are mean with 95% confidence interval (n = 17). Symmetry angle score of 0% indicates perfect symmetry and 100% indicates perfect asymmetry.
There was no condition main effect (all p ≥ 0.053; 0.01 < η2 < 0.16), nor were there any significant time × condition interactions on SA scores for any running mechanical variables (p ≥ 0.640; 0.03 < η2 < 0.12) (Table 1; Figure 1, Figure 2, Figure 3 and Figure 4).
Mean SA values (pooled values for the three conditions) for all variables are presented in Table 1.
Levels of agreement, expressed as a percentage, ranged from 56–94%, 61–100%, and 71–100% for CON-EVA, CON-TPU, and EVA-TPU, respectively (Table 2).
Table 2.
Levels of agreement.
4. Discussion
4.1. SA Scores Are Consistent between the Three Footwear Conditions
This study provides the first normative values for mechanical asymmetry in uninjured individuals during repeated sprinting on a motorized treadmill while wearing CFOs made of EVA and TPU materials. Despite differences in resilience characteristics between the two types of inserts, our findings suggest that neither material significantly affected the SA scores for any of the thirteen biomechanical variables studied. This is in contrast to a study of children with flat foot disorders who wore prefabricated orthoses, in which a reduction in hip abduction moment symmetry was observed only in the dominant limb during walking [15]. However, this comparison is limited due to the highly task-, metric-, and individual-specific nature of assessing bilateral asymmetries [2]. Our study suggests that well-trained runners maintain relatively even strides with or without inserts, indicating that unilateral and bilateral mechanical assessments of (repeated) sprints may offer similar information for quantifying the effects of CFOs in injury-free individuals.
4.2. Constant Asymmetry across Sprint Repetitions
The symmetry angle (SA) scores for thirteen gait variables did not show significant changes across sprint repetitions, which is consistent with previous studies on recreational male team- and/or racket-sport athletes (5 × 5-s sprints with 25 s of rest [22]) and elite female Rugby Sevens players (8 × 5-s sprints with 25 s of rest [8]) who used the ADAL treadmill. One potential explanation is the considerable inter-individual variability within the sample observed for most variables in all conditions, as shown by wide confidence intervals. Given the individual nature of asymmetry, it was argued that for asymmetry to be meaningful, inter-limb differences should be larger than intra-limb variability [23]. Regardless, we confirm that constant low-to-moderate asymmetries seem to be the norm during run-based repeated-sprint ability tests despite individuals becoming progressively slower across ‘all out’ exercise bouts. However, we add the novel observation that wearing CFOs didn’t affect the magnitude of SA scores. Therefore, practitioners can use CFOs during intense workouts without altering bilateral leg differences.
4.3. SA Scores Are Metric-Dependent
Upon qualitative inspection, the SA scores varied considerably across metrics, with values ranging from around 1.1% for step frequency to approximately 6.2% for peak braking forces. SA scores for kinetics (Figure 1) and spring-mass model (Figure 3) characteristics were consistently higher than those for spatio-temporal variables (Figure 2) across all footwear conditions. Overall, horizontal force production variables displayed the largest inter-limb differences (Figure 4), suggesting that a more pronounced forward-oriented asymmetrical response is a biomechanical trait of repeated treadmill sprints. Although not a universal finding [24], similar observations have been made for single [25] and multiple ‘all out’ running bouts [8,22]. Previously, Bissas et al. [25] observed considerable variability in mechanical variables among the finalists of the men’s and women’s 100 m events during the 2017 IAAF World Championship. Despite also using SA scores for asymmetry calculation, direct comparisons of our asymmetry values with those from Bissas et al. [25] are precluded by differences in athletes’ background (well-trained runners vs. World-class sprinters), testing modalities (motorized treadmill vs. overground sprinting), tools used to assess mechanical variables (direct ground reaction forces’ measurement vs. high-speed cameras), and/or the number of steps considered (all steps from early acceleration up to top speed vs. two consecutive steps at ~50 m from the start line).
4.4. Larger Asymmetry for Braking Than Propulsion
Average SA scores for braking and propulsion reveal that symmetry is not only metric- but also gait phase-dependent. Overall, there were twice larger SA scores (i.e., for phase duration and peak force values) derived from braking vs. propulsion ground reaction forces, which is also in line with some (8 × 5-s sprints with 25 s of rest [8]; 10–25 km/h [1]), but not all (4 × 4-min runs with 3 min of rest [26]), previous literature. This indicates that participants arranged their segments slightly more symmetrically during the early as opposed to the late ground contact period, also with comparable adjustments for all footwear conditions. When assessing asymmetry in individuals experiencing acute intense fatigue, practitioners should not rely solely on the braking or propulsive phase, and must consider the entire gait cycle. Additionally, they should be cautious in interpreting SA scores across different phases of the gait cycle, and not use them interchangeably. This holds true regardless of whether the individuals are wearing CFOs or not.
4.5. Individual Responses
There was considerable inter-individual variability among all mechanical variables, regardless of condition. Consistent with previous research on sprinting [7,25,27], most individuals had SA scores within approximately twice the magnitude of the mean value for a given metric. Inconsistencies in the asymmetry of related biomechanical variables between individuals could be attributed to natural compensatory strategies, where different neuromuscular actions are utilized to maintain a comparable running style for both the dominant and non-dominant legs [28]. At the individual level, ‘protective’ neuro-mechanical compensations may arise to maintain a consistent and more symmetrical locomotion pattern by reducing constraints on one side of the body [29].
Although CFOs slightly modified SA scores in some individuals tested in our study, the evidence regarding the effects of inserts on asymmetry is not strong regarding who may benefit and in which way. Previously, we did not observe any significant difference in the time course and magnitude of mechanical adjustments in response to repeated treadmill sprints when comparing shoe only to EVA or TPU inserts [19,20]. Reportedly, healthy individuals walking on a treadmill showed altered frontal and transverse plane foot kinematics with increasing stiffness of CFOs, leading to a reduction in rearfoot eversion and an increase in rearfoot abduction [30]. Future studies including bilateral 3-D analysis of individual joints would be required to determine how CFOs may modify kinematics (i.e., particularly with regard to changes in the frontal and transverse planes, [14]) when participants are facing intense acute fatigue. Such analysis could ideally be coupled with plantar pressure (i.e., EVA was effective in reducing peak pressure in different areas of the foot [31]) and surface EMG recordings (i.e., EMG activity of leg muscles was altered when wearing CFOs made of TPU [32]) to shed more light on the nature of asymmetry adjustments that may result from wearing CFOs.
4.6. Limitations and Additional Considerations
The deviations from symmetry in this study, which ranged from approximately 1–6%, may have been too small to detect any potential effect of inserts on natural asymmetry in healthy male runners. To which extent athletes with unilateral impairments (e.g., post-cruciate ligament reconstruction, amputation) become more symmetrical with respect to certain biomechanical variables if wearing CFOs, and whether this response differs at various stages of the rehabilitation process, is unknown. Athletes who have undergone cruciate ligament reconstruction beyond 9 months may exhibit up to 6% asymmetries in maximal plantar force, as reported in previous studies utilizing in-shoe pressure systems [33]. Such persistent increased bilateral asymmetry in vertically oriented forces, reported by Thomson et al. [33], at a time when return to sport is often considered, compared to <3% average vertical force asymmetry reported here in uninjured athletes, reinforces the need for future CFOs studies in previously injured athletes.
Additional considerations may limit the generalization of our findings to other athletic cohorts. Our sample size of eighteen runners, including two-third of individuals with a rear-foot strike pattern, was too small to make meaningful comparisons with habitual midfoot/forefoot strikers. To which extent neuromuscular control from an insert is modified (or not) depending on the foot strike pattern, and how this is brought about biomechanically (i.e., frontal, sagittal, and transverse planes), is unknown.
The levels of agreement for consistency in the direction of asymmetry (i.e., which limb is favored [2]) were generally less than 100%, suggesting that the limb producing the greatest values occasionally switched sides between conditions. However, levels of agreement were relatively comparable between all three comparisons for a given variable. This suggests that there was limited variation in the superior performing limb across the three footwear conditions. Regardless, it is yet to be confirmed whether the fatiguing protocol used in this study actually subjected one side of the body to more stress than the other, and what is the protective effect (if any) of footwear and assisted devices (e.g., CFOs). The occurrence of larger force deficit on one side of the body could eventually be confirmed by conducting neuromuscular function assessments, including percutaneous muscle/nerve stimulations pre- and post-running, as previously done in response to a similar repeated-sprints protocol yet only for the dominant leg [34].
5. Conclusions
We evaluated interlimb asymmetry levels in kinetic and kinematic variables during repeated sprints on a motorized treadmill in non-injured, well-trained runners. Our primary finding was that the use of inserts, whether made of EVA or TPU materials, did not affect the consistency of SA scores across sprints compared to standard footwear, indicating that the left and right legs behaved similarly with inserts. Overall, our findings do not support using CFOs to ‘correct’ for the observed low-to-moderate natural asymmetries in the presence of intense fatigue.
Author Contributions
K.V.A. and O.G. conceived and designed research. K.V.A. and O.G. conducted experiments. All authors analyzed data. All authors interpreted results of experiments. O.G. drafted manuscript and prepared figures/tables. All authors edited and revised manuscript. All authors have read and agreed to the published version of the manuscript.
Funding
This work is based on research funded by QNRF (NPRP 4-760-3-217).
Informed Consent Statement
Informed consent was obtained from all subjects involved in the study.
Data Availability Statement
Not applicable.
Acknowledgments
The authors thank Jean-Benoit Morin from the Université of Lyon, Saint Étienne, France, for his help in providing the running mechanics data processing custom software.
Conflicts of Interest
The authors declare no conflict of interest.
References
- Girard, O.; Morin, J.-B.; Ryu, J.; Read, P.; Townsend, N. Running velocity does not influence lower limb mechanical asymmetry. Front. Sports Act. Living 2019, 1, 36. [Google Scholar] [CrossRef] [PubMed]
- Afonso, J.; Peña, J.; Sá, M.; Virgile, A.; García-de-Alcaraz, A.; Bishop, C. Why sports should embrace bilateral asymmetry: A narrative review. Symmetry 2022, 14, 1993. [Google Scholar] [CrossRef]
- Beck, O.N.; Azua, E.N.; Grabowski, A.M. Step time asymmetry increases metabolic energy expenditure during running. Eur. J. Appl. Physiol. 2018, 118, 2147–2154. [Google Scholar] [CrossRef]
- Bredeweg, S.W.; Buist, I.; Kluitenberg, B. Differences in kinetic asymmetry between injured and noninjured novice runners: A prospective cohort study. Gait Posture 2013, 38, 847–852. [Google Scholar] [CrossRef]
- Bishop, C.; Read, P.; Chavda, S.; Turner, A. Asymmetries of the lower limb: The calculation conundrum in strength training and conditioning. Strength Cond. J. 2016, 38, 27–32. [Google Scholar] [CrossRef]
- Zifchock, R.A.; Davis, I.; Higginson, J.; Royer, T. The symmetry angle: A novel, robust method of quantifying asymmetry. Gait Posture 2008, 27, 622–627. [Google Scholar] [CrossRef]
- Brown, S.R.; Cross, M.R.; Girard, O.; Brocherie, B.; Samozino, P.; Morin, J.-B. Kinetic sprint asymmetries on a non-motorised treadmill in rugby union athletes. Int. J. Sports Med. 2017, 38, 1017–1022. [Google Scholar] [CrossRef]
- Girard, O.; Racinais, S.; Couderc, A.; Morin, J.-B.; Ryu, J.H.; Piscione, J.; Brocherie, F. Asymmetries during repeated treadmill sprints in elite female Rugby Sevens players. Sports Biomech. 2020. published ahead of print. [Google Scholar]
- Girard, O.; Brocherie, F.; Morin, J.-B.; Millet, G.P.; Hansen, C. Running mechanics and leg muscle activity patterns during early and late acceleration phases of repeated treadmill sprints in male recreational athletes. Eur. J. Appl. Physiol. 2020, 120, 2785–2796. [Google Scholar] [CrossRef]
- Morin, J.-B.; Samozino, P.; Edouard, P.; Tomazin, K. Effect of fatigue on force production and force application technique during repeated sprints. J. Biomech. 2011, 44, 2719–2723. [Google Scholar] [CrossRef]
- Morin, J.-B.; Samozino, P.; Bonnefoy, R.; Edouard, P.; Belli, A. Direct measurement of power during one single sprint on treadmill. J. Biomech. 2010, 43, 1970–1975. [Google Scholar] [CrossRef]
- Hoerzer, S.; Federolf, P.A.; Maurer, C.; Baltich, J.; Nigg, B.M. Footwear decreases gait asymmetry during running. PLoS ONE 2015, 10, e0138631. [Google Scholar] [CrossRef]
- Wilkinson, M.; Ewen, A.; Caplan, N.; O’leary, D.; Smith, N.; Stoneham, R.; Saxby, L. Textured insoles reduce vertical loading rate and increase subjective plantar sensation in overground running. Eur. J. Sport Sci. 2018, 18, 497–503. [Google Scholar] [CrossRef] [PubMed]
- Florenciano Restoy, J.L.; Solé-Casals, J.; Borràs-Boix, X. IMU-based effects assessment of the use of foot orthoses in the stance phase during running and asymmetry between extremities. Sensors 2021, 21, 3277. [Google Scholar] [CrossRef] [PubMed]
- Jafarnezhadgero, A.; Madadi, M.; Ferber, R. The effect of foot orthoses on joint moment asymmetry in male children with flexible flat feet. J. Bodyw. Mov. Ther. 2018, 22, 83–89. [Google Scholar] [CrossRef] [PubMed]
- Van Alsenoy, K.; van der Linden, M.L.; Girard, O.; Santos, D. Increased footwear comfort is associated with improved running economy-a systematic review and meta-analysis. Eur. J. Sports Sci. 2021. published ahead of print. [Google Scholar]
- Morin, J.-B.; Gimenez, P.; Edouard, P.; Arnal, P.; Jiménez-Reyes, P.; Samozino, P.; Brughelli, M.; Mendiguchia, J. Sprint acceleration mechanics: The major role of hamstrings in horizontal force production. Front. Physiol. 2015, 6, 404. [Google Scholar] [CrossRef]
- Russell Esposito, E.; Blanck, R.V.; Harper, N.G.; Hsu, J.R.; Wilken, J.M. How does ankle-foot orthosis stiffness affect gait in patients with lower Limb salvage? Clin. Orthop. Relat. Res. 2014, 472, 3026–3035. [Google Scholar] [CrossRef]
- Van Alsenoy, K.; Ryu, J.H.; Girard, O. Acute intense fatigue does not modify the effect of EVA and TPU custom foot orthoses on running mechanics, running economy and perceived comfort. Eur. J. Appl. Physiol. 2022, 122, 1179–1187. [Google Scholar] [CrossRef]
- Girard, O.; Morin, J.-B.; Ryu, J.H.; Van Alsenoy, K. Custom foot orthoses improve performance, but do not modify the biomechanical manifestation of fatigue, during repeated treadmill sprints. Eur. J. Appl. Physiol. 2020, 120, 2037–2045. [Google Scholar] [CrossRef]
- Bishop, C.; Manuel, J.; Drury, B.; Beato, M.; Turner, A. Assessing eccentric hamstring strength using the NordBord: Between-session reliability and interlimb asymmetries in professional soccer players. J. Strength Cond. Res. 2022, 36, 2552–2557. [Google Scholar] [CrossRef] [PubMed]
- Girard, O.; Brocherie, F.; Morin, J.-B.; Millet, G.P. Lower limb mechanical asymmetry during repeated treadmill sprints. Hum. Mov. Sci. 2017, 52, 203–214. [Google Scholar] [CrossRef]
- Giakas, G.; Baltzopoulos, V. Time and frequency domain analysis of ground reaction forces during walking: An investigation of variability and symmetry. Gait Posture 1997, 5, 189–197. [Google Scholar] [CrossRef]
- Rumpf, M.C.; Cronin, J.B.; Mohamad, I.N.; Mohamad, S.; Oliver, J.L.; Hughes, M.G. Kinetic asymmetries during running in male youth. Phys. Ther. Sports 2014, 15, 53–57. [Google Scholar] [CrossRef]
- Bissas, A.; Walker, J.; Paradisis, G.P.; Hanley, B.; Tucker, C.B.; Jongerius, N.; Thomas, A.; Merlino, S.; Vazel, P.; Girard, O. Asymmetry in sprinting: An insight into sub-10 and sub-11 s men and women sprinters. Scand. J. Med. Sci. Sports 2022, 32, 69–82. [Google Scholar] [CrossRef] [PubMed]
- Girard, O.; Li, S.N.; Hobbins, L.; Ryu, J.H.; Peeling, P. Gait asymmetries during perceptually-regulated interval running in hypoxia and normoxia. Sports Biomech. 2021. published ahead of print. [Google Scholar]
- Pappas, P.; Paradisis, G.P.; Girard, O. Influence of lower limb dominance on mechanical asymmetries during high-speed treadmill running. Sports Biomech. 2021. published ahead of print. [Google Scholar]
- Brughelli, M.; Cronin, J. Influence of running velocity on vertical, leg and joint stiffness: Modelling and recommendations for future research. Sports Med. 2008, 38, 647–657. [Google Scholar] [CrossRef]
- Goldberg, E.J.; Neptune, R.R. Compensatory strategies during normal walking in response to muscle weakness and increased hip joint stiffness. Gait Posture 2007, 25, 360–367. [Google Scholar] [CrossRef]
- Desmyttere, G.; Leteneur, S.; Hajizadeh, M.; Bleau, J.; Begon, M. Effect of 3D printed foot orthoses stiffness and design on foot kinematics and plantar pressures in healthy people. Gait Posture 2020, 81, 247–253. [Google Scholar] [CrossRef]
- Gerrard, J.M.; Bonanno, D.R.; Whittaker, G.A.; Landorf, K.B. Effect of different orthotic materials on plantar pressures: A systematic review. J. Foot Ankle Res. 2020, 13, 35. [Google Scholar] [CrossRef]
- Ji-Yong, J.; Jung-Ja, K. Influence of customized foot orthotics on gait balance for pelvic asymmetry patients. J. Mech. Med. Biol. 2019, 19, 1950039. [Google Scholar]
- Thomson, A.; Einarsson, E.; Hansen, C.; Bleakley, C.; Whiteley, R. Marked asymmetry in vertical force (but not contact times) during running in ACL reconstructed athletes <9 months post-surgery despite meeting functional criteria for return to sport. J. Sci. Med. Sport 2018, 21, 890–893. [Google Scholar]
- Townsend, N.; Brocherie, F.; Millet, G.P.; Girard, O. Central and peripheral muscle fatigue following repeated-sprint running in moderate and severe hypoxia. Exp. Physiol. 2021, 106, 126–138. [Google Scholar] [CrossRef]
Disclaimer/Publisher’s Note: The statements, opinions and data contained in all publications are solely those of the individual author(s) and contributor(s) and not of MDPI and/or the editor(s). MDPI and/or the editor(s) disclaim responsibility for any injury to people or property resulting from any ideas, methods, instructions or products referred to in the content. |
© 2023 by the authors. Licensee MDPI, Basel, Switzerland. This article is an open access article distributed under the terms and conditions of the Creative Commons Attribution (CC BY) license (https://creativecommons.org/licenses/by/4.0/).