Article

An Experimental Study of Cavitation Bubble Dynamics near a Complex Wall with a Continuous Triangular Arrangement

1
Key Laboratory of Power Station Energy Transfer Conversion and System (Ministry of Education), School of Energy Power and Mechanical Engineering, North China Electric Power University, Beijing 102206, China
2
College of Mechanical and Transportation Engineering, China University of Petroleum-Beijing, Beijing 102249, China
3
Beijing Key Laboratory of Process Fluid Filtration and Separation, China University of Petroleum-Beijing, Beijing 102249, China
*
Authors to whom correspondence should be addressed.
Symmetry 2023, 15(3), 693; https://doi.org/10.3390/sym15030693
Submission received: 9 February 2023 / Revised: 1 March 2023 / Accepted: 7 March 2023 / Published: 10 March 2023
(This article belongs to the Section Engineering and Materials)

Abstract

:
The mechanism of cavitation cleaning of complex surfaces has received more and more attention. In the present paper, with the help of a high-speed photography experimental system, the dynamic behavior of a cavitation bubble in symmetrical positions near a complex wall with a continuous triangular arrangement is investigated. In terms of the bubble size and the initial wall–bubble distance, the non-uniform shrinkage of the bubble collapse and the movement characteristics of the bubble centroid are revealed. The main conclusions are as follows: (1) The collapse dynamic behavior of the bubble near a complex wall with a continuous triangular arrangement can be divided into three typical cases. (2) According to a large number of experimental results under different parameters, the parameter ranges corresponding to the three cases and the critical values between different cases are given. (3) The larger the bubble size is, or the smaller the initial wall–bubble distance is, the more significant the effect of the complex wall is, and the greater the movement distance towards the complex wall during the collapse stage.

1. Introduction

Cavitation cleaning is often applied in semiconductor manufacturing and other fields, due to its advantages of green environmental protection, easy operation, and good cleaning effect [1,2,3,4,5]. Explosive growth in a cavitation bubble and the jet, radiation force, and shock wave generated during the collapse process are conducive to the removal of pollutants on the material surface [6,7,8,9]. Therefore, it is necessary to investigate cavitation bubble dynamics near a wall. In addition, cavitation cleaning also faces the serious problem of damage to the material surface, especially for the increasingly sophisticated structure of modern computer chips and storage devices, which puts forward higher requirements for the cavitation cleaning technology [10,11,12]. Therefore, it is necessary to carry out in-depth research on bubble dynamics near a complex wall.
Cavitation bubble dynamics near a wall have been widely studied. According to the differences in wall types, the existing studies can be divided into bubble dynamics near a flat wall [13,14,15,16,17,18], bubble dynamics near a curved wall [19,20,21,22], and bubble dynamics near a corner wall [23,24,25]. A brief review of the literature will be given based on the research results of these three aspects.
In the study of cavitation bubble dynamics near a flat wall, Vogel et al. [13] experimentally investigated the dynamic behavior of the bubble near a solid flat boundary and its relationship with the wall–bubble distance. It is found that the formation of jet and counterjet and the development of annular vortex generated by the jet are the key features of bubble dynamics near a solid flat wall. Lauterborn and Bolle et al. [14] also used high-speed photography technology to experimentally study bubble dynamics near a solid flat boundary, and calculated the shrinkage speed of the bubble wall according to the different bubble wall positions at different times. Li et al. [15] experimentally revealed the retardant effects of the solid flat wall on the bubble collapse behavior. In terms of the interface evolution, bipolar velocity, and bubble centroid motion, the influence of the dimensionless wall–bubble distance on the collapse dynamics was discussed in detail. In theoretical research, Blake et al. [16,17] established the Kelvin pulse theory about the spherical bubble near a flat wall based on the image principle and related hydrodynamic equations, and successfully predicted the jet direction generated by bubble collapse.
In the study of cavitation bubble dynamics near a curved wall, Zhong et al. [19] experimentally studied the dynamics of a spark-induced cavitation bubble near a concave boundary, and found that the bubble moving towards the wall. For further research, Tomita et al. [20] experimentally revealed the bubble dynamics near a curved rigid wall. The complete bubble dynamics including the jet formation were obtained by employing image theory and a boundary integral method. It was found that the curvature of the wall has a significant effect on the bubble migration and the jet velocity.
In the study of cavitation bubble dynamics near a corner wall, Zhang et al. [23] experimentally explored the collapse dynamics of a cavitation bubble near a corner wall. According to the deformation of the bubble interface during the collapse, three typical cases are determined, and the effects of the bubble size and the bubble–wall distance on the movement of the bubble centroid and the bubble wall boundary are revealed. In addition, Brujan et al. [24] also experimentally studied the bubble dynamics near a corner wall and its relationship with bubble–wall distance. It is found that distance significantly affects the direction of the jet and the formation of the annular bubble.
In addition to the study of cavitation bubble dynamics introduced above, some other scholars have also made many contributions to this [26,27,28,29,30,31,32,33]. Among them, Abu-Nab and Morad et al. [30,31,32,33] deeply investigated the bubble growth phenomenon in various fluids by establishing a series of theoretical equations, and analyzed the influence of various physical parameters in detail. In addition, Chen et al. [34] have also studied the dynamic behavior of a bubble near a complex wall, but research on the specific behavior of bubble dynamics and the influence of some important parameters has not been fully revealed.
Although many scholars have studied the cavitation bubble dynamics near flat, curved, and angular walls, the wall types involved are still relatively simple. The field of cavitation cleaning often involves various complex wall conditions. However, cavitation bubble dynamics near a complex wall have not been thoroughly studied. For example, the non-uniform collapse and the centroid movement of the bubble near a complex wall with a continuous triangular arrangement have not yet been revealed. They are of great significance to reveal the mechanism of cavitation cleaning. Therefore, it is worthwhile to investigate cavitation bubble dynamics near a triangular wall. In this paper, the dynamics of the cavitation bubble in symmetrical positions near a complex wall with a continuous triangular arrangement are investigated with the help of experimental system. The content of this paper is specifically arranged as follows. Section 2 shows the experimental setup and parameter definition. Section 3 shows the several typical cases of bubble dynamics and the parameter range corresponding to different cases. Section 4 shows the non-uniform collapse at characteristic locations of the bubble wall. Section 4 shows the bubble movement characteristics. Section 5 shows the effects of the bubble size and the wall–bubble distance on the bubble movement characteristics.

2. Experimental Setup and Parameter Definition

Figure 1 shows the schematic description of the experimental system for the interaction between a single cavitation bubble and a complex wall with a continuous triangular arrangement. For a detailed description of the experimental apparatus, the reader is referred to our previously published paper [35]. The sequence of experimental operations can be divided into the following three steps.
Step 1: Preparation of the experiment. The main equipment in the experimental system was correctly connected. Moreover, according to the preset relative position of the cavitation bubble and the complex wall with a continuous triangular arrangement, the complex wall was properly fixed in a tank filled with deionized water.
Step 2: Debugging parameters. The Nd: YAG laser generator was used to provide a high-energy laser beam pulse through the focusing lens and generate the cavitation bubble in the water tank. In addition, the bubble size was changed by adjusting the laser energy dissipator. The relative position of the bubble and the complex wall was adjusted by the three-dimensional displacement control platform.
Step 3: Data recording. The digital delay generator was employed to synchronize the laser generator, flash, and other equipment. During the experiment, the LED constant light and flash were used to ensure a clear recording of the experimental phenomena. The experimental data were saved in the computer.
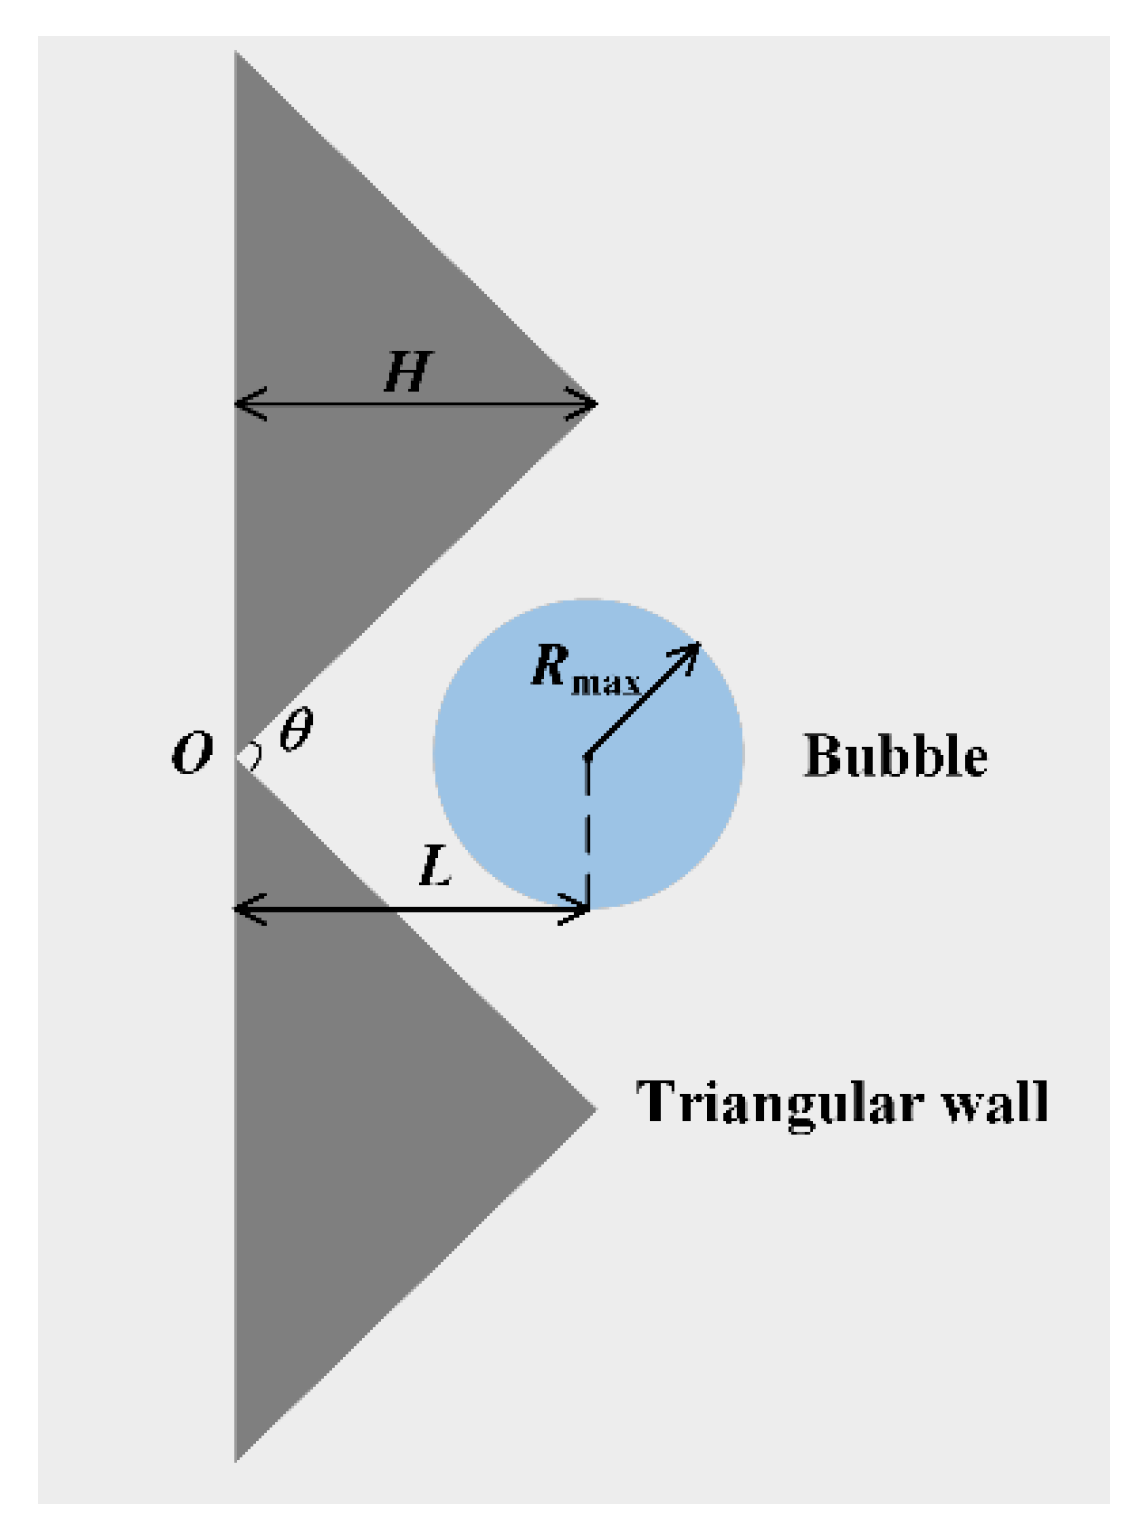
Figure 2 shows the parameter definitions of cavitation bubble dynamics near a complex wall with a continuous triangular arrangement. The initial bubble position is defined by the initial bubble wall distance (L). Rmax is the equivalent maximum radius of the bubble. H is the height of the triangular wall. θ is the angle between two walls. For the convenience of discussion, the dimensionless wall–bubble distance is defined as follows:
γ = L R max

3. Main Characteristics of Cavitation Bubble Dynamics

In this section, according to many experimental results under different parameters, the collapse dynamic behavior of the bubble near a complex wall with a continuous triangular arrangement is divided into three typical cases. The characteristics of each case are demonstrated in detail through an example. Furthermore, the corresponding parameter range of each case is given according to values of L and Rmax.

3.1. Typical Cases

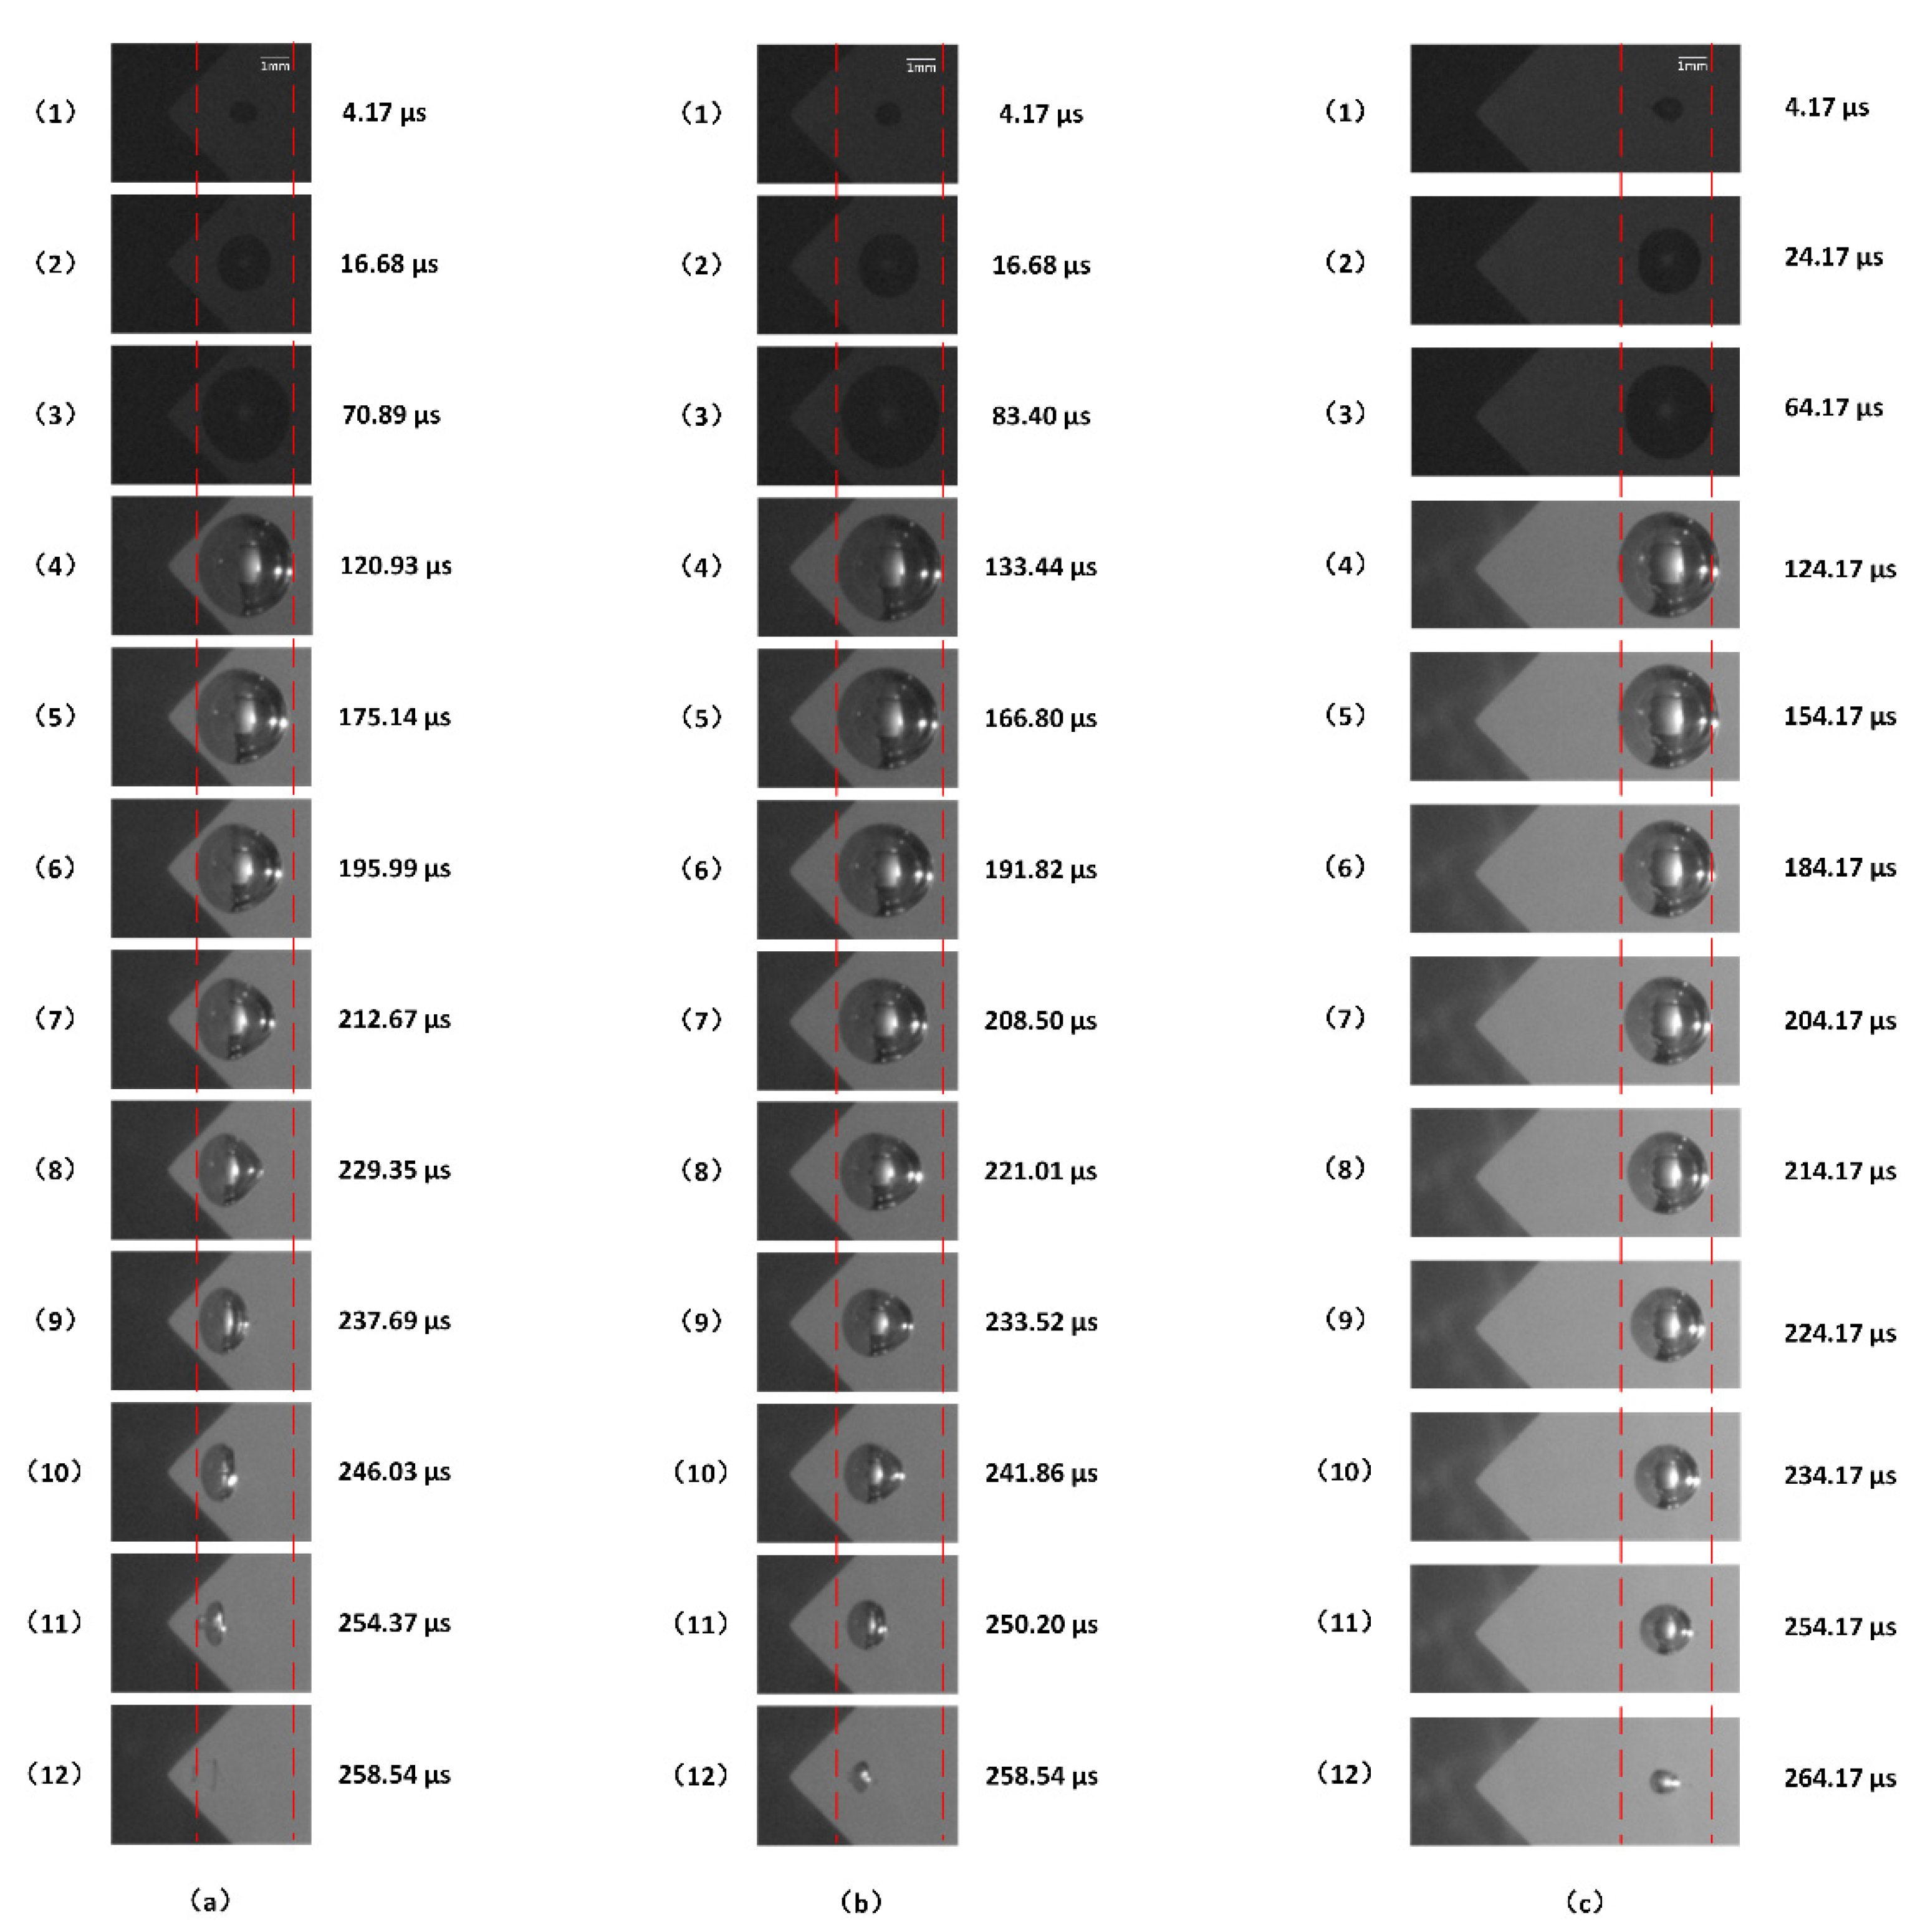
Figure 3a shows the typical cavitation bubble dynamics of case 1 when the cavitation bubble is close to the complex wall with a continuous triangular arrangement. The relevant important parameters are L = 1.80 mm, Rmax = 1.53 mm, and γ = 1.18. In addition, the left and right ends of each frame are marked with the order number and the corresponding time. A scale bar is marked in the upper right corner of the figure. To observe the change in the bubble shape and bubble centroid movement in the process of bubble oscillation, two red dashed lines are marked on the bubble boundary when the bubble first expands to Rmax. The fourth subfigure represents the first bubble expansion to Rmax, and the twelfth subfigure represents the first bubble collapse. It can be seen from Figure 3a that, in the bubble expansion process, the bubble basically shows spherical growth. In the collapse process, under the significant influence of the wall, the bubble presents significant non-uniform collapse characteristics, due to the difference in pressure around the bubble wall. To be specific, the left side of the bubble wall almost does not move during most of the collapse time (corresponding to subfigures Nos. 4–10 in Figure 3a). At the same time, the contraction speed of the right side of the bubble wall is significantly greater than that of the left side (corresponding to subfigures Nos. 4–11 in Figure 3a). In addition, the contraction velocity of the right half of the bubble wall is also uneven at the early collapse stage, and the contraction velocity of the rightmost bubble wall is the smallest (corresponding to subfigures Nos. 6–8 in Figure 3a). At last, the rightmost bubble wall quickly collapses and generates a micro-jet facing the complex wall surface (corresponding to subfigure Nos 11 in Figure 3a). Finally, the bubble completely collapses due to the constant energy dissipation. Furthermore, as shown in Figure 3a, under the effect of the complex wall, the bubble position moves significantly towards the complex wall due to the uneven pressure of the liquid around the bubble.
Figure 3b shows the typical cavitation bubble dynamics near a complex wall with a continuous triangular arrangement for case 2. The relevant important parameters are L = 2.40 mm, Rmax = 1.53 mm, and γ = 1.57. Subfigures 1–4 in the figure represent the expansion process, and subfigures 5–12 represent the bubble collapse process. As shown in Figure 3b, when the wall–bubble distance is medium, the bubble still presents non-uniformity in the collapse process, but the degree of non-uniformity is less than that in case 1. Specifically, unlike case 1, the leftmost bubble wall also shrinks towards the interior of the bubble at the early collapse stage (corresponding to subfigures 4–10 in Figure 3b), although the contraction speed of the leftmost bubble wall is still lower than that of the rightmost bubble wall (corresponding to subfigures 4–11 in Figure 3b). In addition, according to the change in bubble position, it can also be seen that the bubble centroid also moves towards the complex wall surface (corresponding to subfigures 6–12 in Figure 3b).
Figure 3c shows the typical cavitation bubble dynamics near a complex wall with a continuous triangular arrangement for case 3. The relevant important parameters are L = 5.00 mm, Rmax = 1.53 mm, and γ = 3.28. Similar to case 1 and case 2, twelve typical frames of the first period of the bubble are selected to show the bubble dynamic behavior of case 3. According to Figure 3c, the cavitation bubble basically remains spherical during the expansion and collapse process. Moreover, the movement of the bubble centroid in the first period is not obvious. Therefore, the dynamic characteristics of the bubble is similar to those of the bubble in infinite liquid. This shows that the effect of the complex wall on the bubble dynamics can be almost ignored.
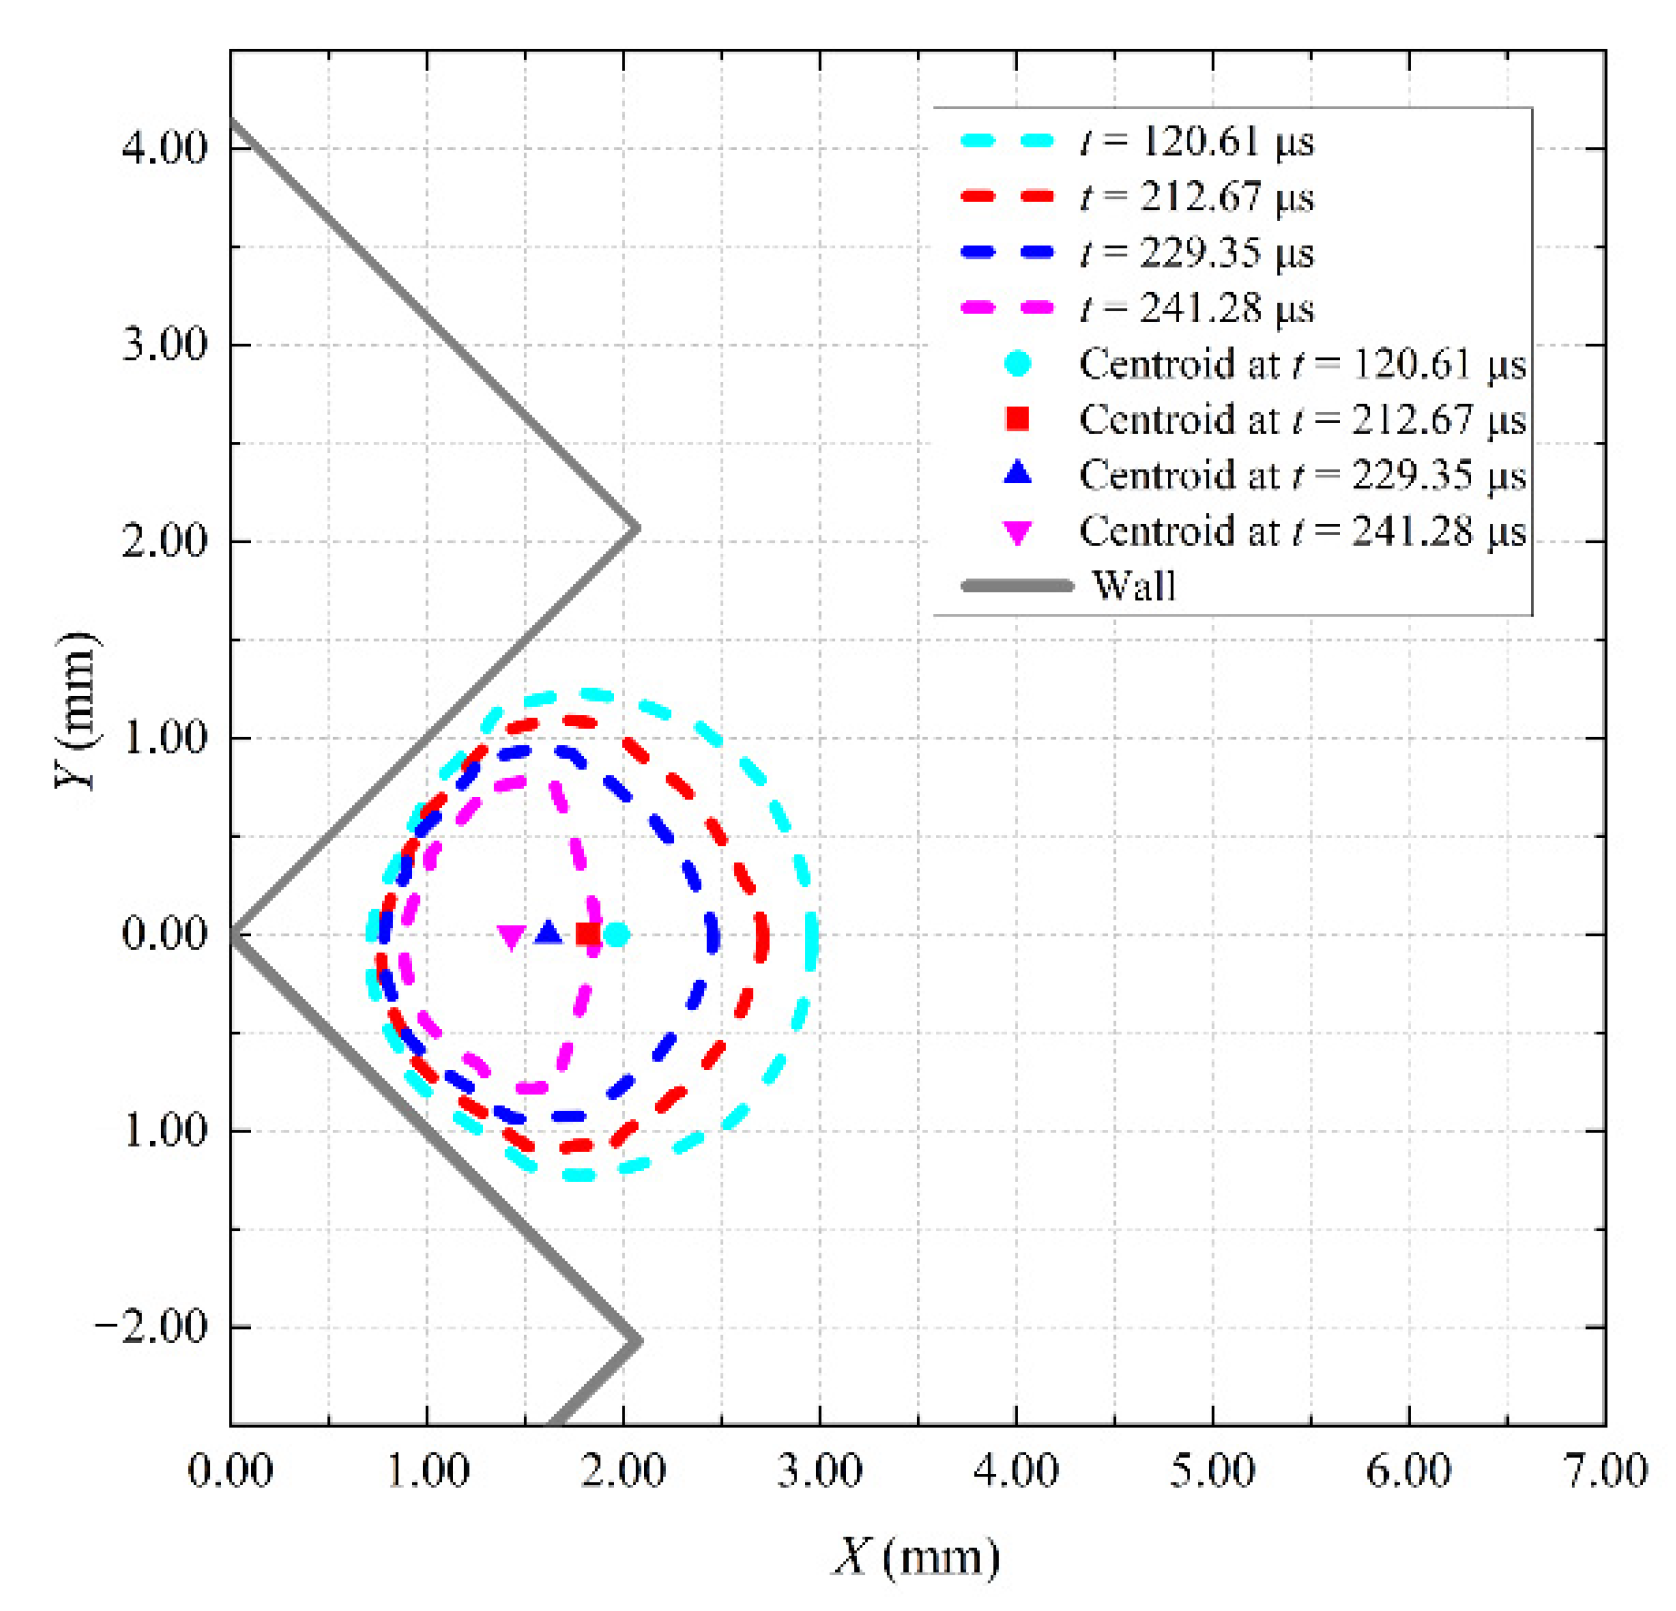
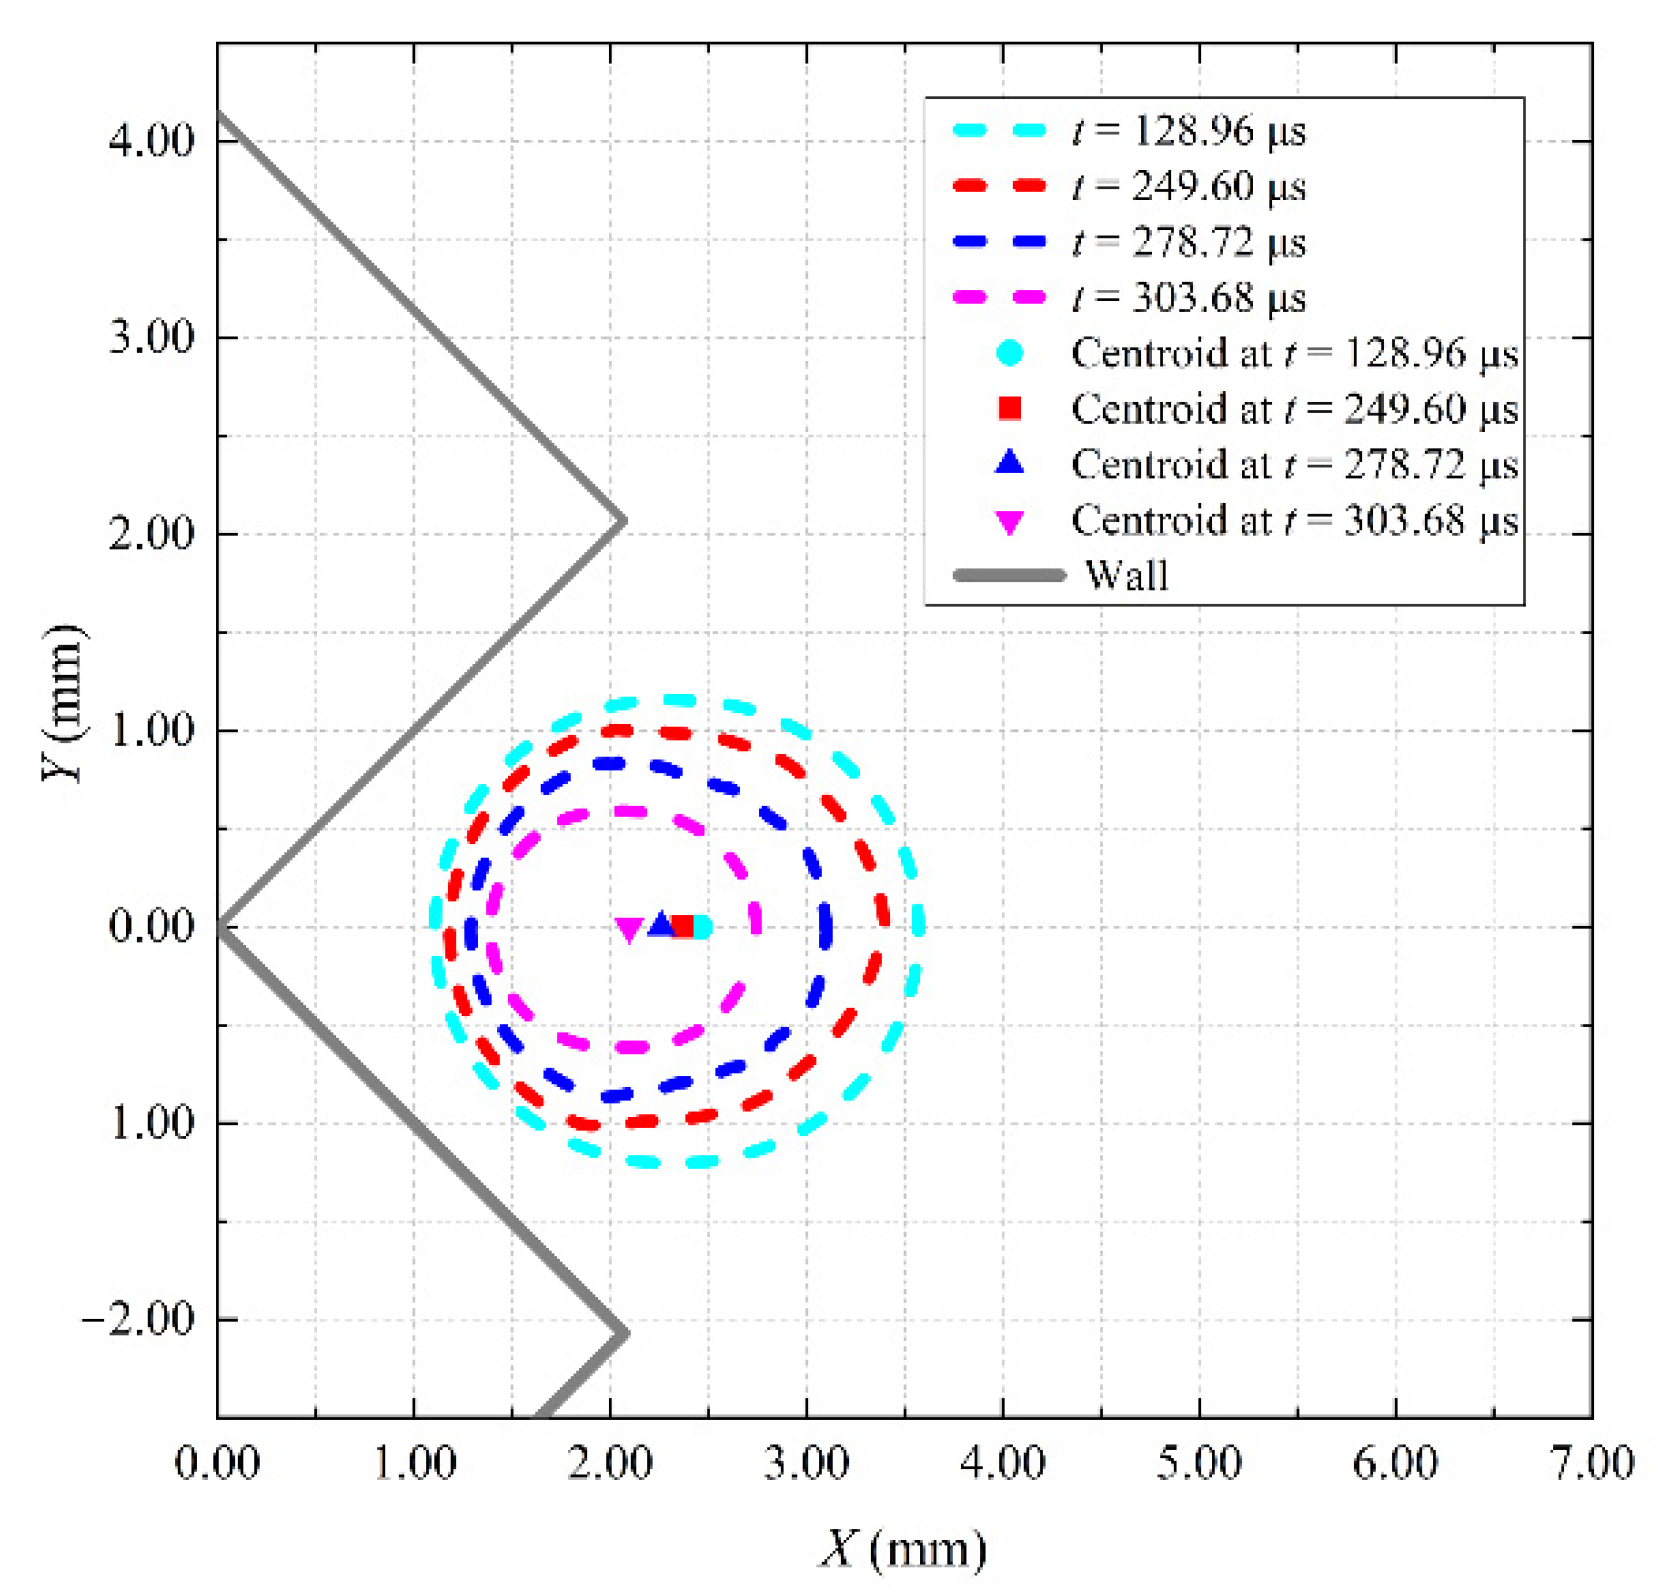
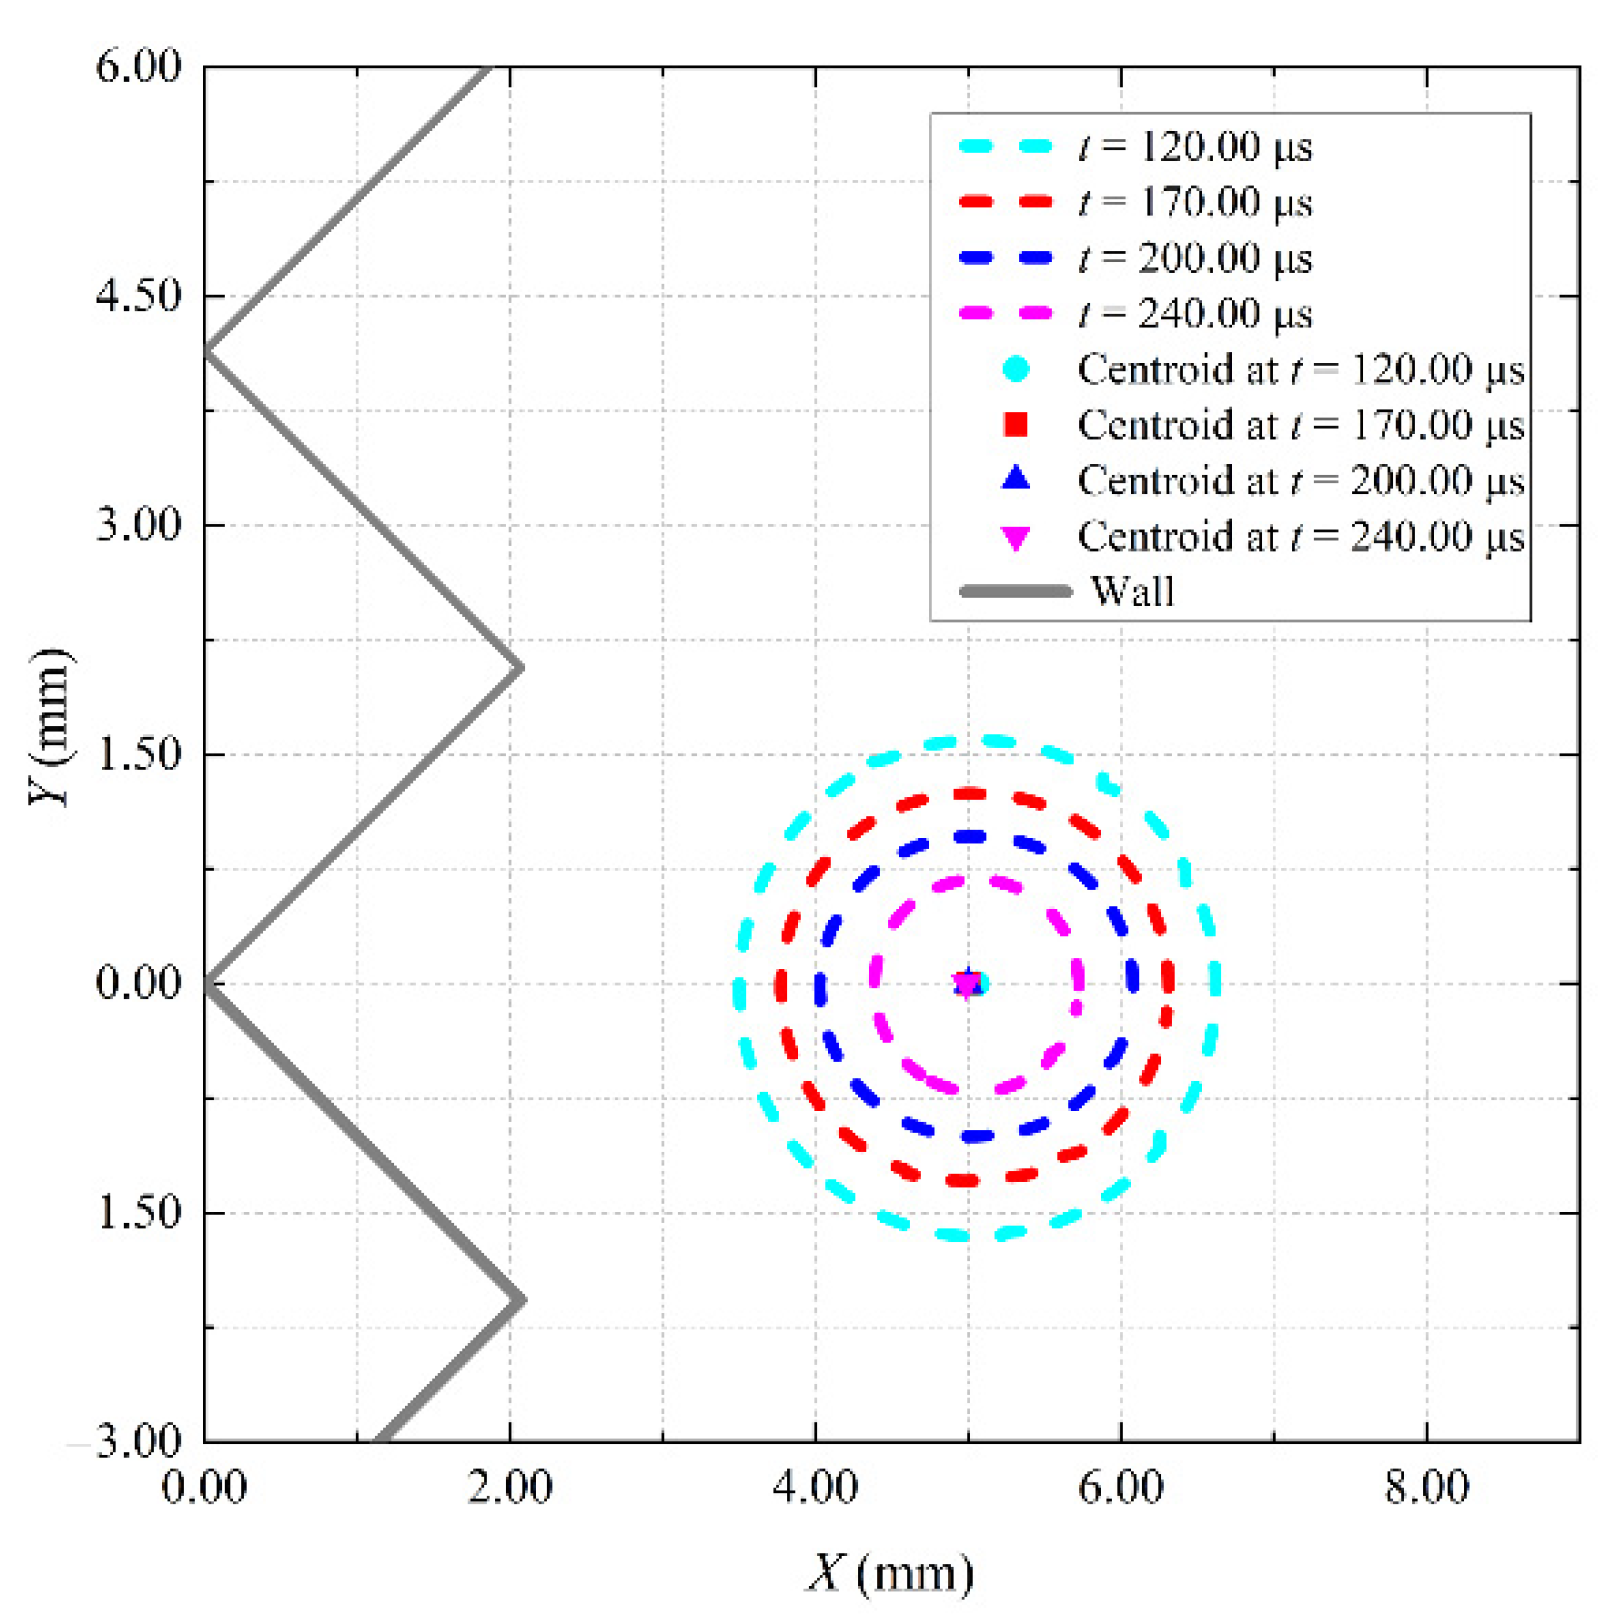
In order to more clearly show the collapse shape and movement of the bubble centroid for different cases, Figure 4, Figure 5 and Figure 6 show the movement of the bubble wall and bubble centroid at four typical moments during the bubble collapse. Different colors in the picture represent different moments. Their relevant parameters in Figure 4, Figure 5 and Figure 6 correspond to Figure 3, Figure 4 and Figure 5, respectively. According to Figure 4, Figure 5 and Figure 6, the deformation and centroid movement of the bubble for case 1 are the most obvious, and the deformation and the centroid movement for case 3 are the least obvious.
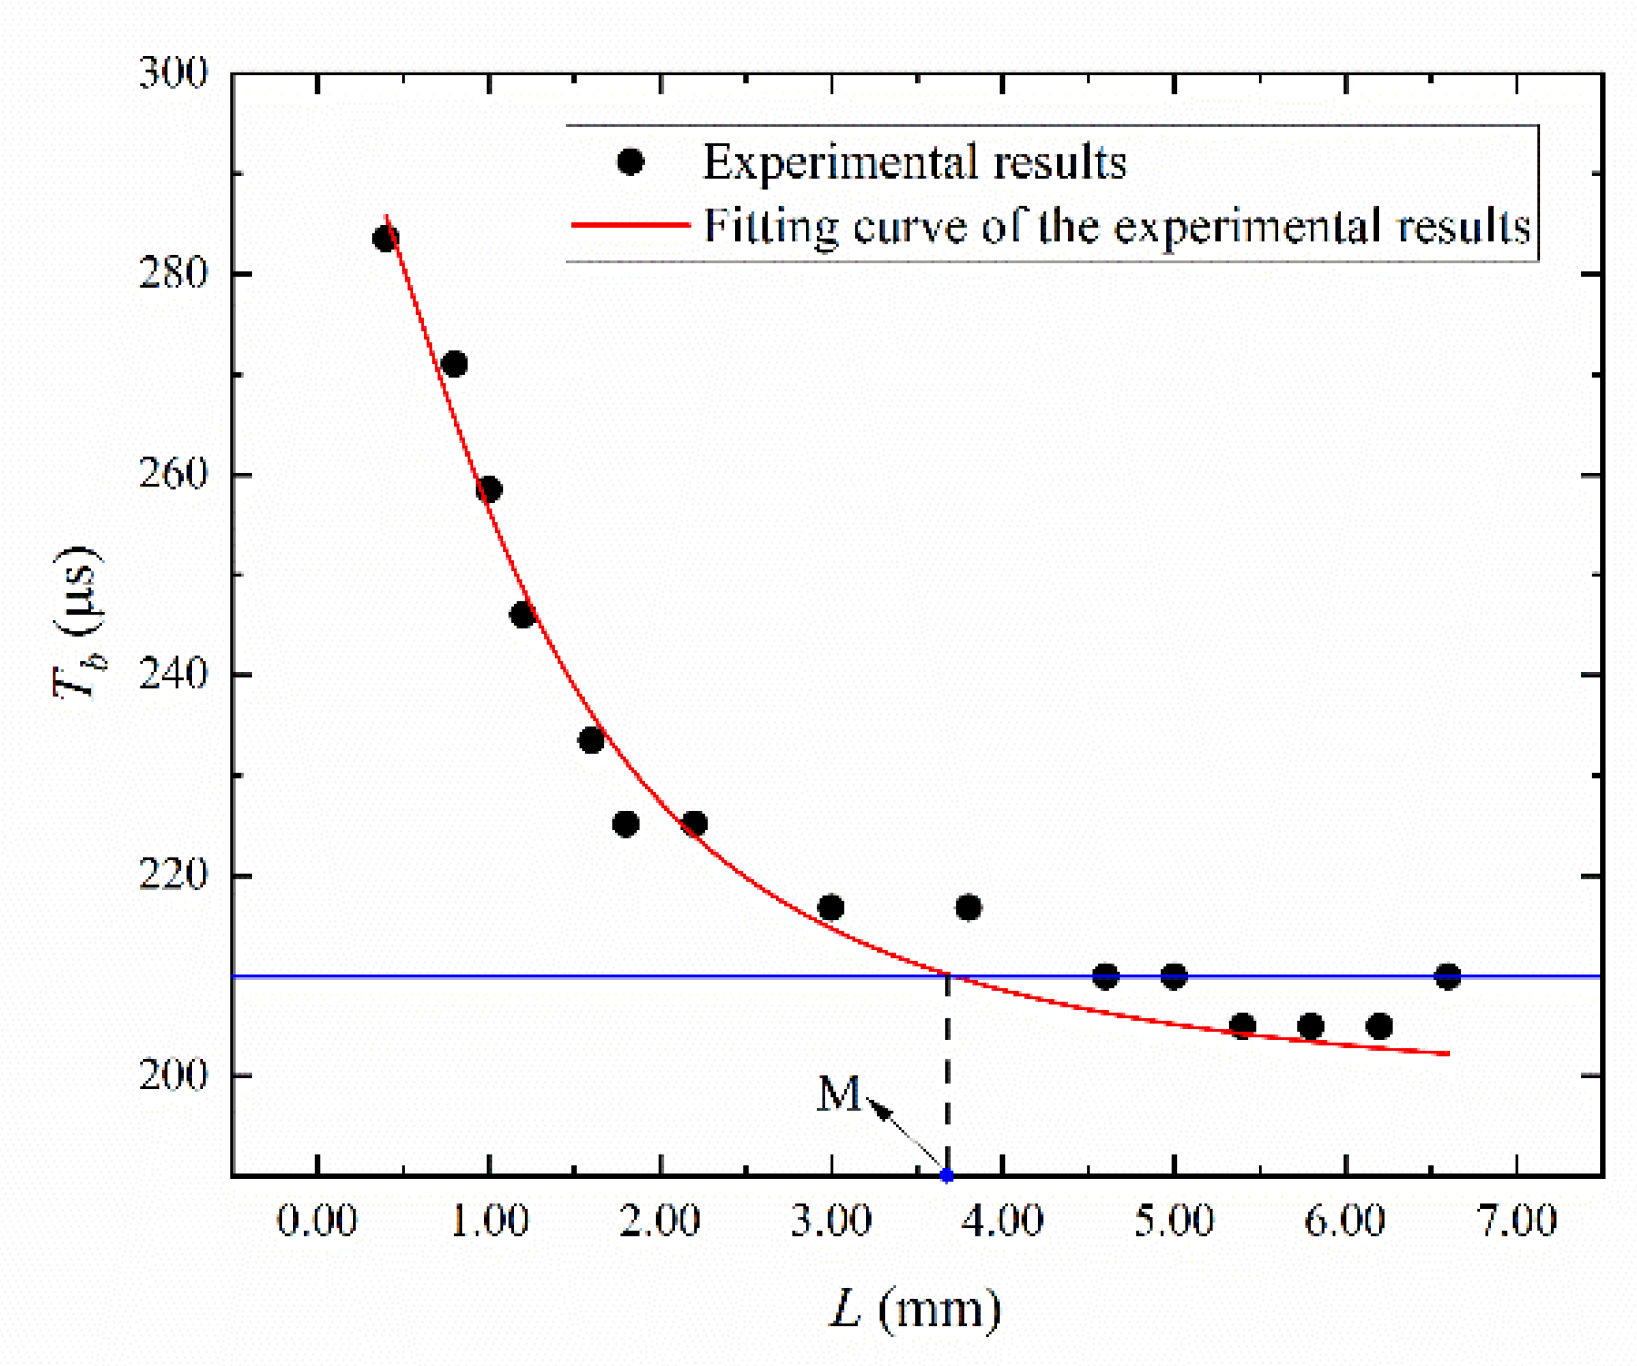
Figure 7 shows the change in the length of the first period of the bubble (Tb) versus the initial bubble–wall distance (L) with Rmax = 1.15 mm. The black dots in the figure represent the experimental results. The blue solid line represents Tb based on the classical bubble wall motion equation (Equations (2) and (3)) [36]. The red solid line in the figure represents the fitting curve according to the experimental results. Equations (4)–(8) show the expression of the fitting curve. The point M represents the value of L corresponding to the intersection of the red solid line and the blue solid line. Based on the experimental results and the theoretical results predicted by Equations (2) and (3), the length of the first period of the bubble near the complex wall with a continuous triangular arrangement is quantitatively studied. As shown in Figure 7, Tb gradually decreases with the increase in L. When L is very large (L > 3.60 mm), the first period obtained by Equations (2) and (3) is in good agreement with the experimental results. Tb tends to a stable value around 210 μs. This indicates that, when L > 3.60 mm, the length of the first period of the bubble can be predicted by Equations (2) and (3).
R R + 3 2 R 2 = p ext ( R , t ) p 0 ρ
where
p ext ( R , t ) = p 0 + 2 σ R 0 R 0 R 3 κ 2 σ R
where R is the instantaneous bubble radius. R and R″ are the first and second derivatives of R with respect to the time. p0 is the ambient pressure. ρ is the liquid density. σ is the surface tension coefficient. R0 is the equilibrium bubble radius. κ is the polytropic exponent. Equations (2) and (3) were numerically solved by ODE 45. The values of other parameters used are: p0 = 1 × 10⁵ Pa, κ = 1.4, ρ = 1 × 10³ kg/m3, and σ = 7.25 × 10⁻² kg/s2.
T b = A 1 + A 2 1 + L A 3 A 4
where
A 1 = 197.05
A 2 = 101.56
A 3 = 1.22
A 4 = 1.73

3.2. Parameter Range Corresponding to Different Cases

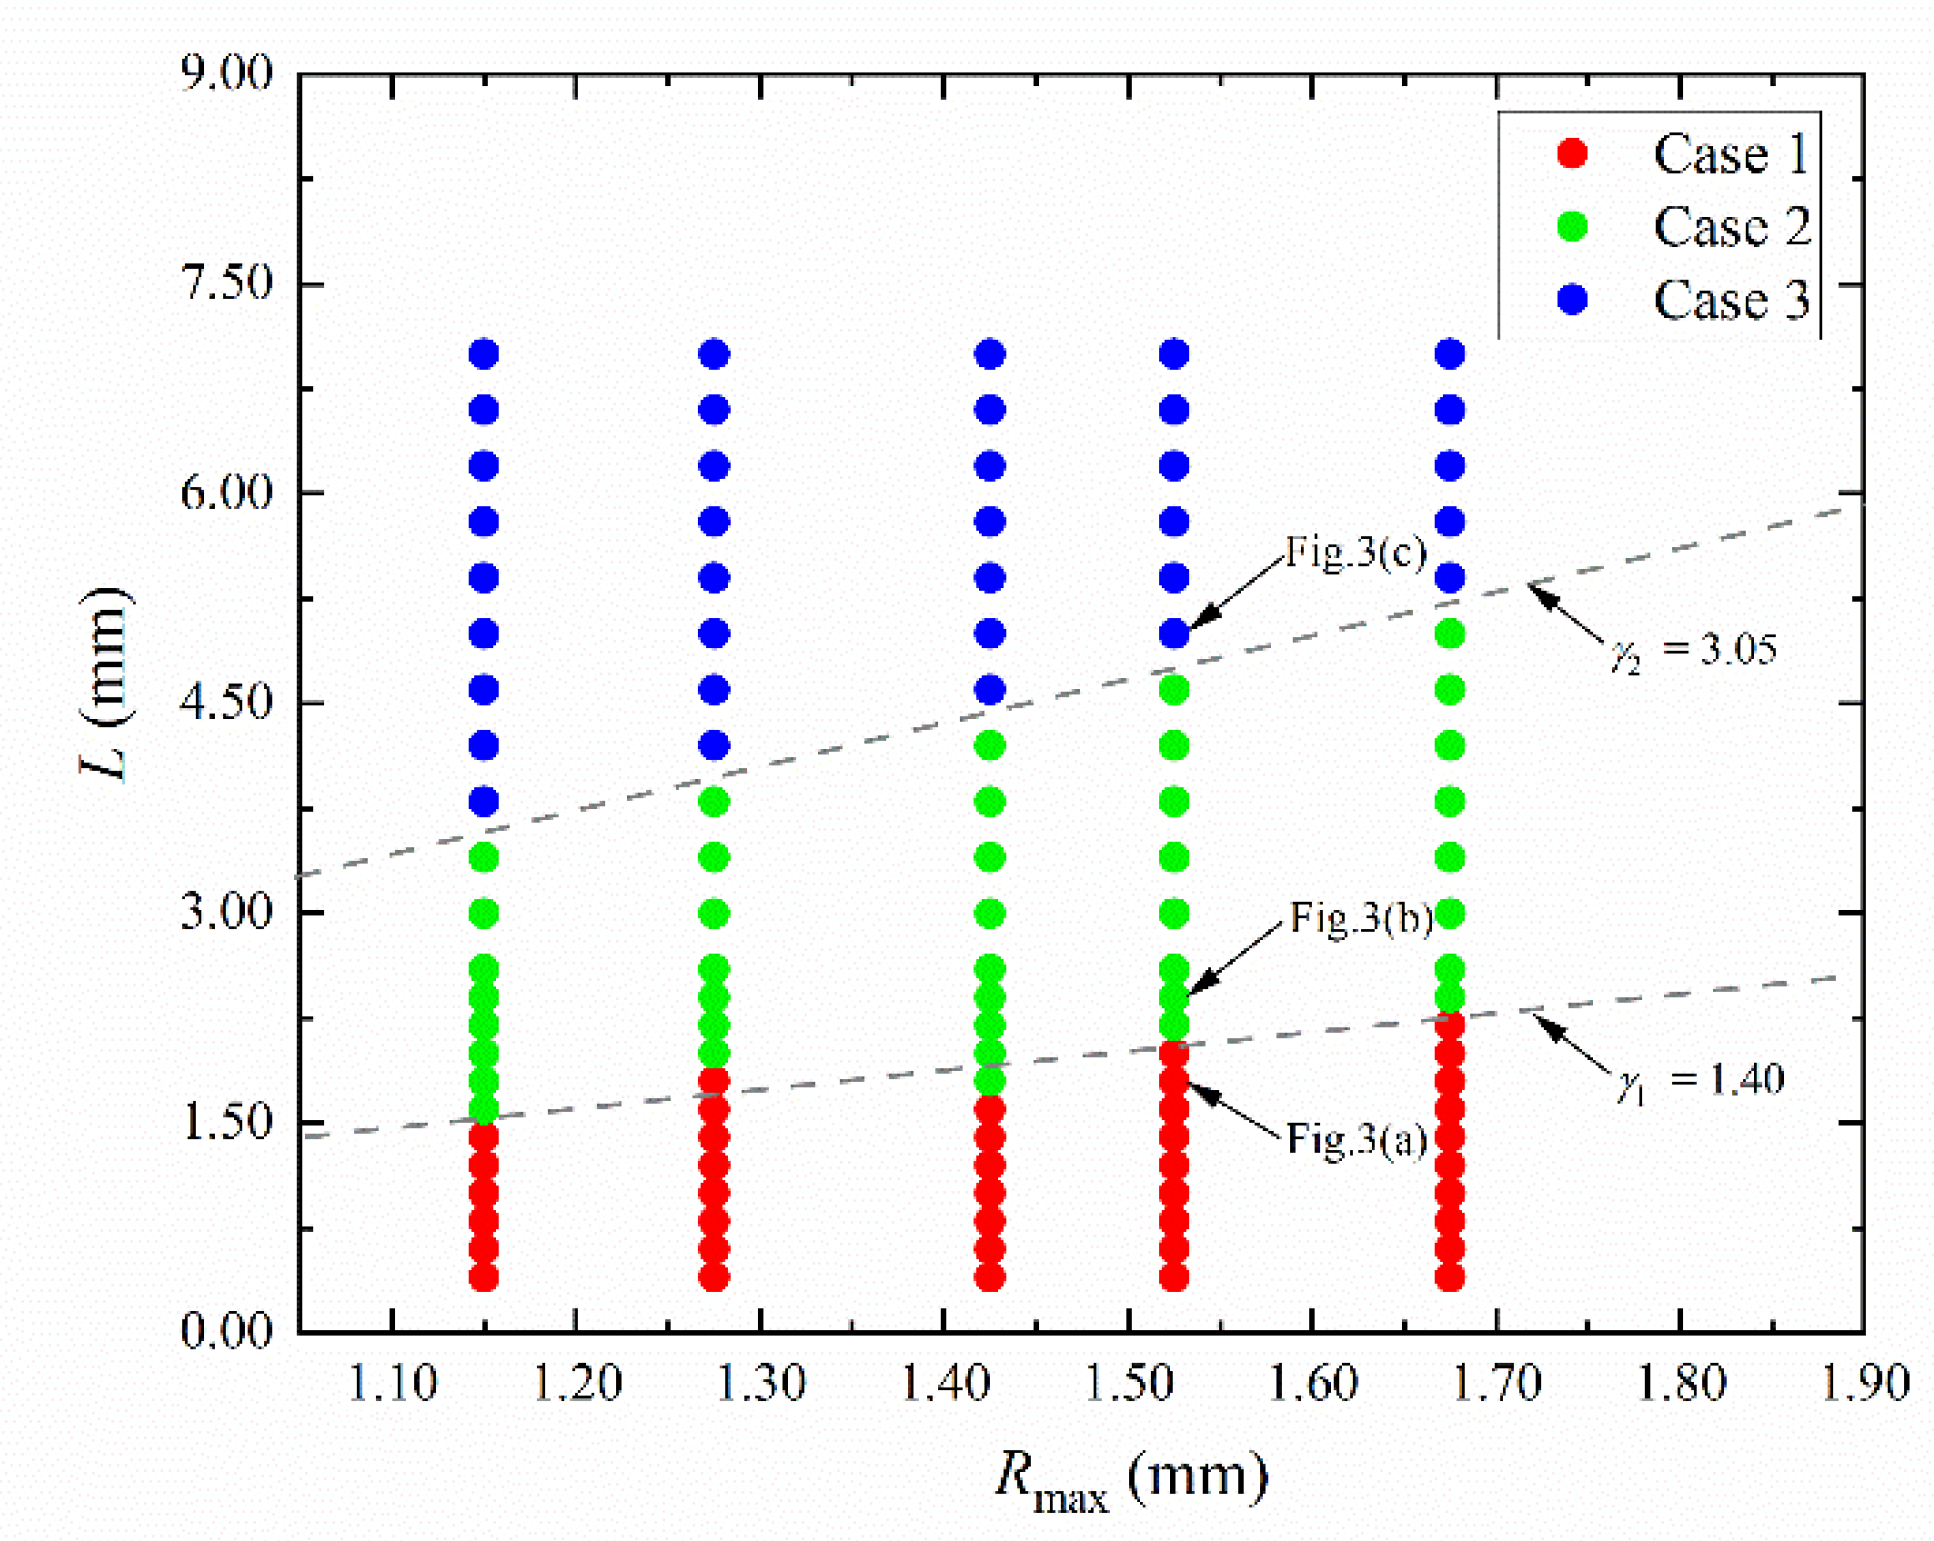
A large number of experimental results under different parameters are divided into the above three cases. As shown in Figure 8, the red, green, and blue solid circles represent cases 1–3, respectively. The corresponding examples of Figure 3a–c analyzed previously are also marked in the figure. Based on the values of γ, the critical value of case 1 and case 2 is γ = 1.40, and the critical value of case 2 and case 3 is γ = 3.05. That is to say, when γ < 1.40, the collapse dynamics of the bubble are similar to case 1. When 1.40 < γ < 3.05, the collapse dynamics of the bubble are similar to case 2. When γ > 3.05, the collapse dynamics of the bubble are similar to case 3. Therefore, the dynamic characteristics of the bubble collapse can be easily predicted according to the specific value of γ.
In this section, the experimental results are divided into three cases, and the dynamic characteristics of the bubble collapse represented by each case are introduced in detail. In addition, the parameter range corresponding to each case is defined based on the value of γ, which is convenient to quickly predict the main characteristics of the dynamic behavior of bubble collapse based on the value of γ or the values of Rmax and L.

4. Non-Uniform Collapse at the Characteristic Location of a Bubble Wall

In this section, based on the shrinkage of the leftmost and rightmost ends of the bubble wall during the bubble collapse, the differences in bubble collapse dynamics between the three cases are further discussed.
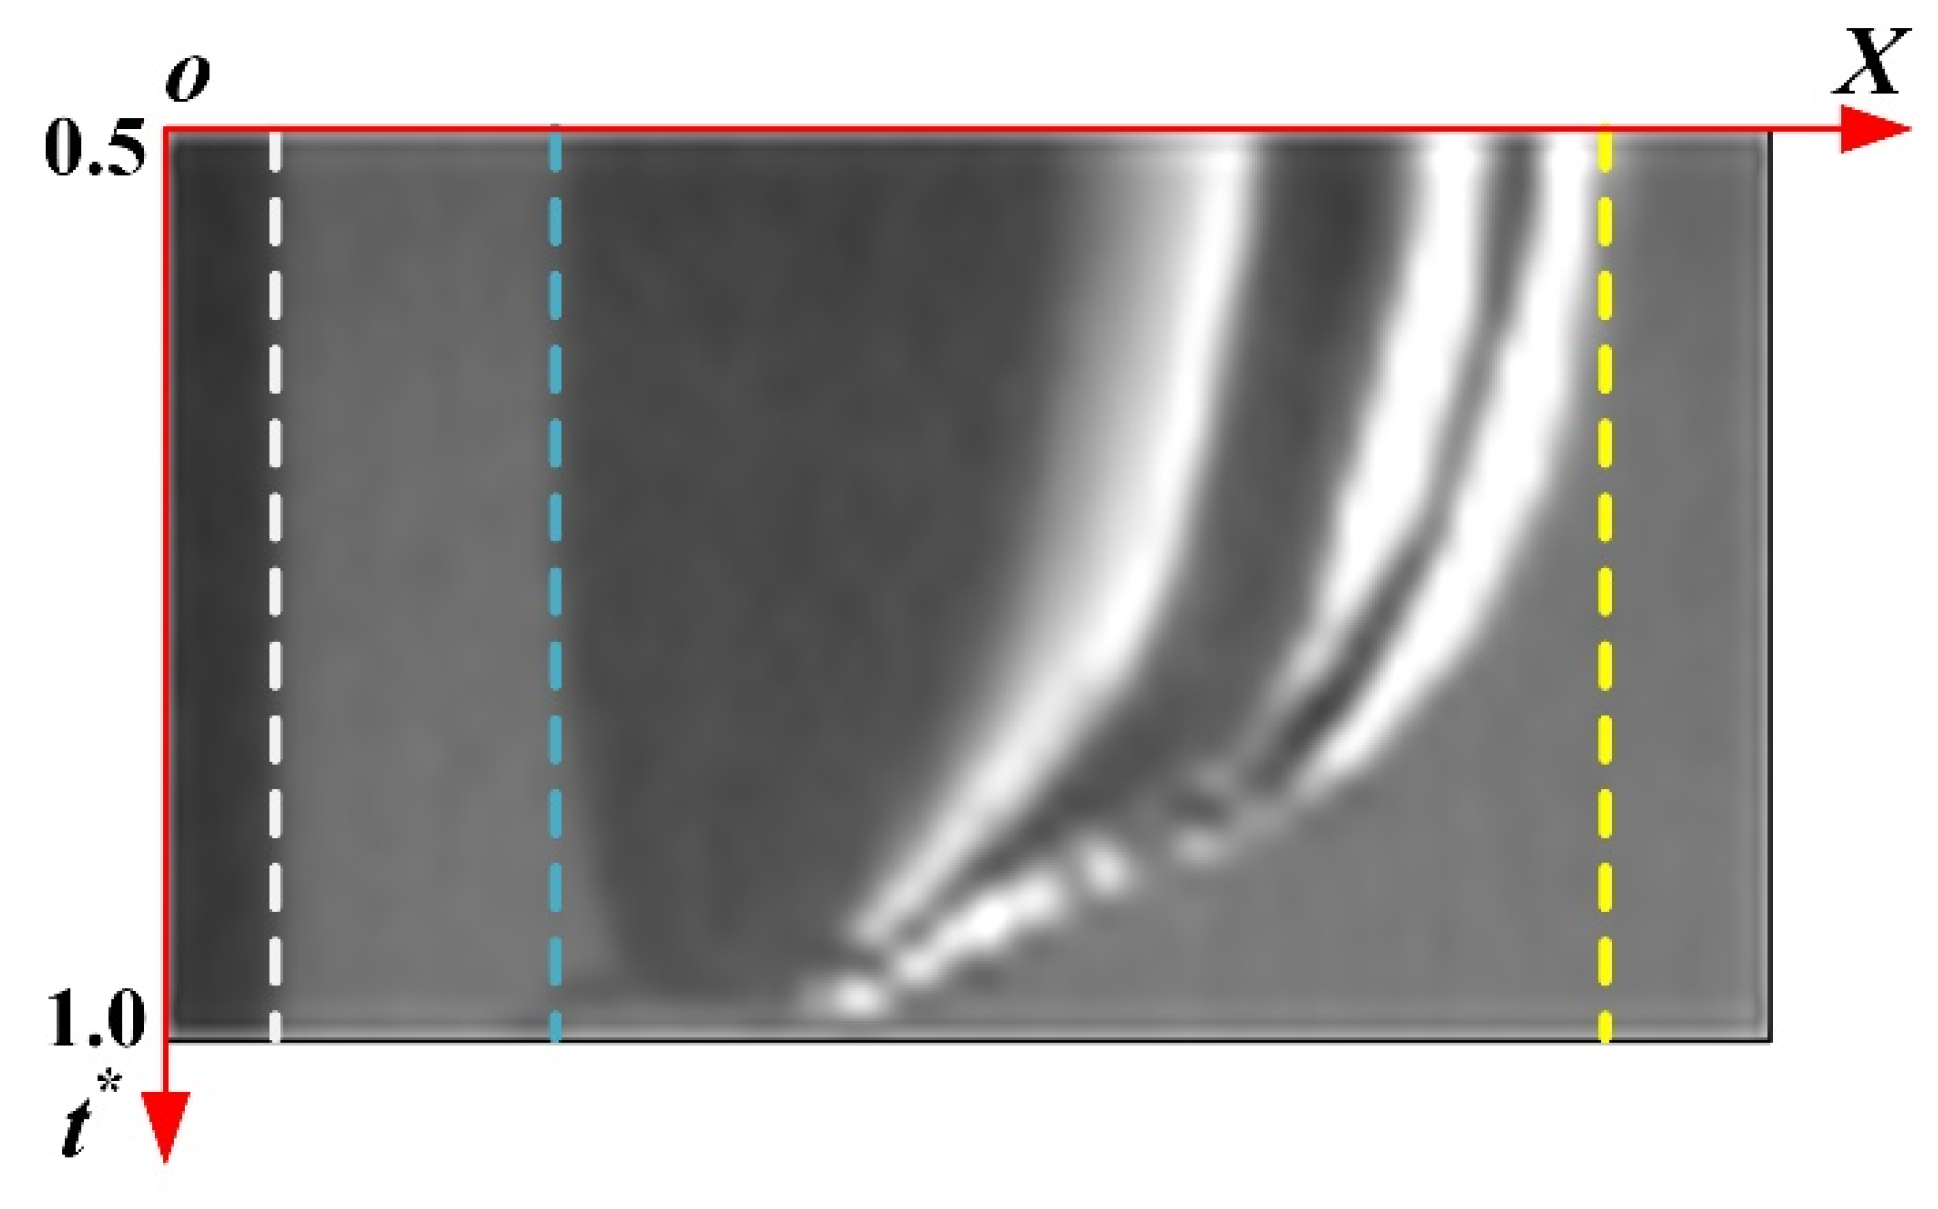
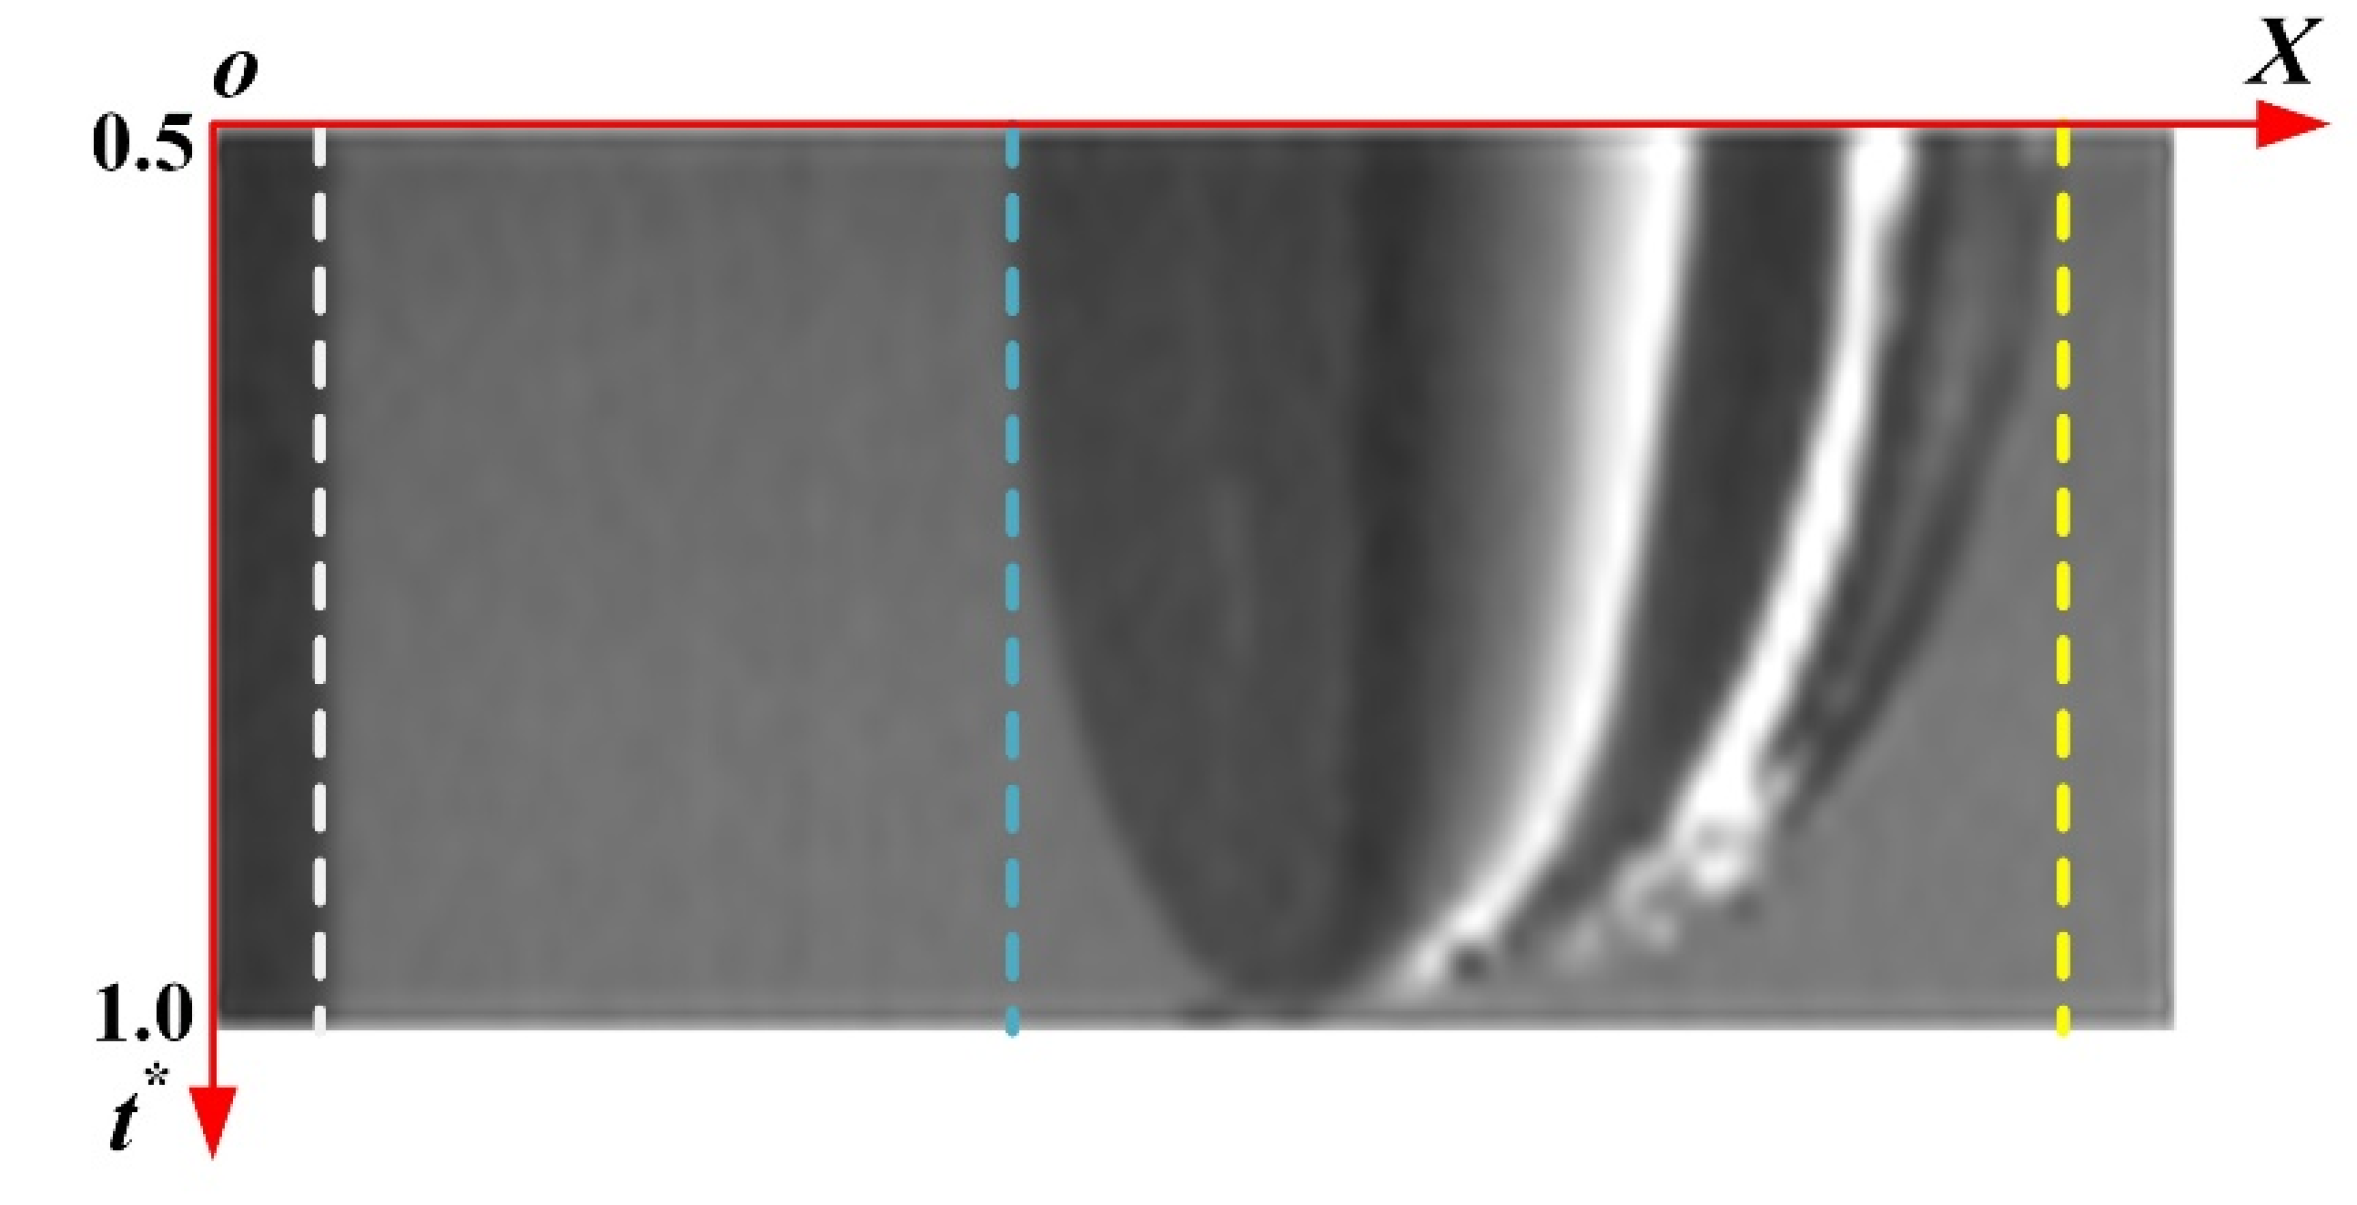
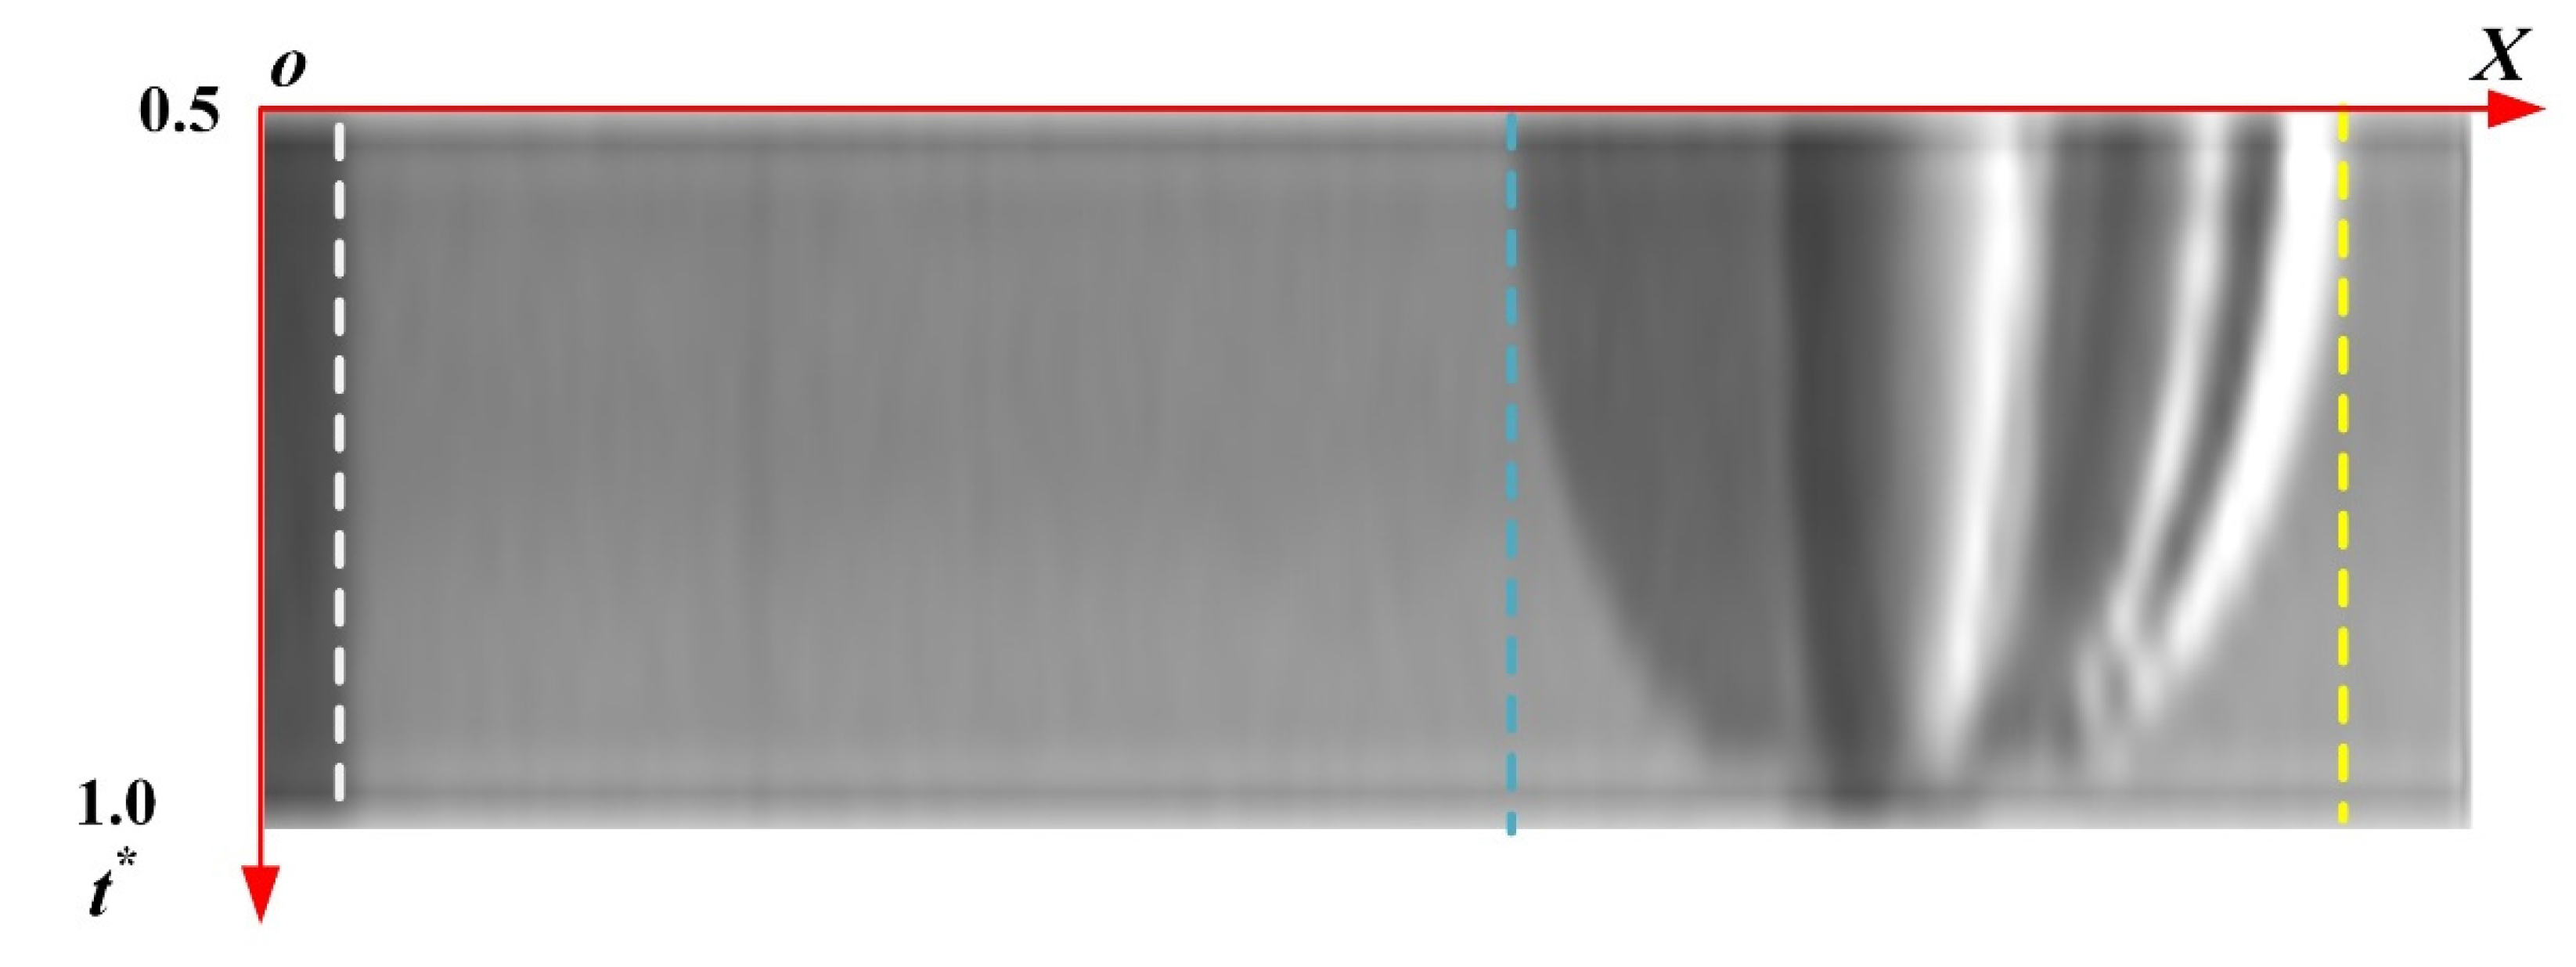
To further reveal the characteristics of bubble collapse with a complex wall with a continuous triangular arrangement, the shrinkage of the leftmost and rightmost ends of the bubble wall in the collapse process is compared for more information. Figure 9, Figure 10 and Figure 11 show the stack diagrams of horizontal slices of many experimental subfigures for three cases. Among them, Figure 9 corresponds to case 1, and its relevant parameters are L = 1.80 mm, Rmax = 1.53 mm, γ = 1.18. Figure 10 corresponds to case 2, and its relevant parameters are L = 3.00 mm, Rmax = 1.53 mm, γ = 1.97. Figure 11 corresponds to case 3, and its relevant parameters are L = 5.00 mm, Rmax = 1.53 mm, γ = 3.28. The white dashed lines in Figure 9, Figure 10 and Figure 11 represent the position of the vertex of the complex wall (corresponding to the O point defined in Figure 2). The blue dashed line represents the leftmost end of the bubble wall. The yellow dashed line represents the rightmost end of the bubble wall. As shown in Figure 8, during the bubble collapse, the leftmost end of the bubble wall almost does not move due to the strong influence of the wall. Meanwhile, the shrinkage speed of the rightmost bubble wall is very fast, especially in the late stage of bubble collapse.
Moreover, Figure 10 and Figure 11 show the shrinkage of the leftmost and rightmost ends of the bubble wall in the collapse process for cases 2 and 3, respectively. Compared with case 1, the difference in the shrinkage speed between the leftmost and rightmost ends of case 2 or case 3 is significantly reduced, especially in case 3. The difference of the shrinkage speed between the leftmost and the rightmost ends of case 2 is smaller than that of case 1, although the shrinkage speed of the leftmost end is still smaller than that of the rightmost end. The shrinkage speed of the leftmost and the rightmost ends of case 3 is almost the same, which indicates that the effect of the complex wall on the bubble collapse dynamics can be safely ignored.
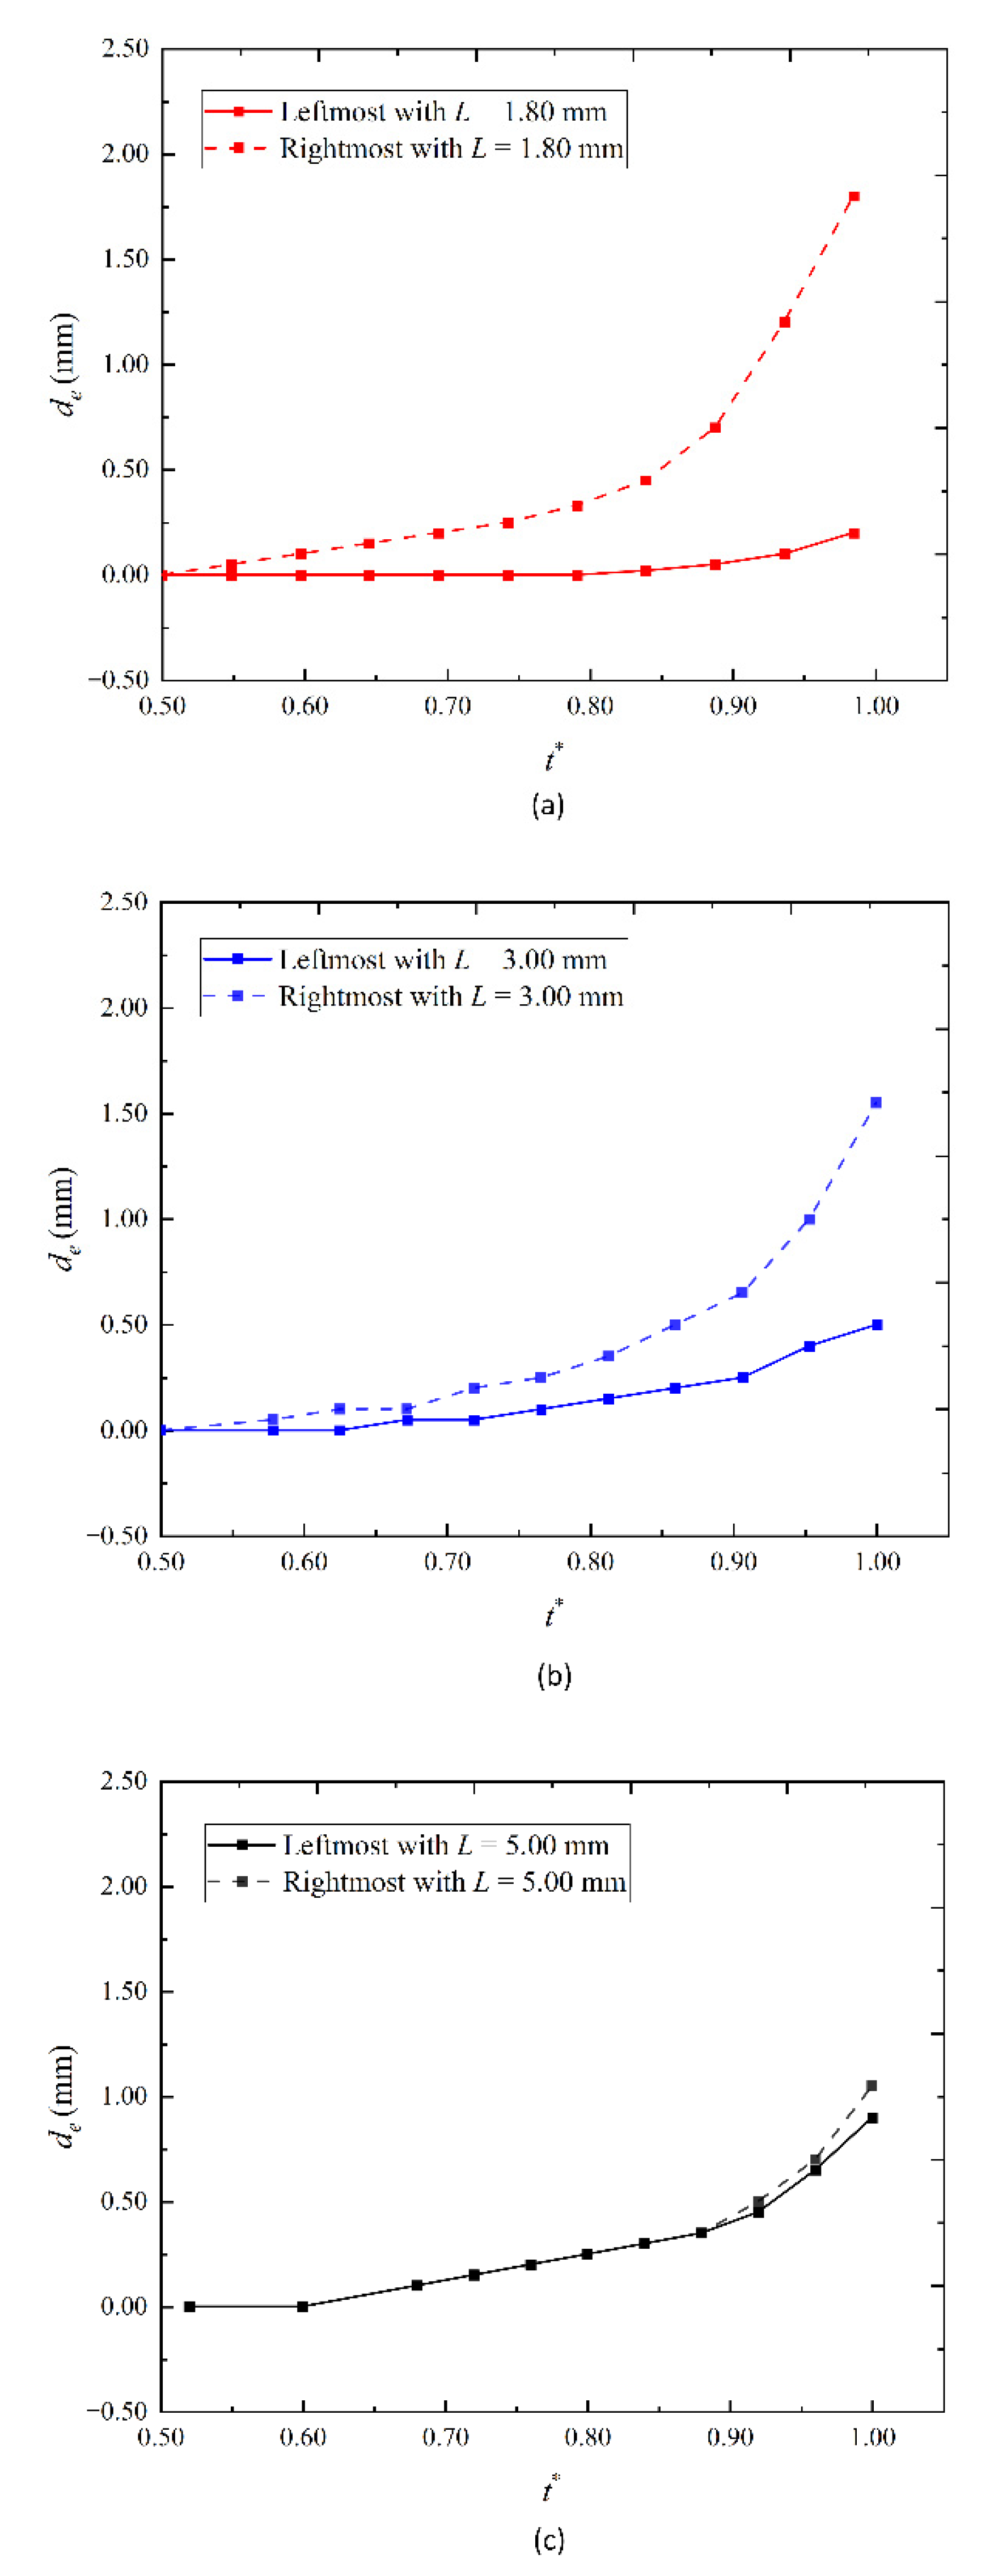
Figure 12 shows the moving distance of the leftmost and rightmost ends of the bubble wall (de) with dimensionless time (t*) versus different initial wall–bubble distance (L) during the collapse. Figure 12a–c refer to L = 1.80 mm, 3.00 mm, and 5.00 mm, respectively. Rmax = 1.53 mm. The corresponding values of γ are 1.18, 1.96, and 3.27, respectively. The solid line represents the leftmost end of the bubble wall, and the dashed line represents the rightmost end of the bubble wall. As shown in Figure 12a, when L is small, the difference in moving distance between the leftmost and rightmost ends of the bubble wall is obvious. With the increase in L, because the effect of the complex wall is weakened, the difference in moving distance between the leftmost and rightmost ends of the bubble wall is gradually reduced. This shows that, the larger L, the weaker the bubble is affected by the wall.
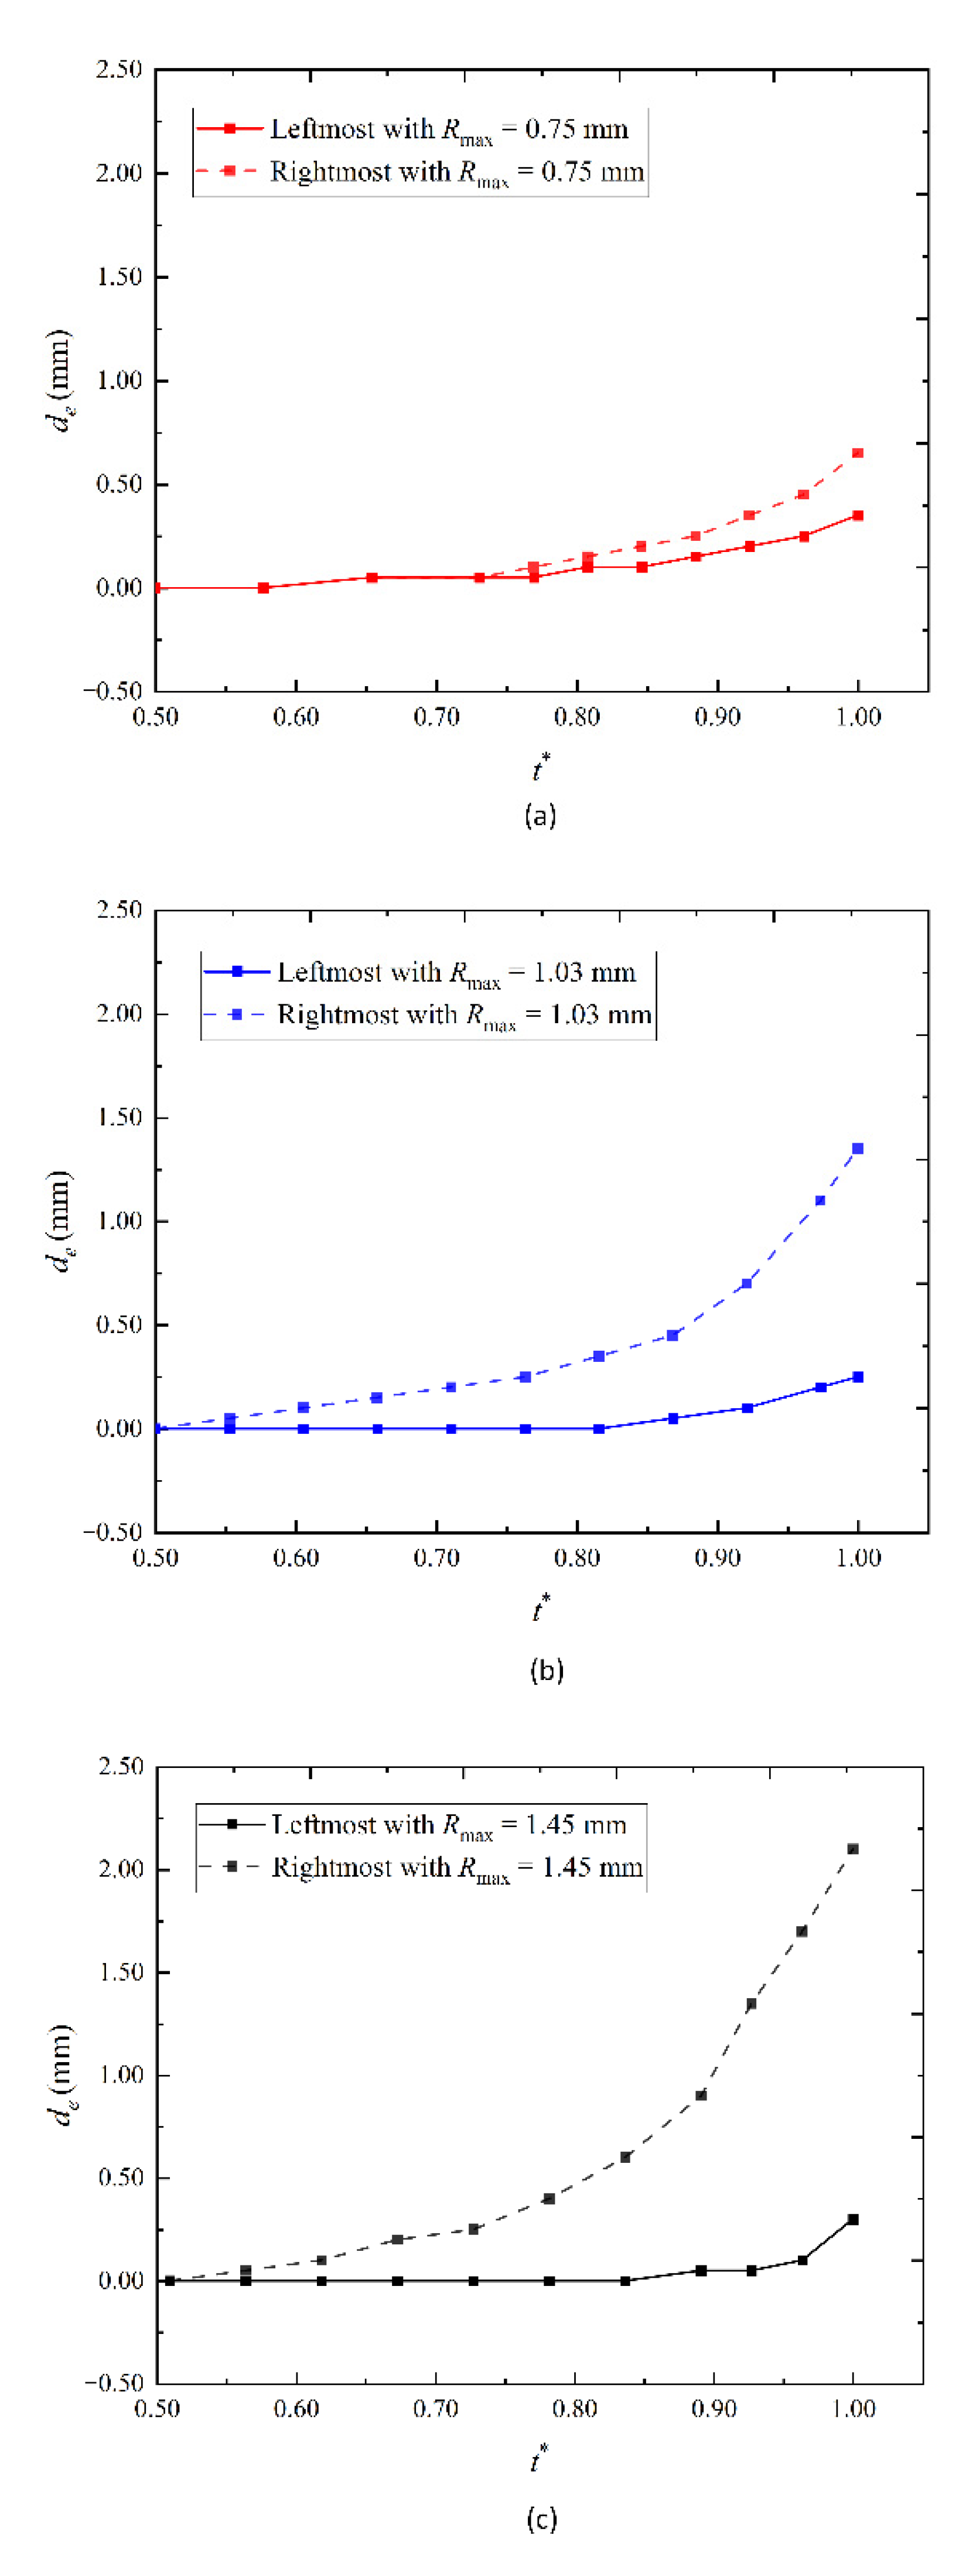
Figure 13 shows the moving distance of the leftmost and rightmost ends of the bubble wall (de) with dimensionless time (t*) versus different bubble sizes during the bubble collapse. The solid line represents the leftmost end of the bubble wall, and the dashed line represents the rightmost end of the bubble wall. Figure 13a–c refer to Rmax = 0.75 mm, 1.03 mm, and 1.45 mm, respectively. L = 2.30 mm. The corresponding values of γ are 3.07, 2.23, and 1.59, respectively. As shown in Figure 13a, when Rmax is small, the difference in moving distance between the leftmost and rightmost ends of the bubble wall is weak. With the increase in Rmax, the above difference gradually increases (corresponding to Figure 13c). This shows that the larger Rmax, the more obvious the effect of the complex wall on the cavitation bubble, and the more serious the spherical deformation of the bubble.
In conclusion, the closer the bubble is to the complex wall, or the larger the bubble size is, the greater is the difference in the movement distance between the left and right sides of the bubble wall in the process of bubble collapse which indicates that the non-uniformity of bubble collapse is more significant. To some extent, this can also indicate that the bubble collapse is relatively violent, which is conducive to the effect of cavitation cleaning on the complex wall.

5. Movement Characteristics of a Cavitation Bubble

In the previous analysis, the characteristics of the bubble shape are focused on. Moreover, according to Figure 3a–c, it is found that the bubble moves towards the wall, Therefore, in order to reveal how the relevant parameters affect the bubble movement, the influences of the initial wall–bubble distance and the bubble size on the movement distance of the bubble centroid are discussed quantitatively in this section.
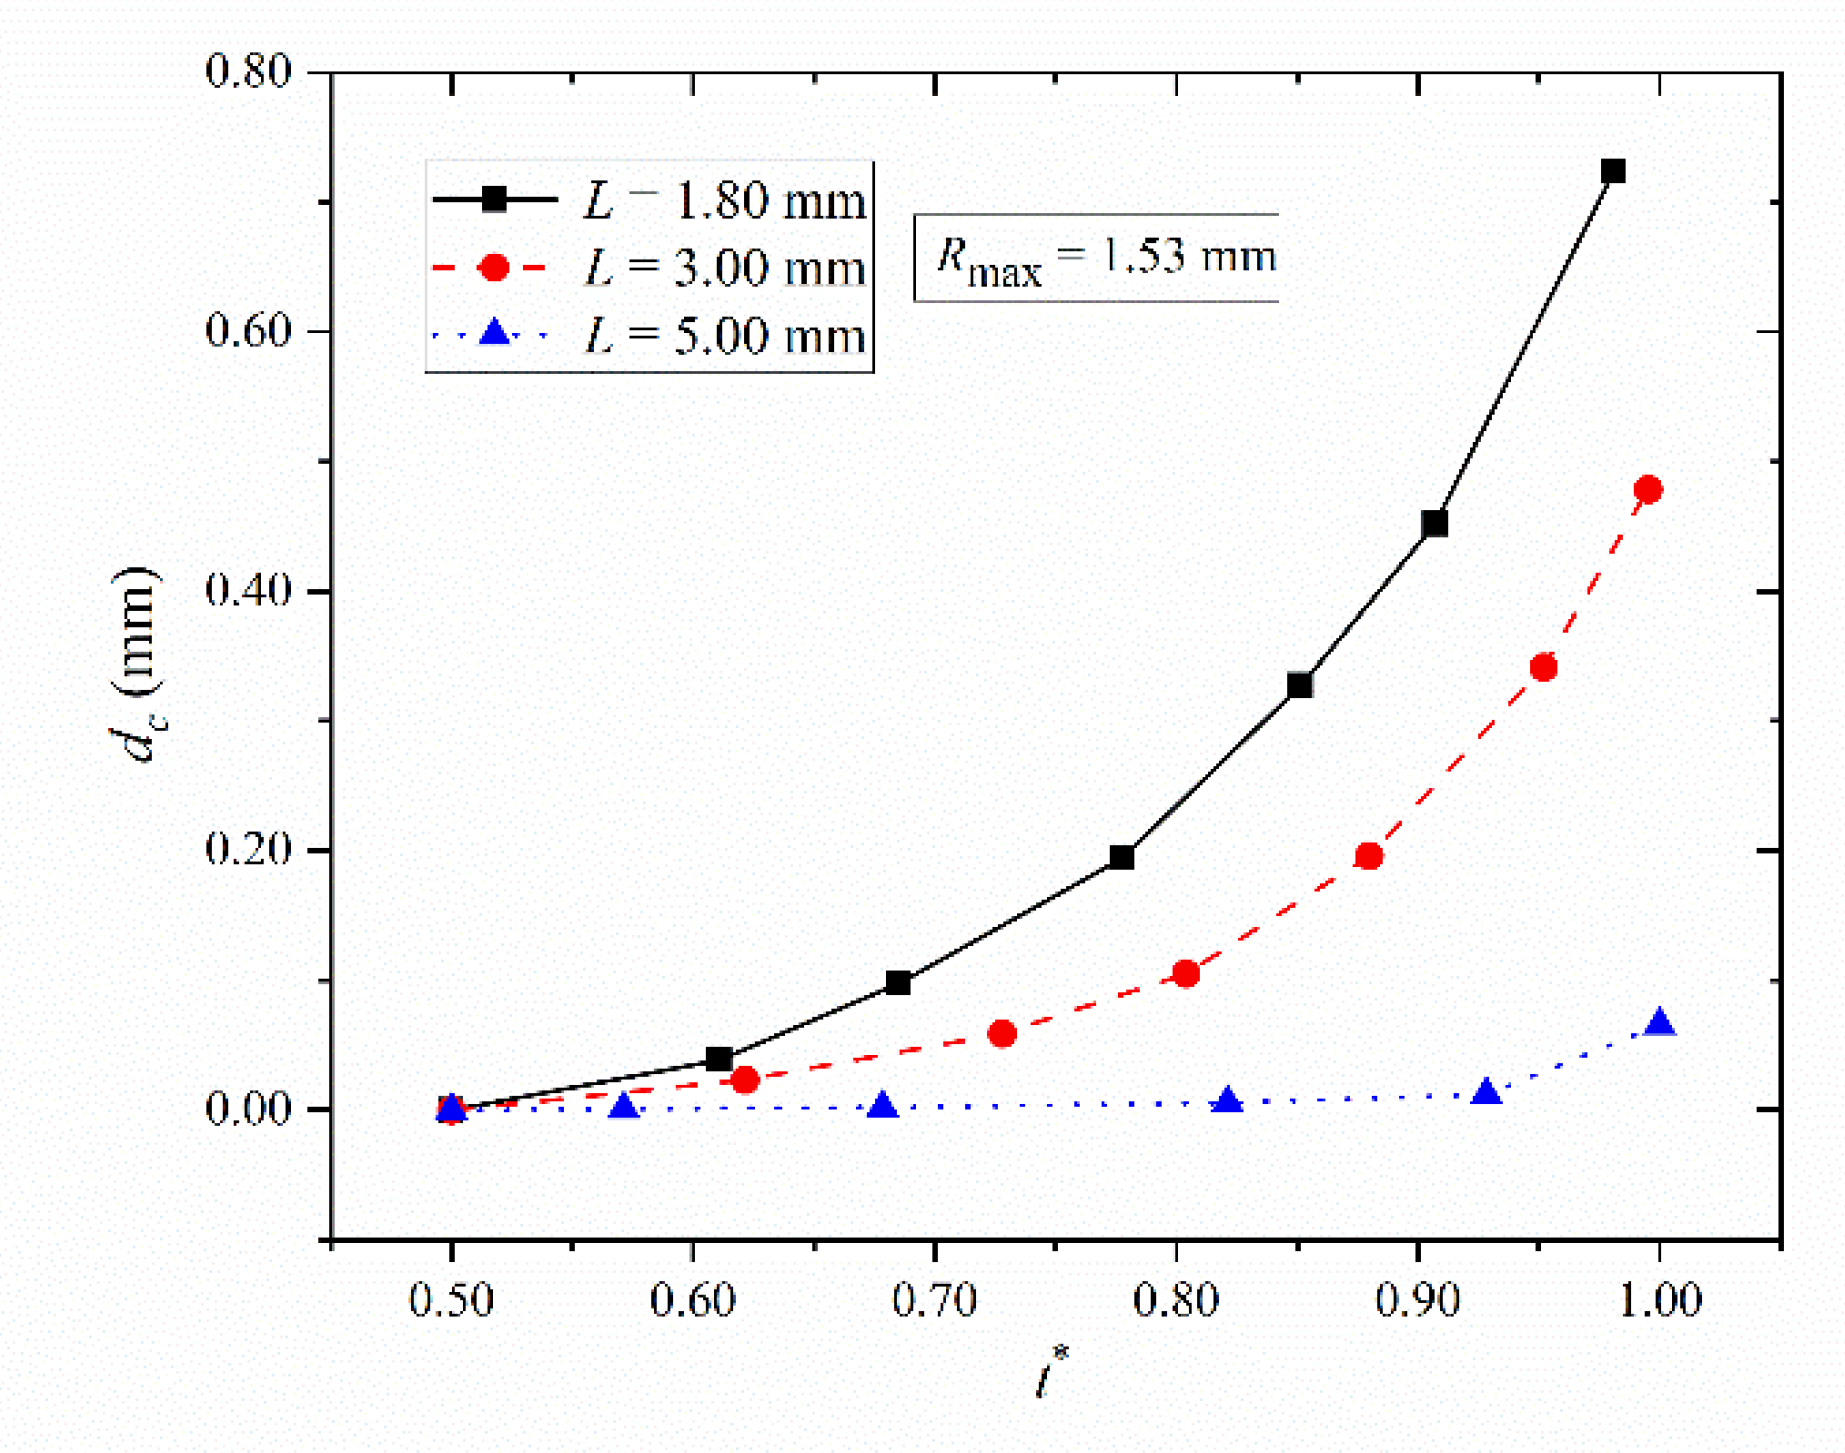
Figure 14 shows the change in the movement distance of the bubble centroid (dc) with dimensionless time (t*) versus different initial wall–bubble distance (L). The black solid, red dashed, and blue dotted lines refer to L = 1.80 mm, 3.00 mm, and 5.00 mm, respectively. Rmax = 1.53 mm. As shown in Figure 14, When L is small, dc is relatively large. Moreover, as L increases, dc decreases gradually. For example, when L = 5.00 mm, the position of the bubble centroid hardly changes. The above analysis shows that the complex wall has a certain attraction to the bubble, which makes the bubble gradually move towards the wall. Moreover, with the increase in L, the effect of the complex wall will gradually weaken.
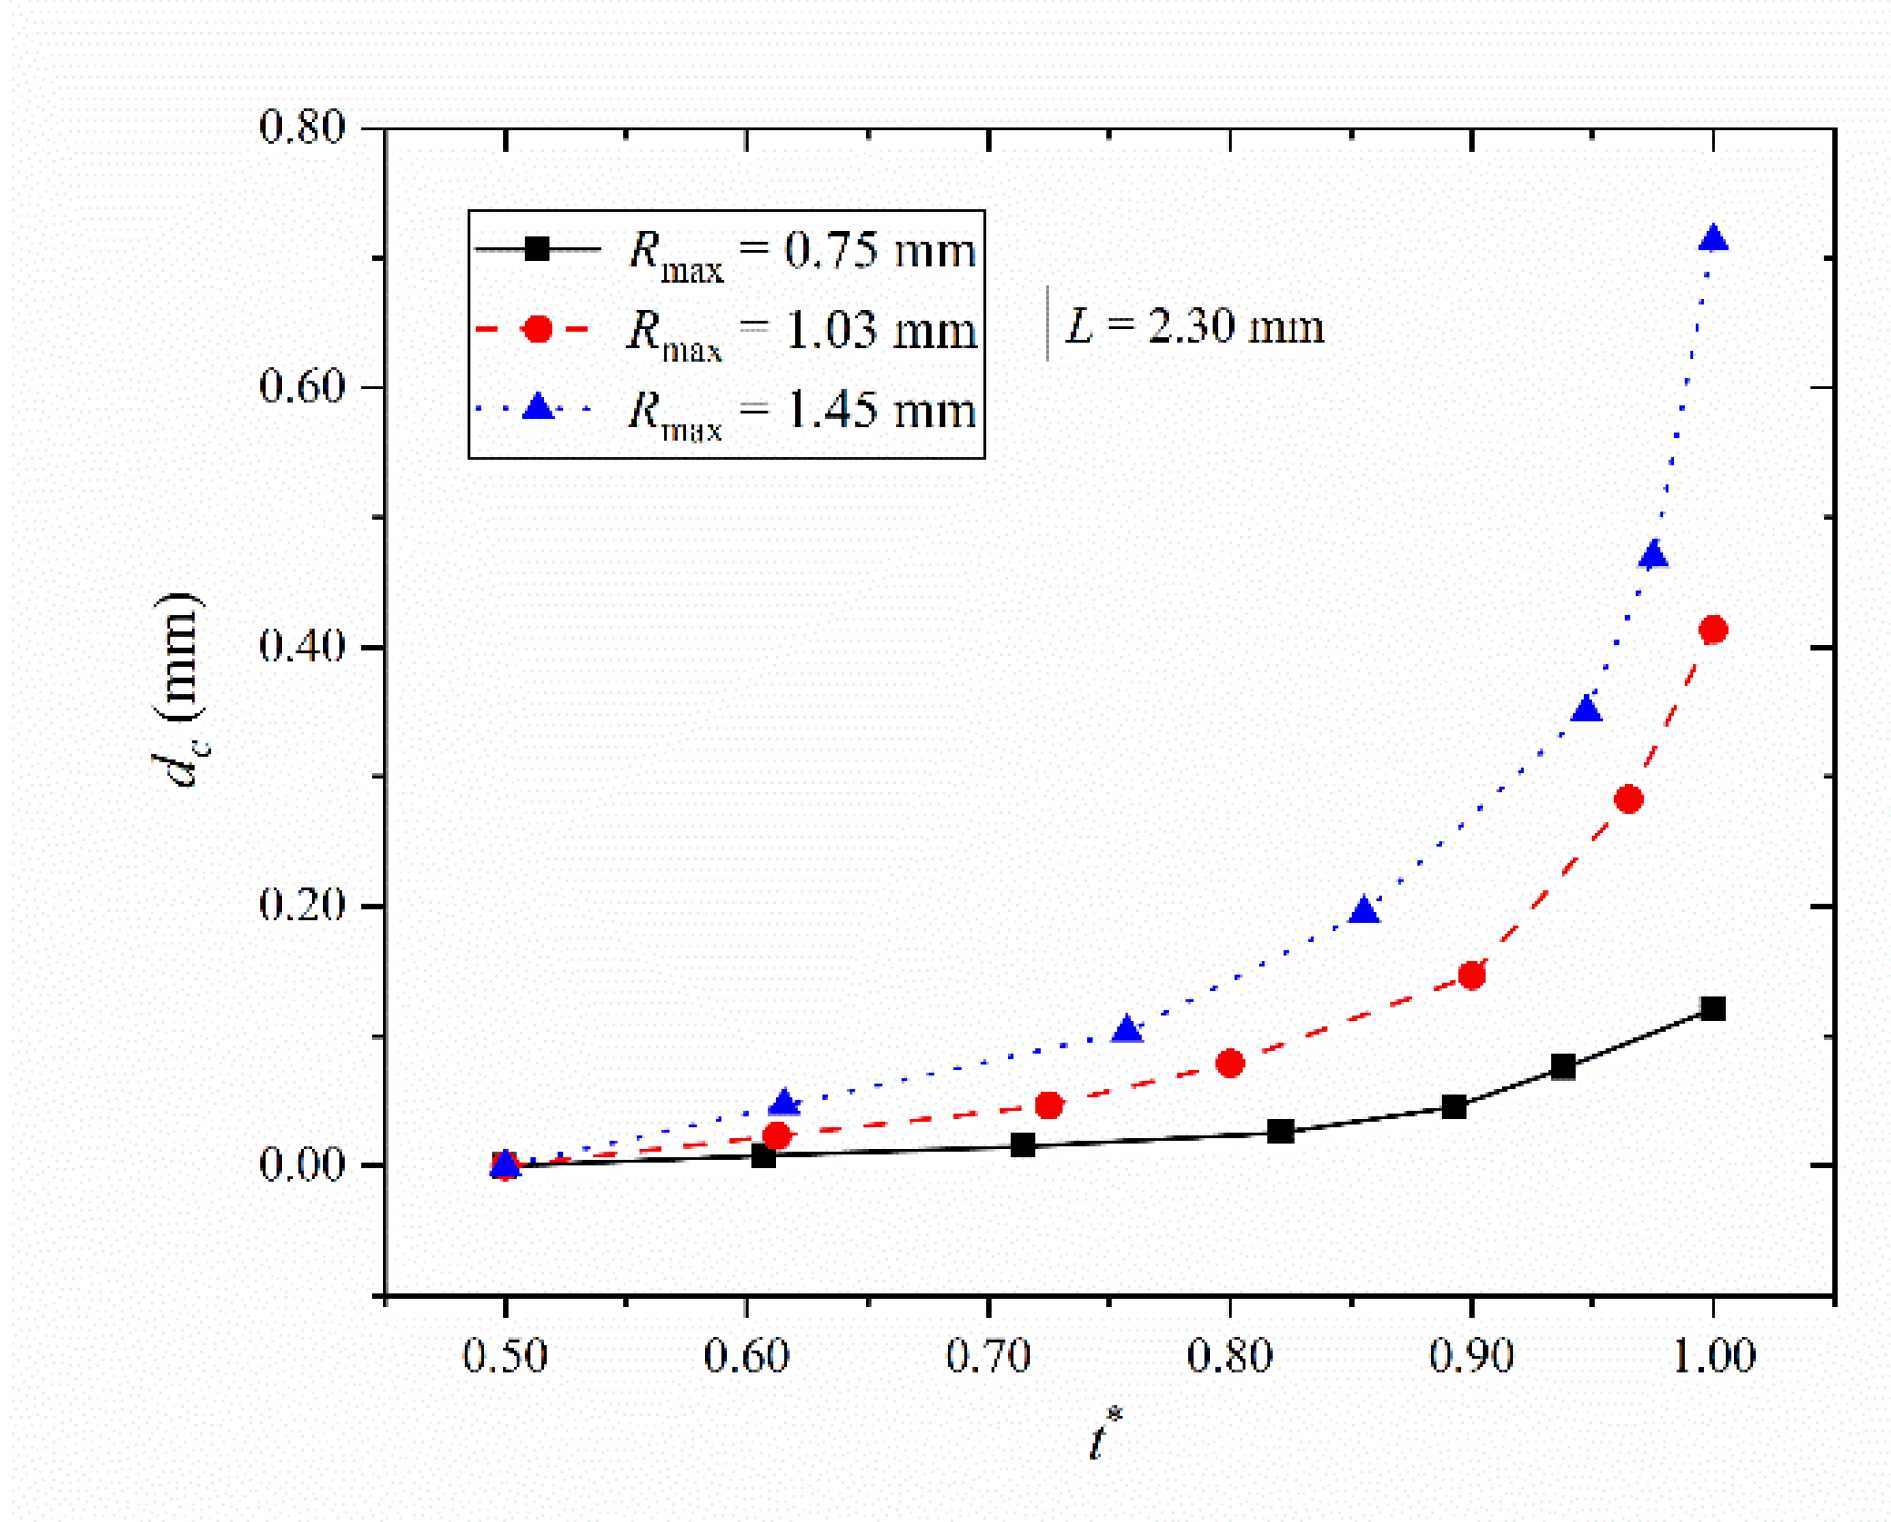
Figure 15 shows the change in dc with t* versus different Rmax. The black solid line, red dashed line, and blue dotted line refer to Rmax = 0.75 mm, 1.03 mm, and 1.45 mm, respectively. L = 2.30 mm. As shown in Figure 15, when Rmax is small, because the effect of the complex wall on the cavitation bubble is relatively weak, dc is not obvious. In addition, when the bubble size gradually increases, the effect of the complex wall on the bubble is also gradually significant, resulting in dc becoming larger and larger.
This section quantitatively discusses the influences of L and Rmax on dc. It is found that, the closer the initial wall–bubble distance is to the complex wall or the larger Rmax is, the more significant the effect of the complex wall on the bubble is, and the greater dc is.

6. Conclusions

In this paper, the dynamic behavior of cavitation bubble in symmetrical positions near a complex wall with a continuous triangular arrangement is investigated, with the help of a high-speed photography experimental system. In terms of bubble size and wall–bubble distance, the non-uniform shrinkage of the bubble collapse and the movement characteristics of the bubble centroid are discussed. The main conclusions of this paper are as follows.
  • According to the difference in the collapse speed of the left and right bubble walls and the difference in the centroid movement distance under different parameters, the collapse dynamics of the bubble near a complex wall with a continuous triangular arrangement can be divided into three typical cases. For case 1, the difference in the contraction velocity between the left and right bubble walls is the most obvious, and the distance of the centroid movement of the bubble is the largest. For case 3, the bubble centroid basically does not move and appears spherical collapse. Case 2 is between case 1 and case 3. According to a large number of experimental results under different parameters, the corresponding parameter range of each case is given. When γ < 1.40, the collapse dynamics of the bubble are similar to case 1. When 1.40 < γ < 3.05, the collapse dynamics of the bubble are similar to case 2. When γ > 3.05, the collapse dynamics of the bubble are similar to case 3.
  • Tb gradually decreases with the increase in L. When L is very large, Tb obtained by classical bubble wall motion equation is in good agreement with the experimental results, and Tb tends to a stable value. This shows that Tb can be effectively predicted by this equation when L is large.
  • The larger Rmax is or the smaller L is, the more significant the effect of the complex wall is, the more significant is the collapse speed of the left and right bubble walls, and, the greater the movement distance towards the complex wall during the collapse stage. To some extent, it can indicate that the bubble collapse near the complex wall is very violent, which is beneficial to the field of cavitation cleaning on the complex wall.

Author Contributions

Conceptualization, X.Z. and X.W.; formal analysis, X.W.; resources, X.Z. and X.L.; software, X.L.; visualization, Y.Z. (Yuning Zhang 1); writing—original draft, X.Z. and J.Y.; writing—review and editing, Y.Z. (Yuning Zhang 2) and J.Y. All authors have read and agreed to the published version of the manuscript.

Funding

This research was financially supported by the National Natural Science Foundation of China (Project Nos.: 51976056 and 52076215).

Institutional Review Board Statement

Not applicable.

Informed Consent Statement

Not applicable.

Data Availability Statement

Not applicable.

Acknowledgments

The authors thank the reviewers for their great help on the article during its review progress.

Conflicts of Interest

The authors declare no conflict of interest.

References

  1. Thanu, D.P.; Antoniswamy, A.; Swaminathan, V.V.; Srinadhu, E.S.; Dole, N.; Zhao, M.; Balachandran, R.; Agrawal, D.; Kumar, J.; Keswani, M. Use of Surfactants in Acoustic Cleaning. Surfactants Precis. Clean. 2022, 193–226. [Google Scholar] [CrossRef]
  2. Kim, H.; Lee, Y.; Lim, E. Design and fabrication of a horn-type megasonic waveguide for nanoparticle cleaning. IEEE Trans. Semicond. Manuf. 2013, 26, 221–225. [Google Scholar] [CrossRef]
  3. Chu, C.L.; Lu, T.Y.; Fuh, Y.K. The suitability of ultrasonic and megasonic cleaning of nanoscale patterns in ammonia hydroxide solutions for particle removal and feature damage. Semicond. Sci. Technol. 2020, 35, 045001. [Google Scholar] [CrossRef]
  4. Gonzalez-Avila, S.R.; Huang, X.; Quinto-Su, P.A.; Wu, T.; Ohl, C.-D. Motion of micrometer sized spherical particles exposed to a transient radial flow: Attraction, repulsion, and rotation. Phys. Rev. Lett. 2011, 107, 074503. [Google Scholar] [CrossRef] [PubMed]
  5. Gonzalez-Avila, S.R.; Prabowo, F.; Kumar, A.; Ohl, C.-D. Improved ultrasonic cleaning of membranes with tandem frequency excitation. J. Membr. Sci. 2012, 415, 776–783. [Google Scholar] [CrossRef]
  6. Olim, M. A theoretical evaluation of megasonic cleaning for submicron particles. J. Electrochem. Soc. 1997, 144, 3657. [Google Scholar] [CrossRef]
  7. Chahine, G.L.; Kapahi, A.; Choi, J.K.; Hsiao, C.T. Modeling of surface cleaning by cavitation bubble dynamics and collapse. Ultrason. Sonochem. 2016, 29, 528–549. [Google Scholar] [CrossRef]
  8. Wu, S.; Zuo, Z.; Stone, H.A.; Liu, S. Motion of a free-settling spherical particle driven by a laser-induced bubble. Phys. Rev. Lett. 2017, 119, 084501. [Google Scholar] [CrossRef]
  9. Neppiras, E.A. Acoustic cavitation. Phys. Rep. 1980, 61, 159–251. [Google Scholar] [CrossRef]
  10. Chen, D.; Weavers, L.K.; Walker, H.W. Ultrasonic control of ceramic membrane fouling by particles: Effect of ultrasonic factors. Ultrason. Sonochem. 2006, 13, 379–387. [Google Scholar] [CrossRef]
  11. Dijkink, R.; Ohl, C.D. Measurement of cavitation induced wall shear stress. Appl. Phys. Lett. 2008, 93, 254107. [Google Scholar] [CrossRef]
  12. Ohl, C.D.; Arora, M.; Dijkink, R.; Janve, V.; Lohse, D. Surface cleaning from laser-induced cavitation bubbles. Appl. Phys. Lett. 2006, 89, 074102. [Google Scholar] [CrossRef] [Green Version]
  13. Vogel, A.; Lauterborn, W.; Timm, R. Optical and acoustic investigations of the dynamics of laser-produced cavitation bubbles near a solid boundary. J. Fluid Mech. 1989, 206, 299–338. [Google Scholar] [CrossRef]
  14. Lauterborn, W.; Bolle, H. Experimental investigations of cavitation-bubble collapse in the neighbourhood of a solid boundary. J. Fluid Mech. 1975, 72, 391–399. [Google Scholar] [CrossRef]
  15. Li, X.; Duan, Y.; Zhang, Y.; Tang, N.; Zhang, Y. Retardant effects of collapsing dynamics of a laser-induced cavitation bubble near a solid wall. Symmetry 2019, 11, 1051. [Google Scholar] [CrossRef] [Green Version]
  16. Blake, J.R.; Cerone, P. A note on the impulse due to a vapour bubble near a boundary. ANZIAM J. 1982, 23, 383–393. [Google Scholar] [CrossRef] [Green Version]
  17. Blake, J.R.; Taib, B.B.; Doherty, G. Transient cavities near boundaries. Part 1. Rigid boundary. J. Fluid Mech. 1986, 170, 479–497. [Google Scholar] [CrossRef]
  18. Zhang, Y.; Sun, Z. Review on progress of the interactions between cavitation bubble and boundary. Nucl. Sci. Eng. 2022, 42, 598–615. [Google Scholar]
  19. Zhong, P.; Cocks, F.H.; Cioanta, I.; Preminger, G.M. Controlled, forced collapse of cavitation bubbles for improved stone fragmentation during shock wave lithotripsy. J. Urol. 1997, 158, 2323–2328. [Google Scholar] [CrossRef] [PubMed]
  20. Tomita, Y.; Robinson, P.B.; Tong, R.P.; Blake, J.R. Growth and collapse of cavitation bubbles near a curved rigid boundary. J. Fluid Mech. 2002, 466, 259–283. [Google Scholar] [CrossRef]
  21. Shima, A.; Tomita, Y.; Gibson, D.C.; Blake, J.R. The growth and collapse of cavitation bubbles near composite surfaces. J. Fluid Mech. 1989, 203, 199–214. [Google Scholar] [CrossRef]
  22. Shervani-Tabar, M.T.; Rouhollahi, R. Numerical study on the effect of the concave rigid boundaries on the cavitation intensity. Sci. Iran. 2017, 24, 1958–1965. [Google Scholar] [CrossRef] [Green Version]
  23. Zhang, Y.; Qiu, X.; Zhang, X.; Tang, N. Collapsing dynamics of a laser-induced cavitation bubble near the edge of a rigid wall. Ultrason. Sonochem. 2020, 67, 105157. [Google Scholar] [CrossRef]
  24. Brujan, E.A.; Noda, T.; Ishigami, A.; Ogasawara, T.; Takahira, H. Dynamics of laser-induced cavitation bubbles near two perpendicular rigid walls. J. Fluid Mech. 2018, 841, 28–49. [Google Scholar] [CrossRef]
  25. Tagawa, Y.; Peters, I.R. Bubble collapse and jet formation in corner geometries. Phys. Rev. Fluids 2018, 3, 081601. [Google Scholar] [CrossRef] [Green Version]
  26. Zhang, Y.N.; Xie, X.Y.; Zhang, Y.N.; Zhang, Y.X. High-speed experimental photography of collapsing cavitation bubble between a spherical particle and a rigid wall. J. Hydrodyn. 2018, 30, 1012–1021. [Google Scholar] [CrossRef]
  27. Zhang, Y.; Xie, X.; Zhang, Y.; Du, X. Experimental study of influences of a particle on the collapsing dynamics of a laser-induced cavitation bubble near a solid wall. Exp. Therm. Fluid Sci. 2019, 105, 289–306. [Google Scholar] [CrossRef]
  28. Wang, X.; Wu, G.; Zheng, X.; Du, X.; Zhang, Y. Theoretical investigation and experimental support for the cavitation bubble dynamics near a spherical particle based on Weiss theorem and Kelvin impulse. Ultrason. Sonochem. 2022, 89, 106130. [Google Scholar] [CrossRef]
  29. Zhang, Y.; Chen, F.; Zhang, Y.; Du, X. Experimental investigations of interactions between a laser-induced cavitation bubble and a spherical particle. Exp. Therm. Fluid Sci. 2018, 98, 645–661. [Google Scholar] [CrossRef]
  30. Morad, A.M.; Selima, E.S.; Abu-Nab, A.K. Bubbles interactions in fluidized granular medium for the van der Waals hydrodynamic regime. Eur. Phys. J. Plus 2021, 136, 306. [Google Scholar] [CrossRef]
  31. Morad, A.M.; Selima, E.S.; Abu-Nab, A.K. Thermophysical bubble dynamics in N-dimensional Al2O3/H2O nanofluid between two-phase turbulent flow. Case Stud. Therm. Eng. 2021, 28, 101527. [Google Scholar] [CrossRef]
  32. Abu-Nab, A.K.; Morad, A.M.; Selima, E.S. Impact of magnetic-field on the dynamic of gas bubbles in N-dimensions of non-Newtonian hybrid nanofluid: Analytical study. Phys. Scr. 2022, 97, 105202. [Google Scholar] [CrossRef]
  33. Abu-Nab, A.K.; Selima, E.S.; Morad, A.M. Theoretical investigation of a single vapor bubble during Al2O3/H2O nanofluids in power-law fluid affected by a variable surface tension. Phys. Scr. 2021, 96, 035222. [Google Scholar] [CrossRef]
  34. Chen, F.; Zhang, Y.; Zhang, Y. Experimental study of a laser induced cavitation bubble near a complex boundary. IOP Conf. Ser. Earth Environ. Sci. 2019, 240, 062039. [Google Scholar] [CrossRef]
  35. Zheng, X.; Wang, X.; Ding, Z.; Li, A.; Lu, X.; Zhang, Y. Investigation on the cavitation bubble collapse and the movement characteristics near spherical particles based on Weiss theorem. Ultrason. Sonochem. 2023, 93, 106301. [Google Scholar] [CrossRef]
  36. Plesset, M.S. The dynamics of cavitation bubbles. Int. J. Appl. Mech. 1949, 16, 277–282. [Google Scholar] [CrossRef]
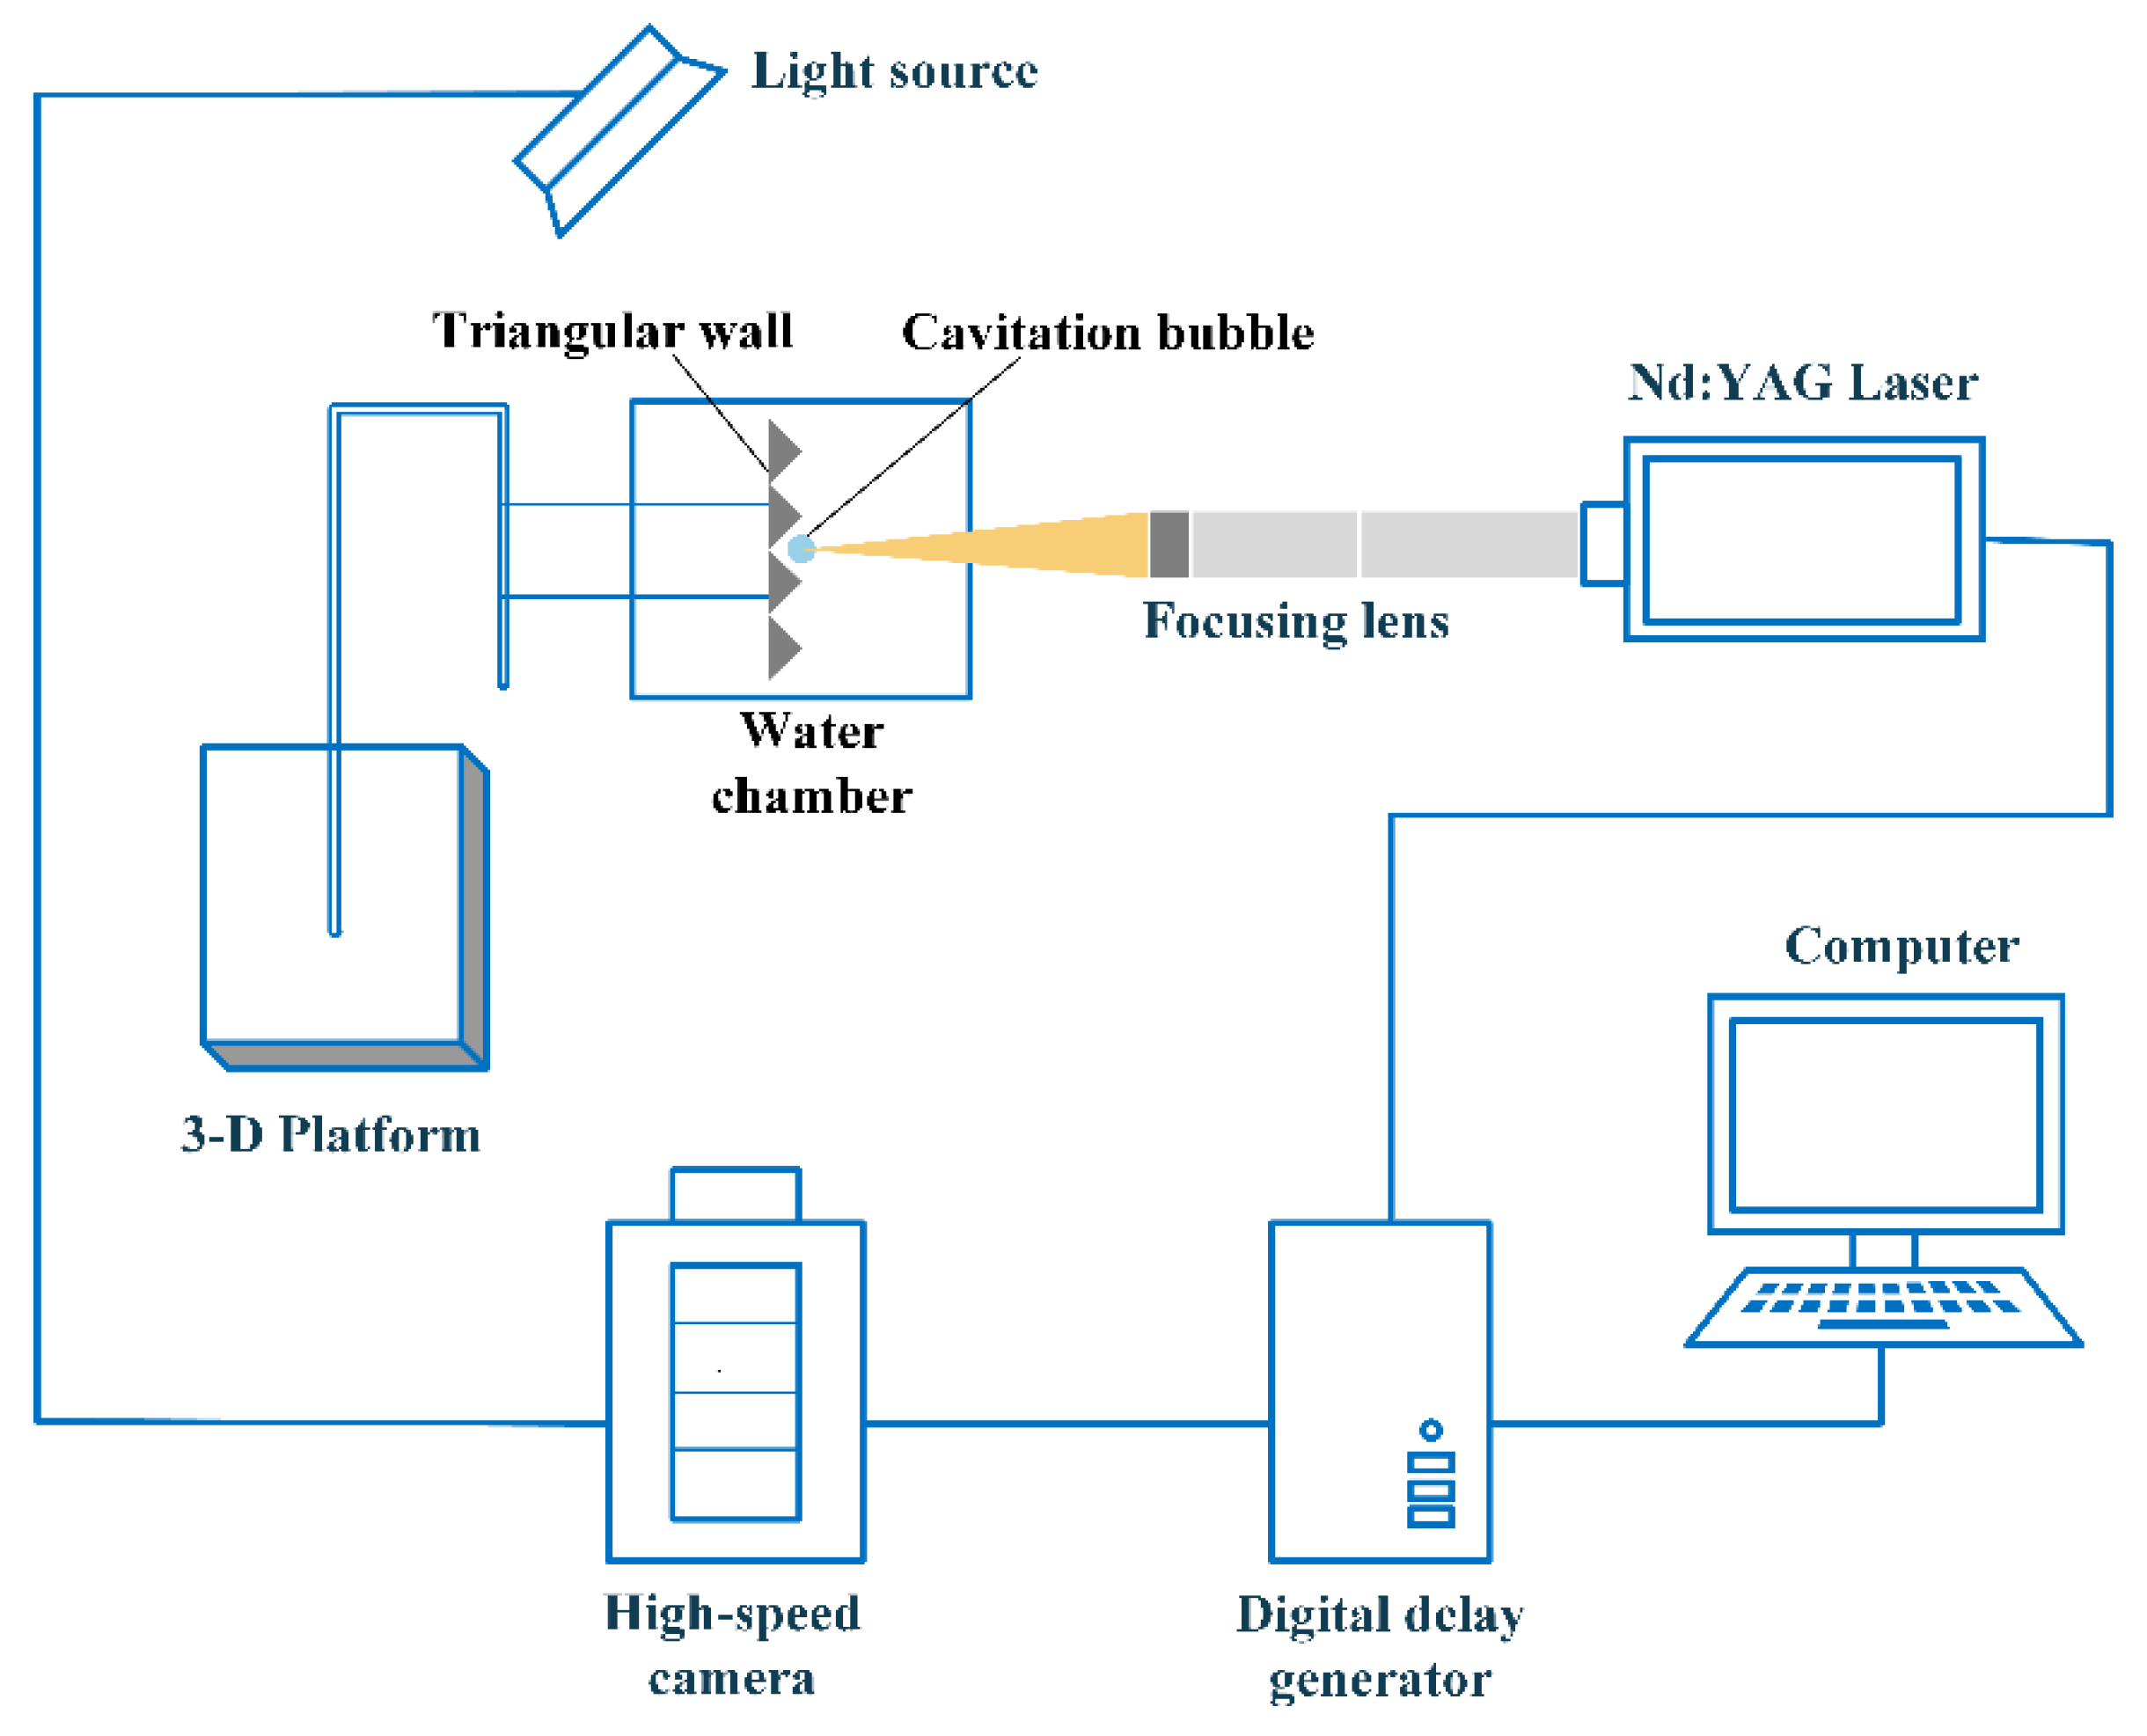
Figure 1. The experimental system of cavitation bubble dynamics near a complex wall with a continuous triangular arrangement.
Symmetry 15 00693 g001
Figure 2. The parameter definitions of cavitation bubble dynamics near a complex wall with a continuous triangular arrangement. L is the initial wall–bubble distance. Rmax is the equivalent maximum radius of the bubble. H is the height of the triangular wall. θ is the angle between triangular walls.
Symmetry 15 00693 g002
Figure 3. Demonstration of typical cavitation bubble dynamics near a complex wall with a continuous triangular arrangement for cases 1–3. (a) refers to L = 1.80 mm, Rmax = 1.53 mm, and γ = 1.18. (b) refers to L = 2.40 mm, Rmax = 1.53 mm, and γ = 1.57. (c) refers to L = 5.00 mm, Rmax = 1.53 mm, and γ = 3.28.
Symmetry 15 00693 g003
Figure 4. The typical movement of the bubble wall and bubble centroid for case 1. L = 1.80 mm. Rmax = 1.53 mm. γ = 1.18.
Symmetry 15 00693 g004
Figure 5. The typical movement of the bubble wall and bubble centroid for case 2. L = 2.40 mm. Rmax = 1.53 mm. γ = 1.57.
Symmetry 15 00693 g005
Figure 6. The typical movement of the bubble wall and bubble centroid for case 3. L = 5.00 mm. Rmax = 1.53 mm. γ = 3.28.
Symmetry 15 00693 g006
Figure 7. The change in the length of the first period of the bubble versus the initial bubble–wall distance with Rmax = 1.15 mm. The black dots in the figure represent the experimental results. The red solid line in the figure represents the fitting curve according to the experimental results. The blue solid line represents the length of the first period of the bubble based on the classical bubble wall motion equation. The point M represents the value of L corresponding to the intersection of the red solid line and the blue solid line.
Symmetry 15 00693 g007
Figure 8. The parameter range corresponding to three cases obtained from sufficient experimental results. The red, green, and blue filled circles represent cases 1–3, respectively. γ1 represents the critical value to distinguish between case 1 and case 2. γ2 represents the critical value to distinguish between case 2 and case 3.
Symmetry 15 00693 g008
Figure 9. The stacked diagram of the leftmost and rightmost movement of the bubble wall during bubble collapse. L = 1.80 mm. Rmax = 1.53 mm. γ = 1.18.
Symmetry 15 00693 g009
Figure 10. The stacked diagram of the leftmost and rightmost movement of the bubble wall during the bubble collapse. L = 3.00 mm. Rmax = 1.53 mm. γ = 1.97.
Symmetry 15 00693 g010
Figure 11. The stacked diagram of the leftmost and rightmost movement of the bubble wall during the bubble collapse. L = 5.00 mm. Rmax = 1.53 mm. γ = 3.28.
Symmetry 15 00693 g011
Figure 12. Moving distance of the leftmost and rightmost ends of the bubble wall with dimensionless time versus different initial wall–bubble distance during the collapse. The solid line represents the leftmost end of the bubble wall, and the dashed line represents the rightmost end of the bubble wall. (ac) refer to L = 1.80 mm, 3.00 mm, and 5.00 mm, respectively. Rmax = 1.53 mm. The corresponding values of γ are 1.18, 1.96, and 3.27, respectively.
Symmetry 15 00693 g012
Figure 13. Moving distance of the leftmost and rightmost ends of the bubble wall with the dimensionless time versus different bubble sizes during the bubble collapse. The solid line represents the leftmost end of the bubble wall, and the dashed line represents the rightmost end of the bubble wall. Figure (ac) refer to Rmax = 0.75 mm, 1.03 mm, and 1.45 mm, respectively. L = 2.30 mm. The corresponding values of γ are 3.07, 2.23, and 1.59, respectively.
Symmetry 15 00693 g013
Figure 14. The change in the movement distance of the bubble centroid with dimensionless time versus different initial wall–bubble distances. The black solid, red dashed, and blue dotted lines refer to L = 1.80 mm, 3.00 mm, and 5.00 mm, respectively. Rmax = 1.53 mm.
Symmetry 15 00693 g014
Figure 15. The change in the movement distance of the bubble centroid with dimensionless time versus different bubble sizes. The black solid line, red dashed line, and blue dotted line refer to Rmax = 0.75 mm, 1.03 mm, and 1.45 mm, respectively. L = 2.30 mm.
Symmetry 15 00693 g015
Disclaimer/Publisher’s Note: The statements, opinions and data contained in all publications are solely those of the individual author(s) and contributor(s) and not of MDPI and/or the editor(s). MDPI and/or the editor(s) disclaim responsibility for any injury to people or property resulting from any ideas, methods, instructions or products referred to in the content.