Abstract
Numerical methods have gained momentum among specific engineering problems that must be solved in such a manner that accuracy and speed are the two most important aspects to consider regarding the output. This paper presents a fast, semi-analytical method (SAM) and original mathematical algorithms to determine the pressure distribution and von Mises stress for spur gears’ meshing teeth. The SAM begins with the Hartnett approach, based on Boussinesq’s equation for the half-space theory of linear elasticity, which implicitly means an infinite width of the gear flank. To simulate more realistic quarter-space conditions, corrections based on virtual mirror pressure are introduced in the computational algorithm. Mathematical surfaces modeling is an important aspect for spur gears as an intermediate stage to determine the pressure distribution and von Mises stress. Shaft misalignment changes the contact problem from symmetric, in which the half- or quarter-space model can be used, to asymmetric. In the latter case, the model must determine the entire contact area. The obtained output is validated by comparisons between our original FEA results and results from the literature using SAMs and FEA.
1. Introduction
Rolling contact fatigue (RCF) represents the final failure mode for gear teeth if the root bending fatigue or static tooth fracture were avoided in the design steps and diverse wear appearance and scuffing were prevented by the choice of an adequate lubricant. A chronological appraisal performed by Sanchez-Marin et al. [1] pointed out the major role of tooth contact analysis (TCA) in the design process of gear drives.
In any real gearing application, the gear width has a finite value, and the normal load has a non-uniform distribution as result of various causes, such as the elastic deformation of shafts or errors due to gear manufacturing or mounting operations. The concentrated contacts achieved during the tooth meshing process is no longer Hertzian, and no direct analytical solution exists. The contact loading induces 3D contact stresses, which have very high depth gradients. Consequently, their values become irrelevant at quite a small depth. This particularity of the state of stresses developed in a concentrated contact loading requires a very fine mesh for its modeling, resulting a higher computing time. The numerical approaches, such as FEMs and semi-analytical methods, have been involved to solve the non-Hertzian contact problems. Recent works published by Najjari and Guilbaut [2] mentioned that, when compared with a SAM, the same accuracy of output data required a computing time 125 times longer when a FEM was used. In [3], the aim of the research was to develop a theoretical calculation method for the surface contact stresses and root-bending stresses of spur gears in cases of misalignment error, assembly error, and tooth modifications. It proposed a mathematical algorithm combined with FEM. Hsu and Su [4] described the mathematical calculations of a modified hob mill that generated crowned profiles for pinion and gear. With crowned profile teeth, the contact changes from a non-Hertzian line contact to point contact and, if the surfaces in mesh are quadratic forms, contact ellipses are established with Hertz relations. Based on instantaneous contact analysis (ICA), Sanchez-Marin et al. [1] obtained a pretty accurate pressure distribution on gear teeth.
A comprehensive tooth contact analysis was presented by Yse and Tsai in [5]. The numerical algorithm of pressure distribution was the same for both spur and helical gears. Several profile modifications of the tooth—end relief, tip relief, and crowned profile teeth—have identified the major role played by tooth profile modifications on the pressure distribution on the tooth flank. In the case of the profile modification of a gear pair, vibrations and noise level remain the same, with the tooth profile modifications having no positive impact on this aspect. Additionally, Mao [6] accomplished a FEM in order to illustrate the effects of tooth profile modifications, misalignment, and material treatments on gear reliability.
In their paper, Qin and Guan [7] used a FEM to investigate the development of contact fatigue. The authors concluded that the dynamic simulation results are closed to the static simulation results, especially when the von Mises stress is considered a critical stress for contact fatigue. Regarding dynamic simulation, a similar result was obtained by Hwang et al. [8]. Today, von Mises stresses are considered critical stresses that are able to cause rolling contact fatigue, also offering reliable explanations for some experimental data such as the sub-surface or surface initiation of RCF, the effect of residual stresses, the role of tangential forces, the influence of roughness and lubrication on the life of gears, the edge effect, and the influence of as misalignment and its attenuation by profile modification [9,10,11]. Roda-Casanova [12] used three different FEM configurations to illustrate the role played by deformations of gears shafts and deformations caused by shaft torsions upon pressure distribution and pressure values.
A numerical model, derived from the concentrated contacts theory of elastic half-space, was developed by Gonzalez-Perez et al. [13]. Its results were in good correlation with FEM. The main objective in [13] was to find the dependence between pressure distribution and stress state upon the misalignment caused by the elastic deformations manifested in two planes. Related to this aspect, Perez et al. [13] presented the interdependence between the misalignment angle and pressure distribution. Roda Casanova et al. [14] presented a comparison between the values of a face load factor calculated using an FEM and the value provided by ISO 6336 [15]. The influences of different parameters such as the shaft length, gear width, relative position of the gear on the shaft, and the ratio between the pitch radius and the shaft radius have been investigated. The correlation relating to the absolute difference between the values of the face load factor (calculated according to ISO 6336 and FEM) and the gear location on shafts was noted.
In order to provide accurate values for the contact stress, Pedrero et al. [16,17] combined the Hertz equation and the non-uniform model of load distribution along the contact line. A parametrized calculation model based on 3D finite elements was presented in Hedlund and Lehtovaara [18]. The starting assumption was that the tooth geometry is not ideal due to the occurrence of errors in the manufacturing process. The gear geometry was presented using equations derived from the rotational and translational matrices, which were determined after the coordinates transfer from the tool coordinate system to the part coordinate system. The normal force distribution between the pairs of teeth in mesh and the influence of the tooth deflections, from both tooth root bending deformations and contact deformations, have been studied. A 3D finite elements model was designed for the calculation of tooth deflection. This model combined both contact and structural analysis and has the potential to point out edge contacts.
A calculation model for bending and contact stresses was developed in Sánchez et al. [19]. The value of the stiffness of the meshing teeth was calculated as a sum of the individual stiffnesses. An interdependence between the stiffness of the tooth pair meshing and a defined-profile factor that emphasizes the importance of contact position was found. Lahtivirta and Lehtovaara [20] used two FEAs for meshing with different precisions. The mesh in [20] was prepared to be very fine in the contact point zone and sparser in the rest. Additionally, a parametric model was developed to analyze the contact pressure and root-bending stresses of the tooth. For conditions of mixed elastic–hydrodynamic lubrication (EHL), D. Zhu et al. [21,22] noticed that the stress concentration due to pressure peaks was similar to the stress concentration of the of dry contact solutions presented in Hu Y. et al. [23]. It was demonstrated that solutions for pressure distribution obtained under EHL conditions gradually approach those of dry contact when the hydrodynamic effect disappears. The unreasonable lubrication in the gearbox can also affect the fatigue life of gears, as provided in [24].
The model used in the present paper was developed under the hypotheses of normal and dry contact loading. Regarding the existing literature, this paper proposes a new computational, semi-analytical method for the contact analysis of standard spur gears. The original contributions of this paper are:
- The proposal of original algorithms to calculate matrices of separations for spur gears in different cases—ideal gearing, profile modifications, and misalignment—as long as the matrix of separations represents a key factor for semi-analytical method approaches;
- The results for contact pressure distribution were obtained considering the finite length effect of gear width;
- The use of von Mises equivalent stress to quantify the harmful influence of the edge effect and misalignment errors was also considered.
Developing numerical models for gear meshing is not new, but models often face the difficulties of a high computational duration, robustness, and accuracy. The present paper proposes an algorithm for the geometrical modeling of the tooth mating surfaces to determine matrices of separation in cases of shaft misalignment with respect to two planes. It is well known that a shaft deforms not only with respect to one plane but with respect to two because the deformation is a spatial one. A fast and practical algorithm was developed in order to simulate a more realistic deformation of the shaft and to calculate contact pressures and von Mises stresses in this case. The simplicity of the proposed algorithm allows for the modeling of the surfaces according to the needs of the user. The present algorithm can simulate the case of double misalignment of the shaft and different profile corrections in order to avoid a sudden increase in the stress risers. The most-used profile modifications are crown profiled teeth and the end relief profile of teeth. The proposed, present work exhibits a much lower computation time and a high degree of accuracy. The semi-analytical models (SAMs) developed in this work performed a fast tooth contact analysis (TCA) with a good degree of adaptability and accuracy for the case studies on concentrated contacts in spur gears. The present work also analyses the contact cases for which Hertz hypotheses are not available (e.g., they are not quadratic surfaces) which has been presented systematically in very limited work.
2. Modeling the Gear Tooth and Modeling the Contact Points (Non-Hertzian Method)
2.1. Developing the Semi-Analytical Model (SAM)
The modeling used in the present study considered the following hypotheses:
- -
- The materials are isotropic and homogenous;
- -
- The linear elasticity rules work up to the yield point, and a perfectly plastic evolution manifests for larger loads;
- -
- The two bodies are considered as half-spaces, resulting in a simpler form for the general equations of elasticity with very few analytical solutions for particular boundary conditions. Hertz’s formulae for non-conformal, concentrated contacts are the most-known example, but different numerical methods have been developed instead;
- -
- The contacting surfaces have no roughness, and no lubricant exists between a dry, frictionless, normal contact;
- -
- No residual stress develops as long as the loading force creates an elastic stress state only.
When a normal load acts on any contact point of a body, the body deforms. The contact can either be a conformal or counter-formal but, in both cases, the shape of the real contact area and the resultant stresses remains unknown. A body is considered half-space when there are no margins that can become stress concentration factors and a certain contact surface is defined. A body is considered quarter-space when margins that cause stress risers do exist, or when the contact surface ends suddenly with a 0-degree contact with the other surfaces that are not contact surfaces. Therefore, to determine the displacement of the half-space boundary, a numerical solution using the flexibility matrix was built.
The influence functions were built with Love’s equations for the Boussinesq integral from the half-space theory [25]. At the common tangent plane, a virtual, rectangular contact area large enough to cover the real contact area is considered (Figure 1). The elastic displacements, (x, y) and (x, y), were measured along the common normal direction. For a certain point situated on the tangent plane, (x, y), the sum of each individual displacement is noted with (x, y). The semi-analytical method uses the initial, no-load separations between surfaces of the conjugate teeth that sustain the meshing process [25]. A virtual rectangular contact area, built on the common tangent plane around the initial contact line and a cartesian system, , are defined. A uniformly spaced, rectangular array is defined on the virtual contact area, with the grid sides parallel to the x and y axes. The nodes of the grid are denoted by , where the and indices refer to the grid columns and grid rows, respectively. The real pressure distribution is approximated with a virtual pressure distribution, characterized by a number, , of values of , which act uniformly inside the corresponding patch, [26,27].
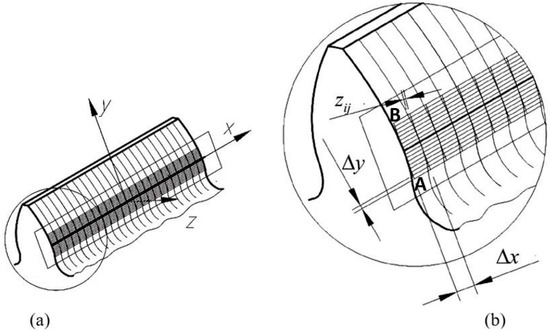
Figure 1.
Numerical mesh of virtual rectangular contact area (a) meshing of gear tooth (b) magnified image of meshed gear tooth. AB = the width of the gear contact virtual area. Δx, Δy = grid step on OX and OY axis, respectively.
The surface deformation is simulated by the following group of linear algebraic equations [28,29,30]:
The geometric equation of the elastic contact is:
where is the gap between the normal surfaces, is the matrix of separations for the unloaded state, is the elastic displacement of the two surfaces, measured along the direction of the straight-line support of the normal load, and is the rigid displacement of the bodies.
The equation of the normal surface displacement is:
where Kij represents the influence coefficient function and illustrates the surface displacement value that was created on the elementary rectangle by the sum of elementary displacements created by a unit pressure located successively in all of the grid cells, and and are specific pressure values for the patch whose position on the array corresponds to (i,j) or (k,l), respectively.
The load balance equation is:
where is the normal force applied on the two bodies in contact.
The constraint equation of non-penetration is:
The constraint equation of non-adhesion is:
The elastic-plastic behavior of the material, the elastic-perfect evolution, was chosen due to its simplicity:
For contact cases, Boussinesq equation from the half-space theory of linear elasticity has the simpler form [29]:
with the solution obtained by Love [29]:
where:
—are the Poisson coefficients of body I and II, respectively; 0.3 for steel;
—Young’s moduli corresponding to body I and II, respectively; 2.1 × 10⁵ MPa for a steel body;
—the length and width of a patch, respectively;
—the half-dimensions of the virtual rectangle;
—the coordinates of the middle points of the kth patch;
and η and ξ are the axes of a so-called source reference system —this coordinate system is useful when half-space contact problems are solved (these two axes can coincide with the X and Y axes) [30].
In (4) and (5), represents the real contact area, and in (6) is the value of the pressure that enables the initiation of the plastic yield.
It is obvious that all machine elements whose functionality is based on a 5-degree kinematic coupling are quarter-spaces. This is also true in the case of two meshing teeth, because a margin is involved as long as the width of the teeth is limited. The solution to these problems necessitates an extension to the Hertz theory. Due to the complexity of the boundary conditions, quarter-spaces are converted into half-spaces with established eigenstrains that are analyzed using the solution of half-space inclusion. Quarter-space problems are particular cases of general wedge problems. Contact problems for general wedges can be solved by considering the contact bodies to be half-spaces.
2.2. Validation of the New Model
Due to its high accuracy and convergence speed, the conjugate gradients method [30,31,32,33] was chosen to solve the system of algebraic linear Equations (1)–(3). The fast Fourier transform (FFT) algorithm was used to reduce the computation time needed to calculate the convolution products. Thus,
where is the elastic displacement of the two surfaces, measured along the direction of the straight-line support of the normal load and is the rigid displacement of the bodies; the symbol represents the convolution product between and ; and are the complex matrices obtained as discrete Fourier transforms of the matrices and , respectively; , where is the displacement matrix in the frequency domain and is an element-to-element product; and, where IFFT means inverse fast Fourier transform and is the displacement matrix in the spatial domain.
Two types of comparisons have been accomplished to validate the accuracy of a semi-analytical method (SAM) for pressure distribution. For Hertzian point contacts, the pressure distribution obtained numerically with a SAM proved to be identical to the distribution stipulated by Hertz relations (Figure 2). For non-Hertzian contacts, the comparisons have been made using results made available by FEM analyses. For the contact between a crowned cylindrical roller and a cylindrical raceway, Figure 3 exemplifies the very good fit of the SAM results with those of the FEM analysis carried out by de Mul et al. [34].
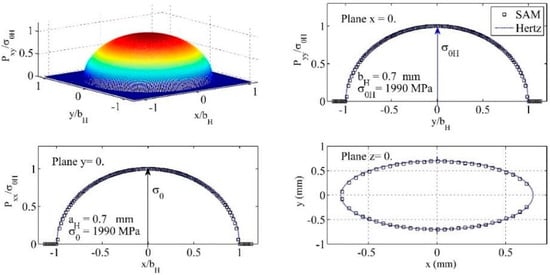
Figure 2.
The pressure distributions resulted at normal loading of two identical smooth steel spheres: SAM results versus Hertz results .

Figure 3.
The non-Hertz algorithm vs. FEM results reported in [34].
A perfect correlation can be observed between the two approaches: the Hertz analytical results and the semi-analytical results (Figure 2).
The contact between a crowned roller bearing and its raceway, analyzed using a FEM by de Mull et al. [34], has been chosen to exemplify the second method used for the validation of a non-Hertz solver (Figure 3). A good correlation exists between the subroutine that solves the equation group given in (1)–(6) and the FEM results from [34] (Figure 3).
The computational algorithm that solves the non-Hertz equations is available in any case of concentrated contact. What differs between one case or another is the geometry of the bodies that are in contact. As long as the pressure distribution subroutine has been validated as 100% accurate, the focus can be set on different cases of standard spur gears. As previously mentioned, the matrix of separations is determined after the mathematical modeling of the surfaces in contact.
2.3. Matrix of Separations for Various Conditions
2.3.1. Matrix of Separations for Ideal Gearing Conditions
In general, the geometrical modeling process consists of using an involute profile (Figure 4). By fixing a certain contact point on the transversal profile of a pinion tooth, the position of the contact point corresponding to the gear profile can be determined by considering a perfect and smooth contact between the profiles. The present paper analyzes concentrated contact cases for gears that are not corrected . No misalignment conditions, manufacturing errors, or profile modifications were considered while developing the models. The separation matrix determination algorithm in this case is based on the following considerations.
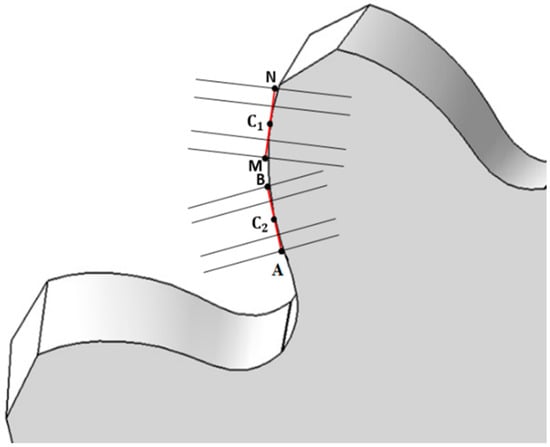
Figure 4.
Illustrative sketch regarding the matrix of separations formation—basic principle.
The parametric equations of the involute curve are:
where is the radius of base circle and is the curve parameter.
In Figure 4, the next notations were adopted:
AB = the width of the gear contact virtual area.
MN = the width of the pinion contact virtual area.
A contact point, , with a radius, (computed as initial data), and a corresponding pressure angle, , were considered on the involute curve. In order to determine the position of the associated contact point of the gear, the corresponding pressure angle of point was determined using the following relations:
With known, the position of can be determined as:
Here, and are the radii of the base circles of the pinion and gear, respectively, and is the pressure angle at the gear centrode.
The curve parameter, of the established position can be determined by summing the two squared expressions presented in Equation (9):
Here, is the curve parameter corresponding to the contact point on the mating gear. Analogous:
where is the curve parameter associated to the contact point position on the pinion.
The tangent straight lines that pass through the two tangent segments on and have the following equations:
The and expressions are:
In these equations, is the variable of the linear function, and and () are their afferent values at points and . Additionally, and () are the first derivatives at points () with respect to θ.
The coordinates of and can be determined using the following relations:
The coordinates of and can be determined using the following relations:
In the above relations, is the half-width of the virtual rectangle that approximates the real contact area.
The normal line at point will have the following equation:
where is the variable of the normal straight line defined as a linear function—.
To find the contact point between the normal and the involute curve, a contact function is defined by substituting and with the parametric equations of and presented in Equation (9). The contact function is noted with Φ.
The distance between and , Figure 5a, represents the separation between and the new point determined on the involute curve (called D, for exemplification):
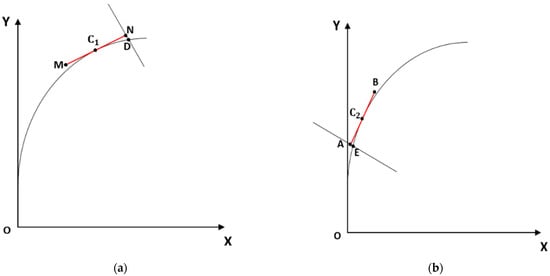
Figure 5.
Schematic representation of procedure formation of matrix of separations (a) tooth flank (b) gear flank (the notations with letters were specified before Figure 4).
The steps (i)–(ix) are repeated for all discretization points situated on both tangent segments that correspond to pinion and gear contact points (Figure 5). The positions of each point vary depending on the position of the current chosen discretization point. An elementary side width between two neighbor points is:
The same procedure can be used to calculate the separation between the tangent segment at the homologous point of , which is (Figure 5b). As long as is the homologous point with respect to , the homologous separation of is the distance between and E—.
The procedure is also extended for each discretization point situated on the tangent segment of the gear profile. The matrix of separations was obtained by summing each distance from each discretization point to each determined point situated on the involute curve for each pinion and gear case. The described algorithm is applied until all separations are calculated. The separations are the same for all tooth widths, even though only the transversal profile is used for the tooth in the presented calculation procedure. This happens because the tooth flank surface is a ruled surface, with straight lines that are parallel to the gear axis (Figure 1). Figure 1 exhibits that all straight lines forming the tooth flank surface are parallel to the axis. In order to calculate the separation matrix, two tangent planes are drawn through and .
2.3.2. The Configuration of Matrix of Separations in Case of Shaft Misalignment Conditions
In practice, the meshing process between two mating tooth surfaces cannot be accomplished under ideal conditions. During meshing, a number of aspects exist that affect the functionality of the gear. Due to the normal load—and other loads that appear in the process—the gear shafts suffer deformations. In addition to this, if manufacturing and mounting errors are considered, it is obvious that the meshing process is affected and the contact does not take place along a line anymore but at a point. This leads to a sudden increase in contact pressure and the occurrence of stress risers at the tooth edges of the gear.
In case of shaft misalignment situations, the following hypotheses were considered:
- -
- The shaft is a rigid body, so the inner deformations will not be considered: only the surface point displacements are considered (Casanova [12]);
- -
- The bending stresses on the tooth are neglected;
- -
- The shaft torsion is not considered;
- -
- Other deformations regarding the whole assembly will not be considered;
- -
- The only shaft that will be deformed (as a rigid body) is the pinion shaft; the gear shaft remain unaffected by deformation.
Two types of misalignment, one with respect to one plane and a second with respect to two planes, are considered in this work.
The Configuration of Matrix of Separations in Case of Shaft Misalignment with Respect to One Plane
In this case, the shaft deformation is in accordance with the model depicted in Figure 6. The flank surface of the pinion is not in a line contact with the mating surface but in a point contact. In an abstract mode, this surface can be considered the ruled surface defined by the involute curve, ruled along the gear axis and tilted with respect to the mating surface. The orientation is kept the same as in previous case, in which ideal conditions were considered.
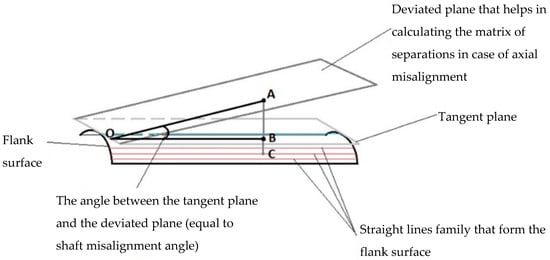
Figure 6.
Schematic representation of the tangent plane and deviated plane for modeling of misalignment conditions (A,B,C are the contact points).
The deformations, in this case, will be measured with respect to the deviated plane. Instead of calculating the separation matrix between each point on the pinion flank surface and the tangent plane, the segment lengths between each point situated on the tooth flank surface and a new deviated plane were calculated, keeping the direction of the normal vector of the initial normal plane. This approach to calculating the matrix of separations best simulates this axial misalignment case, in which separations increase as long as the point positions become further from the contact point (point A, according to Figure 6). Therefore, for the first case, it is enough to change the spatial orientation of the tangent plane in the algorithm. The tangent plane on the tooth flank surface contains a straight line belonging to the flank surface. In this case, the calculation procedure for matrix of separations admits the following considerations:
- -
- A new plane is drawn through the intersection in a straight line between the tangent plane and the plane Z = 0, so that the angle between these two planes is exactly the misalignment shaft angle;
- -
- Each tangent plane contains the involute profile tangent segments presented in Section 2.3.1;
- -
- Each separation, calculated a priori, is then summed up with the segment lengths between the tangent plane and the new deviated one.
When the misalignment angle is known, the segment, is determined as:
The value of can be found at every step because, when the flank surface is meshed, the coordinates of any point are determined by establishing each point on the axis that is parallel to the straight lines that form the tooth flank:
For each step, represents the value of separations for ideal gearing conditions, and can be calculated as:
Therefore, the separations consist of the sum between each and segment lengths ( being the representative separation whose determination was presented in Section 2.3.1).
The Configuration of Matrix of Separations in Case of Shaft Misalignment with Respect to Two Planes
For the second case, the deformation of the shaft will be measured with respect to the axial plane but also to another plane that is perpendicular to the axial plane (Figure 7). Each type of misalignment illustrated in Figure 7 is analyzed in the current paper. In general, most cases are a combination between the first and the second type of shaft misalignment (Figure 7a,b). This case is also treated in the current paper. In Figure 7c, there is a type of non-coincident edge contact. Stress risers occur when the edges of bodies that are in contact are half-spaces and their edges are not coincident. In the case of edge coincidence, the stress risers are significantly lowered or even eliminated. This fact was proven in [2], and this correction procedure was also applied in the current paper for coincident edges (Guilbault correction procedure for coincident edges—Section 3).
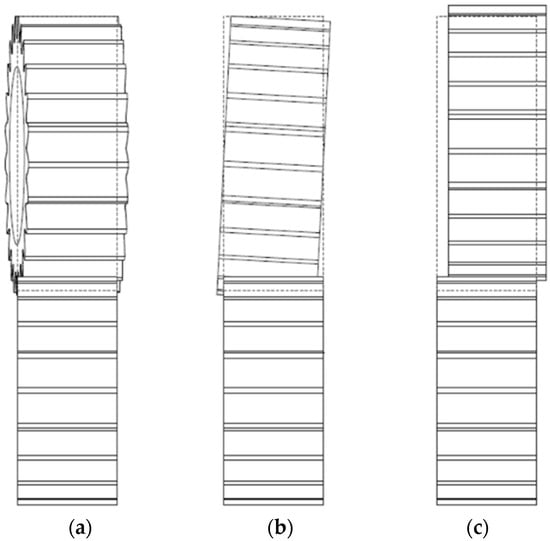
Figure 7.
Different misalignment situations [12]: (a) skewed gear, (b) tilted gear, and (c) displaced gear.
Therefore, after shaft misalignment, the tooth flank surfaces will have similar positions as in Figure 8.
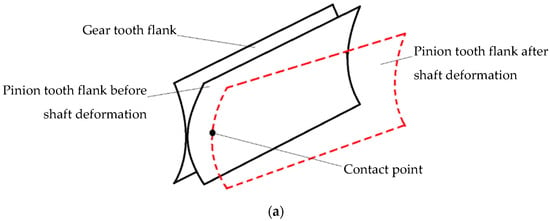
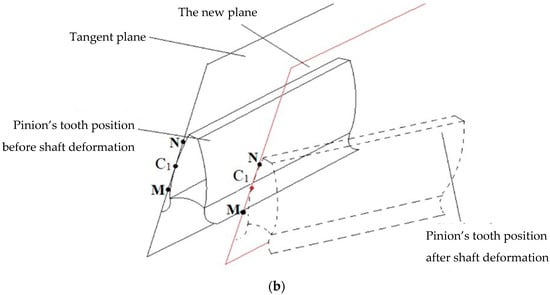
Figure 8.
Schematic representation of tooth flanks (a) and tooth positions (b) before and after shaft misalignment (the notations with letters were specified before Figure 4).
When deformation takes place with respect to the XOZ plane, the Y-coordinate remains constant; the X-coordinate remains constant when the deformation takes place with respect to YOZ plane.
In Figure 9, is the contact line before shaft deformation and is the new position of after the shaft deformation. In this case, the contact is attained at one single point: . Let M be a point on the pinion flank surface that is displaced because of the shaft deformation. Point P represents the shaft bearing and remains fixed. When the flank surface is meshed in a certain number of points, the calculation procedure for the separation matrix is repeated for each point. For simplification reasons, the problem will be reduced from a spatial matter to a plane matter (Figure 10). Here, represents the distance between the bearing and the force appliance point on the tooth flank.
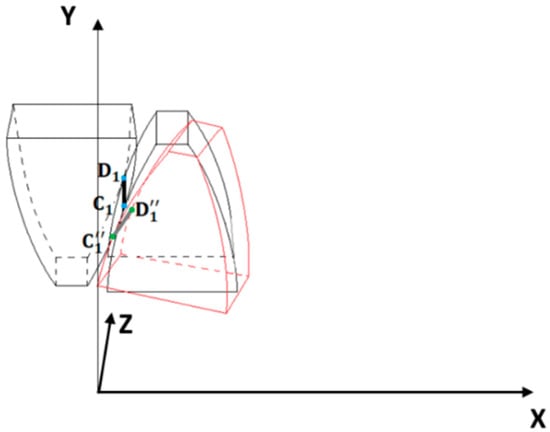
Figure 9.
Meshing teeth position before (with black) and after shaft deformation (with red).
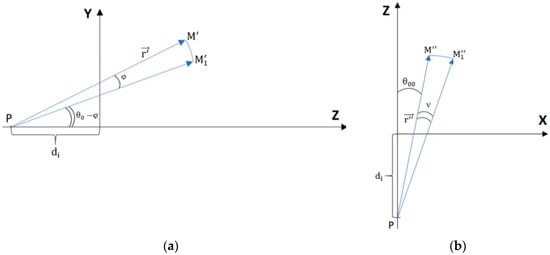
Figure 10.
Point displacement in case of a shaft misalignment with respect to two planes: (a) YoZ plane and (b) XoZ.
If misalignment is present with a known value, the algorithm to calculate the matrix of separation follows the following steps. The new coordinates after the point are rotated with respect to YOZ plane.
The coordinates after rotation are:
Find the new coordinates after the point is rotated with respect to XOZ plane.
The coordinates after rotation are:
Identifying the necessary plane for the matrix of separation calculation.
Two mating surfaces intersect each other along a contact line. Either the pinion flank or gear flank are ruled surfaces, so the tangent plane between these two surfaces contains the line intersection between these two surfaces. When shaft deformation happens, the flank surface changes its position and contact point. Thus, a new plane must be drawn, parallel to the tangent plane. Let and be the planes presented in Figure 8b. As long as these two planes have parallel directions, the only term that differs between their equations is the free term. The Z-coordinate may be found after the displacement with respect to the planes for each discretization point on the tooth flank surface.
As long as the new coordinates have been achieved, through each new Z-coordinate, a straight line representing the normal on the tangent plane is drawn. Its equation is:
where and are the coefficients of the tangent plane.
This straight line intersects the tangent plane and the conjugate surface of the gear tooth flank. As long as a deformation is achieved there, the homologous points situated on the gear tooth flank must be found. In Figure 11, is a certain point on the pinion tooth flank, taken as the discretization point before shaft deformation. Without misalignment, its homologous point on the gear involute profile is . After misalignment, according to Equations (33) and (35), point changes its coordinates, and a new position in space is obtained. From this point, the normal line on the plane is defined. The position marked with is the intersection between the normal and the pinion flank surface if misalignment did not happen. This straight line also intersects the gear tooth flank at . Therefore, is the homologous point on the gear tooth flank to . As long as is found, the same procedure of separation calculation, previously mentioned in Section 2.3.1., can be applied. The presented algorithm also applies to . The procedure exposed in Section 2.3.1. is available for two parametric equations of the same involute profile, defined in the plane . Although the coordinate of was obtained using Equation (35), the points and will have the same coordinate along the axis. Therefore, the procedure presented in Section 2.3.1. can be applied for every plane that is parallel to the plane and which passes through any point whose Z-coordinate is known. In this case, the algorithm is available for each point of the mesh.
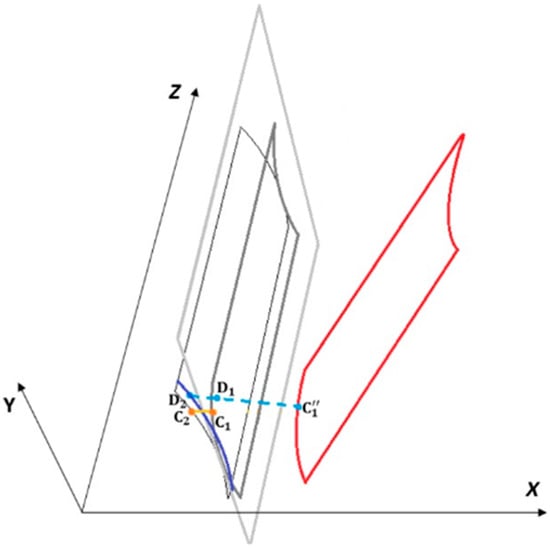
Figure 11.
Graphical illustration of the determination of homologous points on the gear tooth flank.
3. Hertzian Distribution of Contact Pressure. Contact Pressure Determination Using FEA. (Guilbault Correction Factor)
3.1. Pressure Distribution as an Infinite, Long Half-Cylinder
The Hertz analytical approach for the line contact subjected to normal loading provides the pressure distribution as a half-cylinder with infinite length and a constant elliptic shape of any transversal section without edge effect (Figure 12). However, for the non-Hertzian line contacts subjected to normal loading, the pressure distributions are closed to those obtained by using the Hertz approach for ideal Hertzian line contacts except for the edge zones. Due to the edge effect, the middle values of pressure in the case of non-Hertz contact are lower than in the case of a Hertz contact type. Therefore, in the case of a non-Hertzian linear contact, the analytical result displayed by the Hertz methodology can be a first validation of the developed SAM. When misalignment situations occur, the Hertz approach can no longer be used as comparison.
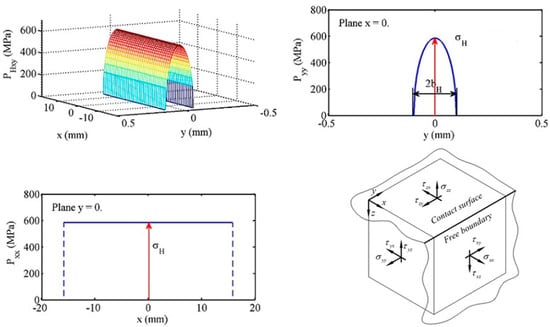
Figure 12.
The non-realistic stress plane state at free boundaries of a finite length contact.
3.2. The Pressure Distribution Using a Finite Element Method
The robustness and accuracy of the data obtained using the SAM algorithm were confirmed through comparison with data provided under similar conditions by:
- -
- The authors’ FEA results;
- -
- Other authors’ TCA and FEA results;
- -
- Other authors’ results from using a different SAM approach.
The FEM analysis for the validation of this SAM was performed in the Static Structural module of the ANSYS Workbench. The material used was linear structural steel, and the mesh consisted of 67.000 nodes and 15.000 hexahedral elements of the second order. For these FEAs, an ANSYS calculation used a preconditioned conjugate gradient solver with sub-steps varying from 10 to 100 per time step.
3.3. Guilbault Correction Factor
The Hertz approach of linear concentrated contact was developed from basic half-space equations and, consequently in this approach, at each free side of the tooth flank there is a plane stress state which is not a real situation (Figure 12).
In order to eliminate the occurrence of the two shear stresses and the single normal stress at the edge zones, a two-step correction procedure was proposed by Hetényi [35,36], applied by de Mul [34], and methodically searched by Najjari and Guiblault [2]:
- -
- A fictive mirror pressure distribution was used to eliminate the shear stresses (Figure 13);
 Figure 13. The objectives pressure distribution and Guilbault virtual pressure distribution.
 - -
- Iterative half-space solutions were used until all quarter-space boundary conditions were accomplished.
To increase the speed of the algorithm and to diminish the normal stresses at free boundaries, Guilbault [37] proposed the multiplication of fictive pressure with virtual distributions by a factor, (Figure 13):
As presented by Guilbault [37], for two edges that are coincident, the edge effect is significantly lowered or completely eliminated in some cases.
For contact cases where the edge effect appears, the results using this correction procedure will also be presented.
4. The Importance of Contact Pressure Determination (Von Mises Equivalent Stress)
All real, concentrated contact cases consist of rough surfaces with a finite contact length (if the contact takes place along a line, as in the case of gears) and the radii of at least one body that is in contact is not constant but varies in the range, following a specific mathematical law. In this paper, even though practical concentrated contact is analyzed, the hypothesis of smooth contact surfaces is maintained, with lubrication and roughness being neglected. If at least one body has a finite length, the pressure values are higher at the end zones. This process is known as the edge effect. Many machine elements, such as roller bearings and raceways, perform gear (flanks contact) work and transmit load based on a linear, non-Hertz contact type, and the edge effect manifests in these cases.
The contact loading determines a spatial distribution of stresses with high depth gradients [29]. The von Mises stresses have a sudden variation, and the maximum depth value of propagation of these stresses varies in the range between 50 and 100 μm. In-depth stresses are the main cause of gear fatigue and the occurrence of pitting. The occurrence of stress on a contact surface leads to the occurrence of micro-cracks. If the friction between two flanks is considered, the tangential stresses lead to the peeling occurrence, which represents a systematic elimination of surface material, thus affecting the gear reliability.
It is very important to consider elementary volume stresses when studying the reliability of a part. Ioannides and Harris [38] developed a model for estimating the bearing contact fatigue. For any elementary volume under the stress incidence, the reliability, S, is calculated as a function of N, the number of cycles, as follows:
where σeq is the equivalent stress value of the elementary volume; σu is the stress fatigue limit; c is the stress exponent; z′ is the mean value of the stress; h is the depth exponent; e is the Weibull slope; and V is the volume under the stress incidence. The values of σu, e, c, and h are experimentally determined, according to [38]. Popinceanu, Diaconescu, and Cretu [9] made a comparative analysis of different components of the stress tensor. The analysis concluded that the equivalent von Mises stress can assure the best correlation with respect to different theoretical and experimental research findings. The maximum value of the von Mises stress was obtained under the contact domain, with this stress having a high influence on the contact surface. The maximum operational value of the von Mises stress can occur under or on the contact surface, depending on the working conditions (lubrication, surface roughness, etc.). Von Mises stresses are used in durability and pitting calculations.
Under real working conditions, the gearing process is influenced by different factors. One of these factors is elastic deformation. Elastic deformation involves error transmission and perturbations of pressure distributions along the tooth flank, especially on the edge zones. Pressure concentrations rush the contact fatigue and wear occurrence. Alternative fatigue criteria consider the maximum shear stress, , or the maximum von Mises stress, (Figure 14b), are critical stresses responsible for the initiation of RCF. Equation (40) of the von Mises equivalent stress reflects the contribution of each component of the stress tensor.
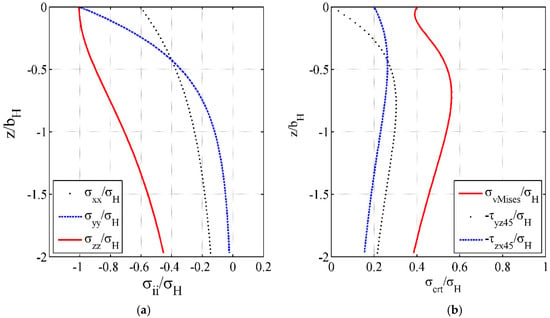
Figure 14.
Stress evolutions along centerline of contact area: (a) normal stresses and (b) critical stresses for RCF.
5. Numerical Results
The computation program is based on the mathematical principles exposed in the previous paragraphs. The numerical results are presented in the following particular cases.
Case 1.

Contact pressure distribution determined using the SAM and FEA in an ideal gearing case. Von Mises stresses were determined with original FEA results. The SAM validation was performed with the original FEA. Table 1 exhibits the initial data used for analysing the first gear pair.

Table 1.
The initial data for the first gear pair to be analyzed.
The data provided by the current SAM algorithm are presented in Figure 15 as the 3D spatial distribution of the pressure; two views of this distribution (longitudinal and transversal pressure distribution in the center of the contact domain) and the contact area.
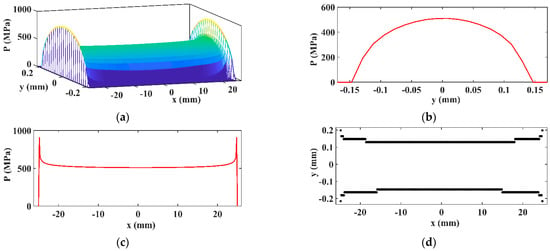
Figure 15.
3D (a), transversal (b), longitudinal pressure distribution (c), and contact area (d).
The value of the pressure provided by the SAM algorithm in the middle of the contact area is MPa. The maximum pressure values at the edge zones are MPa. These extreme values depend on the resolution of the mesh. Unlike extreme pressure, the middle pressure values maintain approximately the same value as the number of patches have a negligible impact on the middle pressure values.
A FEM analysis was developed, and the final results are presented in Figure 16. The middle value is MPa for the current FEM simulation. The difference between SAM and FEM is approximately , which can be appreciated as a very good fit. Additionally, the inner stresses for this case were determined using a FEA. The maximum value of the von Mises stresses is around 570 MPa. In the following cases, the von Mises stresses will be determined using the SAM algorithm. The original FEA results were developed in order to better validate the accuracy of the virtual solver.
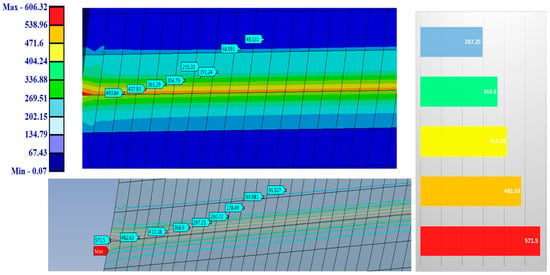
Figure 16.
FEA simulation results for the same case.
The same simulation case of the SAM was performed with the Guilbault correction procedure.
When the Guilbault procedure is applied (Figure 17), it can be observed that the extreme values of the pressure decreased from MPa to MPa due to the correction factor, . This reduction in the extreme values leads to an increase in the median pressure of up to MPa. This is due to the necessity of satisfying the equilibrium equations of the non-Hertzian method.
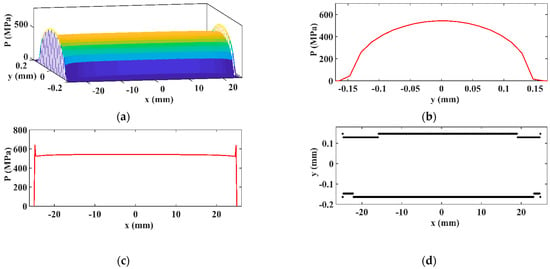
Figure 17.
3D (a), transversal (b), longitudinal pressure distribution (c), and contact area (d) in the case of Guilbault procedure appliance.
Case 2.
Contact pressure distribution determined using the SAM in an ideal gearing situation. Von Mises stresses determined using the SAM. The validation used neutral results found in open technical literature.
The SAM results are presented in Figure 18 in the same manner as the previous case.
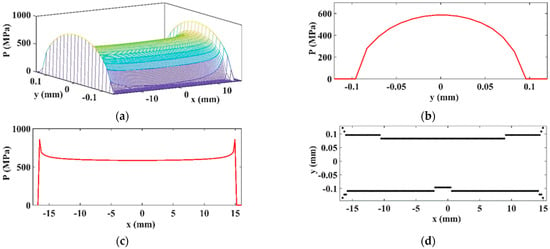
Figure 18.
3D (a), transversal (b), longitudinal pressure distribution (c), and contact area (d) using the SAM.
These results were validated by comparing them with the results provided by the computational algorithm presented in [39]. It can be observed that the difference between the two approaches is insignificant, comprising only several MPa at the edge zones. Figure 19 exhibits the results when Guilbault procedure was applied.
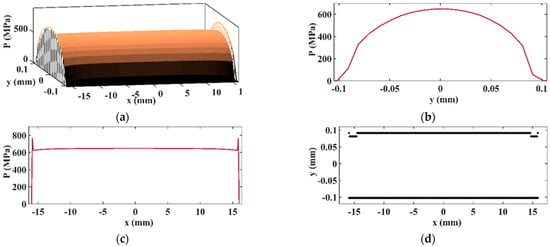
Figure 19.
3D (a), transversal (b), longitudinal pressure distribution (c), and contact area (d) using the SAM and taking into account the Guilbault procedure.
The von Mises stresses provided by the current computational algorithm are presented in Figure 20.
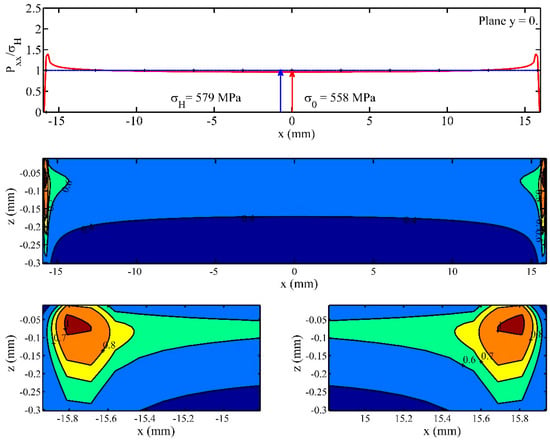
Figure 20.
The longitudinal pressure distribution and the effect of end stress riser on distributions of contact pressure and von Mises equivalent stress.
Both the SAM algorithm and the SAM with the Guilbault correction algorithm use the same procedure to obtain the boundary of the contact zone. The boundary of the contact area is attained in points M(i, j) for which pressure has the evolution:
p(i,j − 1) > 0; p(i,j) = 0; p(i,j + 1) = 0;
The results from Figure 18d and Figure 19d indicate the presence of peaks in the pressure distribution at both ends of the SAM analysis. Practically no such peaks exist when the SAM algorithm included the Guilbault correction.
It has already been mentioned that the von Mises equivalent stress is considered to be a critical stress for starting and developing RCF. Under working conditions, the gearing process runs in the presence of inherent elastic deformations that involve transmission errors with perturbations of pressure distribution along the tooth flank. Pressure concentrations precipitate the contact fatigue and wear occurrence, leading to much shorter gear lives. The developed SAM allows for the study of different influences on distributions of von Mises stress. This set of results was used to exemplify how the von Mises stress distribution is changed by the stress risers (Figure 20). As long as the accuracy of the contact pressure distribution has been validated, the von Misses distribution is also considered validated. A stress increase is observed at each edge zone. For a better observation at point b, a detail section is provided on a tooth width portion equal to 1 mm. At a depth of approximately −0.075 mm, the von Mises stresses reach a maximum value, with the ratio between the von Mises stress and the Hertz value being equal to 1. Thus, a value of 579 MPa is observed for the von Mises stress.
Case 3.
The determination of the Von Mises stress in the case of shaft misalignment with respect to one plane.
The initial data are the same as in Case 2.
In order to highlight the harmful effect of shaft misalignment, a set of results were provided by the computation algorithm using the same initial data presented in Table 2. A misalignment angle measuring min (0.005 degrees) was further introduced in this part. In addition, a chamfer of mm was defined for the tooth profiles in order to avoid material damage and lower the high stresses that would have appeared without this small correction (Figure 21).

Table 2.
The initial data for the second gear pair to be analyzed.
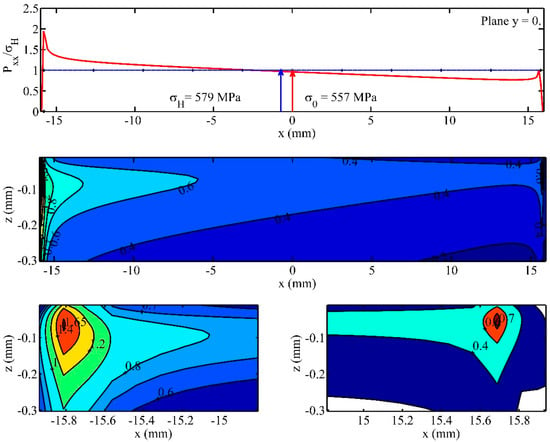
Figure 21.
The effects of stress riser and a misalignment of min on distributions of contact pressure and von Mises equivalent stress.
For simplicity, due to the fact that the initial data are the same, only the transversal contact pressure distribution is presented with von Mises stresses. In the case of a misalignment occurrence, the Guilbault procedure cannot be considered because it operates only in cases of coincident edges. When misalignment occurs, the edges of the teeth are not coincident.
A significant Increase can be observed on the left side of the teeth of the contact pressure values. The maximum value of the contact pressure is approximately 1150 Mpa. Additionally, the von Misses stresses have much higher values on the left side. For every elementary volume of material appreciably stressed, Equation (38) connects the parameters referring to material (σu), load (σeq, z, h), volume of material (V), and the level of reliability corresponding to a certain number of loading cycles. Even if the balance equation is satisfied, the strong, non-linear character of Equation (38) establishes the requirement to identify the influence of each factor. At a depth of approximately −0.05 mm on the left side, the von Mises stresses reach a maximum value, with the ratio between the von Mises stress and the Hertz stress equal to 1.65. Thus, a value of 955.32 Mpa is observed for the von Mises stress on the left side. On the right side, obviously, the edge pressure value decreases, with the ratio between the von Mises stress and the Hertz value being equal to 0.7. Thus, a value of 405.3 Mpa is observed for the von Mises stress on the right side.
Case 4.
Contact pressure determination in the case of shaft misalignment with respect to two planes.
The initial data are presented in Table 3.

Table 3.
The initial data for the fourth gear pair to be analyzed.
A coarser mesh was chosen for this case in order to be closer to the mesh type presented in Casanova [12], in which the authors used 80 elements for the SAM mesh. In addition to a SAM, a FEA was run in [12] in order to make a comparison between the results. Figure 22 shows the results obtained with the current computation algorithm, and Figure 23 is a variation chart with the comparison between the results provided by the current presented algorithm, the SAM-based algorithm presented in [12] and the FEA-run results presented in [14].

Figure 22.
3D contact pressure distribution obtained by SAM (our results) (a) and longitudinal profile of pressure distribution (b).
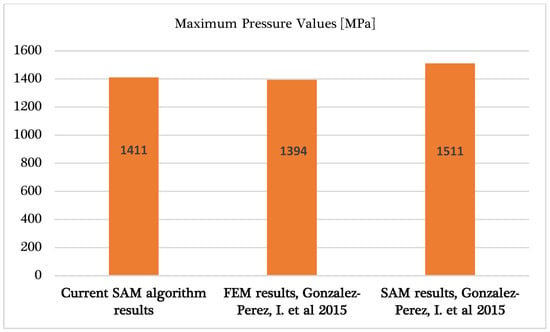
Figure 23.
Comparison between the current SAM algorithm results, the SAM results from [12], and the FEA results from [12].
Due to the small number of discretization points, only the 3D pressure distribution and longitudinal pressure distribution are presented. The maximum values of contact pressure are as follows: Mpa according to the current SAM results, Mpa according to the FEA from [12], and Mpa according to the SAM from [12] (Figure 23).
The increase in edge pressure value decreases the functionality of the gear, affecting the reliability of the part. The difference between the results provided by the current SAM and the SAM from Casanova [12] is , while the results provided by the current SAM and the FEA results from [12] are close, with a difference below 1. For the current computation algorithm, mesh elements were used for the virtual rectangle discretization, and of them were found with pressure values higher than . This means that the number of mesh elements is almost equal to the number of mesh elements from [12], even though the discretization method used there was different. Thus, the present algorithm is validated.
6. Conclusions
The aim of the present work was to develop numerical methods to obtain the von Mises stresses and pressure distributions on the surfaces of a pair of mating spur gears. Thus, a SAM was developed based on the Boussinesq equation of half-space theory, following the Hartnett approach for numerical formulation. Furthermore, the necessary corrections for linear concentrated contacts with a finite length, as proposed by Najjari and Guilbault [2], were considered in the numerical algorithm.
Matrices of separation between conjugate teeth of spur gears running in ideal conditions and under realistic conditions of misalignment were considered. The determination of matrices followed a specific and original algorithm, based on the tooth transversal profile and gear geometry. The large system of algebraic equations was solved using the conjugate gradients method (CGM), which proved to be precise, robust, and very fast when compared to the finite element approaches.
The validation of the developed SAM was performed by comparing its results with those from the literature and with our original FEA results. When the shaft misaligns, the contact problem changes from being symmetric, in which the half-space or quarter-space model can be applied, to being asymmetric. It is necessary for the model to determine the entire contact area in the latter case. The state of elastic stresses in the significantly stressed volume of material was obtained using the superposition principle (influence coefficients functions). On this basis, the depth distribution of the von Mises equivalent stress was used to quantify, comparatively to Hertzian loading, the harmful influences of the end concentrations and the misalignment of the teeth. According to Guilbault [37], a contact analysis performed with semi-analytical methods is 125 times faster than when it is performed with a finite element analysis. For this reason, semi-analytical methods are preferred when a tooth contact analysis needs to be accomplished. In addition, comparing with the sources presented, the present algorithm provides in-depth stresses, which are the main factor in contact fatigue occurrence. There are more algorithms available in the public literature, but this algorithm is easily implemented.
The proposed SAM exhibited results with as high an accuracy as that of a redefined FE work; however, it brings some significant advantages when compared to FE models: a much lower computation time, robustness, accuracy, and a good degree of adaptability. These advantages recommend the SAM to perform fast TCA for case studies regarding the concentrated contacts developed in the spur power gearing.
Author Contributions
Conceptualization, S.C. (Spiridon Crețu) and S.C. (Stelian Cazan); methodology, S.C. (Spiridon Crețu) and S.C. (Stelian Cazan); software, S.C. (Stelian Cazan) and S.C. (Spiridon Crețu); validation, S.C. (Spiridon Crețu) and S.C. (Stelian Cazan), S.B., and V.P.; formal analysis, V.P. and S.B.; investigation, S.C. (Stelian Cazan) and S.C. (Spiridon Crețu); resources, S.C. (Stelian Cazan) and S.C. (Spiridon Crețu); data curation, S.C. (Stelian Cazan) and S.C. (Spiridon Crețu), S.B., and V.P.; writing—original draft preparation, S.C. (Stelian Cazan) and S.C. (Spiridon Crețu), S.B., and V.P.; writing—review and editing, S.C. (Stelian Cazan), S.C. (Spiridon Crețu), S.B., and V.P.; visualization, V.P., S.B., S.C. (Stelian Cazan), and S.C. (Spiridon Crețu); supervision, S.C. (Spiridon Crețu); project administration, S.C. (Spiridon Crețu) and S.C. (Stelian Cazan); funding acquisition, V.P. All authors have read and agreed to the published version of the manuscript.
Funding
This research received no external funding.
Data Availability Statement
Data will be provided on request.
Conflicts of Interest
The authors declare no conflict of interest.
References
- Sanchez-Marin, F.; Iserte, J.L.; Roda-Casanova, V. Numerical Tooth Contact Analysis of Gear Transmissions through the Discretization and Adaptive Refinement of the Contact Surfaces. Mech. Mach. Theory 2016, 101, 75–94. [Google Scholar] [CrossRef]
- Najjari, M.; Guilbault, R. Modeling the Edge Contact Effect of Finite Contact Lines on Subsurface Stresses. Tribol. Int. 2014, 77, 78–85. [Google Scholar] [CrossRef]
- Li, S. Finite Element Analyses for Contact Strength and Bending Strength of a Pair of Spur Gears with Machining Errors, Assembly Errors and Tooth Modifications. Mech. Mach. Theory 2007, 42, 88–114. [Google Scholar] [CrossRef]
- Hsu, R.-H.; Su, H.-H. Tooth Contact Analysis for Helical Gear Pairs Generated by a Modified Hob with Variable Tooth Thickness. Mech. Mach. Theory 2014, 71, 40–51. [Google Scholar] [CrossRef]
- Ye, S.-Y.; Tsai, S.-J. A Computerized Method for Loaded Tooth Contact Analysis of High-Contact-Ratio Spur Gears with or without Flank Modification Considering Tip Corner Contact and Shaft Misalignment. Mech. Mach. Theory 2016, 97, 190–214. [Google Scholar] [CrossRef]
- Mao, K. Gear Tooth Contact Analysis and Its Application in the Reduction of Fatigue Wear. Wear 2007, 262, 1281–1288. [Google Scholar] [CrossRef]
- Qin, W.J.; Guan, C.Y. An Investigation of Contact Stresses and Crack Initiation in Spur Gears Based on Finite Element Dynamics Analysis. Int. J. Mech. Sci. 2014, 83, 96–103. [Google Scholar] [CrossRef]
- Hwang, S.-C.; Lee, J.-H.; Lee, D.-H.; Han, S.-H.; Lee, K.-H. Contact Stress Analysis for a Pair of Mating Gears. Math. Comput. Model. 2013, 57, 40–49. [Google Scholar] [CrossRef]
- Popinceanu, N.G.; Diaconescu, E.; Cretu, S. Critical Stresses in Rolling Contact Fatigue. Wear 1981, 71, 265–282. [Google Scholar] [CrossRef]
- Zhu, D.; Ren, N.; Wang, Q.J. Pitting Life Prediction Based on a 3D Line Contact Mixed EHL Analysis and Subsurface von Mises Stress Calculation. J. Tribol. 2009, 131, 041501. [Google Scholar] [CrossRef]
- Morales-Espejel, G.E.; Gabelli, A.; de Vries, A.J.C. A Model for Rolling Bearing Life with Surface and Subsurface Survival—Tribological Effects. Tribol. Trans. 2015, 58, 894–906. [Google Scholar] [CrossRef]
- Roda-Casanova, V. Simulación Del Engrane y Análisis Del Contacto En Sistemas de Transmisión Por Engranajes Mediante La Modelización Avanzada Del Conjunto Ejes-Engranajes. Ph.D. Thesis, Universitat Jaume, Catello, Spain, 2015. [Google Scholar]
- Gonzalez-Perez, I.; Roda-Casanova, V.; Fuentes, A. Modified Geometry of Spur Gear Drives for Compensation of Shaft Deflections. Meccanica 2015, 50, 1855–1867. [Google Scholar] [CrossRef]
- Roda-Casanova, V.; Sanchez-Marin, F.T.; Gonzalez-Perez, I.; Iserte, J.L.; Fuentes, A. Determination of the ISO Face Load Factor in Spur Gear Drives by the Finite Element Modeling of Gears and Shafts. Mech. Mach. Theory 2013, 65, 1–13. [Google Scholar] [CrossRef]
- ISO/TC 60/SC 2—ISO 6336-1:2019; Gear Capacity Calculation, T.C. Calculation of Load Capacity of Spur and Helical Gears—Part 1: Basic Principles, Introduction and General Influence Factors. International Organization for Standardization ISO Central Secretariat: Geneva, Switzerland, 2019.
- Pedrero, J.I.; Pleguezuelos, M.; Muñoz, M. Critical Stress and Load Conditions for Pitting Calculations of Involute Spur and Helical Gear Teeth. Mech. Mach. Theory 2011, 46, 425–437. [Google Scholar] [CrossRef]
- Pedrero, J.I.; Pleguezuelos, M.; Artés, M.; Antona, J.A. Load Distribution Model along the Line of Contact for Involute External Gears. Mech. Mach. Theory 2010, 45, 780–794. [Google Scholar] [CrossRef]
- Hedlund, J.; Lehtovaara, A. Modeling of Helical Gear Contact with Tooth Deflection. Tribol. Int. 2007, 40, 613–619. [Google Scholar] [CrossRef]
- Sánchez, M.B.; Pleguezuelos, M.; Pedrero, J.I. Approximate Equations for the Meshing Stiffness and the Load Sharing Ratio of Spur Gears Including Hertzian Effects. Mech. Mach. Theory 2017, 109, 231–249. [Google Scholar] [CrossRef]
- Lahtivirta, J.; Lehtovaara, A. Modelling of Spur Gear Contact Using a Local Adaptive Finite Element Mesh. Tribol. Finn. J. Tribol. 2016, 34, 2982. [Google Scholar]
- Zhu, D.; Wang, J.; Ren, N.; Wang, Q.J. Mixed Elastohydrodynamic Lubrication in Finite Roller Contacts Involving Realistic Geometry and Surface Roughness. J. Tribol. 2012, 134, 011504. [Google Scholar] [CrossRef]
- Zhu, D.; Jane Wang, Q. Elastohydrodynamic Lubrication: A Gateway to Interfacial Mechanics—Review and Prospect. J. Tribol. 2011, 133, 041001. [Google Scholar] [CrossRef]
- Hu, Y.-Z.; Barber, G.C.; Zhu, D. Numerical Analysis for the Elastic Contact of Real Rough Surfaces. Tribol. Trans. 1999, 42, 443–452. [Google Scholar] [CrossRef]
- Liu, J.; Xu, Z. A Simulation Investigation of Lubricating Characteristics for a Cylindrical Roller Bearing of a High-Power Gearbox. Tribol. Int. 2022, 167, 107373. [Google Scholar] [CrossRef]
- Creţu, S.S.; Pop, N.N.; Cazan, S.V. Considerations Regarding the Pressures Distribution on Leads of Spur Gears. IOP Conf. Ser. Mater. Sci. Eng. 2018, 444, 022022. [Google Scholar] [CrossRef]
- Hartnett, M.J. The Analysis of Contact Stresses in Rolling Element Bearings. J. Lubr. Technol. 1979, 101, 105–109. [Google Scholar] [CrossRef]
- Hartnett, M.J. A General Numerical Solution for Elastic Body Contact Problem. In Solid Contact and Lubrication; J-GLOBAL: New York, NY, USA, 1980. [Google Scholar]
- Crețu, S.; Antălucă, E.; Crețu, O. The Study of Non-Hertzian Concentrated Contacts by a GC-DFFT Technique. Ann. “Univ. Dunarea Jos” Galați 2003, 24, 39–47. [Google Scholar]
- Crețu, S. Elastic-Plastic Concentrated Contact; Polytehnium: Iași, România, 2009. [Google Scholar]
- Pop, N.; Cretu, S.; Tufescu, A. Non Hertzian Contact Model for Tooth Contact Analysis of Spur Gear with Lead Crowning. AMM 2014, 658, 351–356. [Google Scholar] [CrossRef]
- Shewchuk, J.R. An Introduction to the Conjugate Gradient Method without the Agonizing Pain, 1 1/4 ed.; School of Computer Science, Carnegie Mellon University: Pittsburgh, PA, USA, 1994. [Google Scholar]
- Polonsky, I.A.; Keer, L.M. Fast Methods for Solving Rough Contact Problems: A Comparative Study. J. Tribol. 2000, 122, 36–41. [Google Scholar] [CrossRef]
- Allwood, J. Survey and Performance Assessment of Solution Methods for Elastic Rough Contact Problems. J. Tribol. 2005, 127, 10–23. [Google Scholar] [CrossRef]
- de Mul, J.M.; Kalker, J.J.; Fredriksson, B. The Contact Between Arbitrarily Curved Bodies of Finite Dimensions. J. Tribol. 1986, 108, 140–148. [Google Scholar] [CrossRef]
- Hetenyi, M. A Method of Solution for the Elastic Quarter-Plane. J. Appl. Mech. 1960, 27, 289–296. [Google Scholar] [CrossRef]
- Hetenyi, M. A General Solution for the Elastic Quarter Space. J. Appl. Mech. 1970, 37, 70–76. [Google Scholar] [CrossRef]
- Guilbault, R. A Fast Correction for Elastic Quarter-Space Applied to 3D Modeling of Edge Contact Problems. J. Tribol. 2011, 133, 031402. [Google Scholar] [CrossRef]
- Ioannides, E.; Harris, T.A. A New Fatigue Life Model for Rolling Bearings. J. Tribol. 1985, 107, 367–377. [Google Scholar] [CrossRef]
- Pop, I.; Crețu, S.; Yaldiz, A.S.; Iovan-Dragomir, A. A Semi-Analytical Method for Teeth Contact Analysis of Spur Gears with Modified Profiles. In Proceedings of the 9th International Conference on Tribology Cappadocia, Nevsehir, Turkey, 13 September 2017; pp. 267–288. [Google Scholar]
Disclaimer/Publisher’s Note: The statements, opinions and data contained in all publications are solely those of the individual author(s) and contributor(s) and not of MDPI and/or the editor(s). MDPI and/or the editor(s) disclaim responsibility for any injury to people or property resulting from any ideas, methods, instructions or products referred to in the content. |
© 2023 by the authors. Licensee MDPI, Basel, Switzerland. This article is an open access article distributed under the terms and conditions of the Creative Commons Attribution (CC BY) license (https://creativecommons.org/licenses/by/4.0/).