
Partial Asymmetry Measures for Square Contingency Tables


Abstract
1. Introduction
2. Review of Previous Research
3. The Proposed Measure
4. Numerical Examples
5. Example
6. Concluding Remarks
Author Contributions
Funding
Data Availability Statement
Acknowledgments
Conflicts of Interest
Appendix A
Appendix B
References
- Agresti, A. Categorical Data Analysis, 3rd ed.; Wiley: Hoboken, NJ, USA, 2013. [Google Scholar]
- Bishop, Y.M.M.; Fienberg, S.E.; Holl, P.W. Discrete Multivariate Analysis: Theory and Practice; The MIT Press: Cambridge, MA, USA, 1975. [Google Scholar]
- Beh, E.J.; Simonetti, B.; D’Ambra, L. Partitioning a non-symmetric measure of association for three-way contingency tables. J. Multivar. Anal. 2007, 98, 1391–1411. [Google Scholar] [CrossRef]
- Lombardo, R. Three-way association measure decompositions: The Delta index. J. Stat. Plan. Inference 2011, 141, 1789–1799. [Google Scholar] [CrossRef]
- Wei, Z.; Kim, D. Subcopula-based measure of asymmetric association for contingency tables. Stat. Med. 2017, 36, 3875–3894. [Google Scholar] [CrossRef] [PubMed]
- Wei, Z.; Kim, D. Measure of asymmetric association for ordinal contingency tables via the bilinear extension copula. Stat. Probab. Lett. 2021, 178, 109183. [Google Scholar] [CrossRef]
- Zhang, L.; Lu, D.; Wang, X. The essential dependence for a group of random vectors. Commun. Stat.-Theory Methods 2021, 50, 5836–5872. [Google Scholar] [CrossRef]
- Wei, Z.; Kim, D.; Conlon, E.M. A Bayesian approach to the analysis of asymmetric association for two-way contingency tables. Comput. Stat. 2022, 37, 1311–1338. [Google Scholar] [CrossRef]
- Bowker, A.H. A test for symmetry in contingency tables. J. Am. Stat. Assoc. 1948, 43, 572–574. [Google Scholar] [CrossRef] [PubMed]
- Tomizawa, S. Two kinds of measures of departure from symmetry in square contingency tables having nominal categories. Stat. Sin. 1994, 4, 325–334. [Google Scholar]
- Fernandes, L.H.S.; Araújo, F.H.A. Taxonomy of commodities assets via the complexity-entropy causality plane. Chaos Solitons Fractals 2020, 137, 109909. [Google Scholar] [CrossRef]
- Agresti, A. Analysis of Ordinal Categorical Data; Wiley: New York, NY, USA, 1984. [Google Scholar]
- West, L.J.; Hankin, R.K.S. Exact tests for two-way contingency tables with structural zeros. J. Stat. Softw. 2008, 28, 1–19. [Google Scholar] [CrossRef]


| (a) | (1) | (2) | (3) | (4) | (5) |
| (1) | 37 | 544 | 12 | 7 | 8 |
| (2) | 102 | 26 | 15 | 15 | 12 |
| (3) | 9 | 8 | 29 | 10 | 11 |
| (4) | 9 | 9 | 12 | 40 | 12 |
| (5) | 14 | 9 | 10 | 11 | 29 |
| (b) | (1) | (2) | (3) | (4) | (5) |
| (1) | 47 | 11 | 37 | 44 | 48 |
| (2) | 3 | 38 | 34 | 37 | 49 |
| (3) | 44 | 44 | 52 | 56 | 48 |
| (4) | 38 | 25 | 55 | 45 | 47 |
| (5) | 35 | 25 | 51 | 43 | 44 |
| (c) | (1) | (2) | (3) | (4) | (5) |
| (1) | 33 | 316 | 13 | 18 | 18 |
| (2) | 321 | 37 | 20 | 18 | 20 |
| (3) | 7 | 6 | 26 | 16 | 14 |
| (4) | 5 | 5 | 1 | 30 | 19 |
| (5) | 5 | 10 | 5 | 2 | 35 |
| (d) | (1) | (2) | (3) | (4) | (5) |
| (1) | 39 | 4 | 70 | 42 | 50 |
| (2) | 5 | 34 | 45 | 110 | 84 |
| (3) | 17 | 12 | 54 | 103 | 63 |
| (4) | 31 | 14 | 20 | 39 | 48 |
| (5) | 9 | 29 | 26 | 6 | 46 |
| (e) | (1) | (2) | (3) | (4) | (5) |
| (1) | 7 | 103 | 1 | 1 | 4 |
| (2) | 19 | 10 | 2 | 2 | 4 |
| (3) | 2 | 1 | 6 | 2 | 2 |
| (4) | 3 | 4 | 4 | 5 | 2 |
| (5) | 1 | 2 | 4 | 1 | 8 |
| (a) | (1) | (2) | (3) | (4) | (5) |
| (1) | 0.030 | 0.570 | 0.010 | 0.010 | 0.010 |
| (2) | 0.010 | 0.030 | 0.010 | 0.010 | 0.010 |
| (3) | 0.010 | 0.010 | 0.030 | 0.010 | 0.010 |
| (4) | 0.010 | 0.010 | 0.010 | 0.030 | 0.010 |
| (5) | 0.010 | 0.010 | 0.010 | 0.010 | 0.030 |
| (1) | 0.040 | 0.008 | 0.040 | 0.040 | 0.040 |
| (2) | 0.004 | 0.040 | 0.040 | 0.040 | 0.040 |
| (3) | 0.040 | 0.040 | 0.050 | 0.050 | 0.050 |
| (4) | 0.040 | 0.040 | 0.050 | 0.040 | 0.049 |
| (5) | 0.040 | 0.040 | 0.050 | 0.049 | 0.040 |
| (c) | (1) | (2) | (3) | (4) | (5) |
| (1) | 0.030 | 0.320 | 0.015 | 0.015 | 0.015 |
| (2) | 0.320 | 0.030 | 0.021 | 0.019 | 0.024 |
| (3) | 0.005 | 0.007 | 0.030 | 0.020 | 0.016 |
| (4) | 0.005 | 0.006 | 0.005 | 0.030 | 0.018 |
| (5) | 0.005 | 0.007 | 0.004 | 0.003 | 0.030 |
| (d) | (1) | (2) | (3) | (4) | (5) |
| (1) | 0.040 | 0.003 | 0.080 | 0.050 | 0.050 |
| (2) | 0.003 | 0.040 | 0.050 | 0.100 | 0.080 |
| (3) | 0.020 | 0.010 | 0.050 | 0.100 | 0.064 |
| (4) | 0.030 | 0.020 | 0.020 | 0.040 | 0.050 |
| (5) | 0.010 | 0.020 | 0.020 | 0.020 | 0.040 |
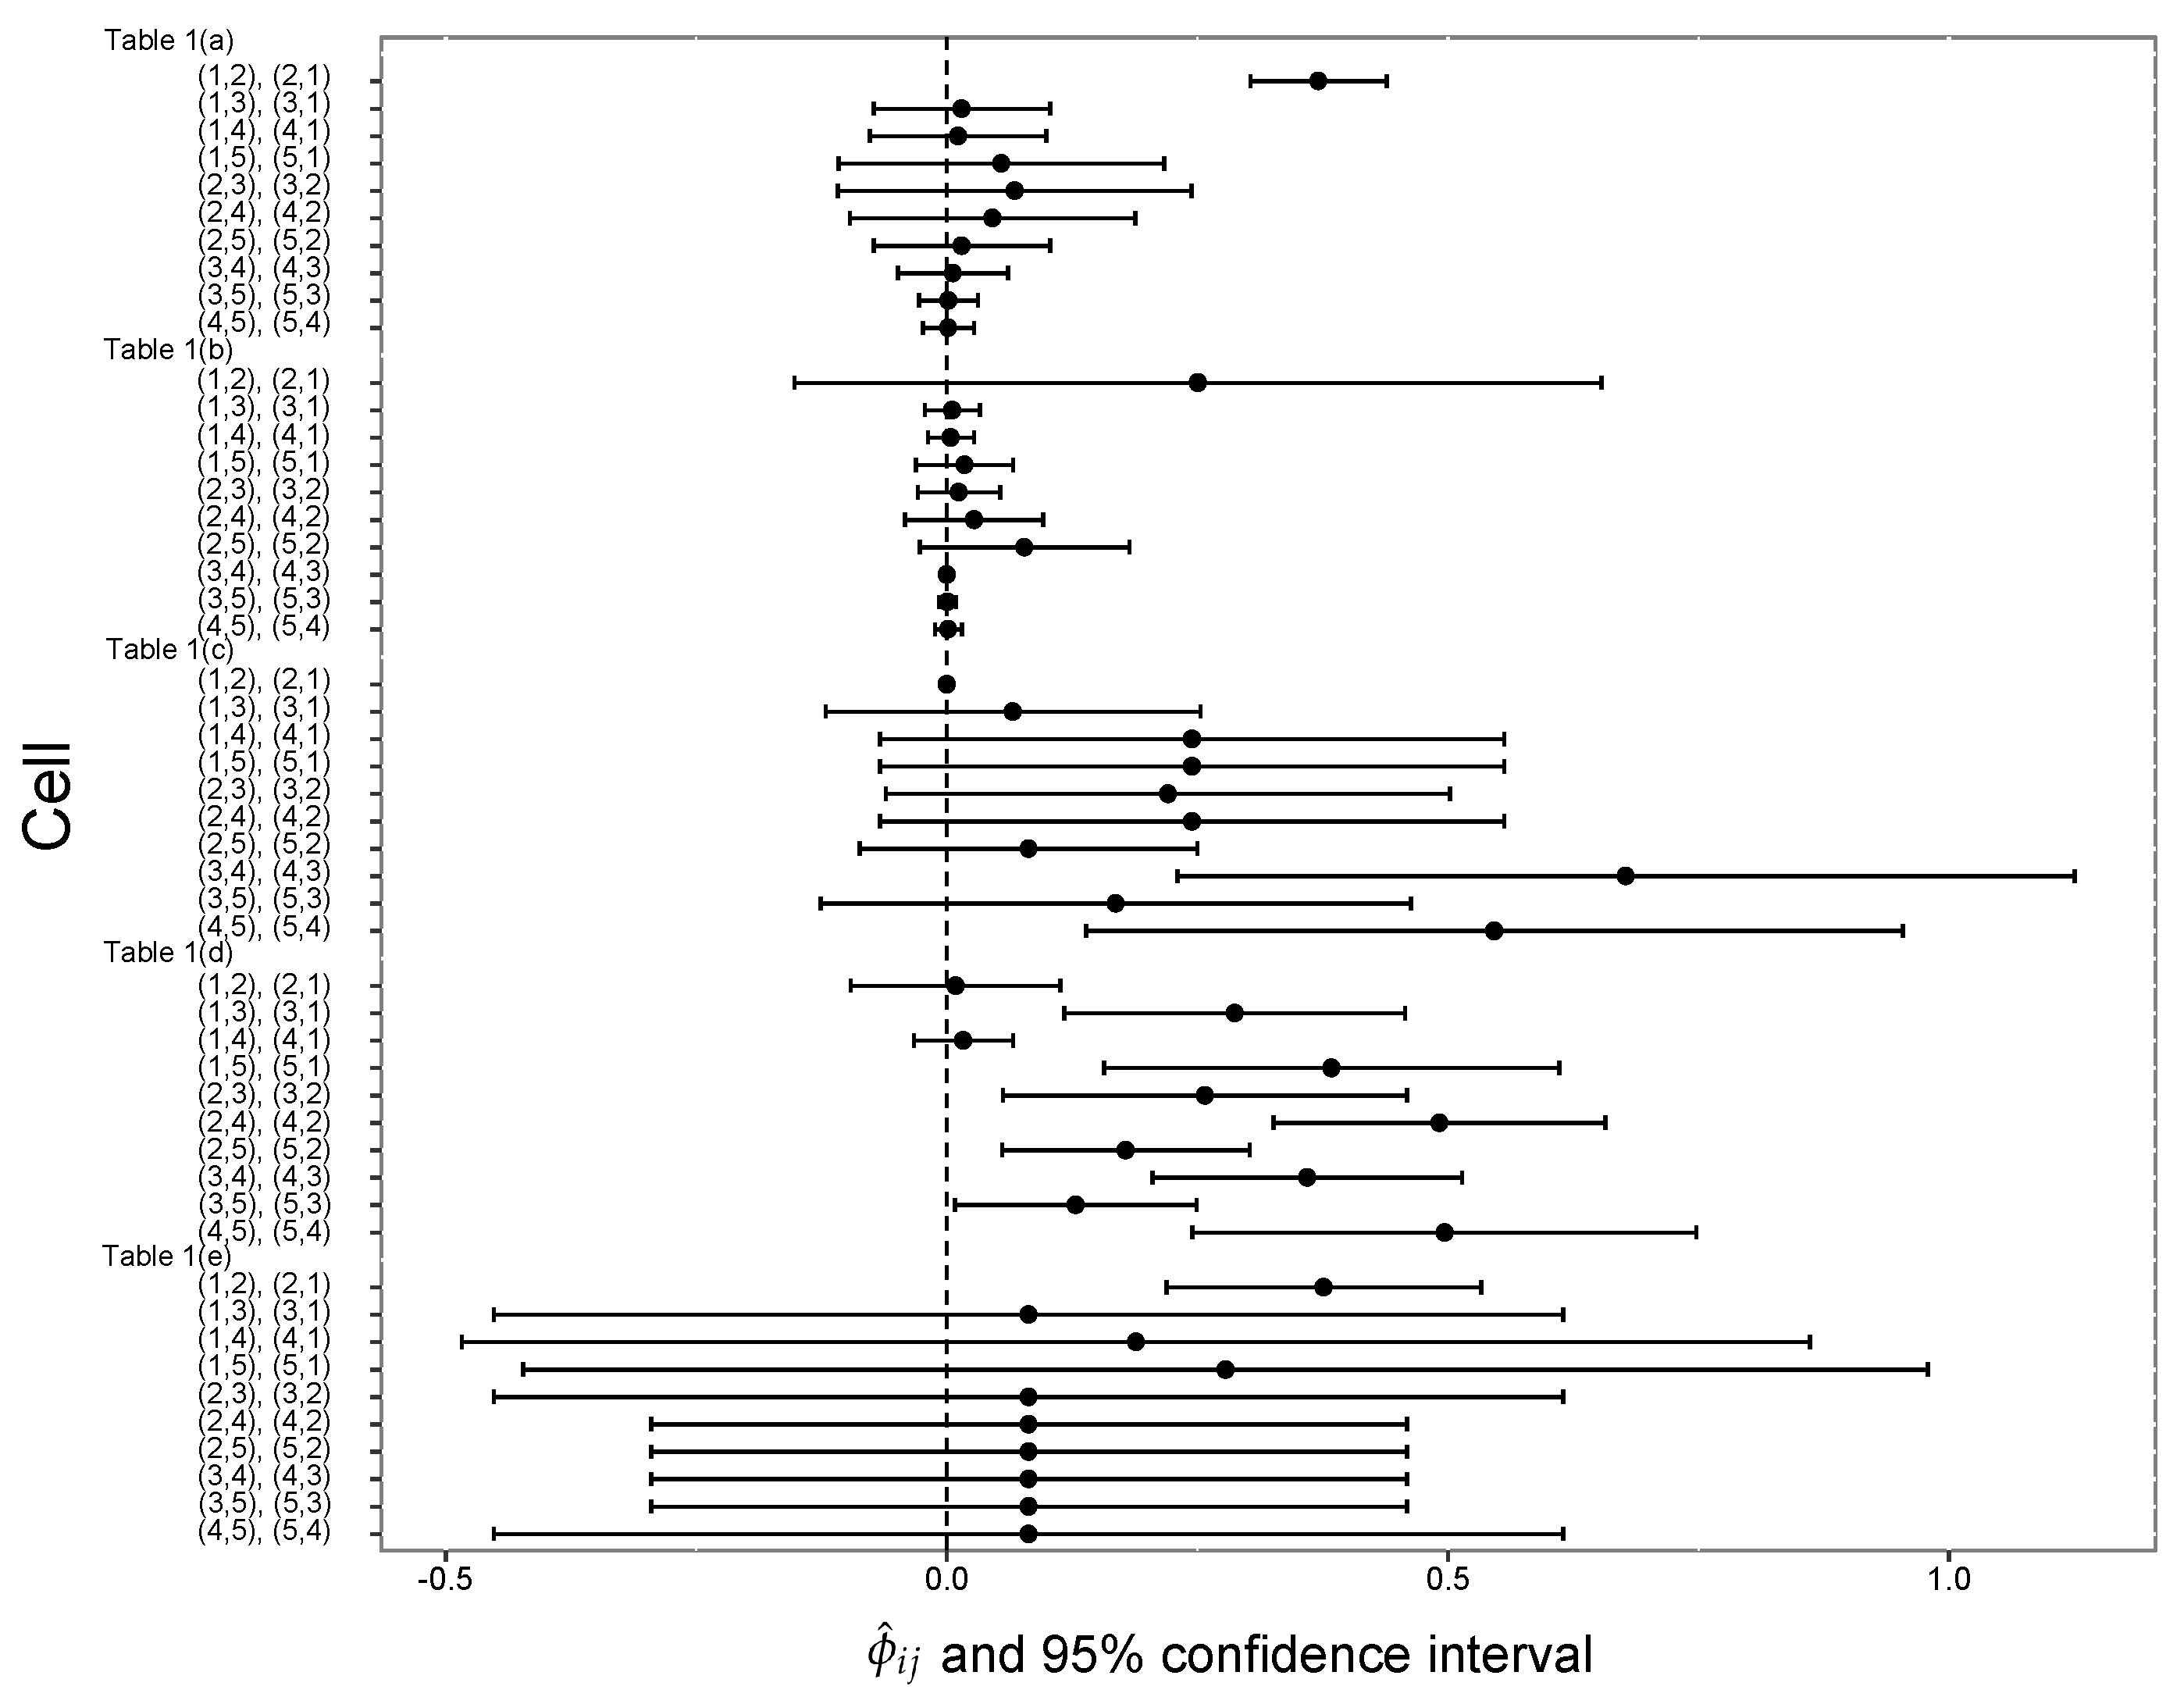
| Applied Data | Cells | Confidence Interval for | ||||||
|---|---|---|---|---|---|---|---|---|
| Table 1(a) | (1,2), (2,1) | 0.37075 | 0.0012005 | (0.303, 0.439) | 0.057987 | 0.769964 | ||
| (1,3), (3,1) | 0.01477 | 0.0020088 | (−0.073, 0.103) | 0.034653 | 0.025030 | |||
| (1,4), (4,1) | 0.01130 | 0.0020219 | (−0.077, 0.099) | 0.034428 | 0.019070 | |||
| (1,5), (5,1) | 0.05434 | 0.0068561 | (−0.108, 0.217) | 0.010153 | 0.026222 | |||
| (2,3), (3,2) | 0.06789 | 0.0081116 | (−0.109, 0.244) | 0.008582 | 0.027414 | 0.02624 | 0.29124 | |
| (2,4), (4,2) | 0.04557 | 0.0053039 | (−0.097, 0.188) | 0.013124 | 0.028605 | |||
| (2,5), (5,2) | 0.01477 | 0.0020088 | (−0.073, 0.103) | 0.034653 | 0.025030 | |||
| (3,4), (4,3) | 0.00597 | 0.0007797 | (−0.049, 0.061) | 0.089277 | 0.026222 | |||
| (3,5), (5,3) | 0.00164 | 0.0002246 | (−0.028, 0.031) | 0.309966 | 0.025030 | |||
| (4,5), (5,4) | 0.00136 | 0.0001710 | (−0.024, 0.027) | 0.407178 | 0.027414 | |||
| Table 1(b) | (1,2), (2,1) | 0.25041 | 0.0422558 | (−0.152, 0.653) | 0.000032 | 0.018088 | ||
| (1,3), (3,1) | 0.00539 | 0.0001914 | (−0.022, 0.033) | 0.006979 | 0.104651 | |||
| (1,4), (4,1) | 0.00387 | 0.0001357 | (−0.019, 0.027) | 0.009848 | 0.105943 | |||
| (1,5), (5,1) | 0.01777 | 0.0006101 | (−0.031, 0.066) | 0.002190 | 0.107235 | |||
| (2,3), (3,2) | 0.01189 | 0.0004362 | (−0.029, 0.053) | 0.003063 | 0.100775 | 0.00036 | 0.01843 | |
| (2,4), (4,2) | 0.02719 | 0.0012416 | (−0.042, 0.096) | 0.001076 | 0.080103 | |||
| (2,5), (5,2) | 0.07727 | 0.0028494 | (−0.027, 0.182) | 0.000469 | 0.095607 | |||
| (3,4), (4,3) | 0.00006 | 0.0000015 | (−0.002, 0.002) | 0.877858 | 0.143411 | |||
| (3,5), (5,3) | 0.00066 | 0.0000193 | (−0.008, 0.009) | 0.069221 | 0.127907 | |||
| (4,5), (5,4) | 0.00143 | 0.0000457 | (−0.012, 0.015) | 0.029264 | 0.116279 | |||
| Table 1(c) | (1,2), (2,1) | 0.00004 | 0.0000002 | (−0.001, 0.001) | 0.999900 | 0.759237 | ||
| (1,3), (3,1) | 0.06593 | 0.0090727 | (−0.121, 0.253) | 0.000022 | 0.023838 | |||
| (1,4), (4,1) | 0.24463 | 0.0252616 | (−0.067, 0.556) | 0.000008 | 0.027414 | |||
| (1,5), (5,1) | 0.24463 | 0.0252616 | (−0.067, 0.556) | 0.000008 | 0.027414 | |||
| (2,3), (3,2) | 0.22065 | 0.0205989 | (−0.061, 0.502) | 0.000010 | 0.030989 | 0.00006 | 0.06270 | |
| (2,4), (4,2) | 0.24463 | 0.0252616 | (−0.067, 0.556) | 0.000008 | 0.027414 | |||
| (2,5), (5,2) | 0.08170 | 0.0074074 | (−0.087, 0.250) | 0.000027 | 0.035757 | |||
| (3,4), (4,3) | 0.67724 | 0.0521067 | (0.230, 1.125) | 0.000004 | 0.020262 | |||
| (3,5), (5,3) | 0.16853 | 0.0225185 | (−0.126, 0.463) | 0.000009 | 0.022646 | |||
| (4,5), (5,4) | 0.54628 | 0.0432851 | (0.139, 0.954) | 0.000005 | 0.025030 | |||
| Table 1(d) | (1,2), (2,1) | 0.00892 | 0.0028433 | (−0.096, 0.113) | 0.113903 | 0.011421 | ||
| (1,3), (3,1) | 0.28736 | 0.0075340 | (0.117, 0.457) | 0.042986 | 0.110406 | |||
| (1,4), (4,1) | 0.01644 | 0.0006424 | (−0.033, 0.066) | 0.504107 | 0.092640 | |||
| (1,5), (5,1) | 0.38383 | 0.0134101 | (0.157, 0.611) | 0.024150 | 0.074873 | |||
| (2,3), (3,2) | 0.25751 | 0.0106028 | (0.056, 0.459) | 0.030545 | 0.072335 | 0.11518 | 0.28830 | |
| (2,4), (4,2) | 0.49139 | 0.0071440 | (0.326, 0.657) | 0.045333 | 0.157360 | |||
| (2,5), (5,2) | 0.17837 | 0.0039745 | (0.055, 0.302) | 0.081484 | 0.143401 | |||
| (3,4), (4,3) | 0.35950 | 0.0061895 | (0.205, 0.514) | 0.052323 | 0.156091 | |||
| (3,5), (5,3) | 0.12854 | 0.0037881 | (0.008, 0.249) | 0.085494 | 0.112944 | |||
| (4,5), (5,4) | 0.49674 | 0.0164609 | (0.245, 0.748) | 0.019674 | 0.068528 | |||
| Table 1(e) | (1,2), (2,1) | 0.37599 | 0.0064089 | (0.219, 0.533) | 0.486330 | 0.743902 | ||
| (1,3), (3,1) | 0.08170 | 0.0740741 | (−0.452, 0.615) | 0.042077 | 0.018293 | |||
| (1,4), (4,1) | 0.18872 | 0.1177550 | (−0.484, 0.861) | 0.026469 | 0.024390 | |||
| (1,5), (5,1) | 0.27807 | 0.1280000 | (−0.423, 0.979) | 0.024350 | 0.030488 | |||
| (2,3), (3,2) | 0.08170 | 0.0740741 | (−0.452, 0.615) | 0.042077 | 0.018293 | 0.23244 | 0.30922 | |
| (2,4), (4,2) | 0.08170 | 0.0370370 | (−0.295, 0.459) | 0.084155 | 0.036585 | |||
| (2,5), (5,2) | 0.08170 | 0.0370370 | (−0.295, 0.459) | 0.084155 | 0.036585 | |||
| (3,4), (4,3) | 0.08170 | 0.0370370 | (−0.295, 0.459) | 0.084155 | 0.036585 | |||
| (3,5), (5,3) | 0.08170 | 0.0370370 | (−0.295, 0.459) | 0.084155 | 0.036585 | |||
| (4,5), (5,4) | 0.08170 | 0.0740741 | (−0.452, 0.615) | 0.042077 | 0.018293 |
| Fathers’ Birth Order | |||||
|---|---|---|---|---|---|
| Mothers’ Birth Order | First | Second | Third | Fourth or More | Total |
| First | 224 | 179 | 53 | 22 | 478 |
| Second | 162 | 153 | 35 | 15 | 365 |
| Third | 37 | 37 | 18 | 11 | 103 |
| Fourth or more | 12 | 7 | 3 | 5 | 27 |
| Total | 435 | 376 | 109 | 53 | 973 |
| Cells | Confidence Interval for | ||||||
|---|---|---|---|---|---|---|---|
| (1,2), (2,1) | 0.0018 | 0.00002 | (−0.006, 0.009) | 0.5864 | 0.5951 | ||
| (1,3), (3,1) | 0.0229 | 0.00072 | (−0.030, 0.076) | 0.0123 | 0.1571 | ||
| (1,4), (4,1) | 0.0633 | 0.00514 | (−0.077, 0.204) | 0.0017 | 0.0593 | ||
| (2,3), (3,2) | 0.0006 | 0.00002 | (−0.009, 0.010) | 0.3986 | 0.1257 | 0.0018 | 0.0184 |
| (2,4), (4,2) | 0.0976 | 0.01192 | (−0.116, 0.312) | 0.0007 | 0.0384 | ||
| (3,4), (4,3) | 0.2504 | 0.04226 | (−0.152, 0.653) | 0.0002 | 0.0244 |
Publisher’s Note: MDPI stays neutral with regard to jurisdictional claims in published maps and institutional affiliations. |
© 2022 by the authors. Licensee MDPI, Basel, Switzerland. This article is an open access article distributed under the terms and conditions of the Creative Commons Attribution (CC BY) license (https://creativecommons.org/licenses/by/4.0/).
Share and Cite
Ishihara, T.; Yamamoto, K.; Tahata, K.; Tomizawa, S. Partial Asymmetry Measures for Square Contingency Tables. Symmetry 2022, 14, 1936. https://doi.org/10.3390/sym14091936
Ishihara T, Yamamoto K, Tahata K, Tomizawa S. Partial Asymmetry Measures for Square Contingency Tables. Symmetry. 2022; 14(9):1936. https://doi.org/10.3390/sym14091936
Chicago/Turabian StyleIshihara, Takuma, Kouji Yamamoto, Kouji Tahata, and Sadao Tomizawa. 2022. "Partial Asymmetry Measures for Square Contingency Tables" Symmetry 14, no. 9: 1936. https://doi.org/10.3390/sym14091936
APA StyleIshihara, T., Yamamoto, K., Tahata, K., & Tomizawa, S. (2022). Partial Asymmetry Measures for Square Contingency Tables. Symmetry, 14(9), 1936. https://doi.org/10.3390/sym14091936