1. Introduction
All data presented in this article could be used for the design of Metal Oxide Varistor (MOV) based Surge Arresters for all voltage domains, with a cylindrical symmetry (cylinders or disks). For rectangular MOVs, other studies must be conducted.
A varistor is an electronic component with an electrical resistance that varies depending on the applied voltage. It has a nonlinear, non-ohmic current characteristic, like a diode. Unlike a diode, however, it has the same characteristic for both directions of the current passage. At low voltage, it has high electrical resistance, which decreases with increasing voltage [
1]. Varistors are used as dedicated devices, in certain circuits, to ensure optimal service conditions or to protect sensitive circuits against dangerous transient voltages. When used as protective devices, they trigger the current caused by the excessive voltage applied to the sensitive circuit when activated [
2].
The most common type of varistor on the market is the Metal-Oxide Varistor (MOV). It contains a massive ceramic block of zinc oxide granules, in a matrix of other metal oxides (manganese, bismuth, stibium, cobalt, etc.), between two metal-plated electrodes [
2]. The interspace between the grains acts like a diode junction, which allows the current to flow only in a single direction. The mass of randomly oriented grains is electrically equivalent to a network of back-to-back diode pairs, each pair in parallel with many other pairs [
3].
In the case of a low or moderate voltage applied to the electrodes, we notice only a small current flow, caused by the reverse leakage through the diode junctions. When a higher voltage is applied, the diode junction opens due to a combination of thermionic emissions and electron tunneling, causing a higher current flow. The result of this behavior is an extremely nonlinear current characteristic, in which the MOV has a high resistance to low voltages and a low resistance to high voltages [
3].
The advantages of overvoltage protection equipment with MOVs are [
3]:
the current-voltage characteristic has a high non-linearity, the non-linearity coefficient α (the slope of the curve) having values between 20 and 70;
most constructive variants do not require fuses in series with varistors;
the volume of the MOV surge arrester (mass and size) is smaller;
the crossing current flow in the permanent service regime (in the absence of overvoltages) has extremely low values;
their response time is very short (between 10 and 25 ns);
they have an increased energy absorption capacity (specific energy E > 150 J/cm3), and allow currents with a density J > 5 kA/cm2 to pass;
the protection level is lower (the equipment is more sensitive to voltage increases).
Other advantages of using overvoltage protection equipment including varistors based on metal oxides are [
4]:
eliminating short interruptions caused by overvoltages;
reducing the number of interruptions due to accidental causes;
reducing the risk of increasing the electrical potential of the neighboring power networks or pieces of equipment;
the possibility of connecting them in parallel;
can be used at frequencies lower than 50 Hz;
can also operate in direct current;
the resulting protective equipment has a high pollution resistance.
The success of surge protection equipment using MOVs is a direct consequence of the concerns regarding power quality and electricity supply continuity, as well as increasing safety of any electrical network, or responding to certain supply specifications.
Any apparatus, equipment, or electrical installation is conceived to operate at a nominal rated supply voltage by having a certain insulation level [
5]. During its service mode, it will be supplied on a service voltage, which is very closely related to the rated (nominal) one. During the normal (or permanent) operating (service) mode of the protective equipment (when the equipment is connected to the rated voltage of the network and no overvoltage is applied), the varistor (or the varistor column) arrives, after a relatively short time, to a stationary thermal regime, which corresponds to an equilibrium between the thermal power developed by the Joule effect inside the varistor mass and the heat dissipated to the environment [
6]. Any perturbation of this fragile equilibrium will be conducive to an increase in temperature, which also generates an increase in the current crossing that varistor (a thermoelectronic current); this avalanche process generates the so-called “thermal runaway” [
6].
However, this category of equipment also has disadvantages, which we mention [
7]:
accidental degradation of the varistor reflected in the change of the current-voltage characteristic after the passage of each surging wave;
permanent degradation of the varistor, even in the absence of overvoltages (the aging phenomenon), due to the permanent passage of an extremely low current through the varistor;
during normal operation, the current-voltage characteristic is highly dependent on temperature, its increase either due to the microclimatic conditions or due to the Joule-Lenz effect, which causes an exponential increase of the current passing through the varistor. At the limit, even uncontrolled, avalanche growth can lead to the phenomenon of thermal runaway and the irreversible destruction of the equipment.
2. Materials and Methods
The transition from the permanent thermal regime (mode) to the thermal (transient mode) runaway regime appears in these situations [
8]:
During a nominal (normal) service mode, when there is an increase in the ambient temperature or an increase of the supplying voltage [
9];
During an emergency overvoltage situation, when the energy of the surge waves is generating a rapid and high-temperature augmentation [
10];
- -
if the temperature remains below a given limit, the heat produced can be completely dissipated, the varistor cools down gradually, and the temperature returns to a balanced value [
3];
- -
if the temperature exceeds a certain threshold value, (for example by applying several voltage shocks occurring at short intervals), an inevitable thermal runaway will appear [
3].
The phenomenon of “thermal runaway” can simply be described by setting a threshold of current, from which an uncontrolled current increase is possible, accompanied naturally by an uncontrolled increase of the temperature, with fatal consequences for the varistor material and these increases amp each other [
11].
The thermal runaway phenomenon occurs if, after a long-lasting operation that has produced a certain varistor heating [
12], the current passing through it increases over time, even when the varistor is supplied with the operating voltage, under unchanged environmental conditions. It can lead to the destruction of the varistor.
Simplified quantification of the thermal runaway phenomenon emergency is given by the load coefficient
C, defined as the ratio between the peak value of the nominal voltage supplied,
Unmax, as an amplitude (for EU and many other countries, it is set as 230 V
RMS × 1.41) and that of the rated threshold of the MOV (or surge arrester device),
UN. It could also be defined considering the real value of the rated voltage [
13]:
Under ideal conditions for ensuring the varistor cooling, a coefficient of use of up to 0.8 can be obtained, without the risk of thermal runaway. Normally, this coefficient has values around 0.5 [
10]. The ideal value of this coefficient is 1, and the varistor (surge arrester) “opens” at the smallest applied voltage increase [
11].
We can also define the overtemperature of a varistor, at a certain time,
τ(t), as a difference between the temperature of that varistor
θ and the environmental (ambient) temperature
θa, as follows:
All temperatures and temperature differences are considered at a particular time.
For each voltage value applied to the MOV, in permanent service mode, and for each value of the environmental temperature, keeping one of the constants, we can establish a critical value of the current density
Jcr, which corresponds to a certain value of the other size [
12]. Consequently, for a certain overtemperature τ, we can find the value
C, which determines
Jcr.
Increasing the current density above this critical level, due to either increasing the supply voltage or increasing the ambient temperature or varistor’s temperature following a current impulse, causes the varistor to overheat and causes its entry into the “thermal runaway” regime, which involves a violent and uncontrolled temp increase, ending with total deterioration.
If the current density is maintained at values below this critical threshold, the varistor heating eventually leads to a steady-state overtemperature,
τs, without destructive consequences for the varistor [
13]. The resistivity of the varistor environment in the “ohmic” area, operating in permanent service mode, is highly dependent on the temperature [
14].
Dependence can be considered linear, only for small temperatures between 20 °C and 60 °C [
14]. It is a much more complex variation [
15].
In the following, we will present the way of variation of the critical current density, depending on the voltage applied to the varistor and the ambient temperature.
After analytical modeling of the heat transfer and the varistor conduction, the following formula for the critical current density can be determined [
3]:
where:
α is the global thermal transmissivity (by convection and radiation);
ρa is the resistance of the varistor at ambient temperature, taken as an average value for the operation of the varistor at a voltage around the nominal one;
αR is the coefficient of variation of the resistivity with temperature;
A is the cross-sectional area;
lp = π · d is the length of the perimeter of the varistor (d is the diameter);
J is the current density through the varistor.
As we can notice,
Jcr is the critical current density, a specific size, strictly defined for each varistor. The critical current density
Jcr, calculated according to (3) is firstly dependent on the diameter of the varistor and the thermal transmissivity by convection, α, which is small enough for values up to 40 °C [
16].
We can observe that Jcr is thus defined as a function of the resistance of the varistor material when connected to the network, namely ρa.
The resistivity at the initial moment,
ρa, is determined by two factors [
17]:
- -
the supply voltage applied to the MOV;
- -
its initial temperature (most often ambient temperature θa)
As a result, the definition of Jcr will be made considering these two sizes.
Before understanding the thermal runaway phenomenon of MOVs, we will present some experimental data obtained by the authors during their stages at the LAPLACE “Génie Electrique” Research Lab, from the PAUL SABATIER University in Toulouse, France.
We tried to respond to this simple question “How is thermal runaway manifested and under what conditions?”. There are no numerical models or known technical solutions applied to prevent this issue [
18].
All conclusions set from the experimental analysis are considered for measurements under a permanent regime and for establishing the functional limits for MOVs.
For the experimental study, we used a set of symmetric disk MOVs, with no connectors, and with both sides covered with Ag-based mix painted electrodes, type VARSI V250 D32 S, manufactured by Varsi d.o.o. [
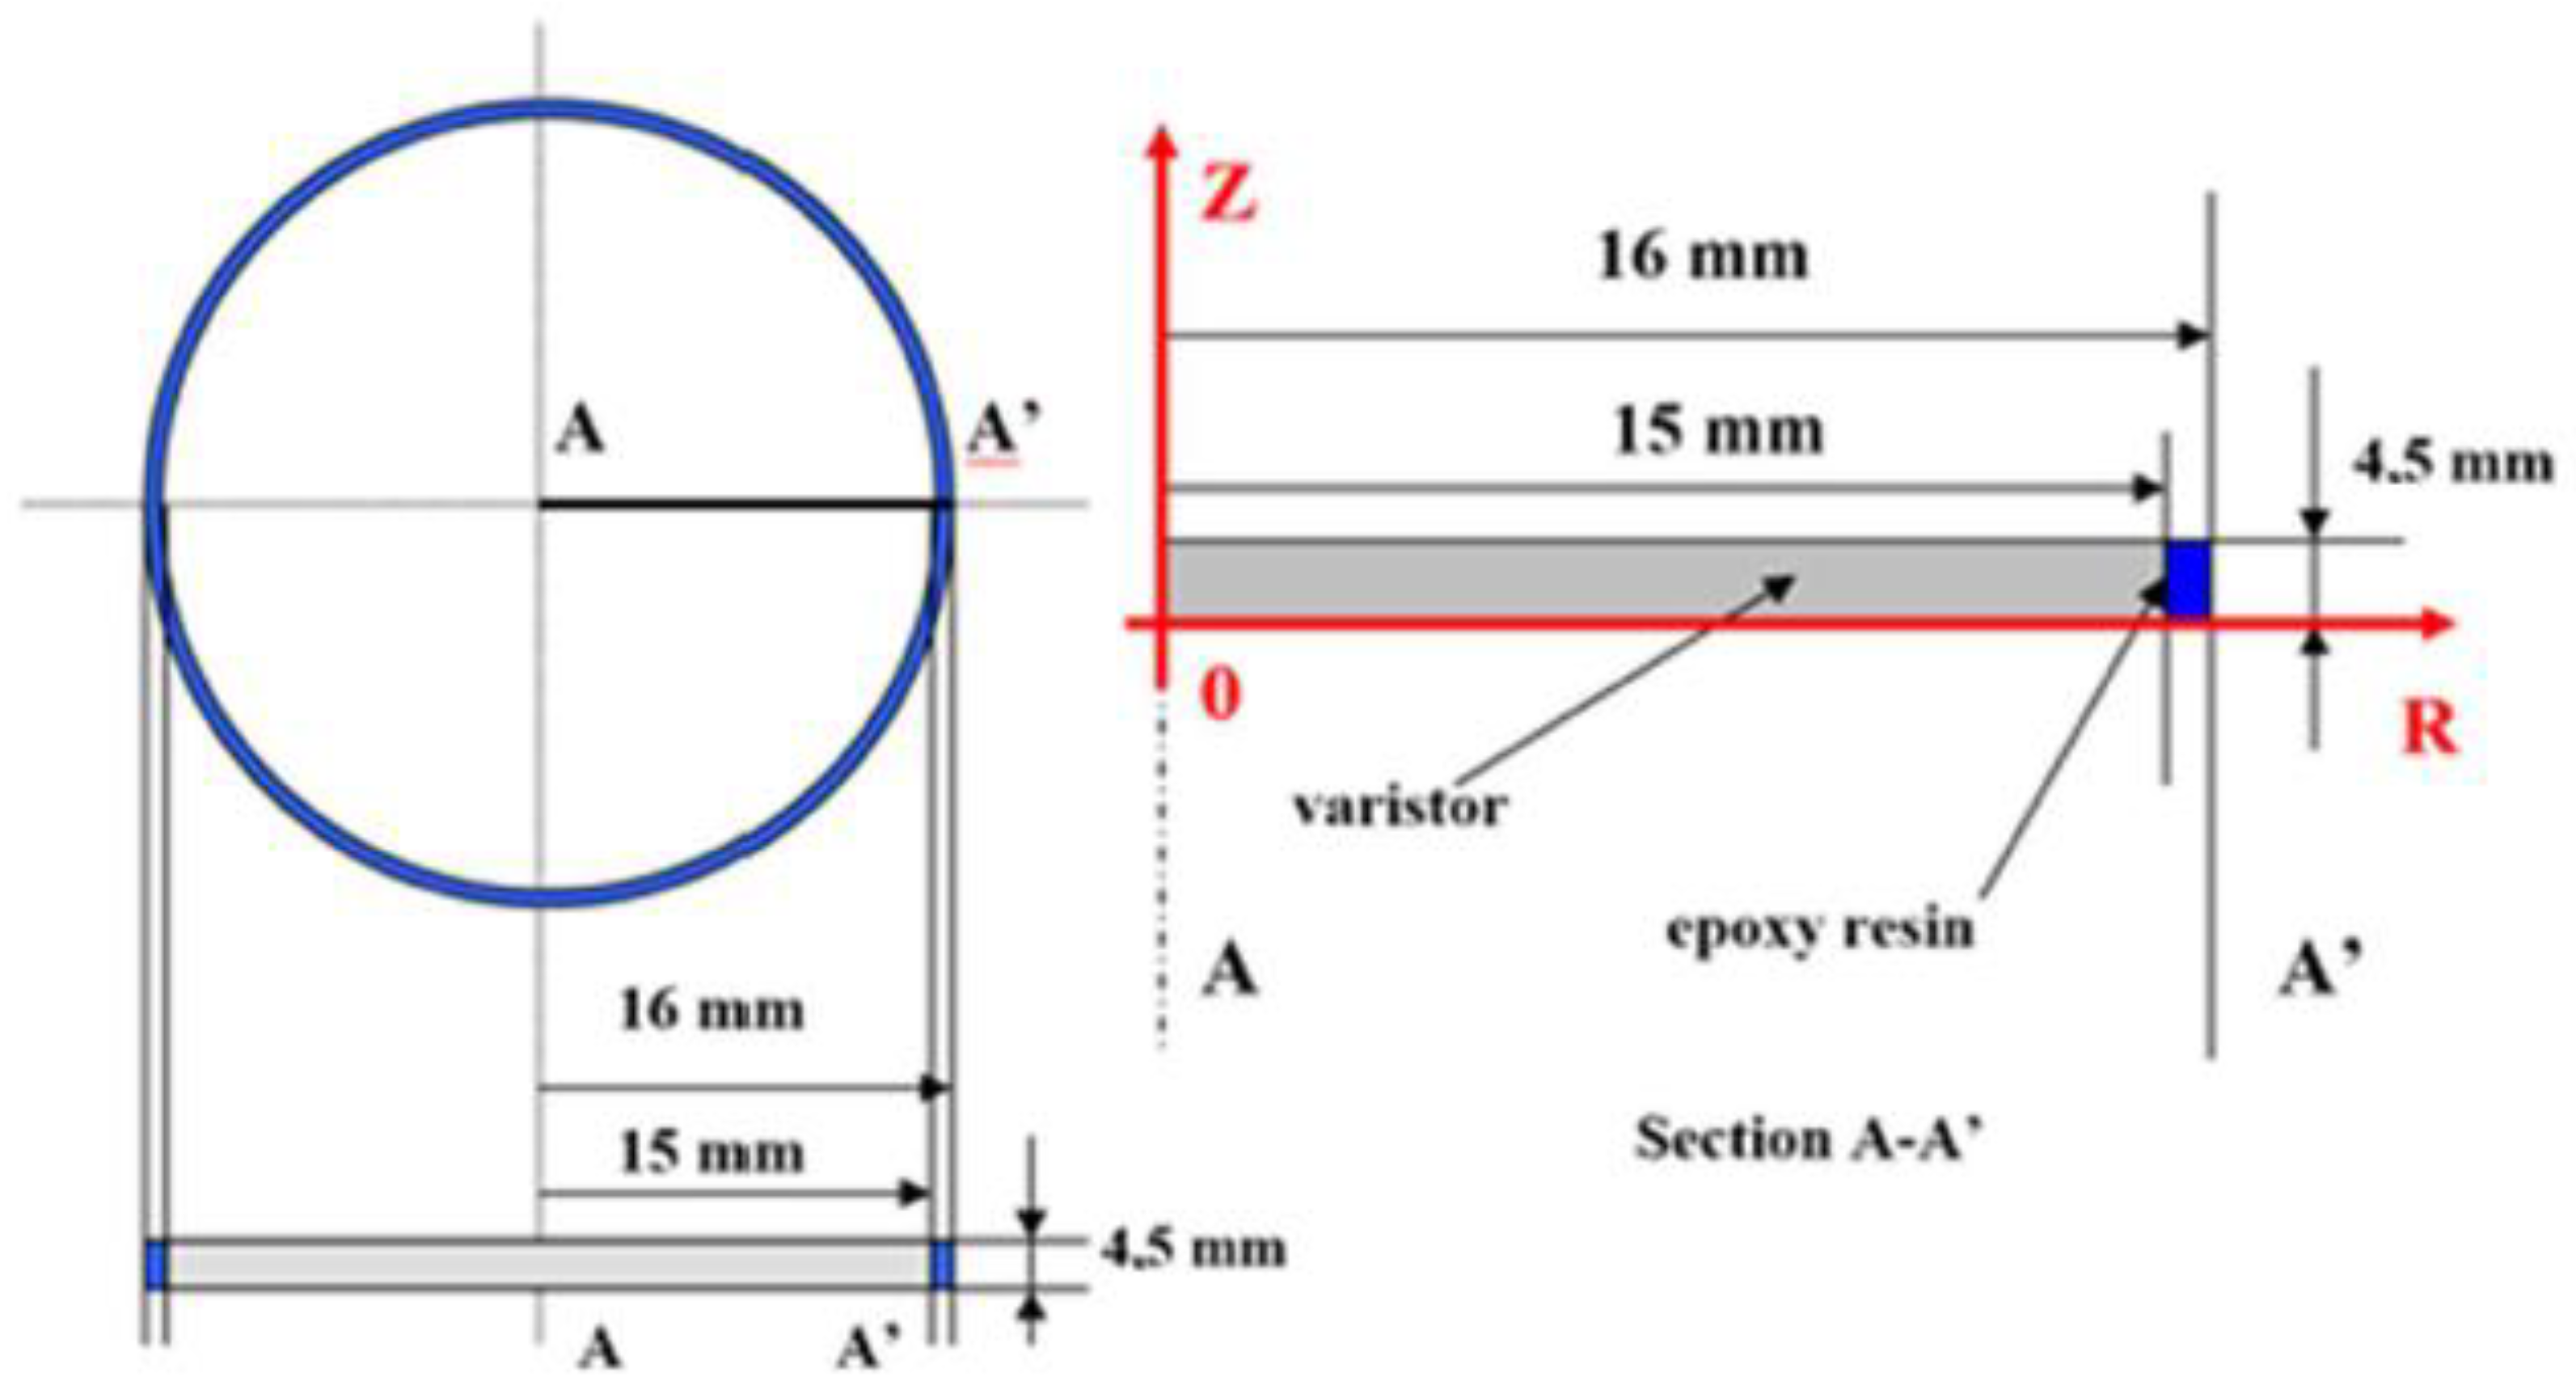
19].
These are high absorption capacity varistors used for special and dedicated low voltage applications.
The real diameter of the MOV is around 30 mm. The device is surrounded on the lateral side by a simple epoxy resin insulating layer, with a thickness of 1 mm. The MOV’s height is set at 4.5 mm.
This is a high energy absorption capacity MOV, mostly applied for the surge protection of regular 230 V low voltage AC networks, as a dedicated and advanced suppression disk. One single varistor was used for each set of measurements (there were 12 identical devices in total, groups of three of them used for generating each graph).
We considered that a 30 mm disk symmetric MOV can be easily used for obtaining quality results.
We observed that the manufacturer provides, indirectly, a maximum functional value for the load coefficient, in the case of an ambient temperature
θa = 25 °C, as we defined in [
2,
3,
4]:
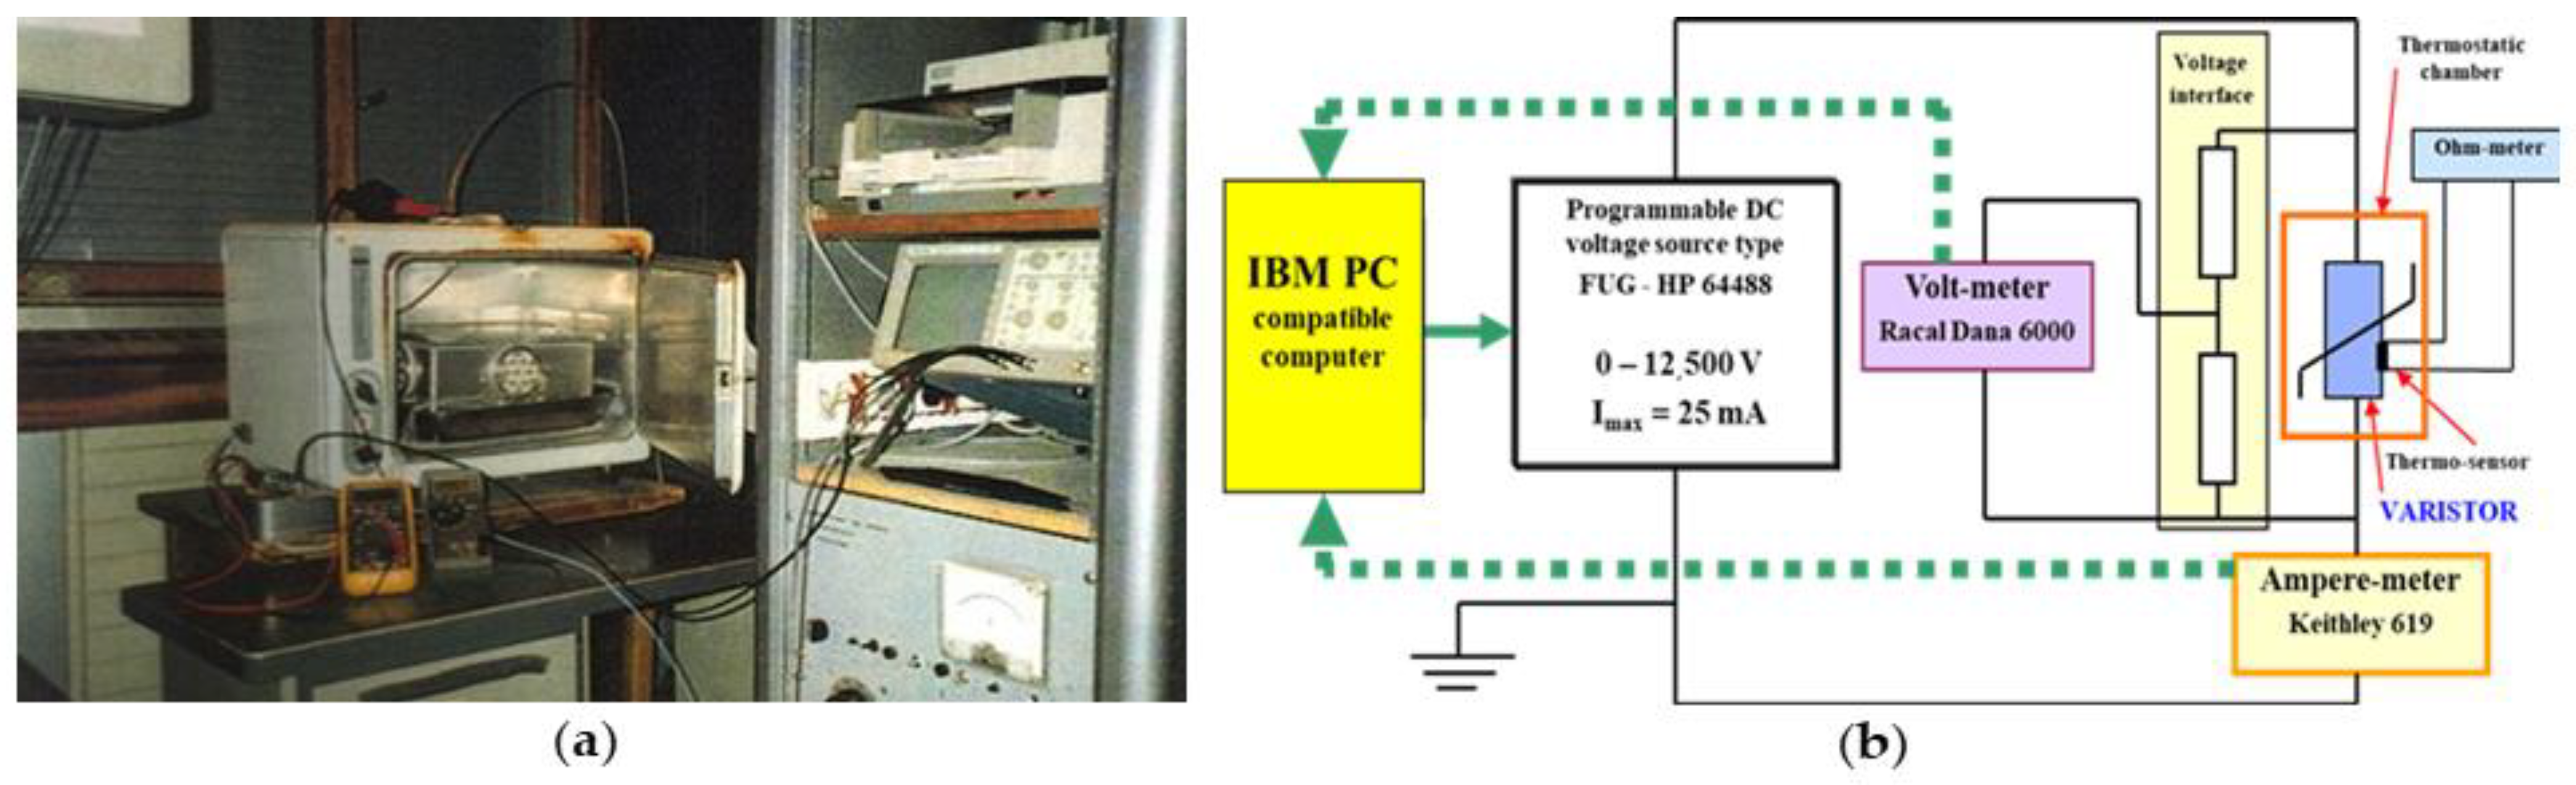
Before assessing the maximal value of the load coefficient C = U/UN, which does not lead to a thermal runaway, at a certain ambient temperature, using measuring the MOV heating on various values of the DC supply voltage U (around UDC = 320 VDC), the considered MOV was subjected to an unarm heating process, inside a thermal oven, set at θa = 25 °C.
Figure 2a shows the general view of the equipment and
Figure 2b presents the electrical dedicated schema of this device.
The main devices of the electrical setup from
Figure 2b, are:
A programmable DC source, manually controlled;
A Keithley 619 digital microammeter, for very low DC currents;
A digital voltmeter, connected between the faces of that varistor, through a 1:1000 resistive divider;
Two standard multimeters (there is only one on the schema) operating as ohmmeters, used to measure the electrical resistance of the thermal sensors. The MOVs are connected by simple wires, to reduce any influence on the total impedance [
7]. They are vertically suspended inside the oven, with the same thermal transmissivity coefficient on each side. These temperatures were measured on symmetrical varistor sides, close to the axis. Very sensitive Platinum sensors were applied.
The thermal inertia of these thermal resistors is small; they respond almost instantly to the smallest variations in temperature. To increase the reaction rate of the assembly, a thin layer of silicone jelly was deposited between the thermal collectors and the varistor, knowing that this material is an excellent thermal conductor [
19].
The connectors were then soldered to the surface of the varistor at the point where the temperature was optimal. All the temperatures determined experimentally in this paper were measured by this process.
The digital ammeter and digital voltmeter can transmit the data obtained directly to the PC, which is provided with a process interface, compatible with IEEE 488. A printer can also be attached to the system. As mentioned earlier, in the first set of tests, the varistor was polarized at three different voltage levels:
312 V DC, corresponding to a C = 312/390 = 0.8—a value slightly below the limit;
320 V DC, corresponding to C = 320/390 = 0.82—a maximal (limit) value recommended by the manufacturer;
345 V DC, corresponding C = 345/390 = 0.884—a value slightly above limit.
According to all standards, a complete set of measurements on varistor must be completed with tests on impulse (transitory) regime, both in electrical and thermal status.
Figure 3a presents a picture of the impulse generator as installed at the “Génie Electrique”—LAPLACE Research Laboratory in Toulouse, France, where all measurements were performed. The electrical setup of the impulse generator is presented in
Figure 2b.
This generator offers a standardized bi-exponential current impulse wave, type 8/20 μs, complying with the IEC 60060-2 regulations.
The 180 μF capacitor in
Figure 3b is charged to approx. 2000 V cc; consequently, the peak voltage directly applied to the MOV is somewhat lower, in a range between 1700 and 1900 V.
It is standard-built equipment, so all major components are given by the manufacturer, to obtain the requested voltage pulse, according to IEC 60060-2. The distance between the electrodes could be modified to adjust the voltage peak value of the setup. We added an oscilloscope only.
The whole discharge phenomenon happens in a few microseconds and can be considered fully adiabatic; the MOV has no time to transfer the heat to the ambient.
The whole energy of that pulse (around 350 J, taken from the 180 μF capacitor at 2000 V) remains stored inside the MOV, producing a very fast temperature increase. The behavior of the varistor in this situation is subject to other research [
3,
4,
5].
All losses inside the test setup are considered negligible [
3].
For visualizing the values and the waveforms of the applied pulses, we used a standard digital oscilloscope having two acquisition channels:
Channel 1—for voltage acquisition, through a 1/1000 adapter;
Channel 2—for current acquisition, through a 0.01 V/A adapter.
3. Results
Our measurements were conducted to establish a simple relation between the voltage applied to the MOV at a certain environmental (ambient) temperature, which is not producing a supplementary overheating of that varistor.
3.1. Measurements in Permanent Service Regime
The main objective of these measurements was:
The assessment of the thermal runaway phenomenon.
Finding the maximum operating voltage limit for a certain ambient temperature.
Observing the thermal behavior of the MOV;
Determination of the limit value for the current density, in case of a given voltage and ambient temperature, beyond which the thermal runaway occurs.
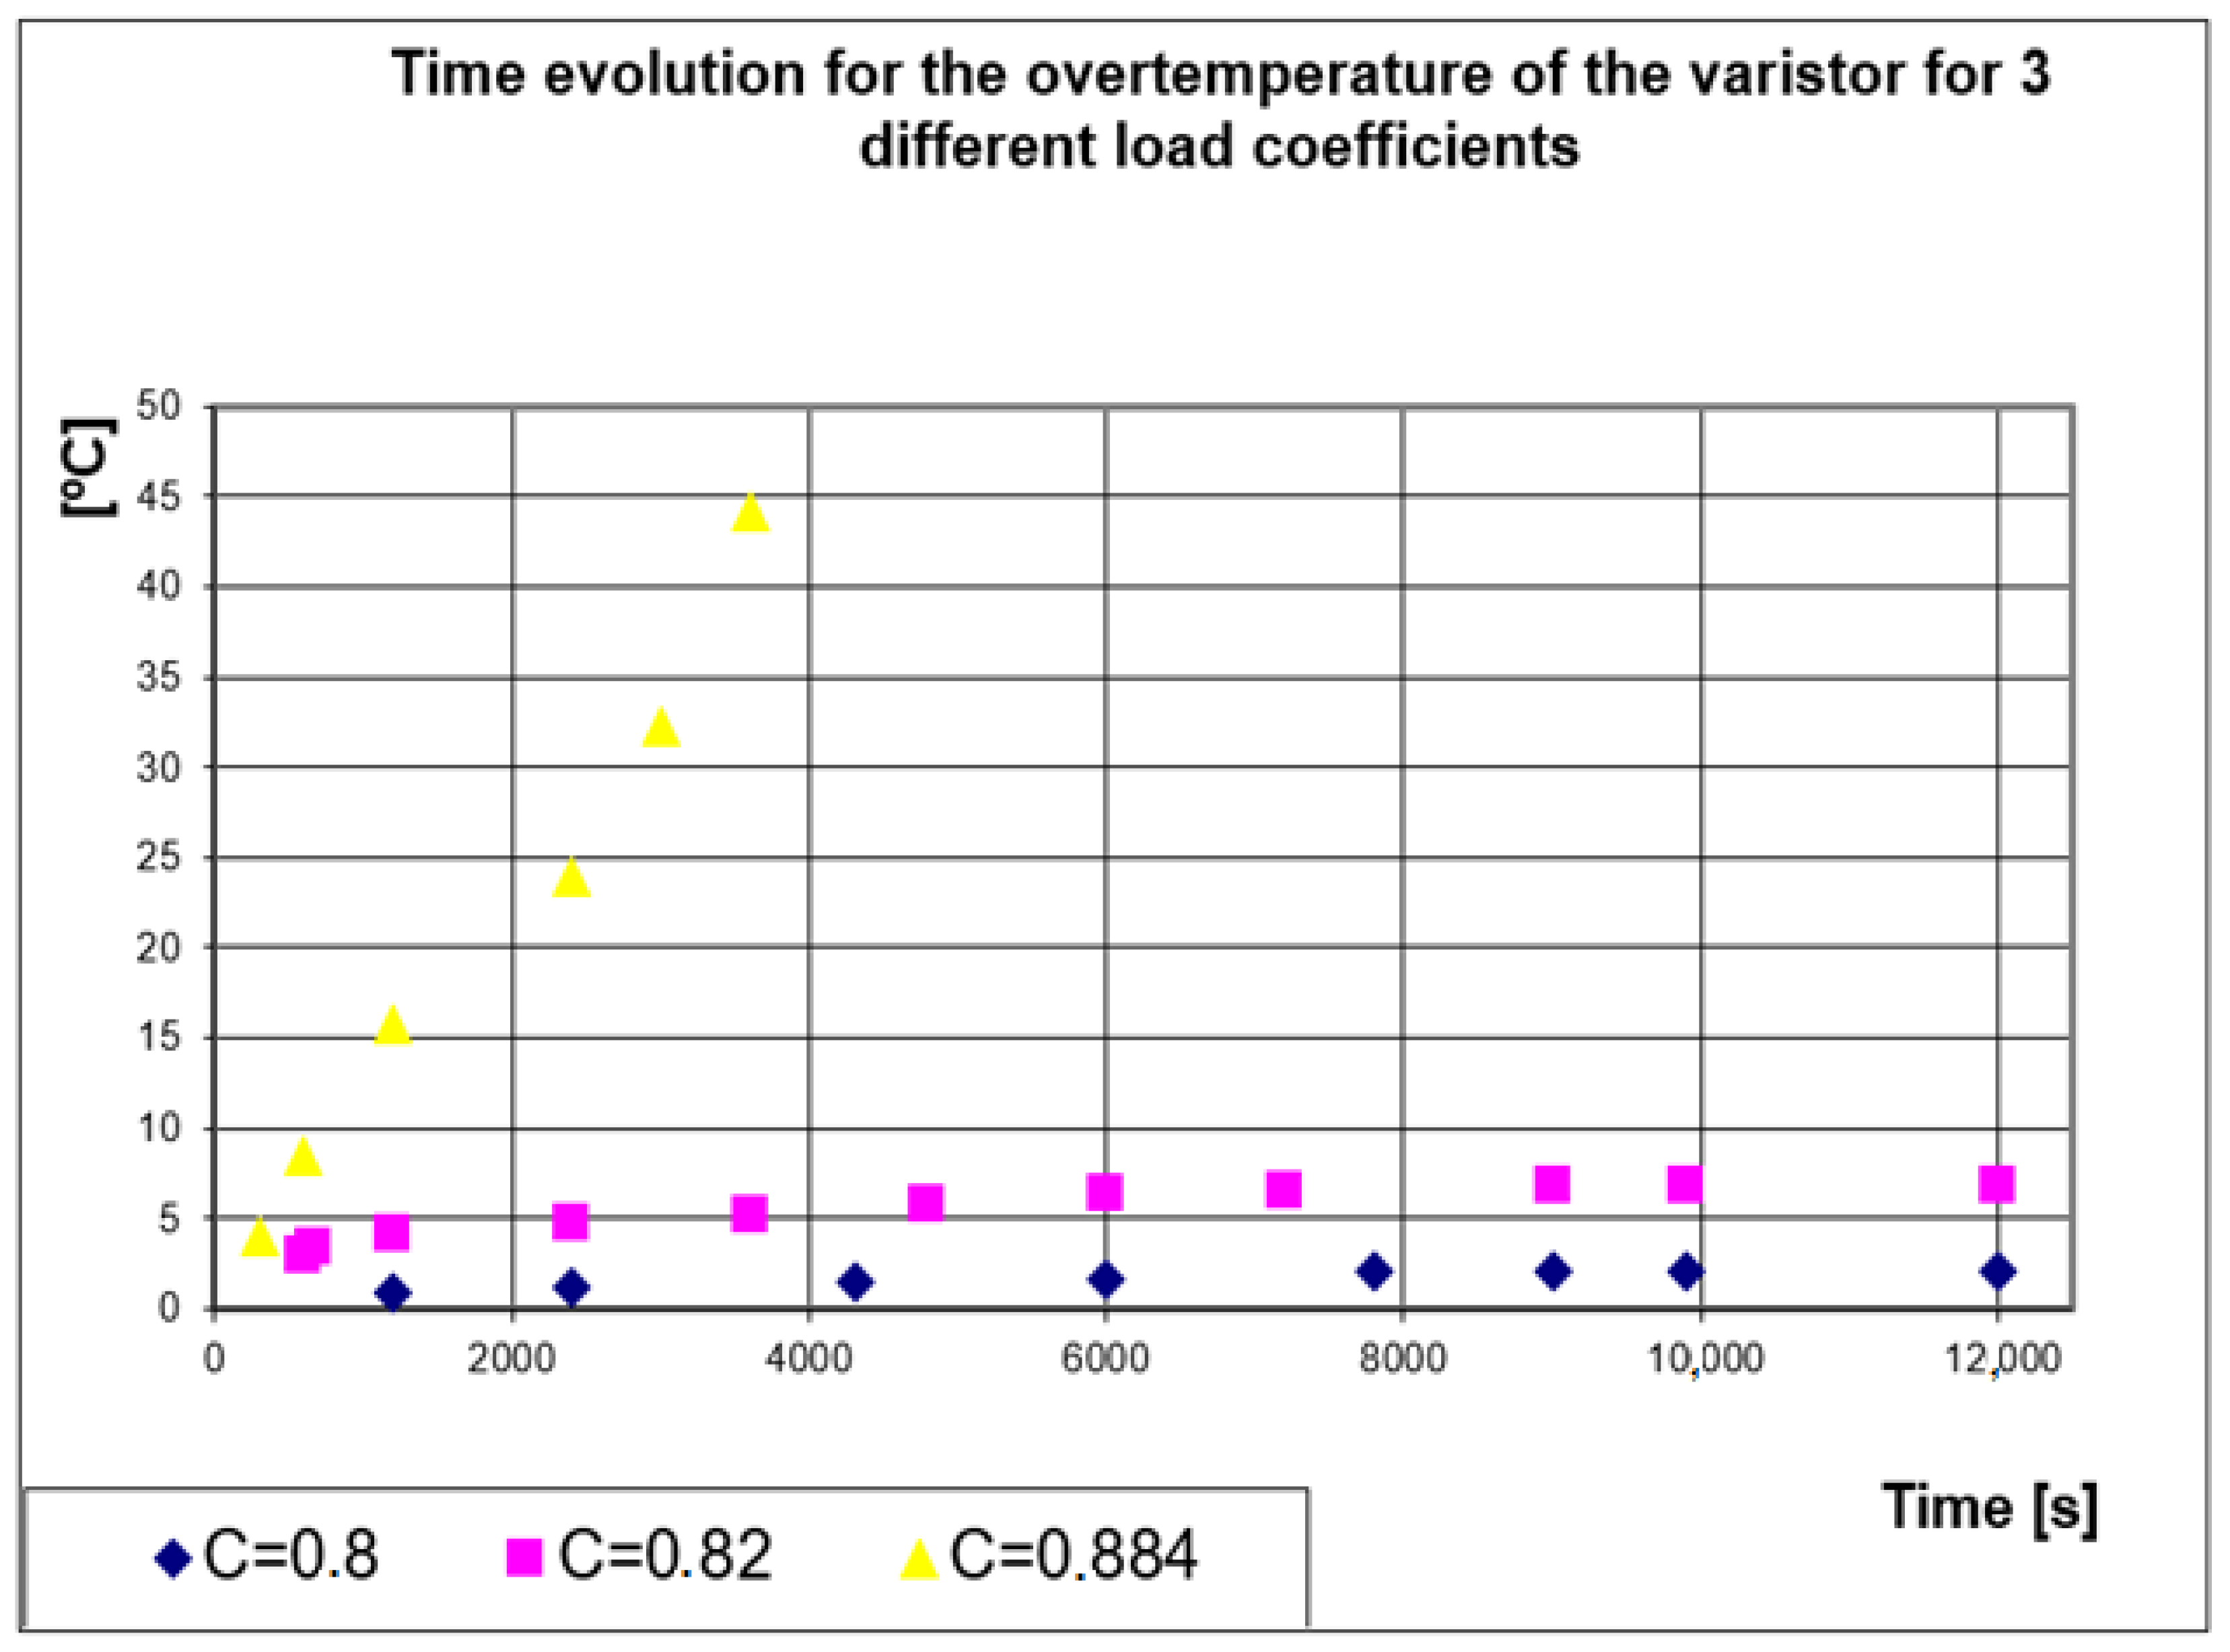
Figure 4 describes the time evolution of the MOV over-temperature for these three values of the load coefficient. In
Figure 4, we can notice that for that limit given load coefficient recommended by the manufacturer, (
C = 0.82), an equilibrium state is obtained, at a maximum over-temperature
τs = 6.8 °C.
In the case of an increased supply voltage (an increased load coefficient), at a constant ambient temperature, this stationary regime can no longer be reached. There is an uncontrolled increase of the temperature, in an avalanche [
20]—practically a thermal runaway.
This MOV was disconnected from the DC source after one hour (3600 s), when its overtemperature was 44.1 °C, to avoid its total destruction the time evolution of the current throughout that MOV. We can notice:
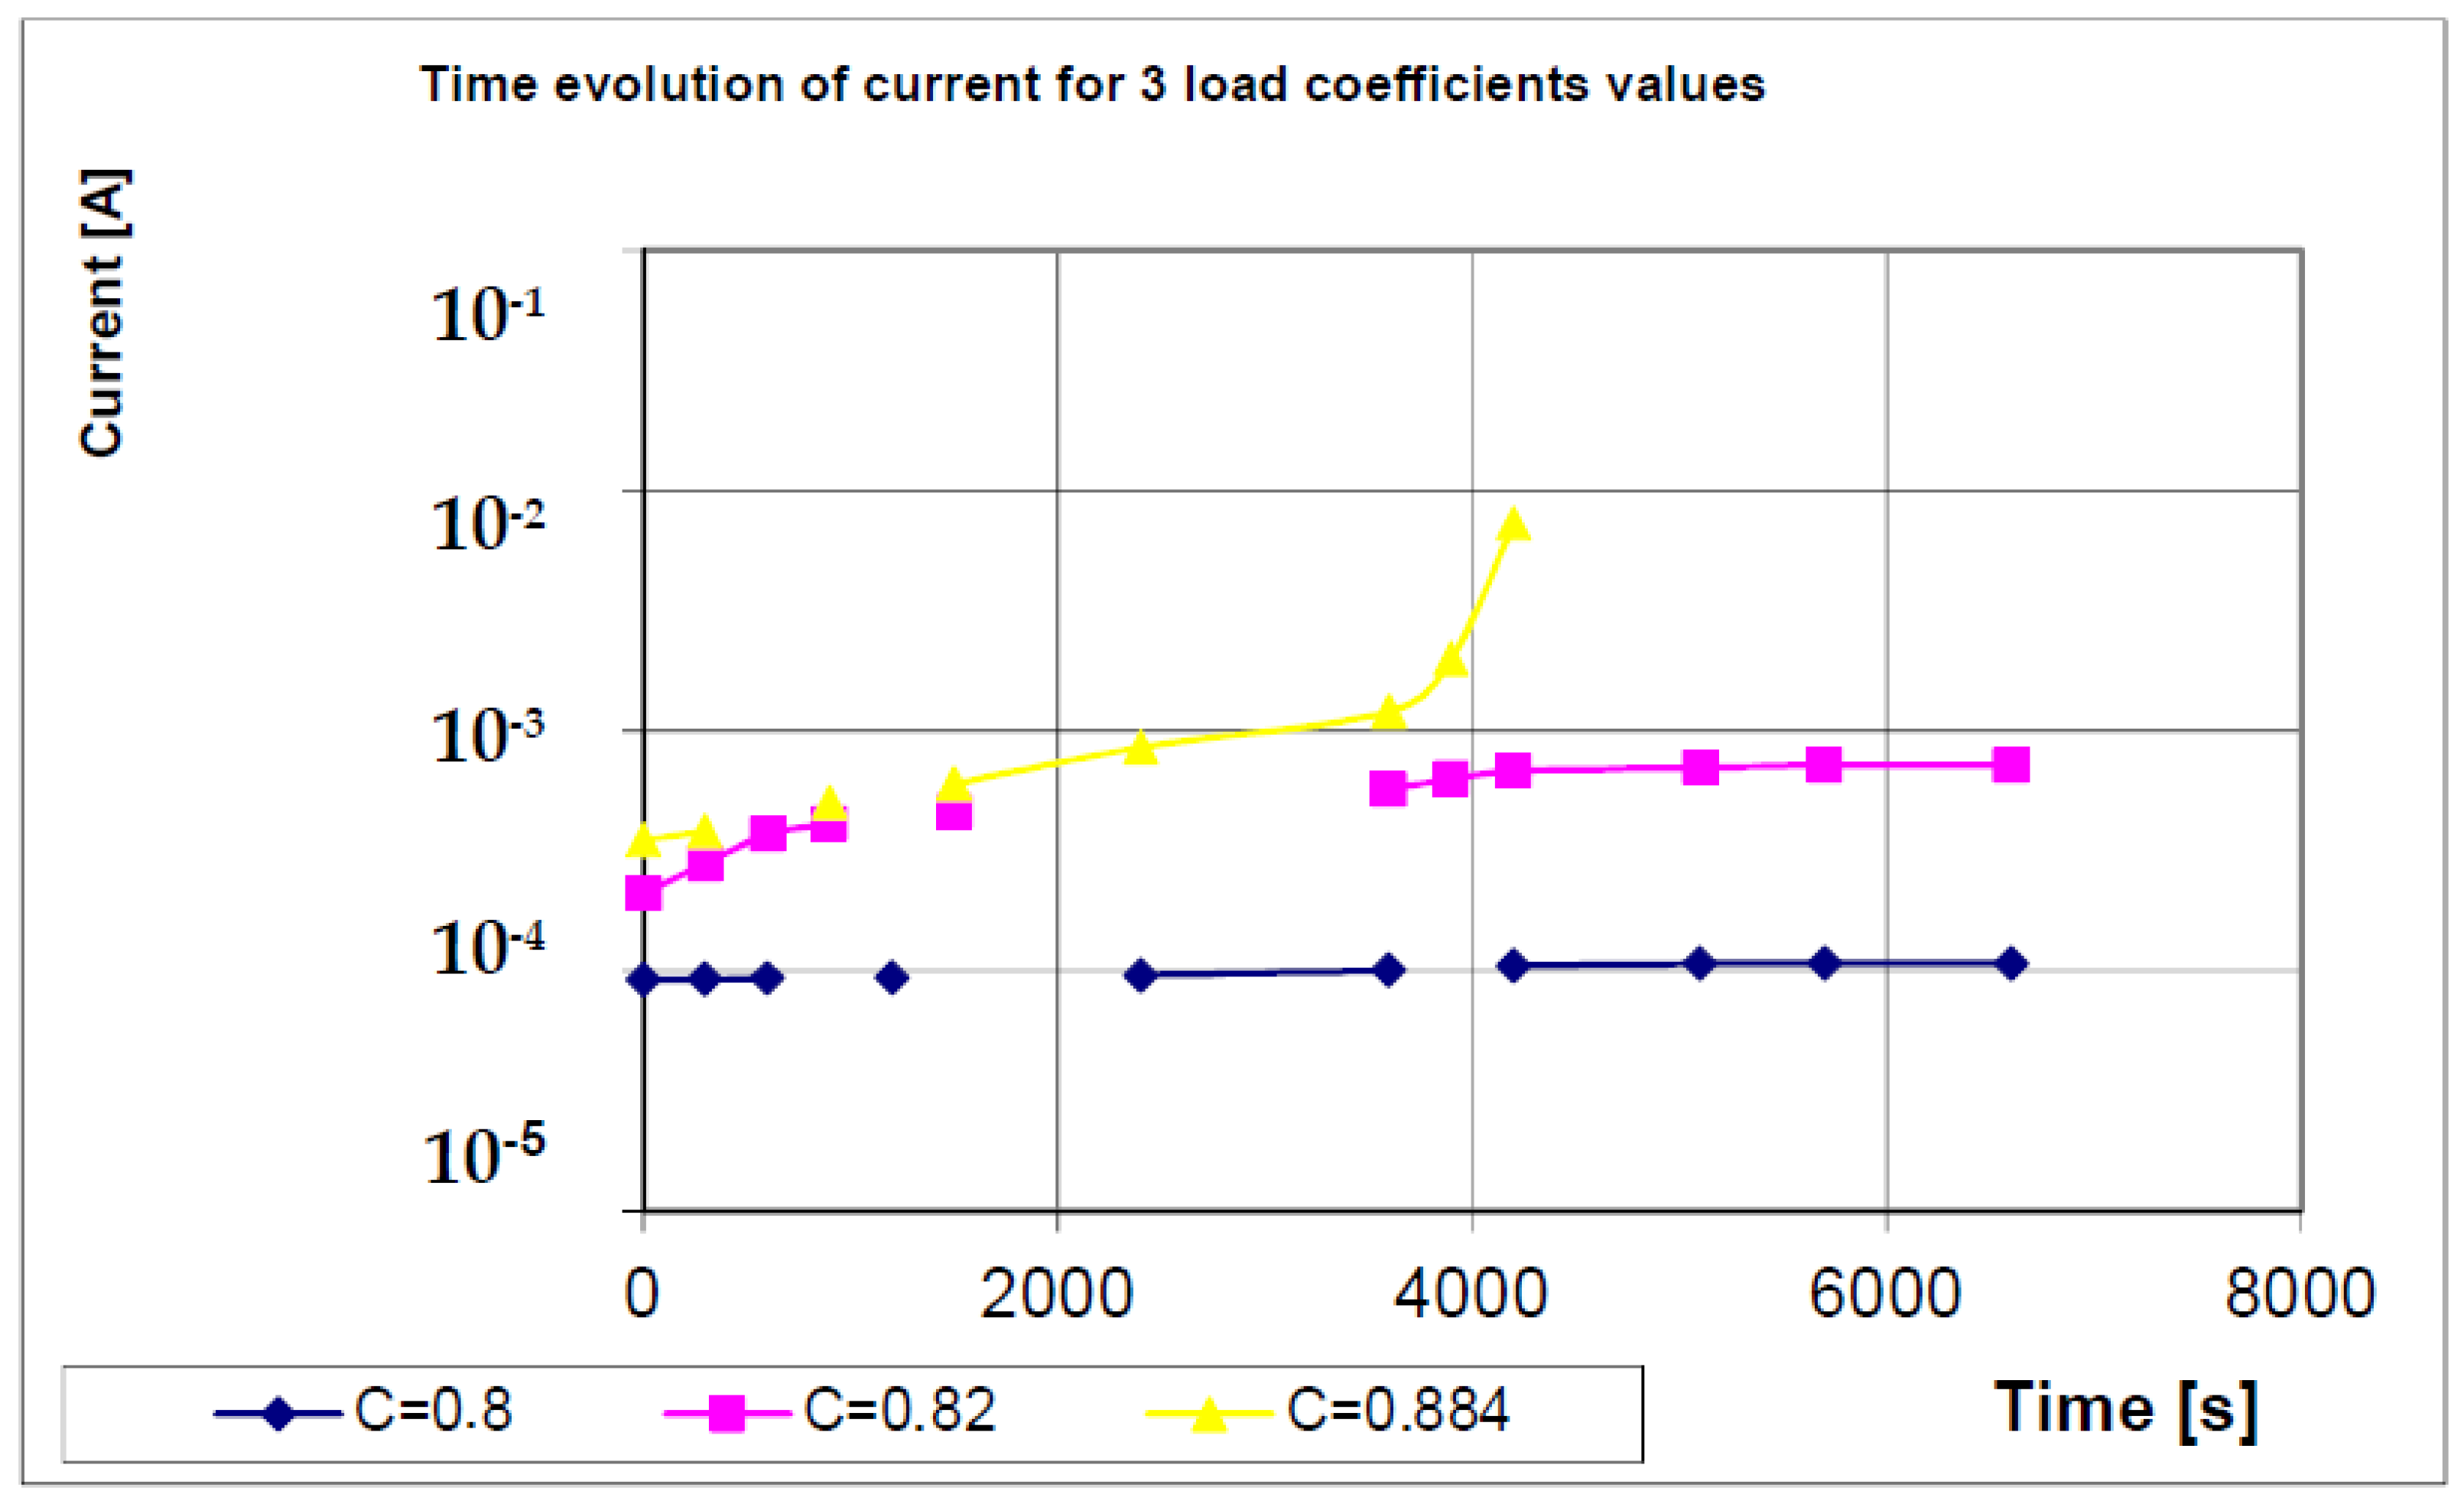
for a load coefficient C = 0.8, below the given limit C = 0.82, the value of the crossing current is almost constant over time, somewhere around 10−4 A;
for a load coefficient C = 0.884, slightly above the given limit, the current starts to increase exponentially (the current scale on vertical is logarithmic), due to the thermal runaway process.
Figure 5 shows the time evolution of the MOV crossing current for certain values located above and below the given limit of the load coefficient.
For the given load coefficient (
C = 0.82 i.e.,
U = 320
VDC), the crossing current is also stabilized around 7.1 × 10
−4 A, even if it starts to increase from a value of approx. 2 × 10
−4 A, according to the static electric characteristic
I (U), directly provided by the MOV manufacturer [
19].
We observe that the limit value of the load coefficient given by the manufacturer does not represent the measured value at which the previously defined critical current density is obtained, being slightly lower than this one [
20].
The critical (limit) current density appears, at an ambient temperature of 25 °C, in case of a load coefficient of approx.
0.83–0.85, depending on the dimensions of that MOV, according to (4), but also on the quality of the material [
21].
According to the experimental data available from the LAPLACE “Génie Electrique” Laboratory of the University “Paul Sabatier” in Toulouse and of some of our own determinations, for the varistor used we have the following parameters [
19]:
ρa = 3.6 × 10⁵ [Ω · m];
αR = 3 × 10⁻³ [°C−1];
d = 3 × 10⁻² [m].
At 25 °C, the thermal transmissivity coefficient is α ≈ 17 [W/(m
2 degree C)] [
22].
The critical current density, calculated according to (4), for the series of varistors with a diameter of approx. 30 mm, is:
Jcr = 1.448 [A/m2]
For this value of the critical current density, when applying a nominal voltage, under permanent service, we have a thermal runaway current: Iamb = Jcr · A ≈ 1.02 [mA].
When observing the critical current density Jcr, from relation (4) it can be noticed that it is highly influenced only by the heat dissipation conditions, by modifying α or by modifying the elementary diameter of the standard ZnO grain, with all specifications previously made.
The critical density value is the same for all series of MOVs having the same diameter, being different than the energy that can be absorbed; the energy is given by the volume of the varistor (by the different height of the ZnO grain) [
23].
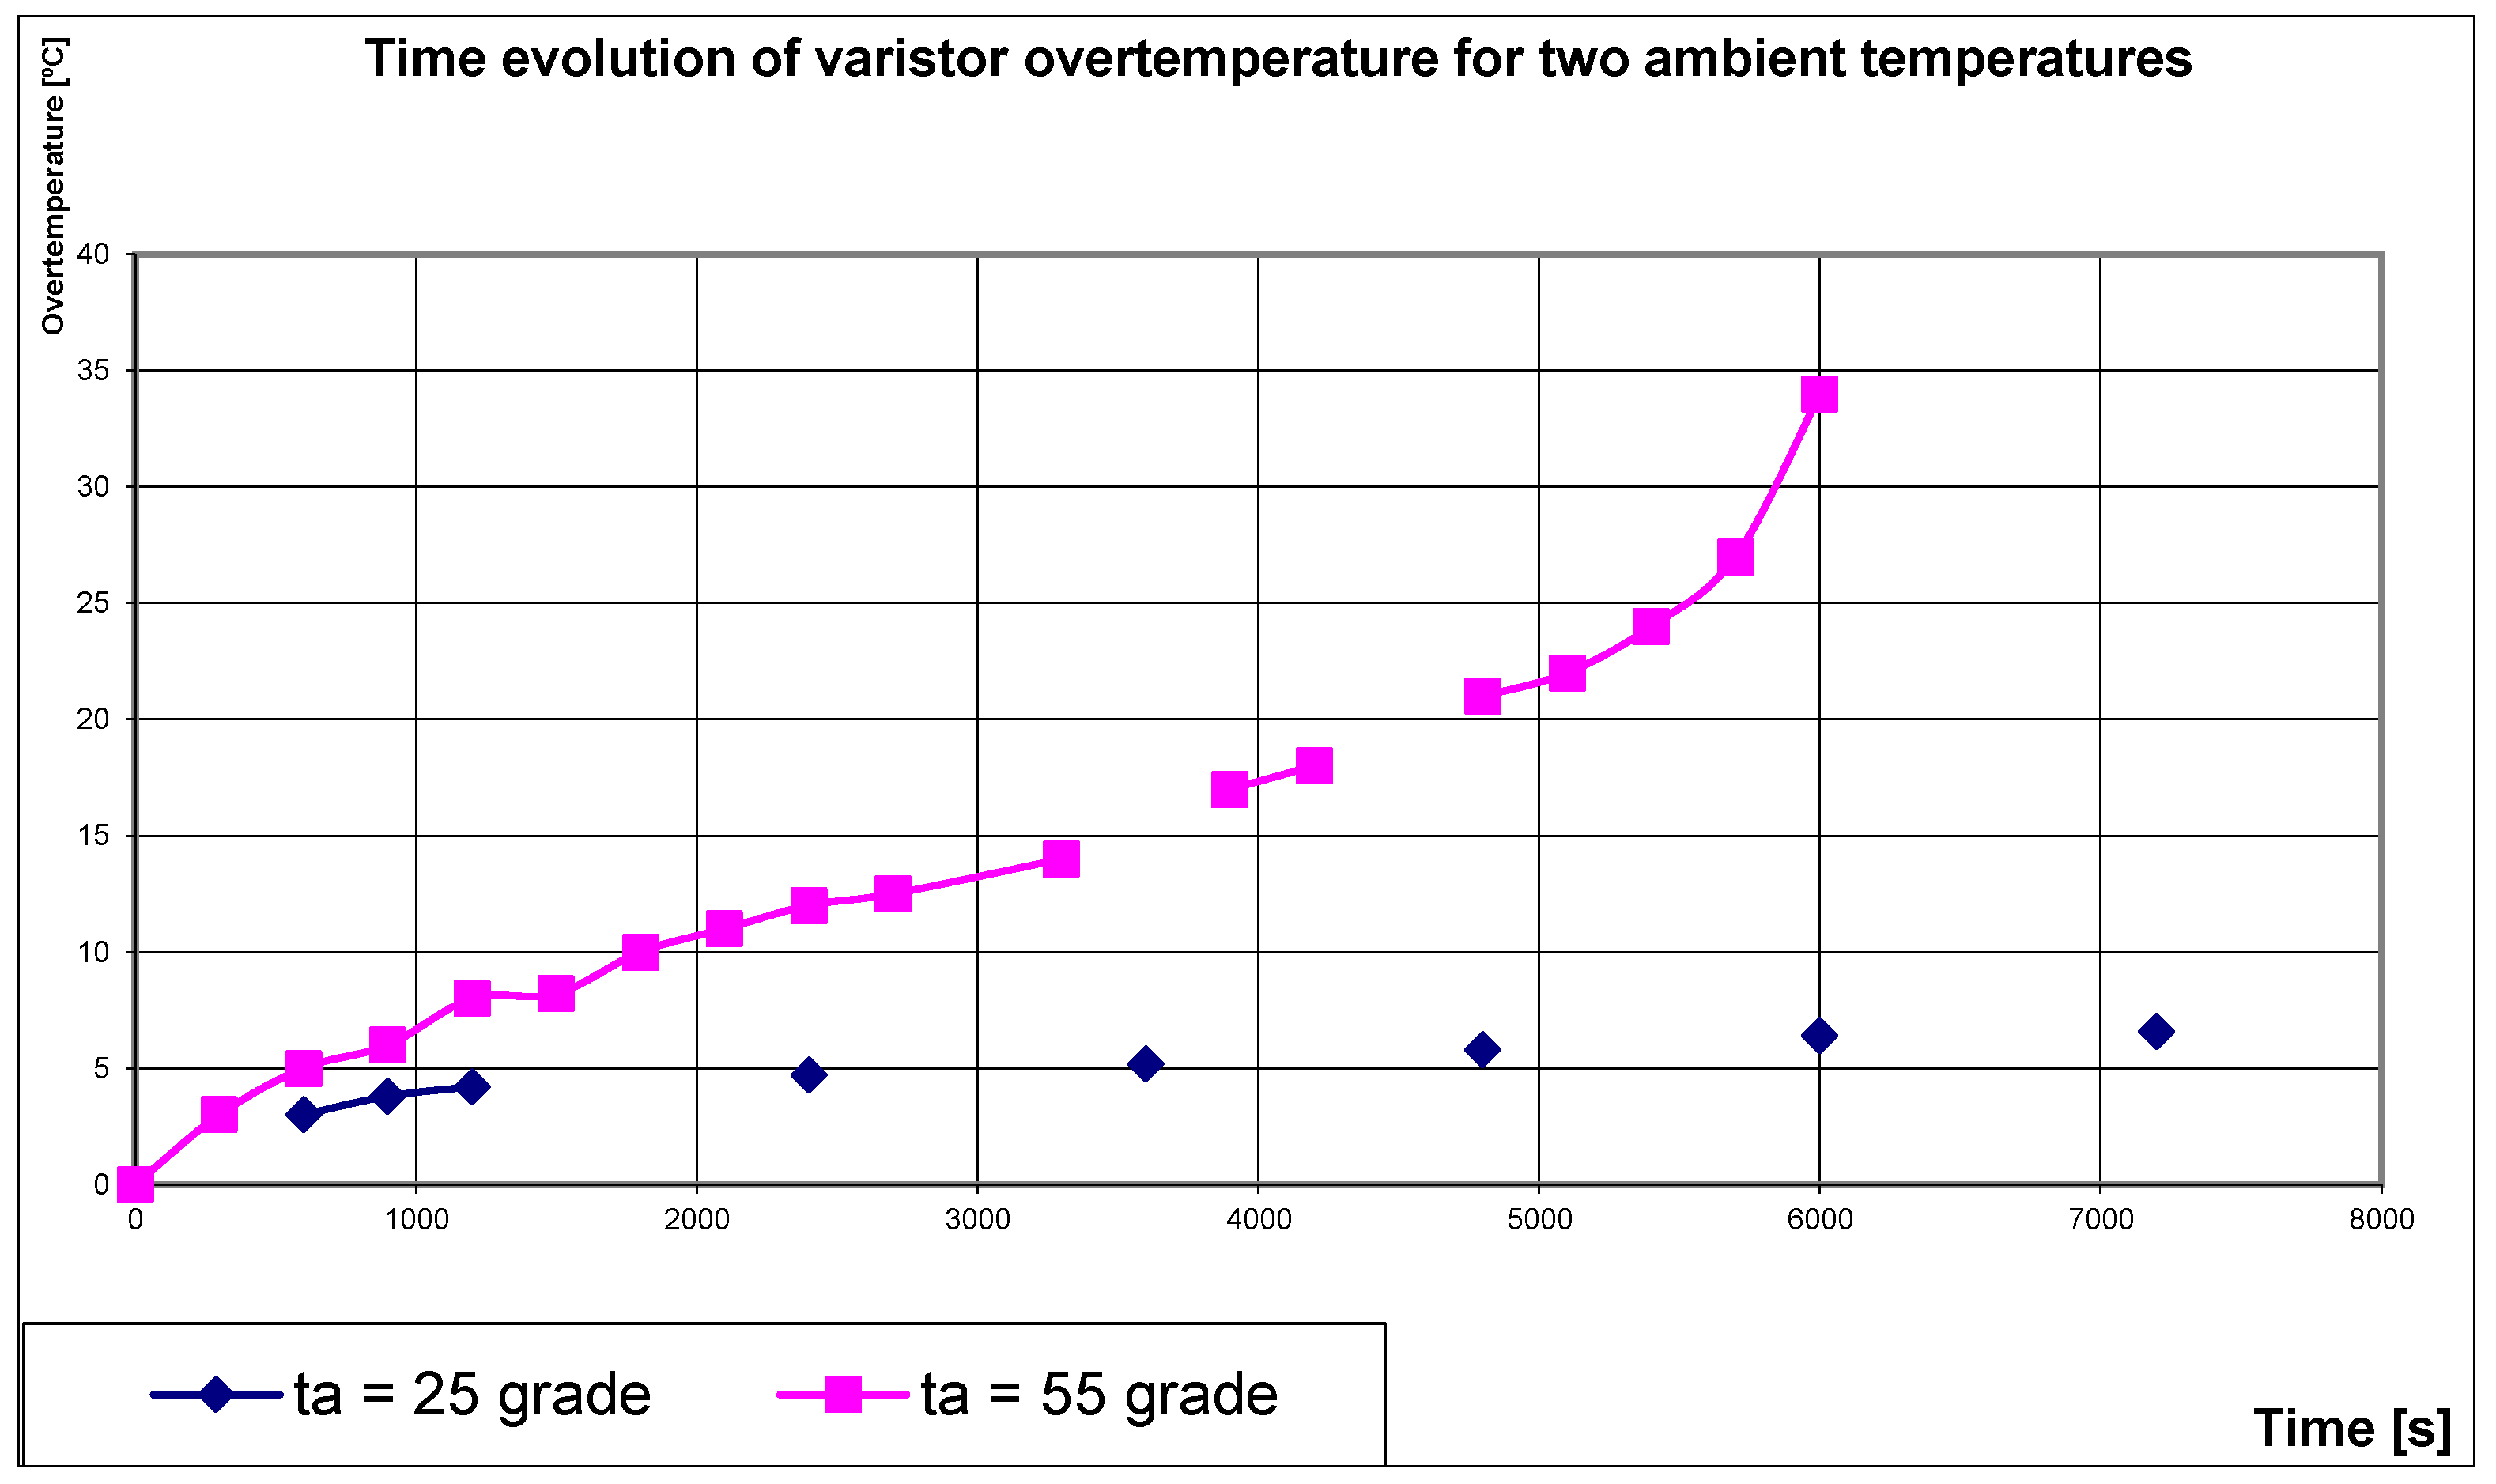
Figure 6 presents the time evolution of the MOV overtemperature for two different values of the ambient temperature,
θa = 25 °C and
θa = 55 °C.
All these measurements were performed on a constant 320 VDC voltage, corresponding to the given limit value indirectly provided by the manufacturer as C = 0.82.
The first value is located below the limit value of the ambient temperature, and the second is located above that value. That limit value of the ambient temperature beyond which the thermal runaway occurs, for a load coefficient C = 0.8, is around 40–45 °C. In the case of a continuous operation, at a low rated voltage (C < 0.65) there is no thermal runaway risk; the manufacturer is guaranteeing the varistor up to θa = 85 °C.
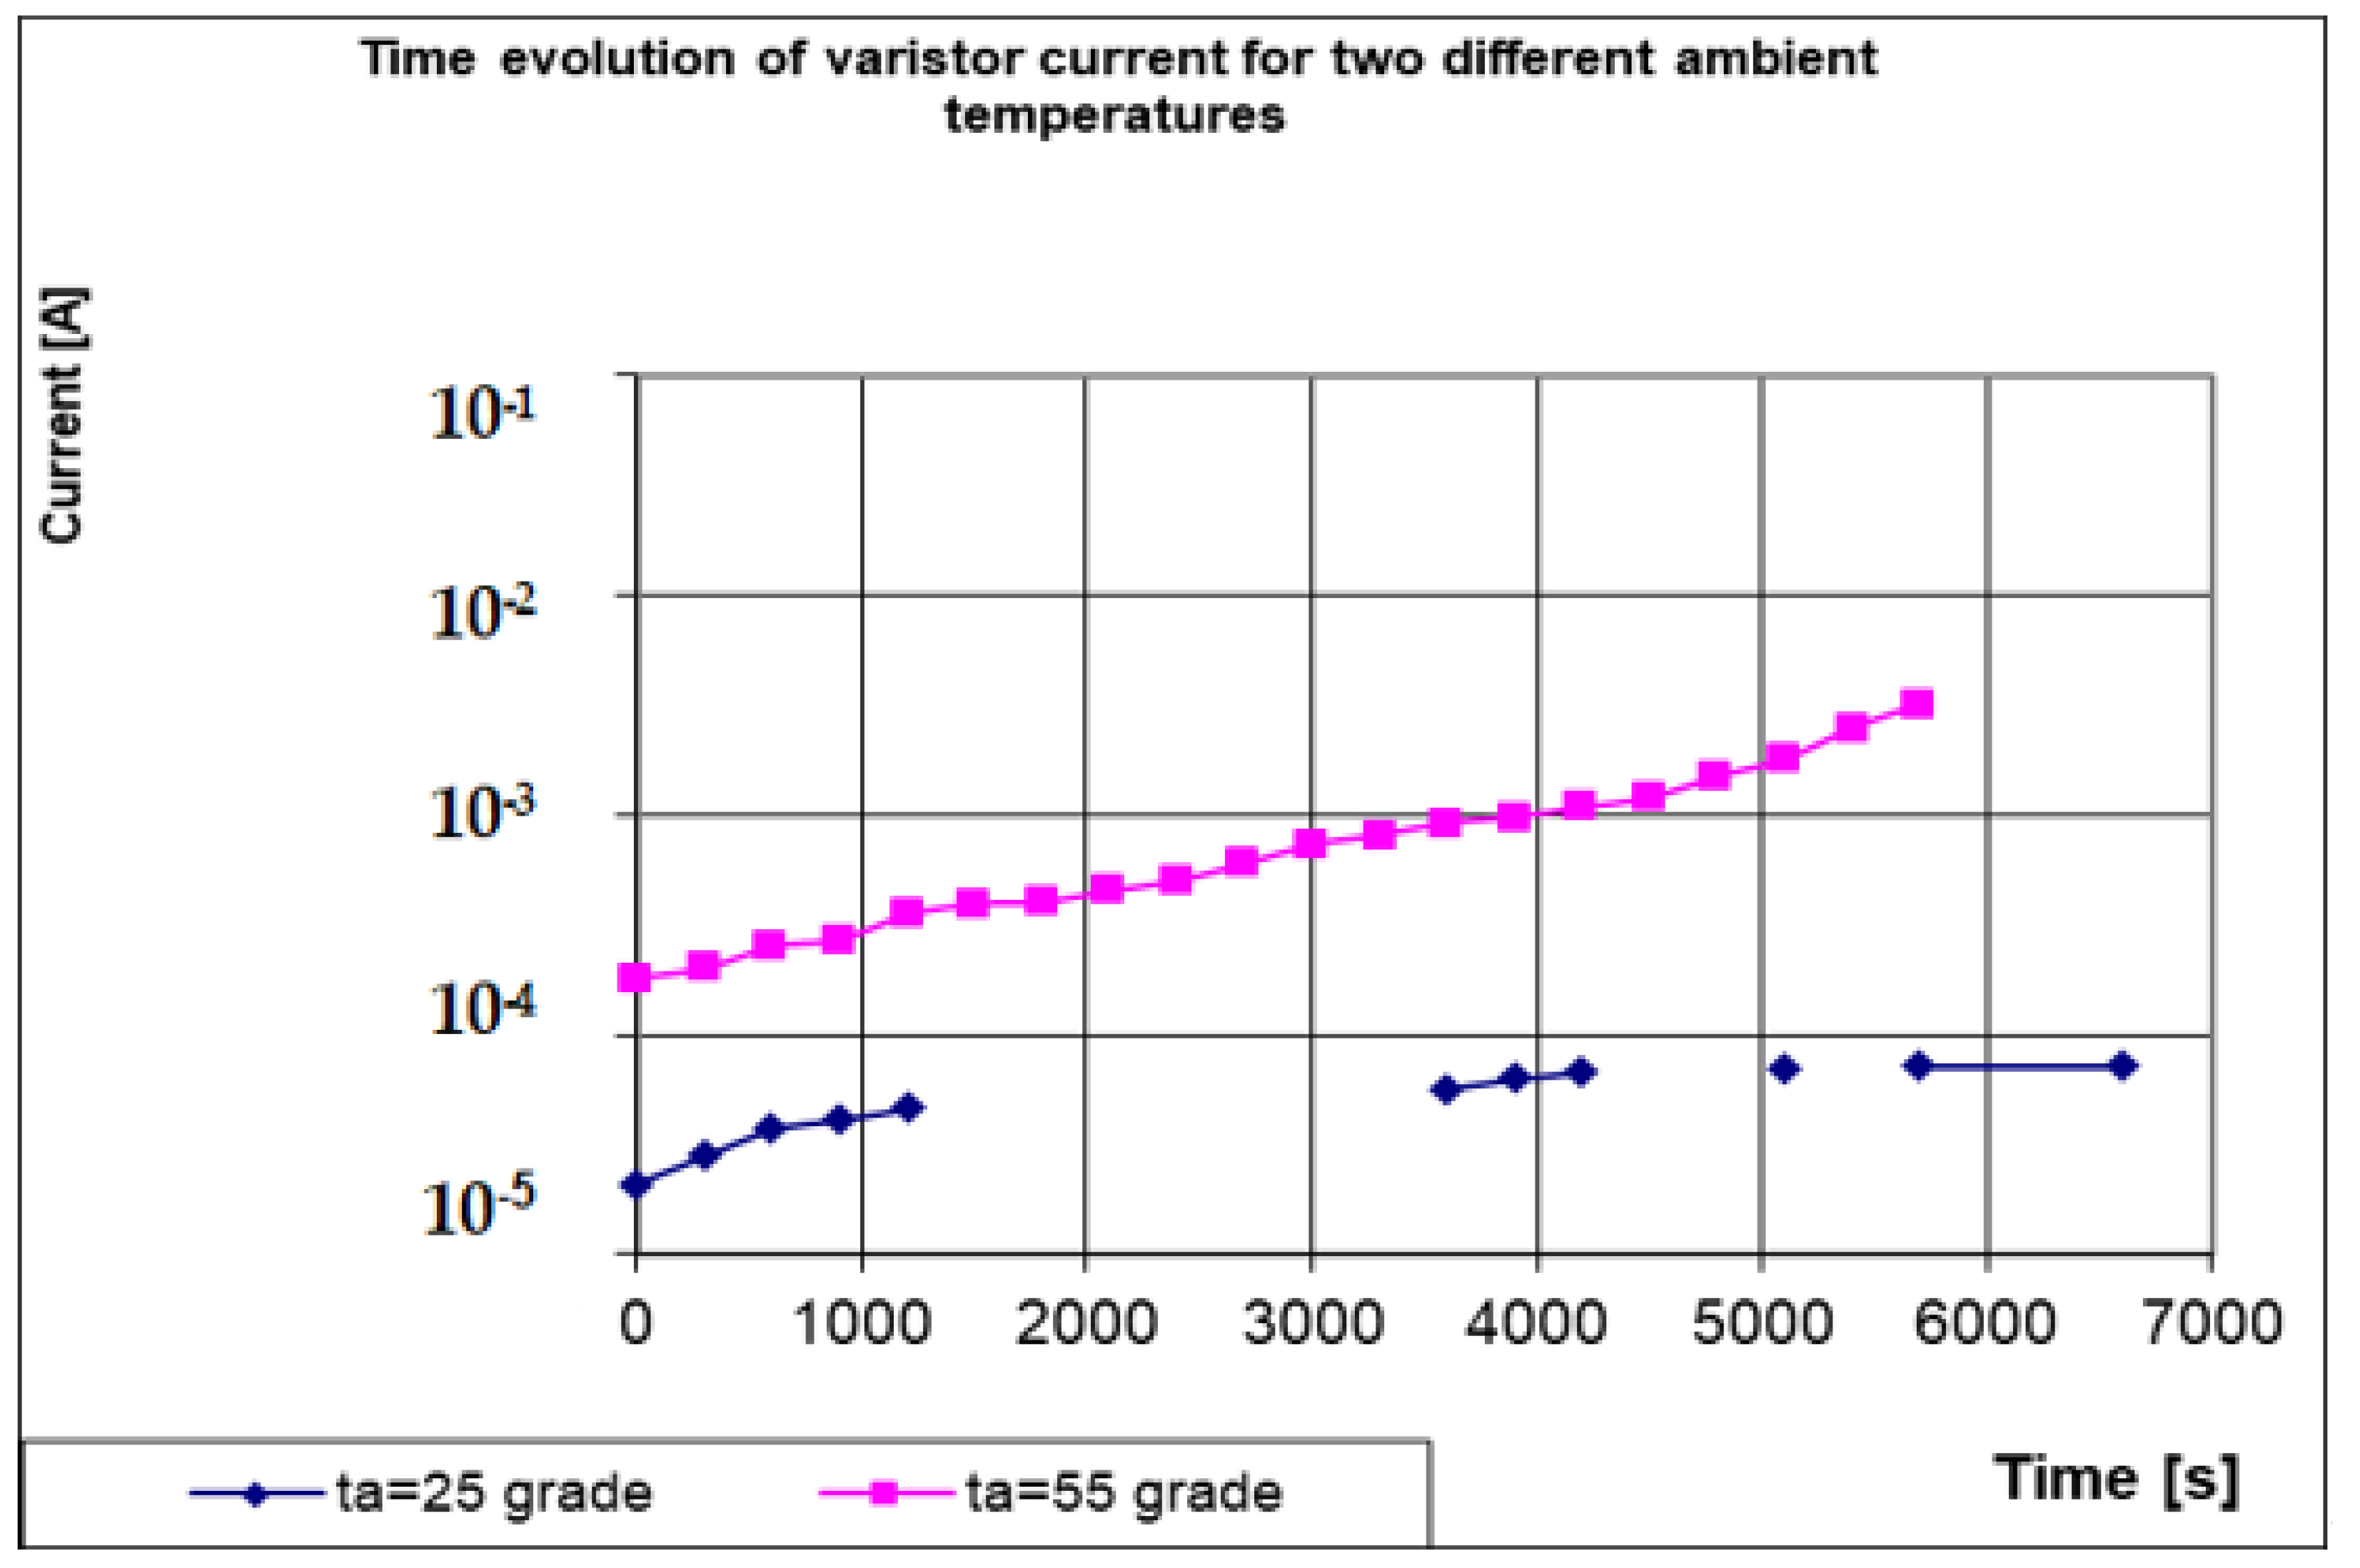
The time evolution of the MOV current is presented in
Figure 7, having the two values of the ambient temperature as parameters.
In this case, we noticed that the thermal runaway also appears at a smaller load coefficient of C = 0.8, due to the increased ambient temperature. That critical load coefficient, related to the thermal runaway, is measured as C = 0.75 for a 55 °C temperature.
They demonstrate the evolution of the temperature towards thermal runaway for a higher environmental temperature or towards a stable equilibrium at normal temperatures.
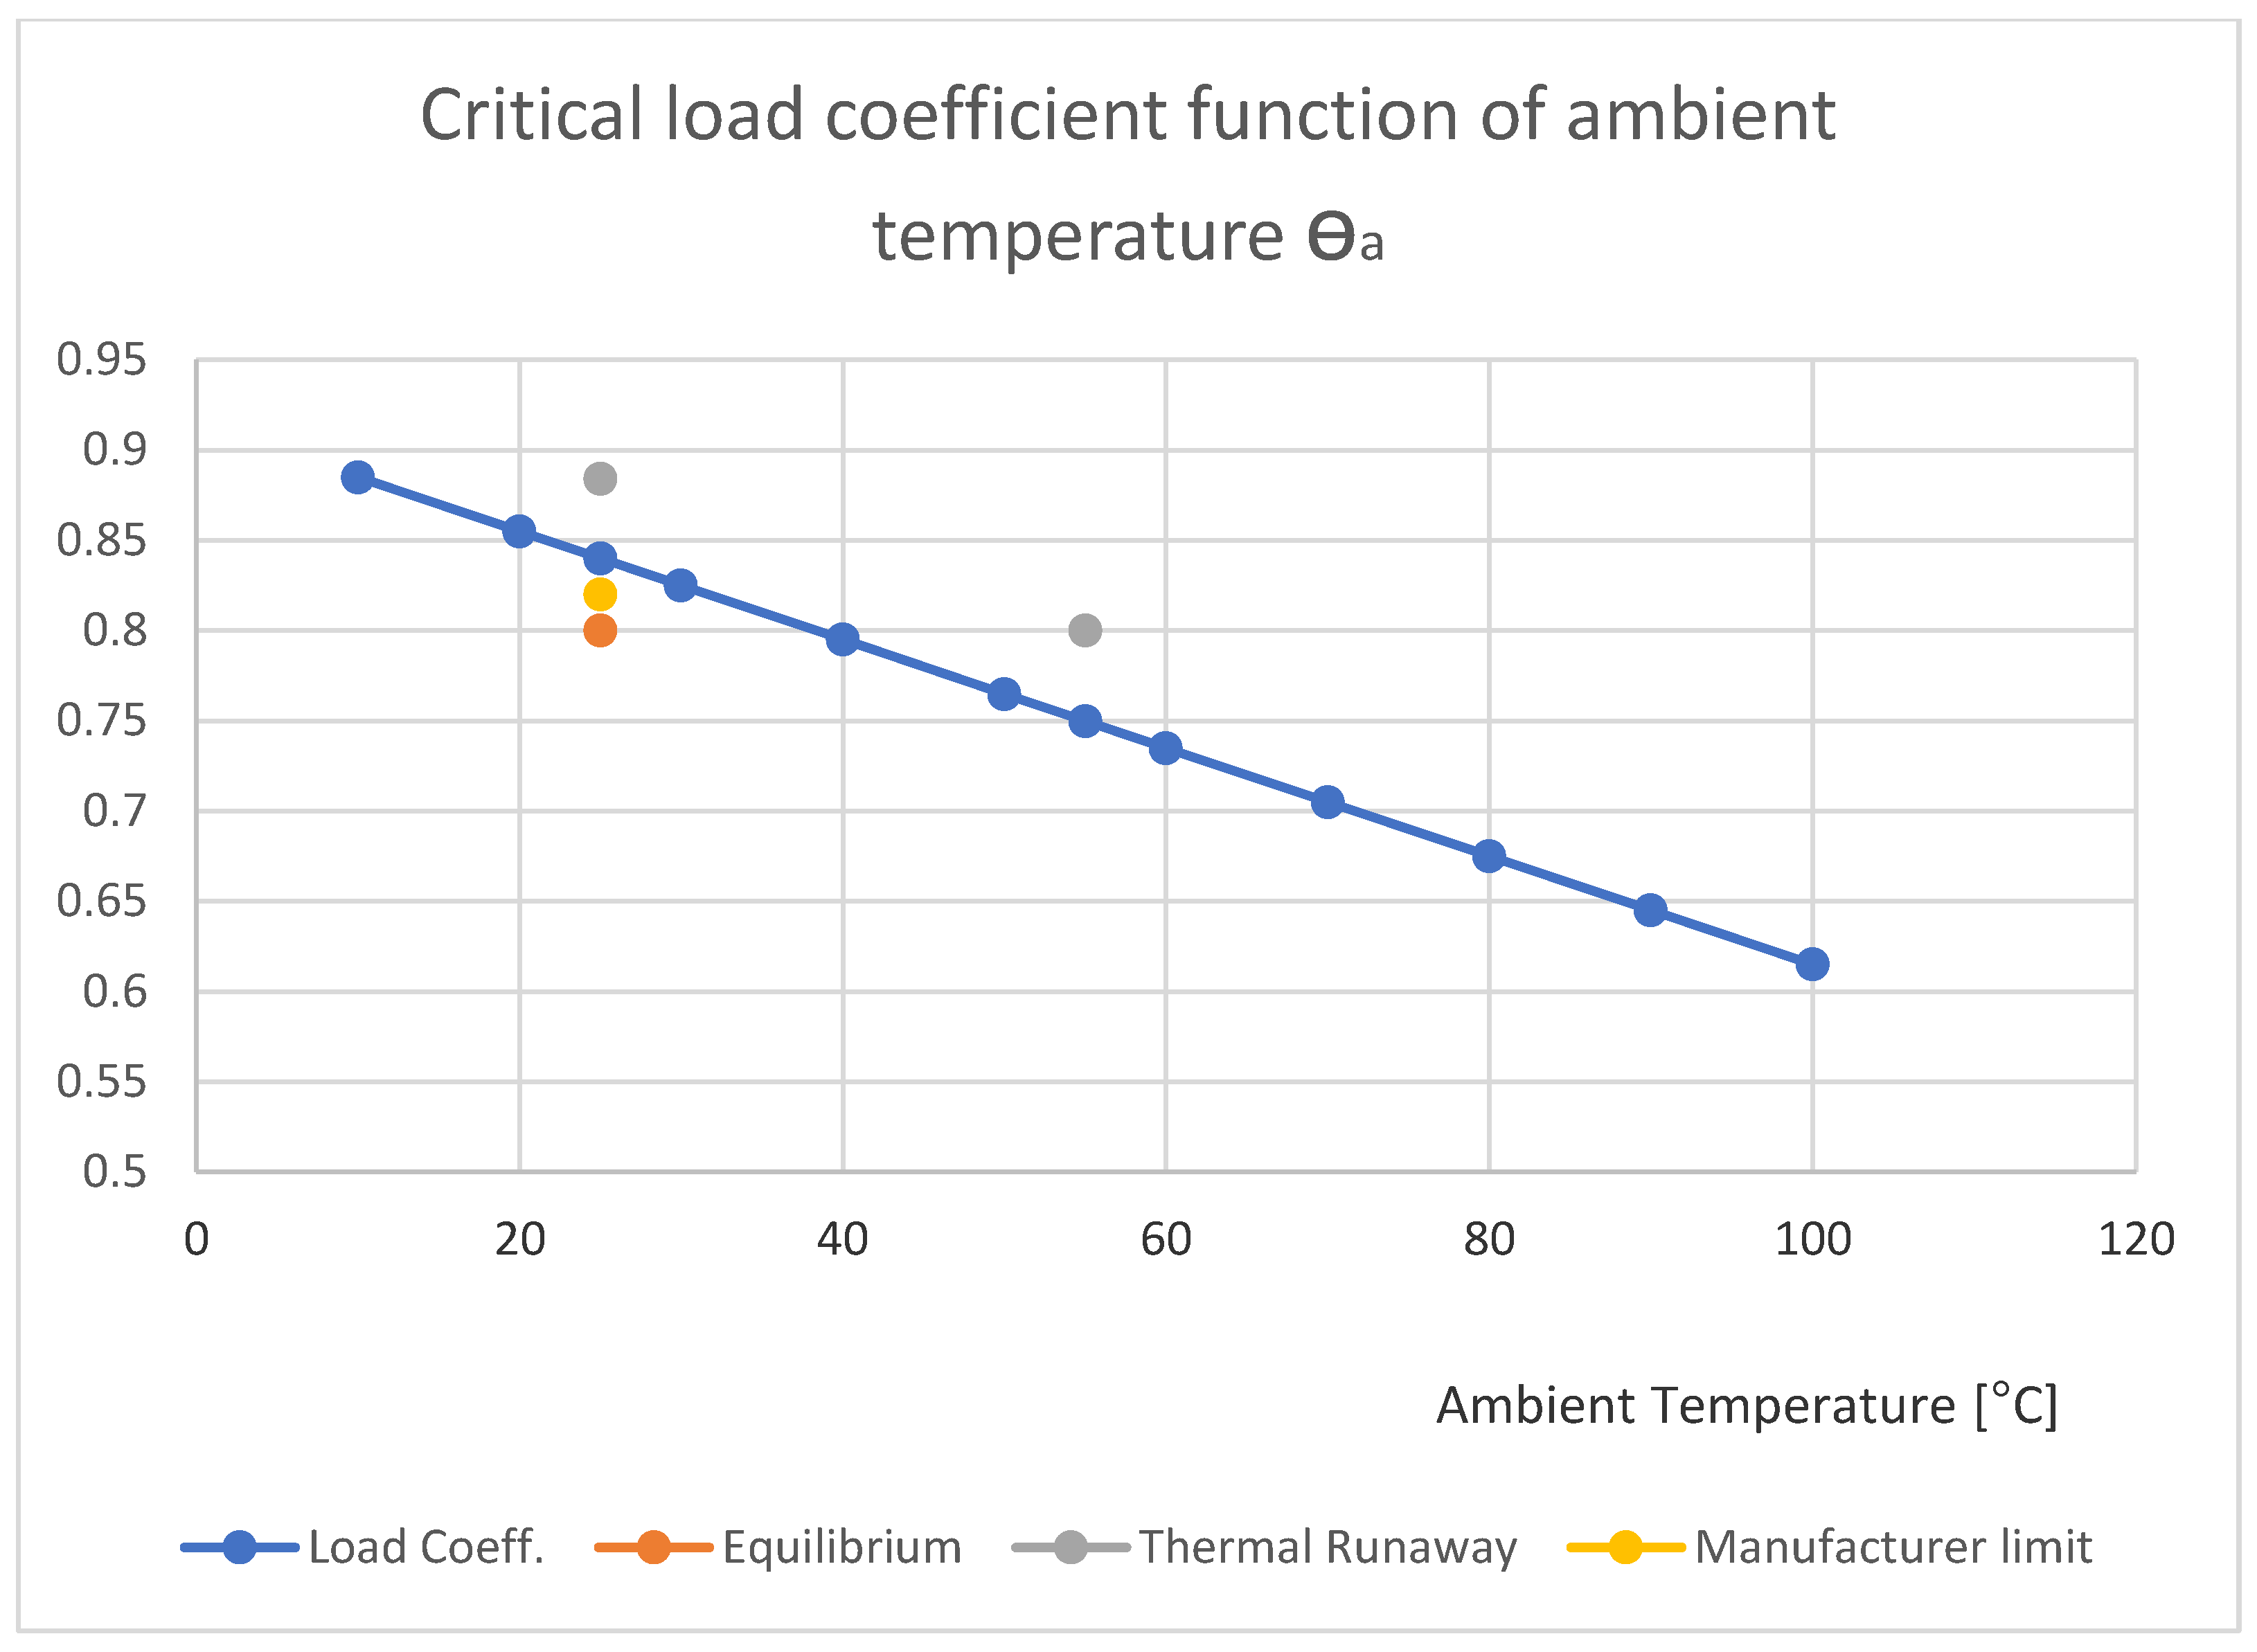
We observed that:
for a θa = 25 °C,—Ccr = 0.84;
for a θa = 55 °C,—Ccr = 0.75;
As a first conclusion, we can predict, following the experimental measurements, that the critical values of that load coefficient have a simple linear dependence function related to the ambient temperature. That line of the critical values passes through these two points previously obtained, yielding this equation:
This line is directly represented in
Figure 8. In the case of the coordinate points (
C, θa) located above it, the thermal runaway at the applied voltage and the ambient temperature is probably appearing, and for the coordinate points (
C, θa) located below this line, the thermal runaway will not occur, and the current critical density is not exceeded.
The points previously obtained from the measurements are also figured.
In case of larger cylindrical varistors, designed to operate at higher voltages, this equation could be approximated as non-linear due to the fact that heat is absorbed, and dissipated easy and over-temperatures are slightly reduced. This will be the object of another future study.
The linear dependence is confirmed by the reality, totally verified on our set of MOVs.
Figure 8 provides a simple method for establishing the functional limits of that varistor. It is essential for this study. It provides the maximum load coefficient for each ambient temperature. On the upper part of the line, there is a major risk of overheating. Below that line, there are equilibrium points where heat produced is totally dissipated.
Knowing the service limits for a certain varistor included into protection equipment is important in order to obtain maximum performance and safety for long-term use of that protection equipment.
It offers to the surge arrester or varistor designer an answer to the question “What is the maximum voltage at which a varistor in permanent service mode can operate at a certain value of ambient temperature?”.
The answer to this question is never explicitly provided by the MOV manufacturer. This aspect is essential, if the surge protection equipment that encloses the MOV is the capsulated version and/or is exposed to sun or other heat sources.
The climate related operational parameters of MOVs are given by the IEC 68-1, IEC 68-2-3, and CECC 42,000 standards, containing general specifications concerning the limits of the ambient temperature during operation times and off-line storage of MOVs.
Normally, the ambient temperature of the varistor storage should not exceed, in case of standard low voltage varistors, 60 to 70 °C. Certain issues could appear in case of capsulated equipment stored outside in hot sunny days, directly exposed to heat and solar radiation, or in tropical locations during intensive service periods.
Certain MOV manufacturers are providing some information about computing a coefficient of adjusting the operating voltage as function of temperature, valid only on a reduced temperature range. This specification is given purely empirically and not regulated by any standards.
Due to the complexity of all mechanisms and models which are trying, in a certain way, to explain the variation low for the supply voltage (load coefficient) limit as function of the ambient temperature, this expression could only be verified experimentally by means of a certain empiric procedure.
The evaluation of the thermal stability of the varistor in a permanent service regime is only a necessary first step in the evaluation of the global thermal stability. The whole thermal stability must be assessed in all regimes, including a permanent one, like previously, but also in the case of transitory regimes, which are causing more issues concerning the overheating and reliability.
3.2. Measurements in Pulse Service Regime
Another situation in which it is possible for thermal runaway to occur is a discharging of the energy of the overvoltage wave through a varistor. As a result, the assessment of thermal stability must be made globally, considering this emergency service regime.
Under the action of discharge currents, overvoltage production, the thermal stress of the varistor (varistor column) is characterized by the following features:
High current density, much higher than in the nominal operating mode, when it is subjected only to the nominal voltage of the installation.
The overload process is short-term, the discharge current through the varistor being reduced to the value of the leakage current If (at Un), after the elimination of the overvoltage wave. In reality, the steady state current that occurs shortly after the pulse wave passes is higher than If due to the increase in the temperature of the varistor following the pulse;
The variation of the current in time is complex and takes place in a very short time;
Electrical resistance (and therefore resistivity) varies within very wide limits (several orders of magnitude) during discharge.
There is also the issue of mathematically modeling the temperature repartition field during the pulse application. This model is particularly difficult to implement, due to the large range of variation of the parameters which are involved. Consequently, we can only consider the augmentation in the temperature of that MOV after the passage of the current pulse wave.
Generally, the current pulse wave passage, accompanied by the conversion of electricity into heat, is a purely adiabatic process, and the MOV has no time to transfer heat to the environment by convection or radiation.
We can notice, without error, that all the energy of the impulse is accumulated as heat in the mass of the varistor, inevitably leading to an increase in its temperature.
This heat must be evacuated from the mass of the varistor, because, as we have shown above, the increase in the temperature of the varistor favors electrical conduction and leads to the entry of the varistor into thermal runaway mode, with well-known consequences. The evacuation of this heat is done mostly by convection and not by radiation and conduction.
It is mandatory to determine the measures that must be applied to avoid any risk of thermal runaway of the MOV in the operating mode that is established after the application of the pulse, in order to ensure an optimal design of a surge protection equipment [
2].
As a result, we can speak of the thermal stability of the varistor in two cases:
We will further try to define the essence and the limits of these concepts starting from the evaluation of the thermal balance.
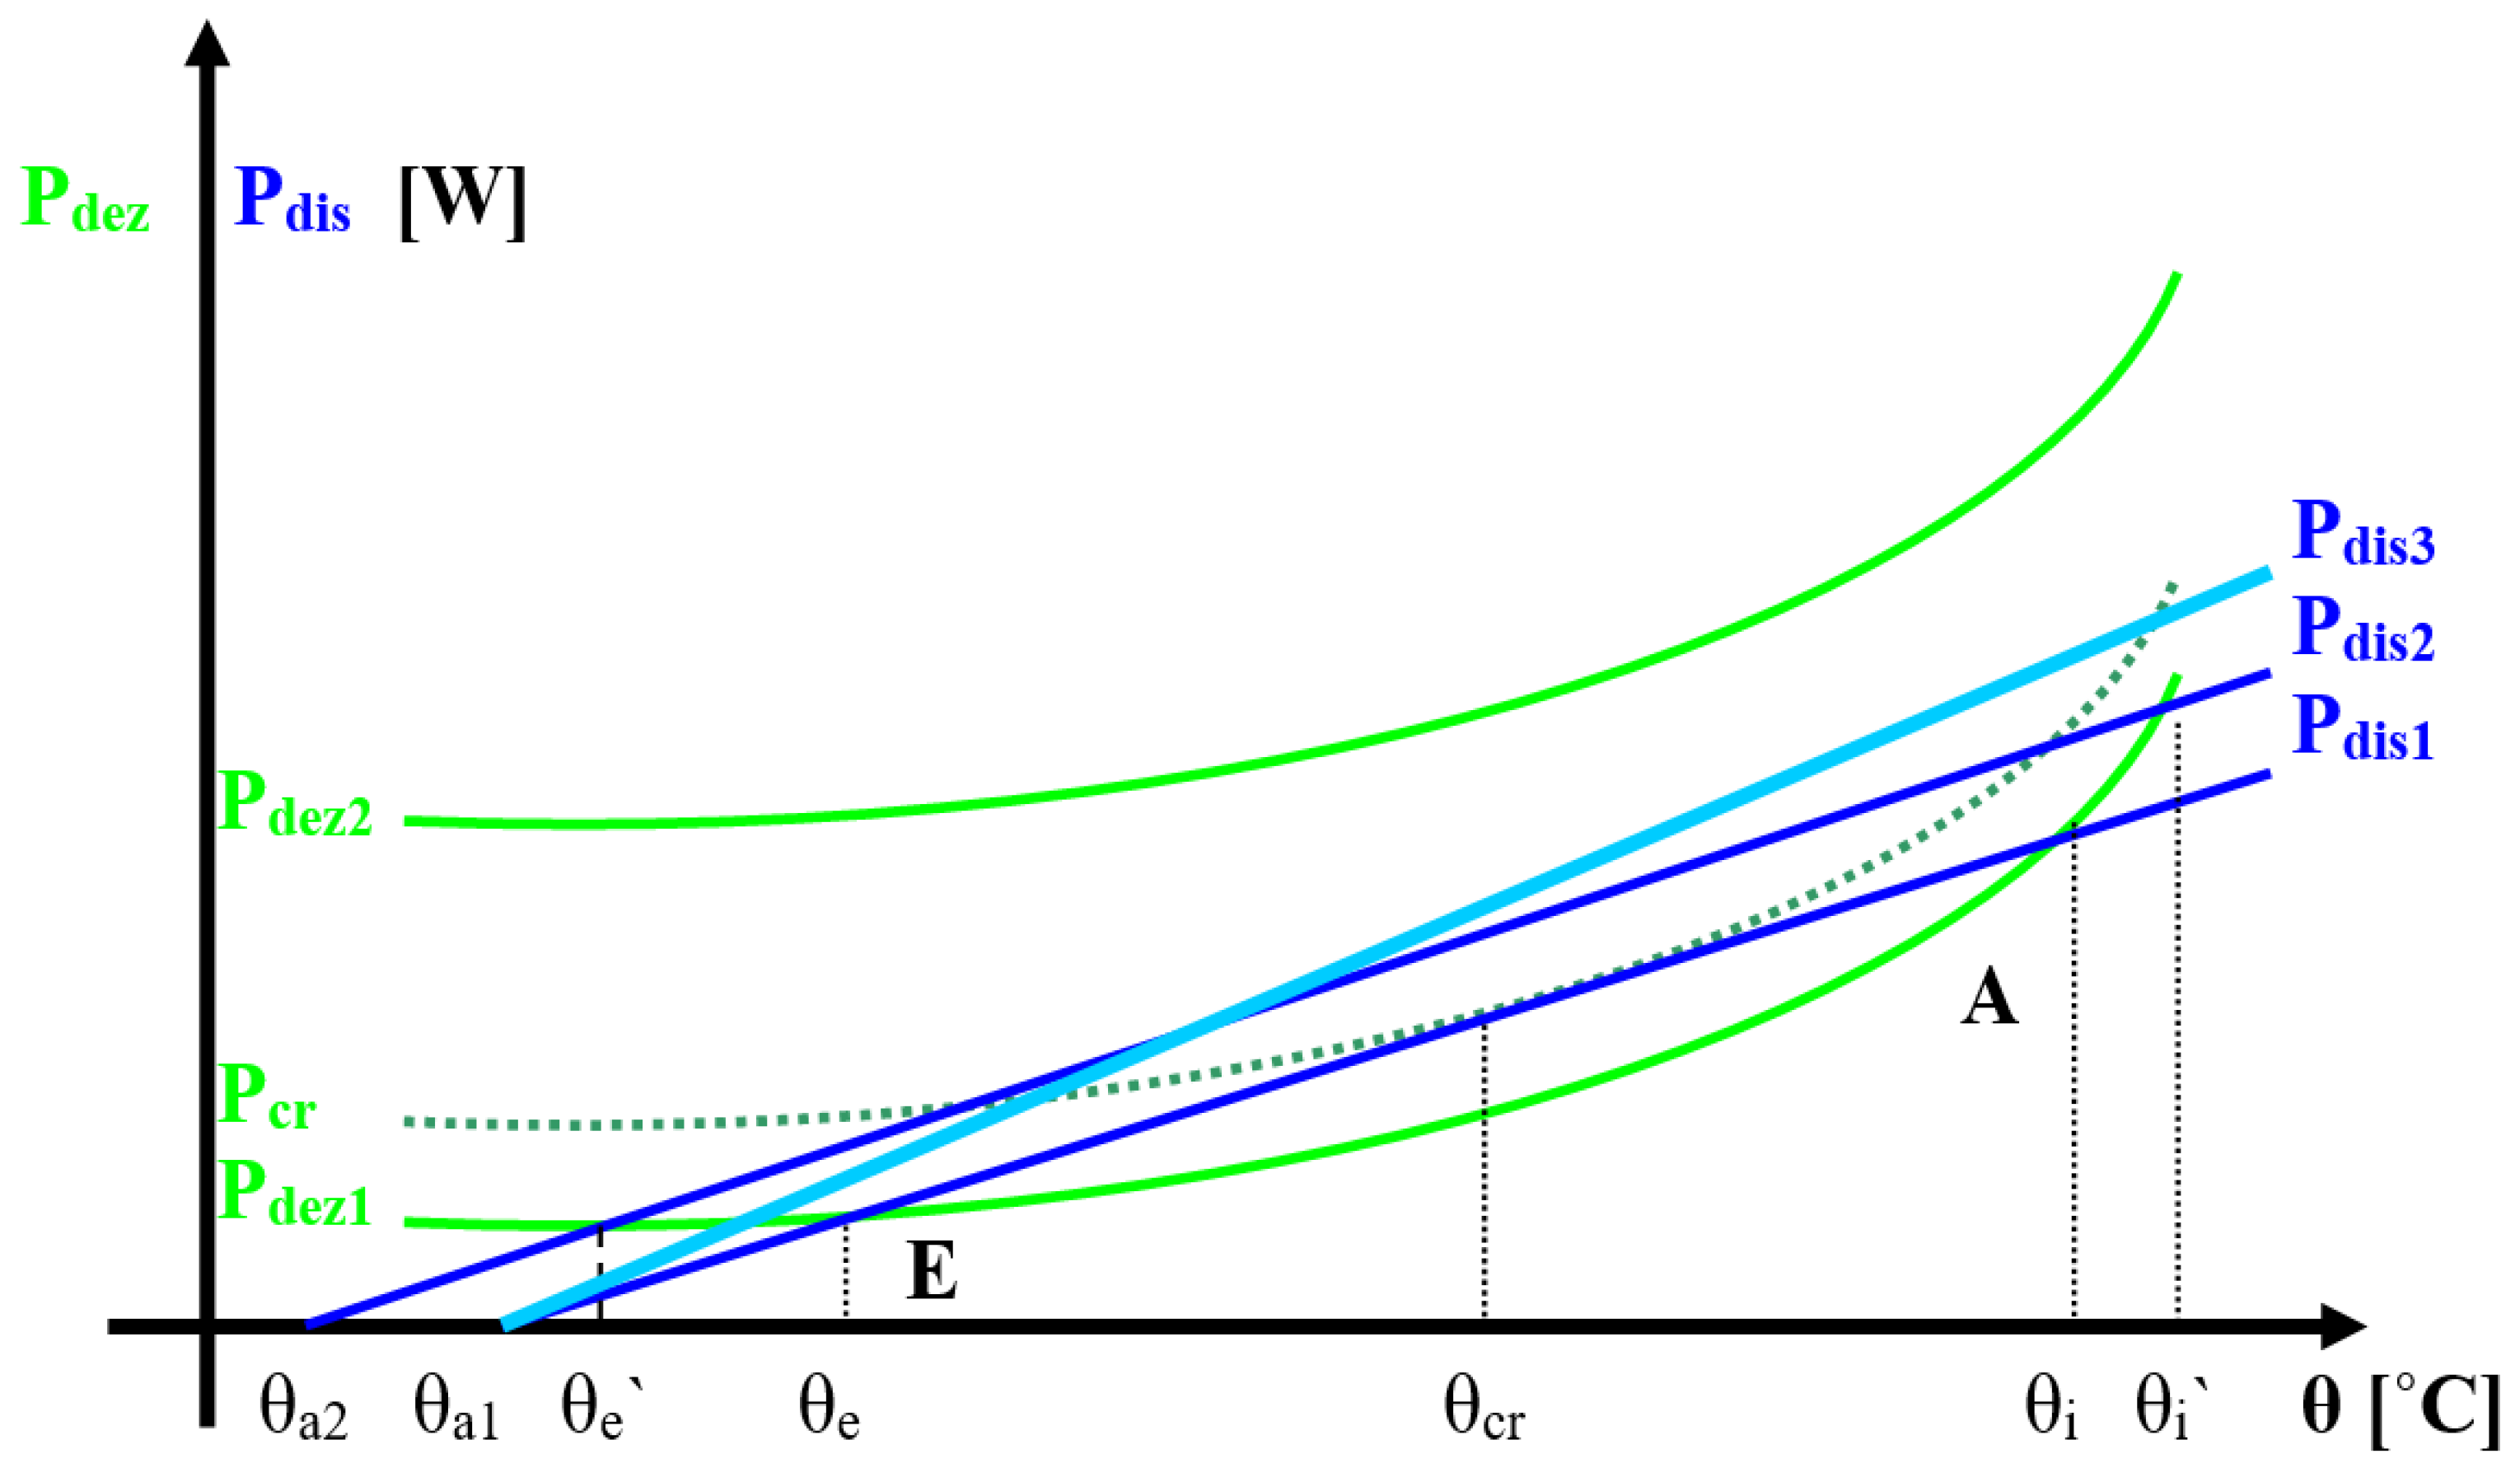
For this we will present a diagram of the variation of the power developed in the varistor by Joule-Lenz,
Pdez effect and of the power dissipated by convection and radiation by the varistor, namely
Pdis, depending on the temperature
θ, diagram shown in
Figure 9.
The mathematical expressions of the two powers are, as we explained earlier:
Developed (produced) heat power:
Dissipated heat power:
where:
- -
Sl is the total power dissipation surface;
- -
Φ (U) is the height of the potential barrier depending on the applied voltage;
- -
qe is the charge of the electron;
- -
T is the absolute temperature (in [K]);
- -
k is Boltzman’s constant;
In relation to the relative position of the curves, we can have the following situations, which are presented in correlation with their physical significance:
Two points of intersection E and A (for the curves Pdez1 and Pdis1), these corresponding to the nominal equilibrium operating temperature (θe) and the maximum thermal stability temperature (θi). At equilibrium, the temperature of the varistor (θe) is quite close to the ambient temperature (θa1), as shown above, with a maximum overtemperature of 21 °C. Previous experimental measurements have shown that this current is the worst case in the order of milliamperes. Point E is precisely the stable operating point at ambient temperature, which we have previously highlighted. If an overvoltage occurs, it is eliminated and its energy causes the varistor to heat up, with the operating point moving on the Pdez1 curve. The stability limit is the point that corresponds to the temperature and, up to this point, the power dissipated being much higher than that produced, the varistor cools and returns to the stable operating point in θe (after the overvoltage has passed); however, if the temperature is exceeded, the temperature will continue to increase progressively, generating the thermal runaway in a dynamic regime. This is due to overvoltage waves that store a large amount of energy, a situation specific to transient switching overvoltages, which occur at short intervals, or violent atmospheric overvoltages that occur during a storm.
A single point of intersection (between the curves Pcr and Pdis1), in the limit situation when the two points of intersection between the dissipated power and the one developed in the varistor overlap, corresponds to the limit temperature of stability in permanent regime θcr, and any request that appears can produce thermal runaway. The situation is characteristic of the operation in permanent regime at a voltage around the threshold; the situation can appear practically when operating the varistor at a voltage that corresponds to a maximum utilization coefficient (for example C ≈ 0.84 at θa = 25 °C, in previously studied case). Any overvoltage that will require the varistor will cause the out of equilibrium and its thermal runaway. In addition, raising the ambient temperature will have the same effect, as we have shown above. This extreme operating situation must be avoided in order to achieve reliable equipment.
The two graphs have no common points (curves Pdez2 and Pdis1), in which case the power dissipated is always lower than that produced in permanent mode, so it is an indisputable regime of thermal runaway, corresponding to an excessively high coefficient of use, even bigger than the unit.
The steady (point E) and unstable (point A) equilibrium states, with the corresponding temperatures θe and θi, give information about the energetic behavior of the varistor.
It is very difficult to draw this graph of the thermal balance of the varistor. The power curve dissipated by the varistor (on right, Pdis) is easy to draw for a certain geometry and at a given value of the ambient temperature.
For the Varsi V250D32S varistor analyzed above, the main sizes in (6) and (7) are:
- -
total heat dissipation surface (two face sides + lateral side surface):
Sl = 1.91 × 10⁻³ [m2]
- -
combined heat transfer (by convection and radiation):
α = 17 [W/(m2 · °C)]
With these clarifications, Equation (7) is rewritten for the concrete case:
where
τ is the varistor overtemperature.
The power curve developed is extremely difficult to draw analytically.
In the literature there are certain exponential or polynomial approximations for the quantities involved in this formula. The closest solution to reality is that presented in [
2] and [
3], which, however, remains difficult to apply in practice.
The functions
A(U) and
Φ(U) are made explicit according to the utilization coefficient
C, resulting in:
(10) in [V]
This type of formula is not used in practice.
According to the CECC 42,000 standard, the varistor manufacturer must supply as catalog data the maximum power that can be dissipated by the varistor, namely Pmax, under normal climatic conditions, at an ambient temperature θa = 25 °C.
This corresponds to the maximum overtemperature τmax that can be dissipated by the varistor under these conditions and gives us the value θi = θa + τmax.
For the specific case of the Varsi V250D32S varistor, this value is Pmax = 1.2 W.
As a result, in degrees Celsius, we obtain:
For this value, θe = θa + τmax = 25 + 37= 62 [°C].
This temperature has nothing to do with the maximum temperature that the varistor can withstand without degrading, this being between 100 and 300 °C, depending on its type. It characterizes only the process of heat dissipation. If the ambient temperature is different, the thermal transmittance by convection and α radiation also changes, so we cannot postulate this as a limit value. It is observed that it is not influenced by the utilization coefficient; it characterizes only the heat exchange. How the varistor reaches that temperature is not essential.
For example, the stable equilibrium point E; if we refer to an usage coefficient C = 0.82, so voltage U = 320 Vdc, will have the coordinates:
These values were obtained in an experimental way.
If we evaluate the fraction (in Kelvin or degrees Celsius):
we obtain a value quite close to the real one (from which we conclude that
α was well chosen).
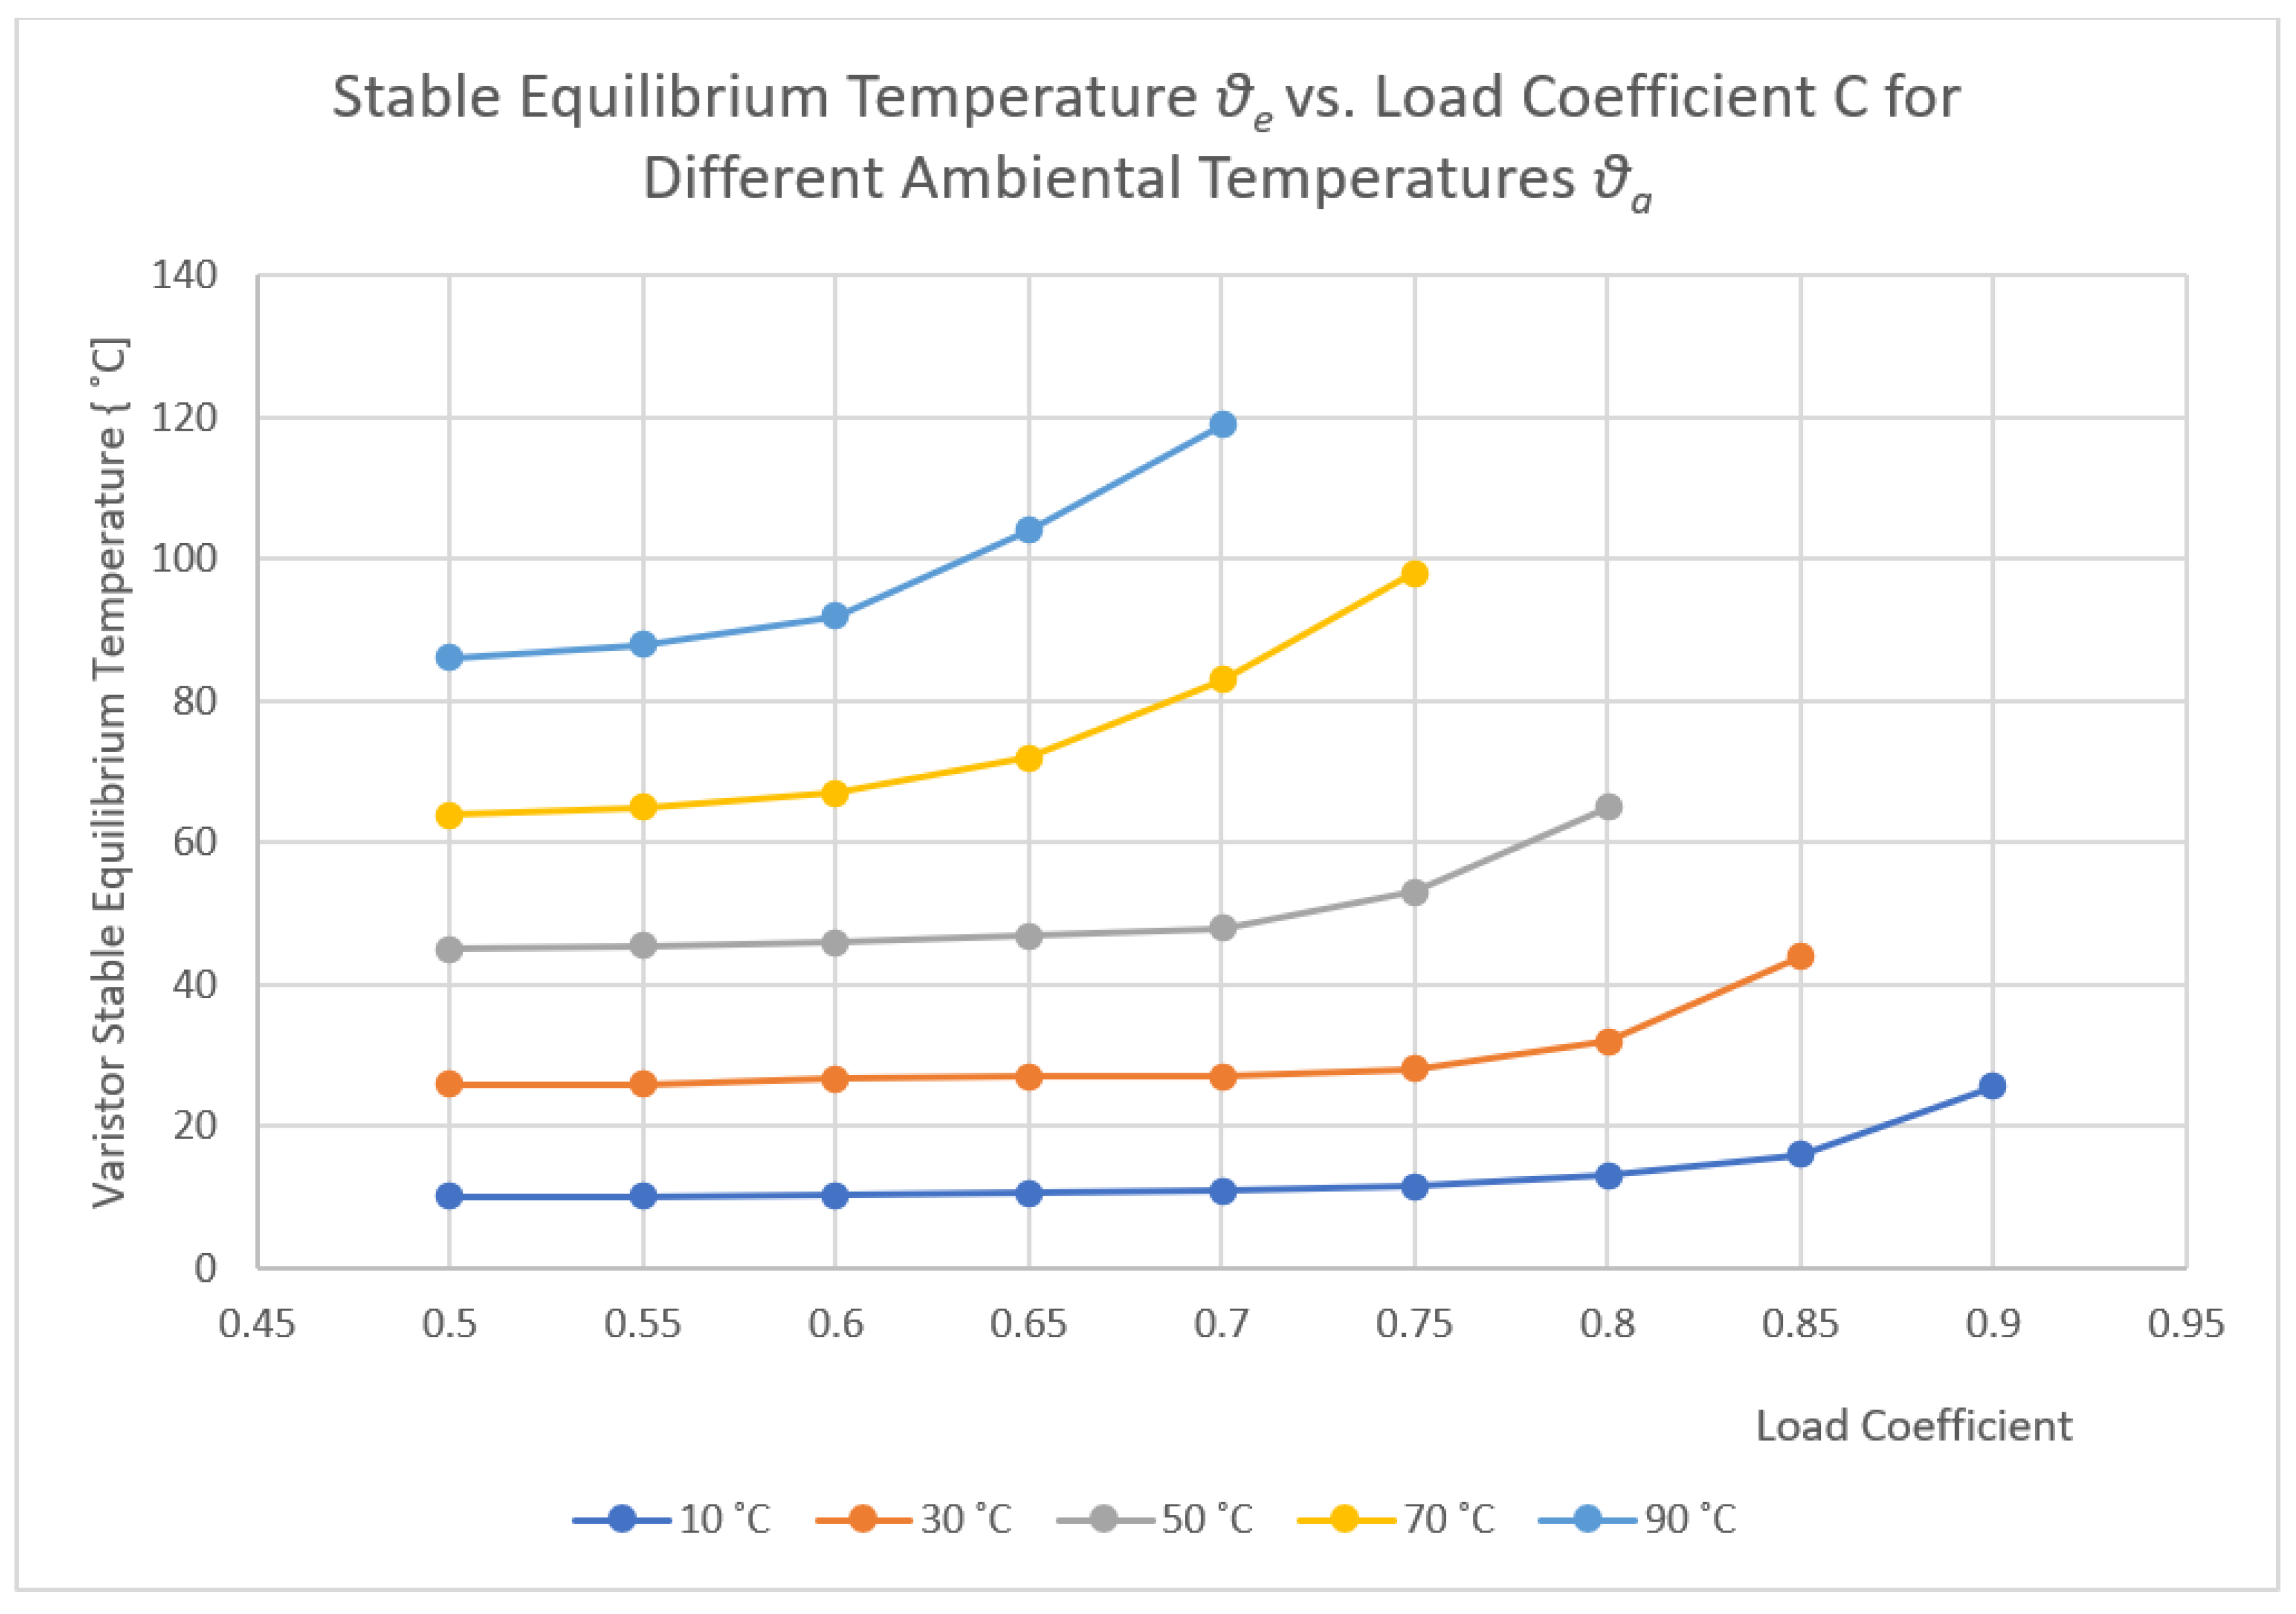
Figure 10 presents the dependence between the stable equilibrium temperature of a sample of varistor material (
θe) depending on the load coefficient, determined for several values of ambient temperature. It is observed that for the usual maximum ambient temperatures of 30–50 °C, a coefficient of use of up to 0.8 can be accepted (in nominal mode).
All these measurements were performed at the “LAPLACE-Génie Electrique” Laboratory in Toulouse and they were used to draw the graph in
Figure 10, for the Varsi V250D32S varistor.
If the possibility of high energy overvoltages or an increase in ambient temperature is considered, C should be reduced to less than 0.5.
As we have already mentioned, the threshold voltage is chosen as a compromise between the protection level and the utilization coefficient imposed by the thermal dimensioning, depending on the concrete field of the application of the protection equipment.
Another direction for solving the problem of thermal equilibrium is to establish in parallel some technical solutions to improve the heat transfer, as we have shown above, and some solutions aimed at reducing the maximum temperature reached by the varistor.
The analysis of thermal stability in the permanent regime, together with the analysis of thermal stability in the impulse regime, must be considered in the design and design of overvoltage protection equipment that uses ZnO-based varistors. The designer of such equipment must avoid the occurrence of the phenomenon of thermal runaway of varistors, due to their permanent supply at too high a voltage.
3.3. Heat Transfer Model Based on the Cylindrical Symmetry
We can extend all conclusions taken from the study of these low voltage varistors to other higher voltage cylindrical ones. Before doing this, we must verify if a finite element-based model, used for this kind of symmetry, is verifying the measurements obtained below. Of course, by logical induction, we can use the main principles of this model (mostly the material related parameters) in case of higher voltage varistors, which are extremely difficult to assess, due to their size and voltage level.
A finite elements-based modeling software (in our case Flux 2D), provides separate procedures for each of the problem-solving steps, from tracing the geometry, describing the materials involved, and setting boundary conditions and initial conditions, to solving the problem and interpreting the results.
As we presented in
Figure 1, due to the cylindrical symmetry designed around the OZ axis, we noticed that the heat transfer model can be assessed only in the section A-A’. Thus, the conclusions can be generalized by extrapolation. From a pure mathematical point of view, modeling can only be done on the upper half of section A-A’, but we preferred modeling the whole radial section for reasons of simplification of the boundary conditions.
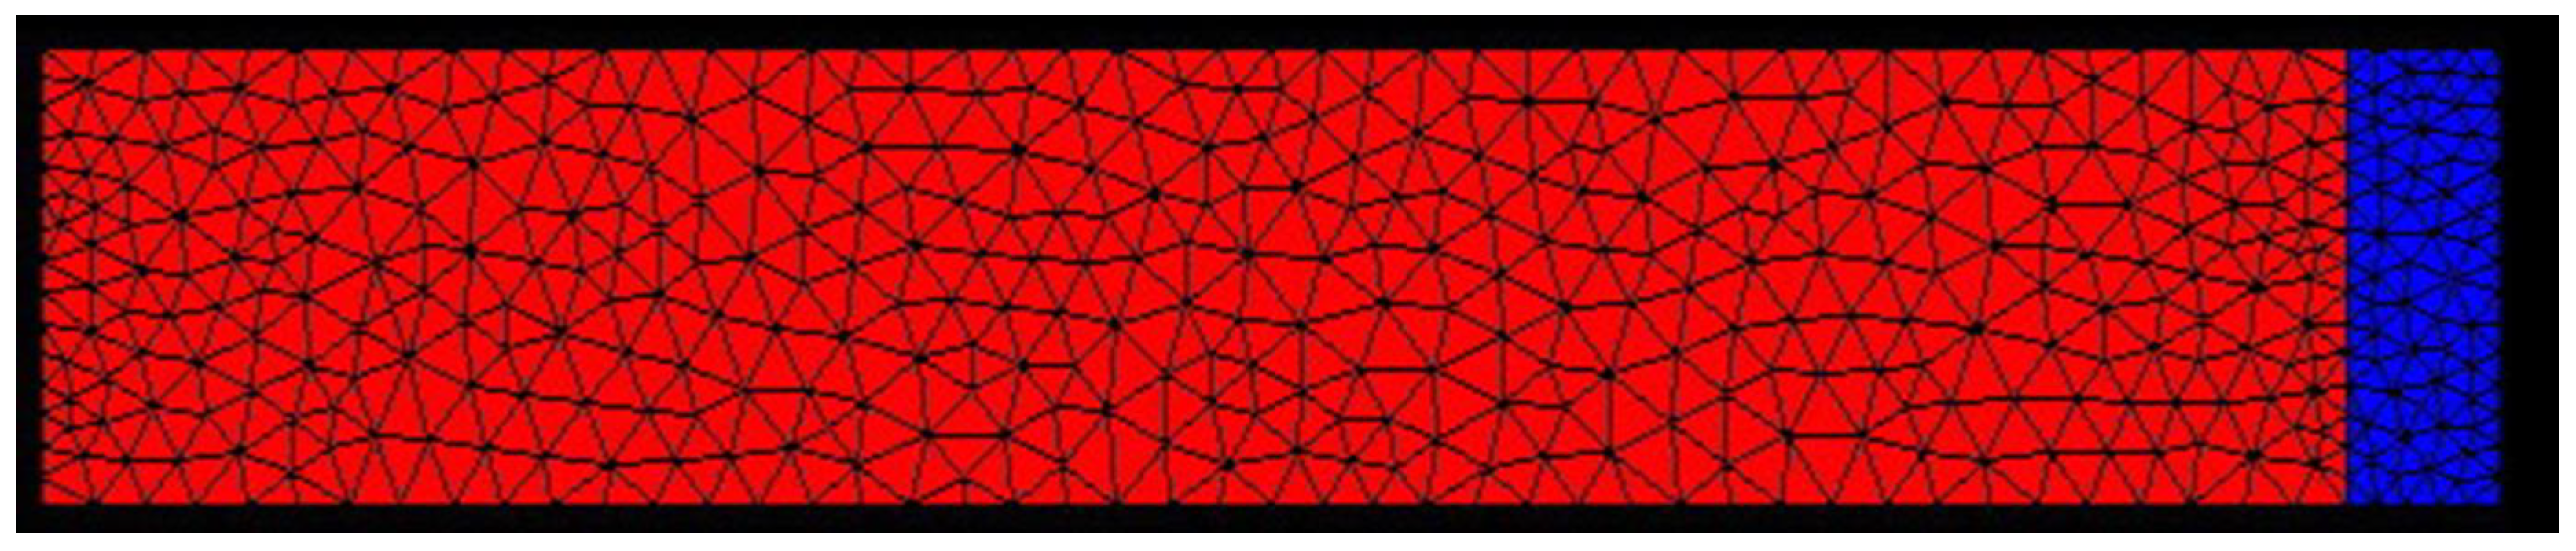
Figure 11 will present the optimal finite element model based on our cylindrical symmetry, having 1943 nodes, used for both permanent and pulse regime studies. We will not insist on the boundary conditions or the geometrical issues, due to the reduced dimensions of this paper.
In case of the permanent regime, numerical modeling will be performed over a duration of the heating process of 3600 s. Some 360-time steps will be considered, the duration of one-time step being 10 s. For each time step 5 iterations will be performed, the accuracy being 0.001.
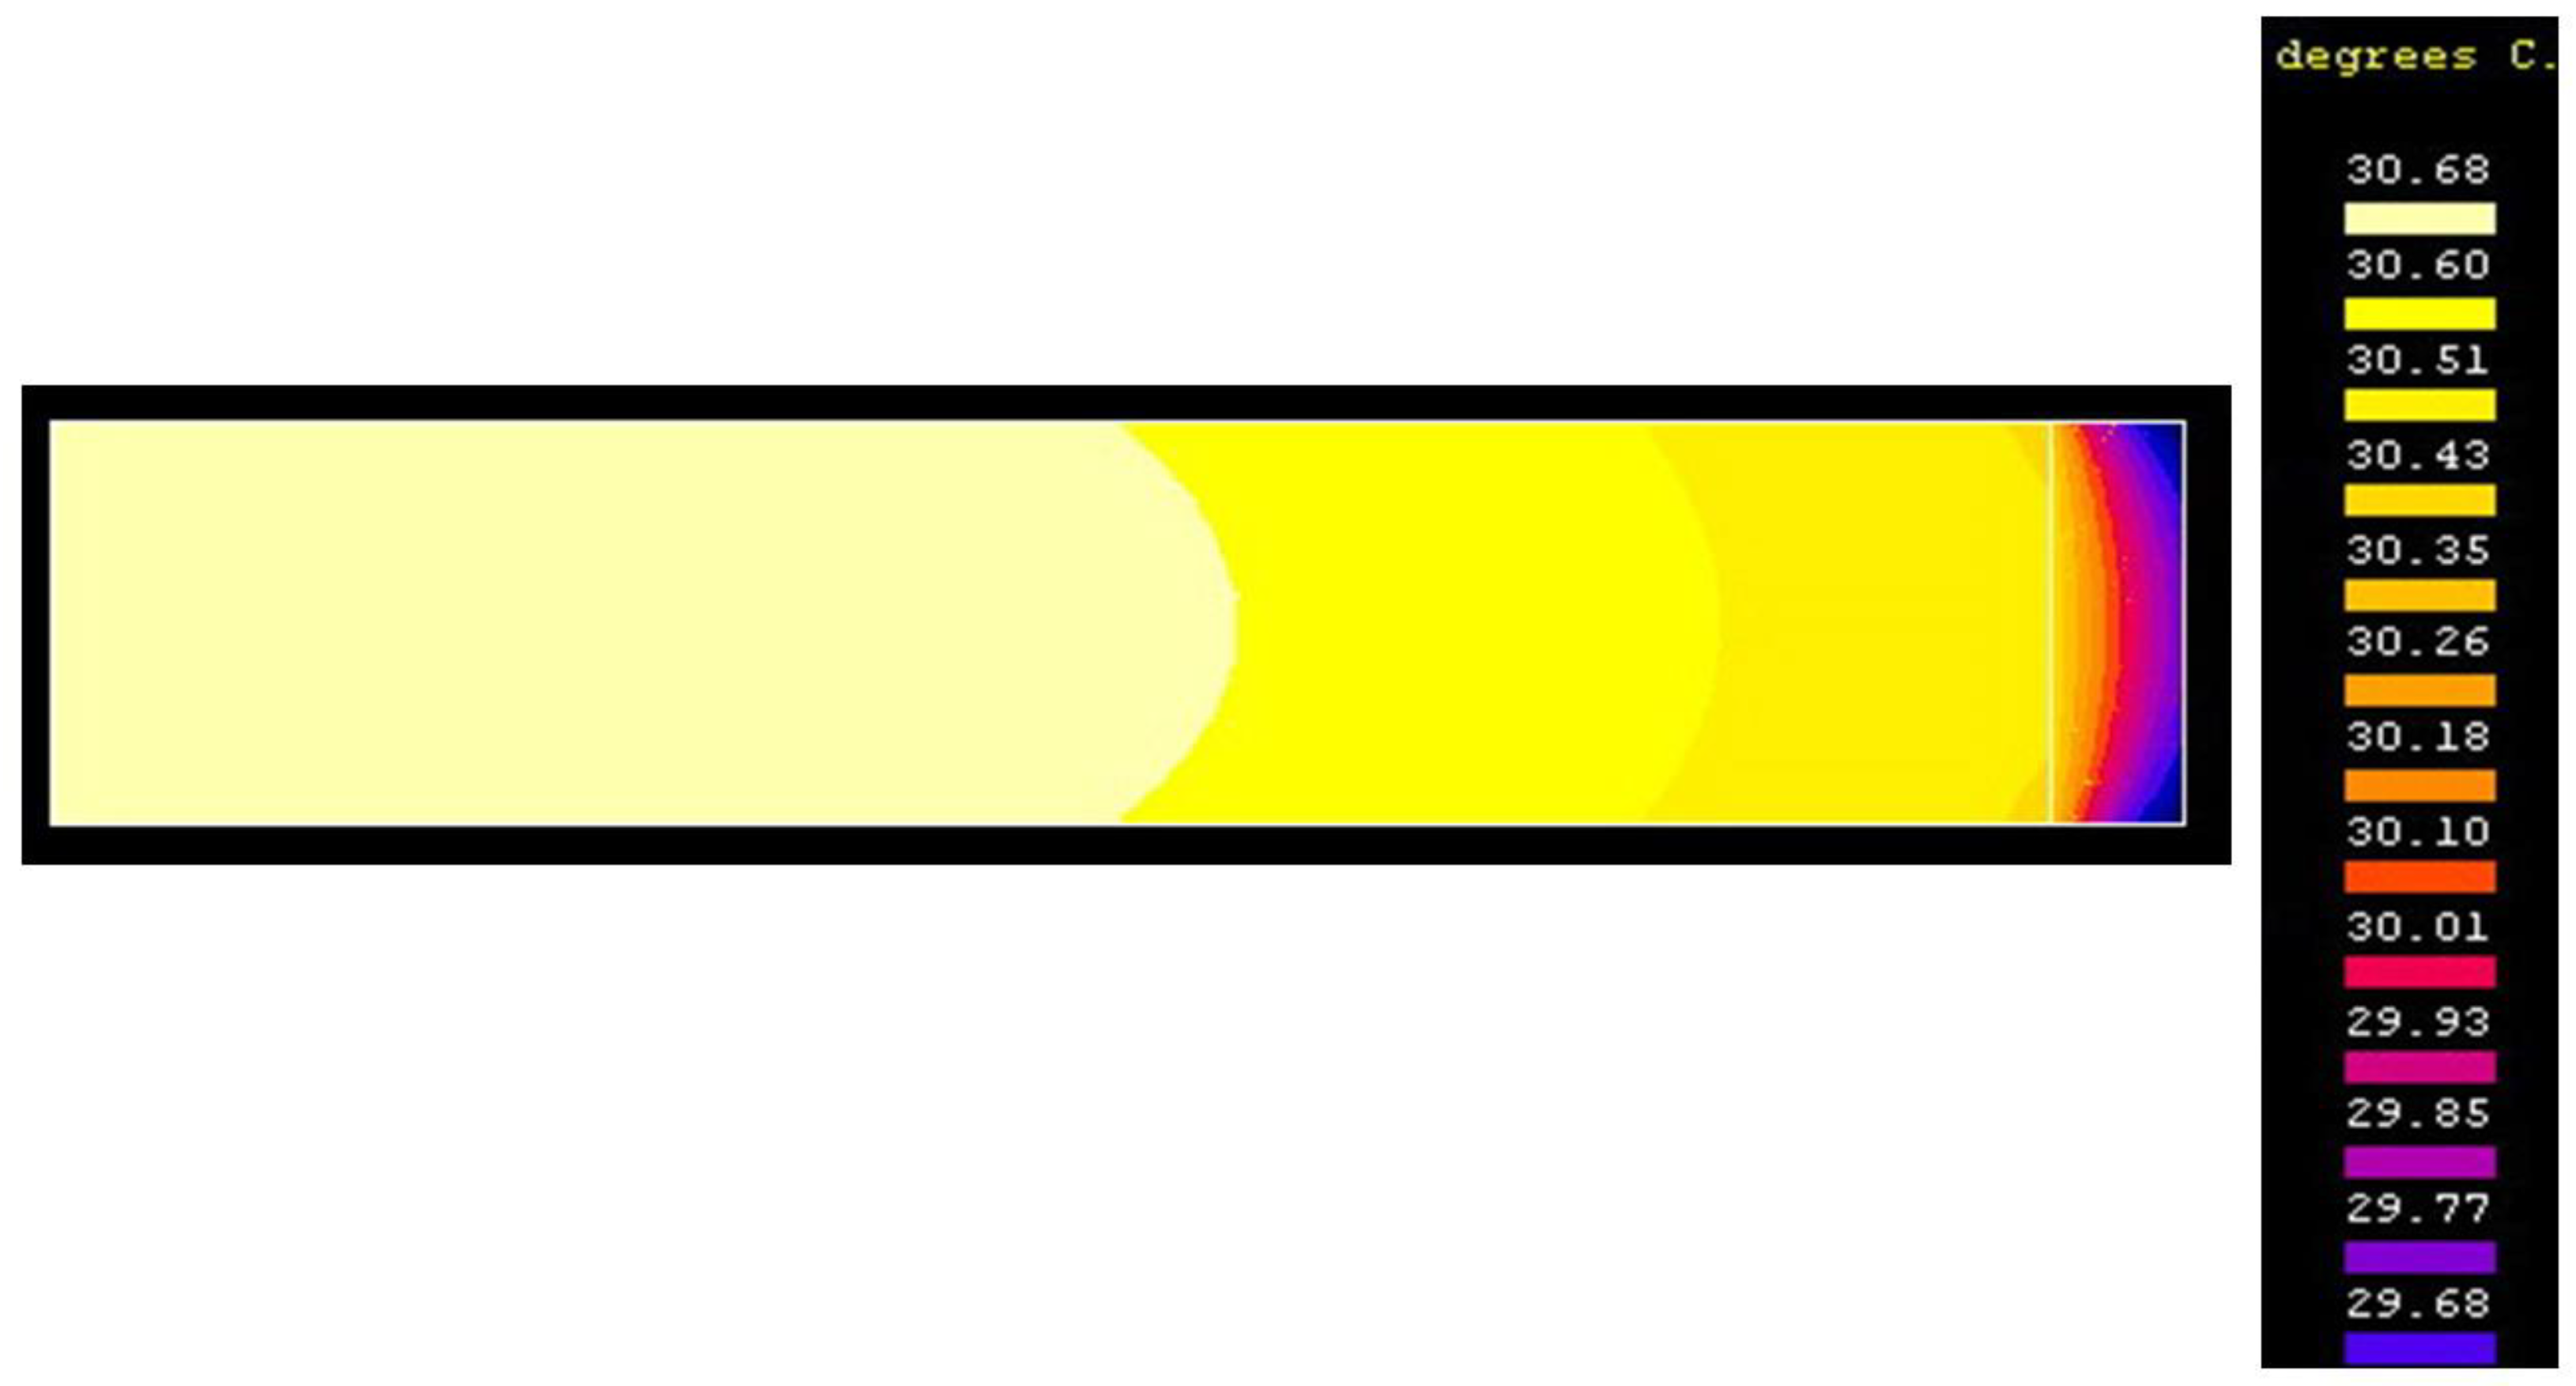
The analysis of thermal stability in permanent service will be done under the operating conditions specified by the varistor manufacturer as the most difficult, by supplying them with direct current, at a voltage corresponding to the limit of use, namely C = U/UN = 0.82. The total heat power was P = U · I = 320 · 7.1 × 10−4 = 0.227 W, corresponding to the real—measured permanent current.
We will present the repartition of temperatures after 3600 s from the beginning of the heating process, when the permanent regime is clearly reached (
Figure 12), as obtained from simulations.
We noticed that the largest temperature difference between the points of this varistor, in permanent regime, does not exceed 1 °C, which observation experimentally confirmed, for an ambient temperature of 24 °C. The highest overtemperature encountered, after modeling the permanent regime, is: τ = 6.68 °C, which is close to the computed and measured 7 °C, in (12), confirming the model.
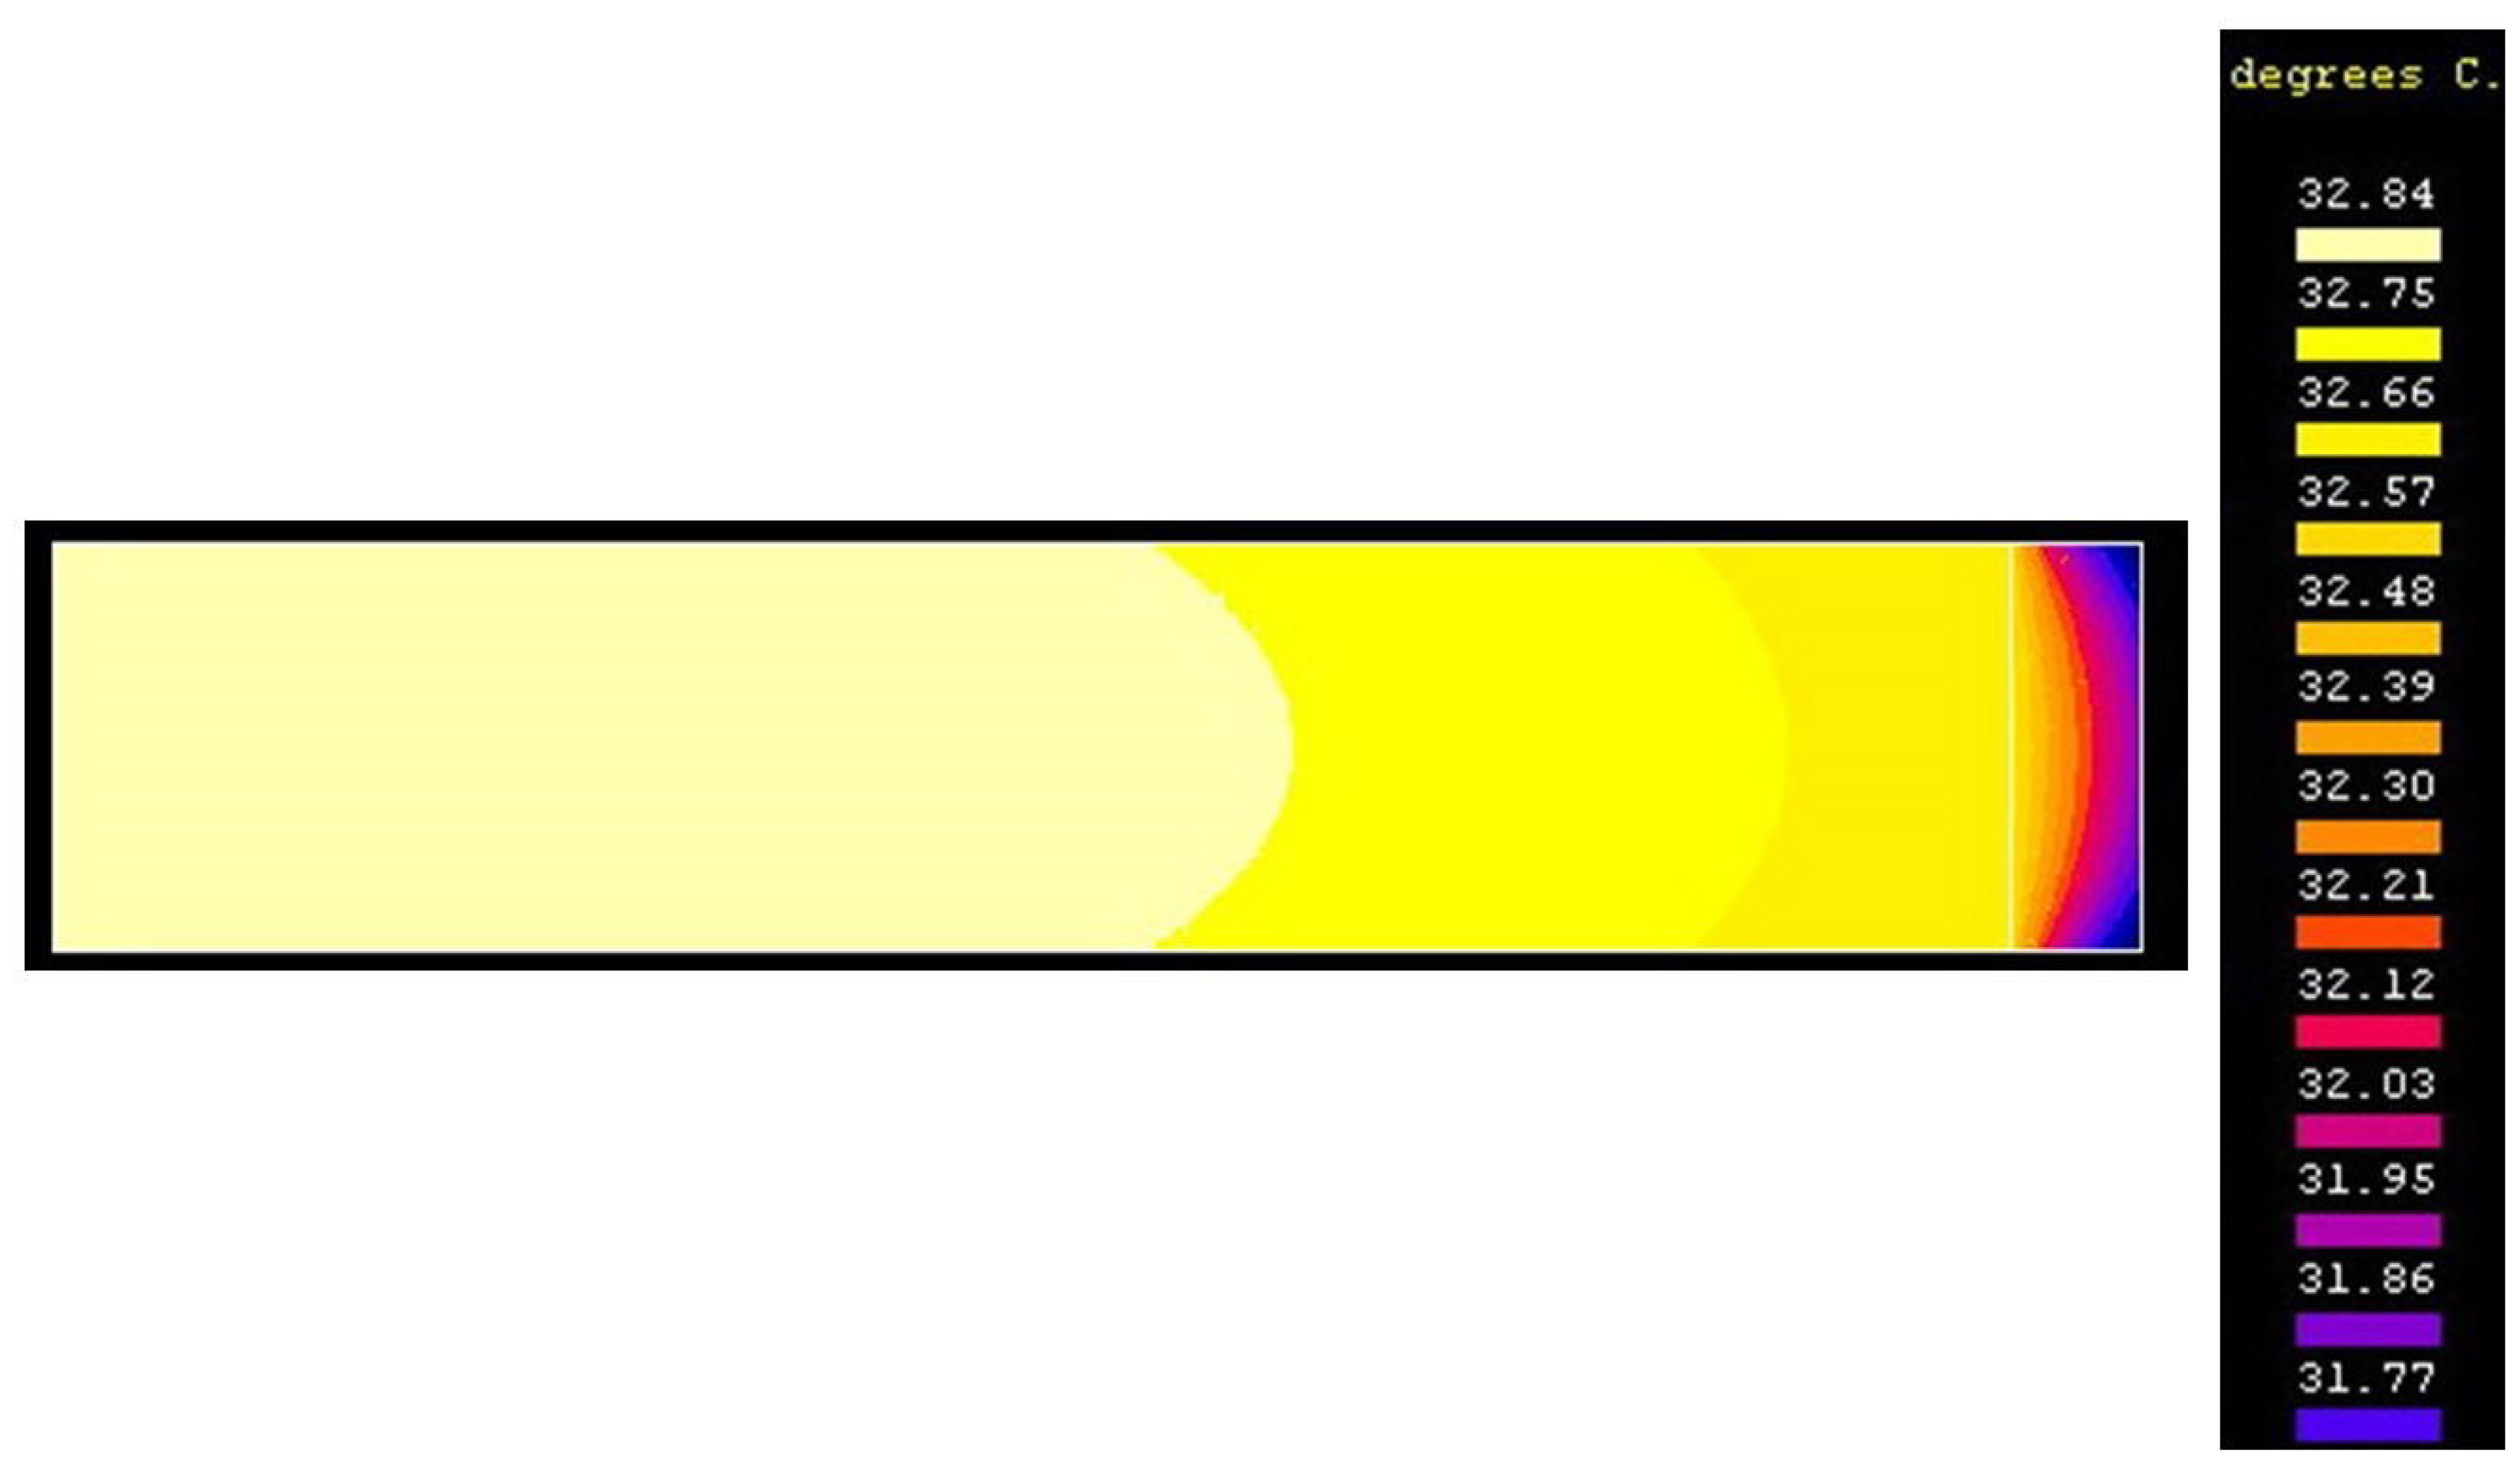
In case of the pulse regime, the duration of the wave application being of the order of tens of microseconds, the process is considered adiabatic. All the pulse energy remains stored in the varistor body, causing its temperature to rise extremely quickly. It is very difficult to determine the peak value of its temperature, but we can measure the overtemperature of that varistor 60 s after the pulse, which must be around the measured value of 9 °C.
The applied pulse energy is 90 J.
Figure 13 shows the temperature distribution inside that varistor, 60 s after the application of the voltage pulse.
We noticed that the largest temperature difference between the points of this var-istor, in the permanent regime, does not exceed 1 °C, which observation experimentally confirmed.
For an ambient temperature of 24 °C. The highest overtemperature encountered after modeling the permanent regime, is: τ = 8.84 °C, which is close to the computed and measured 9 °C, confirming the model.
After comparing the experimental results with those obtained from the modeling, it was found that they are close to each other, the largest deviation being less than 5%. This proves that the approximations of the material parameters were well made, and the conditions imposed on the modeling were correctly chosen.
4. Conclusions
In case of any voltage level or any operational service, inside the varistors heat is constantly produced, and can cause the avalanche increase of the electrical conduction and the total destruction of the MOV by means of a “thermal runaway”. It is mandatory to dissipate this heat into the environment by means of conduction, convection, and radiation.
For each value of the voltage applied to the MOV in permanent service and for each value of the ambient temperature, keeping one of them constant, we can establish a critical value of the current density Jcr, which corresponds to a certain value of the other quantity.
Consequently, we can find the value C that determines Jcr and vice versa. Increasing the current density above this critical level, due to either an increase in supply voltage or an increase in ambient temperature or varistor temperature due to a current pulse, causes the varistor to overheat and enter the “thermal runaway” mode, i.e., increased violent and uncontrolled temperature.
If the current density is maintained below this critical threshold, the heating of the varistor eventually leads to a steady state overtemperature, τs, without destructive consequences for the varistor.
This article describes an experimental method applied to establish the maximum continuous operating DC voltage for a MOV for a certain ambient temperature.
Generally, this set of technical data is not provided by the manufacturer but is necessary when using that device. That is why we introduced a so-called “load coefficient” in order to obtain a much-simplified expression for that relation.
The methods applied in the operational study of surge protection equipment based on MOVs will be a part of a dedicated research focused on a global assessment method for the thermal stability of these state of the art pieces of equipment. This study will be started experimentally.
By analyzing certain disk MOV (a symmetrical type varistor), we obtained a simple linearized equation which offers an answer to the questions related to the basic thermal stability. This linear equation was experimentally verified for many other types of low voltage MOVs, having other dimensions and different manufacturers.
It also provides a starting point for the assessment of the long-term thermal stability of an MOV in given environmental conditions involving no other dedicated further measurements or special testing procedures, reducing the design costs and times for low voltage surge-arresters made by using MOVs.
The main conclusion of this paper is the impossibility of generating a purely analytical model usable for the study of phenomena related to the production and transfer of heat in surge protection equipment using MOVs, due to the large variation of the main parameters and especially because, for example, in the case of disc varistors, heat transfer occurs both radially and axially.
In practice, not every varistor manufacturer provides real data concerning the environmental temperature operational limits of that device. Normally, all manufacturers offer data only for an environmental temperature of 20 or 25 degrees Celsius. Surge arresters have to perform in practice even at higher temperatures, due to extreme climate or direct solar exposure. This kind of measurement is not normalized. As a result, for the future study of varistors heating and cooling, regardless of the thermal regime in which they exist, it is necessary to use a numerical model, which considers all these aspects and offers values of the studied sizes as close to the physical reality as possible.
Inside all surge protection equipment, heat is developing continuously, even in permanent service regimes when no surge voltage is applied to their terminals, because the MOV is exposed at nominal voltage, and a small electrical current is crossing. As a direct consequence of the heat produced inside the MOV, the temperatures of the different parts are increasing to the limits of the permanent regime, when all heat is transferred to the environment.
The MOV, in a steady state, has a certain heat stockage capacity. This heat would be discharged by progressive dissipation in the much colder environment only if that MOV is totally disconnected from the network. The value of this latent heat represents only a fraction of the whole electrical energy that turns into heat inside the varistor in the event of a major surge wave. This issue must also be considered for future studies.
In the emergency situation of an overvoltage pulse, which leads to an important overcurrent, this steady state thermal equilibrium is overpassed. In order to guarantee an exemplary and long-lasting operation of the MOV given thermal stress, the manufacturing standards impose (depending on the materials used and the operating conditions) certain maximum limits allowed for the stationary temperatures. By taking into consideration all these aspects, after all experimental determinations, we observed that all critical values of the load coefficient have a linear dependence of temperature and the line of the critical values passing by those two points.
The temperature of an electrical equipment is set by the ambient temperature θa (where the equipment is located), plus a temperature difference τ (overtemperature), due to the heating of the equipment by electrocaloric effect.
The difference between the temperature of the hot body surface and the temperature of the environment is called the body temperature (compared to the temperature of the environment) and is independent of the choice of origin on the scale of the adopted temperatures. Most norms indicate two values for the stationary regime, one as maximum allowed total temperature and the other as maximum allowed overtemperature.
The heat source, inside a protective equipment, is the varistor (or varistor column), which has been crossed by an electric current (either in permanent mode or in transient, impulse mode). The dielectric losses in varistor in the permanent regime are negligible for most of the categories of protective equipment.
The rest of the parts of the protective equipment, which are not heat sources, can become hot by the heat propagation from one area to another. What is interesting is the level and distribution of temperatures in the component elements of the equipment, which depend on the power of the heat sources and their location in the equipment. In order that the heating of the equipment, in permanent service or impulse mode, does not exceed the limits allowed by standards, it is necessary that the heat dissipation to the environment and the cooling of the appliance be as active as possible.
In addition to excellent electrical and mechanical properties, the varistor material must also have good thermal conductivity and increased operational stability at high temperatures.
The most important conclusions are:
The notion of “thermal runaway” is explained by defining a threshold of current, from which an uncontrolled (avalanche) current increase is possible, accompanied by an uncontrolled increase of the temperature, with devastating consequences for the varistor material.
According to the experimental measurements, we determined that the critical values of the load coefficient have a linear variation function of temperature; the line these critical values is passing through is created by the two points determined above. The dependence is more complicated if we consider the variation of the material parameters with the temperature (which is slightly linear for these relatively reduced temperatures).
For all the points (
C, θa) located above it, the thermal runaway at the applied voltage and the ambient temperature is safely, and for the points (
C, θa) below this line, the thermal runaway does not occur, and the current density is not exceeded [
24].
This study must be continued with an evaluation of the impulse regime thermal stability for completing all tests concerning the low voltage ZnO based varistors. These conclusions could be used even for medium and high voltage ZnO based varistors.
By using a finite-elements model, due to the cylindrical symmetry of the varistor, conclusions could be extrapolated for higher temperatures.


 ,
, 
