Article

Analysis of Short-Term Heart Rate Asymmetry in High-Performance Athletes and Non-Athletes

by
Yecid Mina-Paz
1,2,3,†,
Victoria Noemí Santana-García
4,†,
Luis Javier Tafur-Tascon
1,
Moisés Arturo Cabrera-Hernández
1,
Adriana Cristina Pliego-Carrillo
5 and
José Javier Reyes-Lagos
5,*
1
Faculty of Education and Sports Sciences, Escuela Nacional del Deporte, Cali 76001, Colombia
2
GIMMEIN, Faculty of Health, Universidad Libre Seccional Cali, Cali 76001, Colombia
3
Health and Movement Research Group, Faculty of Health, Universidad Santiago de Cali, Cali 76001, Colombia
4
University Center for Exact Sciences and Engineering (CUCEI), University of Guadalajara (UdeG), Guadalajara 44430, Mexico
5
School of Medicine, Autonomous University of Mexico State (UAEMéx), Toluca de Lerdo 50180, Mexico
*
Author to whom correspondence should be addressed.
These authors contributed equally to this work.
Symmetry 2022, 14(6), 1229; https://doi.org/10.3390/sym14061229
Submission received: 2 May 2022 / Revised: 30 May 2022 / Accepted: 3 June 2022 / Published: 14 June 2022
(This article belongs to the Special Issue Symmetry and Asymmetry in Sport Sciences)

Abstract

:
Heart rate asymmetry (HRA) refers to how asymmetrically the acceleration and deceleration patterns in heartbeat fluctuations are distributed. There is limited evidence regarding HRA changes in athletes and their association with autonomic regulation. This study aimed to compare the short-term HRA of high-performance athletes and non-athletes during an autonomic function test by calculating relevant HRA measures. This exploratory study obtained beat-to-beat RR interval time series from 15 high-performance athletes and 12 non-athletes during a standardized autonomic function test. This test includes rest, postural change, controlled respiration, prolonged orthostatism, exercise, and recovery phases. The following HRA parameters were computed from the RR time series for both groups: asymmetric spread index (ASI), slope index (SI), Porta’s index (PI), Guzik’s index (GI), and Ehlers’ index (EI). We found significant differences (p < 0.01) in the mean value of several HRA parameters between athletes and non-athletes and across the autonomic function test phases, mainly in postural change and recovery phases. Our results indicate that high-performance athletes manifest a higher number and magnitude of cardiac decelerations than non-athletes after an orthostatic challenge, as indicated by GI and EI. In addition, lower HRA was found in athletes in the recovery phase than in non-athletes, as indicated by ASI.

1. Introduction

Heart rate variability (HRV) is defined as the variation in time between consecutive heartbeats [1]. This non-invasive biomarker measures autonomic responsiveness, which is clinically helpful in diagnosing and detecting autonomopathies and neuropathies [2]. HRV is considered a diagnostic and performance monitoring tool in sports and physical activities [3]. Studies indicate that HRV is a reliable means to monitor the physical training of young sportspeople [4] and athletes [5]. According to the literature, HRV could help to assess athletes’ adaptation/maladaptation to training and to set optimal training loads that lead to improved performance [6].
Linear HRV approaches may be insufficient to completely represent the highly complex behavior involved in generating a heart rate that is produced by the intrinsic system’s dynamics, particularly the nonlinear interplay of several physiological regulatory loops [7]. Nonlinear features of HRV are becoming increasingly important in understanding complex biological systems in both health and disease [8]; one relevant feature is the asymmetry of HRV.
The autonomic nervous system (ANS) modifies the heartbeat through heart rate accelerations (AC, shortening of RR intervals) and decelerations (DC, elongation of RR intervals) [9]. Heart rate asymmetry (HRA) refers to the asymmetrical distribution of AC and DC patterns in heartbeat fluctuations. Thus, HRA reflects the role of the sympathetic and parasympathetic nervous systems in balancing regulation of heart rate [10]. Several physiological and pathophysiological phenomena have been explored in the modification of HRA, for example, controlled respiration [9], acute mental stress [11], positive and negative emotions [12], and attention deficit hyperactivity disorder [13].
As a nonlinear technique, HRA provides a novel and verified way to evaluate HRV among the several current linear approaches. Some authors have concluded that nonlinear techniques of HRV analysis outperformed traditional linear time- and frequency-domain approaches in a range of investigations in the field of cardiovascular disorders [14]. Another study found that different breathing patterns significantly impacted HRA in the study population, but not linear HRV parameters [9]. Thus, the authors suggested that HRA analysis may be a more reproducible measure for clinical application because inter-individual differences are inherently more minor than linear HRV parameters [9]. In addition, evidence indicates that short-term HRA has the potential to improve sensitivity in situations when autonomic function tests are used as diagnostic tools [15].
HRV in elite athletes differs significantly from healthy controls [16]. According to recent findings, basal measures employing resting heart rate in one body position do not seem sufficient to monitor the training process for athletes, hence an orthostatic test in conjunction with indices based on HRV is likely to be useful [17]. Despite the abundance of studies investigating the influence of HRV on training and exercise, little is known about whether orthostatic challenges and sports training influence short-term HRA among high-performance athletes.
The primary purpose of this study is to examine whether an autonomic function test leads to changes in HRA between high-performance athletes and non-athletes. Moreover, the central working hypothesis is that short-term HRA differs between athletes and non-athletes in different phases of the autonomic function test.

2. Materials and Methods

2.1. Participants

Fifteen subjects (twelve men and three women) were recruited from the Colombian Sport Institute and voluntarily participated in this exploratory, comparative, and cross-sectional study. The enrolled high-performance athletes were of Colombian nationality, were aged between 18 and 25 years, and had participated in national and international competitions (elite runners). Inclusion criteria included regular training involving three hours of training each day, five days a week. Athletes were instructed to refrain from physical activity, drinking alcoholic beverages, and using any sympathomimetic substances for at least 24 h before the autonomic function test. The study was carried out as part of the training program under the supervision of the trainers.
Additionally, twelve non-athletes (ten men and two women) were recruited from the University Institution National School of Sports (Institución Universitaria Escuela Nacional del Deporte) and were of similar age and body mass index compared to the athletes’ group. Non-athletes were identified as people who did not participate in any semi-elite, competitive elite, successful elite, or world-class sports. All participants were informed about the possible risks of the study before providing written informed consent to participate. All participants were deemed healthy based on their response to a routine medical screening questionnaire. All procedures were approved by the Ethics Committee (CIREH) of Universidad del Valle (approbation number 018-019) and were conducted in accordance with the Declaration of Helsinki.

2.2. Autonomic Function Test and Recording of RR Interbeat Intervals

All volunteers attended the Exercise Physiology laboratory at the Institución Universitaria Escuela Nacional del Deporte to perform an autonomic function test [18]. It was carried out in a closed room with a temperature between 22 °C and 24 °C and a relative air humidity of 50–60%.
The autonomic function test comprised nine phases with a total duration of 19 min. It began with seven minutes of supine decubitus (clinostatic) on a stretcher (P1). The participants were then asked to complete a controlled respiration exercise for one minute at ten cycles per minute (P2). Then, a 12-cycle controlled ventilation exercise was performed for one minute (P3). The participants’ position was changed from supine to standing upright immediately after P3 was completed (P4). The orthostatism phase lasted 4:15 min, maintaining the participants’ position as in P4 (P5). The participants completed one set of 30 squats for 45 s after the orthostatism period (P6). Finally, for 5 min, the subjects returned to the supine decubitus position, divided into the first minute of recovery (P7), the second minute of recovery (P8), and the last three minutes of recovery (P9). The recording of the beat-to-beat RR interval time series was performed for all the phases using a Polar Vantage V2 (Polar Electro Oy, Kempele, Finland) in conjunction with a Polar H10 (Polar Electro Oy) heart rate chest belt monitor, which has been reported to be highly accurate in the detection of RR intervals at rest and during exercise [19].
The shortest phase (P6, 45 s) was utilized as a reference length to avoid any potential bias resulting from the varying lengths of each phase and to avoid discarding any data. As a result, the RR interbeat intervals of all phases were segmented to 45 s.

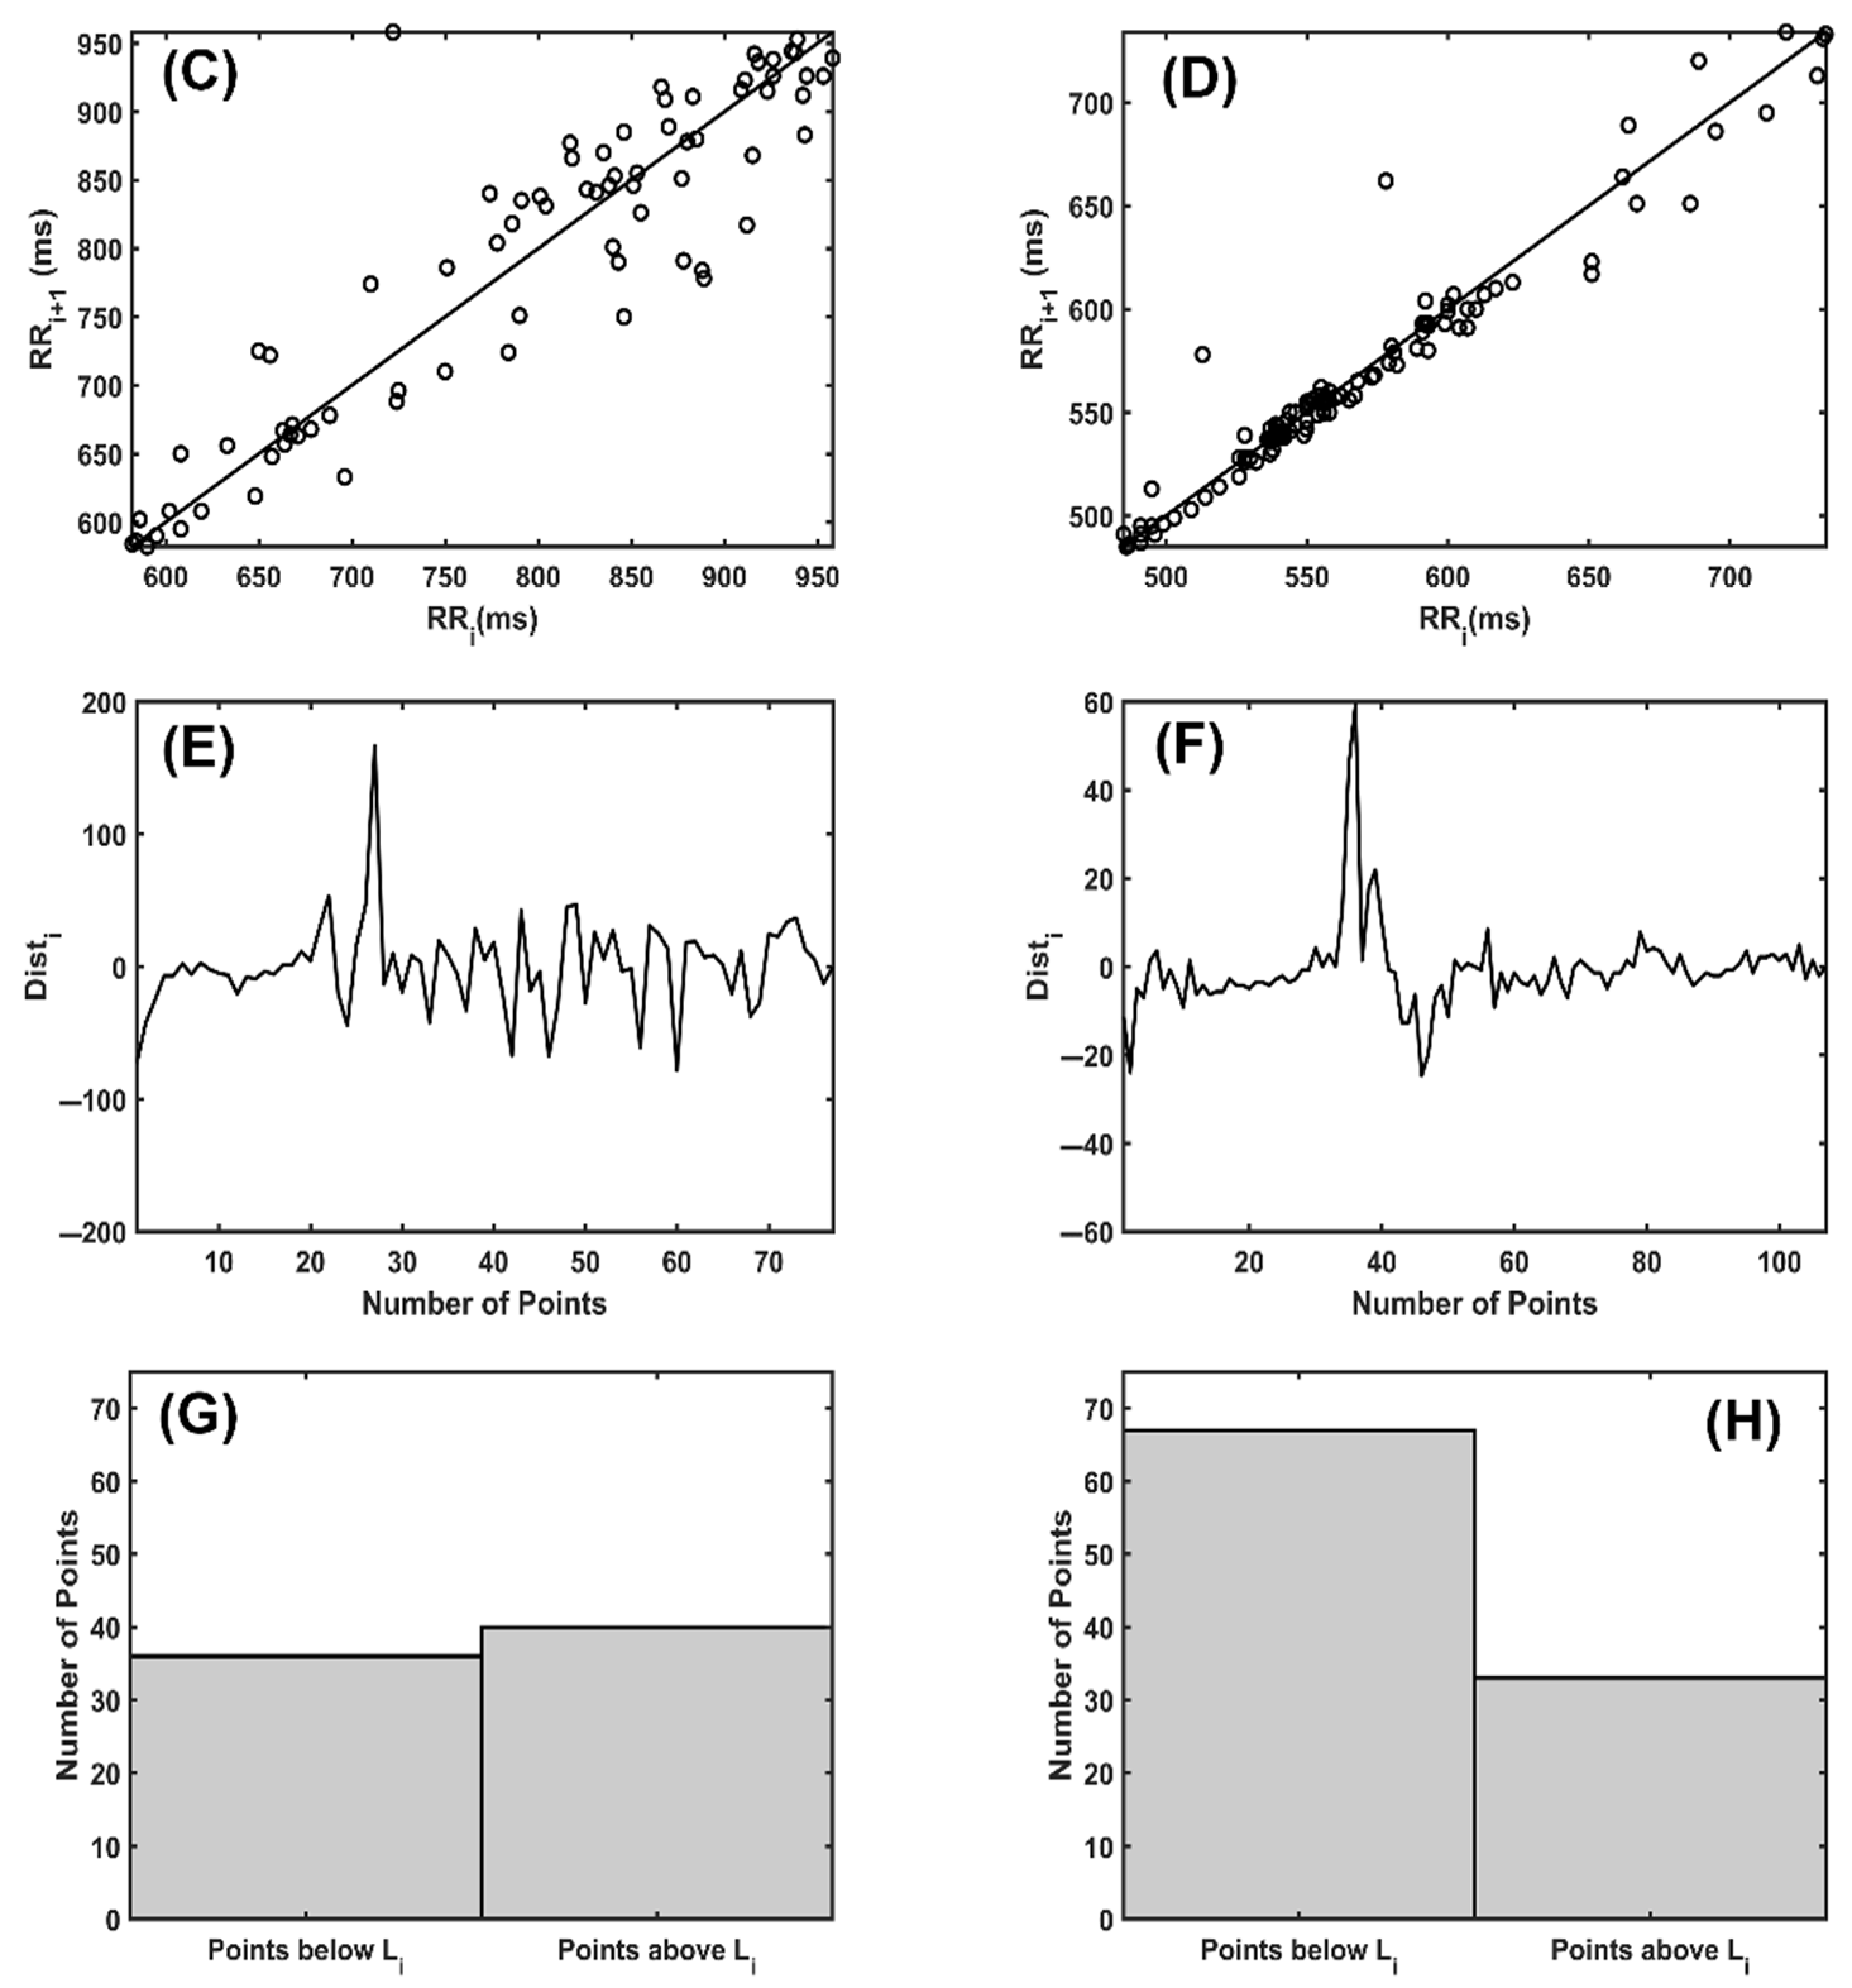
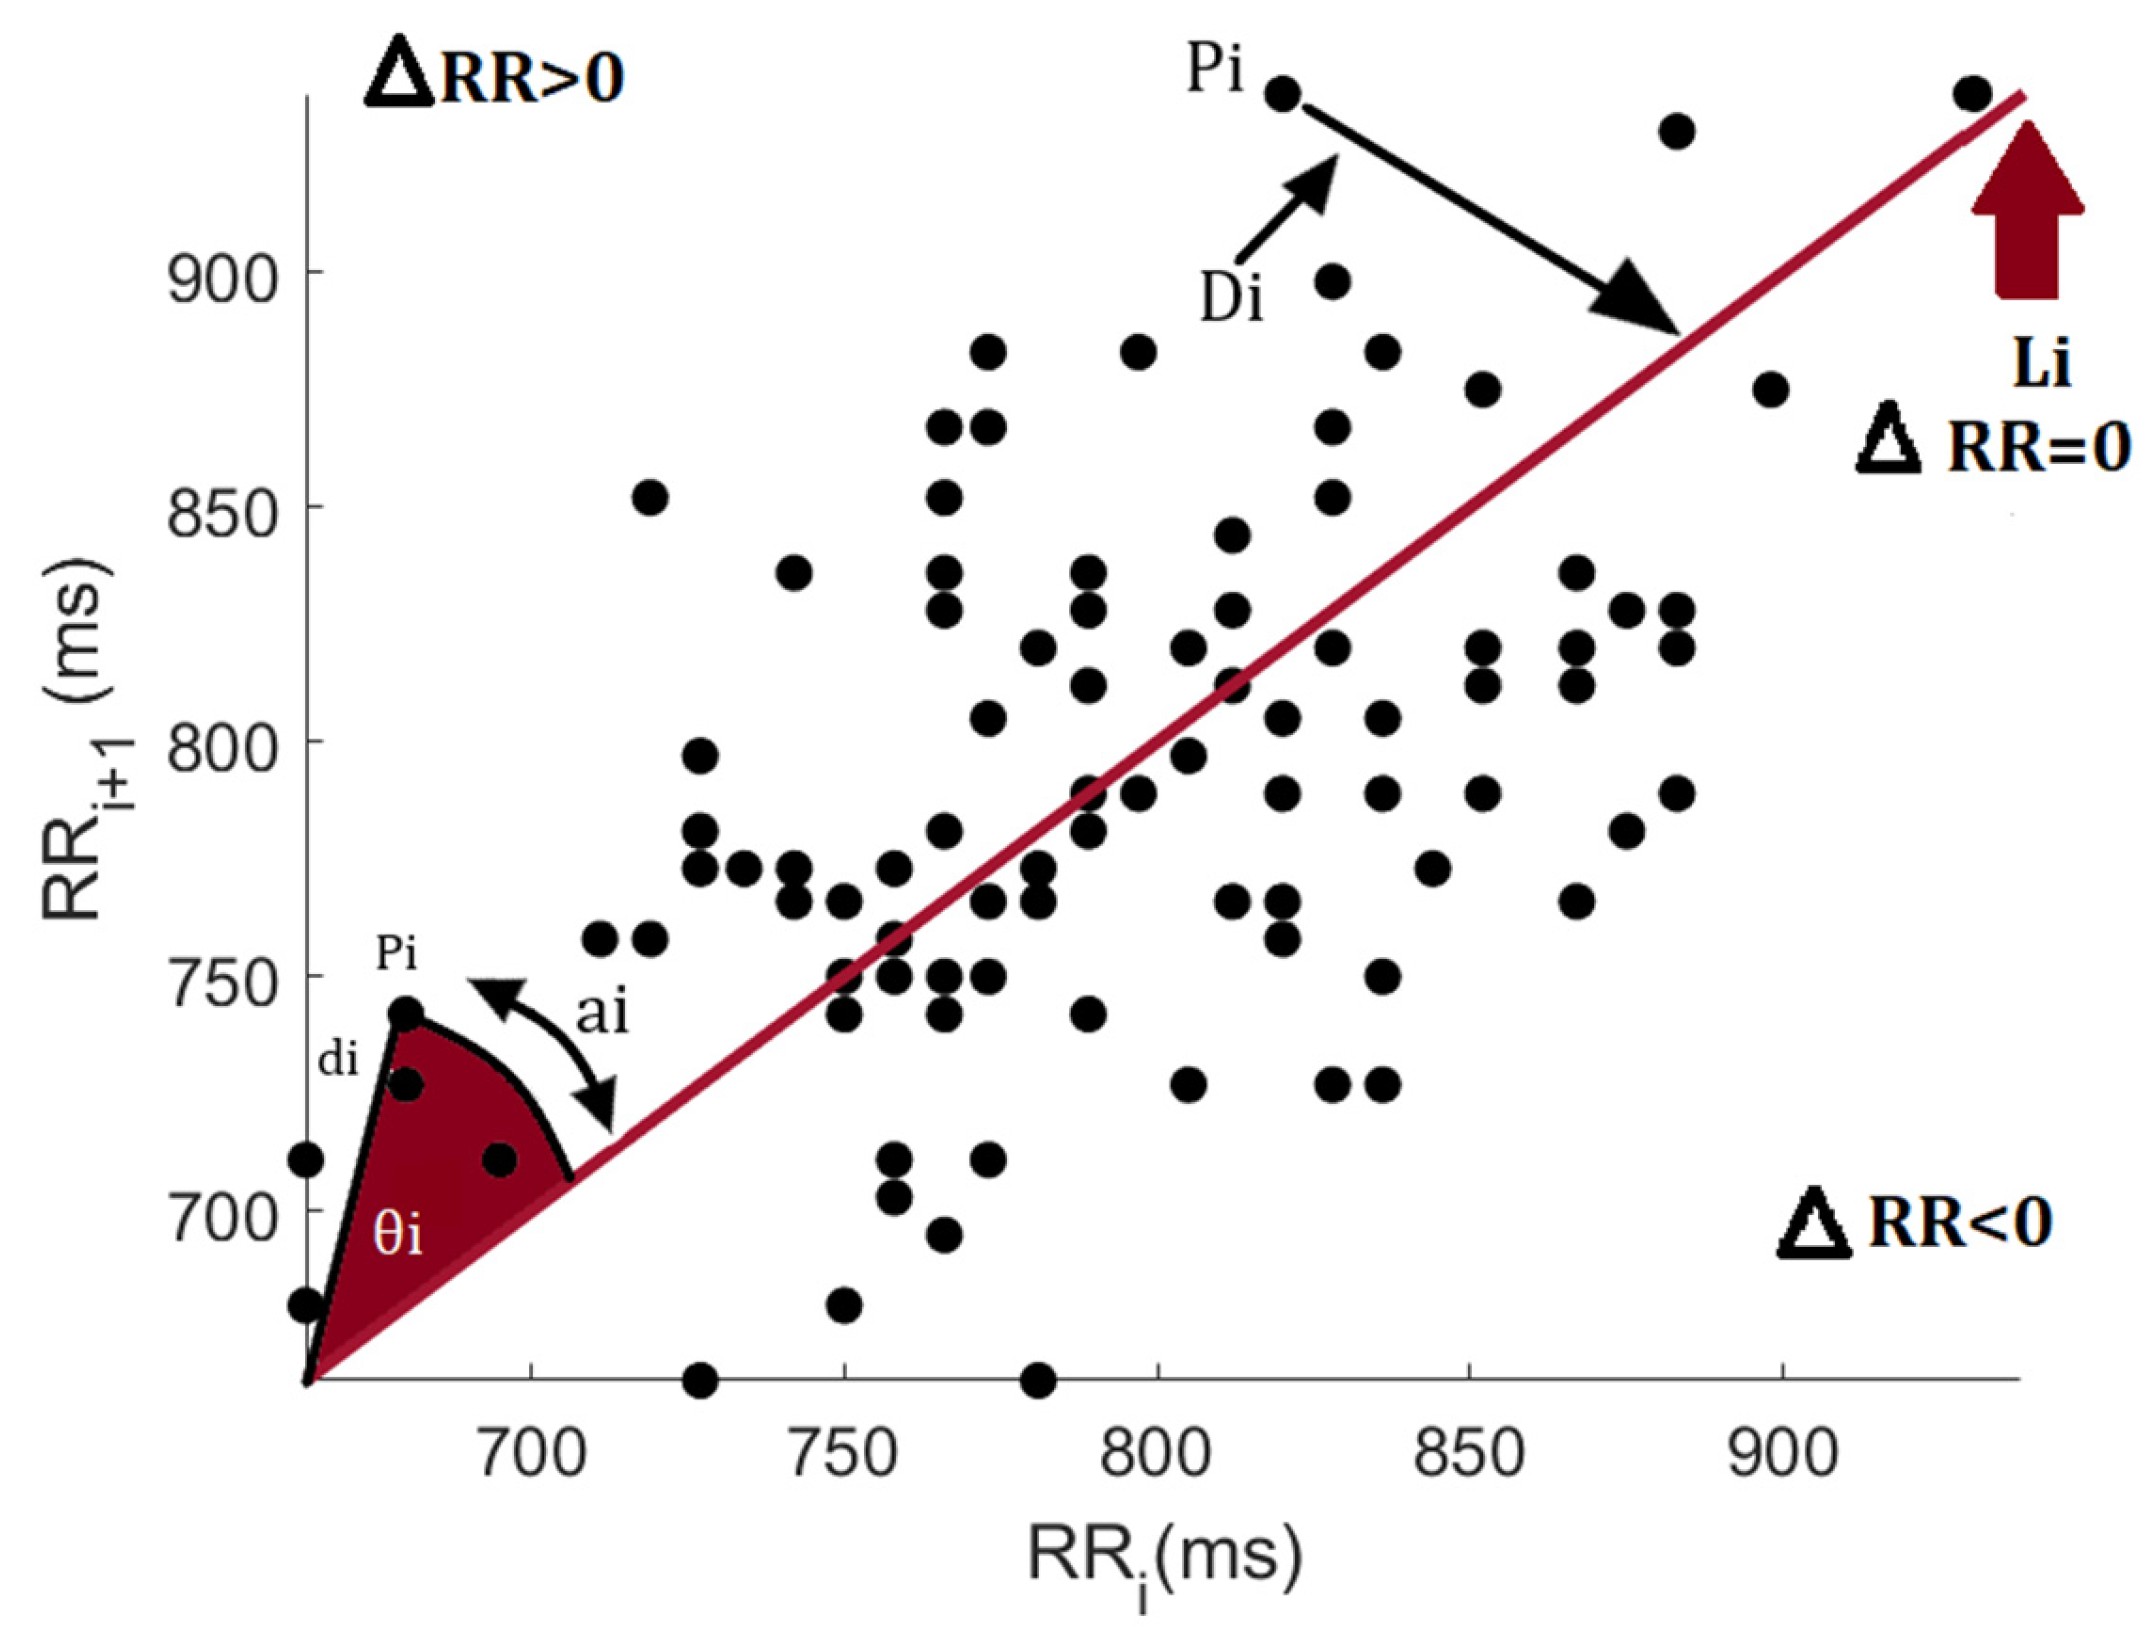
2.3. Heart Rate Asymmetry Assessment

The Poincaré plot was used to create the HRA indices. Figure 1 depicts a representative Poincaré plot. The line of identity (LI) is a diagonal line in the plot that separates it into two areas. The points above the LI indicate an elongation of the RR interval or a deceleration in heart rate ( Δ R R > 0 ), whereas the points below the LI indicate a shortening of the RR interval or an acceleration in heart rate ( Δ R R < 0 ). The Di represents the perpendicular distance between a point (Pi) and the LI. θ i is the phase angle formed by the LI and the line connecting a Pi with the origin. The sectional region corresponding to the point Pi is highlighted in Figure 1. After the data filtering process [20], the following indices of HRA were calculated using Matlab® software (the MathWorks, Inc., Natick, MA, USA) and PyBios [21].

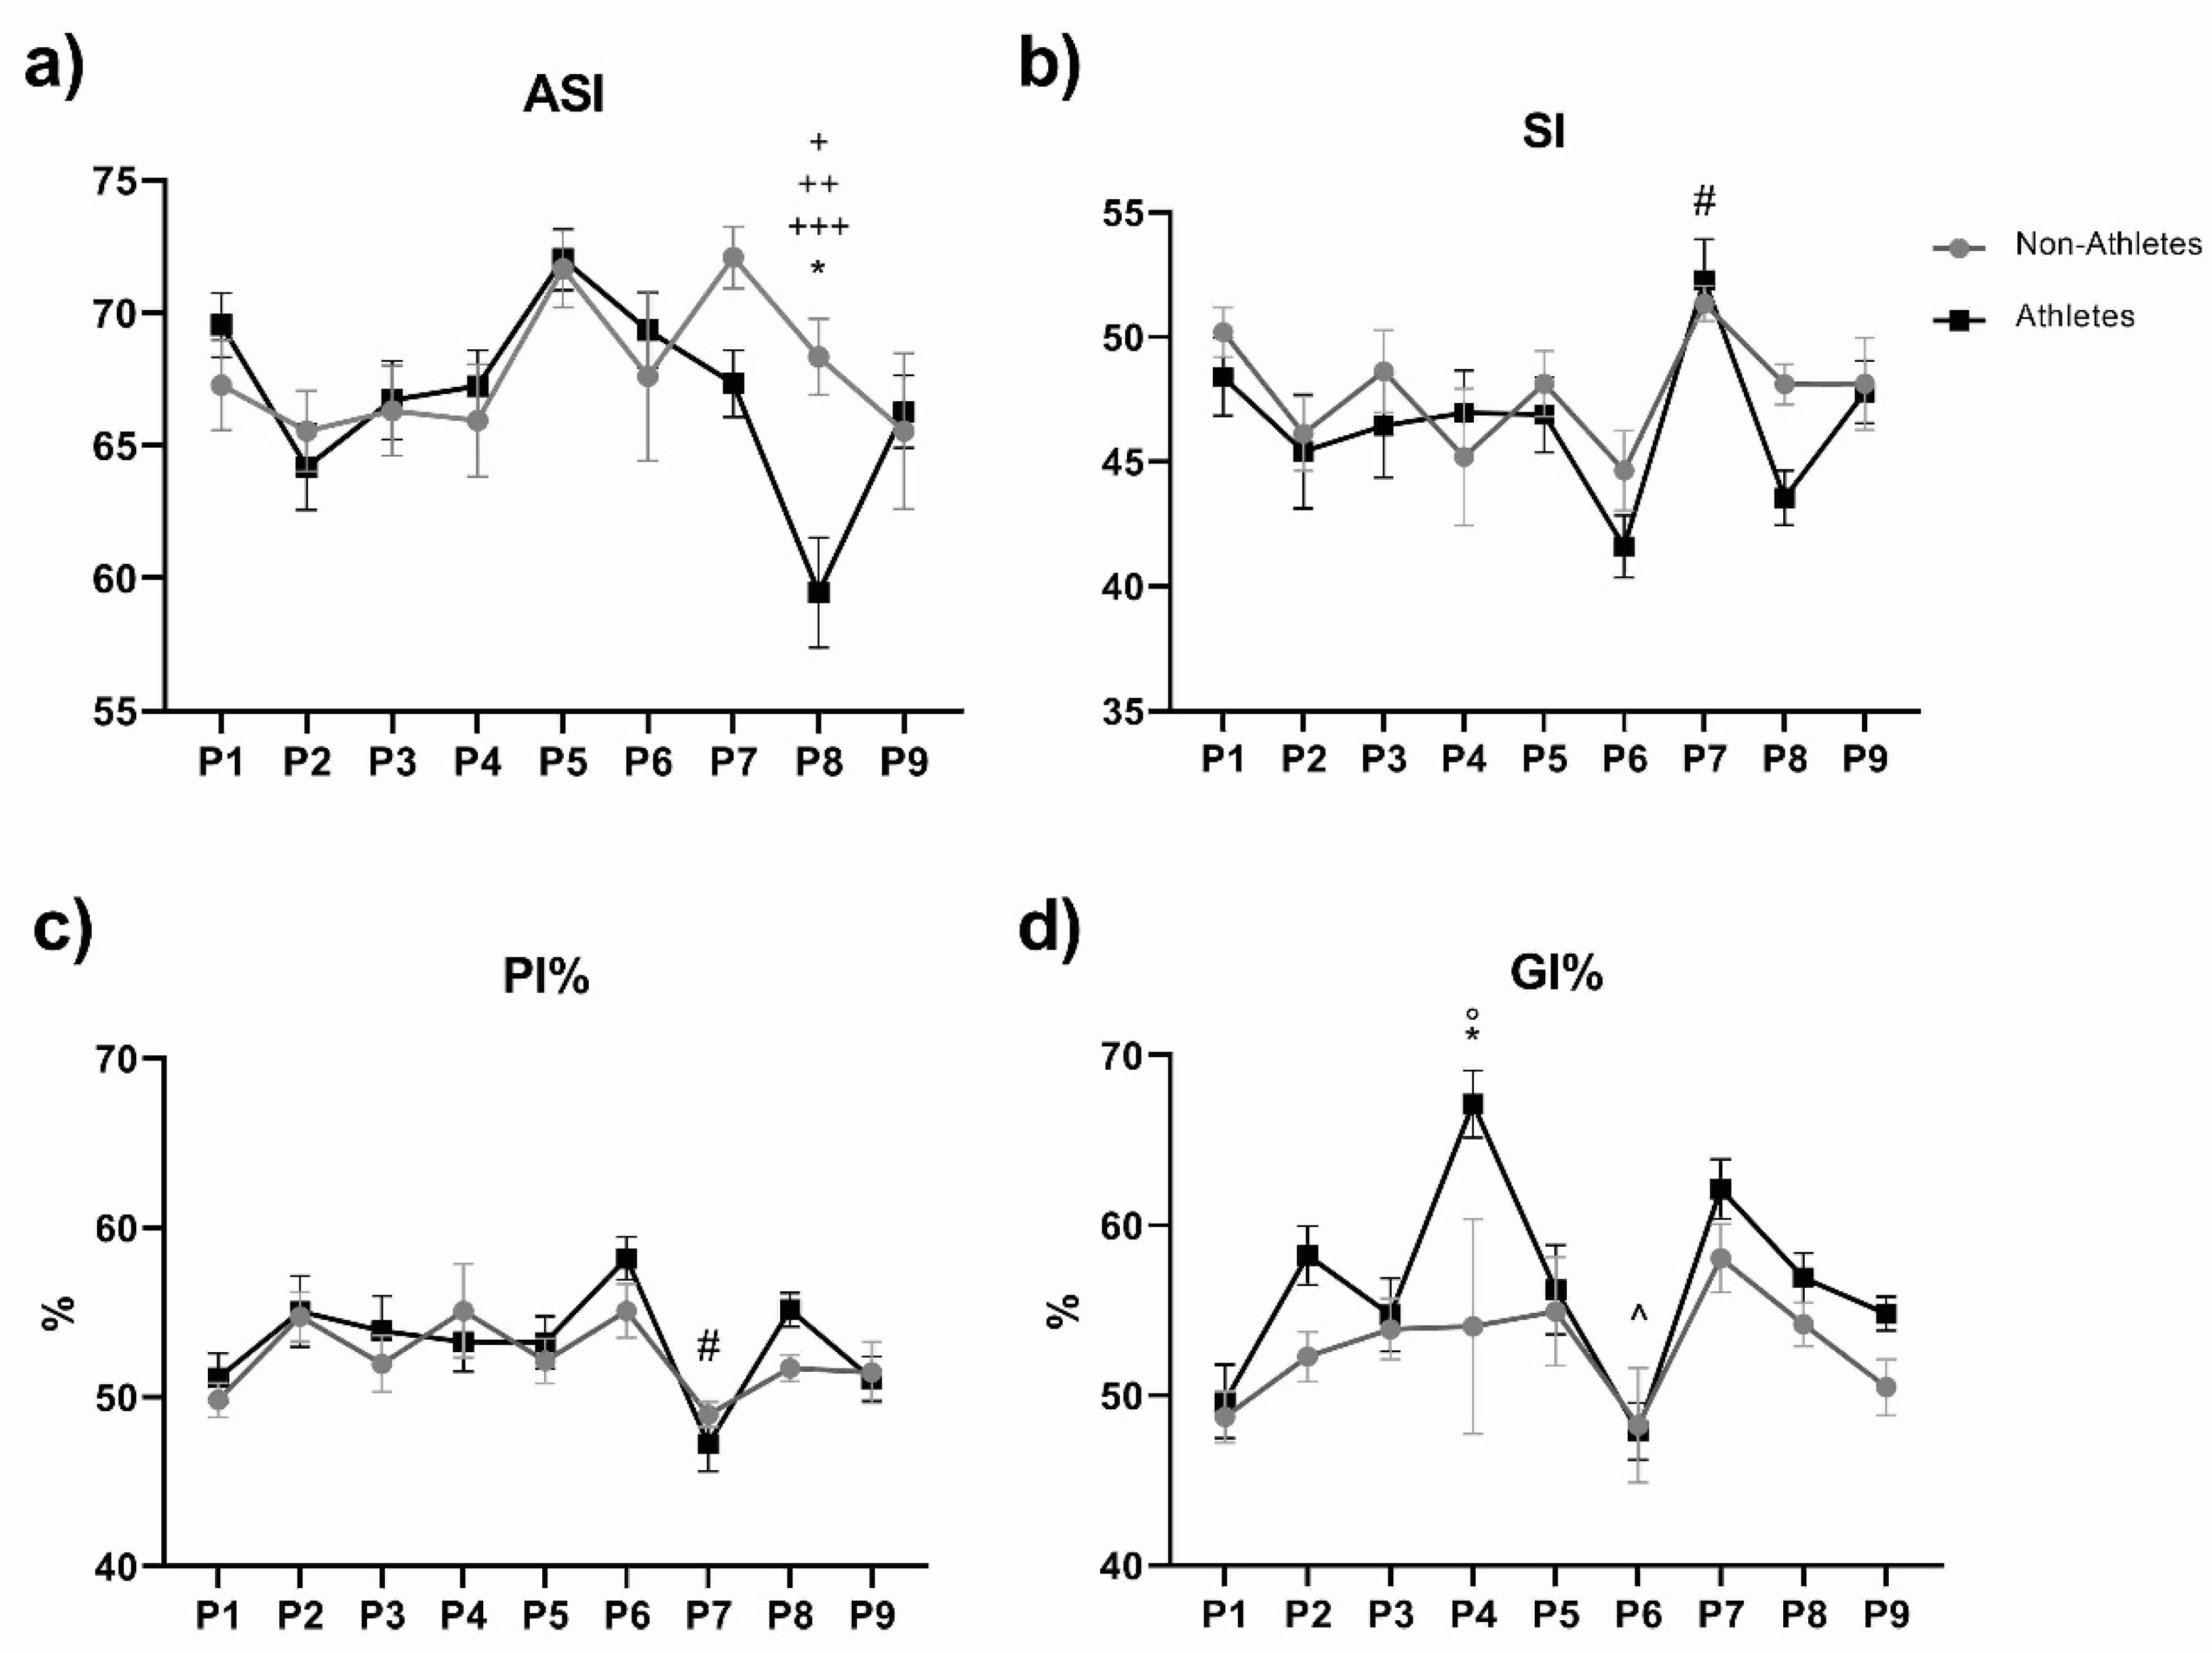
2.3.1. Porta’s Index (PI%)

Porta’s Index denotes asymmetry in the total number of instances of heart rate accelerations and decelerations over a given time interval. The number of points above the LI ( Δ R R ) divided by the total number of points in the plot, excluding points on the LI [22], is defined as PI%.
PI % = N   ( Δ R R ) N   ( Δ R R   0 )   · 100

2.3.2. Guzik’s Index (GI%)

Guzik’s index (GI%) is defined as the percentage of the distance by the points above LI with respect to the total distance and can be represented as [23].
GI % = i = 1 N   ( Δ R R + ) Δ R R +   ( i ) 2 i = 1 N   ( Δ R R ) Δ R R   ( i ) 2   · 100

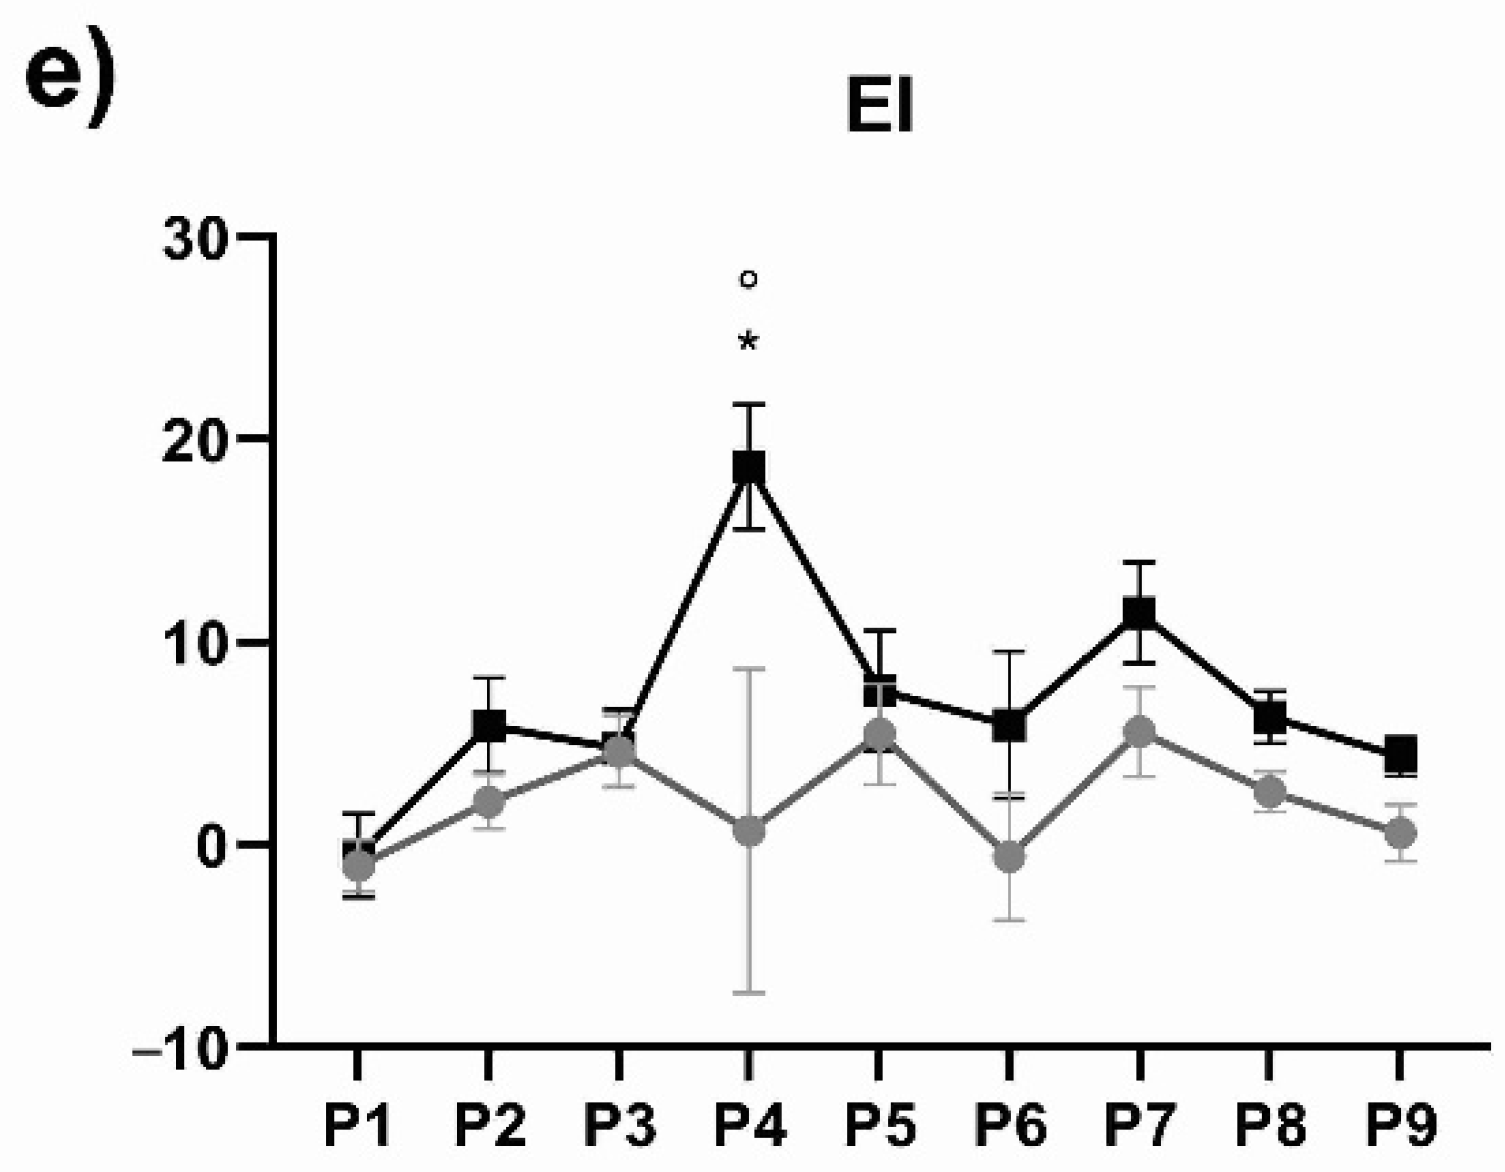
2.3.3. Ehler’s Index (EI)

Ehler’s index (EI) is calculated based on the skewness of the distribution of Δ R R . If EI > 0, the distribution is skewed to the right, and if EI < 0, the distribution is skewed to the left [24].
EI = i = 1 N   ( Δ R R ) Δ R R   ( i ) 3 ( i = 1 N   ( Δ R R ) Δ R R   ( i ) 2 ) 3 / 2

2.3.4. Slope Index (SI)

The slope angles between the LI and the line joining the point Pi were first determined using the θ i = t a n 1 R R i R R i 1 formula. Based on the placements of the points in the plot, the slope angles were then classified as negative or positive. If a point is above the LI, the associated slope angle is positive, and the corresponding slope angle is negative below the LI. Finally, the SI was calculated by dividing the total of positive slope angles by the sum of all slope angles [25,26] as follows:
SI = j = 1 m θ j k = 1 n θ k + j = 1 m θ j
where m is the number of points above the LI, and n is the number of points below the LI.

2.3.5. Asymmetric Spread Index (ASI)

The ASI measures asymmetry in the Poincaré plot spread above and below the LI. First, as shown in Figure 1, the slope of each scatter point ( θ i ) from the origin and its distance from the origin ( d i ) were calculated. After this, the arc length of each scatter point was calculated as a i = θ i · d i . The ASI was calculated by dividing the standard deviation of arc length for points above the LI by twice the standard deviation of arc length for all points, excluding those on the LI [26]. ASI is defined mathematically as:
ASI = j = 1 m ( a j a ¯ ) 2 m 2 · k = 1 m + n ( a k a ¯ ) 2 m + n
where a ¯ = j = 1 m a j m .
Notably, physiologic RR series show more asymmetry if median GI%, PI%, SI, and ASI values are far from symmetry (50%).

2.3.6. Statistical Analysis

The data were analyzed using GraphPad Prism software (version 8.02, by Dotmatics, San Diego, CA, USA). The Shapiro-Wilk test assessed the normality of the distributions of HRA indices. Normally distributed data are descriptively presented with means and standard error of the mean (SEM). Group and phase differences were assessed using a two-way repeated-measures ANOVA with post hoc Holm-Sidak correction for multiple comparisons. P-values less than 0.01 were considered statistically significant.

3. Results

Figure 2 shows the mean values ± SEM (standard error of the mean) of HRA indices for each group for the nine phases of the autonomic function test. We found statical differences in mean values of ASI between non-athletes and athletes in the recovery phase (P8) (Figure 2a; 68.3 ± 5.0 vs. 59.5 ± 8.0, p = 0.003, respectively). The differences were not statistically significant for SI and PI% between the groups in any phase (Figure 2b,c). Interestingly, both GI% and EI revealed statistical differences in mean values between non-athletes and athletes in the orthostatic challenge phase (P4); GI%: Figure 2d; 54.1 ± 21.9 vs. 67.8 ± 7.6, p < 0.001, and EI: Figure 2e; 0.7 ± 27.8 vs. 18.7 ± 11.9, p < 0.0001, respectively.
Furthermore, our results show significant differences in HRA among several phases of the autonomic function test only for the athletes group: ASI exhibited differences (p < 0.01) in the following phases, P1 vs. P8 (69.5 ± 4.7 vs. 59.5 ± 8.0); P5 vs. P8 (72.0 ± 4.5 vs. 59.5 ± 8.0); P6 vs. P8 (69.3 ± 5.4 vs. 59.5 ± 8.0), Figure 2a. SI indicated differences between P6 vs. P7 (41.6 ± 4.8 vs. 52.3 ± 6.4), Figure 2b; PI% showed differences between P6 vs. P7 (58.2 ± 4.9 vs. 47.3 ± 6.3), Figure 2c; GI% revealed differences between P1 vs. P4 (49.8 ± 7.8 vs. 67.8 ± 7.6) and P4 vs. P6 (67.8 ± 7.6 vs. 49.6 ± 9.1), Figure 2d. Finally, EI exhibited differences between P1 vs. P4 (-0.5 ± 8.0 vs. 18.7 ± 11.9), Figure 2e. Notably, no significant differences were found among phases in the non-athletes group.
Figure 3 depicts typical RR interval traces for one participant from each group in P4 (A and B). Subplots C–D show the Poincaré plots that correspond to the RR intervals, and subplots E–F show the distance (Di) of each point in the plot. These distances are used to calculate the HRA index GI%, obtained using Equation (2). The number of points above and below the LI in subplots G–H corresponds to Poincaré plots in subplots C–D.

4. Discussion

The present study evaluated short-term HRA differences between athletes and non-athletes under an autonomic function test. This test included a postural change from supine to standing upright (P4). It is known that this postural maneuver produces a natural stimulus that leads to sympathetic excitation and vagal withdrawal in the heart [27]. Our results indicate that changing position from supine to standing upright has a different effect on short-term HRA in athletes compared to non-athletes. This change is reflected in the increased number and magnitude of decelerations (indicated by higher GI% and EI values, Figure 2d,e) in athletes compared to non-athletes. Our results suggest that athletes may manifest increased vagal activity compared with non-athletes [28]. The typical example presented in Figure 3G,H aligns with this assumption because the number of points below the LI (accelerations) in athletes is less than that in non-athletes. Furthermore, the number of points above the LI (decelerations) in athletes is consistently higher than the number of points in non-athletes.
Exercise interventions in healthy young volunteers increase vagal influences during supine, rising, and standing maneuvers [29]. Moreover, evidence has shown that exercise induces changes in parasympathetic and sympathetic outflow, which can be extracted through orthostatic response measurements when changing from supine to standing position, thereby detecting changes in the cardiovascular autonomic response of the ANS [29]. Evidence has revealed that sympathetic regulation is activated in response to an orthostatic challenge in athletes [30]. In addition, findings have shown that during an orthostatic challenge, athletes exhibit higher values in the time domain indices of HRV than controls [25], which may be related to increased HRA.
According to Mendes et al., regular physical activity causes an increase in HRV, indicating that athletes have a reduced risk of cardiovascular illness compared to sedentary people who have a higher risk [31]. Additional studies suggest that lower values of GI% are associated with physical stress phases, and that signals become more random (show a reduction in asymmetry).
Another relevant result is the ASI mean values in the second minute of recovery after exercise (P8). Our results reveal that lower short-term HRA is manifested in athletes compared to non-athletes. Rohila and Sharma reported that asymmetry in subjects with congestive heart failure and arrhythmia was higher than normal sinus rhythm [26]. They proposed that an ASI value of 50 indicates a balanced response by both sympathetic tone and parasympathetic tone. Thus, high-performance athletes may exhibit a more stable sympathetic and parasympathetic response post-exercise compared to non-athletes. Previous evidence consistently indicates a positive connection with combined sympathetic–parasympathetic modulation in the 3rd and 5th minutes after exercise in healthy men [32].
Comparisons between the phases showed that only athletes manifested significant differences in the autonomic function test phases. For example, sympathetic cardiac activity (indicated by PI%) was increased in exercise (P6) compared to recovery (P7). Contrary to our expectations, parasympathetic cardiac activity (indicated by GI% and EI) was increased in the standing position (P4) compared to the supine position (P1). Evidence indicates that vagally mediated HRV during standing increases in response to functional overreaching in athletes (indicating potential parasympathetic hyperactivity) and improves athletes’ performance [33]. The ASI index could indicate a more balanced response by both sympathetic activity and parasympathetic activity compared to the supine position (P1), prolonged standing (P5), and exercise (P6) in athletes.
There are some potential limitations to our study that should be considered. We did not consider sex differences in HRV calculations due to sample size limitations; however, evidence shows that male athletes constantly demonstrate higher sympathetic activity markers after an orthostatic challenge than female athletes [34]. In addition, we did not examine the menstrual cycle of female athletes in the autonomic function test, however it is known that HRV indices can be affected by the menstrual cycle [35].
We suggest that widely recognized autonomic tests (e.g., deep breathing, cold pressure tests, and handgrip) should be applied in future studies for a more comprehensive understanding of the physiological meaning of HRA in athletes. Nevertheless, the autonomic function test used in this exploratory study contains relevant well-known maneuvers widely applied for cardiovascular autonomic control evaluation, such as controlled ventilation (P2 and P3) related to cardiac vagal activation [36] and the transition from supine to standing position (P4) that initiates parasympathetic withdrawal and activation of the sympathetic nervous system [37].
From a clinical standpoint, researchers suggest that novel HRA indices are more suitable for short-term applications and have greater robustness compared to existing methods [38]. Moreover, studies recommend using HRA in any HRV-based study as an additional marker that is capable of highlighting a unique feature of cardiac regulation that is not fully addressed by other traditional HRV markers [39]. Given that HRA is a novel feature for exploring cardiac autonomic changes, no special considerations have been made to standardize its application. However, it is known that the length of RR interbeat intervals is crucial in the analysis of HRA [26]. Relevant studies have suggested that novel and more robust HRA indices must be analyzed because they are not affected by signal length [26].
Our research, which focused on short-term HRA analysis, might open the possibility of incorporating real-time HRV monitoring into modern wearable devices, such as wristwatches or cell phones with integrated ECG/heart rate measurement modules for the daily monitoring of HRV in athletes. Nonetheless, more evidence is needed to elucidate the physiological processes involved in HRA changes. Future research should focus on HRA on multiple scales in order to better understand the physiological mechanisms in athletes.
Finally, translational research investigating the autonomic nervous system’s control and regulatory mechanisms on athletes’ cardiovascular function is urgently desired, preferably with a multidisciplinary approach involving biomedical engineers, physicians, exercise physiologists, and coaches [40].

5. Conclusions

Changes in heart rate asymmetry between high-performance athletes and non-athletes were found under an autonomic function test. Specifically, high-performance athletes manifested a higher number and magnitude of cardiac decelerations than non-athletes after an orthostatic challenge (indicated by GI% and EI). These results suggest that athletes may manifest increased vagal activity compared with non-athletes. Moreover, a lower HRA was found in athletes in the recovery phase compared to non-athletes (indicated by ASI). Thus, changes in short-term HRA probably reflect the adaptation of the autonomic nervous system to sporting activity in high-performance athletes. Differences in short-term HRA across phases of the autonomic function test may suggest that the analysis of heart rate asymmetry is a potential complementary tool for monitoring the health status of athletes.

Author Contributions

Conceptualization, Y.M.-P.; methodology, V.N.S.-G.; software, V.N.S.-G. and J.J.R.-L.; validation, J.J.R.-L. and V.N.S.-G.; formal analysis, V.N.S.-G. and Y.M.-P.; investigation, Y.M.-P.; resources, Y.M.-P. and V.N.S.-G.; data curation, V.N.S.-G.; writing—original draft preparation, Y.M.-P., V.N.S.-G., L.J.T.-T., M.A.C.-H., A.C.P.-C. and J.J.R.-L.; writing—review and editing, Y.M.-P., V.N.S.-G., L.J.T.-T., M.A.C.-H., A.C.P.-C. and J.J.R.-L.; supervision, J.J.R.-L.; project administration, Y.M.-P. and J.J.R.-L.; funding acquisition, Y.M.-P., L.J.T.-T. and M.A.C.-H. All authors have read and agreed to the published version of the manuscript.

Funding

The APC for this research was funded by Dirección General de Investigaciones of Universidad Santiago de Cali under call No. 01-2022. This research has been funded by the Institucion Universitaria Escuela Nacional del Deporte.

Institutional Review Board Statement

The study was conducted in accordance with the Declaration of Helsinki, and approved by the Ethics Committee CIREH of Universidad del Valle (protocol code 018-019 approved on 10 October 2019).

Informed Consent Statement

Informed consent was obtained from all subjects involved in the study.

Data Availability Statement

Not applicable.

Acknowledgments

To the Institución Universitaria Escuela Nacional del Deporte, Universidad Santiago de Cali, and the Universidad del Valle.

Conflicts of Interest

The authors declare no conflict of interest.

References

  1. Malik, M. Task Force Heart Rate Variability. Standards of measurement, physiological interpretation, and clinical use. Task Force of The European Society of Cardiology and the North American Society for Pacing and Electrophysiology. Eur. Heart J. 1996, 17, 354–381. [Google Scholar] [CrossRef] [Green Version]
  2. Malik, M.; Hnatkova, K.; Huikuri, H.V.; Lombardi, F.; Schmidt, G.; Zabel, M. CrossTalk proposal: Heart rate variability is a valid measure of cardiac autonomic responsiveness. J. Physiol. 2019, 597, 2595–2598. [Google Scholar] [CrossRef]
  3. Makivić, B.; Nikić, M.D.; Willis, M.S. Heart Rate Variability (HRV) as a Tool for Diagnostic and Monitoring Performance in Sport and Physical Activities. J. Exerc. Physiol. Online 2013, 16, 103–131. [Google Scholar]
  4. Bricout, V.A.; DeChenaud, S.; Favre-Juvin, A. Analyses of heart rate variability in young soccer players: The effects of sport activity. Auton. Neurosci. Basic Clin. 2010, 154, 112–116. [Google Scholar] [CrossRef]
  5. Udayanga, M.A.S. Heart Rate Variability (HRV) for sports and exercise training. Sri Lankan J. Sport. Exerc. Med. 2018, 1, 13. [Google Scholar] [CrossRef] [Green Version]
  6. Dong, J.G. The role of heart rate variability in sports physiology (Review). Exp. Ther. Med. 2016, 11, 1531–1536. [Google Scholar] [CrossRef] [Green Version]
  7. Voss, A.; Schroeder, R.; Vallverdú, M.; Schulz, S.; Cygankiewicz, I.; Vázquez, R.; Bayés de Luna, A.; Caminal, P. Short-term vs. long-term heart rate variability in ischemic cardiomyopathy risk stratification. Front. Physiol. 2013, 4, 364. [Google Scholar] [CrossRef] [Green Version]
  8. Spasić, S.Z.; Kesić, S. Editorial: Nonlinearity in living systems: Theoretical and practical perspectives on metrics of physiological signal complexity. Front. Physiol. 2019, 10, 298. [Google Scholar] [CrossRef]
  9. Klintworth, A.; Ajtay, Z.; Paljunite, A.; Szabados, S.; Hejjel, L. Heart rate asymmetry follows the inspiration/expiration ratio in healthy volunteers. Physiol. Meas. 2012, 33, 1717–1731. [Google Scholar] [CrossRef]
  10. Wang, X.; Yan, C.; Shi, B.; Liu, C.; Karmakar, C.; Li, P. Does the Temporal Asymmetry of Short-Term Heart Rate Variability Change during Regular Walking? A Pilot Study of Healthy Young Subjects. Comput. Math. Methods Med. 2018, 2018, 3543048. [Google Scholar] [CrossRef]
  11. Visnovcova, Z.; Mestanik, M.; Javorka, M.; Mokra, D.; Gala, M.; Jurko, A.; Calkovska, A.; Tonhajzerova, I. Complexity and time asymmetry of heart rate variability are altered in acute mental stress. Physiol. Meas. 2014, 35, 1319–1334. [Google Scholar] [CrossRef]
  12. Kaczmarek, L.D.; Behnke, M.; Enko, J.; Kosakowski, M.; Hughes, B.M.; Piskorski, J.; Guzik, P. Effects of emotions on heart rate asymmetry. Psychophysiology 2019, 56, e13318. [Google Scholar] [CrossRef]
  13. Tonhajzerová, I.; Ondrejka, I.; Farský, I.; Višňovcová, Z.; Mešťaník, M.; Javorka, M.; Jurko, A.; Čalkovská, A. Attention deficit/hyperactivity disorder (ADHD) is associated with altered heart rate asymmetry. Physiol. Res. 2014, 63, S509–S519. [Google Scholar] [CrossRef]
  14. Shi, B.; Wang, L.; Yan, C.; Chen, D.; Liu, M.; Li, P. Nonlinear heart rate variability biomarkers for gastric cancer severity: A pilot study. Sci. Rep. 2019, 9, 13833. [Google Scholar] [CrossRef] [Green Version]
  15. Pawłowski, R.; Buszko, K.; Newton, J.L.; Kujawski, S.; Zalewski, P. Heart Rate Asymmetry Analysis During Head-Up Tilt Test in Healthy Men. Front. Physiol. 2021, 12, 657902. [Google Scholar] [CrossRef]
  16. Kiss, O.; Sydó, N.; Vargha, P.; Vágó, H.; Czimbalmos, C.; Édes, E.; Zima, E.; Apponyi, G.; Merkely, G.; Sydó, T.; et al. Detailed heart rate variability analysis in athletes. Clin. Auton. Res. 2016, 26, 245–252. [Google Scholar] [CrossRef]
  17. Hottenrott, L.; Gronwald, T.; Hottenrott, K.; Wiewelhove, T.; Ferrauti, A. Utilizing Heart Rate Variability for Coaching Athletes During and After Viral Infection: A Case Report in an Elite Endurance Athlete. Front. Sport. Act. Living 2021, 3, 612782. [Google Scholar] [CrossRef]
  18. Tafur Tascón, L.J.; Cabrera Hernandez, M.A.; Neisa Herrera, L.F.; García-Corzo, S.A.; Povea Combariza, C.H.; Tejada Rojas, C.X. Autonomic modulation and association with the performance in a jump test in university Colombian players of rugby seven. J. Hum. Sport Exerc. 2019, 14, S1102–S1111. [Google Scholar]
  19. Gilgen-Ammann, R.; Schweizer, T.; Wyss, T. RR interval signal quality of a heart rate monitor and an ECG Holter at rest and during exercise. Eur. J. Appl. Physiol. 2019, 119, 1525–1532. [Google Scholar] [CrossRef]
  20. Wessel, N.; Voss, A.; Malberg, H.; Ziehmann, C.; Voss, H.U.; Schirdewan, A.; Meyerfeldt, U.; Kurths, J. Nonlinear analysis of complex phenomena in cardiological data. Herzschrittmachertherapie Elektrophysiologie 2000, 11, 159–173. [Google Scholar] [CrossRef]
  21. Silva, L.E.V.; Fazan, R.; Marin-Neto, J.A. PyBioS: A freeware computer software for analysis of cardiovascular signals. Comput. Methods Programs Biomed. 2020, 197, 105718. [Google Scholar] [CrossRef]
  22. Porta, A.; Casali, K.R.; Casali, A.G.; Gnecchi-Ruscone, T.; Tobaldini, E.; Montano, N.; Lange, S.; Geue, D.; Cysarz, D.; Van Leeuwen, P. Temporal asymmetries of short-term heart period variability are linked to autonomic regulation. Am. J. Physiol. Regul. Integr. Comp. Physiol. 2008, 295, 550–557. [Google Scholar] [CrossRef] [Green Version]
  23. Piskorski, J.; Guzik, P. Geometry of the Poincaré plot of RR intervals and its asymmetry in healthy adults. Physiol. Meas. 2007, 28, 287–300. [Google Scholar] [CrossRef] [Green Version]
  24. Ehlers, C.L.; Havstad, J.; Prichard, D.; Theiler, J. Low doses of ethanol reduce evidence for nonlinear structure in brain activity. J. Neurosci. 1998, 18, 7474–7486. [Google Scholar] [CrossRef]
  25. Karmakar, C.K.; Khandoker, A.H.; Palaniswami, M. Phase asymmetry of heart rate variability signal. Physiol. Meas. 2015, 36, 303–314. [Google Scholar] [CrossRef] [PubMed]
  26. Rohila, A.; Sharma, A. Asymmetric spread of heart rate variability. Biomed. Signal Process. Control 2020, 60, 101985. [Google Scholar] [CrossRef]
  27. Martinelli, F.S.; Chacon-Mikahil, M.P.T.; Martins, L.E.B.; Lima-Filho, E.C.; Golfetti, R.; Paschoal, M.A.; Gallo-Junior, L. Heart rate variability in athletes and non-athletes at rest and during head-up tilt. Braz. J. Med. Biol. Res. 2005, 38, 639–647. [Google Scholar] [CrossRef] [PubMed]
  28. Gourine, A.V.; Ackland, G.L. Cardiac vagus and exercise. Physiology 2019, 34, 71–80. [Google Scholar] [CrossRef]
  29. Grant, C.C.; Viljoen, M.; Janse van Rensburg, D.C.; Wood, P.S. Heart Rate Variability Assessment of the Effect of Physical Training on Autonomic Cardiac Control. Ann. Noninvasive Electrocardiol. 2012, 17, 219–229. [Google Scholar] [CrossRef] [Green Version]
  30. Rubchenya, I.N.; Sukach, E.S.; Merkis, A.P. Analysis of Heart Rate Variability in Young Athletes of a School of Olympic Reserve. Health Ecol. Issues 2019, 4, 70–75. [Google Scholar] [CrossRef]
  31. Mendes, J.; Pereira, J.; Pereira, T. Variability of Heart Rate in Athletes and Non Athletes. Eur. J. Public Health 2019, 29, ckz034.098. [Google Scholar] [CrossRef]
  32. Molina, G.E.; Fontana, K.E.; Porto, L.G.G.; Junqueira, L.F. Post-exercise heart-rate recovery correlates to resting heart-rate variability in healthy men. Clin. Auton. Res. 2016, 26, 415–421. [Google Scholar] [CrossRef] [PubMed]
  33. Bellenger, C.R.; Karavirta, L.; Thomson, R.L.; Robertson, E.Y.; Davison, K.; Buckley, J.D. Contextualizing parasympathetic hyperactivity in functionally overreached athletes with perceptions of training tolerance. Int. J. Sports Physiol. Perform. 2016, 11, 685–692. [Google Scholar] [CrossRef] [PubMed]
  34. Schäfer, D.; Gjerdalen, G.F.; Solberg, E.E.; Khokhlova, M.; Badtieva, V.; Herzig, D.; Trachsel, L.D.; Noack, P.; Karavirta, L.; Eser, P.; et al. Sex differences in heart rate variability: A longitudinal study in international elite cross-country skiers. Eur. J. Appl. Physiol. 2015, 115, 2107–2114. [Google Scholar] [CrossRef]
  35. Brar, T.K.; Singh, K.D.; Kumar, A. Effect of different phases of menstrual cycle on heart rate variability (HRV). J. Clin. Diagn. Res. 2015, 9, CC01–CC04. [Google Scholar] [CrossRef] [PubMed]
  36. De Souza, L.A.; Ferreira, J.B.; De Oliveira Schein, A.S.; Dartora, D.R.; Casali, A.G.; Scassola, C.M.C.; Tobaldini, E.; Montano, N.; Guzzetti, S.; Porta, A.; et al. Optimization of vagal stimulation protocol based on spontaneous breathing rate. Front. Physiol. 2018, 9, 1341. [Google Scholar] [CrossRef] [PubMed] [Green Version]
  37. Patel, K.; Rössler, A.; Lackner, H.K.; Trozic, I.; Laing, C.; Lorr, D.; Green, D.A.; Hinghofer-Szalkay, H.; Goswami, N. Effect of postural changes on cardiovascular parameters across gender. Medicine 2016, 95, e4149. [Google Scholar] [CrossRef] [PubMed]
  38. Yan, C.; Li, P.; Ji, L.; Yao, L.; Karmakar, C.; Liu, C. Area asymmetry of heart rate variability signal. Biomed. Eng. Online 2017, 16, 112. [Google Scholar] [CrossRef] [PubMed] [Green Version]
  39. de Maria, B.; Dalla Vecchia, L.A.; Maestri, R.; Pinna, G.D.; Parati, M.; Perego, F.; Bari, V.; Cairo, B.; Gelpi, F.; la Rovere, M.T.; et al. Lack of association between heart period variability asymmetry and respiratory sinus arrhythmia in healthy and chronic heart failure individuals. PLoS ONE 2021, 16, e0247145. [Google Scholar] [CrossRef]
  40. Aubert, A.E.; Seps, B.; Beckers, F. Heart Rate Variability in Athletes. Sport. Med. 2003, 33, 889–919. [Google Scholar] [CrossRef] [PubMed]
Figure 1. Poincaré plot of RR interval signal.
Symmetry 14 01229 g001
Figure 2. Mean values ± SEM of heart rate asymmetry (HRA) indices for athlete and non-athlete groups during the nine phases of the autonomic function test (P1 to P9); (a) asymmetric spread index (ASI), (b) slope index (SI), (c) Porta’s Index (PI%), (d) Guzik’s index (GI%) and (e) Ehler’s index (EI). * p < 0.01 between non-athletes vs. athletes; + p < 0.01 between P1 vs. P8 (athletes); ++ p < 0.01 between P5 vs. P8 (athletes); +++ p < 0.01 between P6 vs. P8 (athletes); # p < 0.01 between P6 vs. P7 (athletes); ° p < 0.01 between P1 vs. P4 (athletes); ^ p < 0.01 between P4 vs. P6 (athletes). Differences in means were analyzed using a Holm-Sidak post hoc test.
Symmetry 14 01229 g002aSymmetry 14 01229 g002b
Figure 3. A representative example of RR interval time series (A,B) for the two groups during the orthostatic challenge phase (P4); corresponding Poincaré plots (C,D); distance from the line of identity (E,F); and distribution of points below and above the line of identity (G,H).
Symmetry 14 01229 g003aSymmetry 14 01229 g003b
Publisher’s Note: MDPI stays neutral with regard to jurisdictional claims in published maps and institutional affiliations.

