1. Introduction
The reinforced concrete rib girder bridge is typical in existing bridge structures. As an important part of the roadway slab, it undertakes the task of directly bearing the wheel load and transferring the load to the main beam. In-service bridge travel lane slabs often experience plate surface cracking, plate surface concrete breakage, travel lane slab local brittle fracture, and other diseases. The main reason for this type of damage is the fatigue damage of the roadway slab due to the development of internal damage points in the reinforcement and concrete materials under repeated wheel loads. However, many countries still only consider the design of carriageway slabs using a static load, without taking the fatigue caused by heavy traffic into account [
1]. Thus, the fatigue study of reinforced concrete ribbed girder bridge travel lane slabs remains critical for fatigue-resistance design.
In recent years, scholars from various countries have conducted in-depth research on the development pattern of fatigue injury and resistance to fatigue injury, and good results have been achieved.
Research has been carried out on the fatigue damage mechanism of concrete materials [
2,
3,
4,
5,
6,
7,
8,
9], the final fatigue damage form of travelway slabs [
10,
11,
12], and the fatigue damage mechanism of travelway slabs [
13,
14]. Ferdous et al. studied the residual capacity of railroad ties after fatigue loading [
2] and predicted the fatigue life of GFRP composites [
3]. Hümme J et al. investigated further questions concerning strain and stiffness development and the combination of fatigue loading and marine environmental conditions with new test methods [
4]. Lanwer J P et al. investigated the bonded tensile properties of high-strength fiber concrete under fatigue loading using tensile fatigue tests [
7]. Deng P et al. studied the fatigue life prediction method of RC plates under stamping shear failure mode based on fracture mechanics [
11]. Yu T et al. investigated the effect of long-to-short edge ratio on the fatigue performance of ribbed girder bridge carriageway slabs [
14]. However, there is little in-depth research analyzing the residual bearing capacity of reinforced concrete travelway slabs after experiencing different fatigue load cycles, and how to evaluate and effectively predict their residual bearing capacity.
In addition, previous studies have mainly considered the effects of external factors on the fatigue performance of reinforced concrete carriageway slabs [
14]. These include fatigue loading stress level, the number of cycles of fatigue loading [
15], low-to-high stress ratio, the location of fatigue loading [
16], type of fatigue loading [
4], and environmental conditions [
17,
18,
19]. There are fewer studies on the effects arising from internal factors such as the width-to-height [
19] and length-to-width ratios [
14] of the travel lane slab. This has led to a lack of theoretical support for designers in the fatigue-resistant design of travel lanes.
In view of this, in this study, we carried out fatigue tests on a carriageway slab. The effect of fatigue load level and carriageway slab length to width and width to height ratios on the residual bearing capacity of the carriageway slab was studied based on the accumulation injury theory. A fatigue residual load-carrying capacity evaluation model was then established for travel lane slabs to provide a scientific basis for load-carrying capacity evaluation of in-service bridges and fatigue resistant design of a reinforced concrete ribbed girder bridge.
Compared with other studies, this thesis more comprehensively considers the influence of external factors and internal factors on the fatigue residual bearing capacity of the traveled way slab and establishes a prediction model of the residual bearing capacity of the traveled way slab with the influence of multiple factors, instead of the influence of a single factor. This makes the prediction model more realistic and reasonable. The results of the study can provide important theoretical support for the evaluation of residual load capacity and fatigue resistance design of bridges.
2. Experiment Overview
2.1. Overview of the Test Beam
In consideration of the limitations and costs of indoor testing, this test is based on a similar principle of designing a scaled-down travel lane slab with a model that focuses on the mechanical properties of concrete and tensile reinforcement.
Ziming Liu [
20] suggested that the mechanical properties of the prototype beam and the test beam can be studied by satisfying the following conditions: (1) the strain and reality remain equal; (2) the model stress is equal to reality; and (3) the strain or stress maintains a certain proportional relationship. According to these three conditions, similar ratios of bending moments and so on can be found using
Table 1. For parameters such as concrete strength grade, reinforcement location, reinforcement rate, and reinforcement strength grade model and prototype beams are kept the same, which simplifies the analysis, and it is seen that the geometric dimension ratio of the two is the ratio of the modulus of elasticity. Based on the similarity of the material modulus of elasticity and geometry combined with
Table 1, the similarity coefficients of each physical quantity of the model and prototype beams in
Table 2 can be derived. Therefore, this experimental model can replace the prototype beam and reflect the real bridge rib beam.
A symmetrical double T-beam model using two identical T-beams was designed with reference to the literature [
21]. The test model of the carriageway slab was designed with a symmetrical double T-beam. If the three-beam and two-plate are situated at the double-point plate loading, they will cancel each other out. As single-point loading has the most unfavorable working conditions, in favor of safety considerations, this paper calculates the single-point lane plate loading.
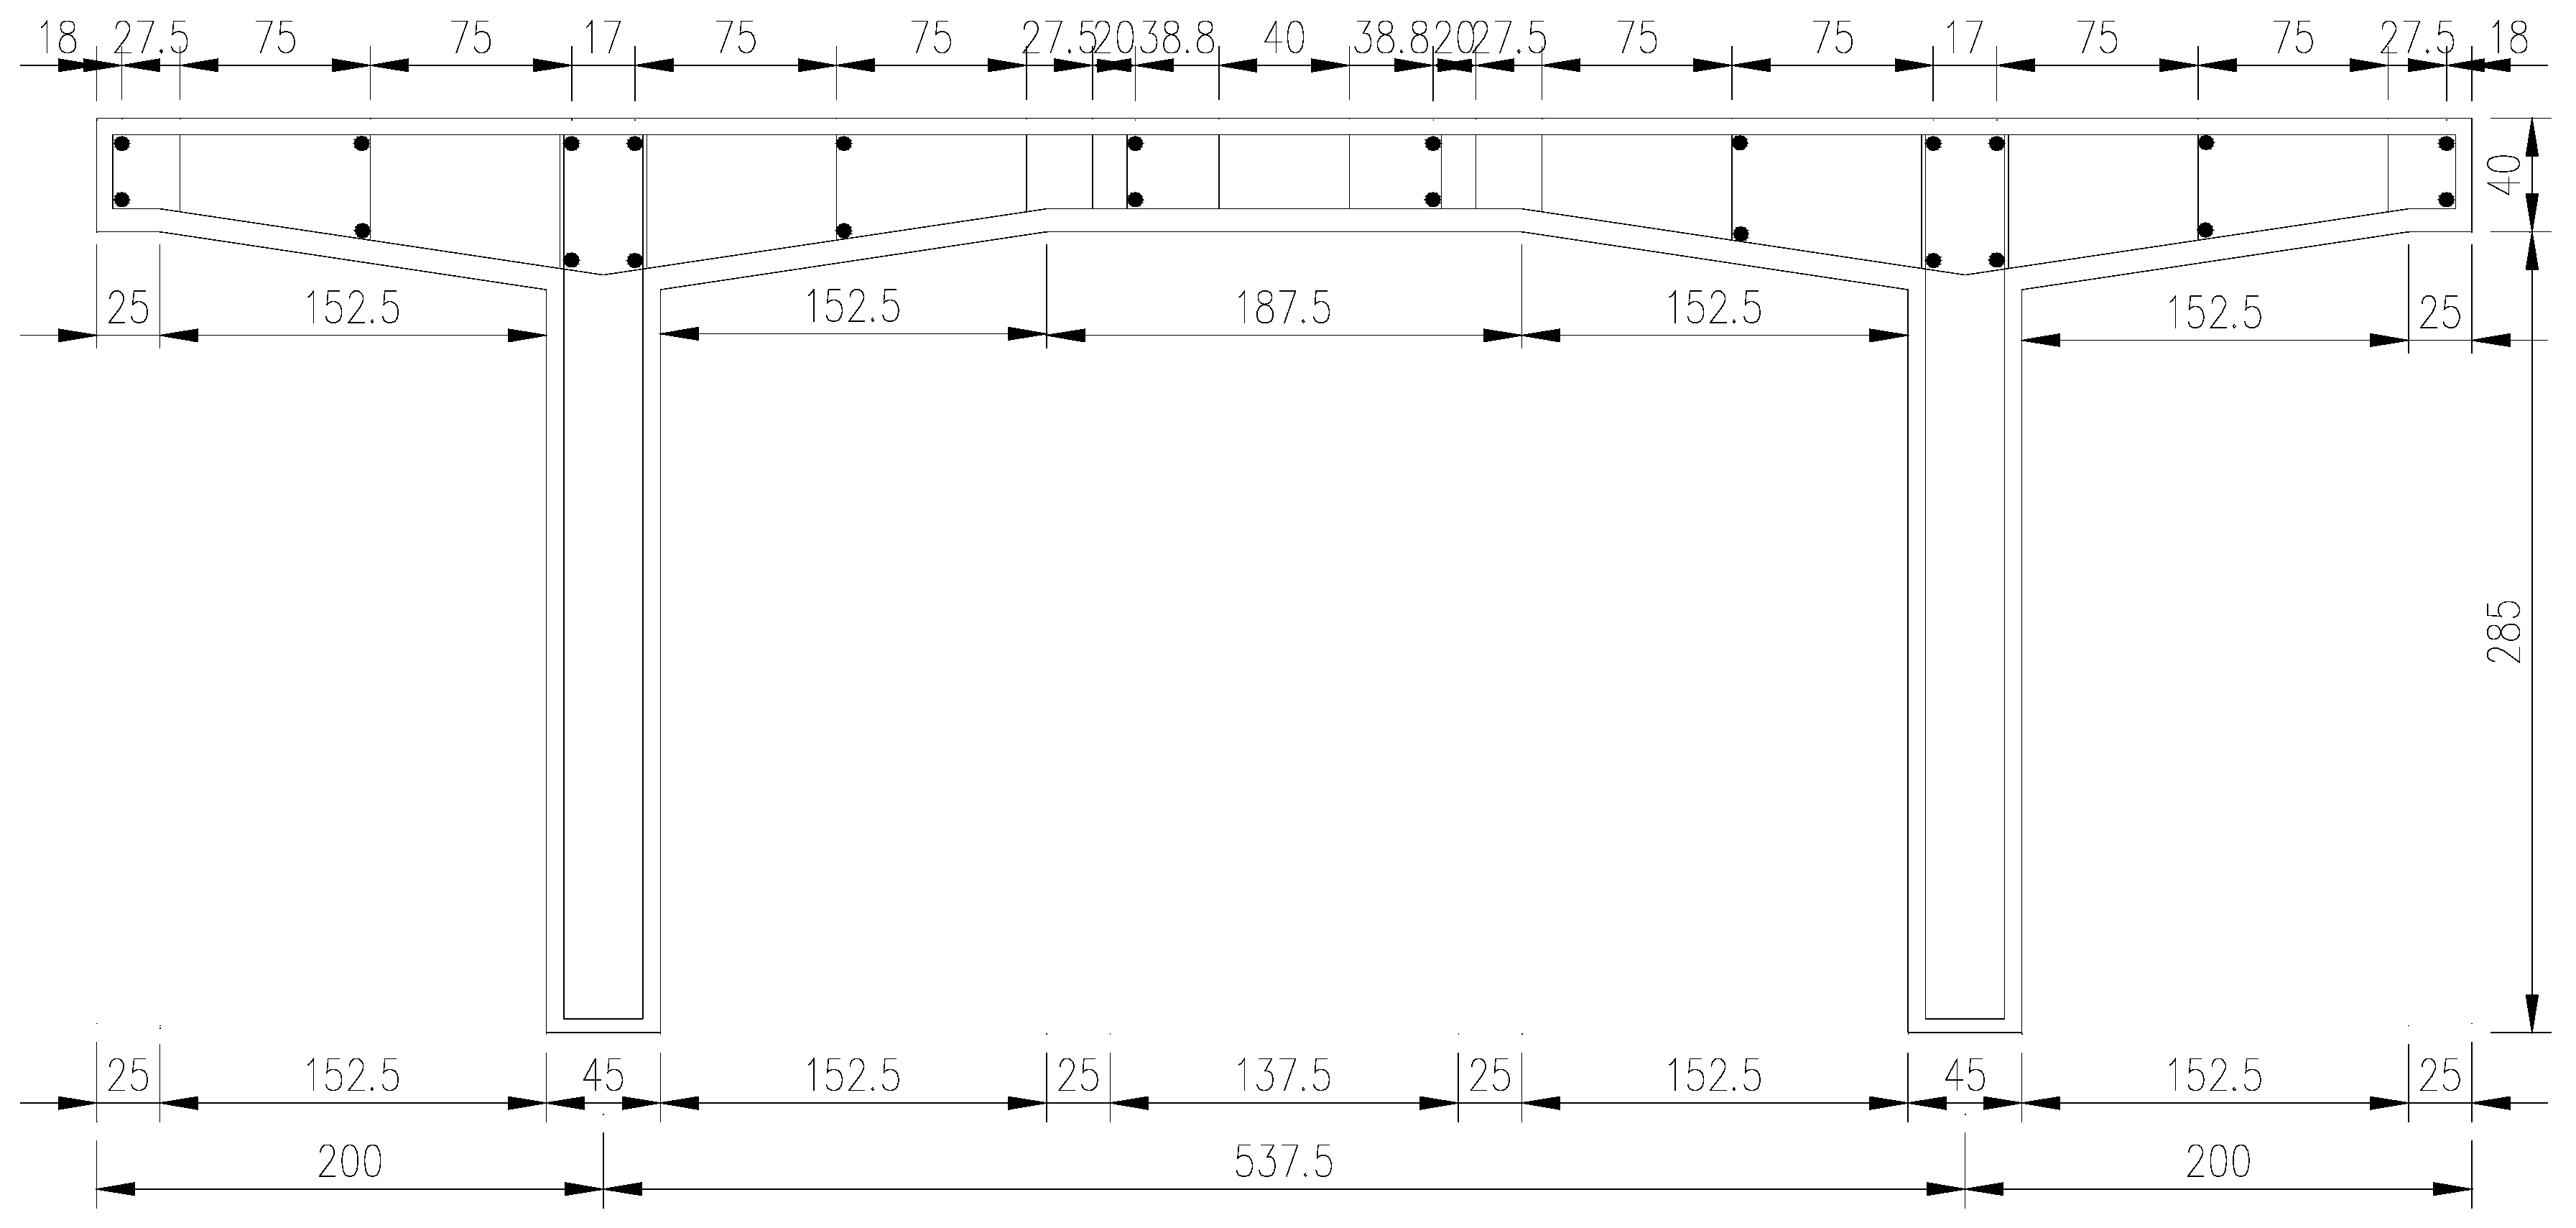
The one-way carriageway slab was 3850 mm long by 512.5 mm wide by 40 mm thick, with a long-to-short side ratio of 7:50. The model was made of C40 concrete, and the carriageway slab was configured with HRB400 grade reinforcement. Six bars of 6 mm in diameter and six bars of 3 mm in diameter were used for the horizontal reinforcement, and 94 bars of 6 mm in diameter were used for the vertical reinforcement, with a section reinforcement ratio of 0.0057. Two travel lane plates, ST and FT, were prefabricated for the test. ST was the reference carriageway slab for determining the load capacity test of the carriageway slab; FT was used for fatigue testing. The structural dimensions and reinforcement of the model are shown in
Figure 1.
During the fabrication of the test beam for the travel lane slab, test on the mechanical properties were conducted for the steel and concrete materials. According to the specifications [
22], three standard pieces were made for tensile, and three standard cubic compressive specimens and three standard axial compressive specimens were reserved for the concrete of each beam and tested in accordance with the specification [
23]. The validity of the test data was verified by using statistical theory. The test results are shown in
Table 3 and
Table 4.
2.2. Measurement Point Layout
(1) Strain measurement points.
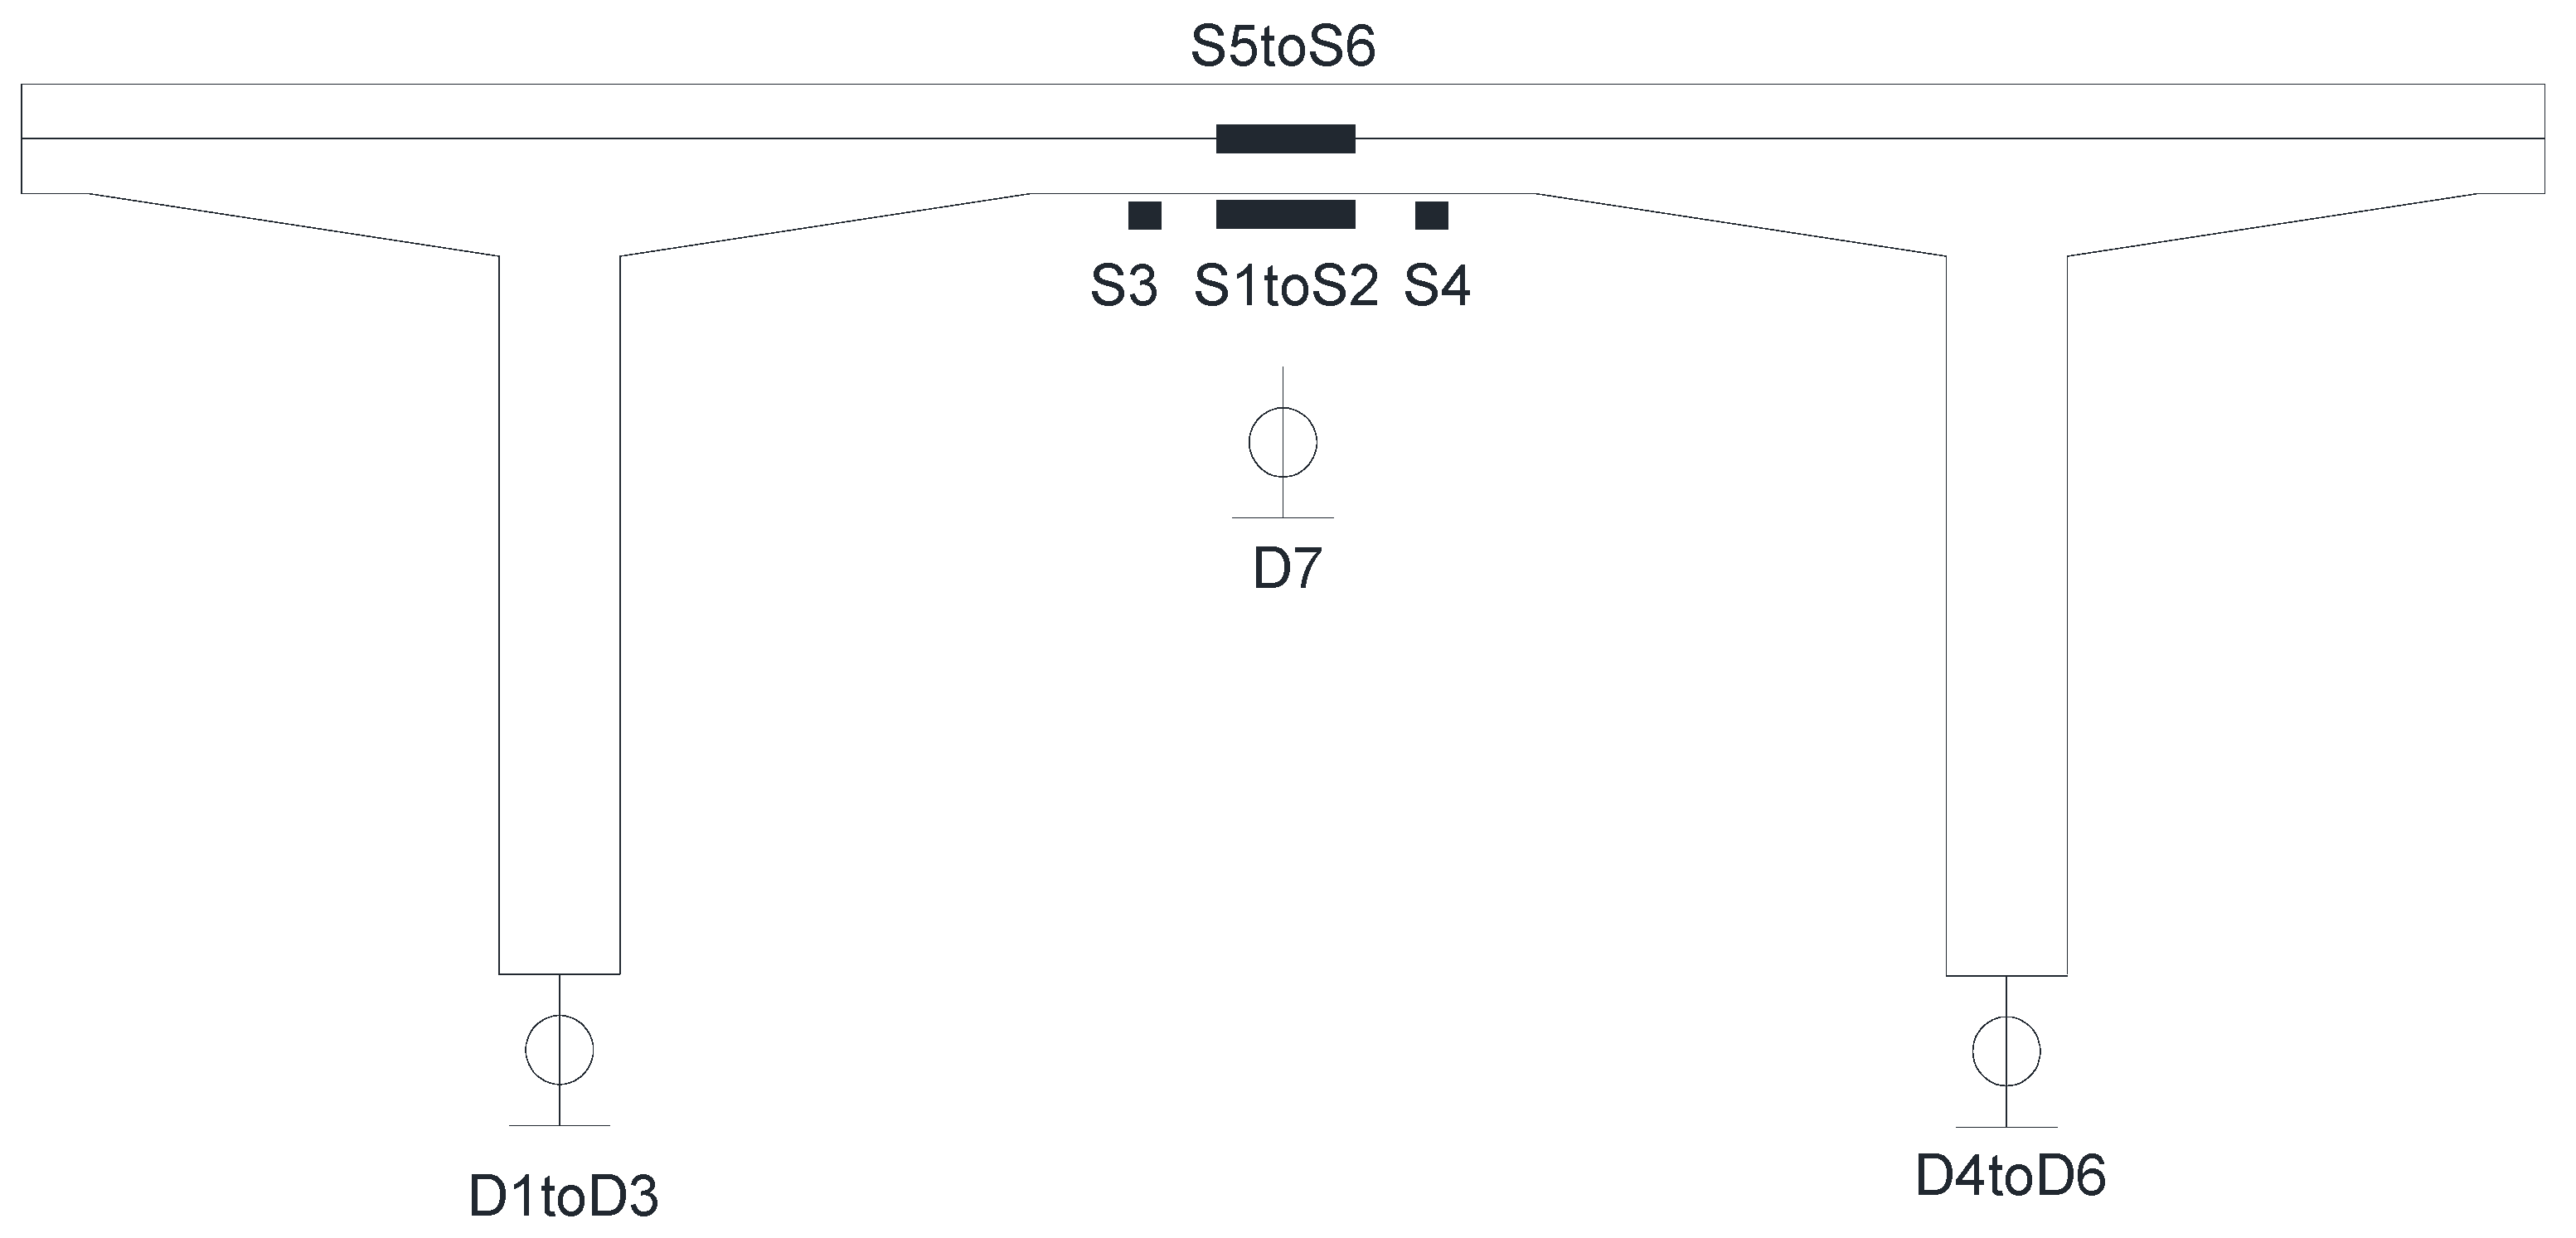
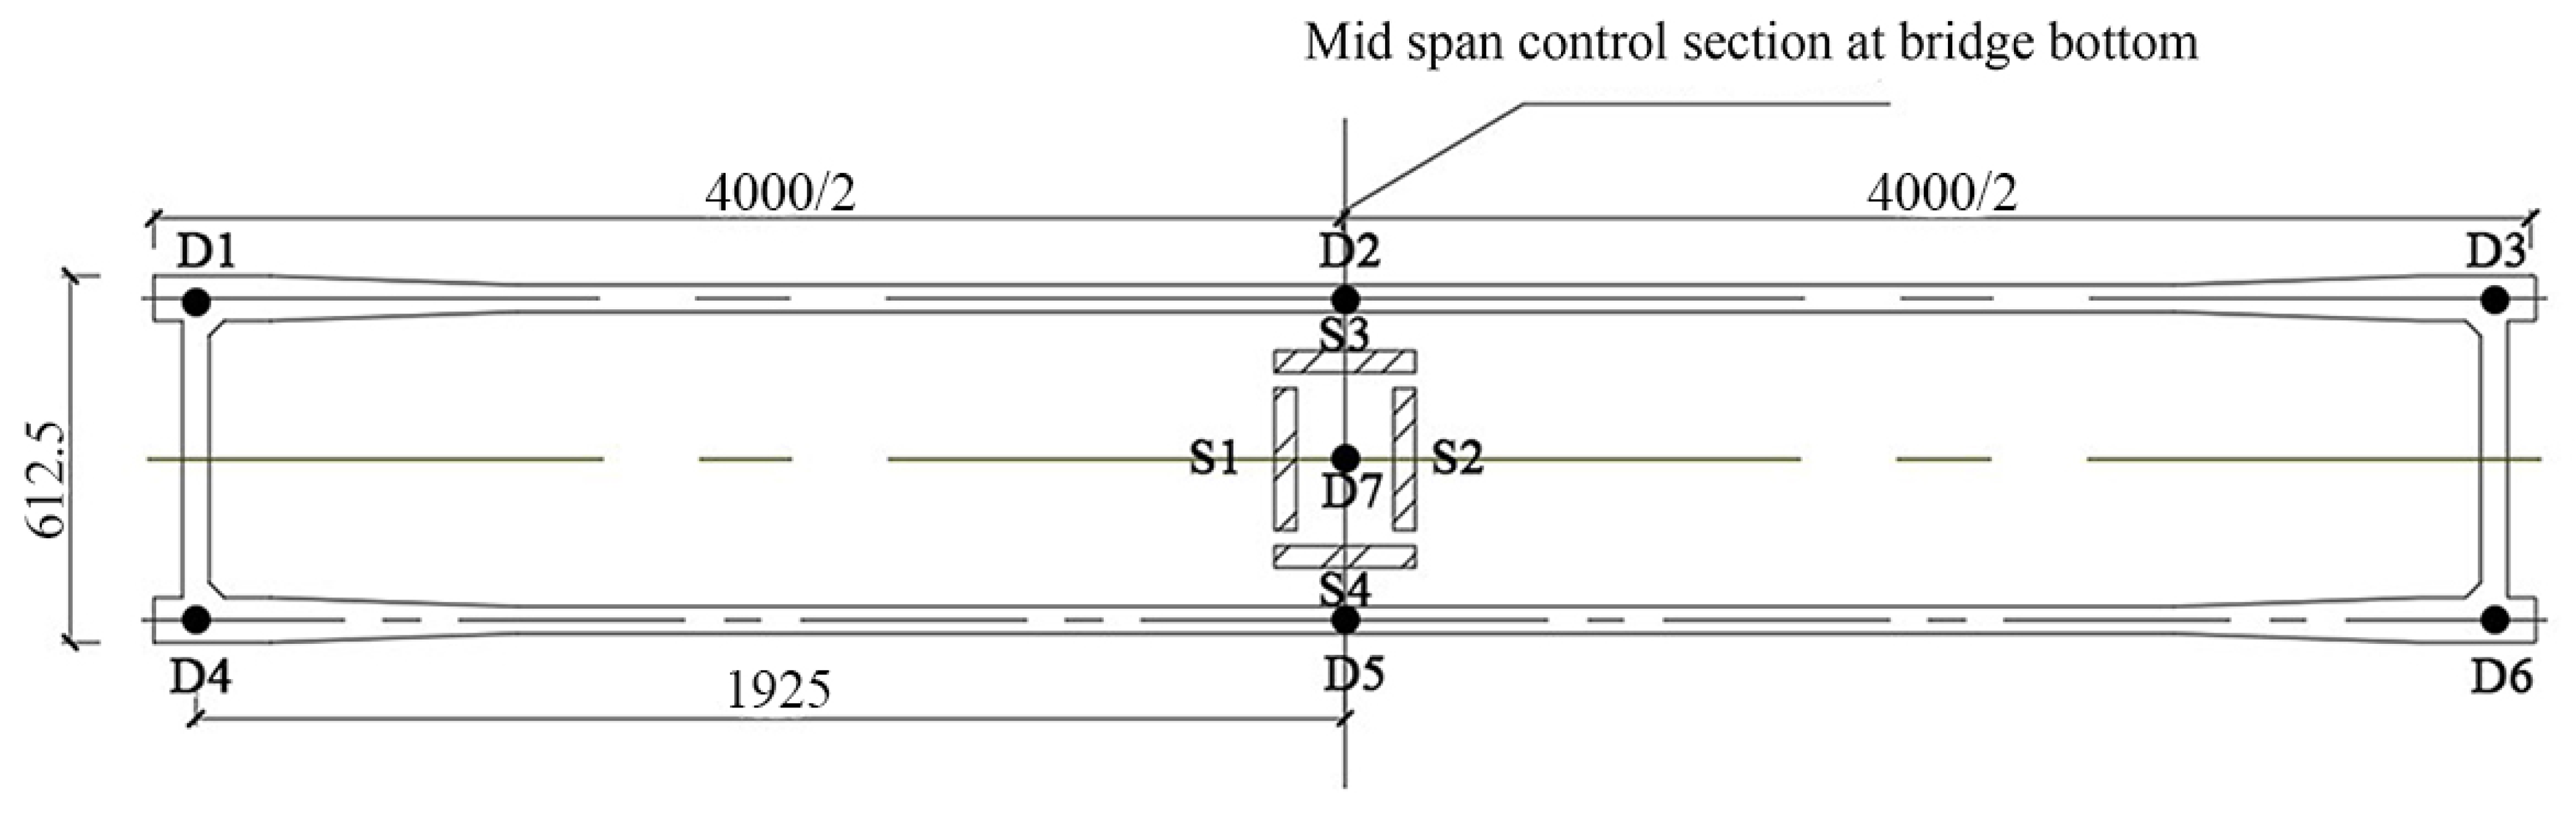
Two concrete strain gauges of type 120-100AA, noted as S1–S4, were fixed in horizontal and vertical directions at the bottom of the interrupted panel across the carriageway slab. One strain gage of type 120-3AA was attached to each of the two transverse reinforcement bars in the carriageway slab, noted as S5 and S6, respectively.
(2) Deflection measurement points.
A total of six deflection measurement points were employed and placed at the span at the bottom edge of each rib in the pivot section. One deflection measurement point was also placed at the bottom span edge of the carriageway slab. These measurement points are noted as D1–D7, respectively. Each deflection measurement point used a displacement meter with a range of 20 cm and an accuracy of 0.01 mm.
The strain and deflection measurement points are arranged as shown in
Figure 2 and
Figure 3.
2.3. Test Apparatus and Devices
(1). Test loading.
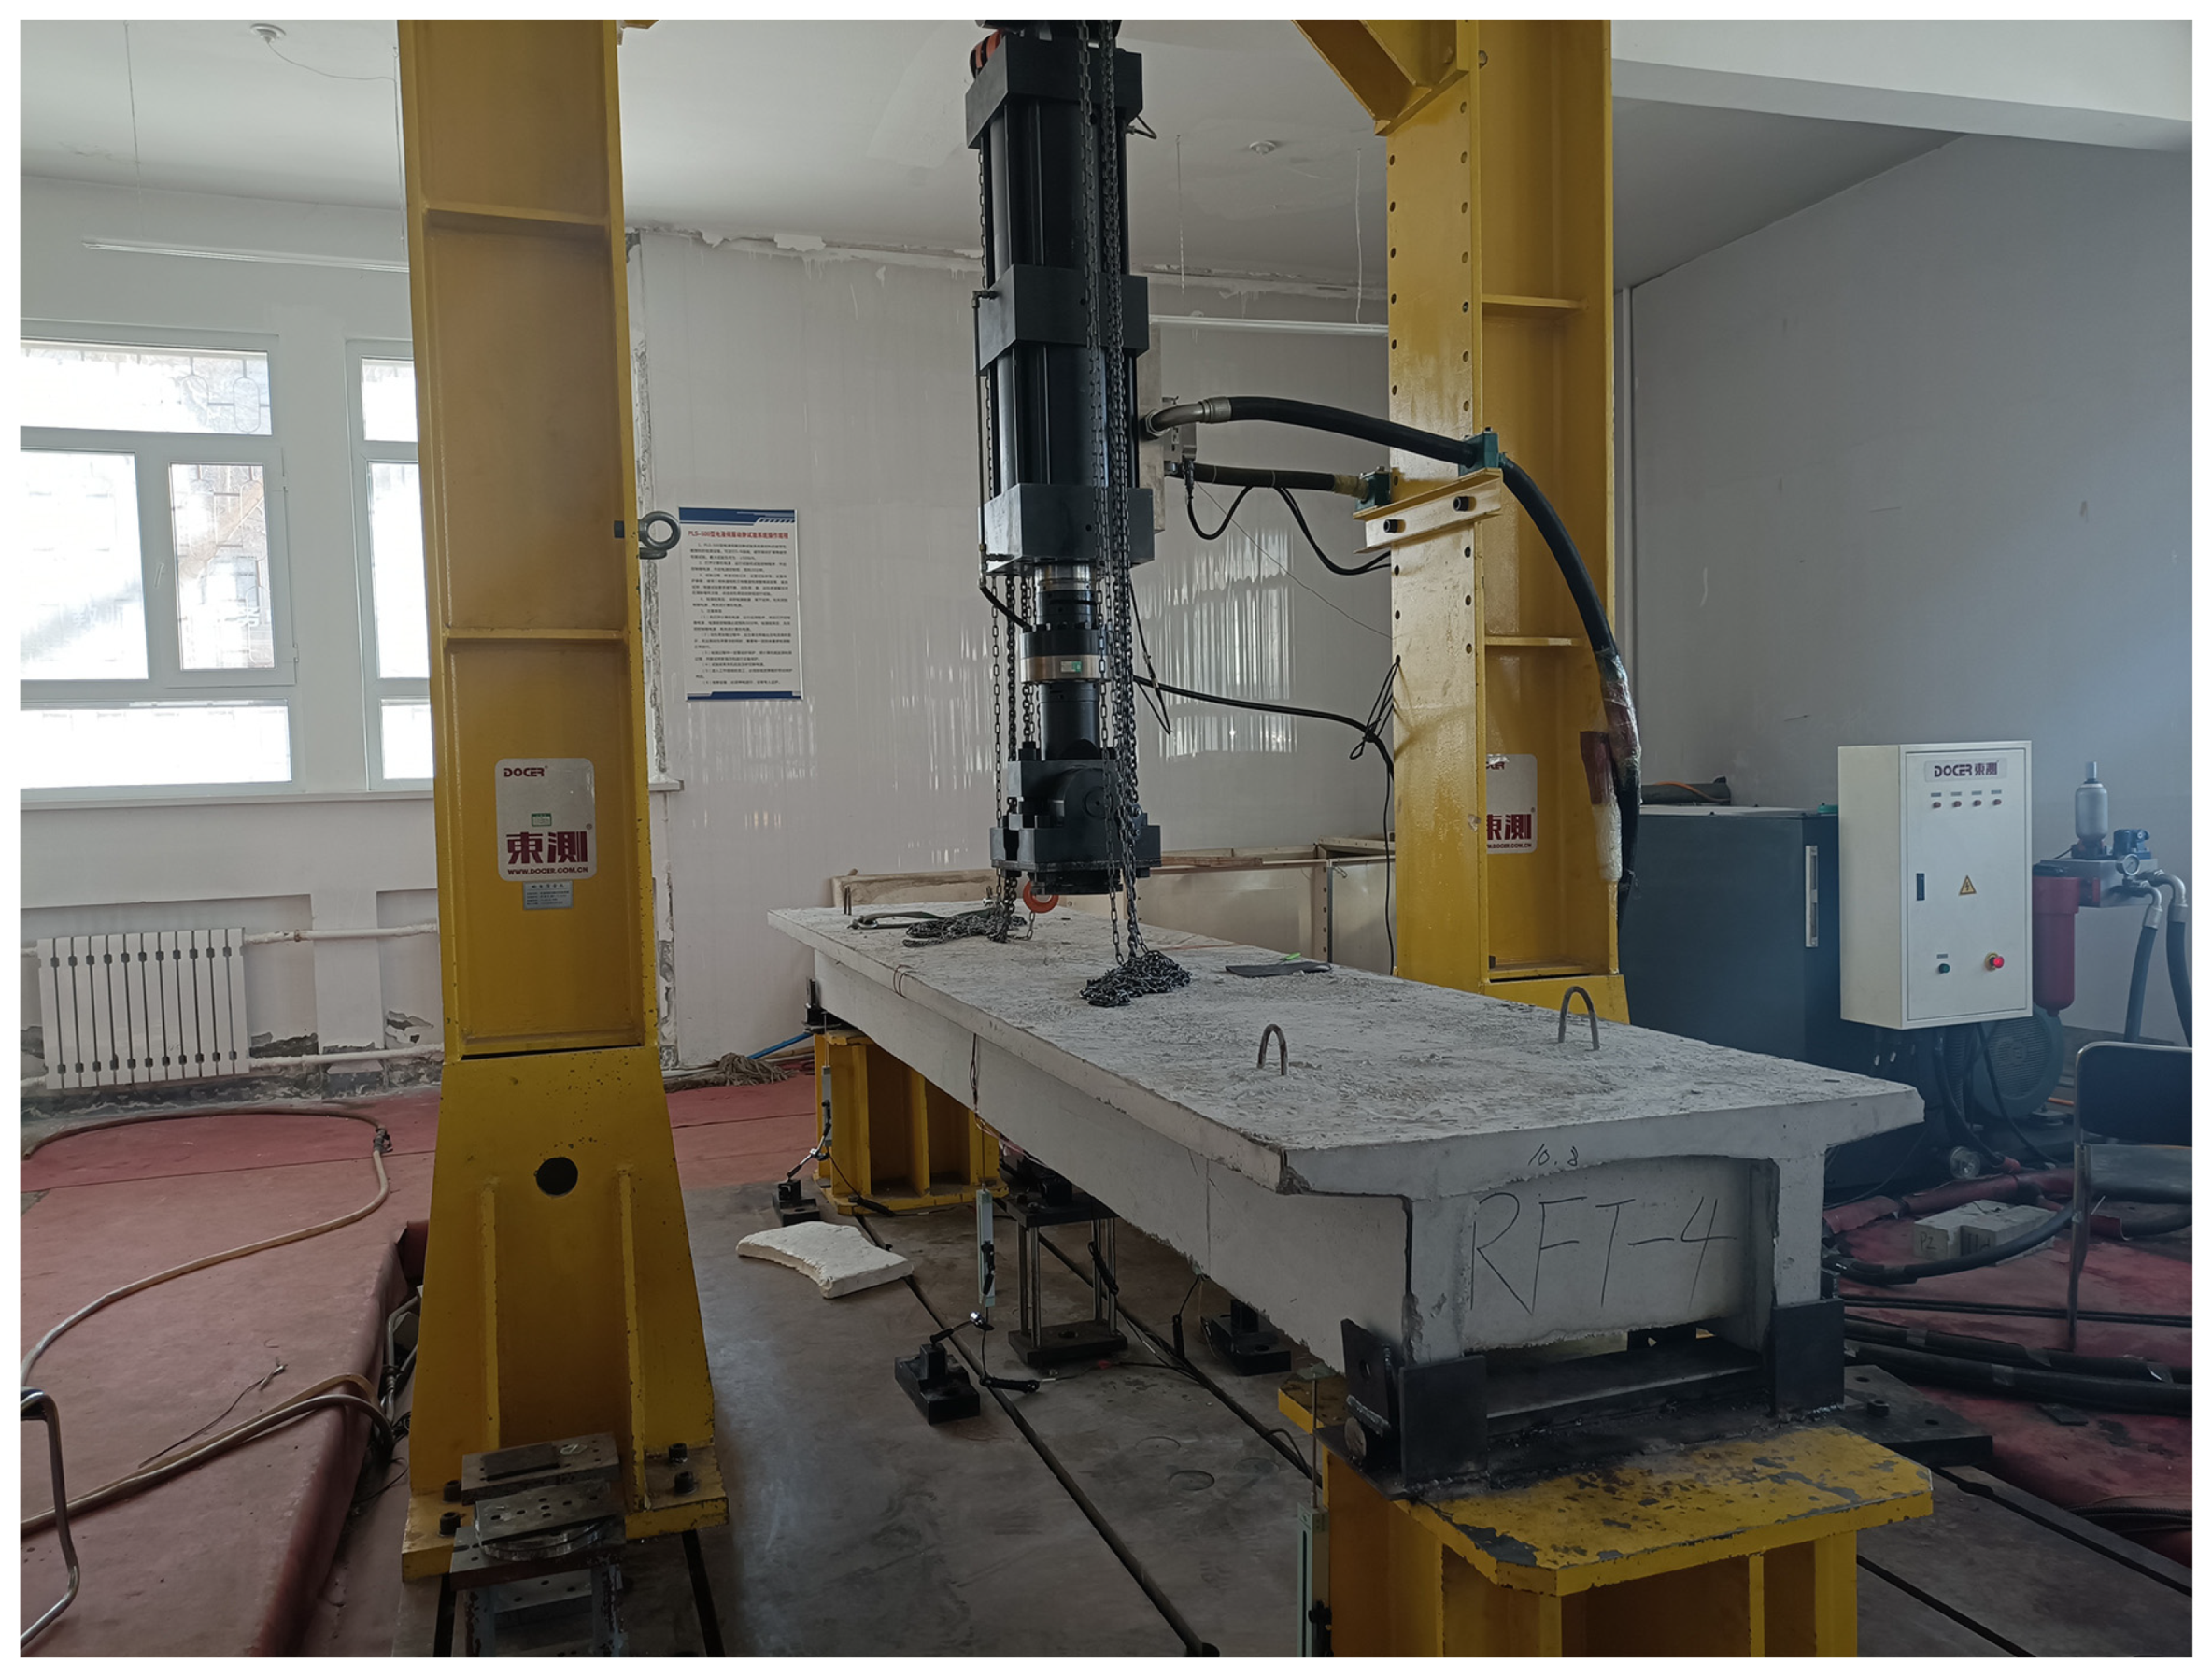
A PLS-500 electro-hydraulic servo dynamic and static test system was used to load the test beam at the mid-span position. The effect of the paving layer on the 45° diffusion of the wheel load was also considered [
24]. The area of the loading head was calculated as a rectangle of 200 mm in the transverse bridge direction and 100 mm in the longitudinal bridge direction to simulate the effect of the wheel load.
The loading device is shown in
Figure 4.
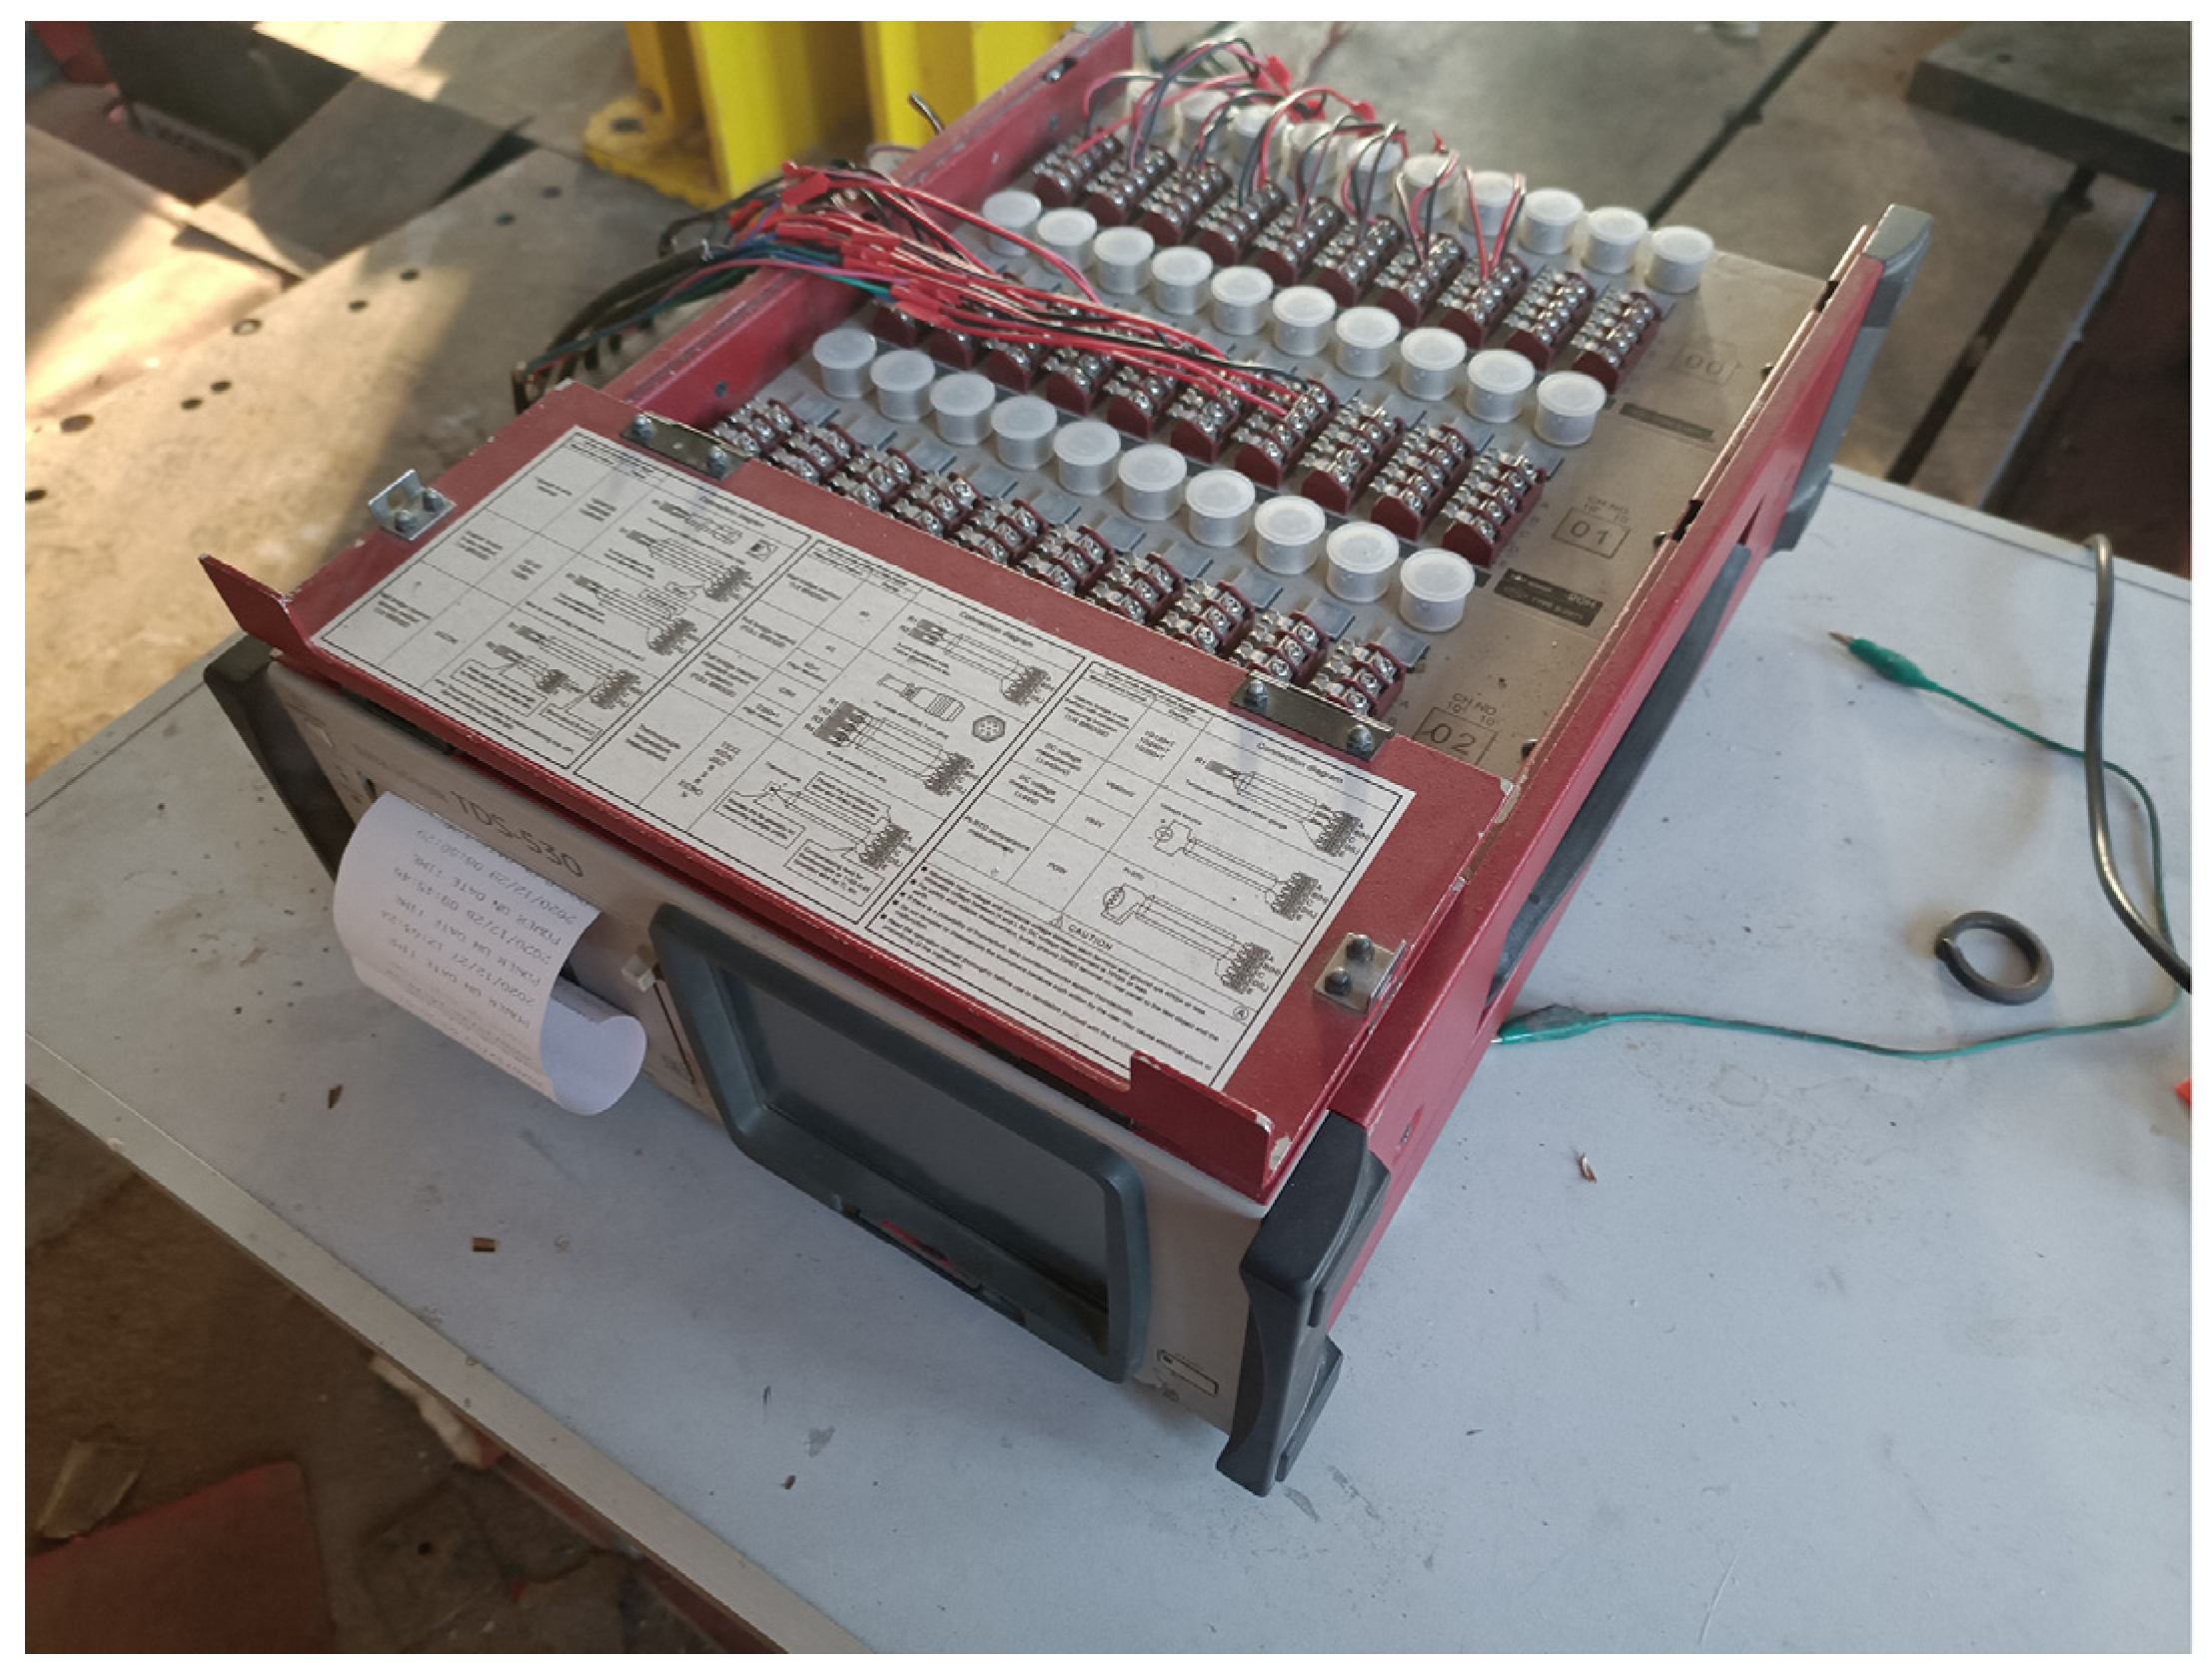
(2). Collection instruments.
To ensure efficient data acquisition, a TDS-530 static data acquisition instrument was used for strain and deflection data acquisition, and a ZBL-F101 crack observer was used to observe the cracks. Photographs of the instruments in action are shown in
Figure 5.
2.4. Fatigue Testing
(1) Reference beam static load test.
The static load test was loaded by force-controlled loading, which was then changed to displacement-controlled loading after the steel reinforcements yielded. Loading was graded at 10 KN per stage. When the carriageway slab was about to crack and was close to damage, the grading was appropriately increased in order to determine its cracking load and ultimate load-carrying capacity. To ensure the accuracy of the test loading, the fatigue testing machine was calibrated before the formal test with a tensile pressure sensor to determine the dynamic head. The linear regression equation after calibration was obtained as:
where x is the actual loading value, and y is the computer input value.
(2) Fatigue load test.
Results obtained from fatigue tests on reinforced concrete carried out by domestic and foreign scholars show that when a fatigue load level of 0.65 is selected, the carriageway slab can guarantee fatigue damage within 2 million cycles [
25,
26,
27,
28]. Thus, the fatigue load level in our experiment was set at 0.65.
The fatigue test was performed using force-controlled loading, using a sine wave that was closer to the moving vehicle load with a loading frequency of 3.8 Hz. The fatigue load had an upper limit of 75 KN, a lower limit of 15 KN, and an amplitude of 30 KN.
3. Fatigue Test Analysis of the Carriageway Slab
3.1. Reference Beam Static Load Test
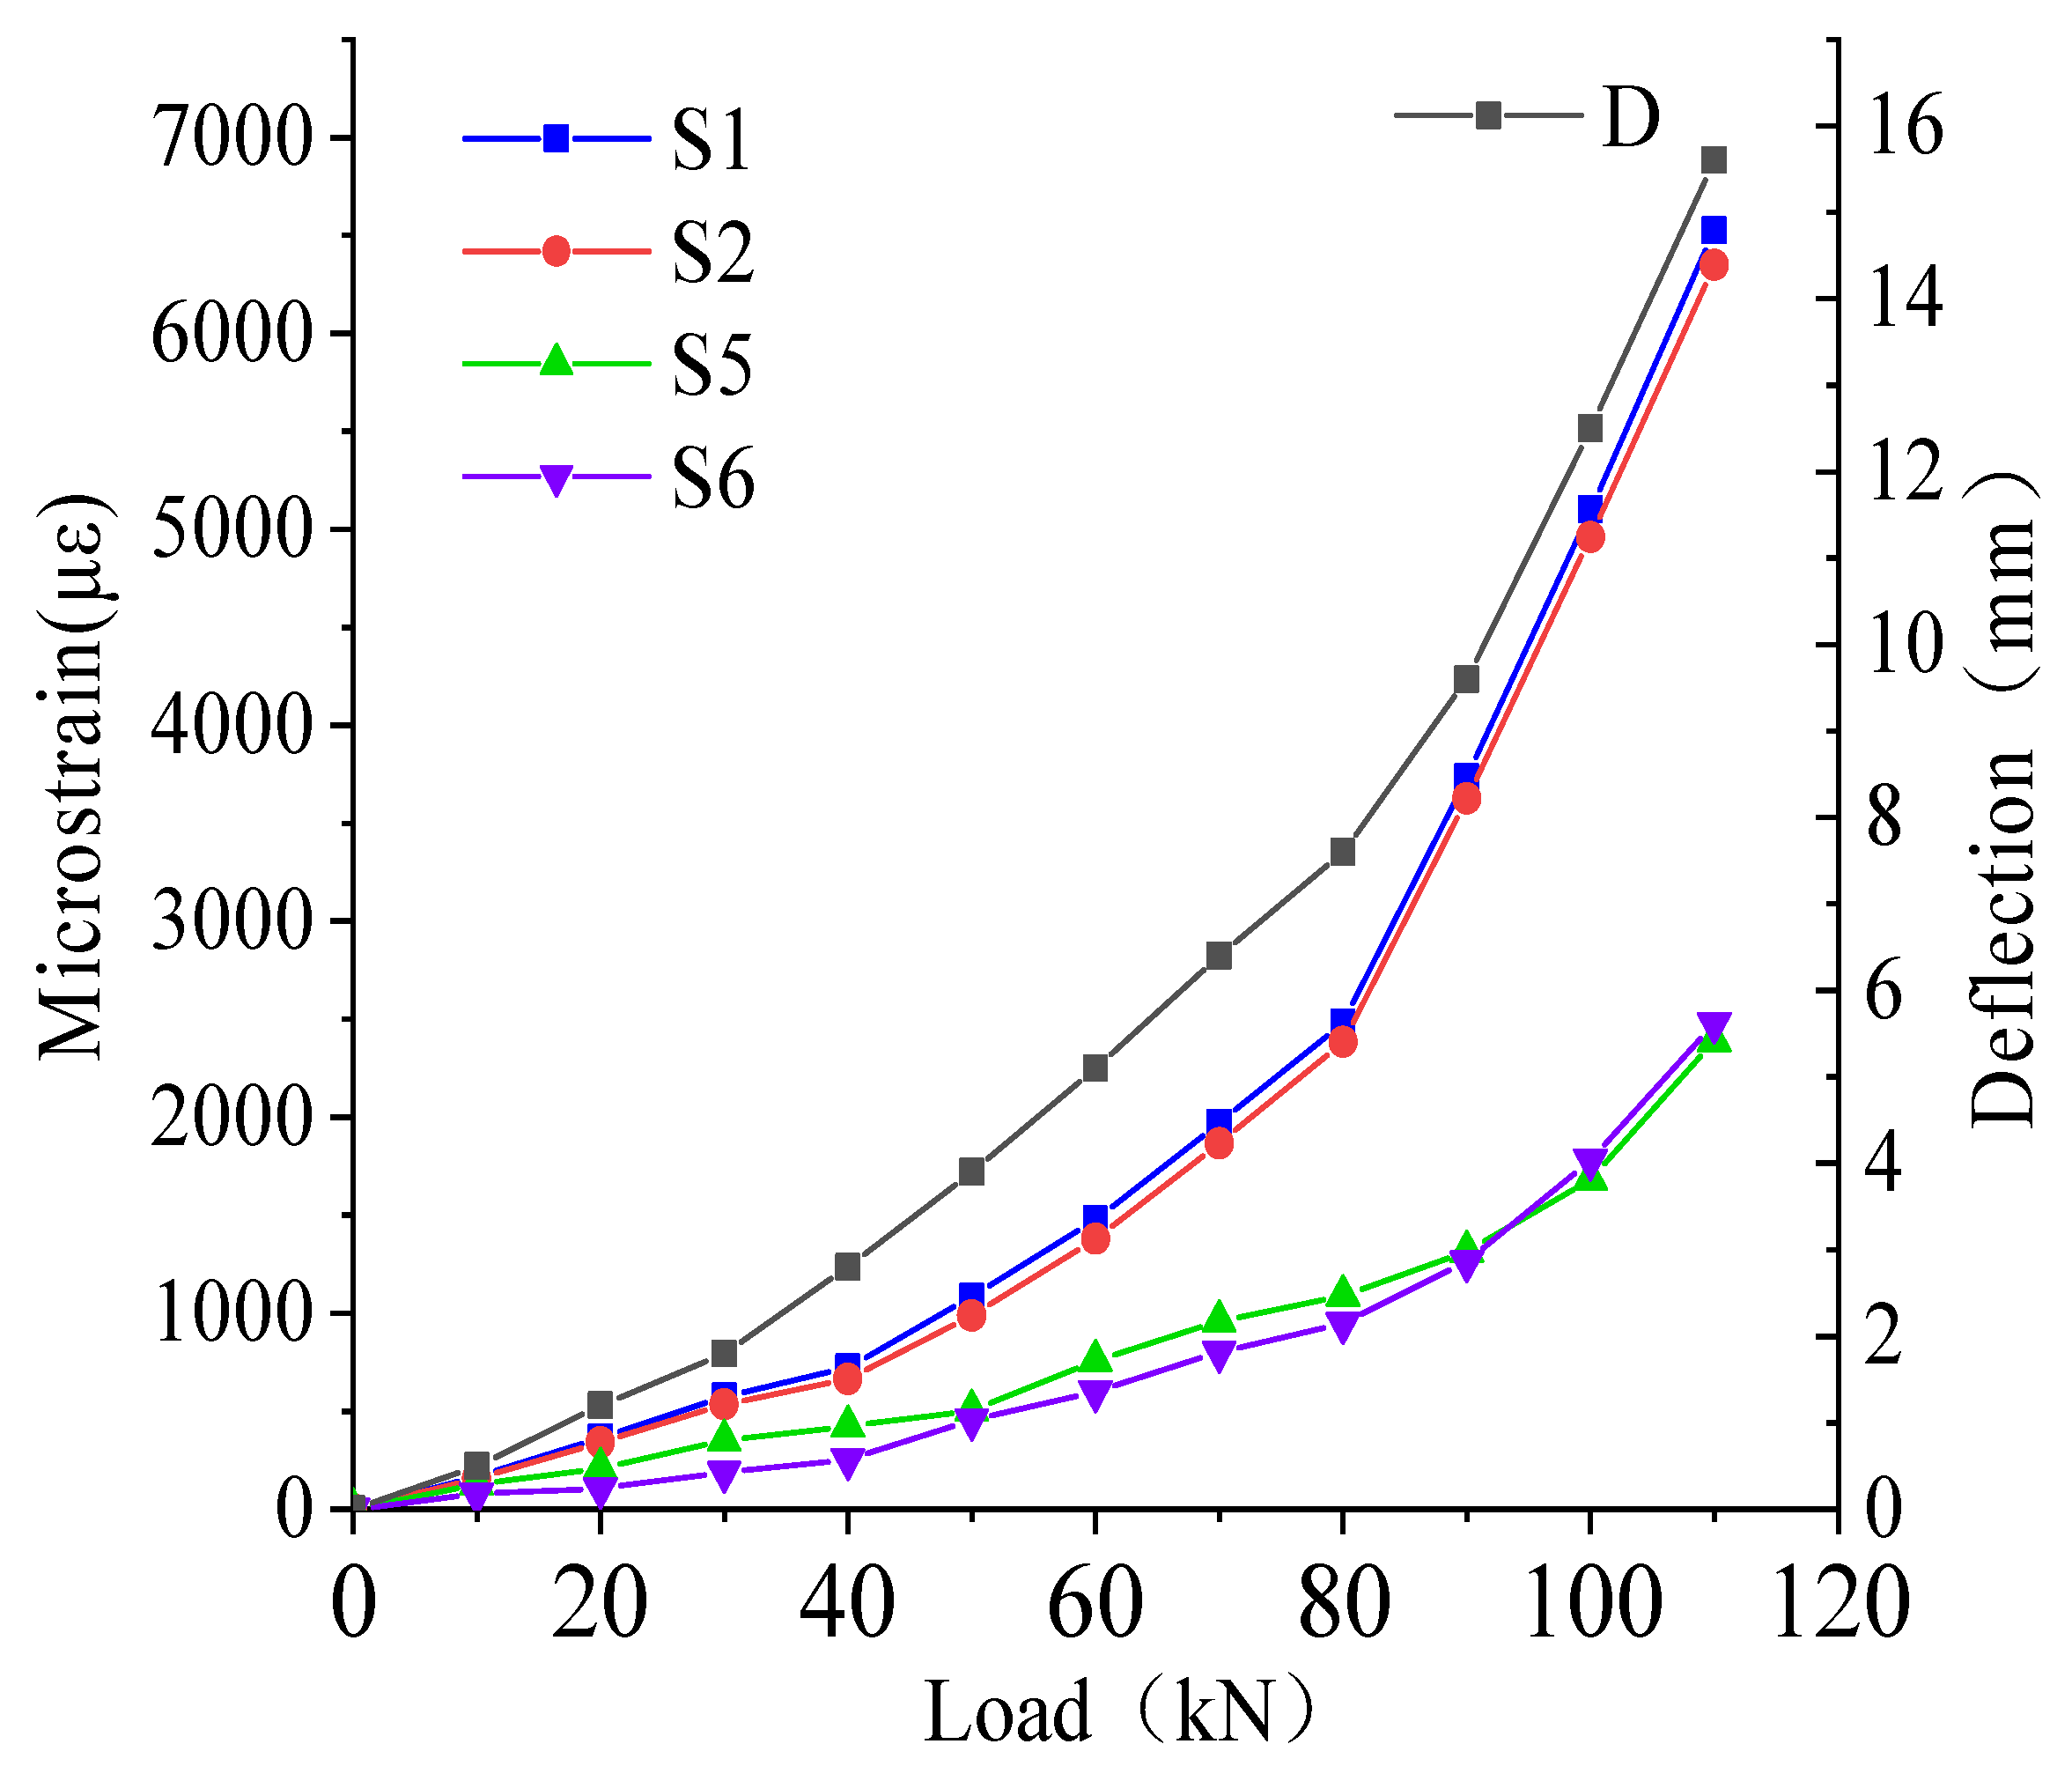
The measured deflection at the bottom of the ST reference beam, the transverse tensile strain in the concrete, and the tensile strain in the transverse reinforcement with load are shown in
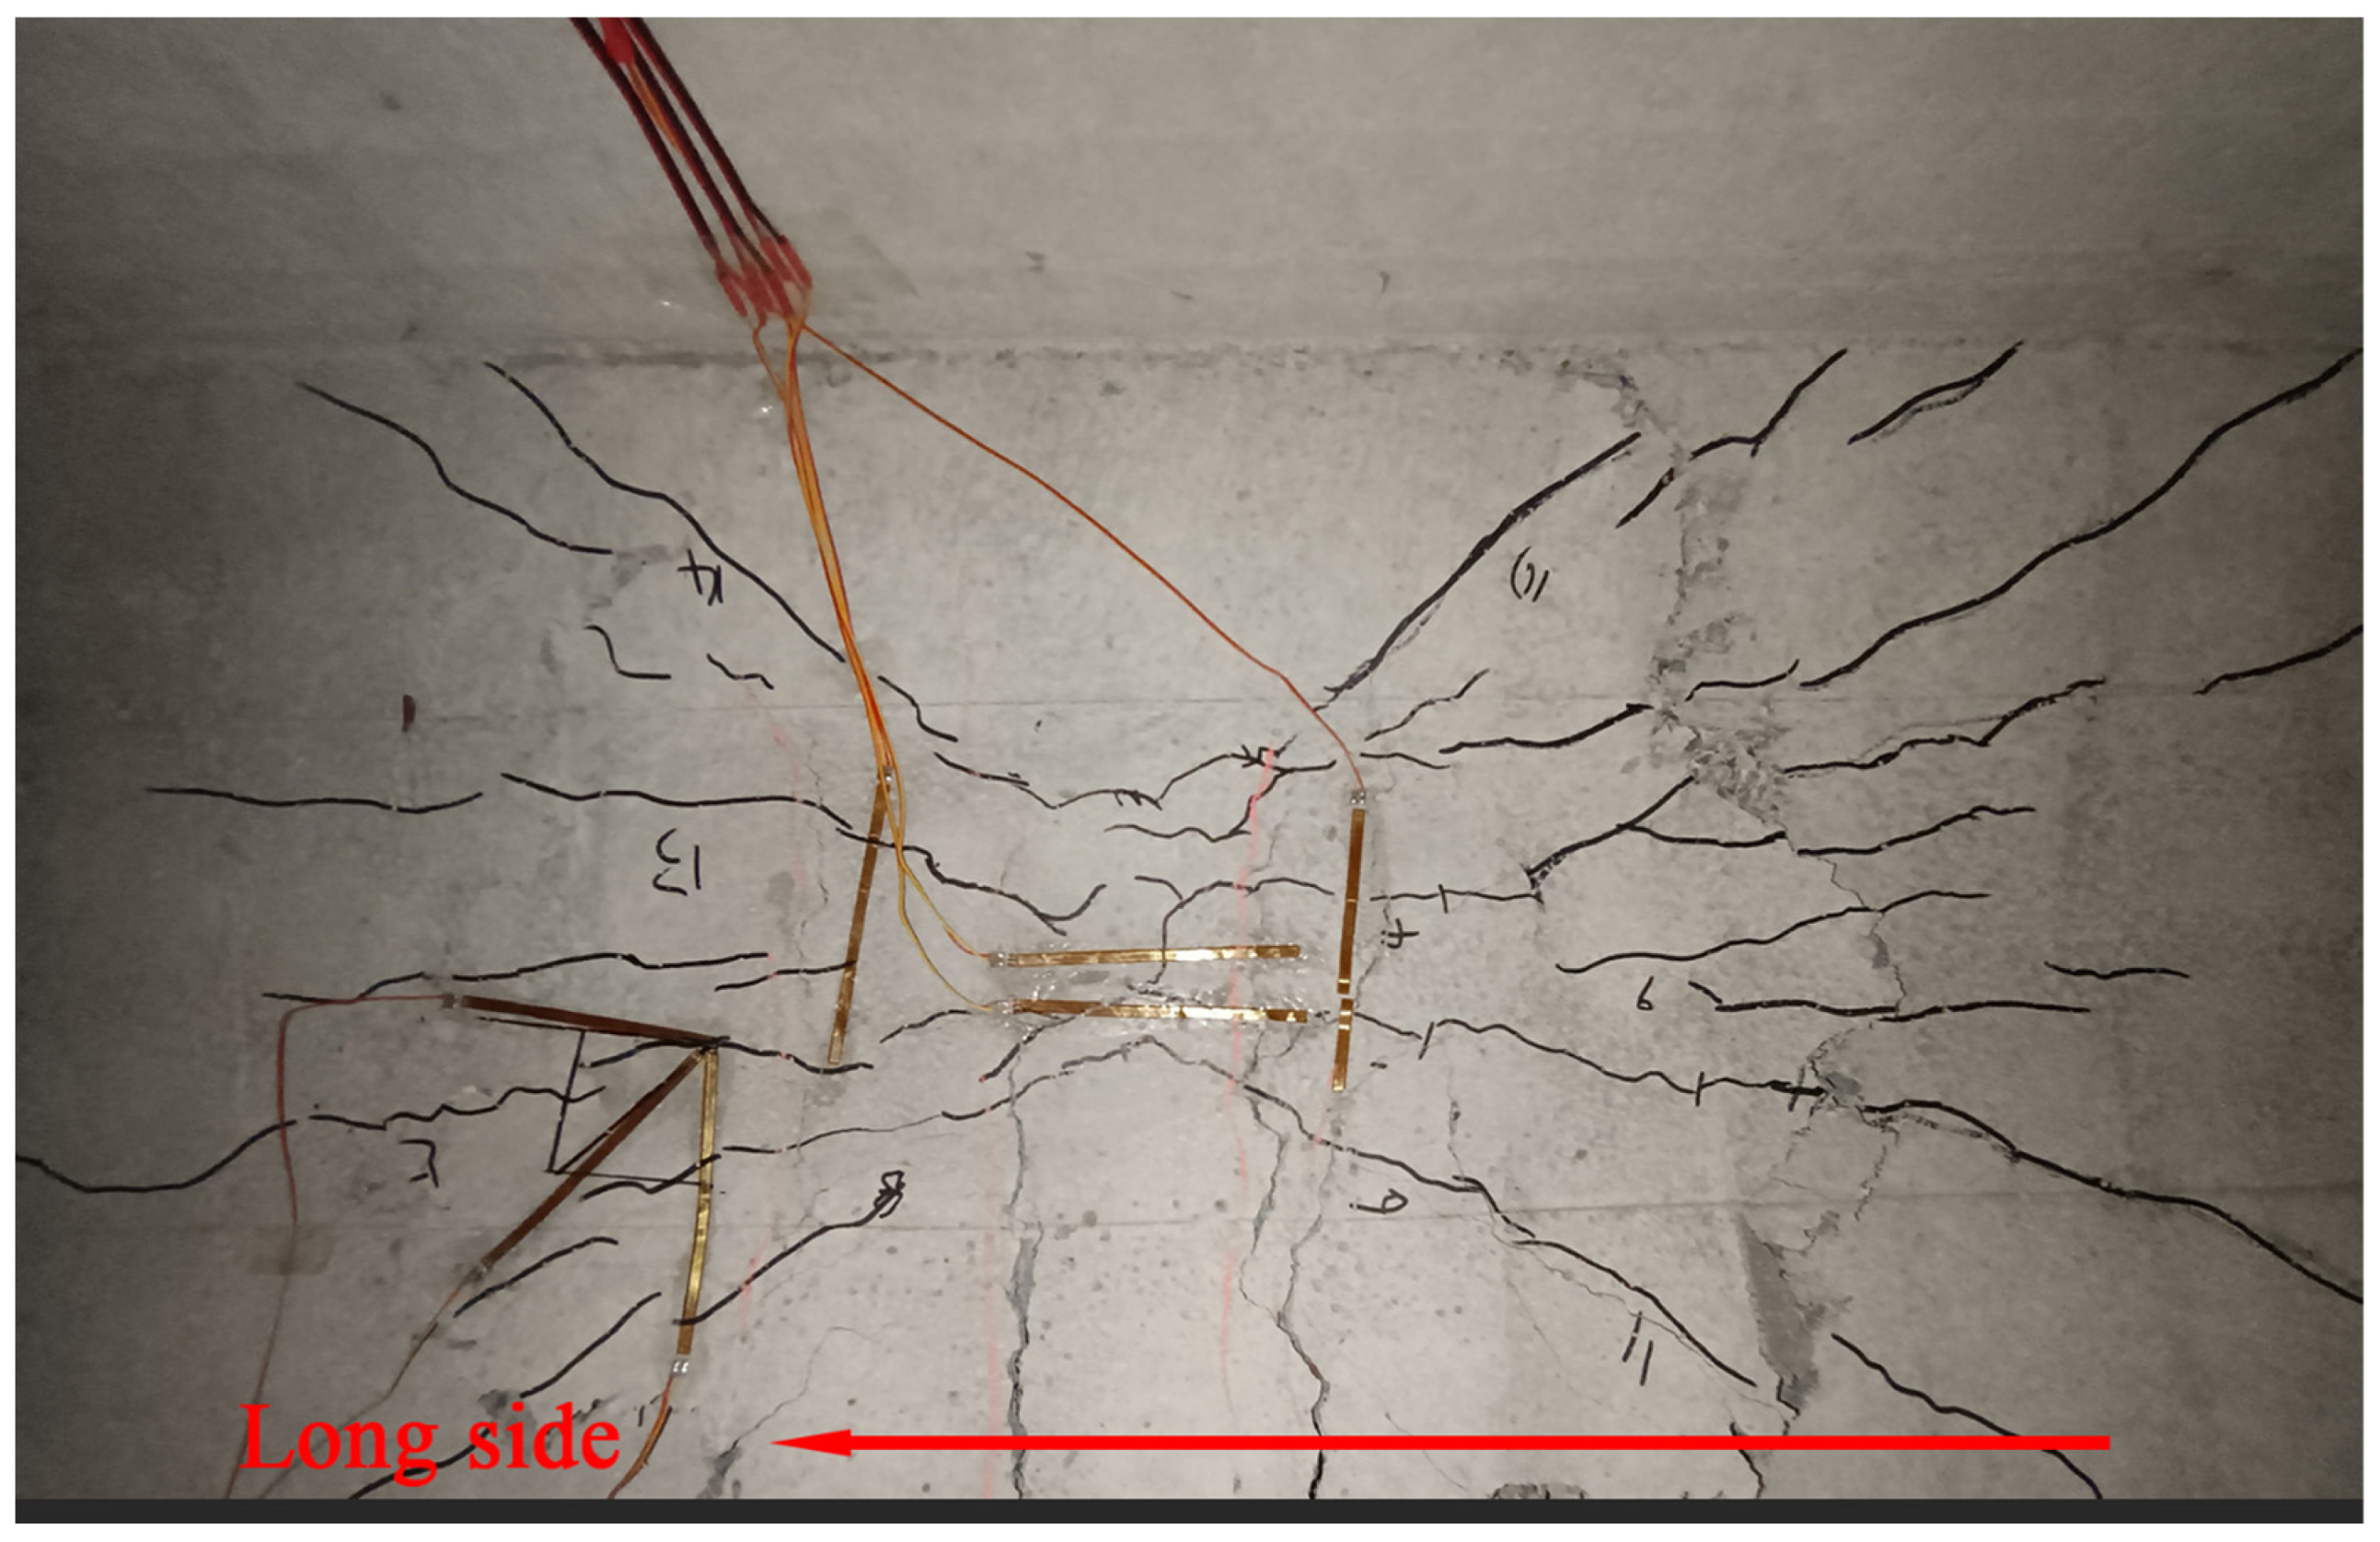
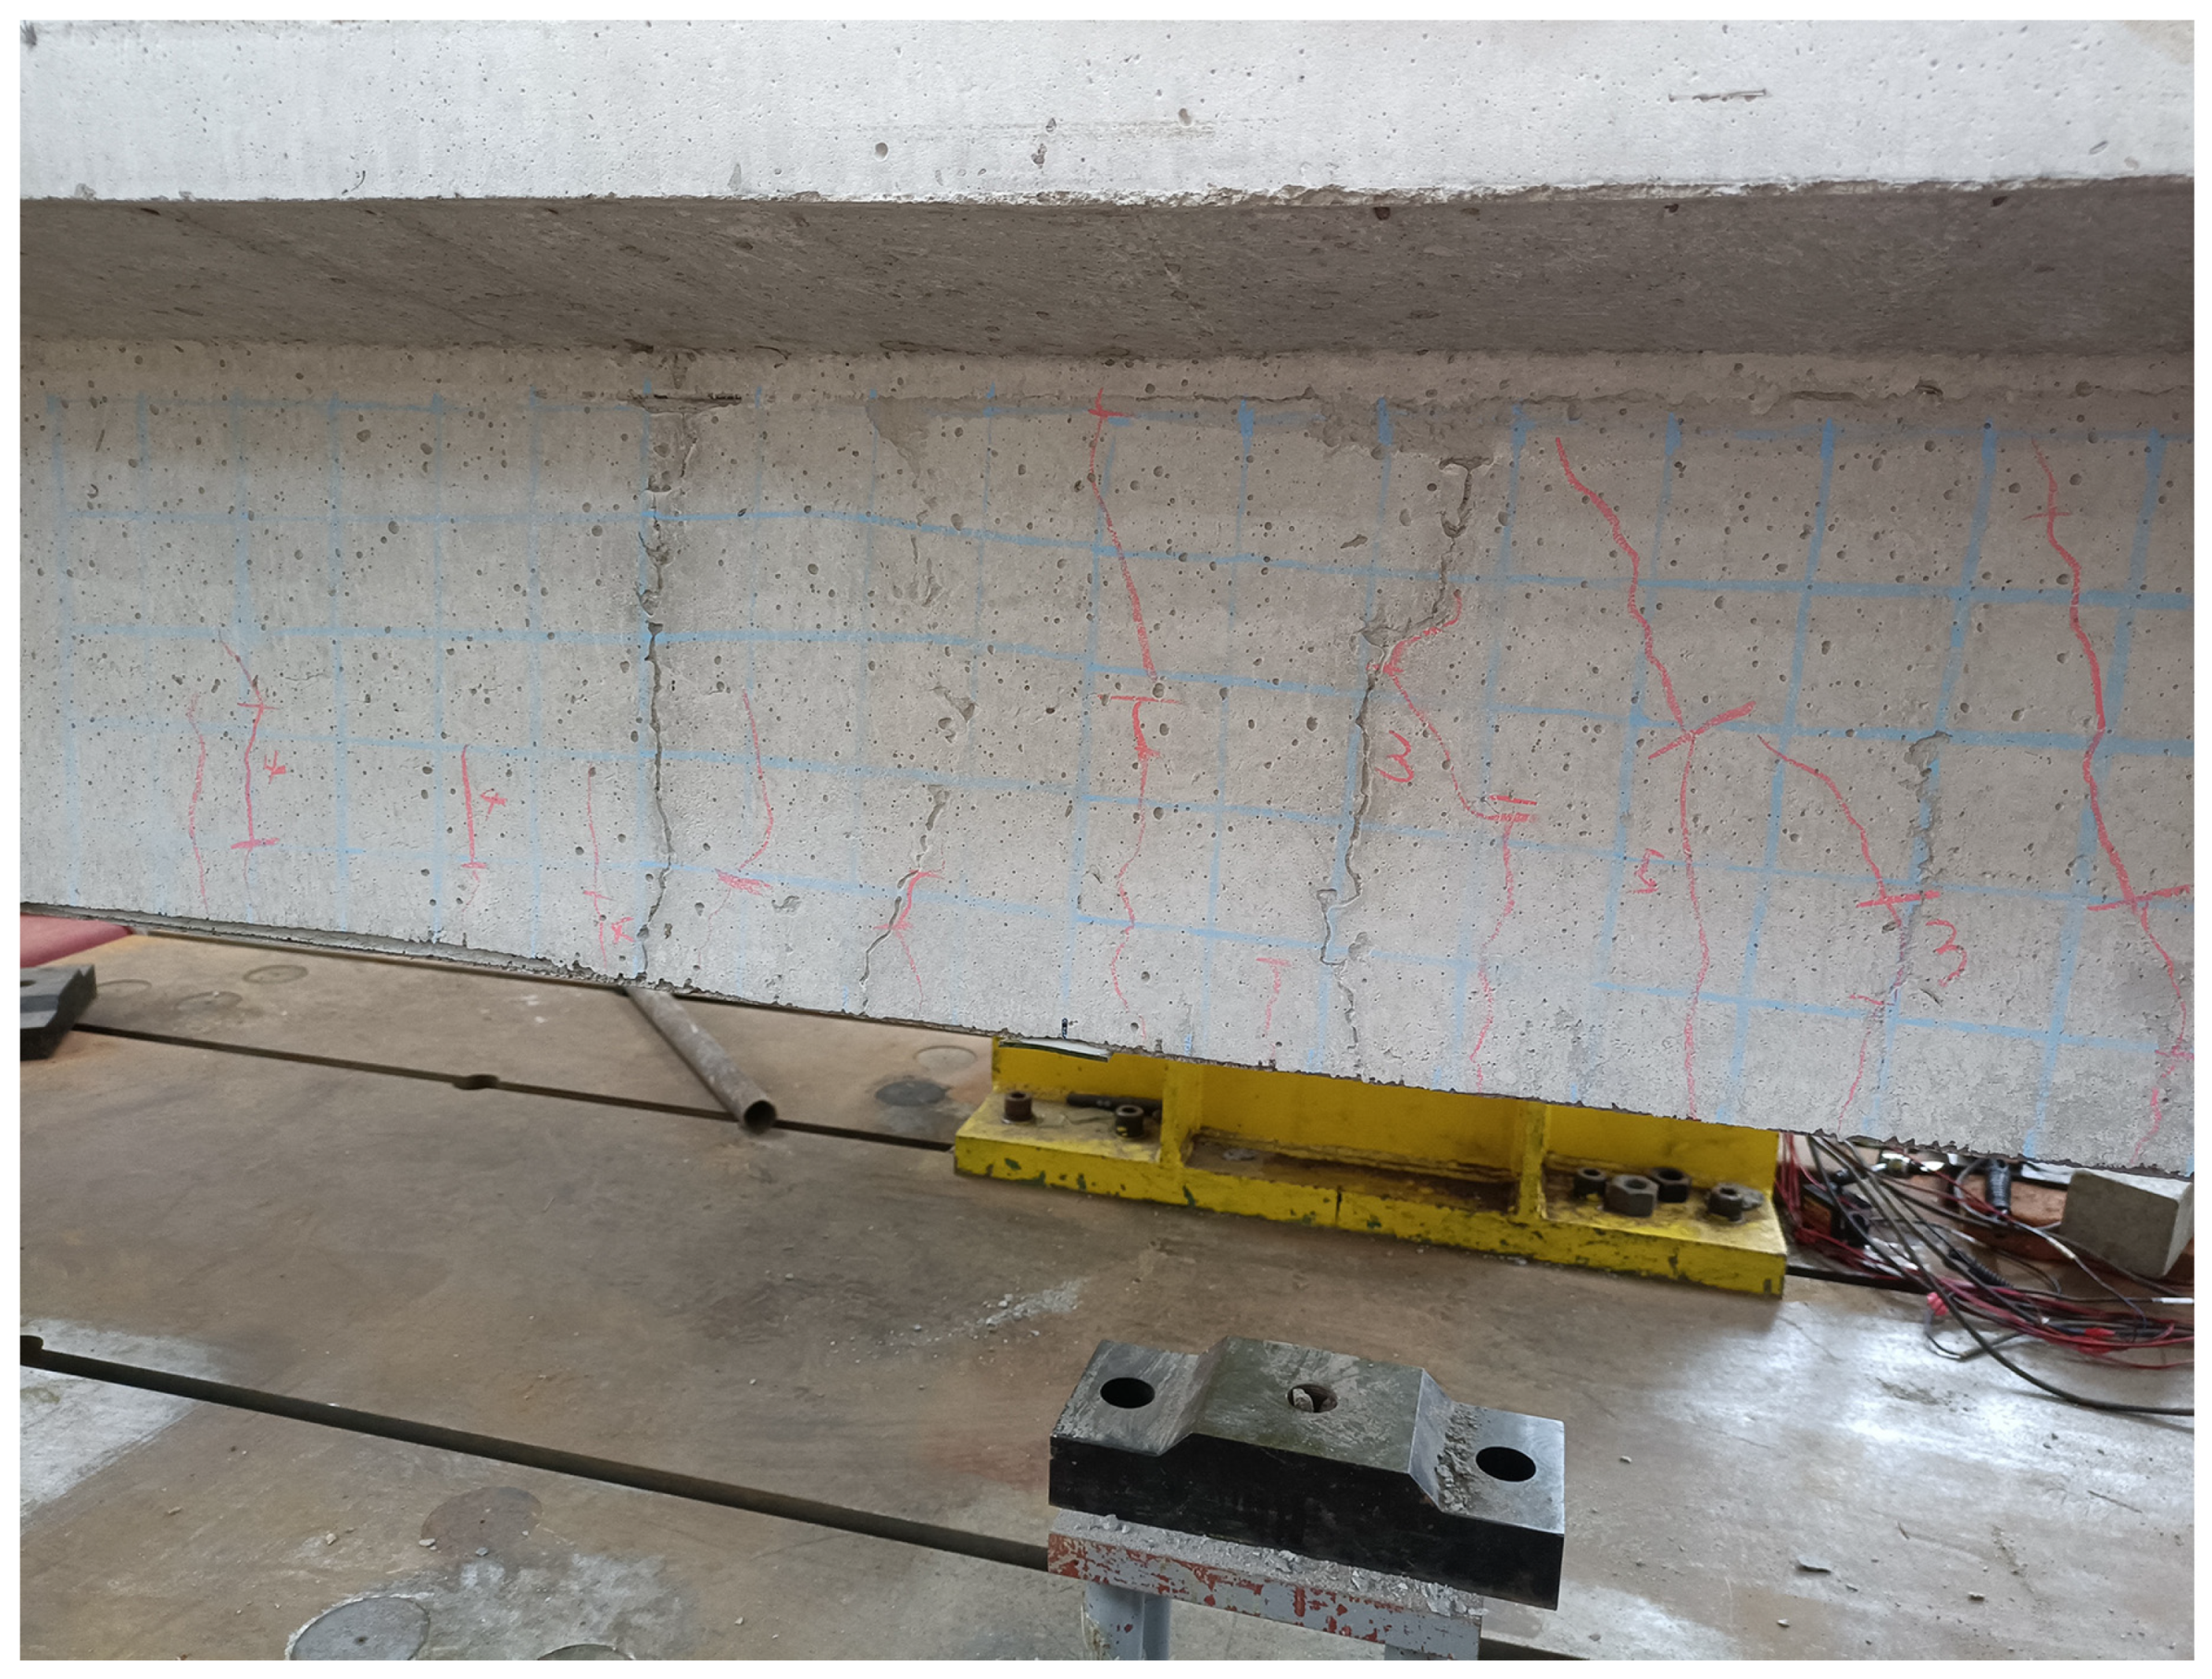
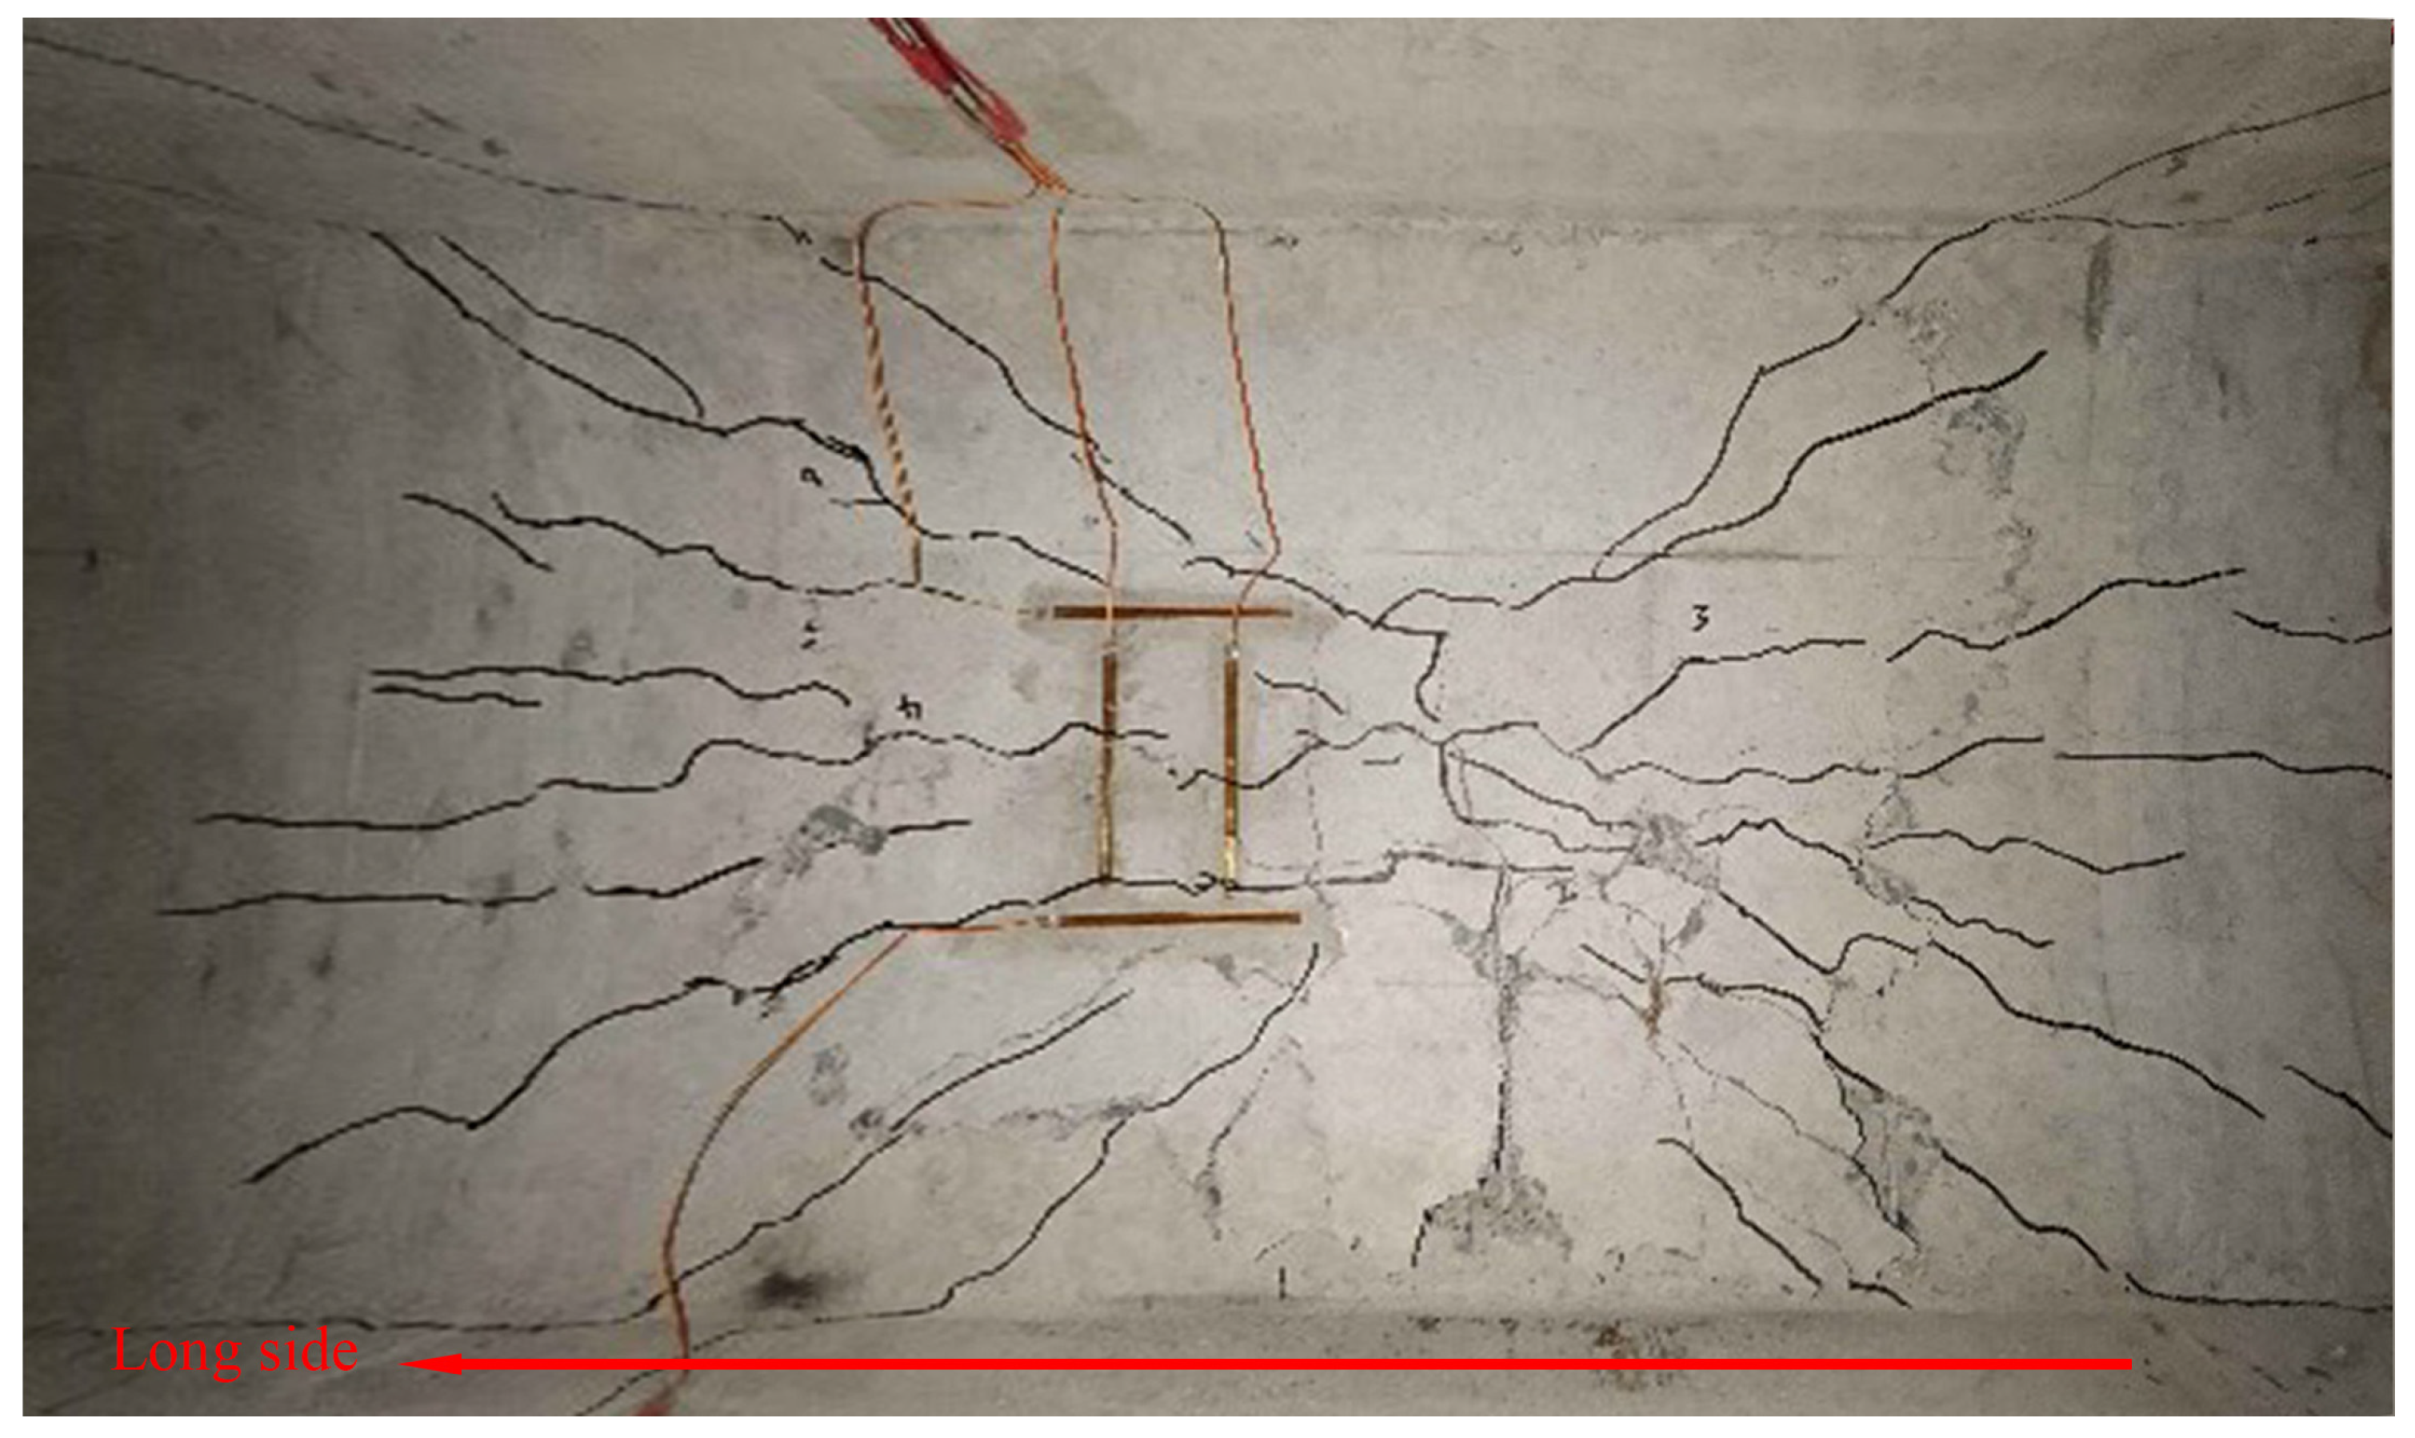
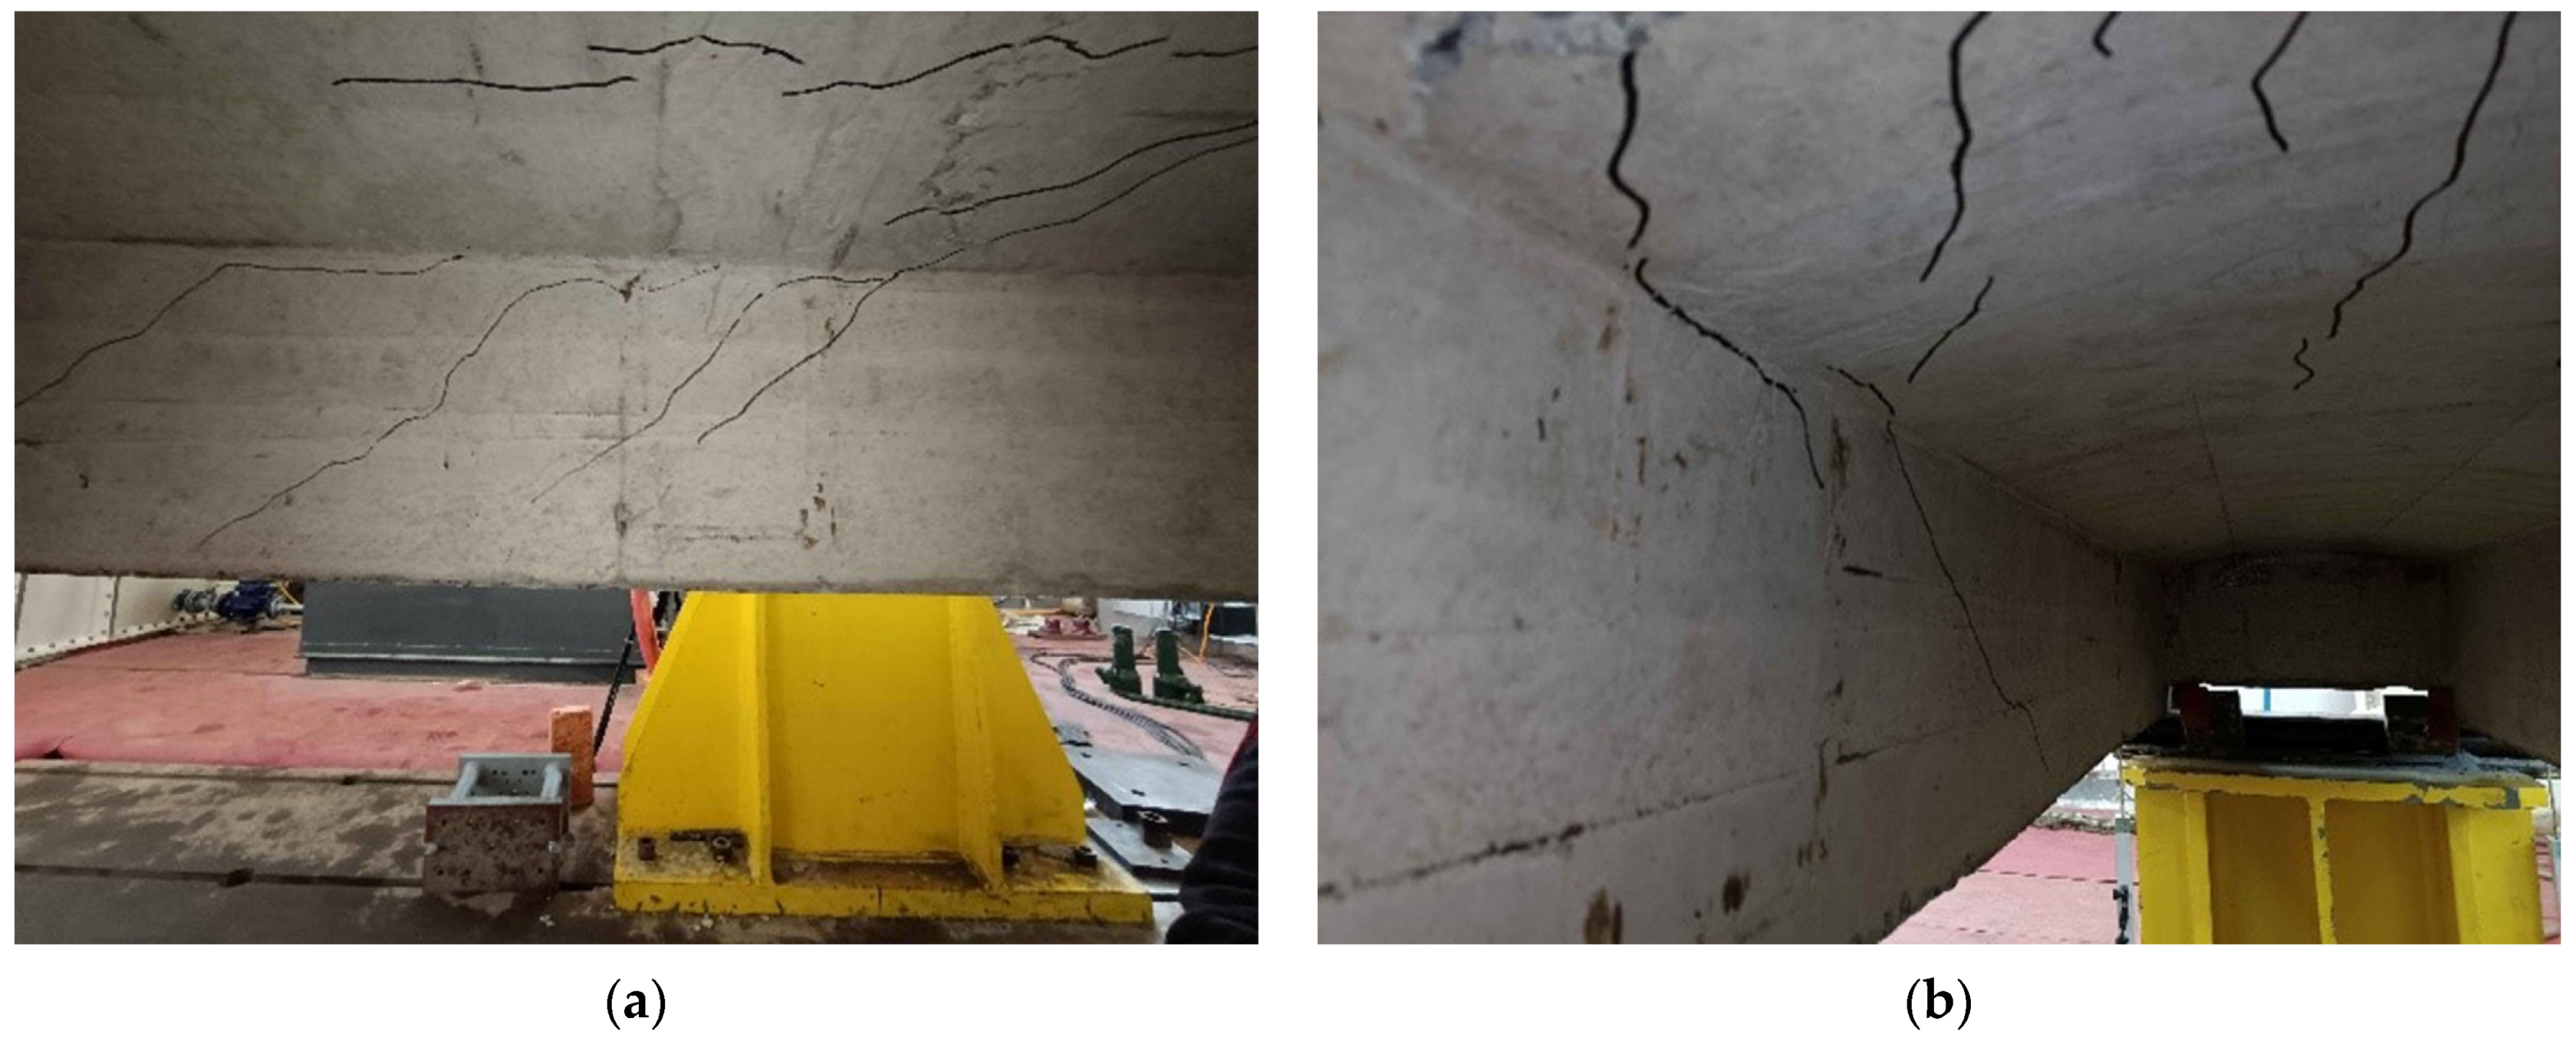
Figure 6. The crack development diagram and damage pattern are shown in
Figure 7 and
Figure 8, respectively.
As can be seen from
Figure 6, the damage process of the carriageway slab under static loading is roughly divided into three stages. When P < 40 KN, the structure is basically in an elastic state, linear increase in carriageway slab deflection, reinforcement and concrete strain. When P = 40 KN, the concrete at the bottom edge of the slab is cracked in tension, and longitudinal cracks appear. The development of deflection, reinforcement, and concrete strain at the bottom of the slab is accelerated at this point. When P = 80 KN, the stress redistribution phenomenon occurs in the carriageway slab, and diagonal cracks appear. Thereafter, the reinforcement yields, and the crack at the bottom of the slab increases suddenly, eventually reaching a crack width of 1.4 mm. This is followed by a loud noise, and the roadway slab is damaged in the form of punching damage. The final crack morphology is a family of scattered cracks from the center of the plate to the long-span direction, these cracks are largely symmetrical in distribution, as shown in
Figure 7 and
Figure 8. The final load capacity of the carriageway slab is approximately 115 KN.
3.2. Analysis of Fatigue Test Results
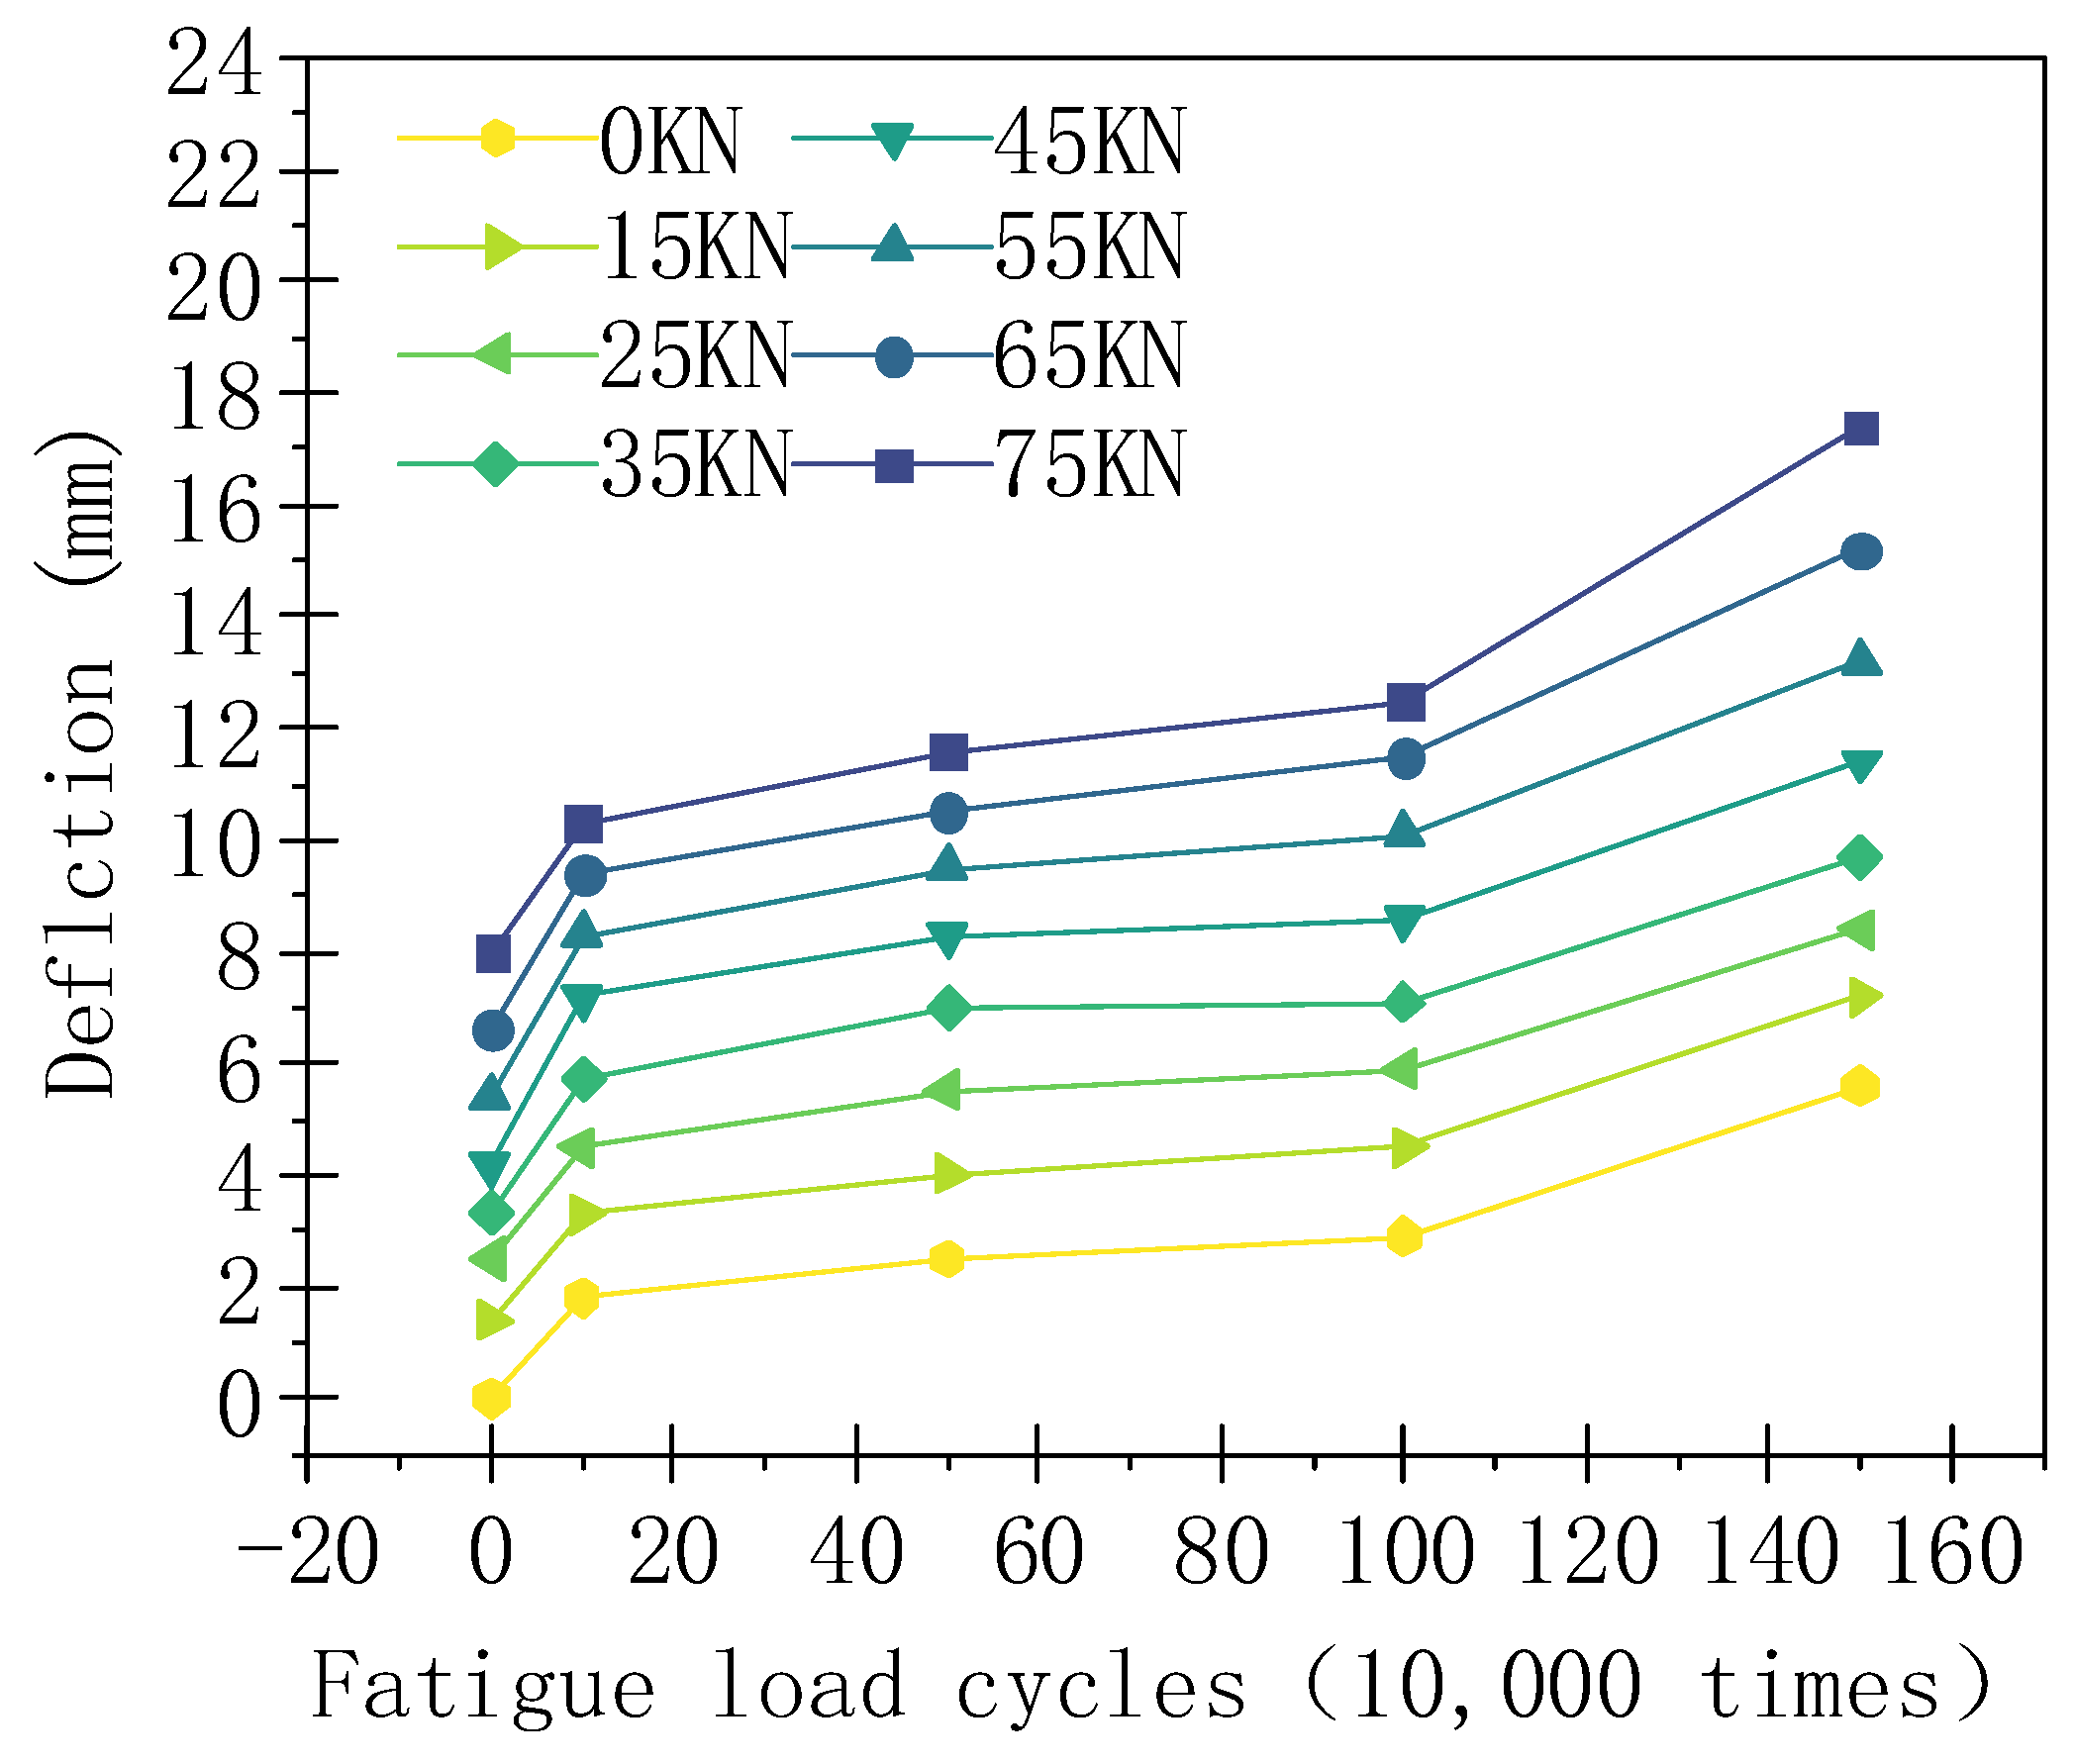
The fatigue loading was suspended when the number of fatigue cycles reached 0, 100,000, 500,000, 1,000,000, and 1,500,000. A static load of 0–75 KN was then, respectively, applied. The carriageway slab crack, slab bottom deflection, and reinforcement strain data are shown in
Figure 9,
Figure 10,
Figure 11 and
Figure 12.
It can be observed in
Figure 9 and
Figure 10 that the deflection of the carriageway slab and the strain of the reinforcement under different loads shows a three-stage trend with an increase in fatigue number. When the number of fatigue cycles is within 100,000, the reinforcement strain and the deflection at the bottom of the slab increase linearly, and no significant macroscopic cracks are seen. When the number of fatigue cycles exceeds 100,000, a longitudinal crack of 0.2 mm in width appears at the bottom of the plate, followed by a scattered family of cracks centered on this crack. There is a roughly steady linear increase in reinforcement strain and slab bottom deflection at this stage, but the increase is smaller. When the number of fatigue cycles exceeds one million, the strain on the steel increases rapidly, the deflection at the bottom of the plate increases rapidly and the steel yields into the plastic phase. Yielding of the reinforcement proves the start of damage to the travel lane slab. The final carriageway slab experiences punching shear damage after 1.6 million fatigue cycles, at which point the maximum crack width at the bottom of the slab reaches 1.2 mm.
4. Carriageway Slab Fatigue Damage Model
4.1. Reinforcement Fatigue Damage Model
An ideal elastic-plastic model, i.e., a bilinear model, is employed in this work. This model is used for steel bars with longer flow widths and is more suitable for our tests. Before constructing the constitutive fatigue model of steel bars under arbitrary fatigue loading times, the following assumptions are made:
- (1)
During any fatigue loading, the reinforcing steel constitutive model is an ideal elastoplastic model, and the yield stress in its constitutive fatigue model is the residual fatigue strength of the reinforcing steel.
- (2)
The elastic modulus of the steel bar does not degrade during the fatigue loading process [
29];
- (3)
The stress (σ-min) corresponding to the lower limit of the equal amplitude fatigue load is a certain value during fatigue loading, and the strength damage of the reinforcement during fatigue loading is in accordance with the linear damage criterion.
4.1.1. Calculation of the Fatigue Life of Steel Bars
It is known from rebar fatigue life tests that there is a double log-linear relationship between
and
in the life curve of rebar [
29]. The object of study in this paper is deformed rebar, and the equation of the S-N curve relationship for its fatigue life is adopted from Equations (1), as proposed by Zeng and Li [
30].
where
represents the fatigue life, and
represents the stress amplitude.
4.1.2. Calculation of Fatigue Residual Strength of Steel Reinforcement
Based on the residual strength model proposed by Zhu Xiancun [
31] and combined with the type of testing in this paper, logarithmic as well as parametric corrections are used to obtain Equation (2) to determine the residual strength of the reinforcement at any number of times.
where
represents the yield strength of the reinforcement;
represents the number of fatigue cycles;
is the fatigue life;
is the stress in the reinforcement.
4.1.3. Constitutive Relation of Reinforcement in Tension under Fatigue Cumulative Damage State
It is also necessary to calculate the fatigue residual strain of the reinforcement to determine the constitutive relation of reinforcement in tension under the fatigue cumulative damage state. As the modulus of elasticity of the reinforcement does not degrade during fatigue loading, the fatigue residual strain of the reinforcement
can be determined, which is calculated as shown in Equation (3).
The yield strain
corresponding to when the reinforcement yields can be obtained from the elastic-plastic model’s constitutive relation to the reinforcement and the residual strength formula of the reinforcement. Its calculation method is shown in Equation (4).
From the above assumptions, as well as the formula, based on the bilinear ideal elastoplastic model, as well as the fatigue cumulative damage theory, the constitutive fatigue model of steel reinforcement under any number of fatigue loading is obtained as Equation (5), and the model curve is shown in
Figure 13:
4.2. Fatigue Damage Model for Concrete
The fatigue cumulative damage theory and the constitutive model for concrete in the literature [
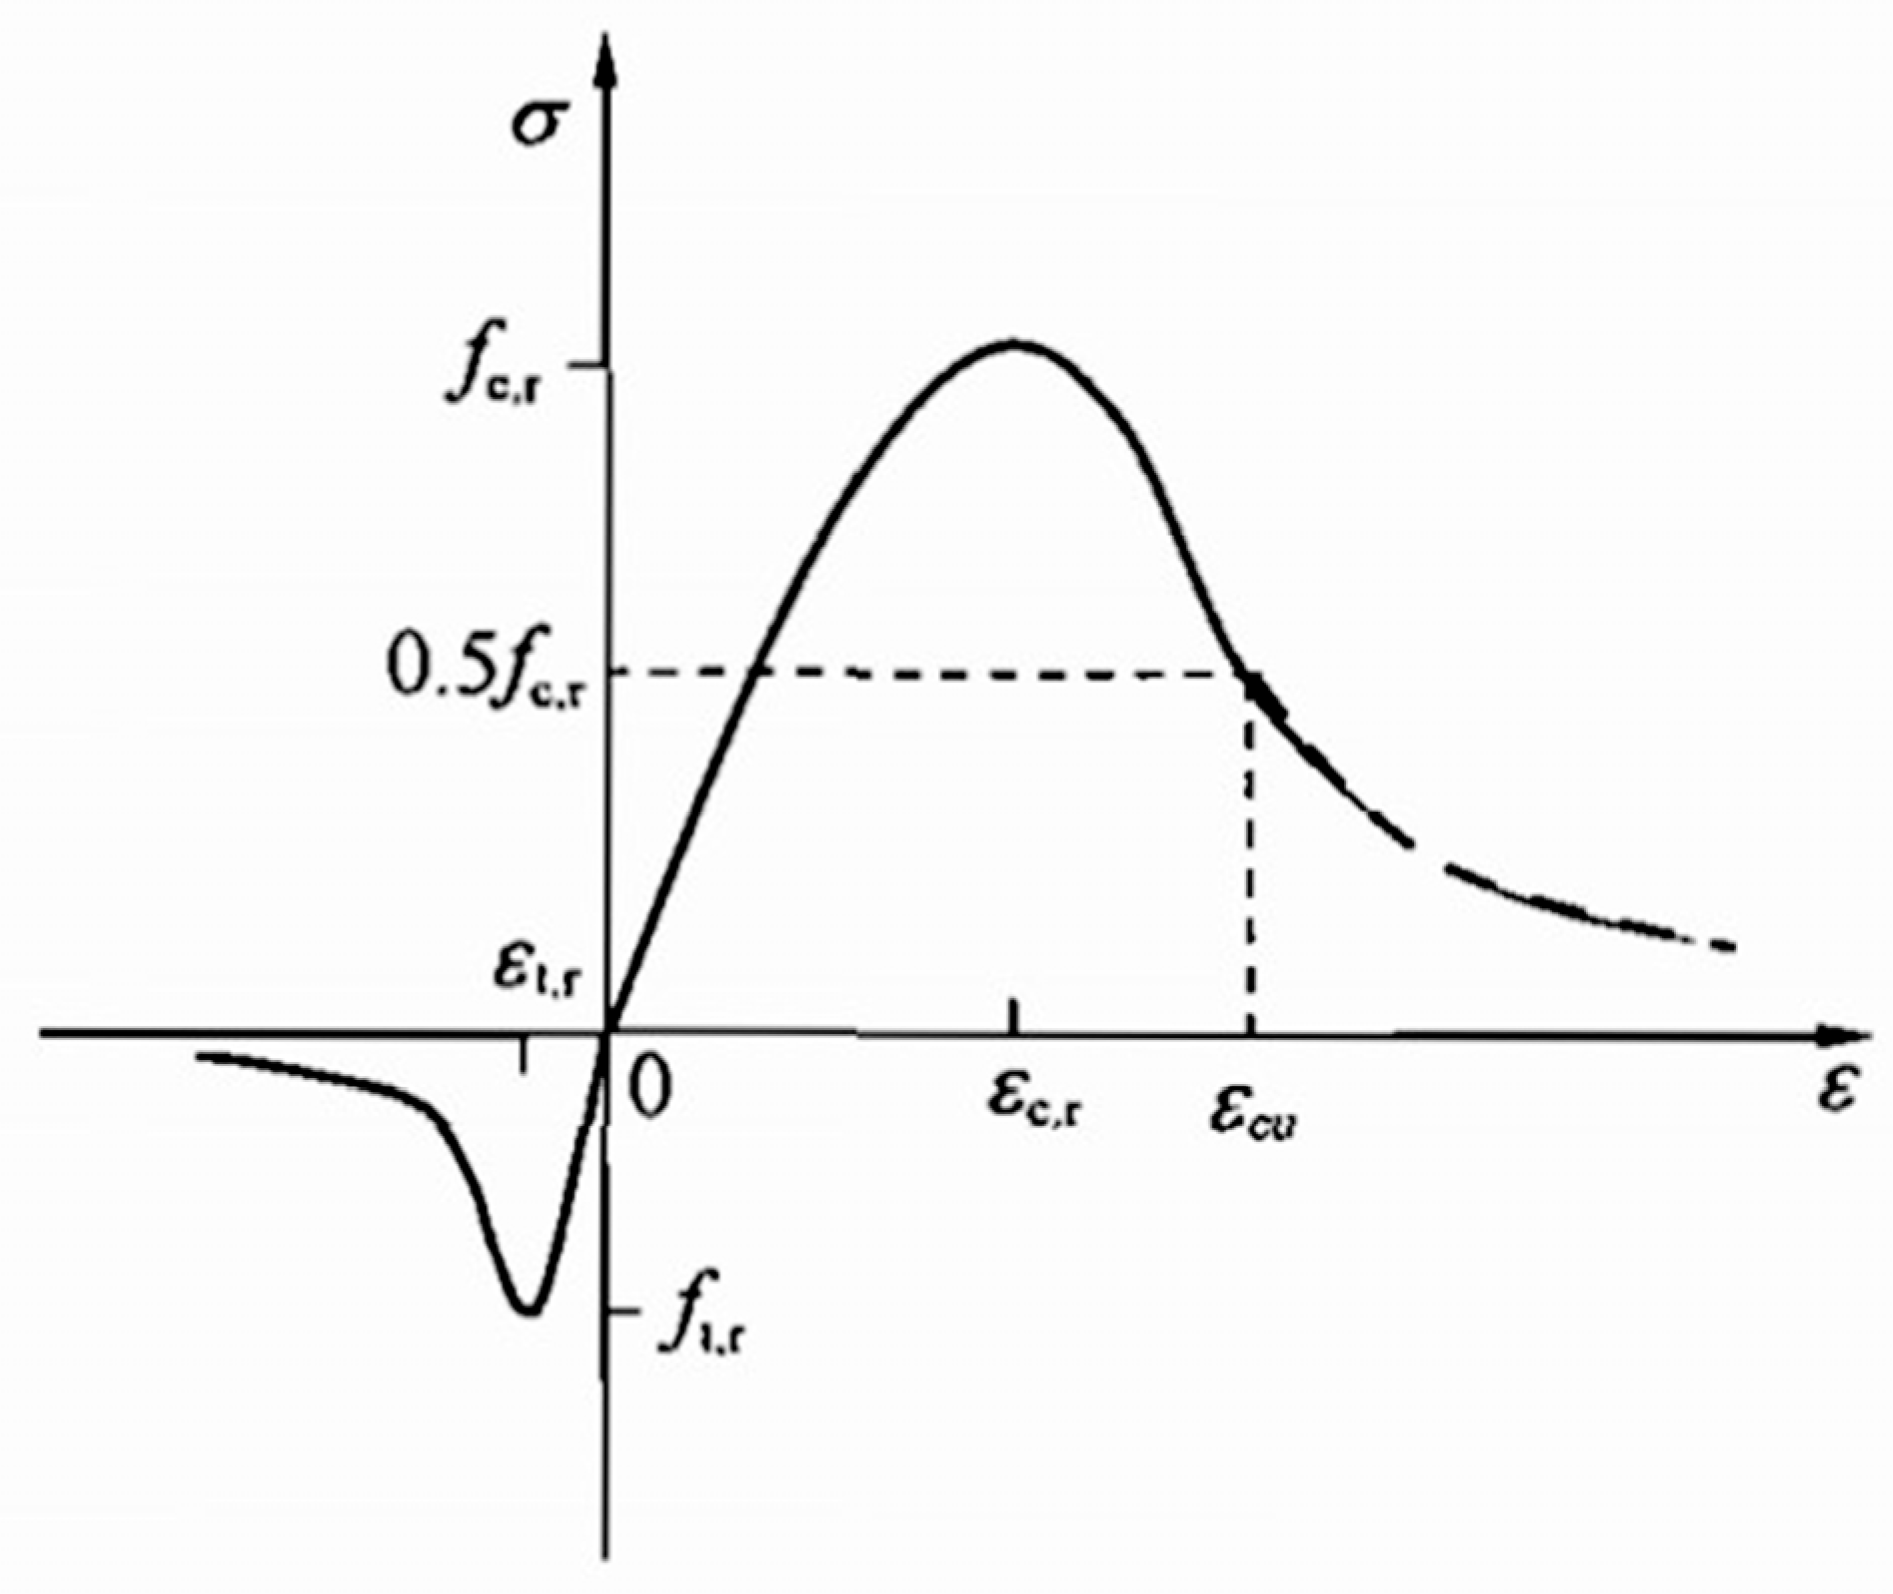
32] clearly indicate that the calculation of concrete fatigue life, modulus of elasticity degradation, and concrete residual strength must be obtained to construct a constitutive model for concrete. The uniaxial stress-strain relationship curve of concrete is shown in
Figure 14. The following assumptions are made before constructing the constitutive model for concrete: Under fatigue loading, the modulus of elasticity of concrete is only related to the number of fatigue cycles;
The fatigue residual strength of concrete at fatigue failure is equal to the stress corresponding to the peak strain of the concrete constitutive relation curve;
Under fatigue loading, the tensile and compressive constitutive consists of two parts before the peak strain, a straight line and a curve, which are represented by a straight line. After the peak strain, the concrete constitutive fatigue is the same as the concrete uniaxial constitutive softening section.
4.2.1. Calculation of Fatigue Life of Concrete
In this paper, the fatigue life of concrete is calculated using the S-N curve equation fitted by the Fatigue Thematic Group [
33], as shown in Equation (6):
In the equation, represents the fatigue life of concrete; represents the standard value of concrete compressive strength; represents the maximum concrete stress; represents the minimum value of concrete stress. represents the fatigue life of concrete.
4.2.2. Degradation of the Modulus of Elasticity of Concrete
The degradation of the modulus of elasticity of concrete is the most important factor contributing to the degradation of concrete stiffness. Holmen [
34] found that the elastic modulus decreased by 33% when concrete was fatigued. This paper adopts Holmen’s formula, shown in Equation (7):
where
represents the fatigue residual modulus of elasticity of concrete;
represents the modulus of elasticity of undamaged concrete;
represents the number of cycles of fatigue loading.
4.2.3. Calculation of the Fatigue Residual Strength of Concrete
When the fatigue residual strength is lower than the upper limit of the fatigue load, the concrete is damaged, and the concrete fatigue damage criterion is as Equation (8):
A fatigue residual strength model for concrete should not be overly complex. Comparing the research results of domestic and foreign scholars, we improved the residual strength formula established by J Schaff, and the relevant parameters were determined according to the fatigue tests of Xianhong Meng [
35]. The model conforms to the basic laws of fatigue residual strength for concrete, as shown in Equation (9):
where
represents the fatigue residual strength of concrete for
cycles of fatigue loading;
represents the standard value of the compressive strength of the concrete;
represents the test parameter, which is determined by Meng Xianhong’s test as 2.055 in compression and 2.514 in tension.
4.2.4. Compressive and Tensile Constitutive Relationships of Concrete in a State of Cumulative Fatigue Damage
Employing Equations (6)–(9) and the assumptions used to construct the constitutive fatigue model of concrete, the modulus of elasticity and the fatigue residual strength can be calculated for concrete of any strength class under an equal amplitude fatigue load for an arbitrary number of fatigue load cycles. The above parameters can then be used to continue deriving the fatigue damage constitutive structure relationship for concrete.
The peak compressive strain of concrete for the fatigue damage constitutive structure relationship is calculated as follows.
Equation (10) is first used to calculate the peak compressive strain of concrete for the fatigue damage constitutive relation:
where
represents the peak compressive strain of concrete for
fatigue load cycles;
represents the fatigue residual strength of concrete for
cycles of fatigue load.
To calculate the damage evolution parameter, it is necessary to consider the descent section parameter
.
Using the peak point as a demarcation, the damage parameters are calculated for each of the two segments, bringing in the ratio
of
ε to
and the parameters
,
:
The pressure damage evolution parameter
is denoted as:
where
is the ascending section and
is the descending section.
The concrete fatigue principal structure can be established at this point. Equation (16) shows that the calculated stress is actually nominal stress, which needs to be converted to real stress in the principal concrete plastic damage structure model.
The constitutive relationship of concrete in tension under arbitrary damage is similar to the process of establishing the constitutive model of concrete in compression damage, which will not be repeated here, and is denoted as Equation (17).
Based on the above concrete uniaxial constitutive model, a fatigue cumulative damage model is established. Due to space limitations, only the fatigue damage calculation results of the NT-1 carriageway slab at 1 million fatigue cycles are given here in
Table 5 and
Table 6.
5. Study of the Residual Load Carrying Capacity of the Carriageway Slab
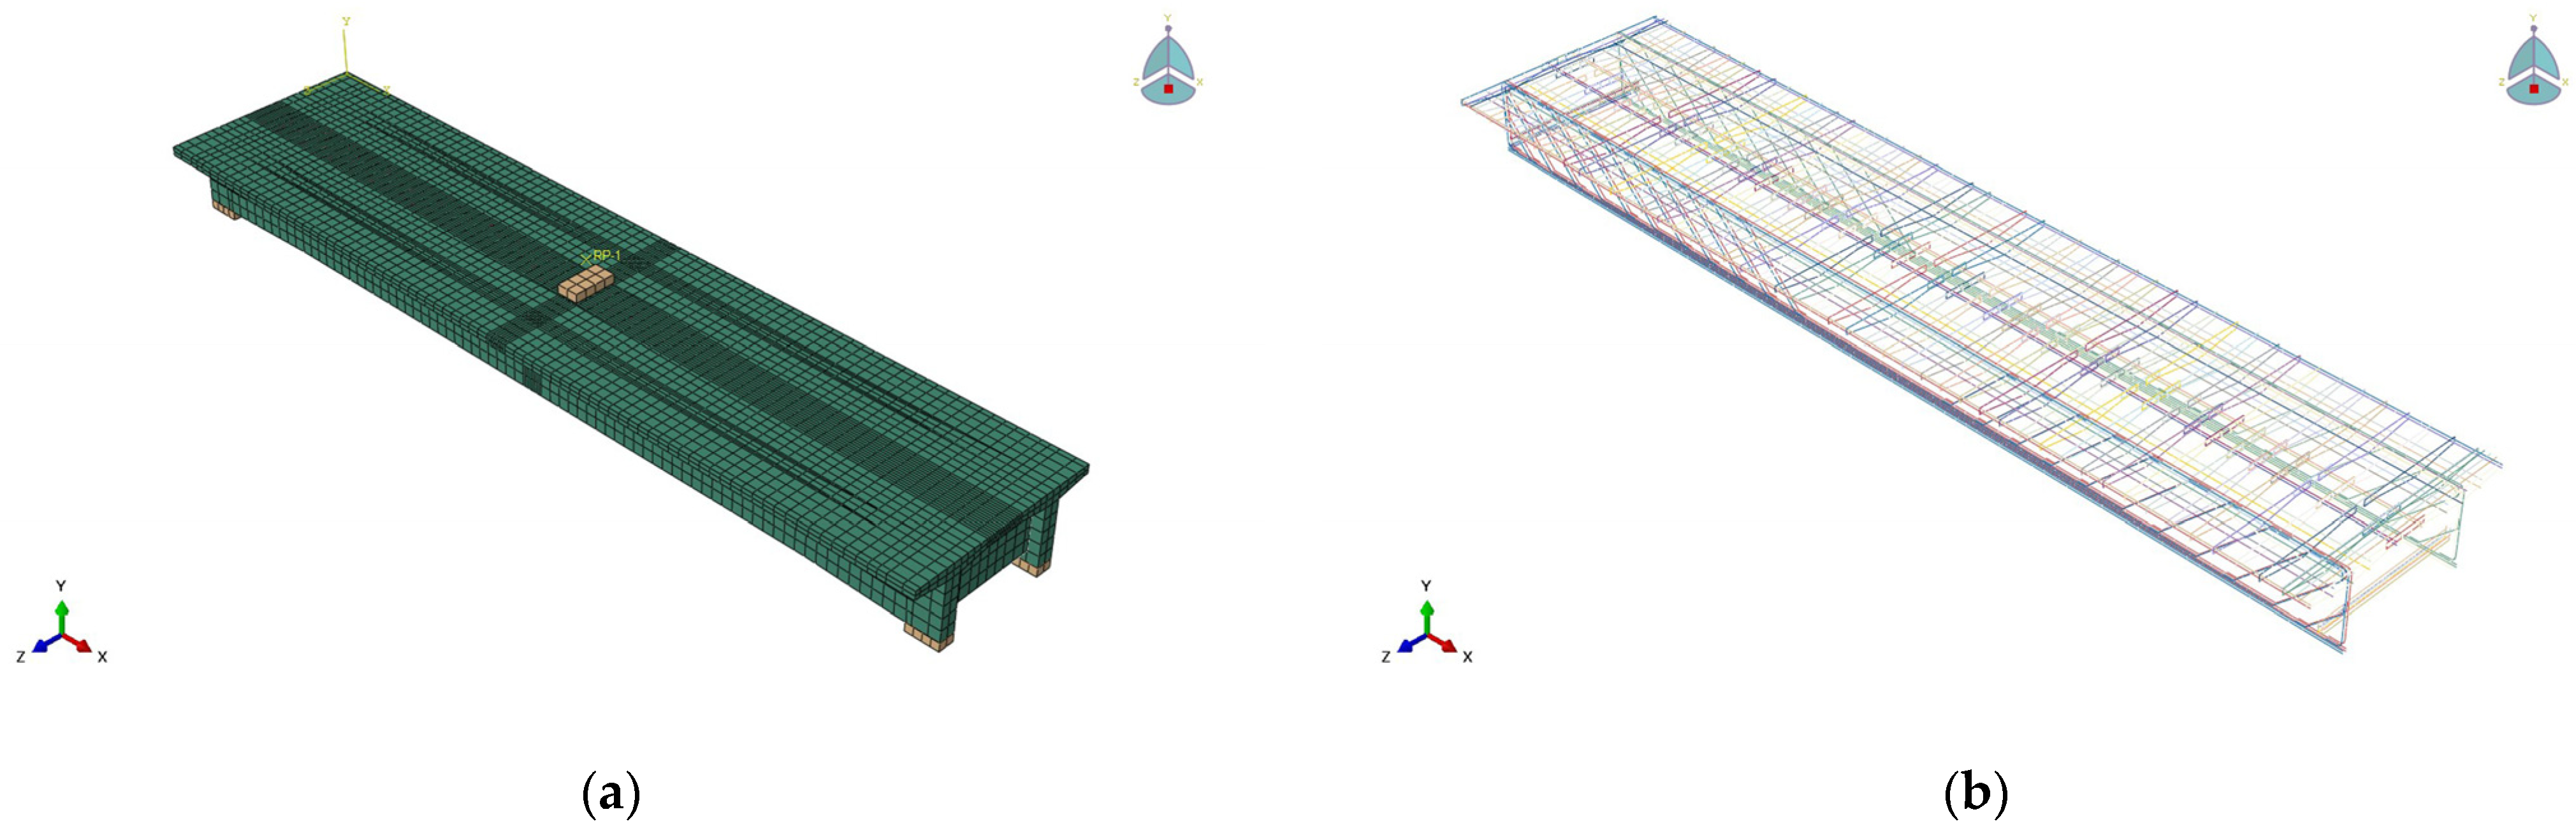
Based on the fatigue accumulation damage theory, we used the Abaqus general analysis program to establish different ratio of width to height, different ratio of length to width, different fatigue load level, and different fatigue load cycle of 32 models in total. Because the carriageway slabs are highly symmetrical, we used the ratio of length to width and the ratio of width to height to express the dimensional changes in the carriageway slabs. The lane plate residual bearing capacity finite element analysis model is shown in
Table 7. T3D2 truss units were used for the model reinforcement, and C3D8R solid units were used for the concrete. An embedded region defined the contact between the reinforcement cage and the concrete. The restraint of a simply supported beam and the application of concentrated forces by means of a reference point restraining the force zone were simulated. The model was solved implicitly (Abaqus/Standard), using the direct method. Full Newton iterations (full Newton method) were used, with severely discontinuous iterations of the transformation, employing the inheritance from the previous analysis step and defaulting to slope loads throughout the analysis step. The concrete finite element mesh is shown in
Figure 15a, and the steel finite element mesh is shown in
Figure 15b.
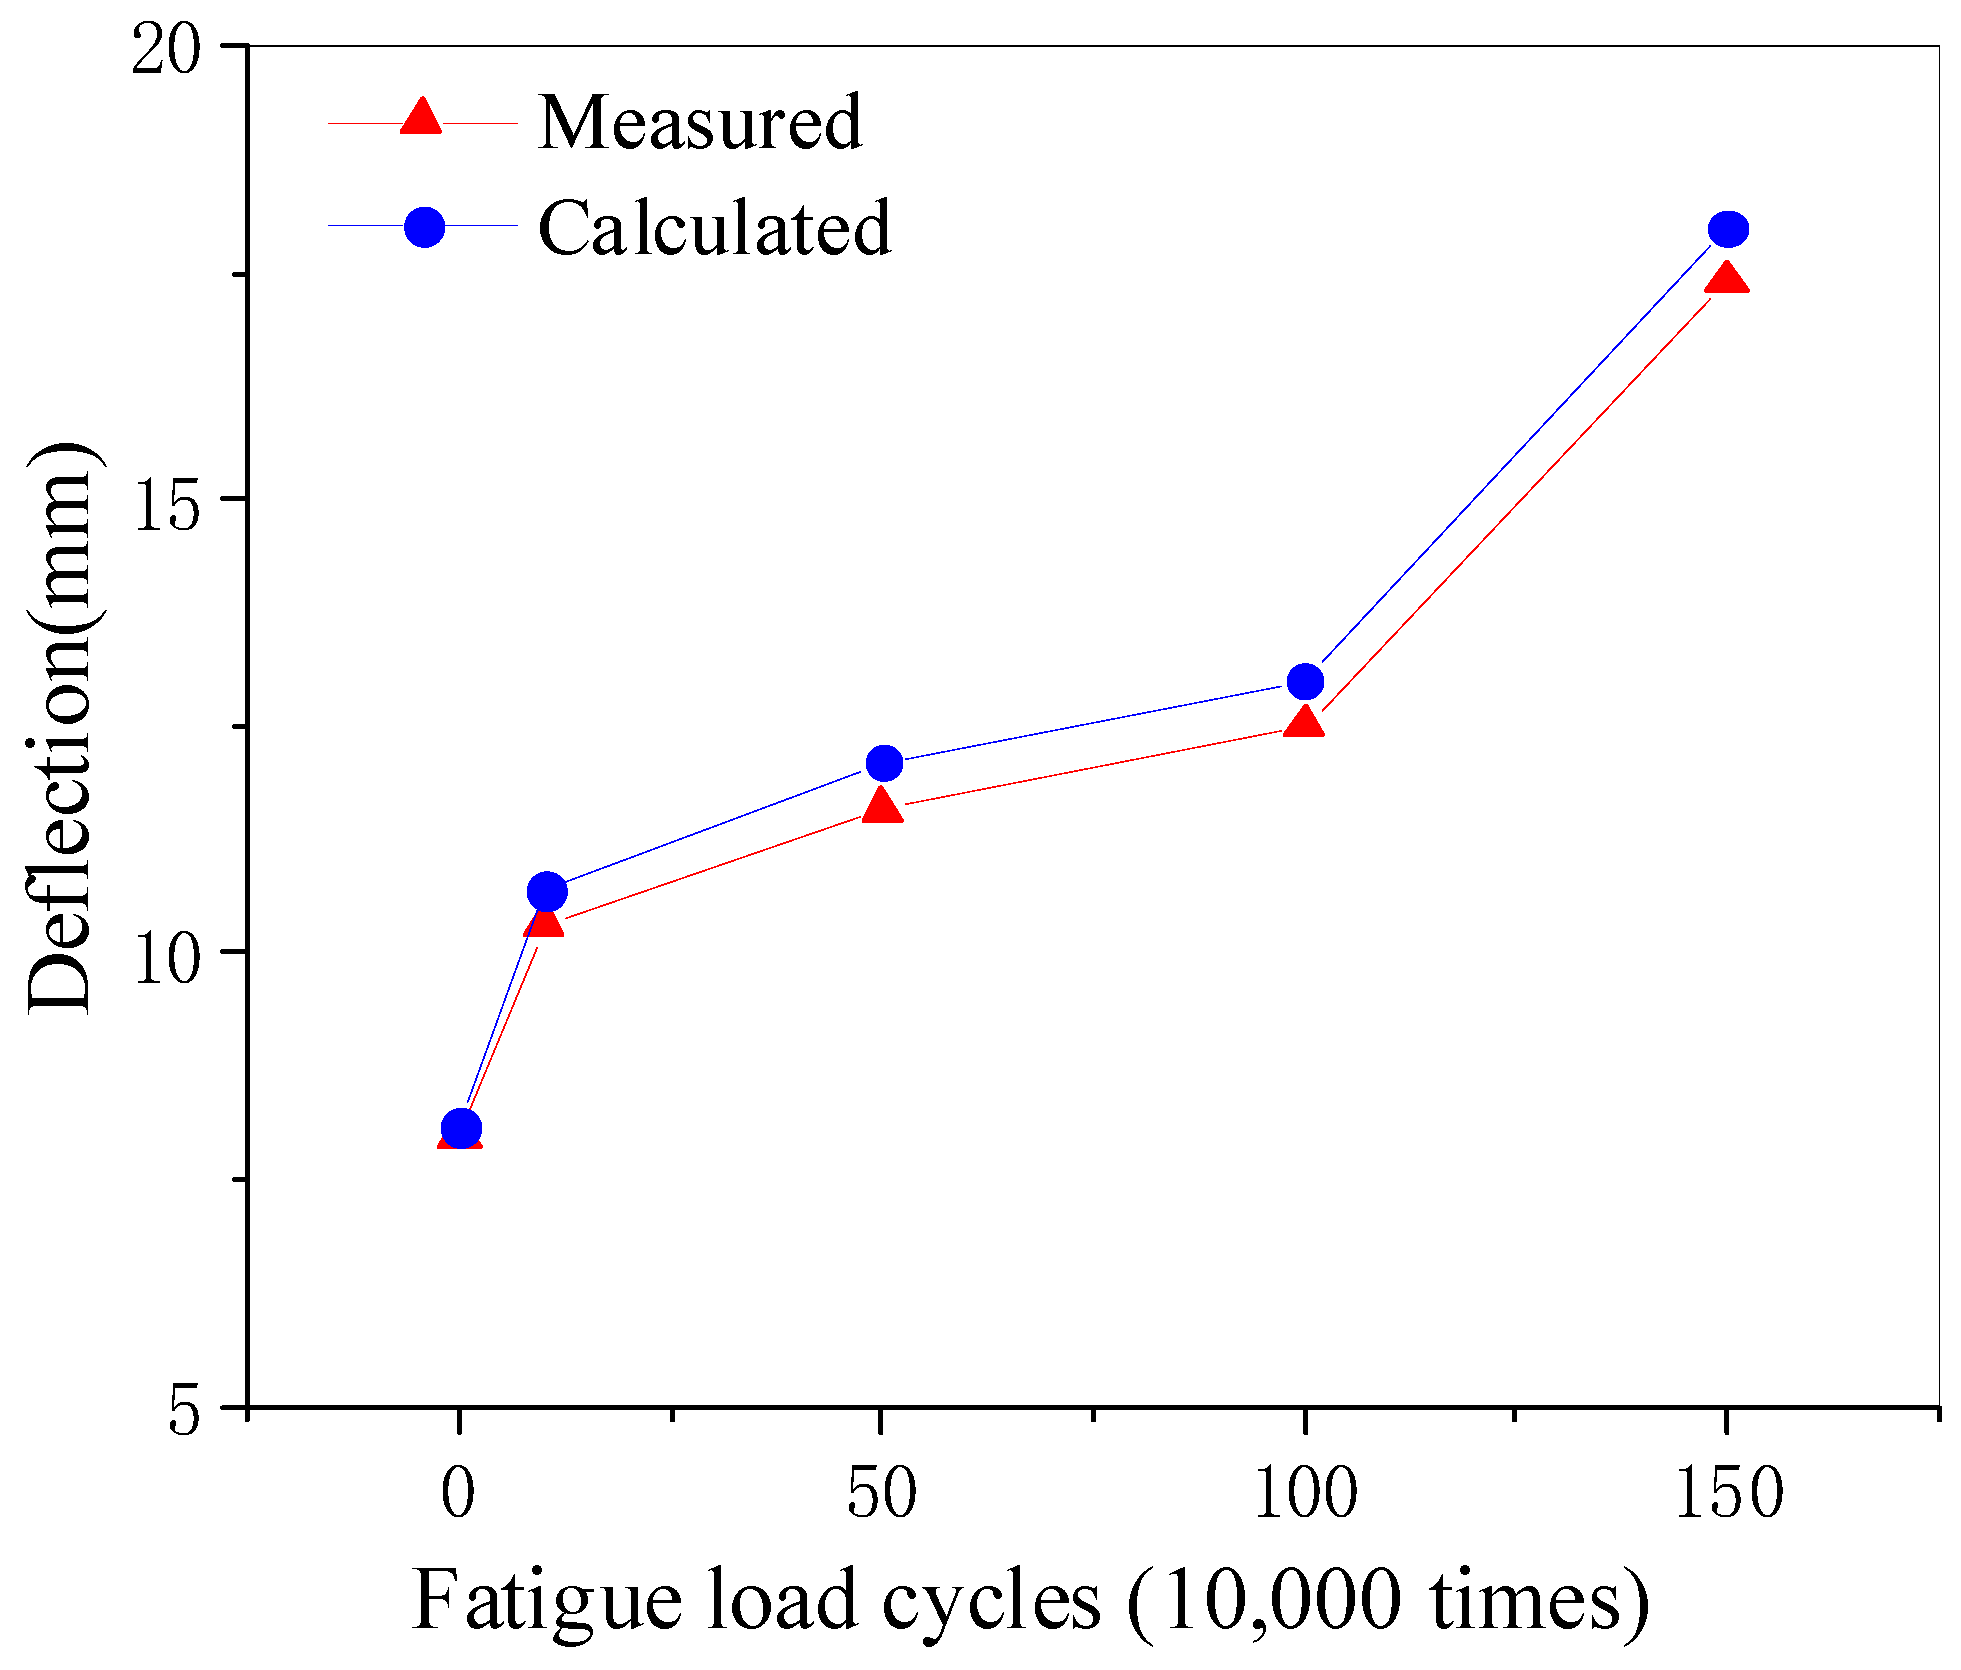
In order to verify the validity of the finite element model, the fatigue test analysis was performed on the fatigue test model, and the comparison between the results of the simulation analysis and the test results are shown in
Figure 16 and
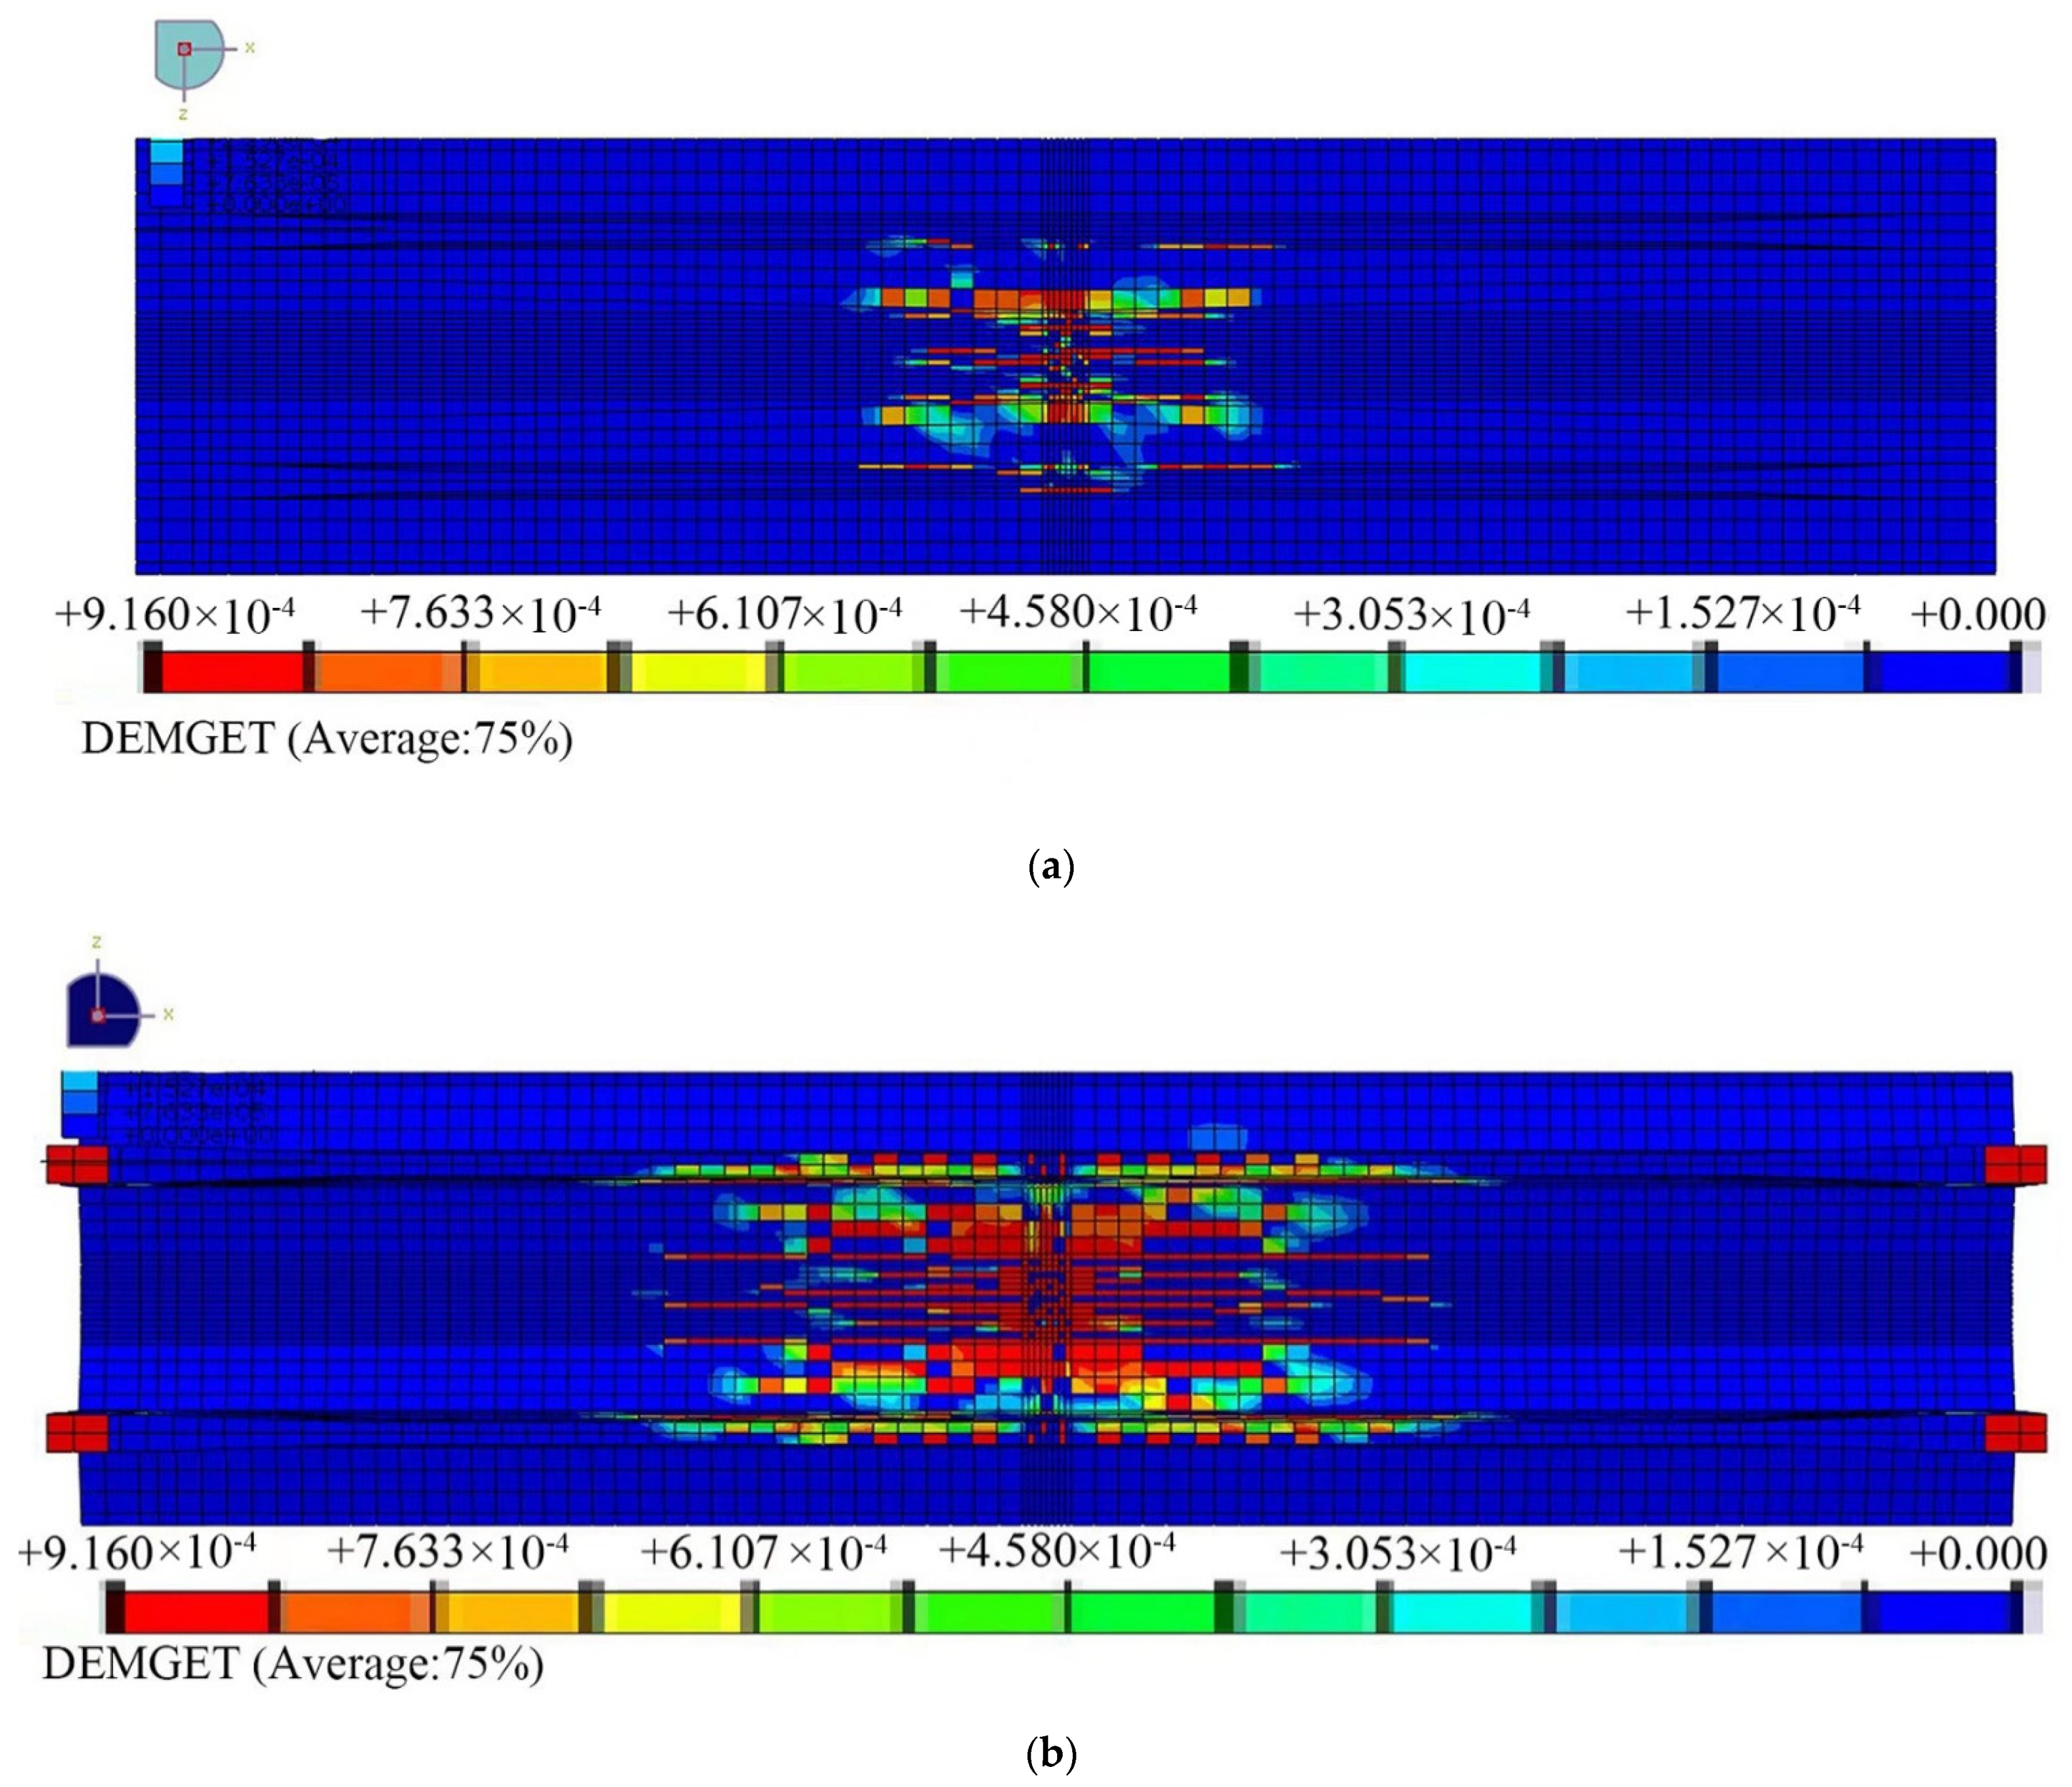
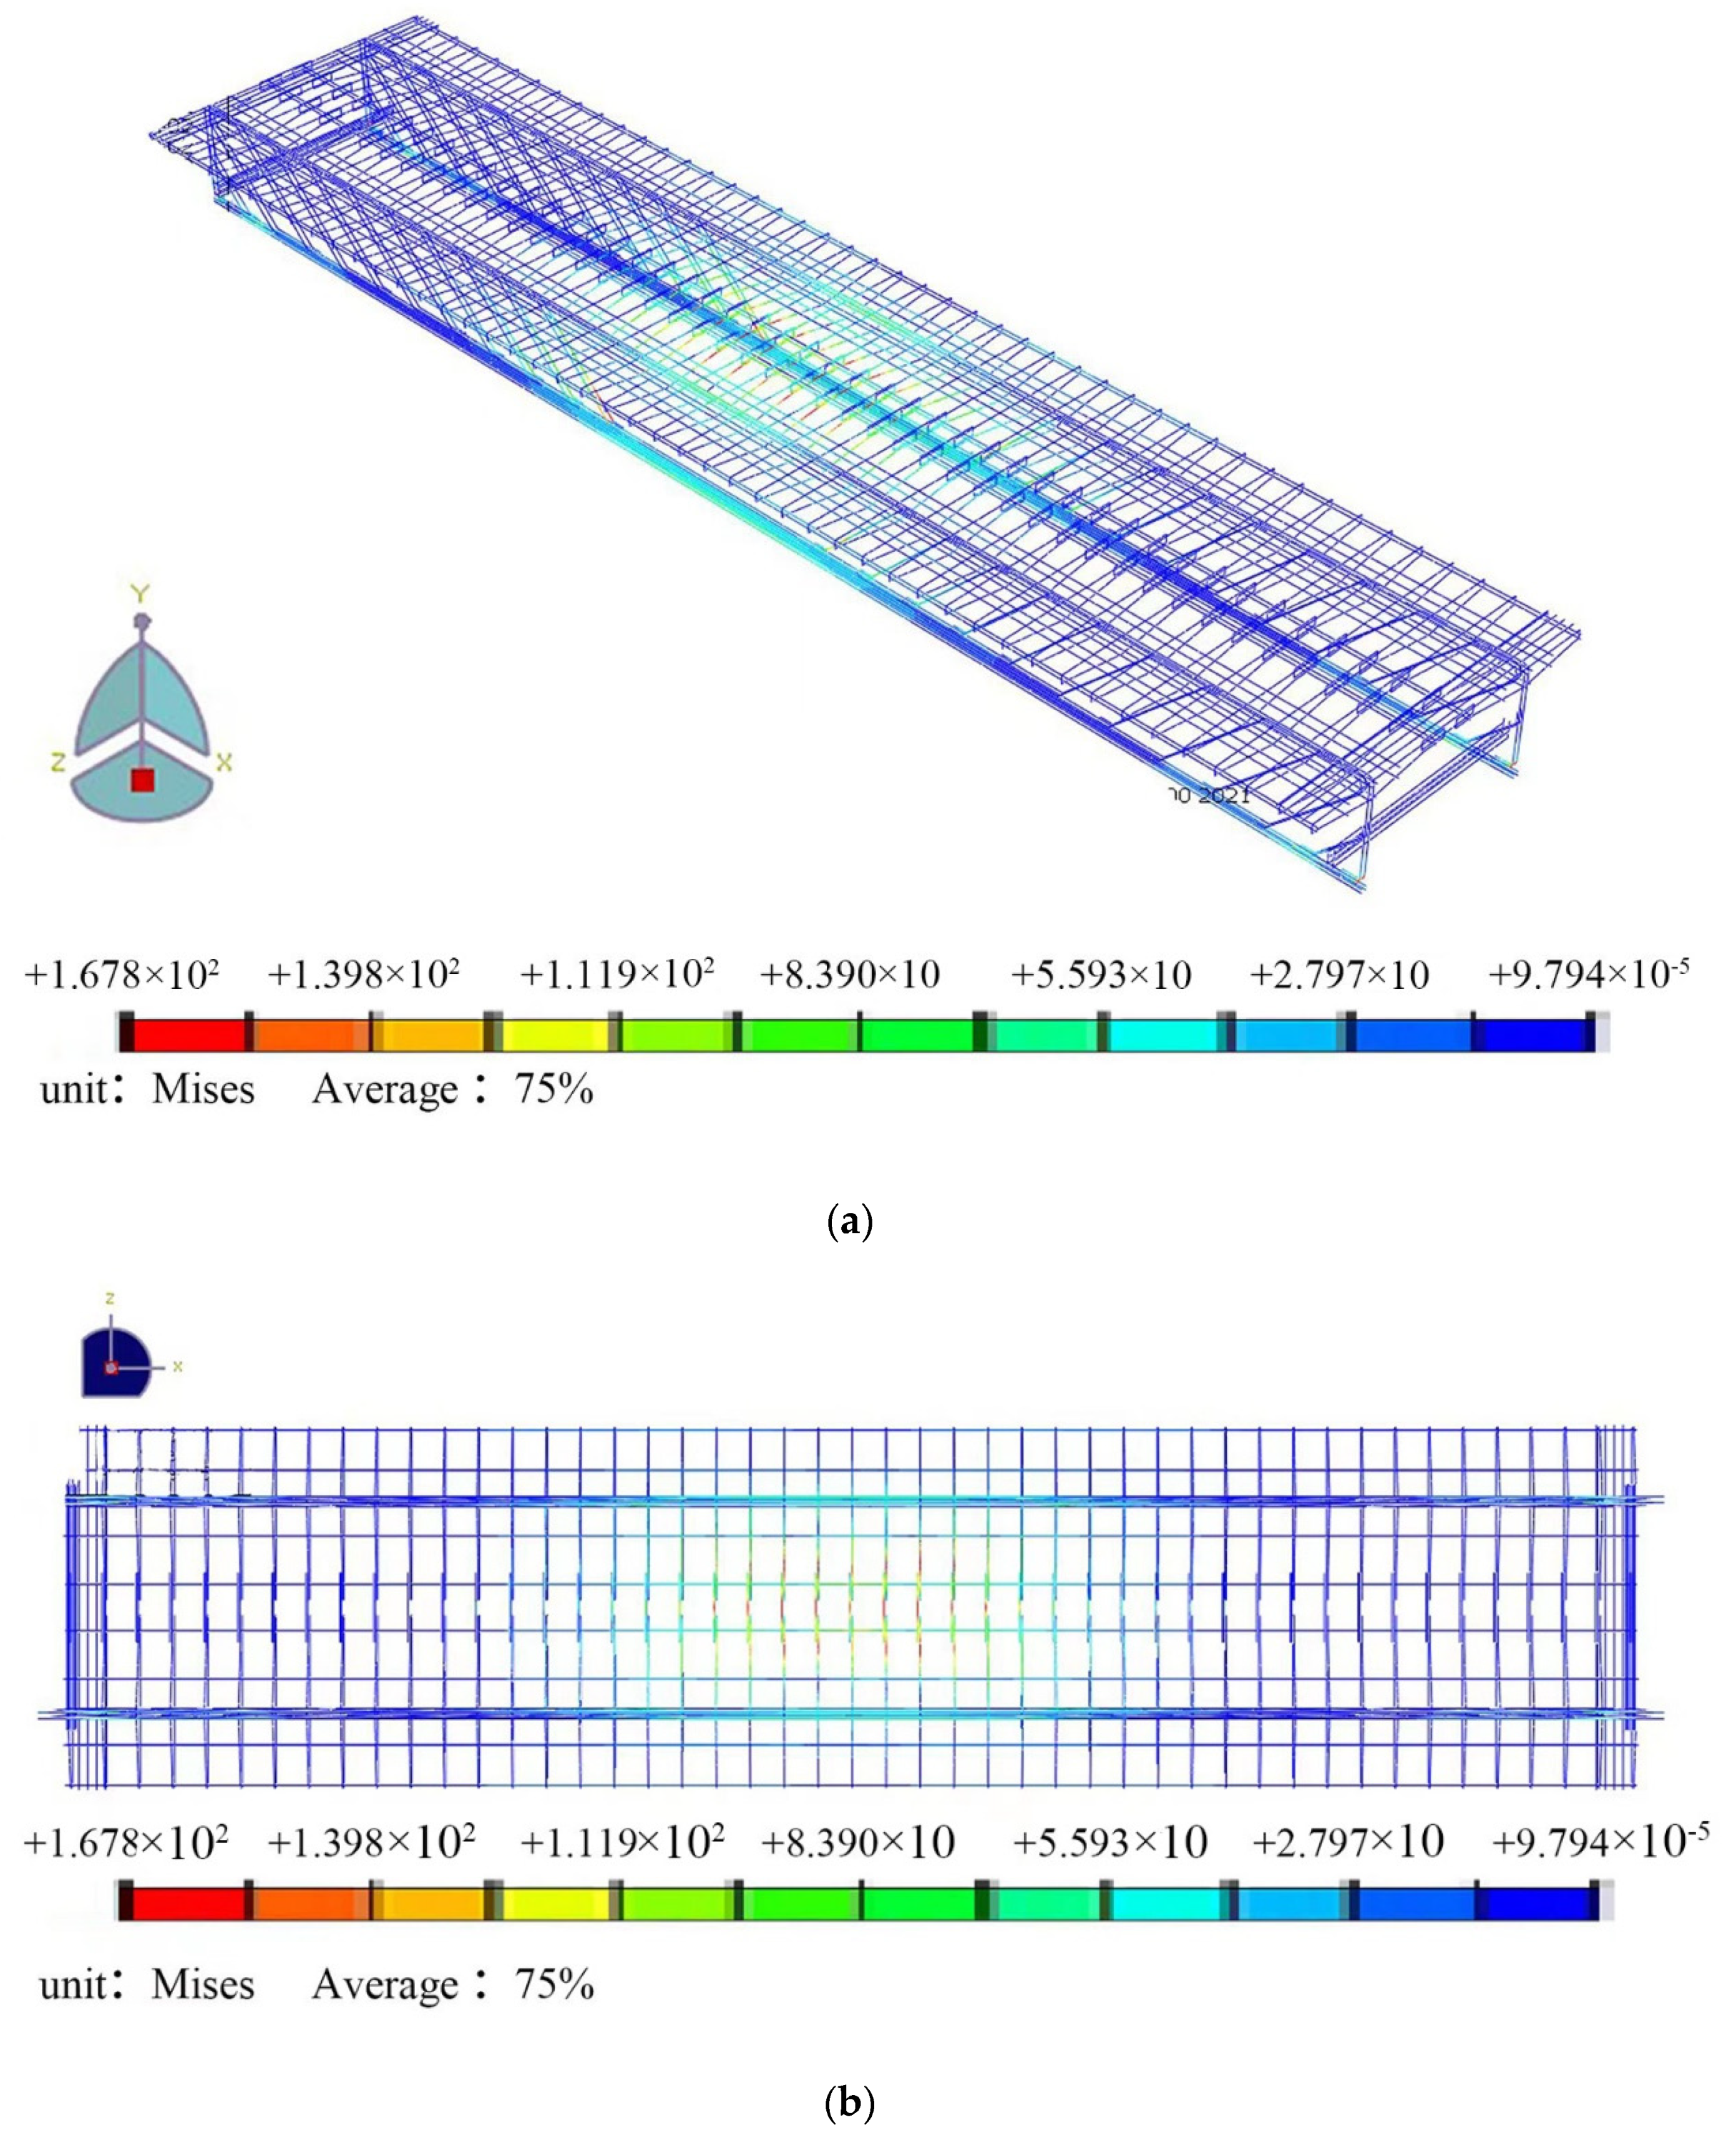
Figure 17. The deflection stress cloud is shown in
Figure 18.
As can be seen from the figure, the measured test curve matches well with the simulated analysis curve. The simulated analysis curve is also divided into three stages; the number of fatigue loads is 0–100,000 times, and the deflection and strain are linearly related to the number of fatigue times; the number of fatigue times is 100–1,000,000 times, and the growth rate of deflection and strain is slow; the number of fatigue times is 1–1,500,000 times, and the growth of deflection and strain is accelerated.
The maximum error between the simulated deflection value and the measured value is 4% and the maximum error between the strain value and the measured value is 4.8% for the same number of fatigue loadings. When the fatigue damage occurred in the lane slab at 1.62 million times, the measured steel strain value was 2045με, and this value was used as the yield strain of the steel, but in the simulation analysis, the strain value of the steel reached 2130με at 1.62 million times, and the strain value of the steel was 2009με at 1.5 million times, so it was considered that the steel yielded between 1.5 and 1.62 million times, and the results were close to the test. It proves that the model can simulate the fatigue performance of the travel lane slab well.
5.1. Effect of Fatigue Load Level on the Residual Load Capacity of the Carriageway Slab
Under the conditions of La/Lb = 7.5 and Lb/h = 12.8, the residual load-carrying capacity of the carriageway slabs at different fatigue load cycles for three fatigue load levels S1 = 0.55, S2 = 0.65, and S3 = 0.75 are shown in
Table 8. Part of the concrete and steel damage cloud diagrams are shown in
Figure 19,
Figure 20 and
Figure 21.
Figure 22 shows the relationship between the residual bearing capacity of the horizontal carriageway slab with different fatigue loads and the number of cycles of fatigue load.
As can be seen from
Figure 22, the greater the fatigue load level, the lower the residual load capacity of the carriageway slab at the same number of cyclic loads. When the load level is 0.55, the residual bearing capacity of the carriageway plate with the increase in the number of fatigue loading does not appear to significantly reduce the trend. After cyclic loading 2 million times, its residual bearing capacity is 85.29 KN, and the plate bearing capacity is 74%. When the fatigue load level is 0.65, the residual load capacity-fatigue loading curve takes a clear turn at 1.5 million cycles, and the residual load capacity is only 43% of the plate load capacity after 2 million cycles of fatigue loading. At a fatigue load level of 0.75, the curve takes a significant turn at 1 million cycles, and the residual load capacity is only 28% of the plate load capacity at 1.5 million cycles of loading. The fatigue load level is also increased from 0.65 to 0.75, and the fatigue curve turning point is lowered from 1.5 to 1 million cyclic loadings, an advance of 500,000 cycles.
5.2. Influence of Length to Width Ratio on the Residual Load-Carrying Capacity of the Carriageway Slab
Fatigue analysis models with La/Lb ratios of 7.5, 3.8, 1.9, and 1.6 were obtained by varying the number and spacing of the crossbeam at a fatigue load level of 0.65 and Lb/h = 12.8. The results are shown in
Table 9. Due to the different initial bearing capacities of different La/Lb carriageway slabs, the residual bearing capacity of each model’s carriageway slab was converted to a relative residual bearing capacity using Equation (18), and the calculation results are shown in
Figure 20.
where
represents the relative residual bearing capacity of the carriageway slab,
represents the residual bearing capacity of the carriageway slab,
represents the undamaged carriageway slab bearing capacity, and
represents fatigue load level.
Figure 23 illustrates that the smaller the La/Lb of the carriageway slab, the greater its relative residual load capacity under the same number of fatigue loading. The relative residual load capacity of two-way board slabs with La/Lb below 2 is significantly higher than that of the one-way board. At a fatigue level of 0.65 and cyclic loading of 1 million cycles, the relative residual load capacity of a carriageway slab with La/Lb of 7.5 is 0.12, while the residual load capacity of a carriageway slab with La/Lb of 1.6 is 0.34 of the pre-damage load capacity, which is 2.8 times higher than La/Lb = 7.5. Therefore, from the point of view of the residual bearing capacity of the carriageway slab, it is recommended to use a two-way board with La/Lb less than 2 when designing the carriageway slab for fatigue resistance.
5.3. Effect of Width to Height Ratio on the Residual Load-Carrying Capacity of the Carriageway Slab
Under the condition that the length to width ratio of the carriageway slab is 1.9 and the fatigue load level is 0.65 (both are certain), the fatigue analysis model with different Lb/h is used to calculate the relative residual bearing capacity for 500,000, 1,000,000, and 1,500,000 cycles of loading. The modeling results are shown in
Table 10.
As can be seen from
Figure 24, under the condition that La/Lb and the fatigue load level are certain, the smaller the Lb/h of the carriageway slab, the greater the relative residual bearing capacity of the carriageway slab. The relative residual load capacity of the carriageway slab with Lb/h = 12.8 at a fatigue level of 0.65 and a cyclic load of 1.5 million cycles is 0.16, while the relative residual load capacity of the carriageway slab with Lb/h = 10.3 is 0.38, which is nearly twice as high as Lb/h = 12.8.
5.4. Residual Load-Carrying Capacity Evaluation Model for Carriageway Slabs
In order to evaluate the residual bearing capacity of different types of carriageway slabs, this paper takes the length to width ratio (La/Lb), the width to height ratio (Lb/h), the fatigue load level, and the number of fatigue load cycles as independent variables and the relative residual bearing capacities of the carriageway slabs as dependent variables. The general global optimization algorithm is used to fit the mathematical evaluation model of the residual bearing capacity of the carriageway slab using 1stOpt fitting software. The residual bearing capacity of each model is converted into the relative residual bearing capacity according to Equation (18), and the mathematical expression of the evaluation model is denoted in Equation (19).
where
,
,
…
are fitting parameters, which are equal to −0.0081, 1.3957, −0.4017, −0.0861, 2.6440, 79.7945, 1161.3893, 349.2907, 94.6238, −4221.9091, −5.3805, and −5.1671, respectively.
—Roadway slab length to width ratio La/Lb;
—Fatigue load level;
—Roadway slab width to height ratio Lb/h;
;
—Fatigue load cycles;
—Target number of fatigue load cycles, the default is 2 million.
The correlation coefficient R = 0.97 for Equation (19) is calculated to be greater than 0.95, indicating a good fit. Additionally, the residual sum of squares SSE = 0.41 is within the range of [−2, 2], proving that the stability of the parameters of the fitted equation is effective. Therefore, the mathematical model between the residual load capacity of the carriageway slab and the length-to-width ratio, width-to-height ratio, fatigue load level, and fatigue loading times is reasonable.
6. Conclusions
The fatigue damage morphology and fatigue damage mechanism of reinforced concrete ribbed girder bridge lane slabs were obtained through fatigue testing of lane slabs in this work. A fatigue analysis model of the carriageway slab was established based on the fatigue cumulative damage theory. The influence of the fatigue load level, carriageway slab length to width ratio, and width to height ratio on the residual load capacity of the carriageway slab was studied, and the residual load-bearing capacity evaluation model of the carriageway slab was obtained by polynomial fitting. The main conclusions were obtained as follows.
(1) Fatigue damage to the carriageway slab took the form of punching damage. The fatigue damage development pattern could be divided into three stages, accounting for 6.25%, 56.25%, and 37.5% of the total fatigue life. The first stage was the initial fatigue phase, where the number of fatigue load cycles was between 0 and 100,000. At this stage, the reinforcement strain and the deflection at the bottom of the slab increased linearly, and no significant macroscopic cracks were observed. When the number of fatigues reached 100,000 times, the damage entered the second stage, i.e., the stage of stable development of fatigue damage. At this point, a longitudinal crack with a width of 0.2 mm appeared at the bottom of the plate, and a family of scattered fissures centered on this fissure emerged. After that, the reinforcement strain and the bottom deflection of the slab increased linearly and steadily, but the increase rate was low. When the number of fatigue loading exceeded 1 million times, the carriageway slab entered the accelerated fatigue development and damage stage. The concrete strain, the deflection of the bottom of the slab, and the concrete crack width all accelerated, and the reinforcement yielded and entered the plastic stage. Finally, the driveway slab underwent punching shear damage at the fatigue number of 1.6 million times, at which time the maximum crack width of the bottom of the slab reached 1.2 mm.
(2) Under the condition that the length to width ratio and width to height ratio of the carriageway slab was certain, the greater the fatigue load level was, the lower the residual load capacity of the carriageway slab. When the fatigue load level was 0.55, the residual bearing capacity of the carriageway slab did not show a significant reduction trend with the increase of fatigue loading times. After 2 million times of cyclic loading, its residual bearing capacity was 85.29 KN, which was still 74% of the plate bearing capacity. This result indicates that carriageway slabs with fatigue load levels of 0.55 and below are essentially unfatigued after 2 million loadings. When the fatigue load level was 0.65, the curve of residual bearing capacity-fatigue cyclic loading times had an obvious turning point at 1.5 million times. After 2 million times of fatigue loading, the residual bearing capacity was only 43% of the plate bearing capacity. When the fatigue load level was 0.75, the curve turned obviously after 1 million times; when the load was 1.5 million times, the residual bearing capacity was only 28% of the plate bearing capacity. The fatigue load level rose from 0.65 to 0.75, and the turning point of the fatigue curve was reduced from 1.5 million cycles to 1 million cycles, 500,000 cycles earlier.
(3) Under the condition that the width to height ratio of the roadway slab was constant and the same fatigue load level, the smaller the length to width ratio of the roadway slab, the greater the residual bearing capacity. Thus, the residual bearing capacity of the two-way slab is higher than that of the one-way slab. When the fatigue level was 0.65, and the number of cyclic loadings reached 1 million, the relative residual bearing capacity of the roadway slab with a length to width ratio of 7.5 was 0.12, and the residual bearing capacity of the roadway slab with a length to width ratio of 1.6 accounted for the pre-damage bearing capacity 0.34, which was 2.8 times the length to width ratio of 7.5. Therefore, from the perspective of the residual bearing capacity of the roadway slab, it is recommended to use a two-way slab with a length to width ratio of less than 2 when carrying out the anti-fatigue design of roadway slabs.
(4) Under the condition that the length to width ratio of the carriageway slab was constant and the fatigue load level was the same, the smaller the width to height ratio of the carriageway slab, the greater its residual bearing capacity. When the fatigue level was 0.65, and the number of cyclic loads was 1.5 million times, the relative residual bearing capacity of the roadway slab with a width to height ratio of 12.8 was 0.16, while the relative residual bearing capacity of the roadway slab with a width to height ratio of 10.3 was 0.38, which is twice the difference.
(5) Using the length to width ratio, width to height ratio, fatigue load level, and number of fatigue load cycles of the carriageway slab as independent variables, and the relative residual load capacities of the carriageway slab as dependent variables, the residual load capacity evaluation model of the carriageway slab was obtained using 1stOpt fitting software.


